Article

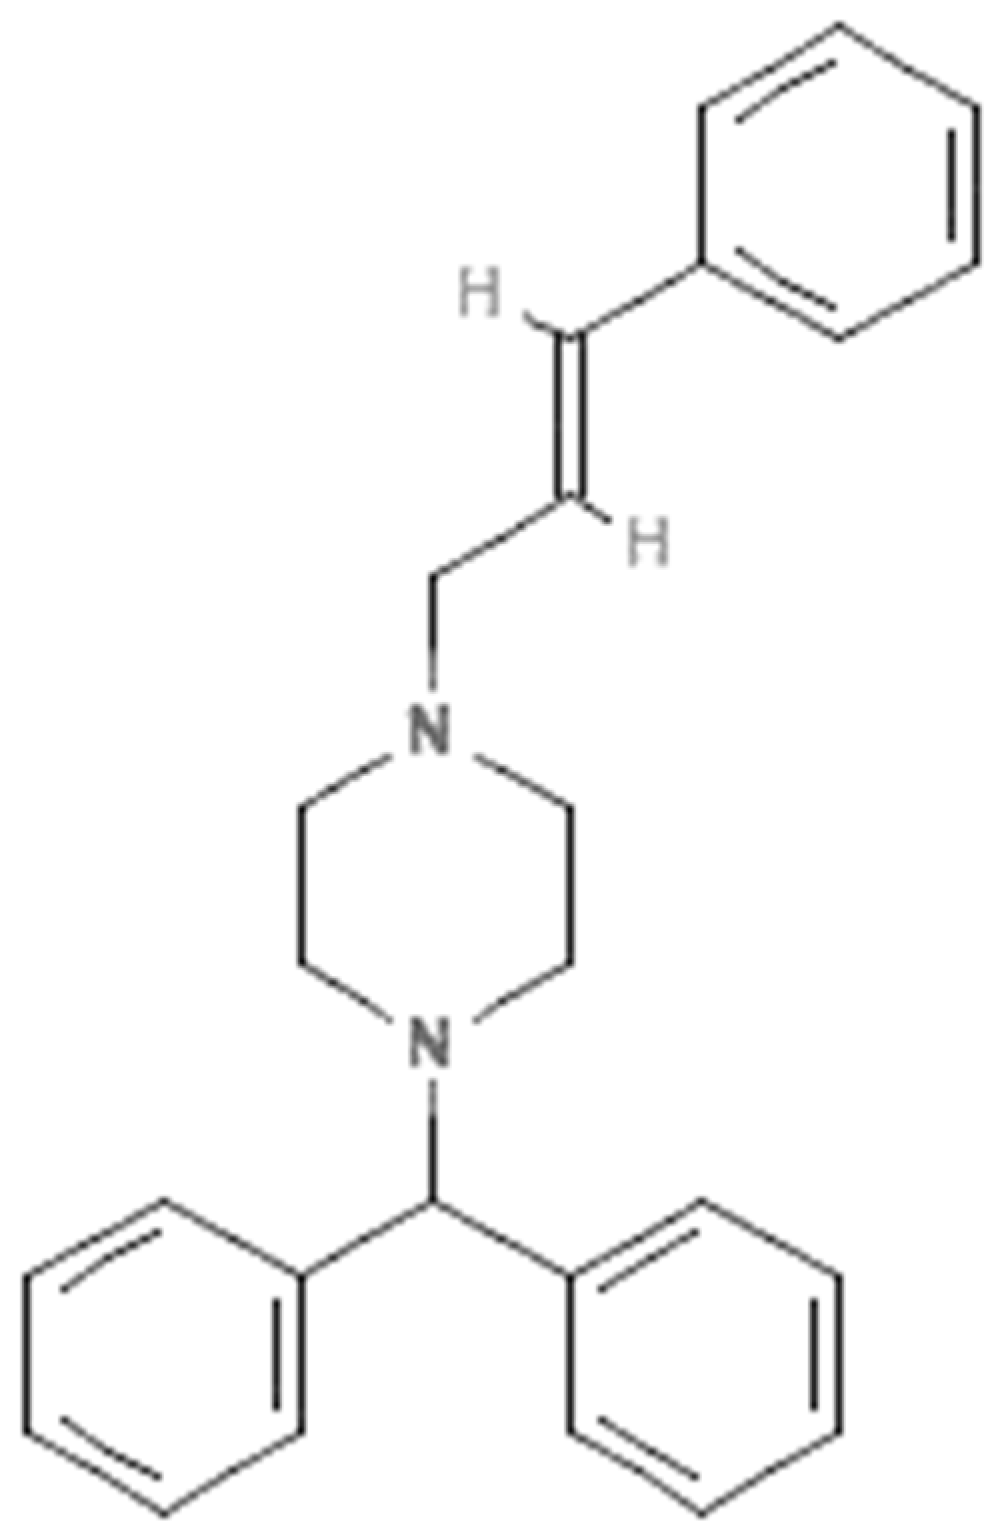
A Validated, Stability-Indicating, Eco-Friendly HPTLC Method for the Determination of Cinnarizine

1
Department of Pharmacognosy, College of Pharmacy, Prince Sattam Bin Abdulaziz University, Al-Kharj 11942, Saudi Arabia
2
Department of Pharmaceutics, College of Pharmacy, King Saud University, Riyadh 11451, Saudi Arabia
3
Department of Pharmacognosy, Faculty of Pharmacy, Mansoura University, Mansoura 35516, Egypt
4
Department of Pharmaceutical Sciences, College of Pharmacy, AlMaarefa University, Ad Diriyah 13713, Saudi Arabia
*
Authors to whom correspondence should be addressed.
Separations 2023, 10(2), 138; https://doi.org/10.3390/separations10020138
Submission received: 1 February 2023 / Revised: 12 February 2023 / Accepted: 15 February 2023 / Published: 17 February 2023
(This article belongs to the Section Analysis of Natural Products and Pharmaceuticals)

Abstract

:
The eco-friendly high-performance thin-layer chromatographic (HPTLC) approaches for measuring cinnarizine (CIN) are scant in reported databases. As a result, the current work has developed and validated an eco-friendly HPTLC technique for assessing CIN in commercial formulations. The proposed approach was based the use of ethyl alcohol-water (90:10 v/v) as the eco-friendly mobile phase. A wavelength of 197 nm was used to detect CIN. The greenness score of the current approach was measured using the Analytical GREENness (AGREE) approach. The current approach was linear for CIN measurement in 50–800 ng band−1 range. The current approach for CIN measurement was validated successfully using ICH guidelines and was found to be linear, accurate (% recovery = 99.07–101.29%), precise (% CV = 0.80–0.95%), robust, sensitive (LOD = 16.81 ng band−1 and LOQ = 50.43 ng band−1), specific, selective, stability-indicating, and eco-friendly. The AGREE score for the current approach was calculated to be 0.80, showing an excellent greenness characteristic of the present approach. Under forced degradation conditions, the current approach was successful in separating the CIN degradation product, demonstrating the stability-indicating qualities/selectivity of the present approach. The % assay of CIN in commercial tablet brands A and B was found to be 98.64 and 101.22%, respectively, suggesting the reliability of the present approach in the pharmaceutical analysis of CIN in commercial dosage forms. The obtained findings indicated that CIN in commercial formulations could be routinely determined using the current approach.

1. Introduction

Cinnarizine (CIN) is piperazine derivative which is used as an antihistaminic and blood-flow promoter due to its H1-receptor and calcium-channel-blocking activity, respectively [1,2]. Its molecular structure is presented in Figure 1. It is recommended for the symptomatic relief of nausea and vertigo caused by Meniers and other vestibular diseases [3]. Several studies indicated that CIN is highly efficacious in the treatment of motion sickness and has fewer side effects compared to other drugs [4,5]. It has been found to be poorly soluble in water but is a highly permeable drug [6,7]. Due to its poor solubility, the bioavailability and oral absorption of CIN are poor after oral administration [8,9]. CIN has been found in numerous commercial formulations. Accordingly, the qualitative and quantitative assessment of CIN in a variety of commercial formulations is important.
Numerous analytical techniques for the pharmaceutical analysis of CIN in pure drug samples, commercial formulations, and biological samples were identified by a thorough literature search. Numerous ultraviolet (UV)-based spectrophotometry approaches have been developed and validated for the detection of CIN in pure drug samples and commercial formulations, either alone or in combination with other medications [10,11,12,13,14,15,16]. However, the spectrophotometry approaches reported were less sensitive and had a lower accuracy than the present approach [10,11,12,13,14,15,16]. Numerous high-performance liquid chromatography (HPLC) assays were also identified to measure CIN in bulk drug and commercial, combined-dosage forms [17,18,19,20,21]. HPLC approaches were also used to determine CIN in plasma samples [22,23,24]. A sensitive liquid-chromatography mass-spectrometry (LC-MS) technique was designed to measure the potential genotoxic impurities in CIN [25]. The reported HPLC and LC-MS approaches for the determination of CIN were more environmentally toxic than the present approach [17,18,19,20,21,22,23,24,25]. The determination of CIN in bulk drug samples and commercial, mixed-dosage forms was also reported by distinct high-performance thin-layer chromatography (HPTLC) and HPLC techniques [26,27,28]. HPLC and HPTLC approaches have also been utilized to determine CIN in pharmaceutical preparations and serum samples [29]. The HPTLC densitometric method has also been developed for the synchronous estimation of CIN and acefylline heptaminol in the presence of potential impurities and their reported degradation products [30]. The linearity range, sensitivity, and CIN pharmaceutical assay of most of the reported HPTLC approaches were inferior to the present method [26,27,28,29,30]. An ultra-high-performance liquid chromatography method was also developed for the simultaneous identification of CIN, its five specified impurities, two degradation products, and two antioxidants [31]. A Raman spectroscopy technique was also used to measure CIN at high pressure [32]. Voltammetry techniques have also been established to find CIN in blood samples and pharmaceutical formulations [33,34]. CIN in mixed-dosage forms was also determined using fluorimetry techniques [35,36]. To detect CIN in rat plasma samples, a supercritical fluid chromatography tandem mass spectrometry method was also developed [37]. The simultaneous determination of CIN and flunarizine in human and animal plasma, urine, and milk samples has also been performed using a sensitive gas chromatography method [38]. Capillary electrophoresis and full spectrum chemometric approaches were also utilized to estimate CIN in combined formulations [39,40].
There are several analytical approaches for CIN analysis in the literature. However, the determination of CIN has not employed an eco-friendly HPTLC method. Furthermore, no greenness profile was estimated for the reported methods. Various approaches to estimate the greenness profiles of the analytical procedures have been utilized in the literature [41,42,43,44,45]. To estimate the greenness profiles, only the Analytical GREENness (AGREE) approach uses all twelve principles of green analytical chemistry (GAC) [43]. Therefore, the greenness characteristics of the present approach was measured using the AGREE approach [43].
Based on the above facts and observations, the goal of the present study is to design and evaluate a stability-indicating, eco-friendly, reverse-phase HPTLC method for the detection of CIN in marketed dosage forms. The current approach for this CIN assay was verified using “The International Council for Harmonization (ICH)-Q2-R1” guidelines [46].

2. Materials and Methods

2.1. Materials

The working standard of CIN (purity = 99.3%) was procured from “FDC Ltd. (Mumbai, India)”. The HPLC-grades ethyl alcohol (EtOH) (purity = 99.9%) and methyl alcohol (purity = 99.9%) were obtained from “E-Merck (Darmstadt, Germany)”. The HPLC-grade water (H2O)/ultra-pure H2O (conductivity < 1.0 µS cm−1 and resistivity = 18.2 MΩ) was procured from the “Milli-Q® (Milli-Q, Lyon, France)” apparatus. The commercial tablet brands A and B of CIN (each having 25 mg of CIN) were procured from Riyadh, Saudi Arabia. All other materials were of analytical grade.

2.2. Equipment and Analytical Conditions

The “HPTLC CAMAG TLC system (CAMAG, Muttenz, Switzerland)” was utilized to determine CIN in commercial tablet brands A and B. For the application of samples as 6 mm bands, a “CAMAG Automatic TLC Sampler 4 (ATS4) Sample Applicator (CAMAG, Geneva, Switzerland)” was utilized. The “RP-60F254S TLC plates (E-Merck, Darmstadt, Germany)” were used as the stationary phase for the separation of CIN. The “CAMAG microliter Syringe (Hamilton, Bonaduz, Switzerland)” was loaded to the sample applicator. For the entire measurement, the application rate for the measurement of CIN was fixed at 150 nL s−1. The stationary phase was set up at a distance of 80 mm in a “CAMAG automated developing chamber 2 (ADC2) (CAMAG, Muttenz, Switzerland)”. The mixture of EtOH-H2O (90:10 v/v) was used as the eco-friendly mobile phase. The development chamber was thoroughly saturated with the vapors of the eco-friendly mobile phase for 30 min at 22 °C. The CIN was measured at a wavelength of 197 nm. The scan speed was set to 20 mm s−1 and the slit size was modified to 4 × 0.45 mm2. Three or six replicates were used for each analysis. The “WinCAT’s (version 1.4.3.6336, CAMAG, Muttenz, Switzerland)” software was used for interpreting the data.

2.3. Calibration Curve for CIN

An accurately weighed 10 mg of CIN was added to 100 mL of eco-friendly mobile phase to create a CIN stock solution of a 100 µg mL−1 concentration (n = 3). Serial dilutions of this stock solution were performed to produce CIN concentrations in the range from 50 to 800 ng band−1 (n = 3). Each CIN solution was placed into to TLC plates in an amount of 200 µL, and the necessary chromatographic response was noted. The measured chromatographic response versus the CIN concentrations were graphically represented to construct the CIN calibration plot. All solutions and experiments were carried out in six replicates (n = 6).

2.4. Sample Preparation for the Assay of CIN in Commercial Tablets

Twenty commercial tablet brands A and B, each having 25 mg of CIN, were averaged to determine their average mass. With the help of a glass pestle and mortar, twenty tablets from each brand were ground into a fine powder. A piece of the powder, having the average mass from each brand, was mixed with 10 mL of methyl alcohol. Then, 50 mL of the mobile phase was used to dilute 1 mL of this solution for each brand of tablet. To remove any undissolved excipients, the generated commercial tablet solutions were sonicated at 25 °C for 25 min and filtered using Whatman filter paper (No. 41). The resulting samples were examined for CIN contents in commercial tablets using the current approach.

2.5. Validation Studies

The present CIN analysis approach was validated utilizing the ICH-Q2-R1 protocol for a number of criteria, including system appropriateness, linearity, accuracy, precision, robustness, sensitivity, specificity, and selectivity [46]. To examine the system’s suitability for the current approach for CIN analysis, an assessment of the retardation factor (Rf), tailing/asymmetry factor (As), and theoretical plates number per meter (N m−1) was utilized. The reported equations were utilized to determine the values of Rf, As, and N m−1 [45].
By plotting the measured chromatographic response versus the CIN concentrations, the linearity of the CIN was assessed. Six repetitions (n = 6) were used to determine the linearity of the current approach for CIN estimation in the range from 50 to 800 ng band−1.
Using the spiking methodology, the intra-day and inter-day accuracies of the present approach for CIN measurement were evaluated in terms of percent recoveries [46]. The pre-analyzed concentration of CIN (200 ng band−1) was spiked with an extra 50, 100, and 150% CIN solution to create low-quality control (LQC = 300 ng band−1), middle-quality control (MQC = 400 ng band−1), and high-quality control (HQC = 500 ng band−1) levels of CIN. On the same day, three distinct CIN QC solutions were re-examined to determine the intra-day accuracy. Over the course of three days, three distinct QC solutions of CIN were re-analyzed to gauge the inter-day accuracy. The percent recovery was calculated at each concentration and for both accuracies. Both accuracies were measured in six replicates (n = 6).
The current approach’s intra-day and inter-day precision for CIN was evaluated. By examining the newly made CIN samples at three distinct QC levels (i.e., LQC, MQC, and HQC) on the same day, it was possible to determine the intra-day precision for CIN. By examining the freshly created CIN solutions at LQC, MQC, and HQC levels over the course of three consecutive days, it was possible to determine the CIN inter-day precision. Both precisions were measured in six replicates (n = 6). The precisions were given as percent of the coefficient of variation (%CV).
The CIN robustness for the current technique was assessed by deliberately changing the composition of the eco-friendly mobile phase. For the current technique, the eco-friendly mobile phase, EtOH-H2O (90:10, v/v), for the CIN was modified to EtOH-H2O (92:8, v/v) and EtOH-H2O (88:12, v/v), and changes in the chromatographic response and Rf values of the CIN were noted.
Using a standard deviation technique, the sensitivity of the current approach for CIN was calculated as the “limit of detection (LOD) and limit of quantification (LOQ)”. The blank solution (without CIN) was examined in six replicates (n = 6) for the current method, and the standard deviation was computed. The values for the “LOD and LOQ” of the CIN were then determined using their published equations [46,47].
In order to evaluate the specificity of the current approach for CIN assessment, the Rf values and the UV spectra of the CIN in formulations A and B were compared to that of pure CIN.

2.6. Forced Degradation/Selectivity Investigations

Forced degradation investigations under four distinct stress conditions, such as acidic (HCl), alkaline (NaOH), oxidative (H2O2), and thermal degradation conditions, were conducted to assess the selectivity/stability-indicating properties of the current approach [45,48]. For all degradation studies, the MQC solution (400 ng band−1) of CIN was freshly prepared using the eco-friendly mobile phase. By mixing 1 mL of MQC solution with 4 mL of 1 M of HCl or 4 mL of 1M of NaOH, acidic and alkaline degradation investigations were performed. Acidic and alkaline hydrolysis mixtures were properly diluted using the eco-friendly mobile phase. The current approach for the measurement of CIN in the presence of its acidic- and alkaline-decomposition compounds, respectively, was applied to these solutions after 48 h of refluxing at 60 °C [45].
The MQC solution (400 ng band−1) of CIN was newly created using the eco-friendly mobile phase for oxidative degradation testing. In order to oxidize this solution (1 mL), 4 mL of 30% H2O2 was added. Using the eco-friendly mobile phase, the mixture was properly diluted. This combination was evaluated using the current method after being refluxed for 48 h at 60 °C in order to identify CIN in the presence of its oxidative hydrolysis [45].
An aliquot of MQC (400 ng band−1) solution was thermally hydrolyzed via transfer to a hot air oven for 48 h at 60 °C after being properly diluted with the eco-friendly mobile phase. The solution was then subjected to the current method for measuring CIN in the presence of its thermal breakdown compounds [45].

2.7. Application of the Existing Approach in the Measurement of CIN in Commercial Tablets

The prepared samples of the commercial tablets were spotted to TLC plates for the current approach. The same experimental setup used to determine the standard CIN was used to record chromatographic responses in triplicates (n = 3). The CIN calibration plot was utilized to measure the percentage assay of CIN in the target formulations with the current approach.

2.8. Greenness Measurement

Utilizing the AGREE approach, the greenness characteristics for the current approach for CIN analysis were predicted [43]. Utilizing “AGREE: The Analytical Greenness Calculator (version 0.5, Gdansk University of Technology, Gdansk, Poland, 2020)”, an AGREE score for the current approach in the range of 0.0–1.0 was calculated.

3. Results and Discussion

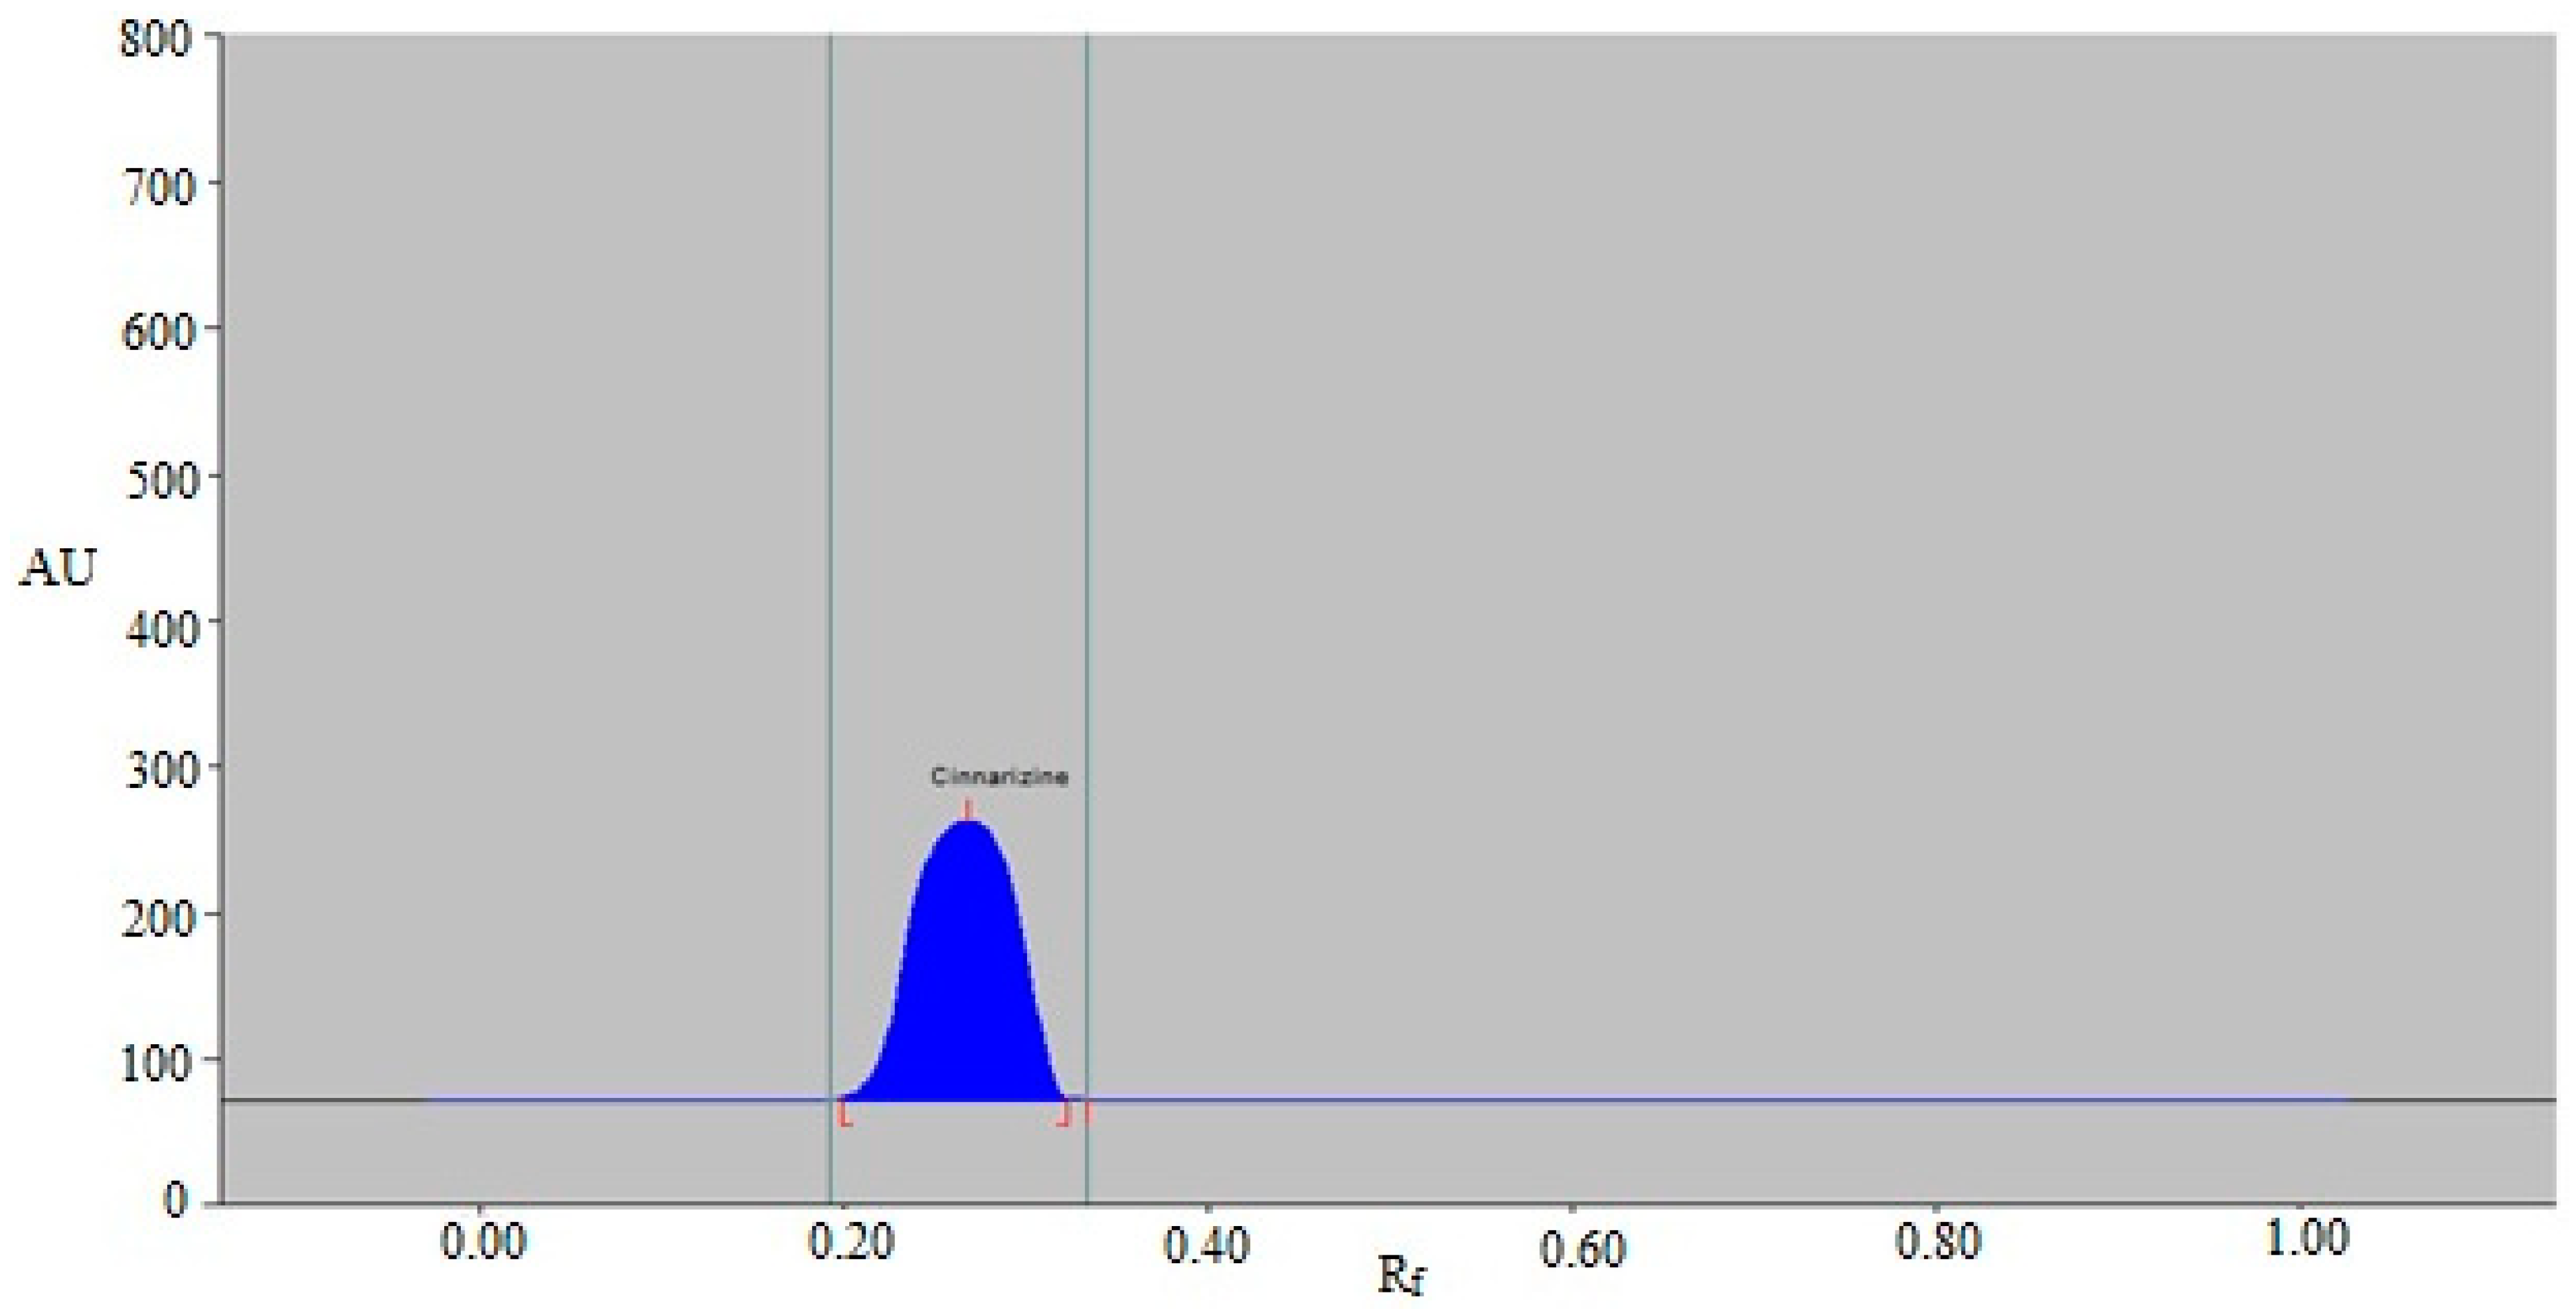
3.1. Method Development

A variety of EtOH and H2O mixtures were examined as the environmentally safe mobile phases for the development of the current approach to CIN measurement, such as EtOH-H2O (30:70 v/v), EtOH-H2O (40:60 v/v), EtOH-H2O (50:50 v/v), EtOH-H2O (60:40 v/v), EtOH-H2O (70:30 v/v), EtOH-H2O (80:20 v/v), and EtOH-H2O (90:10 v/v). For the construction of all environmentally friendly mobile phases, chamber saturation conditions were utilized. A typical TLC chromoplate for pure CIN, the target formulations, and forced decomposition samples are shown in Figure 2.
The eco-friendly mobile phase compositions and distinct chromatography parameters are summarized in Table 1.
The results showed that the eco-friendly mobile phases, such as EtOH-H2O (30:70 v/v), EtOH-H2O (40:60 v/v), EtOH-H2O (50:50 v/v), EtOH-H2O (60:40 v/v), EtOH-H2O (70:30 v/v), and EtOH-H2O (80:20 v/v), produced undesirable CIN chromatographic peaks with larger As values (As ˃ 1.25). Closer examination, on the other hand, revealed that the eco-friendly EtOH-H2O mobile phase (90:10 v/v) offered a well-separated and uninterrupted CIN chromatographic peak at Rf = 0.27 ± 0.01 (Figure 3). Furthermore, it was observed that CIN had a reliable As value of 1.10 for CIN measurement. The EtOH-H2O (90:10 v/v) phase was therefore chosen as the final environmentally acceptable mobile phase for the current approach to CIN analysis. For the measurement of CIN, different wavelengths ranging from 200 to 400 nm were studied. When the CIN spectral bands were determined in densitometry mode, the wavelength with the highest chromatographic response was found to be 197 nm. As a result, 197 nm was employed for the entire CIN analysis.

3.2. Analytical Method Validation

The ICH-Q2-R1 protocol was adhered to in order to collect multiple validation parameters for the CIN analysis [46]. The system suitability parameters for the current approach were determined. The current approach’s Rf, As, and N m−1 for CIN measurement were determined to be 0.27 ± 0.01, 1.10 ± 0.03, and 4523 ± 3.78, respectively, which were suitable for CIN measurement.
Table 2 displays the findings of the linearity assessment of the CIN calibration curve using the present approach. The 50–800 ng band−1 concentration range of the CIN calibration curve for the present approach was demonstrated to be linear. The determination coefficient (R2) and regression coefficient (R) of the CIN for the current method were calculated to be 0.9976 and 0.9987, respectively. These findings suggested a close relation between the CIN concentrations and the observed chromatographic response. The linearity of CIN for the three HPTLC methods from the literature were reported as a 0.5–6 µg band−1, 0.4–1.6 µg band−1, and 1–22 µg mL−1, respectively [26,27,28]. The linearity range of CIN for the HPTLC methods from the literature was greatly inferior to the current approach [26,27,28]. These results demonstrate the linearity of the present method for CIN measurement.
Using the spiking technique, the intra-day and inter-day accuracy of the present CIN analysis method was determined. Table 3 provides the outcomes of the current approach’s % recovery. The intra-day % recoveries of CIN at three different QC solutions were calculated to be 99.24–101.29% by the present methodology. At three different QC levels, it was discovered that the CIN inter-day % recoveries for the present approach ranged from 99.07 to 101.26%. The % recovery of CIN for two HPTLC methods from the literature was reported as 99.78 and 100.27%, respectively [26,27]. The % recovery of CIN for the HPTLC methods from the literature was similar to the current approach [26,27]. The obtained outcomes demonstrate that the present approach is accurate for the determination of CIN.
The intra-day/inter-day precision of the current approach was assessed, and the precision results for the CIN measurements are expressed in terms of the % CV. Table 4 lists the results of both precisions for the present CIN analysis methodology. It was demonstrated that the current approach has a CV of the intra-day precision of CIN of 0.80–0.91%. It was demonstrated that the current method has a CV for the inter-day precision of CIN of 0.85–0.95%. The precision of CIN for two HPTLC methods from the literature was reported as 0.68–1.09 and 0.53–1.34%, respectively [26,27]. The precision of CIN for the HPTLC methods from the literature was also similar to the current approach [26,27]. These outcomes demonstrate the precision of the current approach to determine CIN.
By purposefully changing the composition of the eco-friendly mobile phase, the robustness of the existing method for CIN measurement was evaluated. The results of the robustness evaluation for the present approach are listed in Table 5. The CIN % CV for the present approach was found to be 0.92–1.02%. The CIN Rf values were found to be 0.26–0.28 for the current approach. These outcomes demonstrate that the current approach to CIN analysis is robust.
To evaluate the sensitivity of the existing CIN analysis technique, the “LOD and LOQ” were estimated. The computed “LOD and LOQ” data for the CIN for the present technique are presented in Table 2. The “LOD and LOQ” of CIN were discovered to be 16.81 ± 0.09 and 50.43 ± 0.27 ng band−1, respectively, according to the data. The “LOD and LOQ” of CIN for HPTLC methods from the literate were been reported as 0.03 and 0.12 µg band−1, respectively [27]. The “LOD and LOQ” of CIN for an HPTLC method from the literature was much higher than the current approach [27]. Hence, the current approach was found to be more sensitive than reported HPTLC methods for CIN analysis [27]. The obtained results show that the existing method is sufficiently sensitive for CIN analysis.
By comparing the Rf values and the UV spectra of the CIN in commercial tablet brands A and B with that of pure CIN, the specificity of the present approach for determining CIN concentrations was evaluated. Figure 4 compares the combined UV absorption spectrum of pure CIN with the CIN found in brands A and B of commercial tablets. The commercial formulations and the standard CIN were measured for their peak responses at 197 nm. Formulations A and B, as well as the standard CIN, had identical UV spectra, Rf values, and detection wavelengths, illustrating the current method’s specificity for determining CIN. Overall, the current approach was found to be more linear and sensitive than the reported HPTLC methods of CIN analysis [26,27,28]. However, the accuracy and precision of the current approach were found to be similar to the reported HPTLC methods [26,27,28]. On the other hand, the main limitation of the present method is that it is applicable for the analysis of a single analyte, i.e., CIN. The simultaneous determination of multiple analytes cannot be performed using the present method.

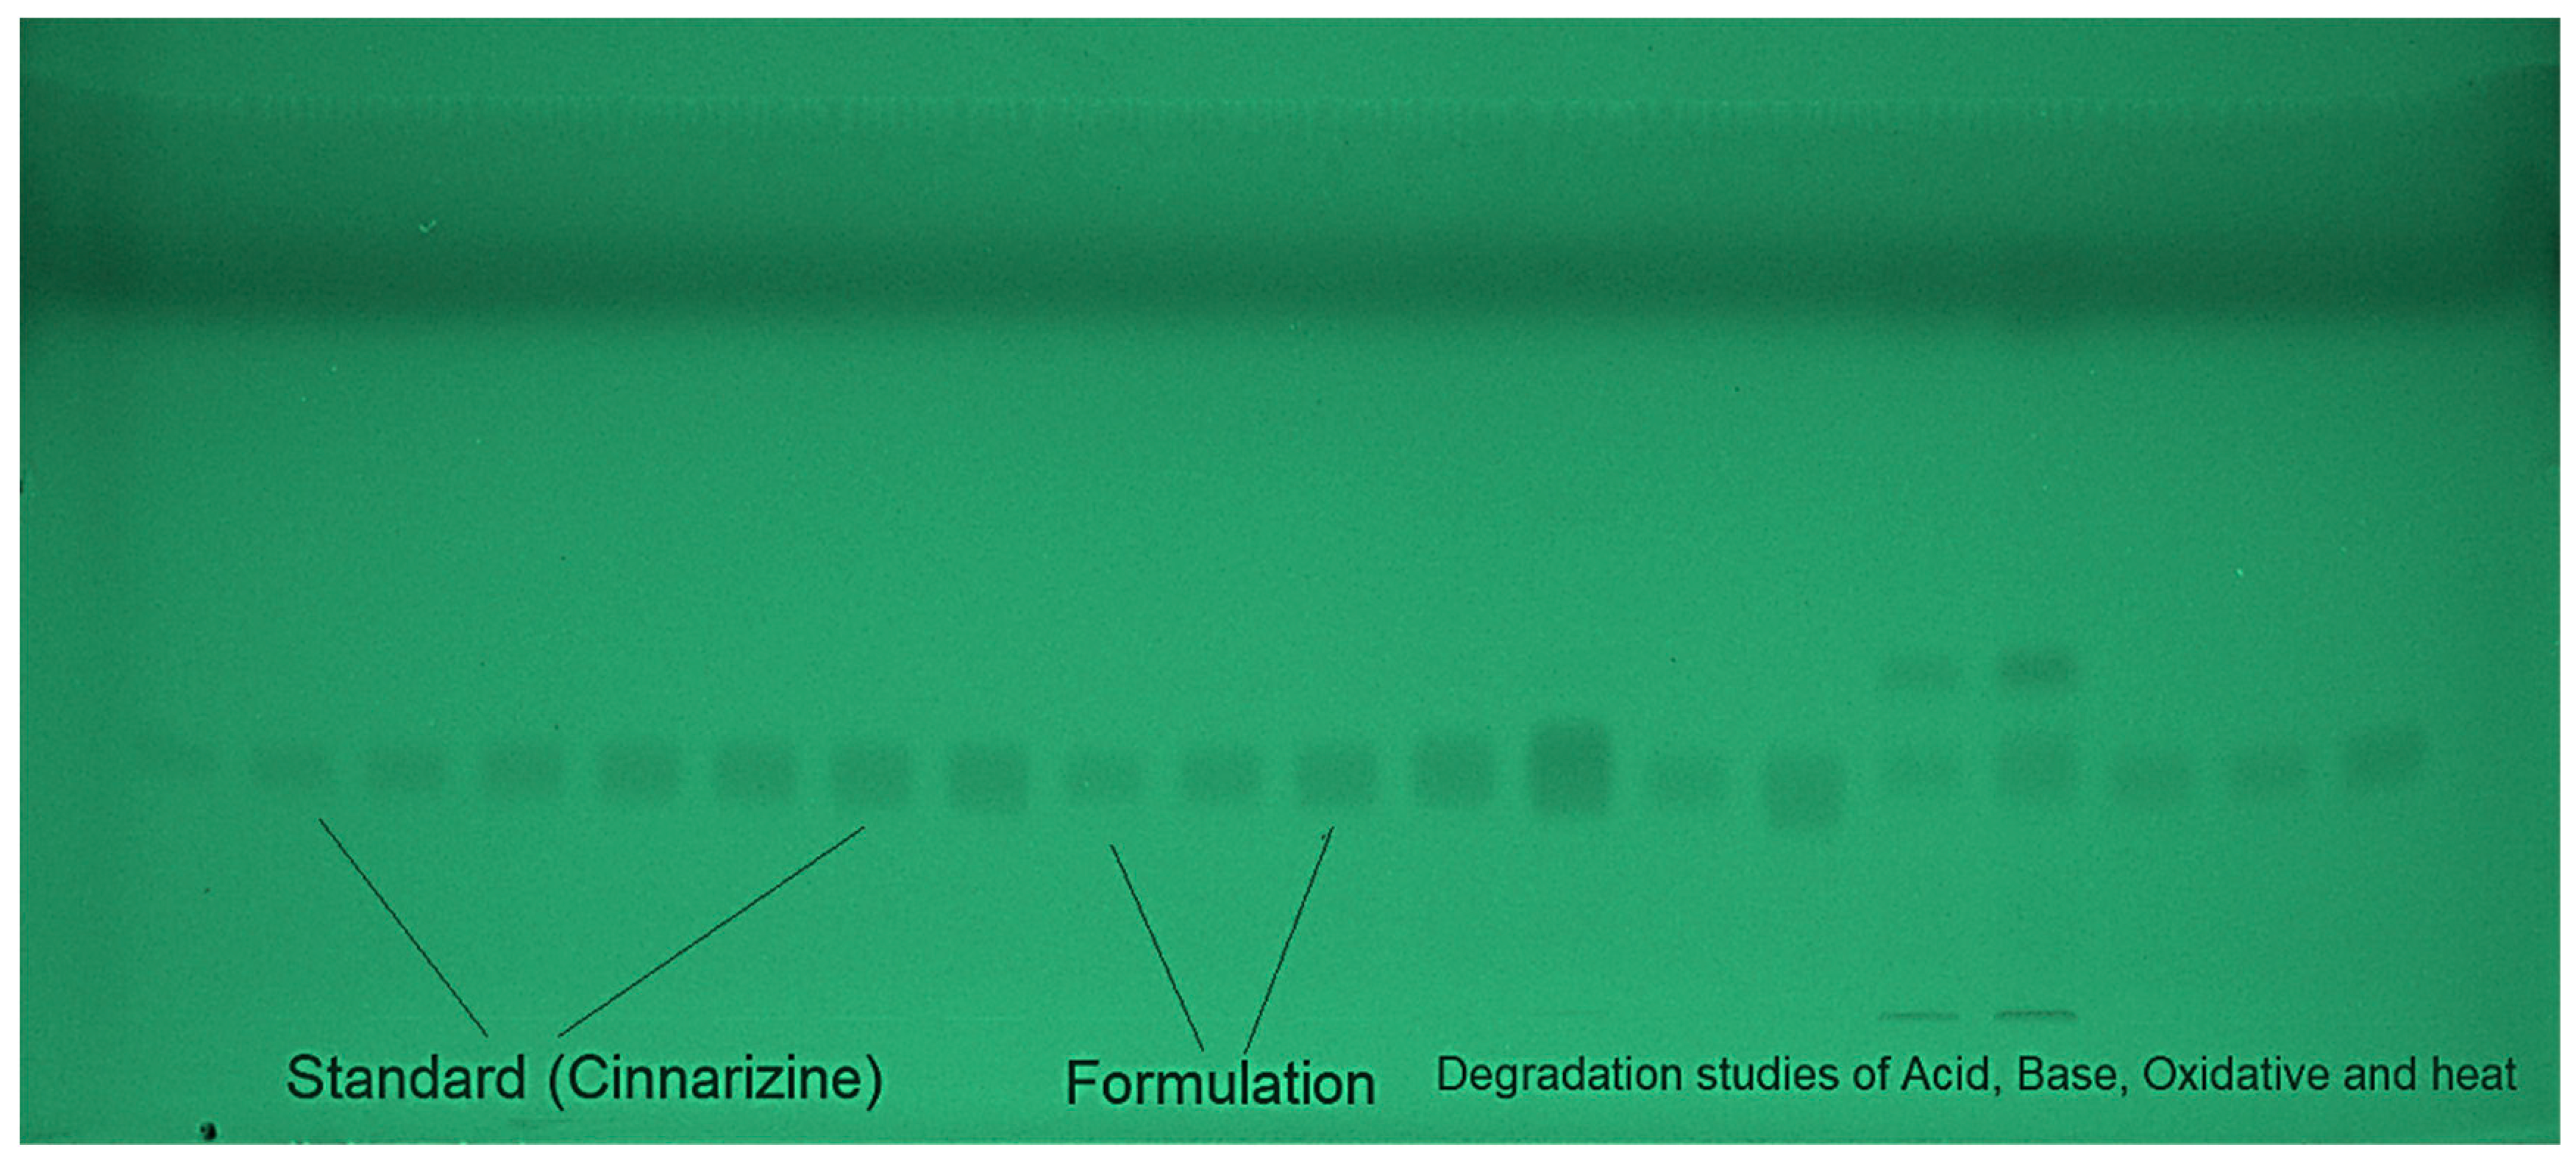
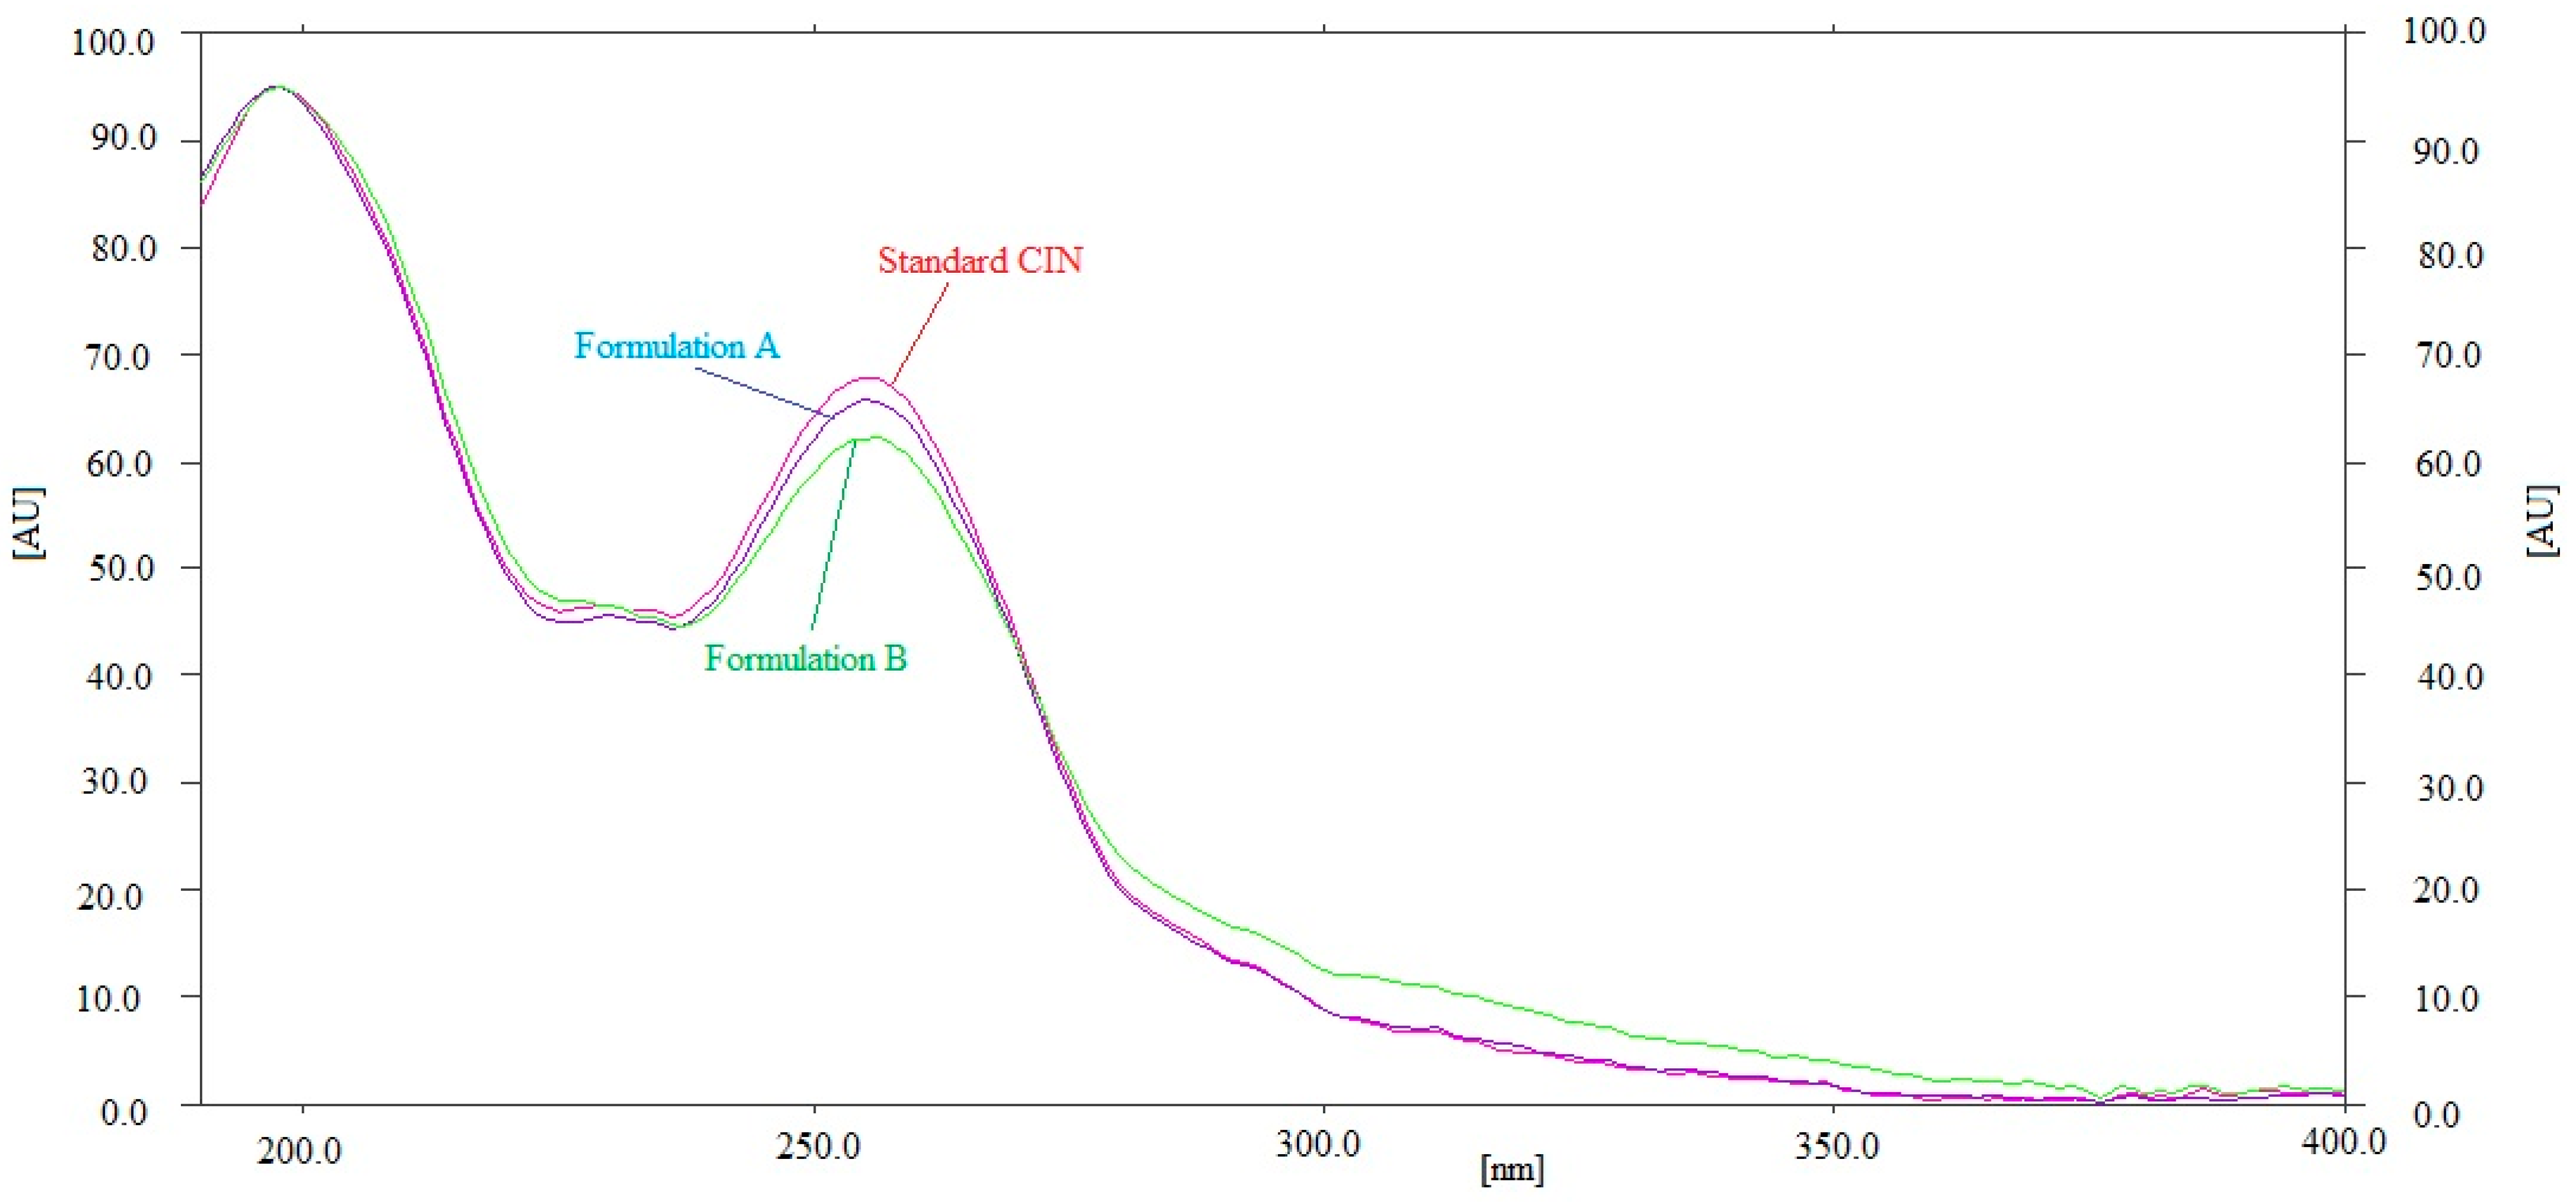
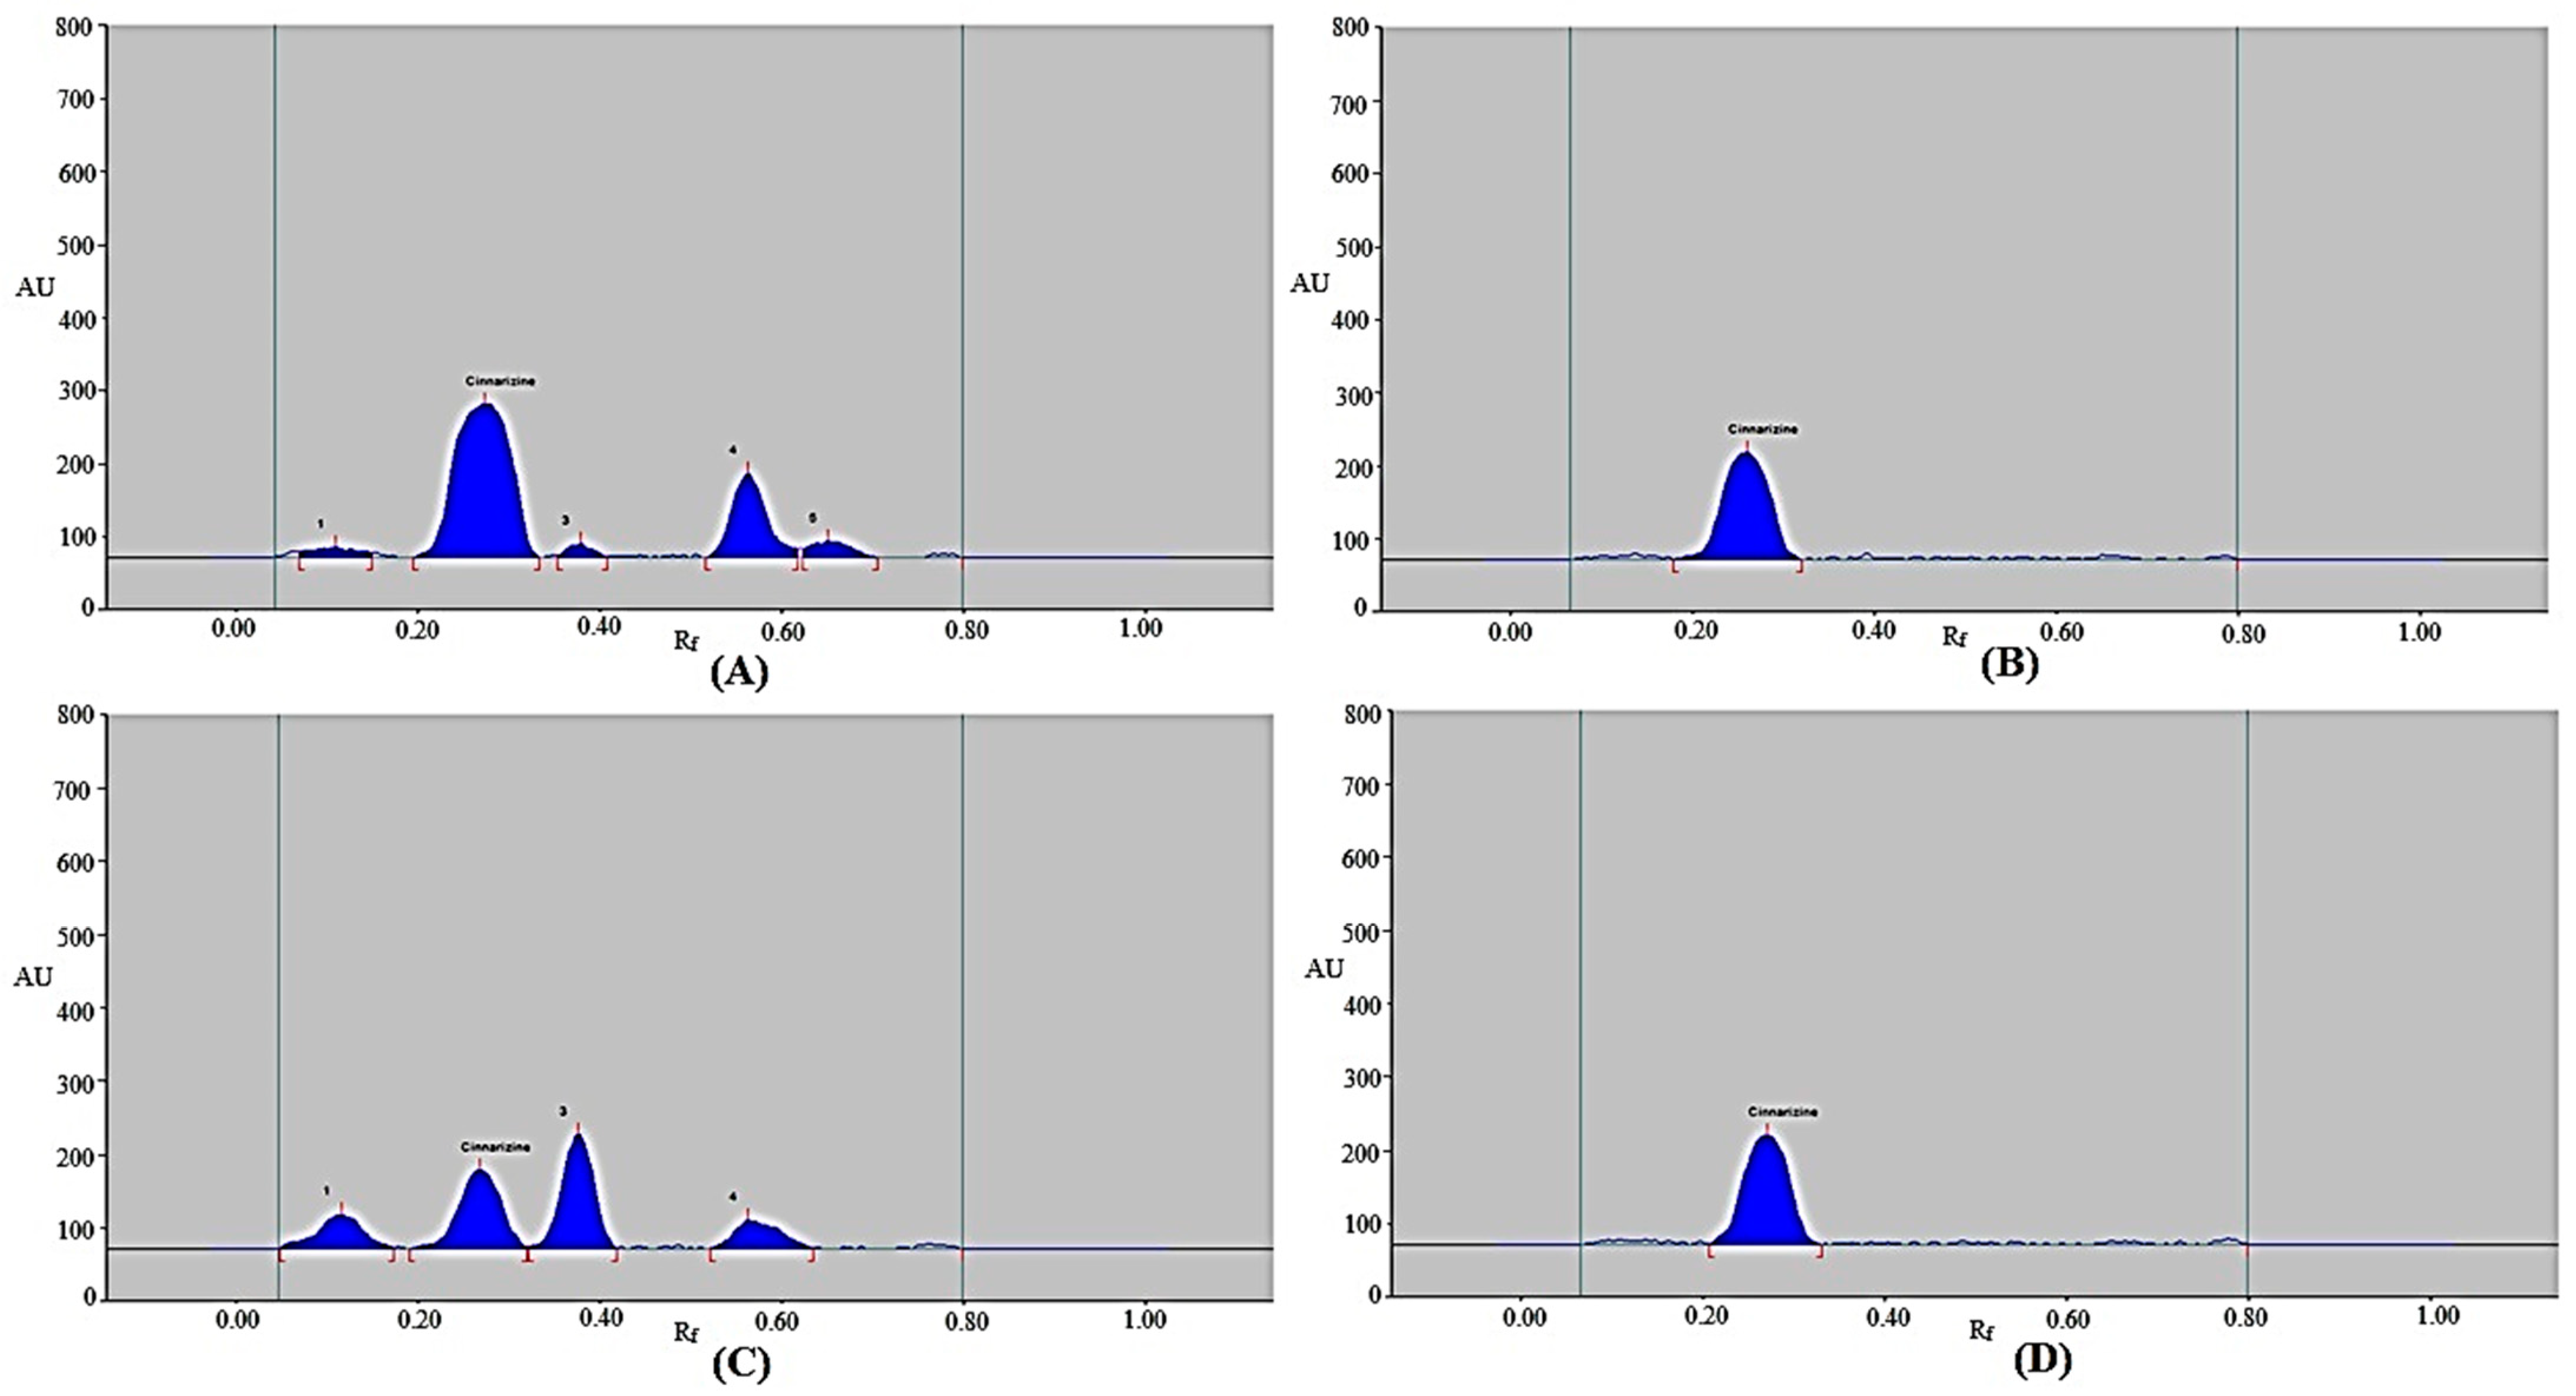
3.3. Selectivity/Forced Degradation Investigations

The selectivity/degradation of the present approach was evaluated using four different stress settings. The results are displayed in Figure 5 and Table 6. In the chromatograms from the degradation scenario, the CIN peak was clearly distinguishable from the other peaks of degradation products (Figure 5). During the acidic degradation test, CIN remained at 66.40%, while 33.60% was decomposed (Table 6 and Figure 5A). As a result, CIN was found to be sufficiently unstable under acidic degradation conditions. Chromatographic peaks 1, 3, 4, and 5 in Figure 5A, which represent the acid-induced degradation peaks, were separated by Rf values of 0.11, 0.38, 0.56, and 0.65, respectively. During the acidic degradation test, CIN’s Rf value was unchanged (Rf = 0.27). As 100% of the CIN was left after the alkaline and thermal degradation tests, no CIN was degraded under alkaline and thermal stress conditions (Table 6 and Figure 5B,D). As a result, CIN was found to be highly stable under alkaline and thermal stress conditions. During the alkaline degradation tests, the CIN’s Rf value was slightly shifted (Rf = 0.26). However, during the thermal degradation tests, the CIN’s Rf value was remained the same (Rf = 0.27). During the oxidative degradation test, CIN remained at 32.68%, while 67.32% was decomposed (Table 6 and Figure 5C). As a result, CIN was found to be highly unstable under oxidative conditions. Chromatographic peaks 1, 3, and 4 in Figure 5C, which represent the oxidative degradation peaks, were separated by Rf values of 0.12, 0.38, and 0.56, respectively. Under oxidative degradation conditions, the CIN’s Rf value was also unchanged (Rf = 0.27). Using the current approach, the maximum CIN decomposition was found during the oxidative degradation test. These outcomes suggest that CIN can be measured using the present approach in the presence of its decomposition compounds. These results show that the current approach has selectivity and a stability-indicating property.

3.4. Application of Existing Approach in the Measurement of CIN in Commercial Tablets

For the measurement of CIN in commercial tablets, the current approach was utilized as an alternative approach to regular chromatographic techniques. The chromatogram of CIN from the commercial tablet brands A and B was identified by contrasting the TLC spot at Rf = 0.27 ± 0.01 for CIN with pure CIN using the present approach. When using the present approach, the CIN in commercial tablet brands A and B had the same chromatographic peak as pure CIN. Furthermore, commercial tablet brands A or B did not exhibit any formulation-excipient peaks, showing no interaction between CIN and the excipients of the tablets. As no physical or chemical interaction was found, modification of the mobile phase or stationary phase was not required for further analysis. Using the current approach, the CIN amount was derived by the CIN calibration curve. Using the current approach, the % assay of CIN in commercial tablet brands A and B was determined to be 98.64 ± 0.98 and 101.22 ± 1.08%, respectively. The % assay of CIN in commercial formulations using two HPTLC methods from the literature were reported as 99.86–101.18% and 105.03%, respectively [26,27]. The % assay of CIN in the commercial formulations using current approach was similar to the first HPTLC method from the literature [26] and was superior to the second HPTLC method [27]. These results suggest that the current strategy is appropriate for the CIN pharmaceutical assay. Hence, the current method can be applied successfully in the routine analysis of CIN in a variety of commercial products in the pharmaceutical industries.

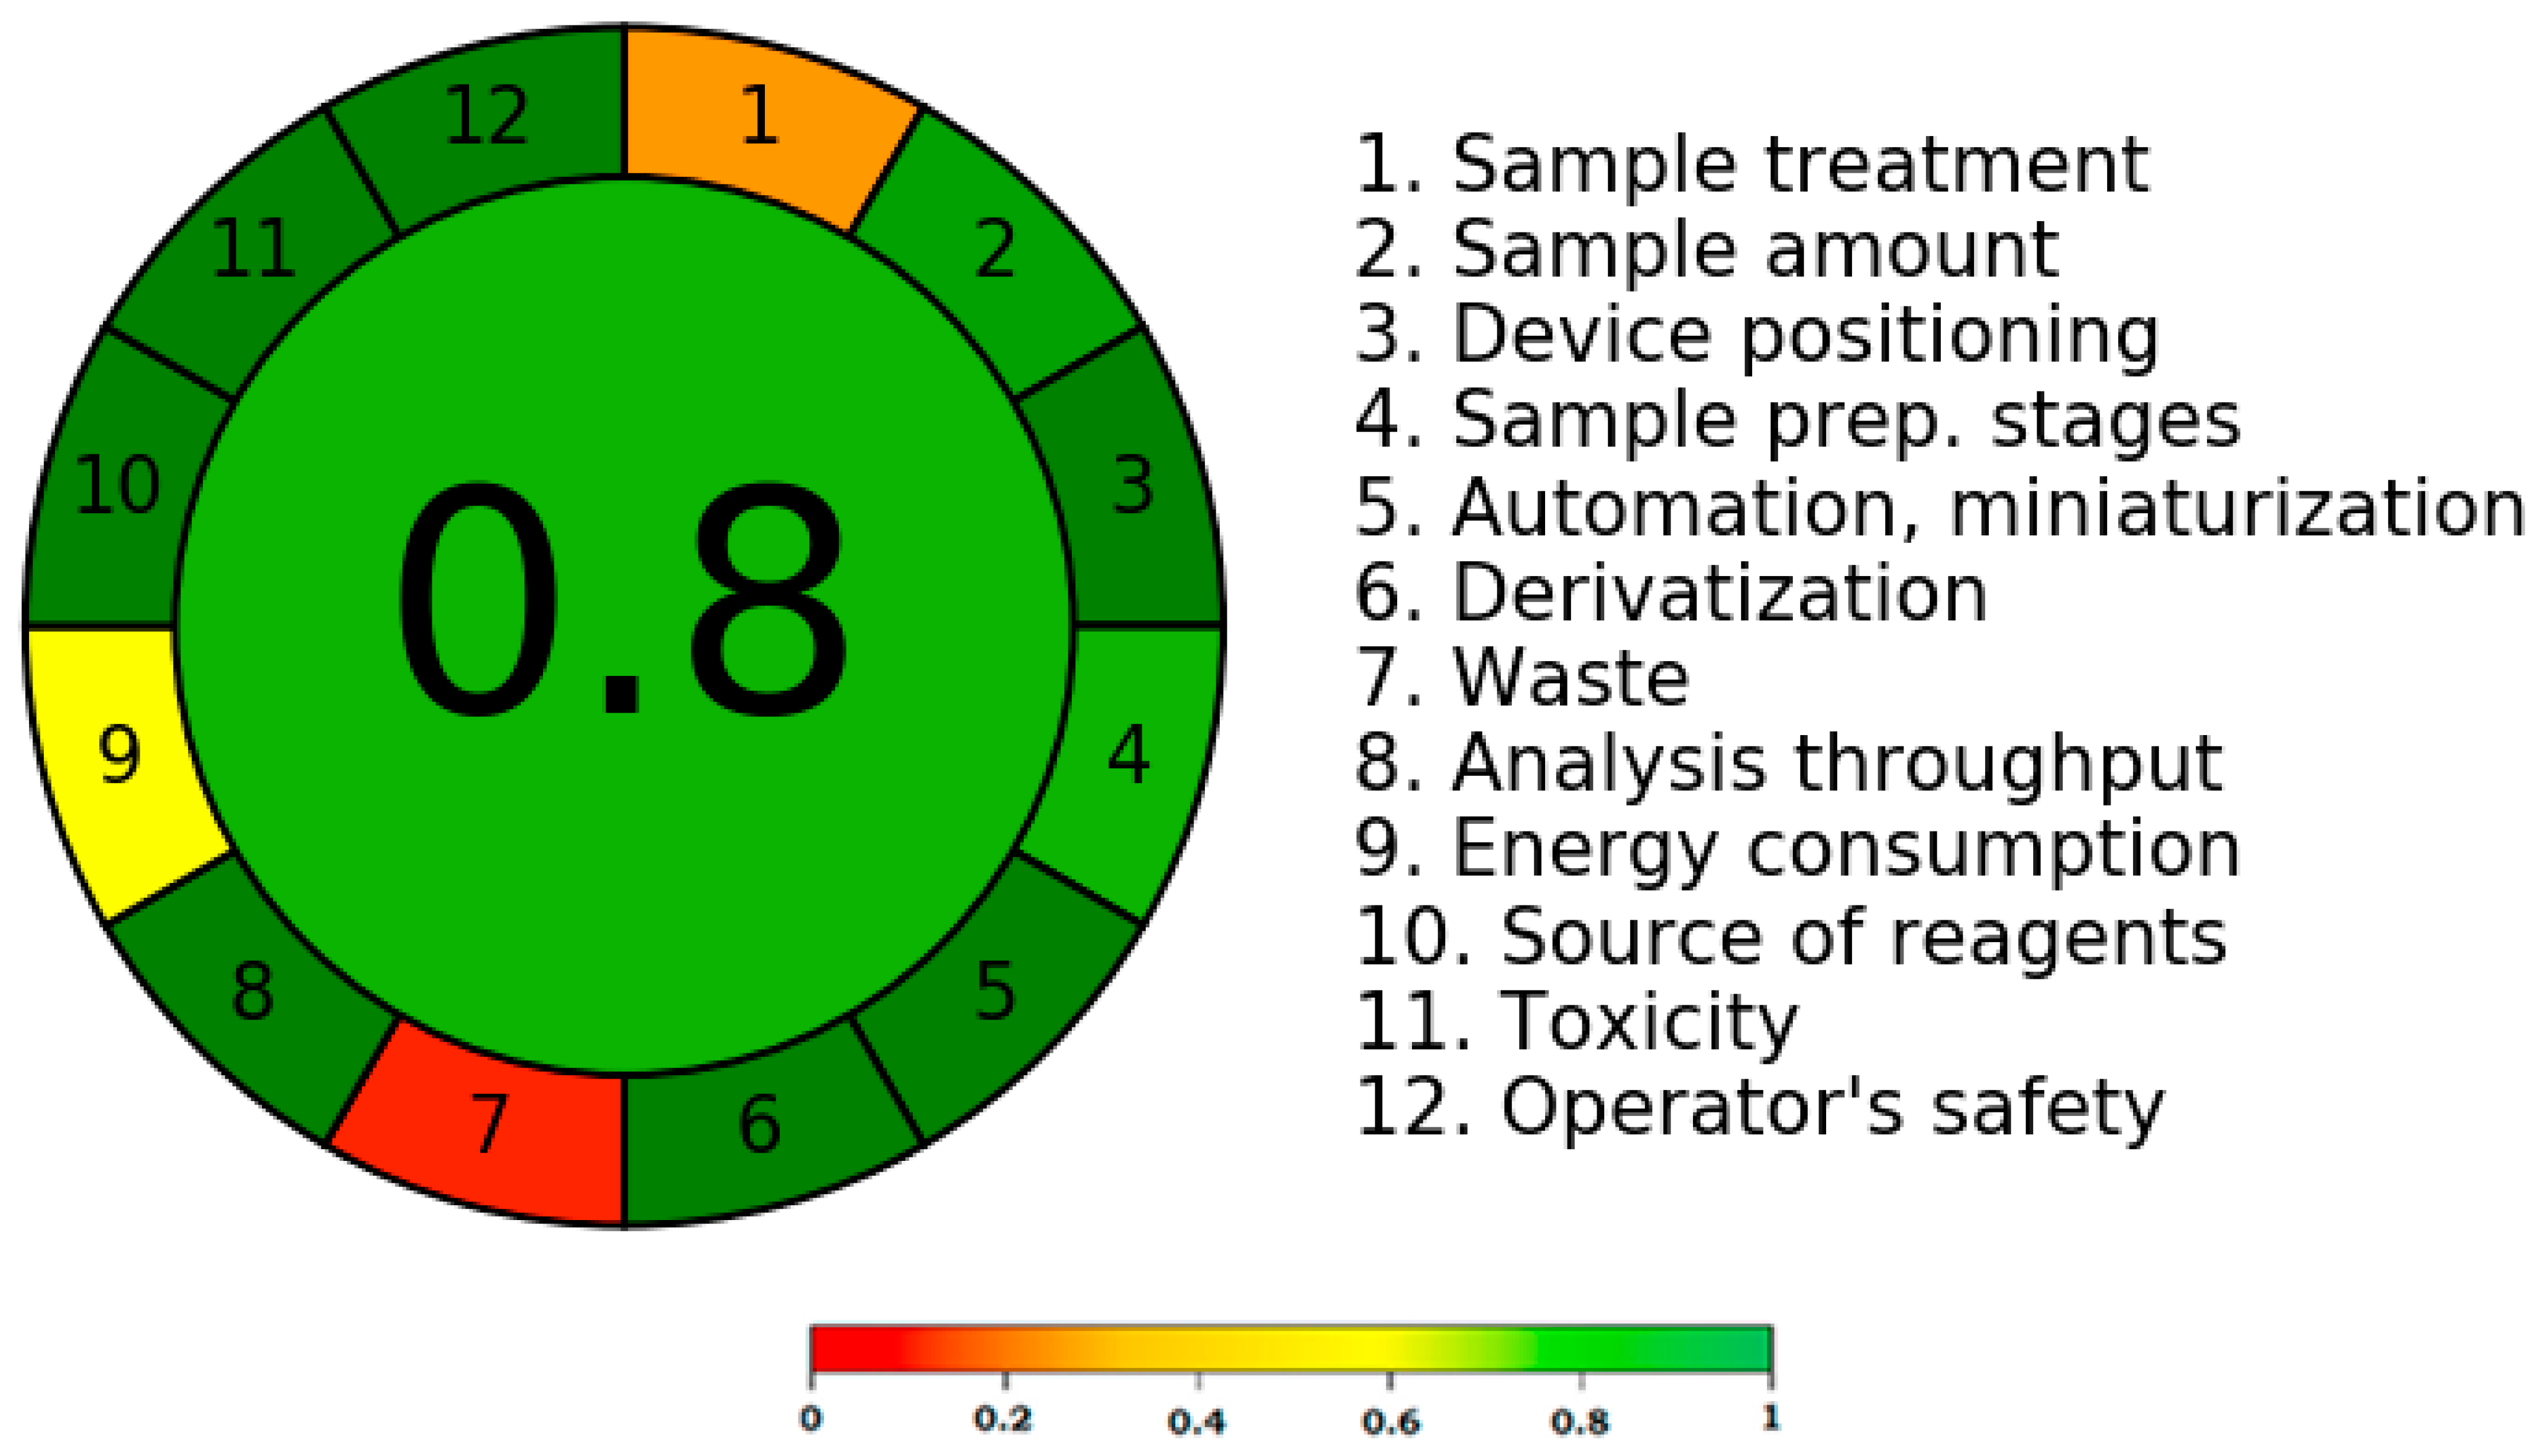
3.5. Greenness Measurement

According to the literature, the greenness score of an analytical method can be determined using a variety of methods [41,42,43,44,45]. To determine the greenness score, only the AGREE metric technique considers all twelve GAC principles [43]. The greenness rating of the current technique was therefore determined using the AGREE metric approach. Figure 6 displays a representative pictogram for the AGREE score of the present method. The distinct AGREE scores/weights for each component of the GAC were assigned by the AGREE calculator. The distinct GAC criteria are also mentioned in Figure 6 (points 1–12). The assigned weights/scores were in the range of 0.0 to 1.0. The current approach’s AGREE score was calculated to be 0.80, indicating that it had an outstanding greenness profile for CIN analysis.

4. Conclusions

For CIN analysis, there are no accessible, green HPTLC methods. This research was carried out in order to establish and validate a straightforward, quick, sensitive, eco-friendly, and stability-indicating HPTLC approach for the analysis of CIN in commercial tablets. The CIN analysis method presented is straightforward, quick, accurate, precise, robust, sensitive, eco-friendly, and stability-indicating. The current strategy has a remarkable greenness profile according to the AGREE analysis. The oxidative degradation process caused CIN to decompose the most, although alkaline and thermal degradation stress conditions showed it to be highly stable. The ability of the current method to identify CIN, even in the presence of its breakdown products, highlighted the selectivity/stability-indication capabilities of the method. In terms of linearity, sensitivity, and the CIN pharmaceutical assay, the new methodology was proven to be superior to the published HPTLC methods. Furthermore, the present method is eco-friendly and stability-indicating when compared to the reported HPTLC methods. These findings suggested that the CIN in commercial formulations can be analyzed using the current methodology. As a result, the current approach can be successfully applied for the routine analysis of CIN in commercial products in the pharmaceutical industry.

Author Contributions

Conceptualization, P.A. and F.S.; methodology, M.H.A., P.A., A.I.F., and T.M.A.; software, W.A.M. and S.A.; validation, S.A. and W.A.M.; formal analysis, F.M.A.B. and W.A.M.; investigation, M.H.A. and A.I.F.; resources, W.A.M.; data curation, T.M.A. and F.M.A.B.; writing—original draft preparation, F.S.; writing—review and editing, S.A., P.A., and W.A.M.; visualization, W.A.M.; supervision, P.A. and F.S.; project administration, F.S. and P.A.; funding acquisition, W.A.M. All authors have read and agreed to the published version of the manuscript.

Funding

This research project was supported by the Researchers Supporting Project, number (RSP2023R516), from the King Saud University, Riyadh, Saudi Arabia. This study was also supported via funding from Prince Sattam bin Abdulaziz University, project number (PSAU/2023/R/1444). The APC was funded by the RSP.

Institutional Review Board Statement

Not applicable.

Informed Consent Statement

Not applicable.

Data Availability Statement

Not applicable.

Acknowledgments

The authors are thankful to the Researchers Supporting Project, number (RSP2023R516), from the King Saud University, Riyadh, Saudi Arabia, for supporting this work. The authors are also thankful to Prince Sattam bin Abdulaziz University for supporting this work via project number (PSAU/2023/R/1444). The authors are also thankful to AlMaarefa University for their generous support.

Conflicts of Interest

The authors declare no conflict of interest.

References

  1. Raghuvanshi, S.; Pathak, K. Recent advances in drug delivery systems and therapeutics of cinnarizine: A poorly water soluble drug with absorption window in stomach. J. Drug Deliv. 2014, 2014, E479246. [Google Scholar] [CrossRef] [PubMed] [Green Version]
  2. Shi, S.; Chen, H.; Lin, X.; Tang, X. Pharmacokinetics, tissue distribution and safety of cinnarizine delivered in lipid emulsion. Int. J. Pharm. 2010, 383, 264–270. [Google Scholar] [CrossRef] [PubMed]
  3. Lucertini, M.; Mirante, N.; Casagrande, M.; Trivelloni, P.; Lugli, V. The effect of cinnarizine and cocculus indicus on simulator sickness. Physiol. Behav. 2007, 91, 180–190. [Google Scholar] [CrossRef] [PubMed]
  4. Doweck, I.; Gordon, C.R.; Spitzer, O.; Melamed, Y.; Shupak, A. Effect of cinnarizine in the prevention of seasickness. Aviat. Space Environ. Med. 1994, 65, 606–609. [Google Scholar]
  5. Gordon, C.R.; Gonen, A.; Nachum, Z.; Dowech, I.; Spitzer, O.; Shupak, A. The effects of dimenhydrinate, cinnarizine, and transdermal scopolamine on performance. J. Psychopharmacol. 2001, 15, 167–172. [Google Scholar] [CrossRef]
  6. Shakeel, F.; Kazi, M.; Alanazi, F.K.; Alam, P. Solubility of cinnarizine in (Transcutol + water) mixtures: Determination, Hansen solubility parameters, correlation, and thermodynamics. Molecules 2021, 26, 7052. [Google Scholar] [CrossRef]
  7. Amidon, G.L.; Lennernas, H.; Shah, V.P.; Crison, J.R. A theoretical basis for a biopharmaceutic drug classification-the correlation of in-vitro drug product dissolution and in-vivo bioavailability. Pharm. Res. 1995, 12, 413–420. [Google Scholar] [CrossRef] [Green Version]
  8. Pedersen, P.B.; Berthelsen, R.; Rades, T.; Jorgensen, S.A.; Vilmann, P.; Bar-Shalom, D.; Baldursdottir, S.; Mullertz, A. Physico-chemical characterization of aspirated and simulated human gastric fluids to study their influence on the intrinsic dissolution rate of cinnarizine. Int. J. Pharm. 2022, 622, E121856. [Google Scholar] [CrossRef]
  9. Albertini, B.; Bertoni, S.; Sangiorgi, S.; Nucci, G.; Resources, N.P.; Mezzina, E. NaDES as a green technological approach for the solubility improvement of BCS class II APIs: An insight into the molecular interactions. Int. J. Pharm. 2023, 634, E122696. [Google Scholar] [CrossRef]
  10. Abdine, H.; Belal, F.; Zoman, N. Simple spectrophotometric determination of cinnarizine in its dosage forms. Farmaco 2002, 57, 267–271. [Google Scholar] [CrossRef]
  11. Salem, M.Y.; El-Bardicy, M.G.; El-Tarras, M.F.; El-Zanfally, E.S. Simultaneous determination of domperidone maleate and cinnarizine in a binary mixture using derivative ratio spectrophotometry and classical least squares calibration. J. Pharm. Biomed. Anal. 2002, 30, 21–33. [Google Scholar] [CrossRef] [PubMed]
  12. Salem, M.Y.; El-Zanfally, E.S.; El-Tarras, M.F.; El-Bardicy, M.G. Simultaneous determination of domperidone and cinnarizine in a binary mixture using derivative spectrophotometry, partial least squares and principle component regression calibration. Anal. Bioanal. Chem. 2003, 375, 211–216. [Google Scholar] [CrossRef] [PubMed]
  13. Devagondanahalli, M.H.; Shaikh, S.M.T.; Jaldappagari, S.; Ramanaboyina, S.K.; Kasalanti, H. Determination of cinnarizine in pure and pharmaceutical formulations. J. Chin. Chem. Soc. 2007, 54, 63–68. [Google Scholar] [CrossRef]
  14. Abdelrahman, M.M. Simultaneous determination of cinnarizine and domperidone by area under curve and dual wavelength spectrophotometric methods. Spectrochim. Acta Part A 2013, 113, 291–296. [Google Scholar] [CrossRef]
  15. Lamie, N.T.; Yehia, A.M. Development of normalized spectra manipulating spectrophotometric methods for simultaneous determination of dimenhydrinate and cinnarizine binary mixture. Spectrochim. Acta Part A 2015, 150, 142–150. [Google Scholar] [CrossRef]
  16. Al-Ghani, A.M.; Thabet, A.A.M. Validated spectrophotometric methods for the estimation of cinnarizine in binary mixture with paracetamol in bulk and tablets. Asian J. Pharm. Clin. Res. 2021, 14, 161–166. [Google Scholar] [CrossRef]
  17. Heda, A.A.; Sonawane, A.R.; Naranje, G.H.; Puranik, P.K. A rapid determination of cinnarizine in bulk and pharmaceutical dosage form by LC. E.-J. Chem. 2010, 7, 1080–1084. [Google Scholar] [CrossRef] [Green Version]
  18. El-Houssini, O.M.; Zawilla, N.H.; Mohammad, M.A. Development and validation of RP-LC method for the determination of cinnarizine/piracetam and cinnarizine/heptaminol acefyllinate in presence of cinnarizine reported degradation products. Anal. Chem. Insights 2013, 8, 99–106. [Google Scholar] [CrossRef] [Green Version]
  19. Naga Sirisha, M.; Shanta Kumari, A. Validated RP-HPLC method for simultaneous estimation of cinnarizine and domperidone in bulk and pharmaceutical dosage form. J. Pharm. Scient. Innov. 2013, 2, 46–50. [Google Scholar]
  20. El-Adl, S.M.; El-Sadek, M.E.; Hasan, M.H. Exploring novel isocractic HPLC method for quantitative determination of cinnarizine and piracetam in their capsule preparations. J. Appl. Pharm. 2016, 8, E1000225. [Google Scholar]
  21. Edrees, F.H.; Saad, A.S.; Alsaadi, M.T.; Amin, N.H.; Abdelwahab, N.S. Experimentally designed chromatographic method for the simultaneous analysis of dimenhydrinate, cinnarizine and their toxic impurities. RSC Adv. 2021, 11, 1450–1460. [Google Scholar] [CrossRef] [PubMed]
  22. Hundt, H.K.L.; Brown, L.W.; Clark, E.C. Determination of cinnarizine in plasma by high-performance liquid chromatography. J. Chromatogr. B 1980, 183, 378–382. [Google Scholar] [CrossRef]
  23. Hundt, H.K.L. Determination of cinnarizine in plasma by high performance liquid chromatography. J. Chromatogr. B 1982, 232, 465. [Google Scholar] [CrossRef] [PubMed]
  24. Nowacka-Krukowska, H.; Rakowska, M.; Neubart, K.; Kobylinska, M. High-performance liquid chromatographic assay for cinnarizine in human plasma. Acta Pol. Pharm. 2007, 63, 407–411. [Google Scholar]
  25. Mullangi, S.; Ravindhranath, K.; Yarala, M.R.; Panchakarla, R.K. A sensitive LC-MS/MS method for the determination of genotoxic impurities in cinnarizine. Anal. Pharm. Franc. 2023, 81, 74–82. [Google Scholar] [CrossRef] [PubMed]
  26. Lamie, N.T.; Monir, H.H. Simultaneous determination of cinnarizine and dimenhydrinate in binary mixture using chromatographic methods. J. Chromatogr. Sci. 2016, 54, 36–42. [Google Scholar] [CrossRef] [Green Version]
  27. Ahmed, A.B.; Abdelwahab, N.S.; Abdelrahman, M.M.; Salama, F.M. Simultaneous determination of dimenhydrinate, cinnarizine and cinnarizine impurity by TLC and HPLC chromatographic methods. Bull. Fac. Pharm. Cairo Univ. 2017, 55, 163–169. [Google Scholar] [CrossRef]
  28. Mahrouse, M.A.; El-Zaher, A.A.; Al-Ghani, A.M. Validated chromatographic methods for simultaneous estimation of cinnarizine in binary mixture with domperidone and paracetamol in tablets. Curr. Pharm. Anal. 2019, 15, 429–438. [Google Scholar] [CrossRef]
  29. Hassan, S.S.M.; Elmosallamy, M.A.F.; Abbas, A.B. LC and TLC determination of cinnarizine in pharmaceutical preparations and serum. J. Pharm. Biomed. Anal. 2002, 28, 711–719. [Google Scholar] [CrossRef]
  30. El-Houssini, O.M.; Mohammad, M.A. Versatile TLC-densitometric methods for the synchronous estimation of cinnarizine and acefylline heptaminol in the presence of potential impurity and their reported degradation products. J. Chromatogr. Sci. 2022, 60, 832–839. [Google Scholar] [CrossRef]
  31. Mhaske, D.K.; Kumbhar, A.S. Development and validation of rapid, timesaving, and cost-effective UHPLC method for simultaneous quantification of cinnarizine, its five specified impurities, two degradation products and two antioxidants. Anal. Chem. Lett. 2022, 12, 488–504. [Google Scholar] [CrossRef]
  32. Trivedi, J.U.; Ghalsasi, P.; Ganguly, S.; Mary, S.J.J.; James, C. Raman spectroscopic study of cinnamyl-1 diphenylmethyl-4 piperazine (cinnarizine) at high pressure. J. Mol. Str. 2022, 1253, E132214. [Google Scholar] [CrossRef]
  33. El-Sayed, G.O.; Yasin, S.A.; El Badawy, A.A. Voltammetric behavior and determination of cinnarizine in pharmaceutical formulations and serum. Anal. Lett. 2008, 41, 3021–3033. [Google Scholar] [CrossRef]
  34. Hedge, R.N.; Hosamani, R.R.; Nandibewoor, S.T. Voltammetric oxidation and determination of cinnarizine at glassy carbon electrode modified with multi-walled carbon nanotubes. Coll. Surf. B 2009, 72, 259–265. [Google Scholar]
  35. Walash, M.I.; Belal, F.; El-Enany, N.; Abdelal, A.A. Second-derivative synchronous fluorometric method for the simultaneous determination of cinnarizine and domperidone in pharmaceutical preparations. Application to biological fluids. J. Fluoresc. 2008, 18, 61–74. [Google Scholar] [CrossRef] [PubMed]
  36. Walash, M.I.; Belal, F.; El-Enany, N.; Abdelal, A. Second-derivative synchronous fluorescence spectroscopy for the simultaneous determination of cinnarizine and nicergoline in pharmaceutical preparations. J. AOAC Int. 2008, 91, 349–359. [Google Scholar] [CrossRef] [PubMed] [Green Version]
  37. Zhang, J.; Zhang, Y.; Liu, X.; Xu, X.; Li, Y.; Zhang, T. Supercritical fluid chromatography tandem mass spectrometry employed with evaporation-free liquid–liquid extraction for the rapid analysis of cinnarizine in rat plasma. J. Sep. Sci. 2021, 45, 968–975. [Google Scholar] [CrossRef]
  38. Woestenborghs, R.; Michielsen, L.; Lorreyne, W.; Heykants, J. Sensitive gas chromatographic method for the determination of cinnarizine and flunarizine in biological samples. J. Chromatogr. B 1982, 232, 85–91. [Google Scholar] [CrossRef]
  39. Abdelal, A.A.; Kitagawa, S.; Ohtani, H.; El-Enany, N.; Belal, F.; Walash, M.I. Method development and validation for the simultaneous determination of cinnarizine and co-formulated drugs in pharmaceutical preparations by capillary electrophoresis. J. Pharm. Biomed. Anal. 2008, 46, 491–497. [Google Scholar] [CrossRef]
  40. Tawakkol, S.M.; El-Zeiny, M.B.; Hemdan, A. Full spectrum and selected spectrum based chemometric methods for the simultaneous determination of cinnarizine and dimenhydrinate in laboratory prepared mixtures and pharmaceutical dosage form. Spectrochim. Acta A 2017, 173, 892–896. [Google Scholar] [CrossRef]
  41. Abdelrahman, M.M.; Abdelwahab, N.S.; Hegazy, M.A.; Fares, M.Y.; El-Sayed, G.M. Determination of the abused intravenously administered madness drops (tropicamide) by liquid chromatography in rat plasma; an application to pharmacokinetic study and greenness profile assessment. Microchem. J. 2020, 159, E105582. [Google Scholar] [CrossRef]
  42. Duan, X.; Liu, X.; Dong, Y.; Yang, J.; Zhang, J.; He, S.; Yang, F.; Wang, Z.; Dong, Y. A green HPLC method for determination of nine sulfonamides in milk and beef, and its greenness assessment with analytical eco-scale and greenness profile. J. AOAC Int. 2020, 103, 1181–1189. [Google Scholar] [CrossRef] [PubMed]
  43. Pena-Pereira, F.; Wojnowski, W.; Tobiszewski, M. AGREE-Analytical GREEnness metric approach and software. Anal. Chem. 2020, 92, 10076–10082. [Google Scholar] [CrossRef]
  44. Alam, P.; Salem-Bekhit, M.M.; Al-Joufi, F.A.; Alqarni, M.H.; Shakeel, F. Quantitative analysis of cabozantinib in pharmaceutical dosage forms using green RP-HPTLC and green NP-HPTLC methods: A comparative evaluation. Sus. Chem. Pharm. 2021, 21, E100413. [Google Scholar] [CrossRef]
  45. Foudah, A.I.; Shakeel, F.; Alqarni, M.H.; Alam, P. A rapid and sensitive stability-indicating green RP-HPTLC method for the quantitation of flibanserin compared to green NP-HPTLC method: Validation studies and greenness assessment. Microchem. J. 2021, 164, E105960. [Google Scholar] [CrossRef]
  46. International Conference on Harmonization (ICH). Q2 (R1): Validation of Analytical Procedures–Text and Methodology. Geneva, Switzerland, 2005. Available online: https://database.ich.org/sites/default/files/Q2%28R1%29%20Guideline.pdf (accessed on 1 February 2023).
  47. Alam, P.; Shakeel, F.; Ali, A.; Alqarni, M.H.; Foudah, A.I.; Aljarba, T.M.; Alkholifi, F.K.; Alshehri, S.; Ghoneim, M.M.; Ali, A. Simultaneous determination of caffeine and paracetamol in commercial formulations using greener normal-phase and reversed-phase HPTLC methods: A contrast of validation parameters. Molecules 2022, 27, 405. [Google Scholar] [CrossRef] [PubMed]
  48. Haq, N.; Iqbal, M.; Alanazi, F.K.; Alsarra, I.A.; Shakeel, F. Applying green analytical chemistry for rapid analysis of drugs: Adding health to pharmaceutical industry. Arabian J. Chem. 2017, 10, S777–S785. [Google Scholar] [CrossRef] [Green Version]
Figure 1. Molecular structure of cinnarizine (CIN).
Separations 10 00138 g001
Figure 2. A typical, thin-layer chromatography (TLC) chromoplate of the standard CIN, formulations, and forced degradation samples derived from an eco-friendly EtOH-H2O (90:10 v/v) mobile phase for the current approach.
Separations 10 00138 g002
Figure 3. A typical chromatogram of standard CIN for the current approach.
Separations 10 00138 g003
Figure 4. Overlaid UV absorption spectum of pure CIN and commercial formulations.
Separations 10 00138 g004
Figure 5. Typical chromatograms of CIN recorded under (A) acidic stress test, (B) basic stress test, (C) oxidative degradation test, and (D) thermal stress test of CIN.
Separations 10 00138 g005
Figure 6. A typical pictogram for AGREE score for the present approach obtained utilizing AGREE calculator.
Separations 10 00138 g006
Table 1. The optimization of the eco-friendly mobile phases and measured chromatography parameters of cinnarizine (CIN) measurement for the present approach (mean ± SD; n = 3).
Eco-Friendly Mobile PhaseAsN m−1Rf
EtOH-H2O (30:70 v/v)1.31 ± 0.051548 ± 1.780.33 ± 0.02
EtOH-H2O (40:60 v/v)1.30 ± 0.041741 ± 1.850.32 ± 0.03
EtOH-H2O (50:50 v/v)1.29 ± 0.031904 ± 1.920.31 ± 0.03
EtOH-H2O (60:40, v/v)1.28 ± 0.042274 ± 1.980.30 ± 0.02
EtOH-H2O (70:30 v/v)1.27 ± 0.032841 ± 2.450.29 ± 0.02
EtOH-H2O (80:20 v/v)1.26 ± 0.023452 ± 2.840.28 ± 0.01
EtOH-H2O (90:10 v/v)1.10 ± 0.034523 ± 3.780.27 ± 0.01
EtOH: ethyl alcohol; H2O: water; Rf: retardation factor; As: asymmetry factor; N m−1: theoretical plates number per meter.
Table 2. Findings for the linearity of CIN for the present approach (mean ± SD; n = 6).
ParametersValue
Linearity range (ng band−1)50–800
Regression equationy = 12.224x + 507.44
R20.9976
R0.9987
SE of slope0.27
SE of intercept1.73
95% CI of slope11.04–13.40
95% CI of intercept499.99–514.88
LOD ± SD (ng band−1)16.81 ± 0.09
LOQ ± SD (ng band−1)50.43 ± 0.27
R2: determination coefficient; R: regression coefficient; y: peak area; x: concentration (ng band−1); SE: standard error; CI: confidence interval; LOD: limit of detection; LOQ: limit of quantification.
Table 3. Accuracy results for determining CIN using the present approach (mean ± SD; n = 6).
Concentration (ng band−1)Concentration Found (ng band−1) ± SDRecovery (%)CV (%)
Intra-day accuracy
300302.12 ± 2.64100.700.87
400405.16 ± 3.36101.290.82
500496.21 ± 4.0299.240.81
Inter-day accuracy
300298.41 ± 2.6699.470.89
400396.31 ± 3.3499.070.84
500506.31 ± 4.17101.260.82
Table 4. Measurement of CIN precision for the present approach (mean ± SD; n = 6).
Concentration (ng band−1)Intra-Day PrecisionInter-Day Precision
Concentration (ng band−1) ± SDSECV (%)Concentration (ng band−1) ± SDSECV (%)
300303.16 ± 2.771.130.91305.21 ± 2.901.180.95
400397.41 ± 3.411.390.85407.24 ± 3.561.450.87
500504.61 ± 4.061.650.80494.63 ± 4.211.710.85
Table 5. Findings of CIN robustness for the present approach (mean ± SD; n = 6).
Concentration (ng band−1)Eco-Friendly Mobile Phase (EtOH-H2O)Results
OriginalUsedLevelConcentration (ng band−1) ± SDCV (%)Rf
92:8+2.0393.32 ± 3.650.920.26
40090:1090:100.0398.21 ± 3.910.980.27
88:12−2.0407.81 ± 4.171.020.28
Table 6. Results of forced degradation investigations of CIN under distinct stress conditions for the present approach (mean ± SD; n = 3).
Stress Condition Number of Degradation Products (Rf)CIN RfCIN Remained (ng band−1)CIN Recovered (%)
1 M HCl4 (0.11, 0.38, 0.56, 0.65)0.27265.6066.40 ± 1.18
1 M NaOH0 0.26400.00100.00 ± 0.00
30% H2O23 (0.12, 0.38, 0.56)0.27130.7232.68 ± 0.58
Thermal00.27400.00100 ± 0.00
Disclaimer/Publisher’s Note: The statements, opinions and data contained in all publications are solely those of the individual author(s) and contributor(s) and not of MDPI and/or the editor(s). MDPI and/or the editor(s) disclaim responsibility for any injury to people or property resulting from any ideas, methods, instructions or products referred to in the content.

