Article

Combined Effects of Polyamide Microplastics and Hydrochemical Factors on the Transport of Bisphenol A in Groundwater

1
Guangdong Provincial Research Center for Environment Pollution Control and Remediation Materials, College of Life Science and Technology, Jinan University, Guangzhou 510632, China
2
Guangdong Provincial Academy of Environmental Science, Guangzhou 510045, China
3
Key Laboratory of Surficial Geochemistry, Department of Hydrosciences, School of Earth Sciences and Engineering, Ministry of Education, Nanjing University, Nanjing 210023, China
4
Guangdong Yixin Ecological Technology Co., Ltd., Guangzhou 510055, China
5
Guangdong Key Laboratory of Environmental Pollution and Health, School of Environment, Jinan University, Guangzhou 510632, China
6
School of Water Conservancy and Environment, University of Jinan, Jinan 250022, China
*
Authors to whom correspondence should be addressed.
These authors contributed equally to this work.
Separations 2023, 10(2), 123; https://doi.org/10.3390/separations10020123
Submission received: 24 November 2022 / Revised: 26 January 2023 / Accepted: 27 January 2023 / Published: 9 February 2023

Abstract

:
Polyamide (PA) and bisphenol A (BPA) are selected as typical microplastic and endocrine-disrupting chemicals in this study. The adsorption of BPA on the surface of PA and the effect of PA on the transport behavior of BPA in groundwater are systematically investigated using a combination of batch experiments, column experiments and numerical models. The results of scanning electron microscope (SEM) and Fourier transform infrared spectra (FTIR) show that the surface of PA particles is changed significantly after adsorption of BPA. The isothermal adsorption process of BPA can be simulated by the Langmuir model and the Freundlich model. Kinetic adsorption, on the other hand, can be fitted by a quasi-first-order adsorption model, and the adsorption results indicate that the maximum adsorption of BPA on PA reaches 13 mg·g−1. The results of the column experiments suggest that the mass recovery rate of BPA decreases with PA content, and increases with flow velocity, while initial concentration has no apparent influence on BPA transport. In addition, due to the hydrolysis of BPA, the mass recovery rate of BPA does not change with pH under conditions of pH < 10.2 and increases substantially to 94% when pH > 10.2. Moreover, Ca2+ has a significant inhibitory effect on the transport of BPA, while Na+ has no apparent influence on the transport of BPA. The transport process of BPA in porous media is simulated using a single-point kinetic model, and the fitted mathematical relationships for the variation of kinetic parameters with environmental factors are obtained by regression analysis.

1. Introduction

More than 240 million tons of plastic are consumed globally each year. As plastic consumption continues to increase, the environmental problems caused by microplastic pollution attract more and more attention from all over the world [1]. Microplastics are plastic particles less than 5 mm in size formed after natural physicochemical and biological weathering and crushing [2,3]. The main sources of microplastic pollutants are fine plastic particles in personal care products, and the degradation of large plastics and discharge of domestic sewage, where fine plastic particles in personal care products are called primary microplastics and those formed by degradation are called secondary microplastics [4]. A large proportion of these fine microplastic particles enter the environment, such as oceans, rivers, soil and groundwater, and the ingestion of microplastics by marine organisms, such as fish, shellfish and seabirds, has been reported in relevant studies [5,6,7,8]. Most of the current research on microplastic pollution focuses on the marine area, but the detection of microplastics in soil groundwater has become more frequent in recent years [9]. Microplastics include polyolefines, fluoroplastics, vinyl plastics, styrene plastics, acrylonitrile-butadinene-styrene, styrene-butadiene, styrene-acrylonitrile, polymers based on acrylate, polyacrylonitrile, polyesters, polyamide (PA), etc. [6]. Among them, PA is one of the major microplastics detected in large quantities in soil-groundwater systems [10]. The abundance of PA in the soil can reach 14.7–158.5 units/kg, while it can also reach 15.2 units/L in groundwater environments. The detected PA microplastic particles are generally small in size (50–100 μm) [4]. After entering groundwater, microplastic particles can not only adsorb heavy metals and organic contaminants, but also act as a carrier of contaminants to enhance the mobility of contaminants, thus causing more serious groundwater pollution and even contamination of underground drinking water sources [10,11,12].
Bisphenols refer to compounds with two hydroxyphenyl structures, of which bisphenol A (diphenol propane, 2,2-bisphenol propane, BPA) is one of the most produced and used bisphenols in the world [13,14,15]. BPA is widely used in many fields, such as the manufacture of engineering plastics, dental composites, and sealants [14,16]. BPA has been proven to be an endocrine disruptor, which causes a large impact on groundwater resources and the environment [17]. BPA can interfere with the endocrine and reproductive systems of the organism and disrupt the hormonal balance in the organism. In addition, BPA can pass from the mother to the fetus via the placenta, causing serious effects on fetal growth [18]. The average detected concentration of BPA in groundwater in the United States is 0.0041~1.9 μg·L−1, and the detected concentration of BPA in groundwater in the UK is even as high as 20 μg·L−1, which retains estrogenic activity at concentrations below 1 × 10⁻³ μg·L−1 [19]. Currently, the global production of BPA is up to 7 million tons per year, resulting in a large amount of BPA entering the environment, causing serious contamination and endangering human health through food and drinking water [17]. The highest detected concentrations of BPA in landfill leachate, rivers, and drinking water reached 17.2 × 10³ μg·L−1, 12 μg·L−1, and 0.1 μg·L−1, respectively [20]. The migration pattern of BPA in porous media has been investigated limitedly, such as the study of the transport pattern of BPA and BPS in quartz sand and limestone porous media [20,21,22]. The results of these studies indicate that xylenes strongly inhibit the migration of BPA in quartz sand, and that the mobility of BPA in limestone porous media is less than that in quartz sand. However, the interaction between microplastics and BPA remains unclear, and the combined effect of microplastics and environmental factors on the transport of BPA in groundwater is still not systematically investigated.
There is a lack of research on the BPA transport behaviors influenced by microplastics and hydrochemical factors. It is critical to systematically understand the combined effects of microplastics and hydrochemical factors on BPA transport for assessing associated environmental risks in natural aquifers. Therefore, the combined effects of microplastics and hydrochemical factors on the transport of bisphenols in groundwater are explored. PA and BPA are selected as typical microplastics and bisphenol contaminants, and combined effects are investigated systematically by a combination of batch experiments, column experiments, and numerical models. The objectives of this research include: (1) investigate the magnitude of the adsorption capacity of PA on BPA; (2) determine the mobility of BPA in saturated porous media containing PA; (3) investigate the combined effects of PA and hydrochemical factors (pH, flow velocity, initial concentration, and ionic strength) on the transport of BPA; and (4) build transport models of BPA based on experimental results to simulate and predict the transport behavior of BPA in porous media.

2. Materials and Methods

2.1. Experimental Material

The microplastic polyamide-66 (PA66, CAS 32131-17-2) with a particle size of 0.1 mm and BPA (CAS 80-05-7, >99%) were purchased from China Jie Cheng Plastic Technology Co., Ltd. (Shenzhen, China) and Shanghai Aladdin Biochemical Technology Co., Ltd. (Shanghai, China), respectively. The molecular structures of PA66 and BPA are shown in Figure S1, with the molecular formulae (C12H22N2O2)n and C15H16O2, respectively. The BPA solution was prepared by accurately weighing 100 mg of BPA dissolved in methanol solution and diluted to 1 L with ultrapure water, keeping the mass fraction of methanol solution less than 0.1% during the dilution process to obtain 100 mg·L−1 BPA solution, which was finally stored at 4 °C under light-proof conditions. The forms of BPA under different pH conditions are shown in Figure S2.
The transport of BPA in porous media was investigated by column experiments, in which quartz sand (QS) with a particle size of 0.35–0.45 mm was used as a typical porous media packed in columns, and NaCl and CaCl2 solutions with different ionic strengths were used as background solutions. Before column experiments, QS was rinsed with tap water to remove large particles of impurities, followed by soaking in 10% nitric acid for 24 h to remove metal oxides, organic matter, and other impurities from the surface of the QS, and finally washed with ultrapure water to neutral and then dried at 105 °C.

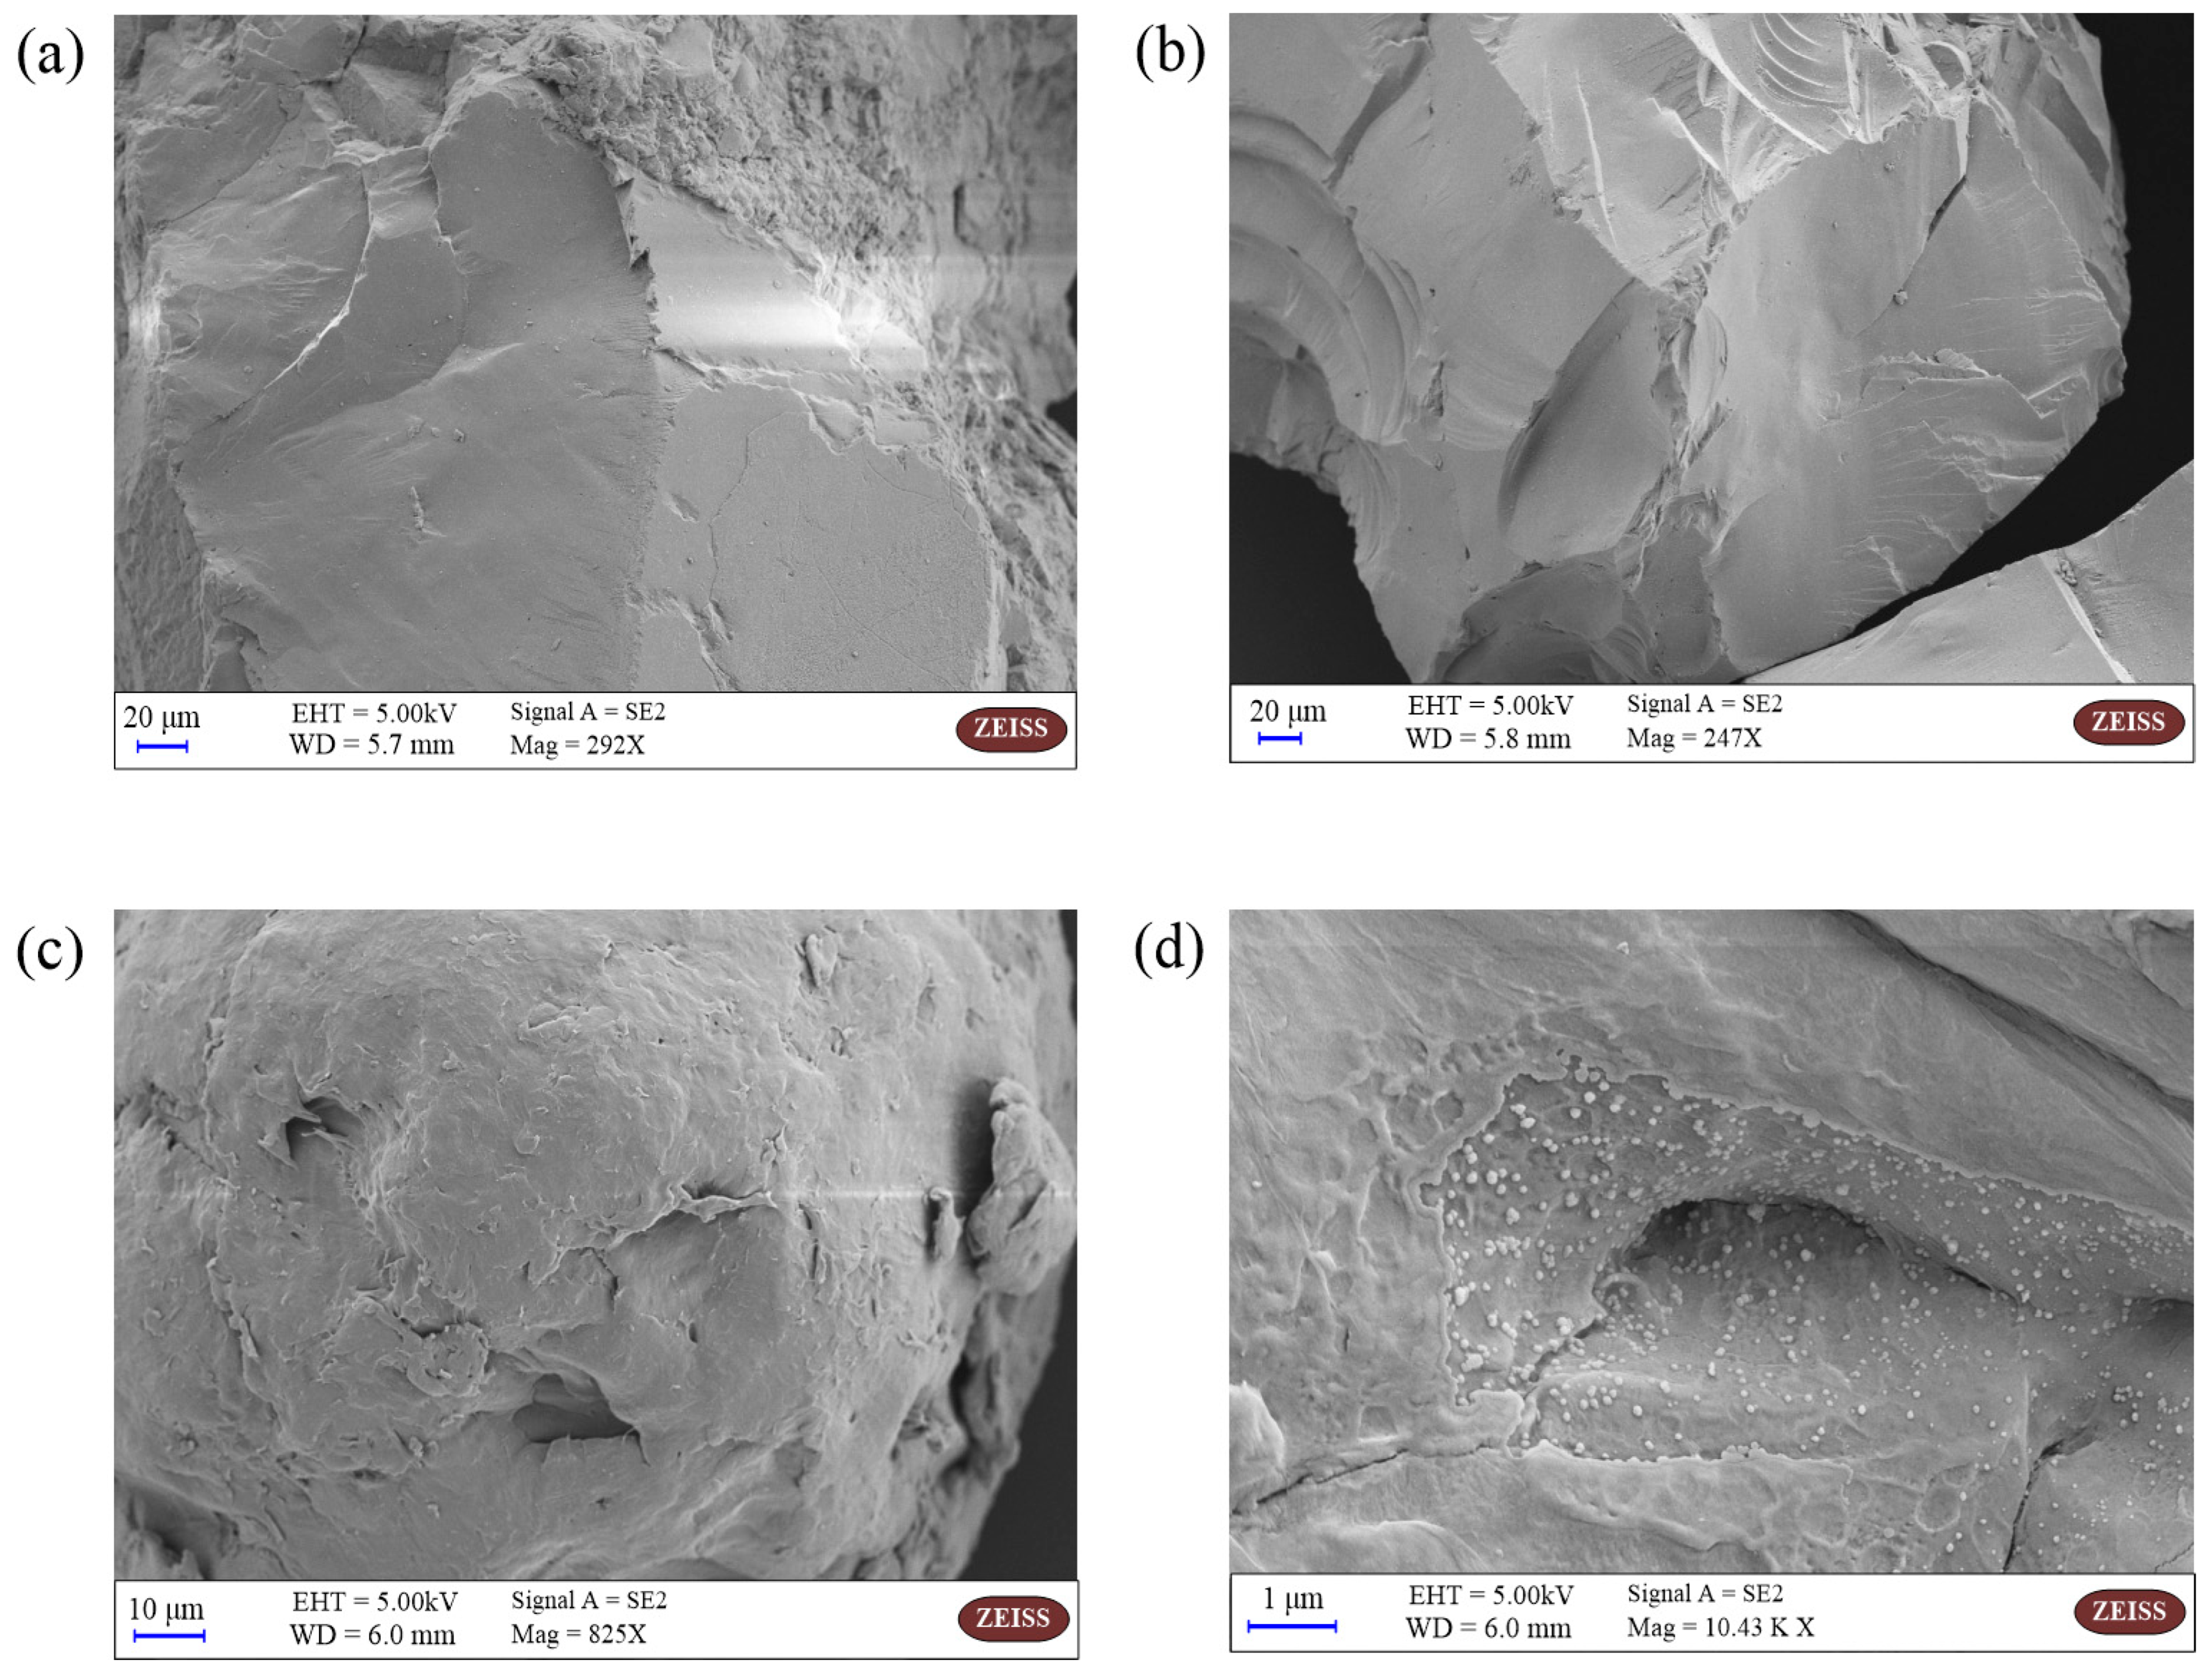
2.2. Material Characterization

The PA microplastic were dried and mixed with KBr in the ratio of 1:100, then ground into powder and finally put into the tablet press to produce and use Fourier transform infrared spectra (FTIR) to determine the structure. The QS and PA microplastics before and after BPA adsorption were glued to the sample stage with conductive adhesive tape and gold sprayed to improve the conductivity of the material, and then the surface morphology was observed using scanning electron microscope (SEM, Ultra-55, Zeiss, Jena, Germany).

2.3. Batch Experiments

2.3.1. Isothermal Adsorption Experiments

Isothermal adsorption experiments were performed using 50 mL colorimetric tubes as reaction vessels. An amount of 25 mL of different concentrations of BPA solution (0, 20, 40, 60, 80, 100 mg·L−1) was added into the colorimetric tubes, followed by 0.1 g of PA microplastic particles or QS, and finally the adsorption equilibrium was reached by shaking at 25 °C and 220 rpm for 24 h. Samples were taken using a disposable syringe with a 0.22 μm needle-type filter to measure BPA concentration.
The amount of BPA adsorbed by PA microplastic particles p0 is:
p 0 = C 0 C V m
where p0 is the amount of BPA adsorbed on PA (M·M−1); C0 is the initial concentration of BPA solution (M·L−3); C is the remaining BPA concentration at the end of adsorption (M·L−3); 𝑉 is the volume of BPA solution (L3); 𝑚 is the mass of sorbent PA or QS (M).
Isothermal adsorption experiments were analyzed using Langmuir and Freundlich isothermal adsorption models:
p = p m K L C 1 + K L C
p = K F C n
where Equation (2) is Langmuir isothermal model; Equation (3) is Freundlich isothermal adsorption model; p is the amount of BPA adsorbed by PA or QS (M·M−1); pm is the maximum amount of BPA adsorbed by PA or QS (M·M−1); KL is the adsorption constant of the Langmuir isothermal model; KF and n are the adsorption constants of the Freundlich isothermal model.

2.3.2. Kinetic Adsorption Experiments

Kinetic adsorption experiments were also conducted using 50 mL colorimetric tubes as reaction vessels. Firstly, 25 mL of 60 mg·L−1 BPA solution was added into the colorimetric tube, followed by 0.1 g of PA microplastic particles or QS, and finally shaken under conditions of 25 °C and 220 rpm for adsorption. Samples were taken at t = 1, 5, 10, 30, 60, 120, 300, 600, and 1440 min to measure BPA concentration. The kinetic adsorption process was simulated using quasi-first-order and quasi-second-order kinetic equations:
p = p m 1 1 e k 1 t
p = p m 2 2 k 2 t 1 + p m 2 k 2 t
where Equation (4) is the quasi-first-order kinetic equation; Equation (5) is the quasi-second-order kinetic equation; pm1 is the maximum amount of BPA adsorbed by PA or QS for quasi-first-order kinetic equation (M·M−1); pm2 is the maximum amount of BPA adsorbed by PA or QS for quasi-second-order kinetic equation (M·M−1); k1 and k2 are the adsorption constants of quasi-first-order and quasi-second-order kinetic adsorption equations, respectively.

2.4. BPA Transport Experiment

BPA transport experiments were performed in columns with an inner diameter of 2.5 cm and a length of 20 cm. Using the wet method to pack QS into the column, first we added a certain volume of ultrapure water to the column, then added a certain amount of QS (keeping QS always below the water level) and repeated the packing process until the column was fully packed by QS. During the packing process, QS was continuously stirred by a glass rod to remove air and compacted using a small hammer. The porosity of the QS packed in the column is 0.45. A 50 μm screen was placed at both ends of the column to make water flow uniformly in the column. Ultra-pure water was first injected into the column for about 10 h to remove impurities from QS packed in the column. At the beginning of the experiment, 10 pore volumes (PVs) of background solution, 1 PV of BPA solution, and 8 PV of background solution were injected into the column sequentially by a peristaltic pump, and the BPA concentration in the effluent samples was determined by automatic sampling and collection of the effluent solution using an automatic sample collector throughout the experiment. The experimental setup diagram is shown in Figure S3.

2.5. BPA Transport Model

The transport process of BPA in porous media containing PA was simulated using a single-site deposition kinetic model [23,24,25,26] based on advection–dispersion equation:
D 2 C B z 2 v C B z = C B t + ρ θ S B t
ρ θ S B t = k C B 1 S B S max
where CB is the concentration of BPA (M·L−3); t represents time (T); ρ denotes the bulk density of porous media (M·L−3); θ is porosity; SB is the concentration of BPA adsorbed on the surface of the adsorption site (M·M−1); D represents the hydrodynamic dispersion coefficient (L2·T−1); z is the direction parallel to the flow (L); ν represents the flow velocity of the water flow in column (L·T−1); k is the adsorption coefficient of BPA (T−1); Smax is the maximum concentration of BPA adsorbed on the surface of the adsorption site (M·M−1).
The above model is solved using Hydrus-1D to fit BPA column experiments to obtain the values of parameters k and Smax, where the value of D is obtained by fitting the breakthrough curves (BTCs) of tracer experiments.

3. Results and Discussion

3.1. Characterization of Materials

The surface functional groups of PA before and after the adsorption of BPA were analyzed and compared by FTIR (Figure S4). It can be seen that the absorption peaks of the stretching and bending vibrations of N-H are at 3435 cm−1, 1541.5 cm−1, and 683.5 cm−1, respectively. Simultaneously, the absorption peaks of the coupling and stretching vibrations of C-N are at 3089 cm−1 and 1202 cm−1, respectively. At these characteristic peaks, it can be seen that the absorption peaks of PA after the adsorption experiments are slightly shifted toward the low wave number and the intensity of the absorption peaks is reduced, which is due to the formation of hydrogen bonds by combining the amide bonds on the PA surface with the hydroxyl groups on BPA. The formation of hydrogen bonds makes the bonding electron cloud density decrease, the chemical bonding force constantly decreases, the stretching vibration absorption shifts to the low wave number, and the intensity of the absorption peak decreases.
The SEM images of QS and PA microplastic before and after the adsorption experiments are shown in Figure 1. The surface of QS is smooth and flat (Figure 1a), which does not have the conditions for BPA adsorption, and no BPA is found to be adsorbed on its surface after the adsorption experiments. In contrast, there are more folds and bumps on the surface of the PA microplastic, which provide better conditions for the adsorption of BPA. As seen in Figure 1d, more BPA is adsorbed on the surface of the PA microplastic, indicating that PA has a good adsorption effect on BPA.

3.2. Adsorption

The results of the isothermal adsorption of BPA by PA and QS are shown in Figure S5a. As shown in Figure S5a, the isothermal adsorption of BPA on PA microplastics and QS can be well simulated by the Langmuir and Freundlich models with correlation coefficients R2 above 0.99 (Table S1). It can be seen from Figure S5a that the adsorption of BPA by PA is strong and the adsorption amount continues to increase with BPA concentration. The adsorption amount is at a low level when BPA concentration is low. This is because the PA adsorption sites are not sufficiently occupied and are underutilized. Under the condition of high BPA concentration, the adsorption sites are gradually utilized and the adsorption amount increases. No significant extreme values appear in Figure S5a, indicating that the adsorption capacity of PA on BPA has not yet reached a maximum value. However, the adsorption of BPA by QS is almost zero, indicating that QS does not have a significant adsorption effect on BPA. The stronger adsorption of PA on BPA is mainly due to the presence of amide bonds (-C(O)NH-) on the PA surface that can act as acceptors for hydrogen bonding, while BPA contains hydroxyl groups (-OH) that can act as donors for hydrogen bonding. Simultaneously, hydrogen bonding (2–40 kJ·mol−1) is much greater than hydrophobic interaction (5 kJ·mol−1), so PA has a strong adsorption capacity to BPA [27].
The kinetic adsorption results of BPA on PA are shown in Figure S5b. It can be seen that BPA is rapidly adsorbed on PA, and the adsorption equilibrium approaches at t = 720 min with a maximum adsorption amount of 13 mg·g−1. At the reaction time t = 300 min, the adsorption of BPA on PA has exceeded 90% of the total adsorbed amount. The quasi-first-order and quasi-second-order kinetic equations are used to simulate the adsorption process, and the fitted results with fitted parameters are shown in Figure S5b and Table S2. The correlation coefficient R2 obtained by the quasi-first-order kinetic model (0.82) is much larger than that of the quasi-second-order kinetic model (0.29), which suggests that the adsorption of BPA on PA is more suitable to be described by the quasi-first-order kinetic model.

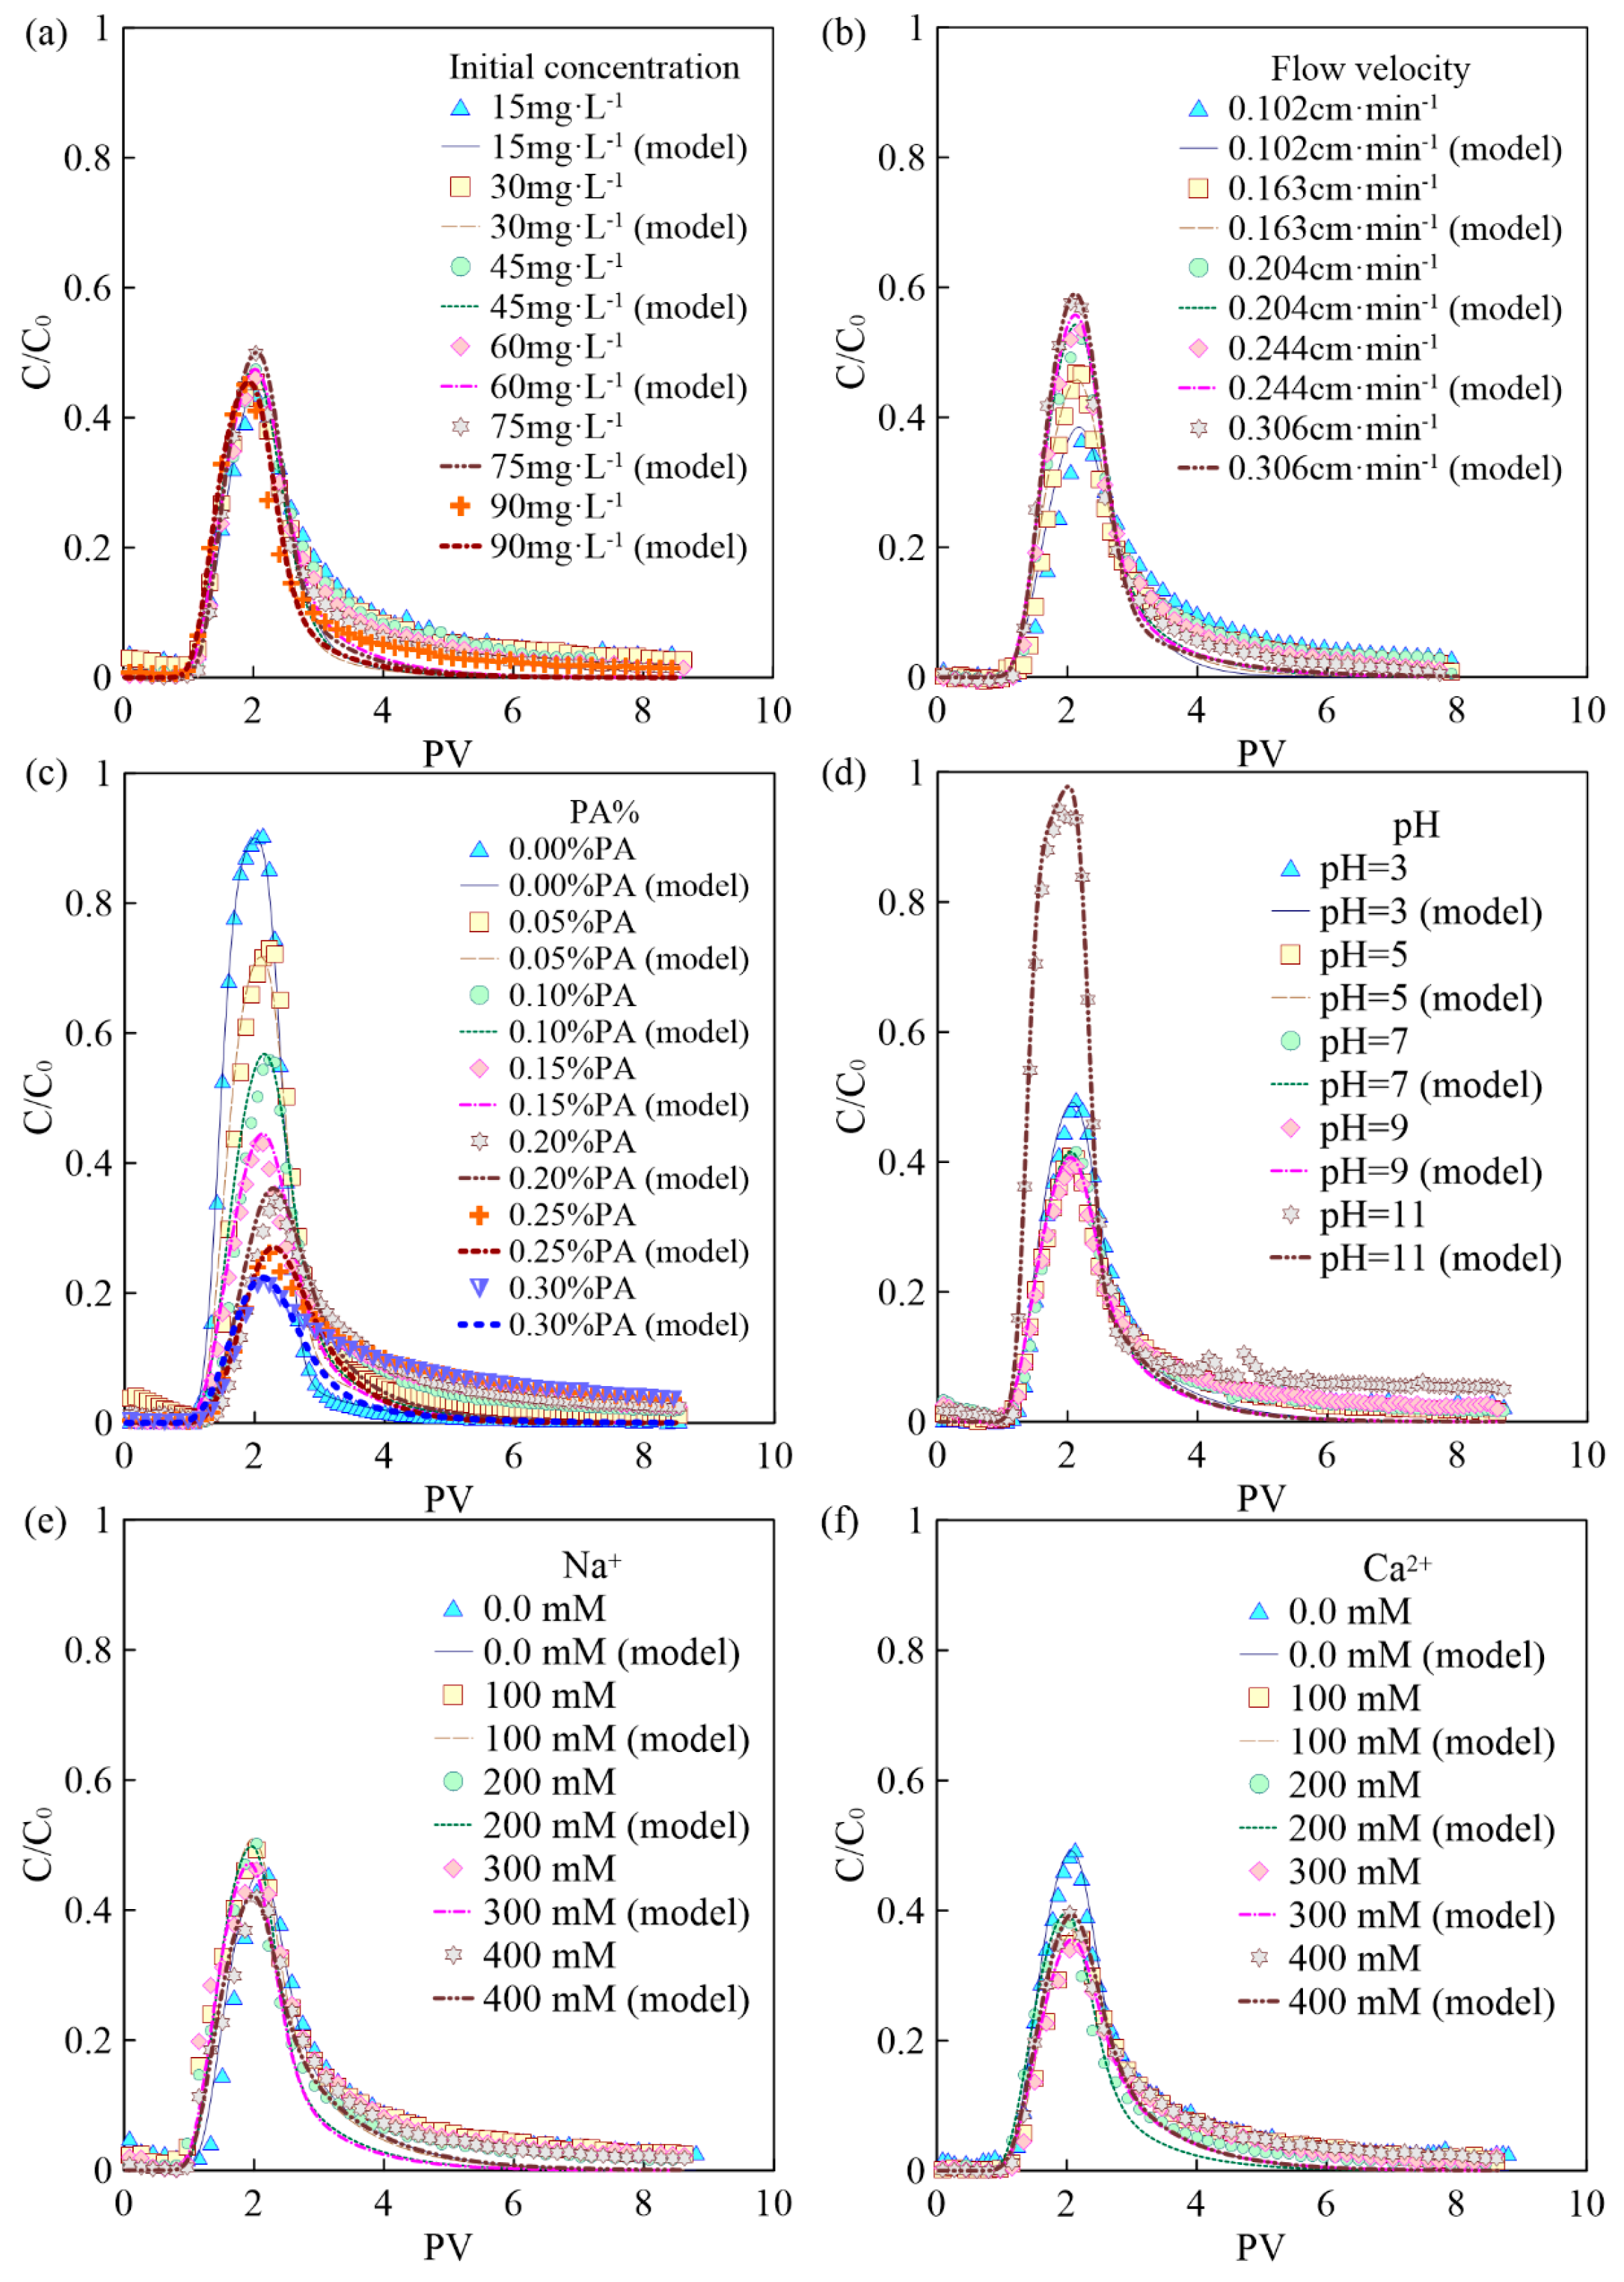
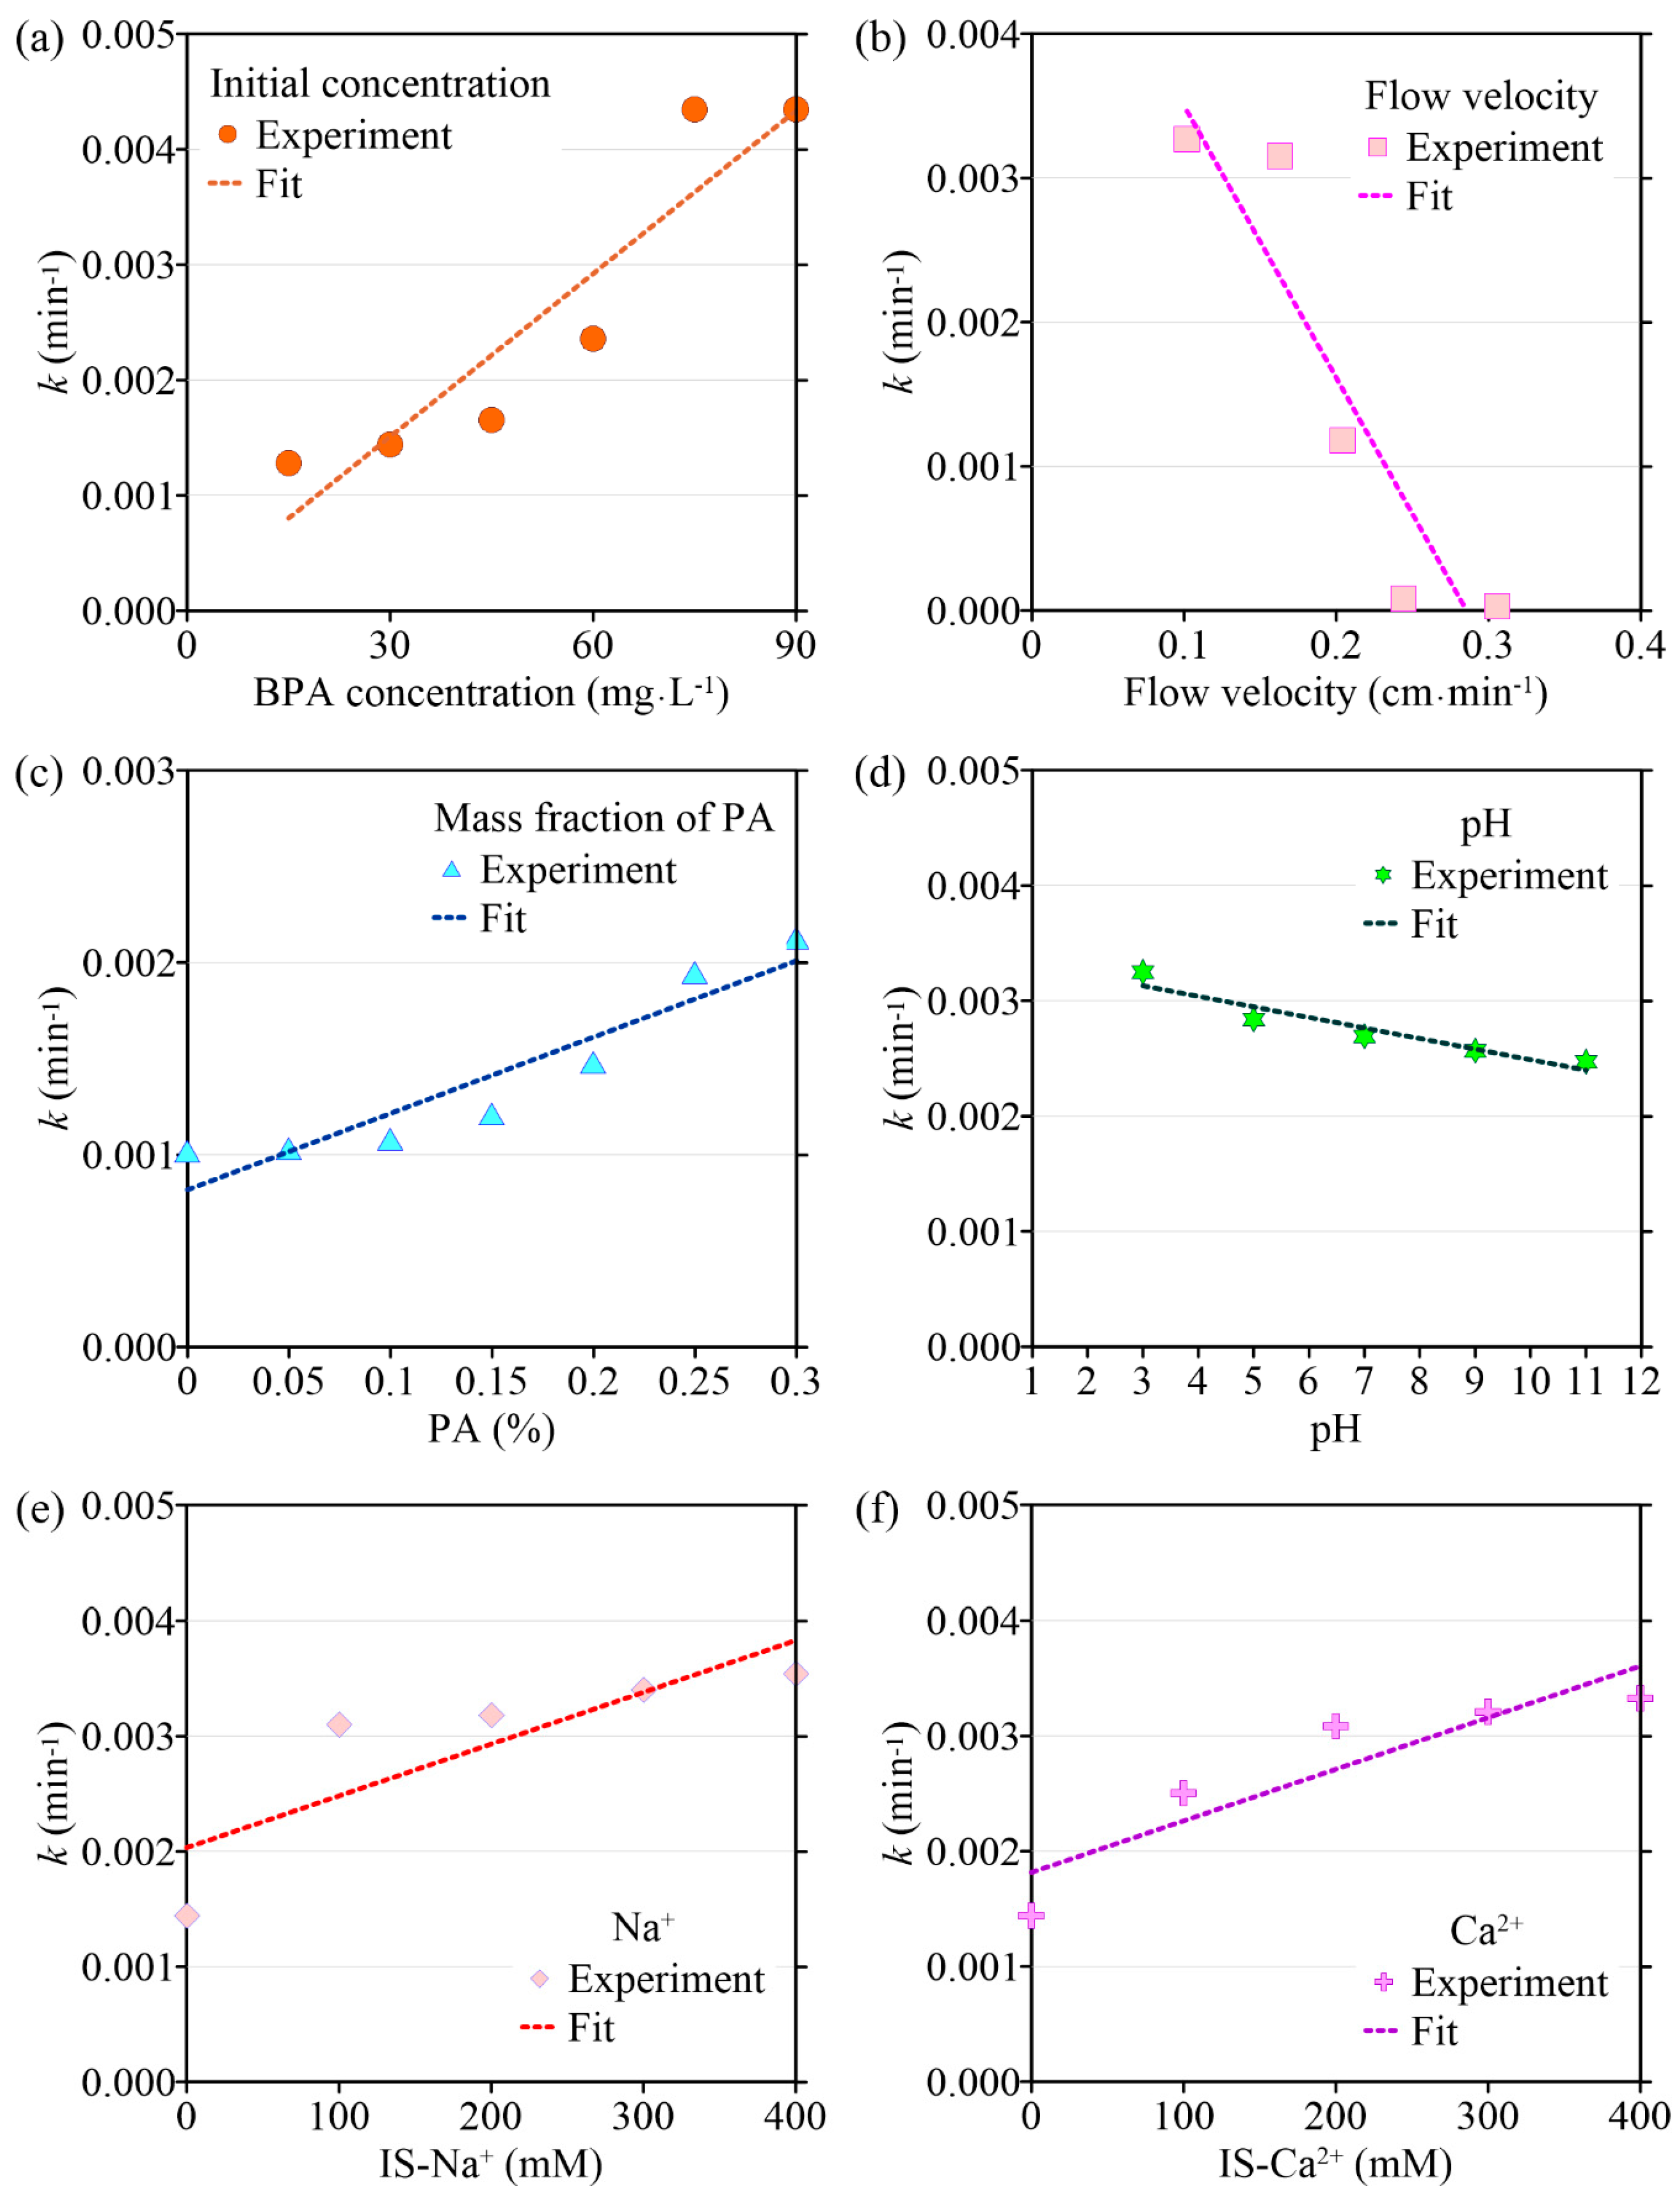
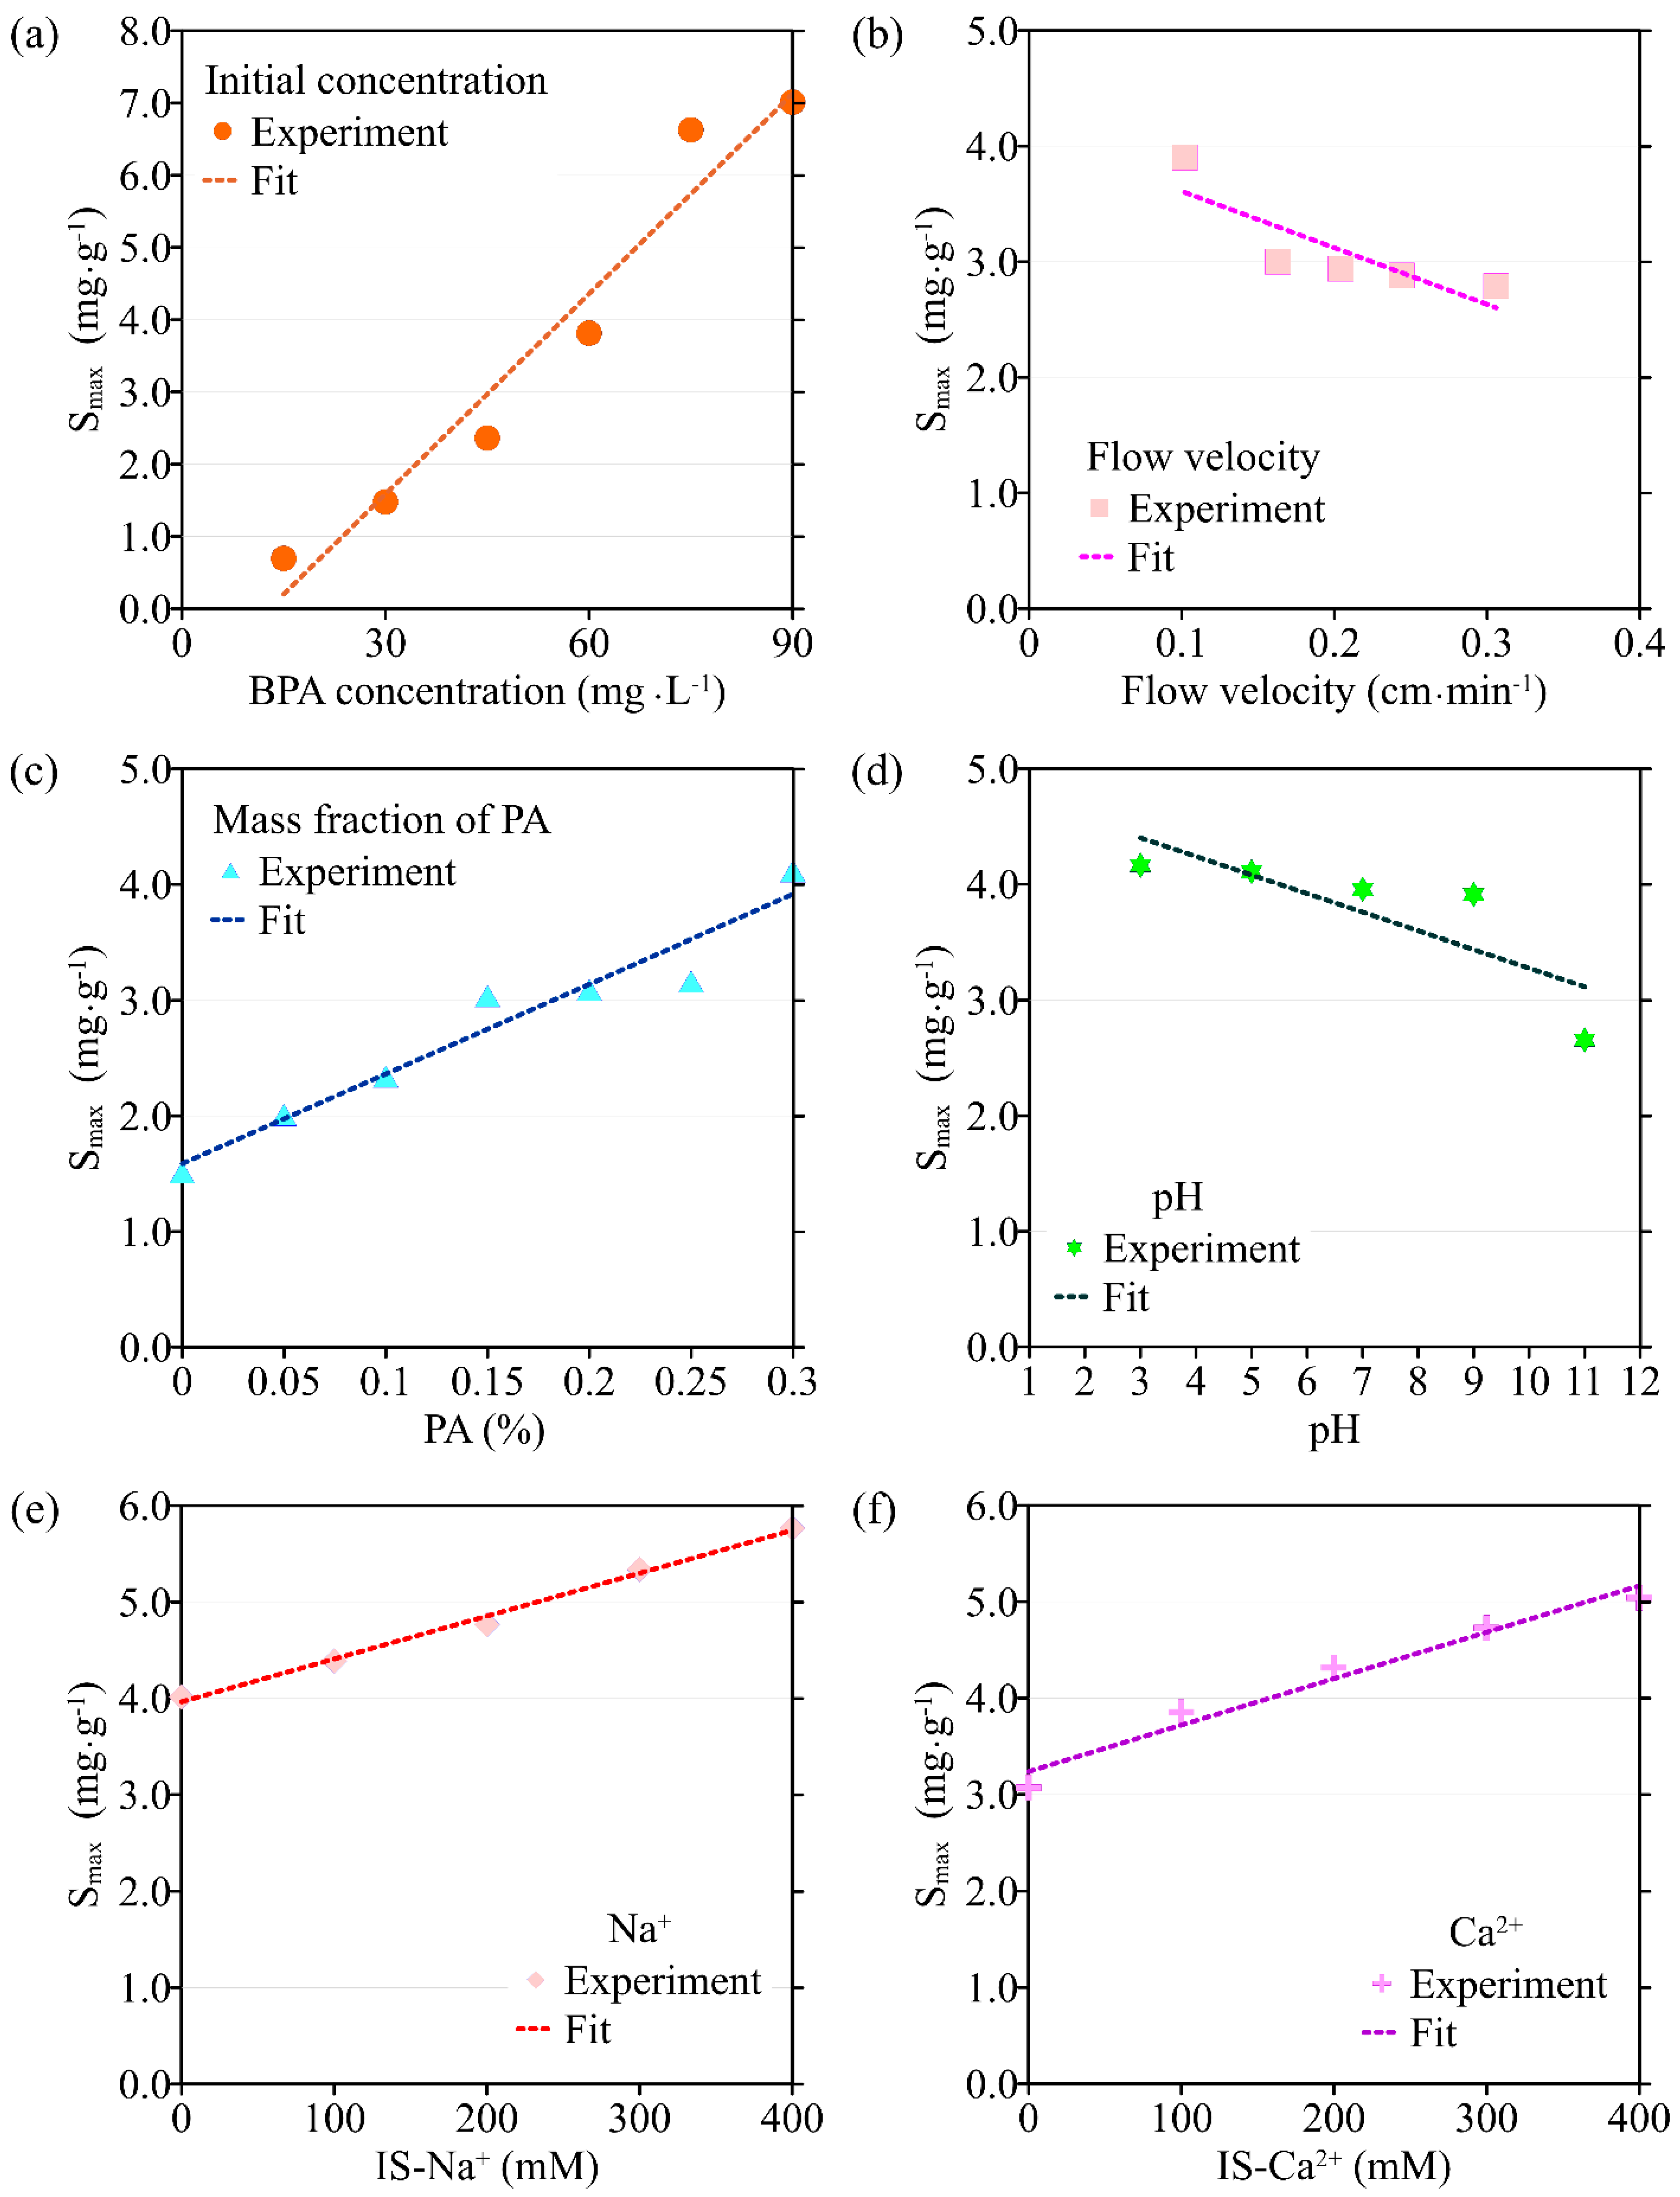
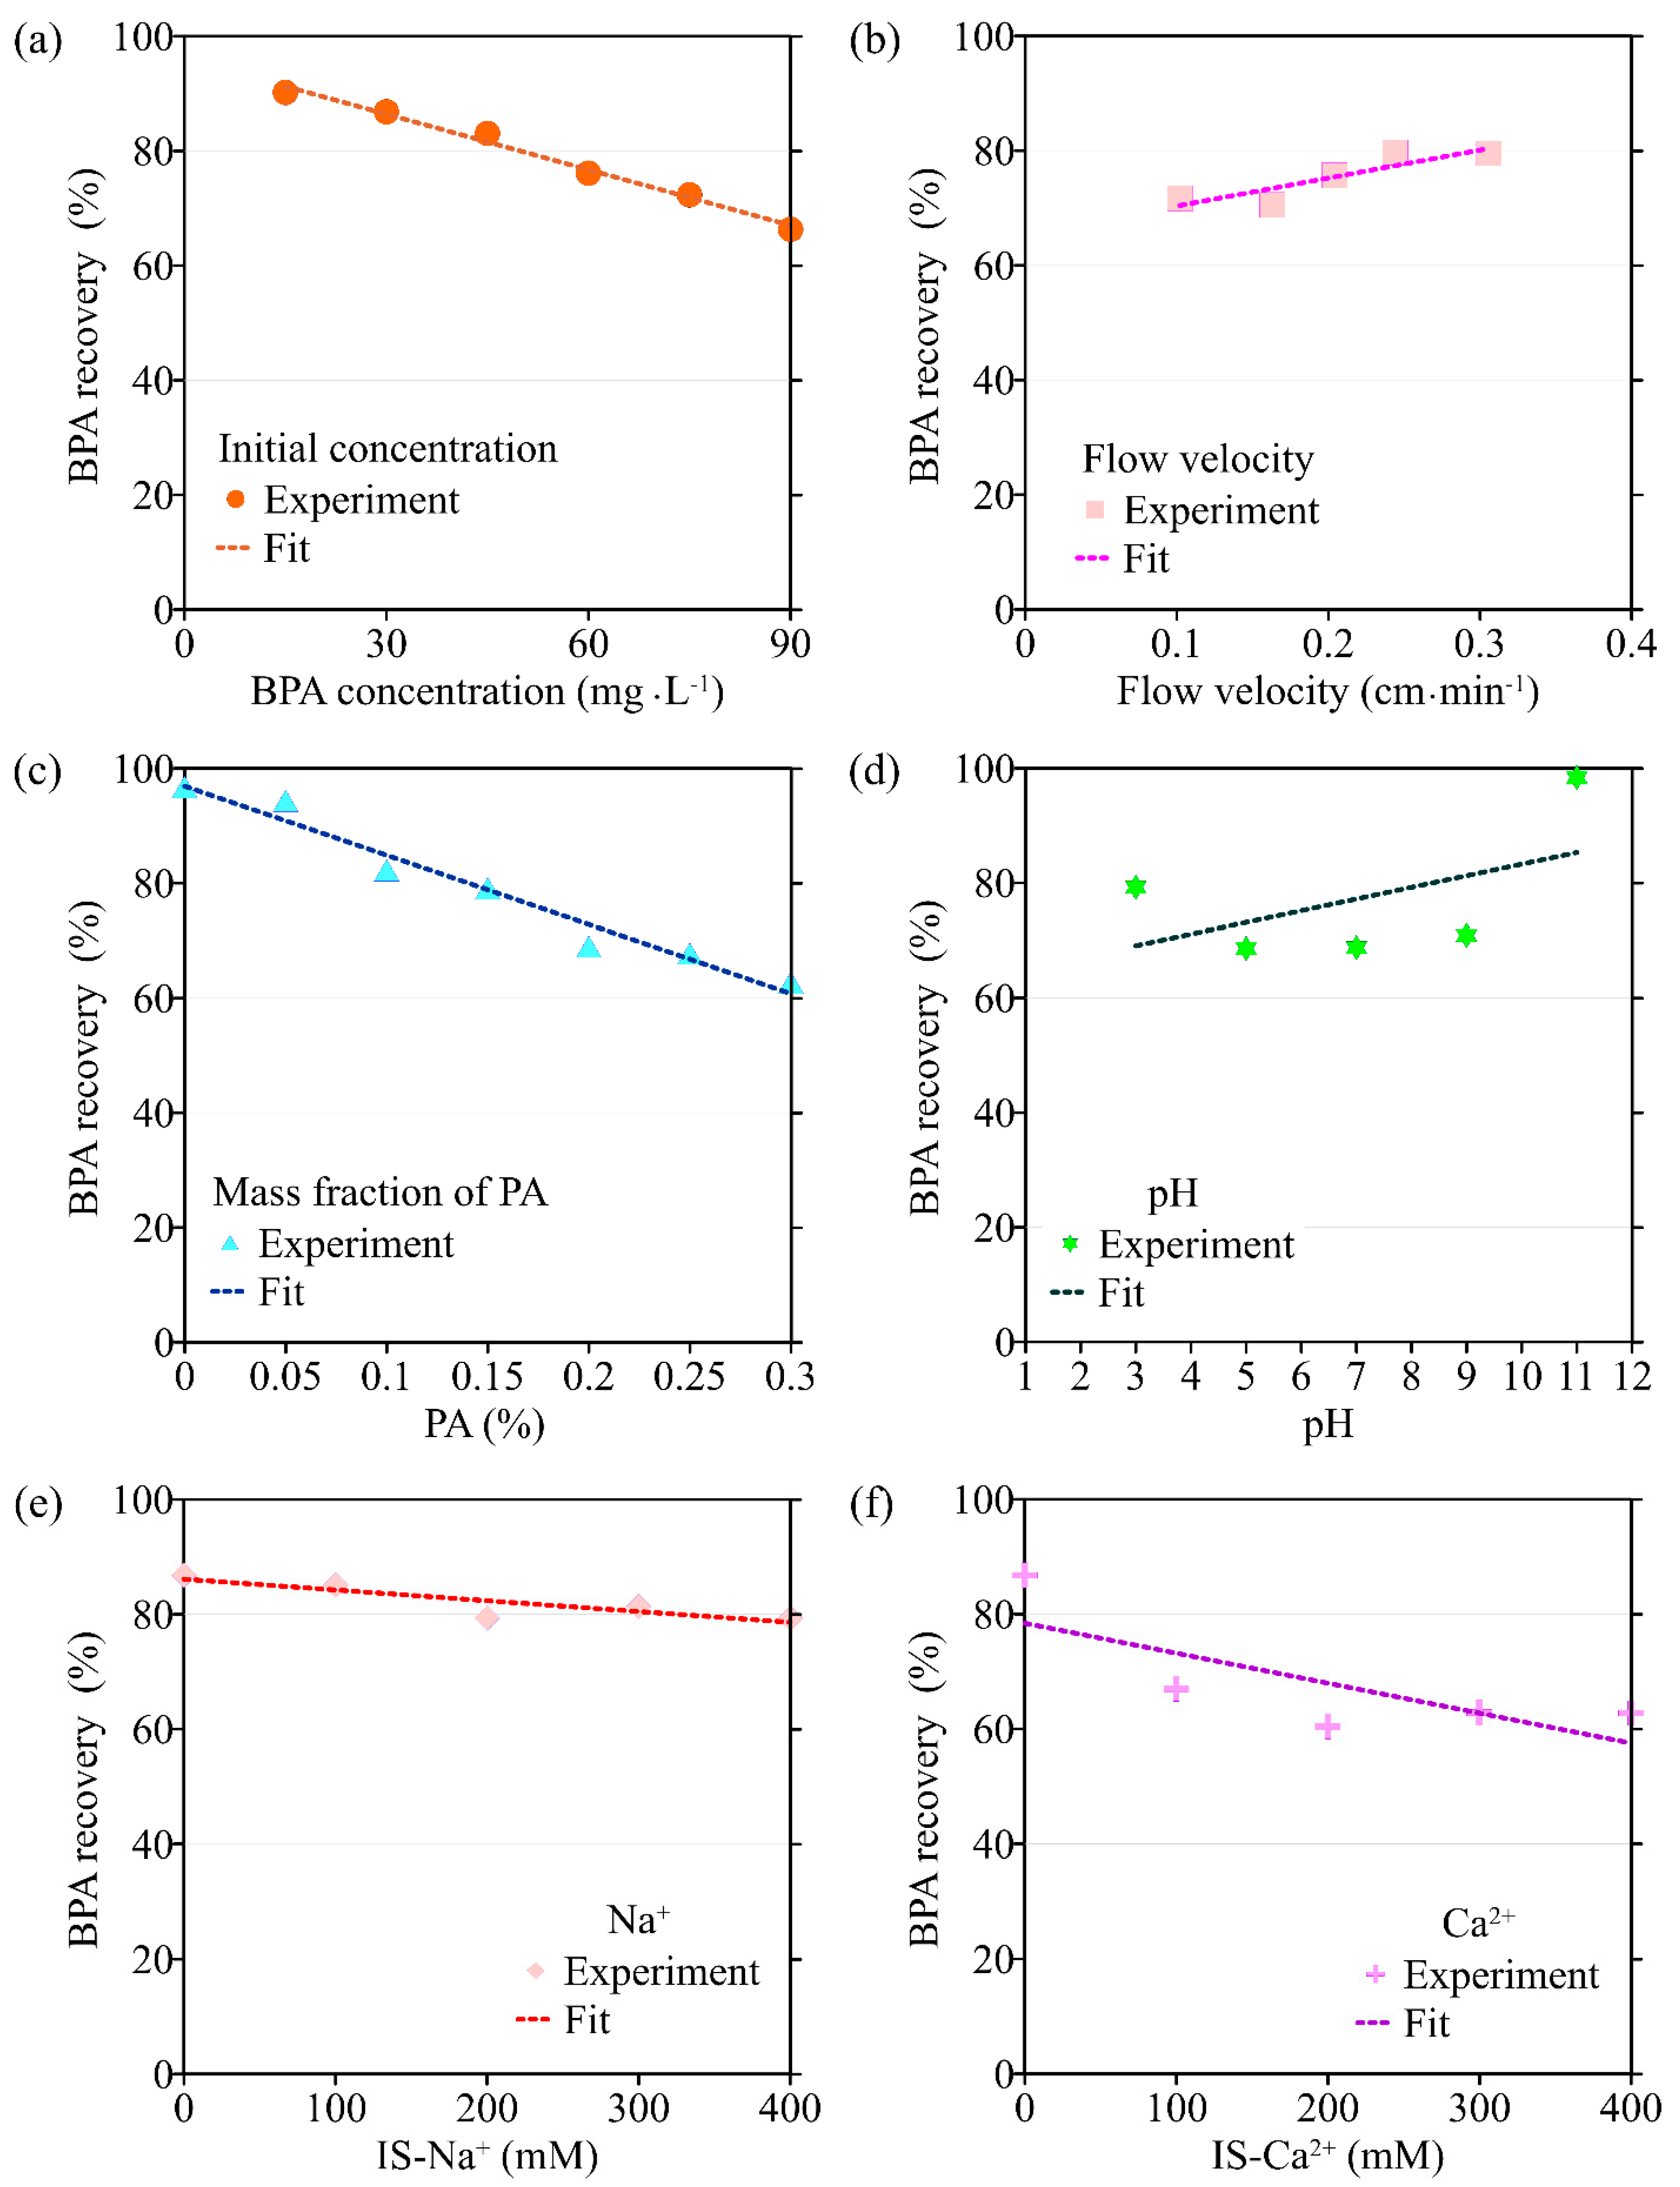
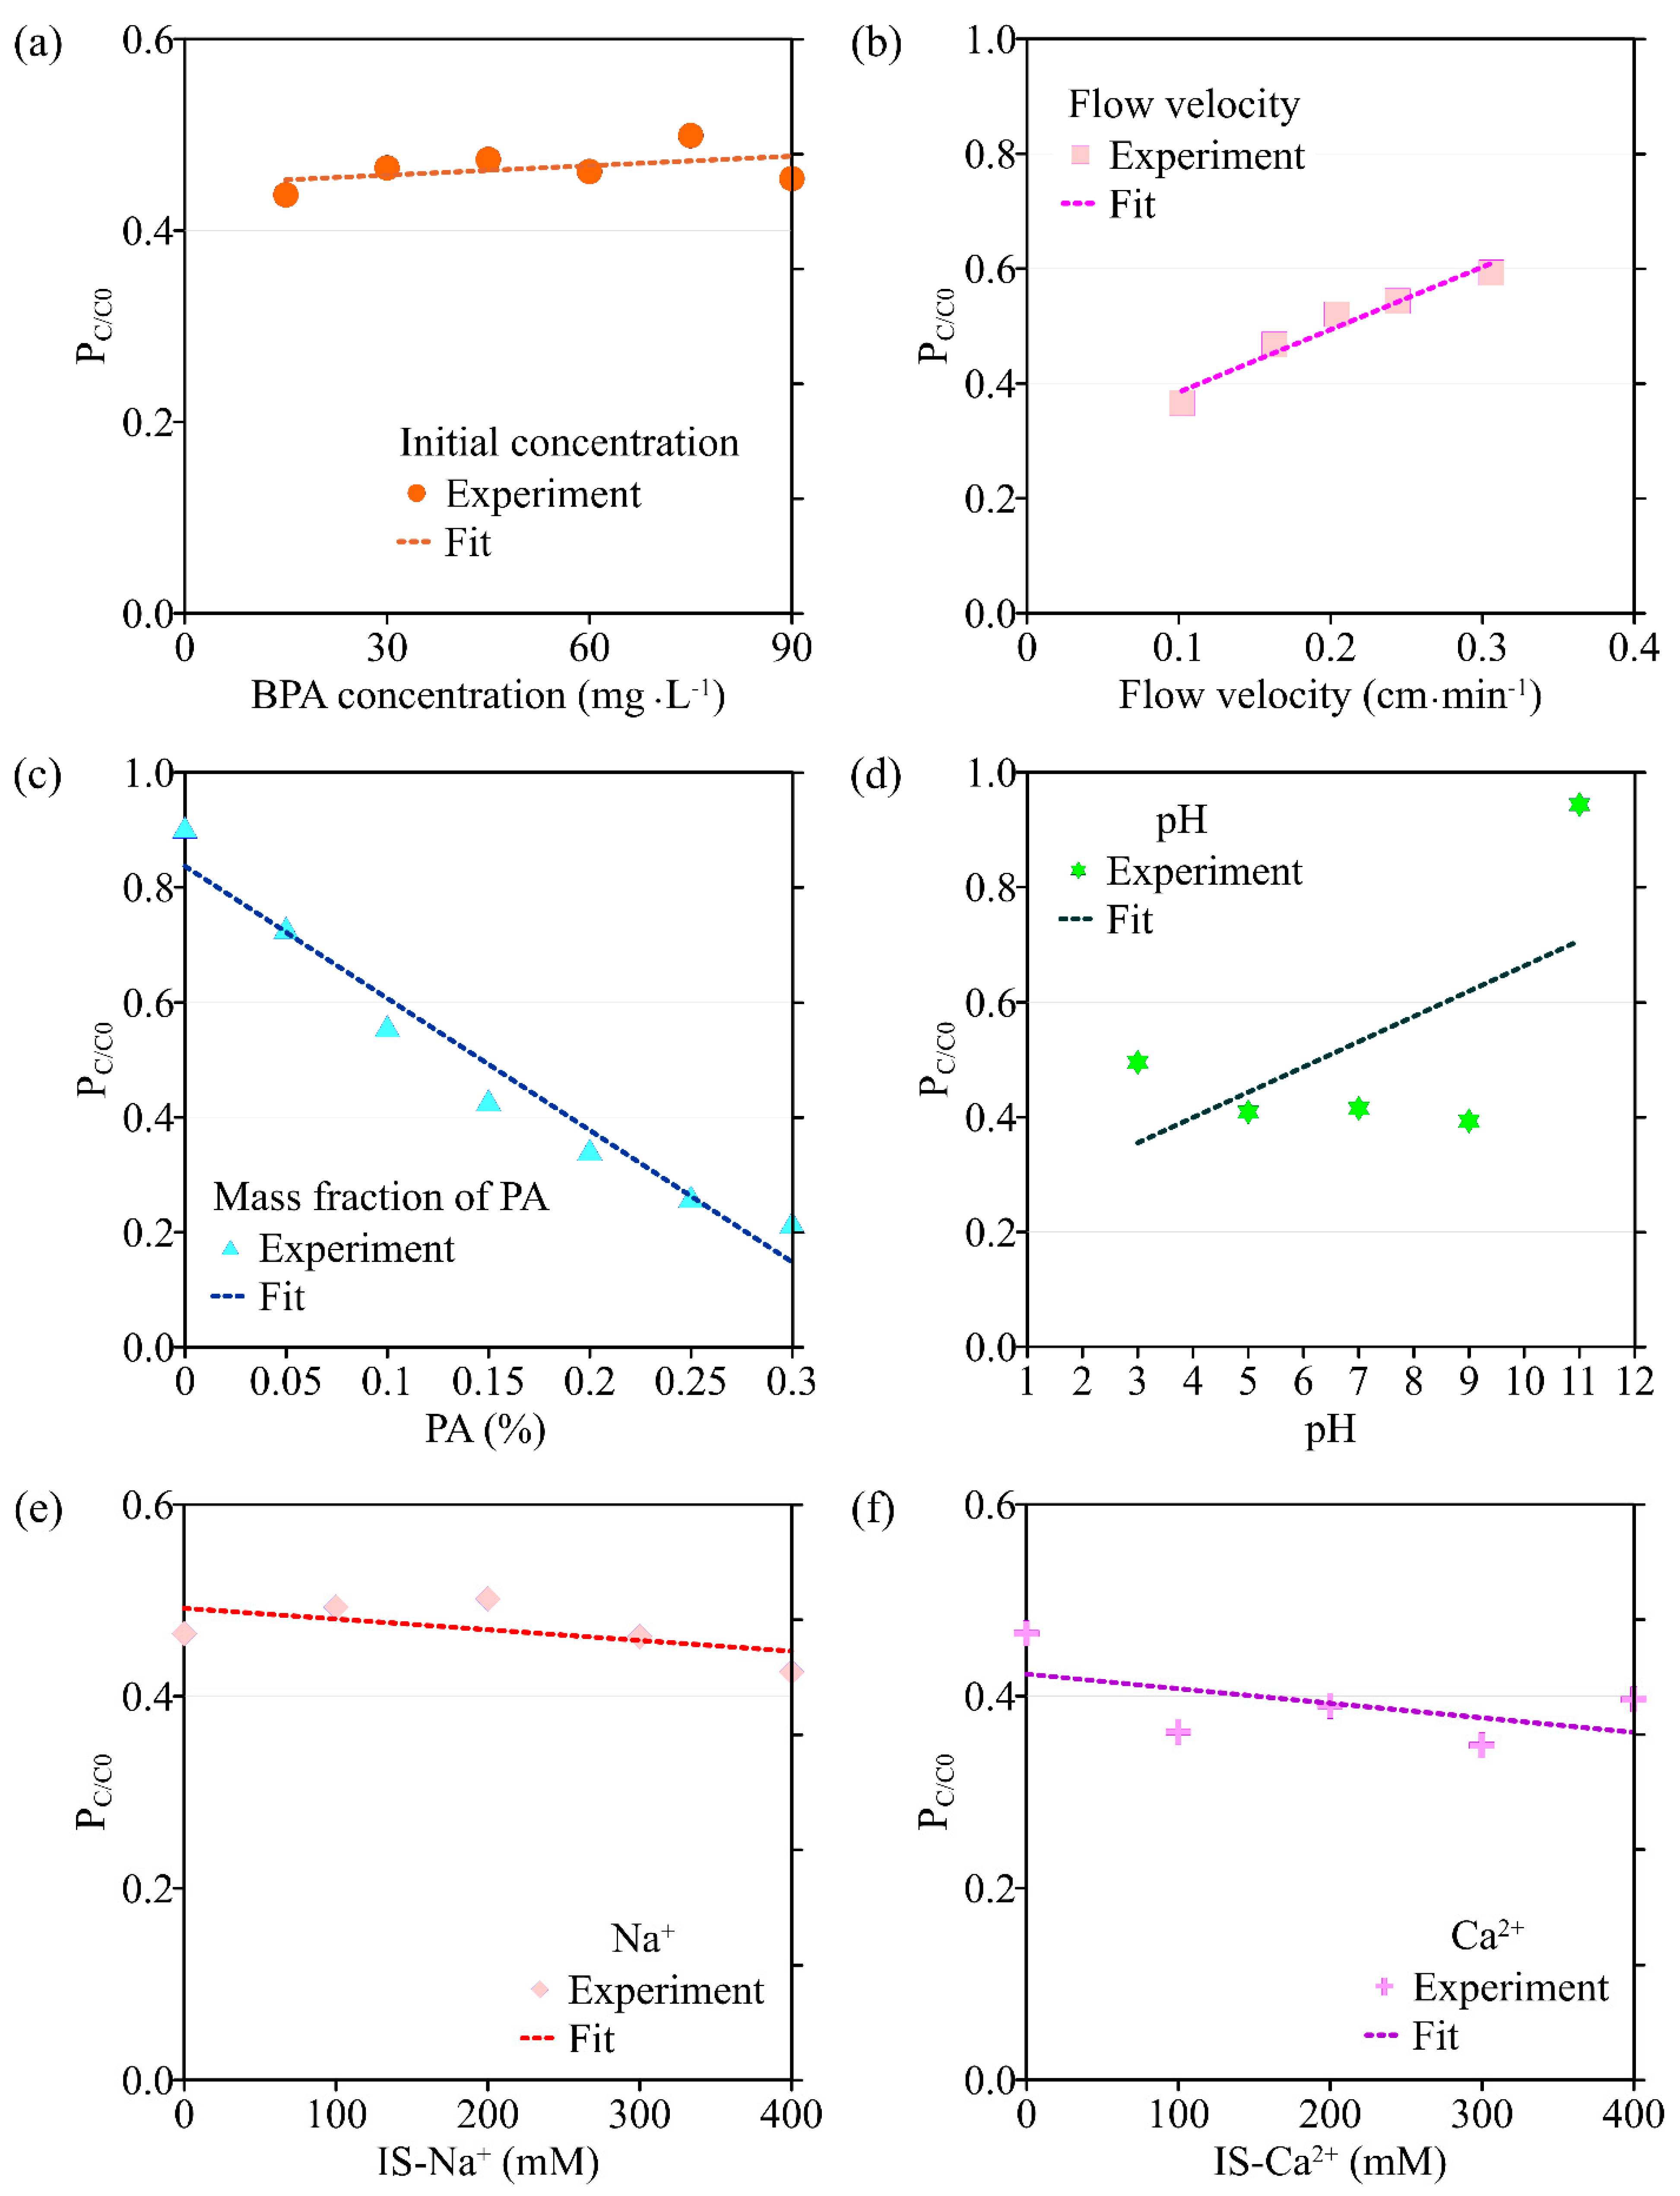
3.3. BPA Transport under Different Conditions

3.3.1. Initial Concentration

The BTCs of BPA with different initial concentrations are shown in Figure 2a. It can be seen that the initial concentration of BPA has no obvious influence on the mass recovery rate (43.7–49.9%). This is consistent with the results of isothermal adsorption experiments, where the adsorption amount p0 is almost linearly related to the BPA concentration C0. Therefore, the mass recovery rate of BPA does not change when the BPA concentration is changed. In addition, the trailing phenomenon of BTCs under conditions of high BPA concentration can be observed, because the adsorption sites on the PA surface are occupied more rapidly by BPA under higher BPA concentrations [21,28]. As a result, a BPA solution with a high concentration will flow out more quickly and reduce the degree of subsequent trailing.
The transport model based on single-point kinetics has a good effect on the simulation of BPA transport under different initial concentrations (R2 > 0.92). When the BPA concentration increases from 15 mg·L−1 to 75 mg·L−1, the value of the BPA adsorption coefficient (k) increases from 1.28 × 10⁻³ min−1 to 4.35 × 10⁻³ min−1, the maximum deposition concentration Smax is increased from 0.693 mg·g−1 to 6.63 mg·g−1, while the mass recovery rate of BPA decreases from 90.2% to 72.3%, and the peak of C/C0 apparently did not change (Figure 3, Figure 4, Figure 5 and Figure 6, Table 1). When the BPA concentration exceeds 75 mg·L−1, the values of k and Smax do not change significantly with BPA concentration, which is consistent with the experimental results (Table 1), indicating that the adsorption sites on the PA surface are occupied by BPA under the conditions of high BPA concentration. The mobility of BPA remains at a constant level and no longer changes significantly when BPA concentration > 75 mg·L−1.

3.3.2. Flow Velocity

The BTCs of BPA under different flow velocities (0.102 cm·min−1, 0.163 cm·min−1, 0.204 cm·min−1, 0.244 cm·min−1, 0.306 cm·min−1) are shown in Figure 2b. It can be seen that the flow velocity has a significant effect on the BPA transport. When the flow rate is 0.102 cm·min−1, the mass recovery rate of BPA is low, only 36%. Experimental results suggest that the mass recovery rate of BPA gradually increases with flow velocity, and high flow velocity can significantly increase the mass recovery rate of BPA. This is due to the fact that BPA has more contact time with PA particles in the porous media under low flow velocity, and the adsorption of BPA on the PA surface is more adequate and complete. In addition, the high flow velocity can increase the shear force of the water flow, leading to some BPA that has attached to the surface of the media to return to the liquid phase, thus increasing the mass recovery rate of BPA [29,30,31].
Results obtained by the transport model based on the single-point kinetic agree well with experimental observations (R2 > 0.91). When the flow rate increases from 0.102 cm·min−1 to 0.306 cm·min−1, the value of k obtained from the model inversion decreases from 3.27 × 10⁻³ min−1 to 2.75 × 10⁻⁵ min−1, and Smax decreases from 3.90 mg·g−1 to 2.79 mg·g−1, indicating that the adsorption of BPA is enhanced under conditions of low flow velocity, which is consistent with the experimental results. Regression analysis shows that the values of k, Smax, the mass recovery rate of BPA, and the peak value of C/C0 are correlated with the flow velocity (Figure 3 and Figure 4, Table 2). Both k and Smax decrease with flow velocity, while the mass recovery rate of BPA and peak value of C/C0 increase with flow velocity (Figure 3, Figure 4, Figure 5 and Figure 6).

3.3.3. Mass Fraction of PA

When the mass fraction of PA in the column increases from 0% to 0.3%, the corresponding BTCs of BPA are shown in Figure 2c. As can be seen from Figure 5c and Figure 6c, both the peak value of C/C0 and the mass recovery rate of BPA decrease significantly with the mass fraction of PA contained in porous media. When the mass fraction of PA is 0%, the mass recovery rate of BPA is up to 90%. When the mass fraction of PA increases to 0.3%, the mass recovery rate of BPA decreases to 21%. In addition, the trailing phenomenon of BTCs is more obvious under the condition of a high mass fraction of PA [32,33,34]. After the injection of 8 PVs of background solution, the BPA concentration in the effluent of the group containing 0.3% PA is ten times higher than that of the group without PA. The above experimental results show that PA has a significant influence on the adsorption and retention of BPA in saturated porous media. Therefore, the higher the mass fraction of PA, the stronger the adsorption and retention of BPA in porous media.
Based on the experimental results, the ADE with a single-point kinetic deposition model is applied to simulate the transport of BPA in porous media. The model results are in good agreement with the experimental results (Table 1). Using regression analysis, the fitted mathematical relationships of k, Smax, the mass recovery rate of BPA, and the peak value of C/C0 are obtained (Table 2). Higher values of k and Smax indicate weaker mobility of BPA in porous media. The results of transport suggest that both k and Smax increase with the mass fraction of PA, while the peak values of C/C0 and the mass recovery rate of BPA decrease with the mass fraction of PA.

3.3.4. pH

The BTCs of BPA under different pH conditions are shown in Figure 2d. When the background solution gradually increases from weakly acidic to neutral and weakly basic, the mass recovery rate of BPA is unchanged and maintained at about 40%. When the pH of the background solution is 3, the mass recovery rate of BPA slightly increases to 49%. This may be due to the fact that the large amount of hydrogen ions contained in the background solution under low pH conditions preempts the adsorption sites on the surface of PA particles, resulting in some BPA not being adsorbed. When the pH of the background solution increases to 11, the mass recovery rate of BPA increases dramatically to 94%. BPA exists in three different forms under different pH conditions, where 2 pKa are present in Figure S2. When the pH is low, the BPA in the solution is mainly composed of BPA with a molecular state. The amount of ionic BPA in the solution gradually increases with pH. When the pH of the background solution is further increased, the two hydroxyl groups on the BPA molecule are hydrolyzed to release hydrogen ions. When pH > 10.2, the chemical form of BPA is dominated by Bis(OH)O- and BisO22−, and the amide bond on the PA surface is unable to form hydrogen bonds with the hydroxyl groups on the BPA surface, resulting in the inability of BPA to adsorb on the PA surface [27,28,35,36].
The transport model based on the single-point kinetic is effective in simulating the transport process of BPA with a good fit (R2 > 0.97). When the pH increases from 3 to 11, the value of k decreases from 3.25 × 10⁻³ min−1 to 2.47 × 10⁻³ min−1, Smax increases from 4.16 mg·g−1 to 2.65 mg·g−1, the peak value of C/C0 increases from 0.496 to 0.944, and the mass recovery rate of BPA increases from 79.2% to 94.4%. These results indicate that the mobility of BPA is positively correlated with pH.

3.3.5. Ionic Types and Strengths

The BTCs of BPA under different ionic types and strengths are shown in Figure 2e,f. As can be seen from Figure 2f, the effect of Ca2+ on the transport of BPA in saturated porous media is significantly greater than that of Na+ on the transport of BPA under the same ionic strength condition (0.3 mmol·L−1). In addition, the mass recovery rate of BPA decreases from 49% to 36% when the Ca2+ concentration in the background solution is increased from 0 mmol·L−1 to 0.1 mmol·L−1. The above results indicate that Ca2+ can significantly inhibit the transport of BPA in the saturated porous media containing PA. When the ionic strength of Na+ and Ca2+ in the background solution is increased from 0.1 mmol·L−1 to 0.4 mmol·L−1, the mass recovery rate of BPA is 42–50% and 31–38%, respectively, indicating that the effect of ion type on BPA transport is more significant than the effect of ionic strength on it. This is due to the fact that BPA is mainly present in solution in an uncharged or partially charged form, so changing the ionic strength has a limited effect on its transport in saturated porous media [37].
The results of the BPA transport model show that when ionic strength (Na+) is increased, k increases from 1.44 × 10⁻³ min−1 to 3.54 × 10⁻³ min−1, Smax increases from 1.48 mg·g−1 to 5.77 mg·g−1, the mass recovery rate of BPA decreases from 86.8% to 79.3% and the peak value of C/C0 decreases from 0.465 to 0.425 (Figure 3e, Figure 4e, Figure 5e and Figure 6e). Meanwhile, the BPA transport model obtains R2 greater than 0.96 (Table 1), indicating that the transport model based on the single-point kinetic can accurately simulate and predict the transport of BPA in the column. The fitted relationships between BPA transport parameters and ionic strength are presented in Table 2. Furthermore, when the electrolyte in the background solution is changed to a divalent cation (Ca2+), the decrease in the mass recovery rate of BPA is greater as ionic strength increases, indicating that the divalent cation inhibits the mobility of BPA in the porous media with greater intensity. These results suggest that the mobility of BPA is weak under the conditions of the existence of divalent cation and high ionic strength.

4. Conclusions

In this study, the adsorption of BPA on PA and the combined effect of PA microplastic and hydrochemical factors on the transport of BPA in saturated porous media are investigated by a combination of batch experiments, column experiments, and numerical models. The results obtained by batch experiments indicate that the adsorption capacity of PA on BPA is much larger than that of QS. The isothermal adsorption results of BPA on PA and QS can be simulated by Langmuir and Freundlich models with a high value of R2, while the simulation result of the quasi-first-order kinetic adsorption model is better than that of the quasi-second-order kinetic adsorption model for kinetic adsorption experiments.
Column experimental and model results suggest that the mobility of BPA is inhibited significantly as the mass fraction of PA increases. When the pH < 10.2, the mobility of BPA does not change significantly with pH. However, when pH exceeds 10.2, the mobility of BPA is strengthened by the conditions of high pH. This phenomenon is due to the hydrolysis of BPA and the ionization of hydrogen ions from the two hydroxyl groups on the BPA molecule, which in turn prevents the BPA from forming hydrogen bonds with the PA and thus from being adsorbed onto the PA. Due to the decrease in contact time between BPA and PA under the condition of high BPA concentration, the mass recovery rate of BPA increases dramatically with the initial concentration of BPA. Moreover, ionic types and strengths also have an apparent influence on the mobility of BPA. Compared with the monovalent ion (Na+), the divalent ion (Ca2+) can significantly inhibit the mobility of BPA in porous media containing PA. These findings can provide basic reference and guidance for the prediction of endocrine disruptor migration behavior in soil-groundwater systems, the accurate assessment of the environmental risks of endocrine disruptors, and the application of the numerical model in the field of the remediation of endocrine-disrupting chemicals.

Supplementary Materials

The following supporting information can be downloaded at: https://www.mdpi.com/article/10.3390/separations10020123/s1, Figure S1: Molecular structure formula of BPA and PA66; Figure S2: The existence form of BPA under different pH conditions; Figure S3: The device diagram of column experiment; Figure S4: FTIR spectra of PA before and after adsorption experiments; Figure S5: The results of adsorption experiments: (a) Isothermal adsorption model of BPA on PA and QS; (b) Quasi-first-order kinetic adsorption model and quasi-second-order kinetic adsorption model of BPA on PA; Table S1: The parameters of isotherm models for BPA adsorption on PA and QS; Table S2: Kinetic adsorption parameters for the adsorption of BPA on PA.

Author Contributions

Z.C.: Conceptualization, Methodology, Writing—original draft, Project administration; X.L.: Conceptualization, Methodology, Writing—original draft; M.W.: Conceptualization, Methodology, Writing—review and editing, Funding acquisition, Project administration; G.L.: Conceptualization, Methodology, Writing—review and editing; Y.H.: Conceptualization; C.M.: Conceptualization, Methodology, Writing—review and editing; Q.L.: Conceptualization; J.W. (Jianfeng Wu): Conceptualization; J.W. (Jichun Wu): Conceptualization; B.X.H.: Conceptualization, Methodology. All authors have read and agreed to the published version of the manuscript.

Funding

This research was funded by the National Natural Science Foundation of China (41902246), the Natural Science Foundation of Guangdong Province (2022A1515010273), the Natural Science Foundation of Guangzhou City (202201010414) and the National Key Research and Development Plan of China (2019YFC1804302).

Institutional Review Board Statement

Not applicable.

Informed Consent Statement

Not applicable.

Data Availability Statement

Data will be made available on request.

Conflicts of Interest

The authors declare no conflict of interest.

References

  1. Rillig, M.C. Microplastic in Terrestrial Ecosystems and the Soil? Environ. Sci. Technol. 2012, 46, 6453–6454. [Google Scholar]
  2. Rochman, C.M. Microplastics research—From sink to source. Science 2018, 360, 28–29. [Google Scholar] [CrossRef]
  3. Shi, J.Y.; Dong, Y.B.; Shi, Y.Y.; Yin, T.T.; He, W.; An, T.Y.; Tang, Y.L.; Hou, X.W.; Chong, S.J.; Chen, D.N.; et al. Groundwater antibiotics and microplastics in a drinking-water source area, northern China: Occurrence, spatial distribution, risk assessment, and correlation. Environ. Res. 2022, 210, 112855. [Google Scholar] [CrossRef]
  4. Auta, H.S.; Emenike, C.U.; Fauziah, S.H. Distribution and importance of microplastics in the marine environment: A review of the sources, fate, effects, and potential solutions. Environ. Int. 2017, 102, 165–176. [Google Scholar] [CrossRef]
  5. Cole, M.; Lindeque, P.; Fileman, E.; Halsband, C.; Goodhhead, R.; Moger, J.L.; Galloway, T.S. Microplastic Ingestion by Zooplankton. Environ. Sci. Technol. 2013, 47, 6646–6655. [Google Scholar]
  6. Wright, S.L.; Thompson, R.C.; Galloway, T.S. The physical impacts of microplastics on marine organisms: A review. Environ. Pollut. 2013, 178, 483–492. [Google Scholar]
  7. Kazour, M.; Terki, S.; Rabhi, K.; Jemaa, S.; Khalaf, G.; Amara, R. Sources of microplastics pollution in the marine environment: Importance of wastewater treatment plant and coastal landfill. Mar. Pollut. Bull. 2019, 146, 608–618. [Google Scholar]
  8. Zhang, Y.; Wu, H.W.; Xu, L.; Liu, H.Z.; An, L.H. Promising indicators for monitoring microplastic pollution. Mar. Pollut. Bull. 2022, 182, 113952. [Google Scholar]
  9. Mintenig, S.M.; Löder, M.G.J.; Primpke, S.; Gerdts, G. Low numbers of microplastics detected in drinking water from ground water sources. Sci. Total Environ. 2019, 648, 631–635. [Google Scholar]
  10. Nizzetto, L.; Futter, M.; Langaas, S. Are Agricultural Soils Dumps for Microplastics of Urban Origin? Environ. Sci. Technol. 2016, 50, 10777–10779. [Google Scholar] [CrossRef]
  11. Teuten, E.L.; Rowland, S.J.; Galloway, T.S.; Thompson, R.C. Potential for Plastics to Transport Hydrophobic Contaminants. Environ. Sci. Technol. 2007, 41, 7759–7764. [Google Scholar]
  12. Panno, S.V.; Kelly, W.R.; Scott, J.; Zheng, W.; McNeish, R.E.; Holm, N.; Hoellein, T.J.; Baranski, E.L. Microplastic Contamination in Karst Groundwater Systems. Groundwater 2019, 57, 189–196. [Google Scholar] [CrossRef]
  13. Huang, Y.Q.; Wong, C.K.C.; Zheng, J.S.; Bouwman, H.; Barra, R.; Wahlström, B.; Neretin, L.; Wong, M.H. Bisphenol A (BPA) in China: A review of sources, environmental levels, and potential human health impacts. Environ. Int. 2012, 42, 91–99. [Google Scholar] [CrossRef]
  14. Česen, M.; Lenarčič, K.; Mislej, V.; Levstek, M.; Kovačič, A.; Cimrmančič, B.; Uranjek, N.; Kosjek, T.; Heath, D.; Dolenc, M.S.; et al. The occurrence and source identification of bisphenol compounds in wastewaters. Sci. Total Environ. 2018, 616–617, 744–752. [Google Scholar]
  15. Ballesteros-Gómez, A.; Rubio, S.; Pérez-Bendito, D. Analytical methods for the determination of bisphenol A in food. J. Chromatogr. A 2022, 182, 113952. [Google Scholar] [CrossRef]
  16. Vandenberg, L.N.; Hauser, R.; Marcus, M.; Olea, N.; Welshons, W.V. Human exposure to bisphenol A (BPA). Reprod. Toxicol. 2007, 24, 139–177. [Google Scholar] [CrossRef]
  17. Li, D.; Zhou, Z.; Qing, D.; He, Y.; Wu, T.; Miao, M.; Wang, J.; Weng, X.; Ferber, J.R.; Herrinton, L.J.; et al. Occupational exposure to bisphenol-A (BPA) and the risk of Self-Reported Male Sexual Dysfunction. Hum. Reprod. 2010, 25, 519–527. [Google Scholar]
  18. Gerona, R.R.; Woodruff, T.J.; Dickenson, C.A.; Pan, J.; Schwartz, J.M.; Sen, S.; Friesen, M.W.; Fujimoto, V.Y.; Hunt, P.A. Bisphenol-A (BPA), BPA Glucuronide, and BPA Sulfate in Midgestation Umbilical Cord Serum in a Northern and Central California Population. Environ. Sci. Technol. 2013, 47, 12477–12485. [Google Scholar]
  19. Careghini, A.; Mastorgio, A.F.; Saponaro, S.; Sezenna, E. Bisphenol A, nonylphenols, benzophenones, and benzotriazoles in soils, groundwater, surface water, sediments, and food: A review. Environ. Sci. Pollut. Res. 2015, 22, 5711–5741. [Google Scholar]
  20. Ahmadzadeh, S.; Dolatabadi, M. Modeling and kinetics study of electrochemical peroxidation process for mineralization of bisphenol A; a new paradigm for groundwater treatment. J. Mol. Liq. 2018, 254, 76–82. [Google Scholar]
  21. Shi, Y.F.; Sun, Y.Y.; Gao, B.; Xu, H.X.; Shi, X.Q.; Wu, J.C. Retention and Transport of Bisphenol A and Bisphenol S in Saturated Limestone Porous Media. Water Air Soil Pollut. 2018, 229, 260. [Google Scholar]
  22. Shi, Y.F.; Gao, B.; Sun, Y.Y.; Xu, H.X.; Wu, J.C. Effect of Residual NAPLs on the Transport of Bisphenol A and Bisphenol S in Saturated Porous Media. Water Air Soil Pollut. 2019, 230, 185. [Google Scholar] [CrossRef]
  23. Šimůnek, J.; van Genuchten, M.T. Modeling nonequilibrium flow and transport processes using Hydrus. Vadose Zone J. 2008, 7, 782–797. [Google Scholar] [CrossRef] [Green Version]
  24. Teijón, G.; Candela, L.; Šimůnek, J.; Tamoh, K.; Valdes-Abellán, J. Fate and transport of naproxen in a sandy aquifer material: Saturated column studies and model evaluation. Soil Sediment Contam. 2014, 23, 736–750. [Google Scholar]
  25. Zakari, S.; Liu, H.; Tong, L.; Wang, Y.; Liu, J.F. Transport of bisphenol-A in sandy aquifer sediment: Column experiment. Chemosphere 2016, 144, 1807–1814. [Google Scholar]
  26. Wu, M.; Chen, Y.N.; Cheng, Z.; Hao, Y.R.; Hu, B.X.; Mo, C.M.; Li, Q.S.; Zhao, H.M.; Xiang, L.; Wu, J.F.; et al. Effects of polyamide microplastic on the transport of graphene oxide in porous media. Sci. Total Environ. 2022, 843, 157042. [Google Scholar] [CrossRef]
  27. Liu, X.M. Interaction and Mechanism between Microplastics and Typical Environmental Endocrine Disrupting Compounds. Master’s Thesis, East China Normal University, Shanghai, China, 2020. (In Chinese with English abstract). [Google Scholar]
  28. Chen, Y.N.; Wu, M.; Cheng, Z.; Hu, X.N. Effects of typical microplastics on migration of ciprofloxacin in porous media. J. Agro-Environ. Sci. 2021, 40, 400–407, (In Chinese with English abstract). [Google Scholar]
  29. Wei, X.; Shao, M.; Du, L.; Horton, R. Humic acid transport in saturated porous media: Influence of flow velocity and influent concentration. J. Environ. Sci. 2014, 26, 2554–2561. [Google Scholar] [CrossRef]
  30. Cai, L.; Zhu, J.H.; Hou, Y.L.; Tong, M.P.; Kim, H.J. Influence of gravity on transport and retention of representative engineered nanoparticles in quartz sand. J. Contam. Hydrol. 2015, 181, 153–160. [Google Scholar]
  31. Song, S.; Song, Y.; Shi, M.; Hu, Z.; Li, T.; Lin, S. Transport and numerical simulation of Cu2+ in saturated porous medium in the presence of magnetic nanoparticles. Environ. Sci. Pollut. R. 2019, 26, 35827–35837. [Google Scholar] [CrossRef]
  32. Liang, Y.; Bradford, S.A.; Simunek, J.; Vereecken, H.; Klumpp, E. Sensitivity of the transport and retention of stabilized silver nanoparticles to physicochemical factors. Water Res. 2013, 47, 2572–2582. [Google Scholar] [CrossRef]
  33. Sun, Y.; Gao, B.; Bradford, S.A.; Wu, L.; Chen, H.; Shi, X.; Wu, J. Transport, retention, and size perturbation of graphene oxide in saturated porous media:effects of input concentration and grain size. Water Res. 2015, 68, 24–33. [Google Scholar]
  34. Wang, D.; Shen, C.; Jin, Y.; Su, C.; Chu, L.; Zhou, D. Role of solution chemistry in the retention and release of graphene oxide nanomaterials in uncoated and iron oxide-coated sand. Sci. Total Environ. 2016, 579, 776–785. [Google Scholar] [CrossRef]
  35. Zhao, X.Q. The removal of bisphenol compiunds in water environment by coconut shell biochar immobilized TTNP3. Master’s Thesis, Nanjing University, Nanjing, China, 2018. (In Chinese with English abstract). [Google Scholar]
  36. Yang, D. The adsorption mechanism of bisphenol A and its substitute on graphene. Master’s Thesis, Kunming University of Science and Technology, Kunming, China, 2021. (In Chinese with English abstract). [Google Scholar]
  37. Ye, X.; Cheng, Z.; Wu, M.; Hao, Y.; Lu, G.P.; Hu, B.X.; Mo, C.H.; Li, Q.S.; Wu, J.F.; Wu, J.C. Effects of Clay Minerals on the Transport of Polystyrene Nanoplastic in Groundwater. Water Res. 2022, 223, 118978. [Google Scholar]
Figure 1. SEM Images of QS and PA: (a) SEM of QS before adsorption; (b) SEM of QS after adsorption; (c) SEM of PA before adsorption; (d) SEM of PA after adsorption.
Separations 10 00123 g001
Figure 2. BTCs of BPA under different conditions: (a) initial concentration of BPA; (b) flow velocity; (c) the mass fraction of PA contained in porous media; (d) pH; (e) ionic strength (Na+); (f) ionic strength (Ca2+).
Separations 10 00123 g002
Figure 3. The variation in BPA desorption coefficient (k) with different environmental factors: (a) initial concentration of BPA; (b) flow velocity; (c) the mass fraction of PA contained in porous media; (d) pH; (e) ionic strength (Na+); (f) ionic strength (Ca2+).
Separations 10 00123 g003
Figure 4. The variation in the maximum solid-phase concentration of deposited BPA (Smax) with different environmental factors: (a) initial concentration of BPA; (b) flow velocity; (c) the mass fraction of PA contained in porous media; (d) pH; (e) ionic strength (Na+); (f) ionic strength (Ca2+).
Separations 10 00123 g004
Figure 5. The variation in BPA recovery rate with different environmental factors: (a) initial concentration of BPA; (b) flow velocity; (c) the mass fraction of PA contained in porous media; (d) pH; (e) ionic strength (Na+); (f) ionic strength (Ca2+).
Separations 10 00123 g005
Figure 6. The variation in the peak value of C/C0 (PC/C0) with different environmental factors: (a) initial concentration of BPA; (b) flow velocity; (c) the mass fraction of PA contained in porous media; (d) pH; (e) ionic strength (Na+); (f) ionic strength (Ca2+).
Separations 10 00123 g006
Table 1. Summary of experimental conditions and model results.
No.CBPA 1
(mg·L−1)
ν 2
(cm·min−1)
PPA 3
(%)
pHIS 4 (mM)PC/C0 5RC 6
(%)
Model Results
Na+Ca2+k7
(min−1)
Smax 8 (mg·g−1)R2
1150.2040.17\\0.43790.21.28 × 10−30.6930.942
2300.2040.17\\0.46586.81.44 × 10−31.480.928
3450.2040.17\\0.47483.01.65 × 10−32.360.923
4600.2040.17\\0.46276.12.35 × 10−33.810.958
5750.2040.17\\0.49972.34.35 × 10−36.630.977
6900.2040.17\\0.45466.34.34 × 10−37.010.976
7300.1020.17\\0.36671.73.27 × 10−33.900.913
8300.1630.17\\0.46870.53.15 × 10−33.000.958
9300.2440.17\\0.54379.78.21 × 10−52.880.981
10300.3060.17\\0.59379.52.75 × 10−52.790.987
11300.2040.07\\0.90596.71.02 × 10−31.510.997
12300.2040.057\\0.73094.31.03 × 10−32.010.947
13300.2040.157\\0.43079.11.21 × 10−33.040.953
14300.2040.27\\0.34469.01.48 × 10−33.090.904
15300.2040.257\\0.26267.71.95 × 10−33.160.859
16300.2040.37\\0.21762.72.13 × 10−34.110.779
17300.2040.13\\0.49679.23.25 × 10−34.160.974
18300.2040.15\\0.40968.72.84 × 10−34.110.983
19300.2040.19\\0.39370.92.56 × 10−33.910.979
20300.2040.111\\0.94498.42.47 × 10−32.650.991
21300.2040.17100\0.49385.13.10 × 10−34.390.985
22300.2040.17200\0.50279.43.18 × 10−34.760.977
23300.2040.17300\0.46281.33.40 × 10−35.340.964
24300.2040.17400\0.42579.33.54 × 10−35.770.974
25300.2040.17\1000.36267.02.50 × 10−33.850.965
26300.2040.17\2000.39060.43.08 × 10−34.310.986
27300.2040.17\3000.34962.83.21 × 10−34.730.960
28300.2040.17\4000.39662.73.32 × 10−35.040.982
1 CBPA is initial concentrations of BPA; 2 ν is flow velocity; 3 PPA is the mass fraction of PA contained in porous media; 4 IS is ionic strength; 5 PC/C0 is the peak value of C/C0; 6 Rc is the mass recovery rate of BPA; 7 k is desorption coefficient of BPA; 8 Smax is the maximum solid phase concentration of deposited BPA.
Table 2. The fitted equations of BPA transport parameters, peak value of C/C0, and mass recovery rate of BPA.
Parameterk1 (min−1)Smax 2 (mg·g−1)PC/C0 3RC 4 (%)
CBPA 5 (mg·L−1) k = 4.71 × 10 5 C B P A + 9.46 × 10 5
(R2 = 0.863)
S m a x = 9.24 × 10 2 C B P A 1.18
(R2 = 0.951)
P C / C 0 = 3.91 × 10 4 C B P A + 4.43 × 10 1
(R2 = 0.368)
R C = 3.19 × 10 1 C B P A + 95.8
(R2 = 0.989)
ν 6 (cm·min−1) k = 1.88 × 10 2 ν + 5.39 × 10 3
(R2 = 0.848)
S m a x = 4.90 ν + 4.10
(R2 = 0.704)
P C / C 0 = 1.09 ν + 2.76 × 10 1
(R2 = 0.953)
R C = 4.88 × 10 1 ν + 6.55 × 10 1
(R2 = 0.784)
PPA7 (%) k = 3.97 × 10 3 P P A + 8.18 × 10 4
(R2 = 0.881)
S m a x = 7.76 P P A + 1.59
(R2 = 0.941)
P C / C 0 = 2.30 P P A + 8.37 × 10 1
(R2 = 0.956)
R C = 1.20 × 10 2 P P A + 96.9
(R2 = 0.963)
pH k = 9.16 × 10 5 p H + 3.41 × 10 3
(R2 = 0.904)
S m a x = 1.61 × 10 1 p H + 4.88
(R2 = 0.659)
P C / C 0 = 4.40 × 10 2 p H + 2.23 × 10 1
(R2 = 0.354)
R C = 2.03 p H + 63.0
(R2 = 0.378)
ISNaCl 8 (mM) k = 4.49 × 10 6 I S N a C l + 2.03 × 10 3
(R2 = 0.775)
S m a x = 4.45 × 10 3 I S N a C l + 3.96
(R2 = 0.993)
P C / C 0 = 9.02 × 10 5 I S N a C l + 4.85 × 10 1
(R2 = 0.313)
R C = 1.88 × 10 2 I S N a C l + 90.1
(R2 = 0.276)
ISCaCl2 9 (mM) k = 4.48 × 10 6 I S C a C l 2 + 1.82 × 10 3
(R2 = 0.851)
S m a x = 4.82 × 10 3 I S C a C l 2 + 3.24
(R2 = 0.968)
P C / C 0 = 2.08 × 10 4 I S C a C l 2 + 4.40 × 10 1
(R2 = 0.336)
R C = 2.57 × 10 2 I S C a C l 2 + 74.5
(R2 = 0.295)
1k is desorption coefficient of BPA; 2 Smax is the maximum solid phase concentration of deposited BPA; 3 PC/C0 is the peak value of C/C0; 4 Rc is the mass recovery rate of BPA; 5 CBPA is initial concentrations of BPA; 6 ν is flow velocity; 7 PPA is the mass fraction of PA contained in porous media; 8 ISNaCl is the ionic strength of Na+; 9 ISCaCl2 is the ionic strength of Ca2+.
Disclaimer/Publisher’s Note: The statements, opinions and data contained in all publications are solely those of the individual author(s) and contributor(s) and not of MDPI and/or the editor(s). MDPI and/or the editor(s) disclaim responsibility for any injury to people or property resulting from any ideas, methods, instructions or products referred to in the content.

