Article

Development of Micro-Column Preconcentration Method Using a Restricted-Access Poly(protoporphyrin-co-vinyl pyridine) Adsorbent for Copper Determination in Water and Milk Samples by FIA-FAAS

by
Fabio Antonio Cajamarca Suquila
1,2,
Letícia Alana Bertoldo
2,
Eduardo Lins
2 and
César Ricardo Teixeira Tarley
2,3,4,*
1
Department of Biology, National Pedagogic University (UPN), Cll 72 # 11-86, Bogotá 110231, Colombia
2
Department of Chemistry, State University of Londrina (UEL), Rodovia Celso Garcia Cid, PR 445, km 380, CEP, Londrina 86050-482, Brazil
3
National Institute of Science and Technology of Bioanalytics (INCTBio), Campinas 13083-970, Brazil
4
Department of Analytical Chemistry, Institute of Chemistry–Unicamp, P.O. Box 6154, Campinas 13084-974, Brazil
*
Author to whom correspondence should be addressed.
Separations 2023, 10(2), 122; https://doi.org/10.3390/separations10020122
Submission received: 5 January 2023 / Revised: 8 February 2023 / Accepted: 8 February 2023 / Published: 9 February 2023

Abstract

:
For years, researchers have focused on the determination of metal ions at trace levels in environmental and food samples using analytical methods that employ techniques with low cost acquisition and maintenance and without microwave-assisted acid digestion procedures or aggressive reagents. Therefore, the present study deals with the synthesis and application of a novel, restricted-access poly(protoporphyrin-co-vinyl pyridine) adsorbent to preconcentrate copper in water samples and bovine milk that have only been subjected to pH adjusting (pH 6.0) and filtration using posterior on-line determination by FAAS. Regarding macromolecules, the restricted-access property of the adsorbent was achieved using the hydrophilic compound 2-hydroxyethyl methacrylate (HEMA). This method is based on the preconcentration of Cu2+ ions using a flow-injection system which is buffered with 0.05 mol L−1 of Britton–Robinson (BR) at a pH of 6.0 and has a flow rate of 14.0 mL min−1 through a mini-column packed with 50.0 mg of adsorbent. The elution was carried out using 0.40 mol L−1 of HCl toward the FAAS detector. The developed method provided a preconcentration factor of 44.7-fold, low limits of detection (LOD) (0.90 µg L−1) and quantification (LOQ) (2.90 µg L−1), tolerance to interfering ions (95.0 and 103.0%), and intra-day and inter-day precision assessed as the RSD (percentage of relative standard deviation), which ranged from 3.08 to 4.80%. The restricted-access poly(protoporphyrin-co-vinyl pyridine) adsorbent demonstrated outstanding features to exclude macromolecules, bovine serum albumin (BSA), and humic acid (HA) from an aqueous medium. Lake water and bovine milk samples were analyzed by the proposed preconcentration method with minimal sample pretreatment (which was based mainly on pH adjusting and filtration using an analytical curve with external calibration), yielding recovery values from addition and recovery tests ranging from 91.7 to 101.9%. The developed method shows great advantages over previously published methods, avoiding the time-consuming use of concentrated acids in a microwave-assisted acid digestion procedure.

Graphical Abstract

1. Introduction

Copper plays an important role in plants, animals, and humans. This trace metal is present in diverse physical, chemical, and biological processes such as cellular respiration, angiogenesis, as a catalytic cofactor of several metalloenzymes, the biosynthesis of neurotransmitters and peptide hormones, the cross-linking of elastin, collagen and keratin, protective actions against free radicals, and immune responses [1,2].
An excess of free Cu2+ ions in the human organism induces several complications for cellular components. These include oxidative stress, DNA damage, reduced cell proliferation, Indian childhood cirrhosis, endemic Tyrolean infantile cirrhosis, idiopathic copper toxicosis, and Menkes and Wilson diseases. In the latter, copper is bioaccumulated specifically in the liver and brain due to a variant in the gene which encodes the copper-ATPase enzyme, affecting the performance of these vital organs [2,3].
The main intake sources of copper for human beings are diet, supplements, and water. National and international regulatory agencies have established daily copper intakes (RDIs—daily reference intakes) and maximum concentration levels in foods, with greater emphasis placed on foods consumed daily, such as bovine milk and its derivatives. The Brazilian Health Regulatory Agency (ANVISA) established copper RDI values for food samples ranging from 200.0 to 220.0 μg/day for infants, 340.0 to 440.0 μg/day for children, and 900.0 μg/day for adults [4], while the Codex Alimentarius JECFA (Joint FAO/WHO Expert Committee on Food Additives), administered by Food and Agriculture, established ranges of 500.0–700.0 μg/day for infants and 200.0–300.0 μg/day for adults [5,6]. The Agency for Toxic Substances and Disease Registry (ATSDR) adopted a maximum copper value of 0.3 mg kg−1 [7], whereas the Japan External Trade Organization (JETRO) established a copper maximum of 0.6 mg kg−1 [8]. In addition, regarding drinking water, a maximum copper concentration level of 2000 µg L−1 was established by the National Environment Council (CONAMA) and the Ministry of Health (Brazil) [9,10], and the European Food Safety Authority (EFSA) established an adequate intake of 1.6 and 1.3 mg/day for men and women, respectively [11]. Therefore, it is of paramount importance to monitor copper in water samples and food samples for quality control, bearing in mind the maximum allowable copper levels established by national and international regulatory agencies.
Inductively coupled plasma optical emission spectrometry (ICP-OES) [12], inductively coupled plasma mass spectrometry (ICP-MS) [13], and atomic absorption spectrometry (AAS), including its different atomization systems, such as flame atomic absorption spectrometry (FAAS) [14], thermospray flame furnace atomic absorption spectrometry (TS-FF-AAS) [15], and graphite furnace atomic absorption spectrometry (GFAAS) [16], are the most frequently used spectroanalytical techniques for copper determination. Despite FAAS demonstrating a low acquisition cost, low maintenance, high selectivity, and simplicity, this technique suffers from low sensitivity for copper determination at trace levels (≤ µg L−1). Therefore, preconcentration methods have been associated with FAAS for metal-ion determination at low levels [15,17]. Liquid–liquid microextraction methods, including cloud point extraction (CPE); dispersive liquid–liquid microextraction (DLLME); liquid membrane extraction (LM) and its different types (supported liquid membrane (SLM), hollow fiber-supported liquid membrane (HFSLM), emulsion liquid membrane (ELM), and bulk liquid membrane (BLM)); coprecipitation; ion exchange; electrodeposition; and solid-phase extraction-based methods, including flow injection analysis, solid phase extraction, and dispersive solid-phase extraction (D-SPE) [18,19]; are examples of successful preconcentration methods.
Nevertheless, the flow injection analysis–solid-phase extraction methods have been the most popular due to a wide variety of natural or synthetic adsorbents, high sample throughput, high preconcentration factor, high adsorbent reusability, and reasonable selectivity, which are factors that depend upon the nature of adsorbent [18,19,20].
For functional polymers, the binding sites of functional monomers used in synthesis play an important role in the adsorptive capacity and selectivity of the polymer. As previously reported, vinyl protoporphyrins and vinyl pyridines used as functional monomers have presented interesting properties for forming very stable complexes with diverse ion metals (Co2+, Fe3+, Mn2+, Cd2+) [21,22,23,24,25,26,27,28,29,30].
However, one of the major limitations of solid-phase extraction is the inability to exclude macromolecules, such as bovine serum albumin—BSA and humic acid—HA [31], in the adsorption process. The adsorption of these macromolecules on the adsorbent surface hinders or diminishes the adsorption of the metal toward the binding site. In order to solve this drawback, adsorbents based on restricted-access materials (RAM) can be used. These are obtained by grafting or exposing hydrophilic or hydrophobic functional groups to the external surface of the material [32,33]. The choice of these groups depends on the chemical nature of the macromolecule to be excluded. In this way, to exclude BSA and HA, which are hydrophilic macromolecules, compounds containing -OH groups such as glyceryl methacrylate (GMA) and 2-hydroxyethyl methacrylate (HEMA) can be used [34].
The exclusion mechanism of the macromolecules can occur through a physical or chemical diffusion barrier or through a combination of both, in which the macromolecule is excluded by repulsive forces (based on pH), through a size-exclusion process, or both on the material surface, without hindering the metal diffusion into the inner surface of the porous particles [35]. The development of restricted-access materials (RAM) for the preconcentration of molecules from the complex matrices is well-documented. However, such a strategy for metal ions is still in its infancy.
Thus, in the present paper, the performance of a novel adsorbent containing 2-hydroxyethyl methacrylate (HEMA) in the polymeric network, poly(protoporphyrin-co-vinyl pyridine), was evaluated for copper preconcentration using an FIA-FAAS system with the simultaneous exclusion of macromolecules.

2. Materials and Methods

2.1. Reagents and Standard Solutions

All reagents used in this study were of analytical grade. For the preparation of all solutions, ultrapure water with a resistivity of 18.2 MΩ cm, obtained from an ELGA PURELAB Maxima purification system (High Wycombe, Bucks, UK), was employed. Likewise, all plastic and glassware used in this work were previously kept in a 10.0% (v/v) HNO3 solution for 24 h, then washed with ultrapure water to remove any contaminating substances, mainly for metals.
Protoporphyrin IX disodium (Na2PpIX, ≥90.0%), 4-vinyl pyridine (4-VP, 95.0%), ethylene glycol dimethacrylate (EGDMA, 98.0%), 2,2’-azobis-iso-butyronitrile (AIBN, 98.0%), and dimethyl sulfoxide (DMSO, ≥99.0%) were purchased from Sigma-Aldrich (Steinheim, DEU), while 2-hydroxyethyl methacrylate (HEMA, 98.0%), purchased from Acros Organic (Morris Plains, NJ, USA), and chloroform (CHCl3, ≥99.0%), obtained from Vetec (Rio de Janeiro, RJ, BR), were employed for the polymer synthesis.
Copper(II) nitrate trihydrate salt [Cu(NO3)2 ▪ 3H2O, 98.0–103.0%; Sigma-Aldrich] was used to prepare a stock solution of 1000 mg L−1 in 5.0 % (v/v) HCl. Next, 10 mg L−1 Cu2+ was prepared by diluting the stock solutions with ultrapure water which, in turn, was used to prepare the working solution (100.0 μg L−1 Cu2+).
The pH adjustment of the solutions was carried out using solutions of 1.0 mol L−1 of sodium hydroxide (NaOH, 99.0%; Vetec) and/or hydrochloric acid (HCl, 37.0%; Panreac, Darmstadt, DEU). The former was also used as an eluent in the FIA-FAAS system in an amount of 1.5 mol L−1.
The buffer solutions Tris/Tris-HCl and H2PO4/H2PO42− were made from salts of Tris(hydroxymethyl)aminomethane (NH2C(CH2OH)3 ▪ HCl, Merck, Darmstadt, DEU) and sodium dihydrogen phosphate monohydrate (NaH2PO4 ▪ H2O, 98.0%; J.T. Baker, Ecatepec, State of Mexico, MX). The Britton–Robinson (BR) buffer was prepared by mixing an acidic solution of boric acid (H3BO3, 99.0%; Chemco, BR), acetic acid (CH₃COOH, 99.8%; Sigma-Aldrich), and phosphoric acid (H3PO4, 85.0%; Merck) in the same concentrations (0.05 mol L−1).
For the study of the interfering ions, solutions of metallic ions (Al3+, Ba2+, Cd2+, Co2+, Pb2+, Fe2+, Mn2+, Ni2+, Zn2+, Ca2+, Mg2+, K+, and Cu2+) were prepared from their respective nitrates (NIST -National Institute of Standards and Technology), while solutions of anions were prepared from their respective sodium salts (Na2SO4 (99.9%—VETEC), Na3PO4 ▪ H2O (98.4%—J.T. Baker), Na2CO3 (97.0–103.0%—Synth), NaCl (99.5%—Sigma-Aldrich), Na3AsO4 ▪ 7H2O (99.9%—Sigma-Aldrich), Na2SeO4 (99.8%—AlfaAesar), and Na3C6H5O7 ▪ 2H2O (99.0%—Chemco)).
The bovine serum albumin (BSA, 98%) and humic acid (HA) employed in the macromolecules exclusion study were acquired from Sigma-Aldrich (Steinheim, Germany).

2.2. Instrumentation

A flame atomic absorption spectrometer (FAAS), model AA-7000, Shimadzu (Kyoto, Japan), was applied. All measurements were carried out in an acetylene/air flame at 2.0 and 15.0 L min−1, respectively. The copper hollow-cathode lamp (wavelength: 324.8 nm; current: 8.0 mA) was used with a spectral bandwidth of 0.5 nm. A deuterium background correction was applied to all measurements.
The pH measurements were carried out using a mobile, digital pH meter from Metrohm®, model 826.
A spectrophotometer (PerkinElmer, Lambda 25 (MA, USA) was used to monitor the BSA protein (λmax = 278 nm) and HA (λmax = 192 nm), while the identification of the main functional groups in the polymer was performed by using a Bruker FT-IR Fourier transform spectrometer, Vertex 70 Model, operating in transmission mode (4000–400 cm−1). A Platinum ATR reflectance accessory was also used. The spectrum was acquired using 10 scans and a resolution of 4 cm−1.
The SEM images were obtained using a Tescan Mira 3 (Czech Republic) scanning electron microscope (SEM). For the SEM analysis, the polymer was previously coated with a thin layer of gold (30 nm) and placed in an aluminum sample holder with carbon tape, using Bal-Tec SCD Sputter Coater equipment (New York, NY, USA) to reduce charging under the incident electron beam during analysis. The micro-photographs of the polymer were obtained at 25, 400, 800, 1600, and 6000 times magnified, with a scale of 2.0 mm, 100.0 μm, 50.0 μm, 20.0 μm, and 10.0 μm, respectively. The degree of crystallinity of the polymer was evaluated using a PAN analytical, X’Pert PRO MPD diffractometer (Almelo, Germany). The XRD pattern appearance was employed to infer the solid-state structural properties, such as the degree of crystallinity (structural order) or amorphous content of the polymer. Thus, the XRD pattern was generated by radiation Cu Kα (λ = 1.54 Å) for a Bragg’s angle range of 5° to 80° (2θ angular ranges), using a scan step size of 0.05° and a time per step of 15 s.

2.3. Polymer Synthesis

The synthesis of the polymer was based on procedures described in the literature, with some modifications [21]. Firstly, 0.1 mmol of Na2PPIX was dissolved in 5.0 mL of the DMSO:CHCl3 mixture (1:1 v/v) inside a glass tube, followed by the addition of 5.0 mmol of 4-VP (monomer), 10.0 mmol of EGDMA (cross-linker), 10.0 mmol of HEMA (hydrophilic co-monomer), and 100.0 mg of AIBN (free-radical initiator); all were solubilized in a single stage. The mixture was bubbled with nitrogen for 15 min. The flask was then sealed and submitted to heating at 60 °C in a glycerin bath for 24h. After this time, the glass tube was broken, and the obtained polymer was removed, washed with ethanol and ultrapure water, dried at 50 °C, crushed, ground in a mortar, and sieved to obtain a particles size of 106-150 µm, which is an appropriate size for packing in a mini-column, avoiding polymer loss.

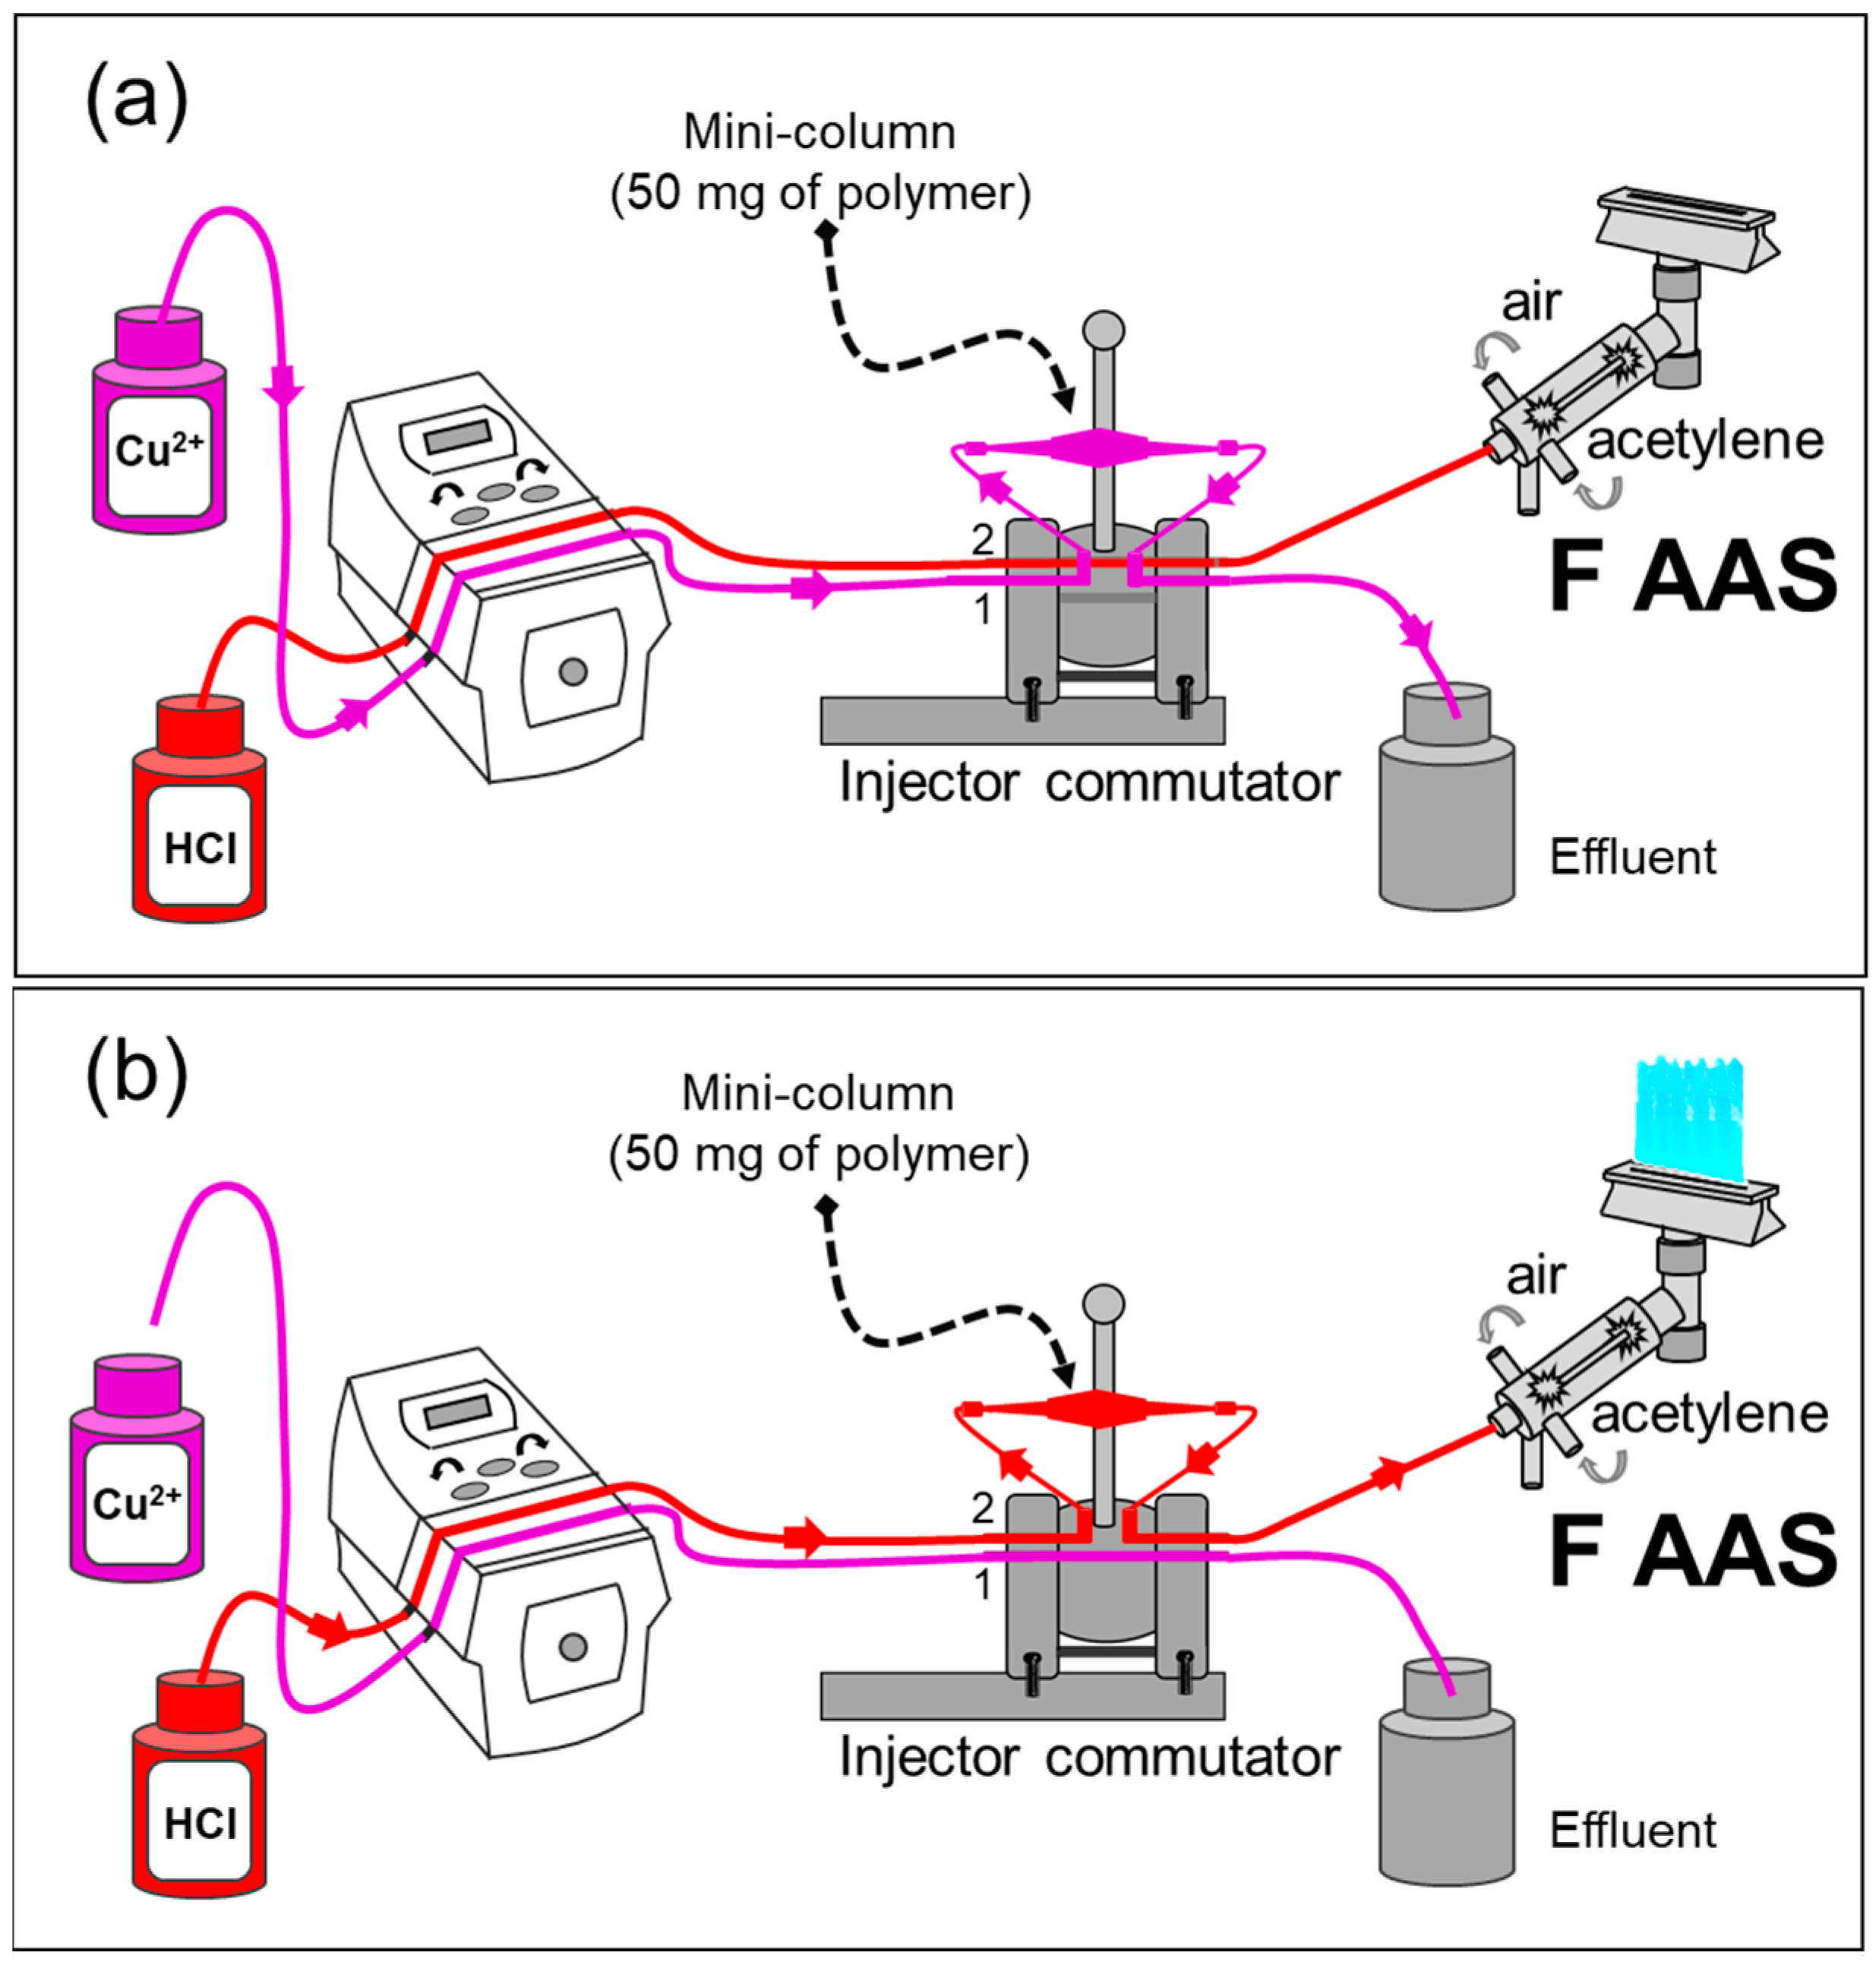
2.4. Online FIA-FAAS Determination of Cu2+

The flow injection analysis (FIA) system comprised a GILSON Minipuls Evolution peristaltic pump (Middleton, WI, USA) with channels for placing Tygon® tubes (Courbevoie, France); a cylindrical mini-column fixed to a homemade commutator injector composed of poly(acrylic acid); and tubes of polyethylene with a 0.8 mm internal diameter for all system connections.
The homemade, cylindrical mini-column, which was composed of polyethylene from Eppendorf pipette tips, was packed with 50.0 mg of polymer. To avoid polymer loss from the mini-column during the preconcentration and elution step, each internal extremity of the mini-column was sealed using glass wool and a small piece of cotton tissue as filter materials. It is important to stress that a blank mini-column was built, aimed at the possible adsorption of copper by the glass wool and cotton, but no copper adsorption was observed under the optimized condition of the method.
The FIA system was coupled to flame atomic absorption spectrometry (FAAS) (FIA-FAAS) for the on-line copper detection, as can be seen in Figure 1. For the first stage (Figure 1a), a solution containing Cu2+ ions was percolated through the mini-column for 2.14 min at an optimum flow rate of 14.0 mL min−1. The injector was then commuted, and a solution of 0.40 mol L−1 HCl was employed for the elution of Cu2+ from the polymer towards the FAAS detector. This occurred at the same flow rate as the preconcentration step. The signals were recorded as absorbance (Figure 1b).

2.5. pH Effect on Cu2+ Adsorption

The effect of the sample pH on the Cu2+ adsorption was investigated using FIA-FAAS. For this assay, 14.0 mL of a standard solution of Cu2+ at a concentration of 100.0 μg L−1, buffered with 0.01 mol L−1 BR and at different pH values in a wide range of pH (3.00–11.00), was percolated through the mini-column at a flow rate of 7.0 mL min−1. After the elution step, 0.40 mol L−1 HCl was percolated through the mini-column for 1 min as an eluent to strip out the Cu2+ toward the FAAS detector.

2.6. Influence of Buffer Solution on Cu2+ Adsorption

The preconcentration of Cu2+ using FIA-FAAS was also studied in the presence and absence of different types of buffer solutions (Tris/Tris-HCl, H2PO4/H2PO42−, and BR) and buffer concentrations (0.01, 0.05, and 0.10 mol L−1) at a flow rate of 7.0 mL min−1 by preconcentrating 14.0 mL of 100.0 μg L−1 Cu2+ solution.

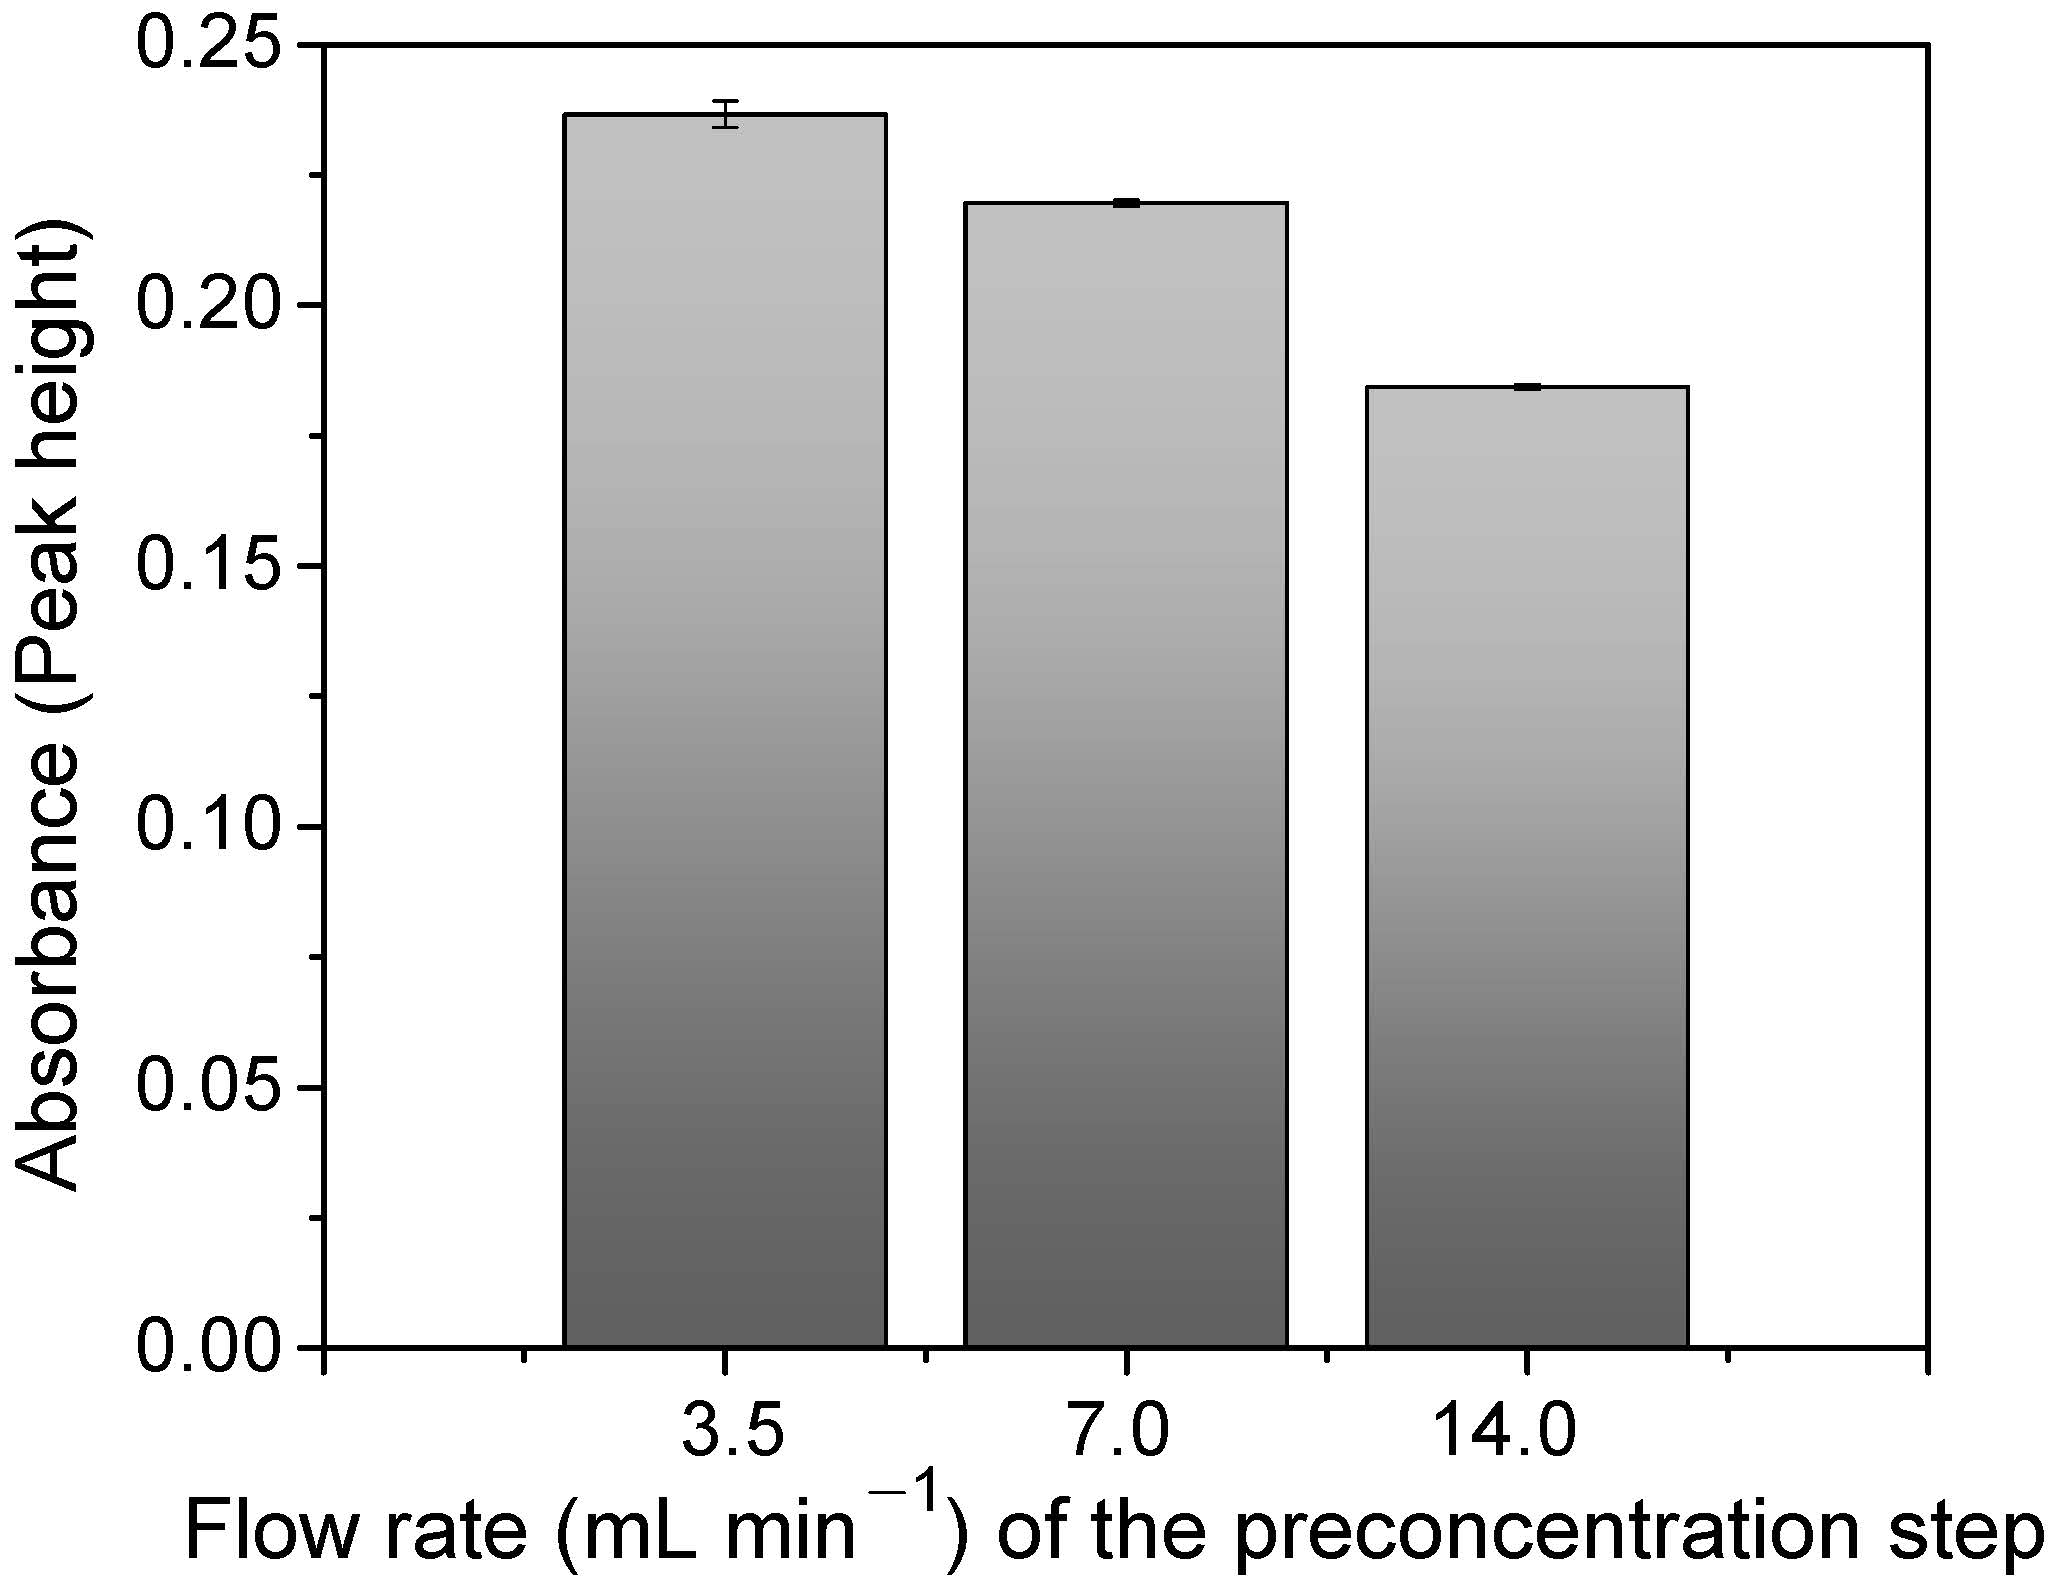
2.7. Influence of Flow Rate on Cu2+ Adsorption

The influence of the sample flow rate on the FIA system was studied in the range of 3.5–14.0 mL min−1 by preconcentrating 14.0 mL of 100.0 μg L−1 Cu2+ solution.

2.8. Evaluation of Exclusion Properties of Macromolecules by Polymer

The exclusion property of macromolecules by the polymer was performed using the BSA (Bovine Serum Albumin) protein and HA (Humic Acid), once these macromolecules were found in the milk and the river and lake water samples, respectively. Thus, 30.0 mL of a 100.0 μg L−1 Cu2+ solution, in the presence of 1.20 g L−1 of BSA solution, at a pH of 6.0, and buffered with 0.05 mol L−1 BR, was percolated through the mini-column at a flow rate of at 14.0 mL min−1. The column effluent from the preconcentration step was collected and analyzed by UV–vis (λmax = 278 nm). The BSA exclusion percentage (n = 3) was calculated from the ratio of the BSA absorbance in the effluent to the absorbance of the original concentration of BSA; this result was multiplied by 100. At the preconcentration step, the elution was carried out using 0.40 mol L−1 of the HCl solution. After the preconcentration/elution step, a 1.00 mol L−1 NaCl solution was percolated through the mini-column to eliminate the residual BSA. This same procedure was employed in 5.0 mg L−1 of the HA solution (λmax = 192 nm).

2.9. Analytical Figures of Merit

Under the optimal conditions of the preconcentration method, the linearity of the analytical curve, limit of detection (LOD), limit of quantification (LOQ), preconcentration factor (PF), concentration efficiency (CE), consumption index (CI), sample throughput (ST), precision, and accuracy were evaluated. The analytical curves with and without the preconcentration step were constructed in the ranges of 2.9–100.0 μg L−1 and 500–3000 μg L−1 of Cu2+ ions at a pH of 6.0 and buffered with 0.05 mol L−1 of BR. Each point of concentration on the analytical curves (with and without the preconcentration step) was carried out in triplicate. The LOD and LOQ were calculated according to IUPAC recommendations [37], using the standard deviation of the analytical blank (n = 10) and the angular coefficient (m) of the analytical curve with the preconcentration step. The preconcentration factor (PF) was determined to be the ratio between the slopes of the analytical curves obtained with and without the preconcentration step. The consumptive index (CI, mL) was estimated by the ratio between the sample volume (30.0 mL) used in the preconcentration step and the PF value, while the concentration efficiency (CE, min−1) was calculated by the ratio between the PF and the preconcentration time (min). The sample throughput ST (h−1) was established as the number of preconcentration/elution cycles carried out per hour.
Inter/intra-day precision was investigated in terms of repeatability as relative standard deviations (RSD) of n = 10 and n = 2 at two concentration levels of Cu2+ ions (50.0 and 100.0 μg L−1), respectively.

2.10. Studies of Interferent Ions in the Cu2+ Ions Preconcentration

In order to check the effect of possible interferent ions on the proposed method, three sets of experiments were carried out under optimized conditions. Firstly, a solution containing 100.0 µg L−1 of Cu2+ ions, in combination with a macronutrient mixture (Ca2+—175,000 µg L−1, Mg2+—450,000 µg L−1, and K+—125,000 µg L−1), was percolated through the mini-column. In the second experiment, a Cu2+ solution at a concentration of 100.0 µg L−1 was preconcentrated in the presence of other metallic ions (Al3+—650.0 µg L−1, Ba2+—250.0 µg L−1, Cd2+—500.0 µg L−1, Co2+—125.0 µg L−1, Pb2+—200.0 µg L−1, Fe2+—5000.0 µg L−1, Mn2+—200 µg L−1, Ni2+—300.0 µg L−1, and Zn2+—350.0 µg L−1) considered to be micronutrients and/or potentially toxic. Finally, a Cu2+ solution at a concentration of 100.0 µg L−1, in the presence of an anion mixture (SO42−—5000.0 µg L−1, PO43−—1000.0 µg L−1, CO32−—1000.0 µg L−1, Cl—150,000 µg L−1, AsO43−—480.0 µg L−1, SeO42−—460.0 µg L−1, and Citrate—300.0 µg L−1), was preconcentrated. Thus, the influence of interfering ions was examined by comparing the analytical signals of a solution containing only Cu2+ ions to the solutions containing Cu2+ ions in addition to a mixture of other metallic ions or anions.
The interfering ions and their respective concentrations were adopted based on other work previously published by our research group [38,39] and the CONAMA 357 (2005)—Brazil [9].

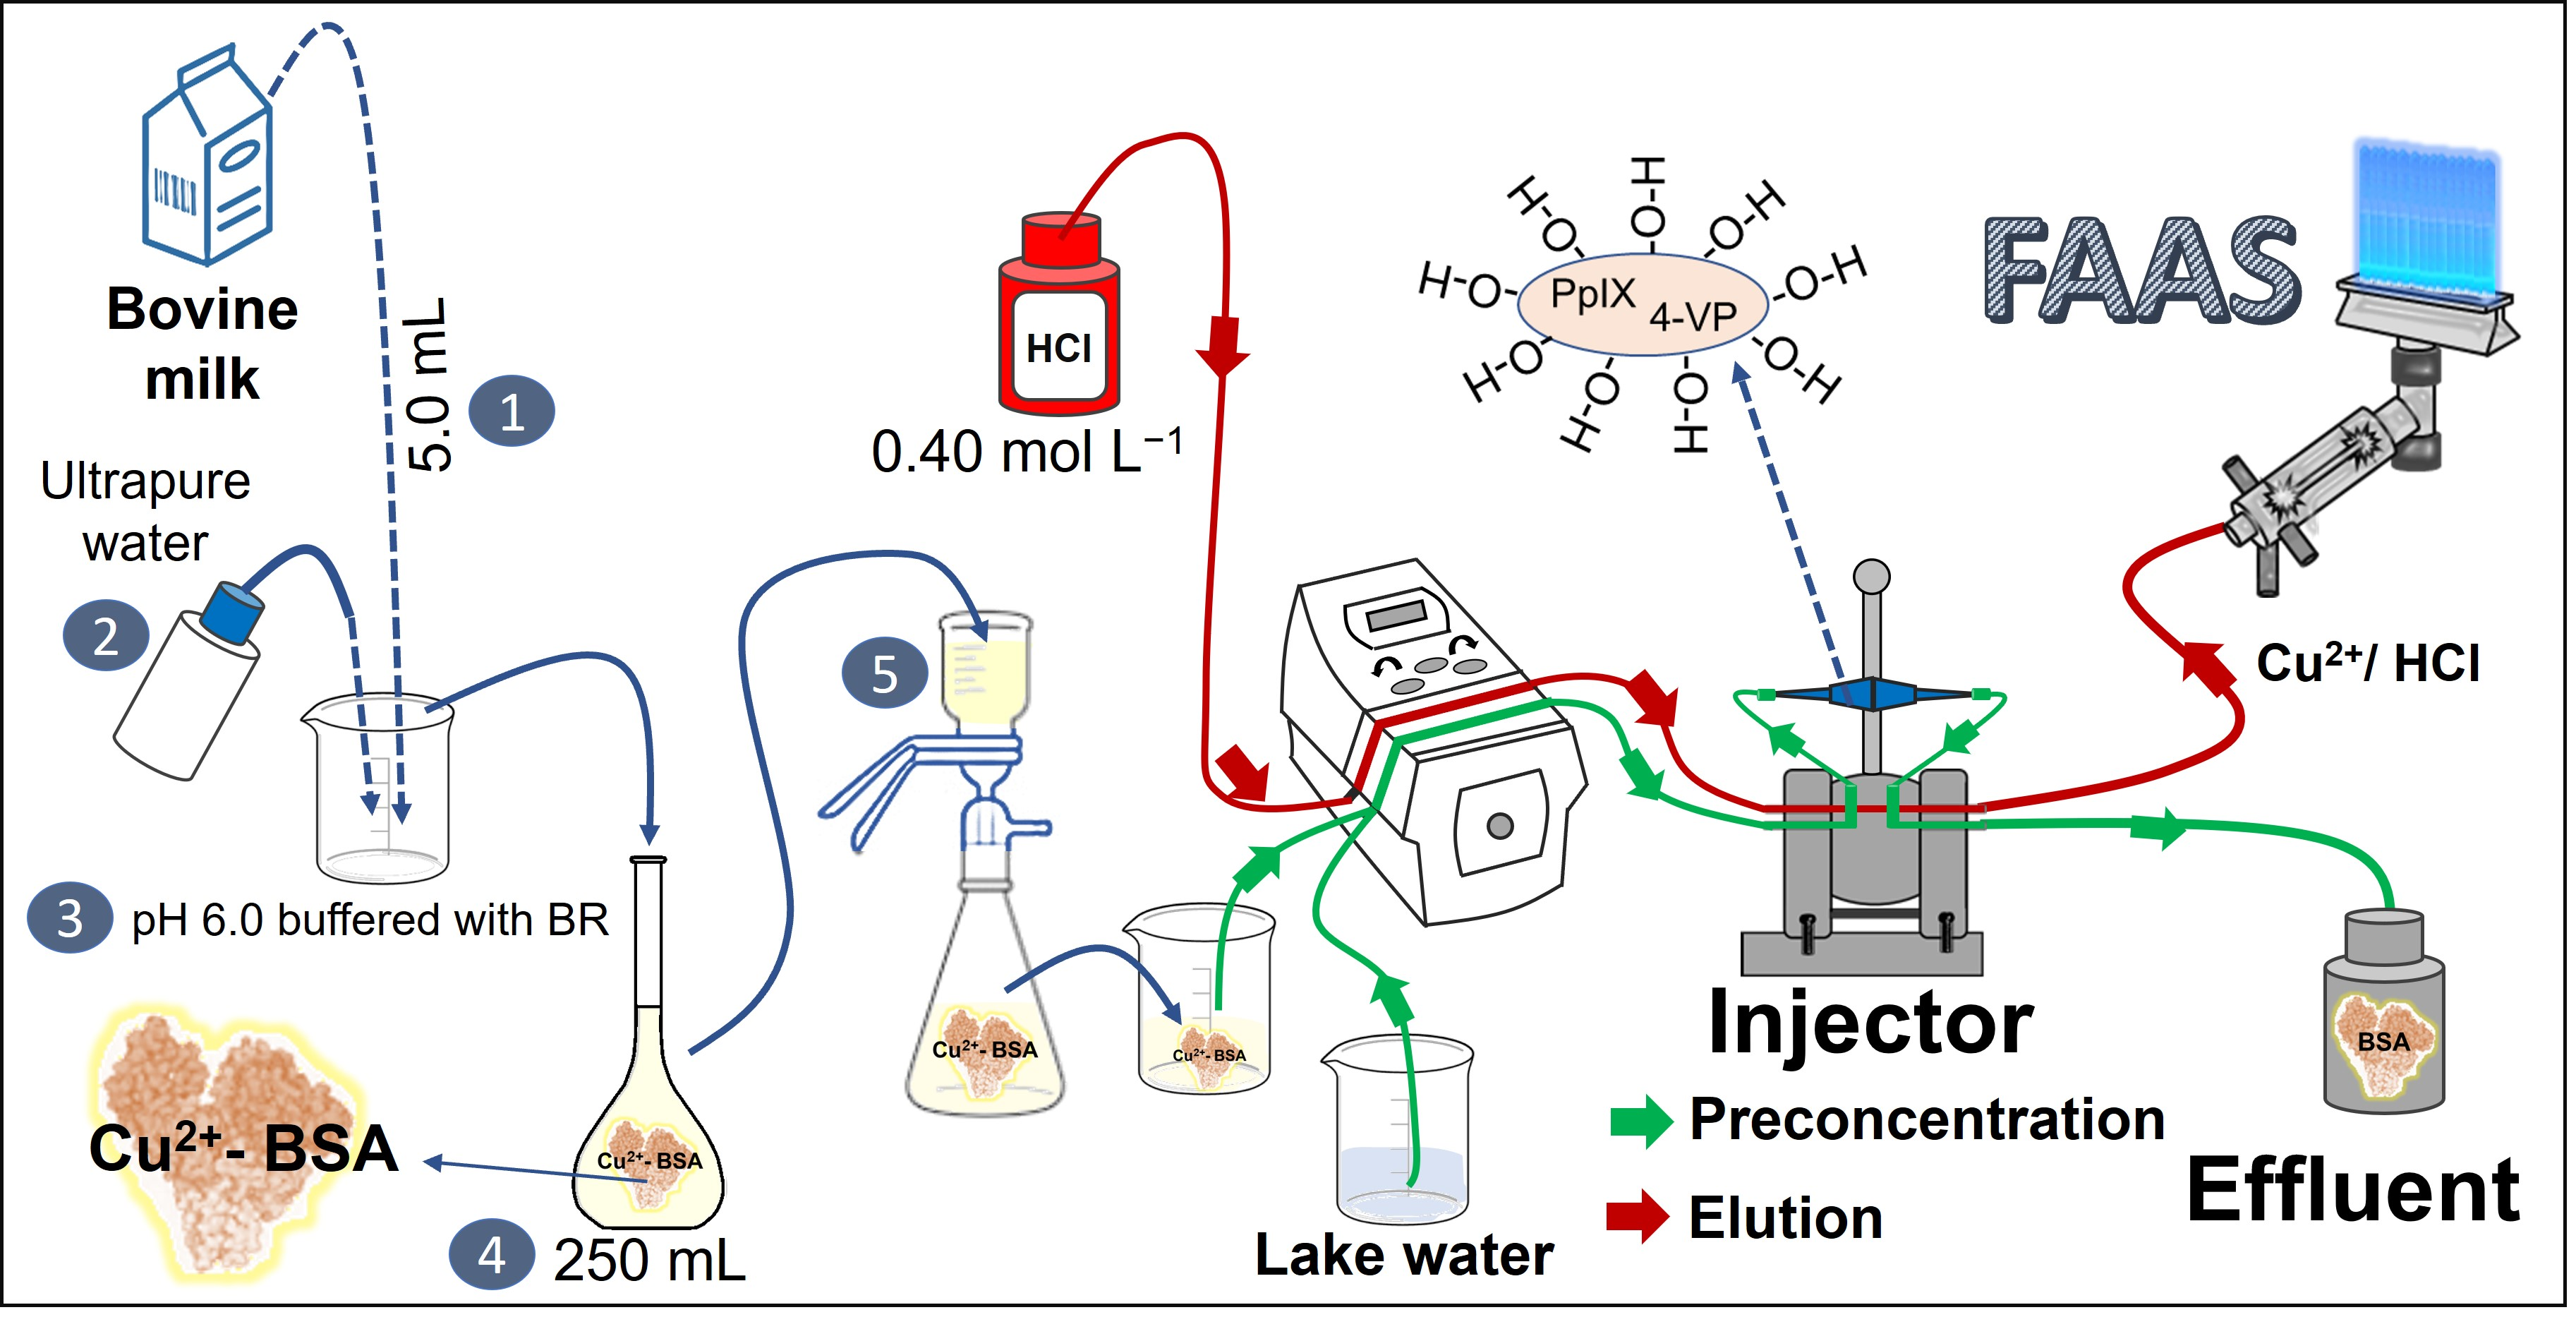
2.11. Accuracy and Analytical Application

The accuracy of this method was assessed using addition/recovery tests of 50.0 and 100.0 µg kg−1 Cu2+ in bovine milk samples and water samples. For the milk samples, the results were also compared to microwave-assisted acid digestion.
Three water samples were collected at three points of Igapó Lake, in the city of Londrina (PR-Brazil), which were acidified until they reached a pH of 2.0. They were then filtered through a 0.45 μm cellulose acetate membrane before use. These samples were named S1 (23°19′18.4″ S–51°10′54.7″ W), S2 (23°19′14.7″ S–51°10′55.0″ W), and S3 (23°19′16.5″ S–51°10′56.4″ W).
Two bovine milk samples (trademarks) were purchased at a local supermarket. They were named S4 and S5. These samples were pretreated by microwave-assisted acid digestion [39]. The same samples were also pretreated through only pH adjustment (pH 6.0) and filtration. This minimal sample pretreatment was carried out by mixing 5.0 mL of the bovine milk sample with 200 mL of ultrapure water in a beaker. The pH was adjusted to 6.0, and the final volume was increased to 250.0 mL. Afterward, this milk solution was filtered using a 0.45 μm cellulose acetate membrane.
All samples (water and bovine milk) had their pH adjusted with 0.05 mol L−1 of BR prior to analysis by the FIA-FAAS system. Analytical blanks were also used.

3. Results

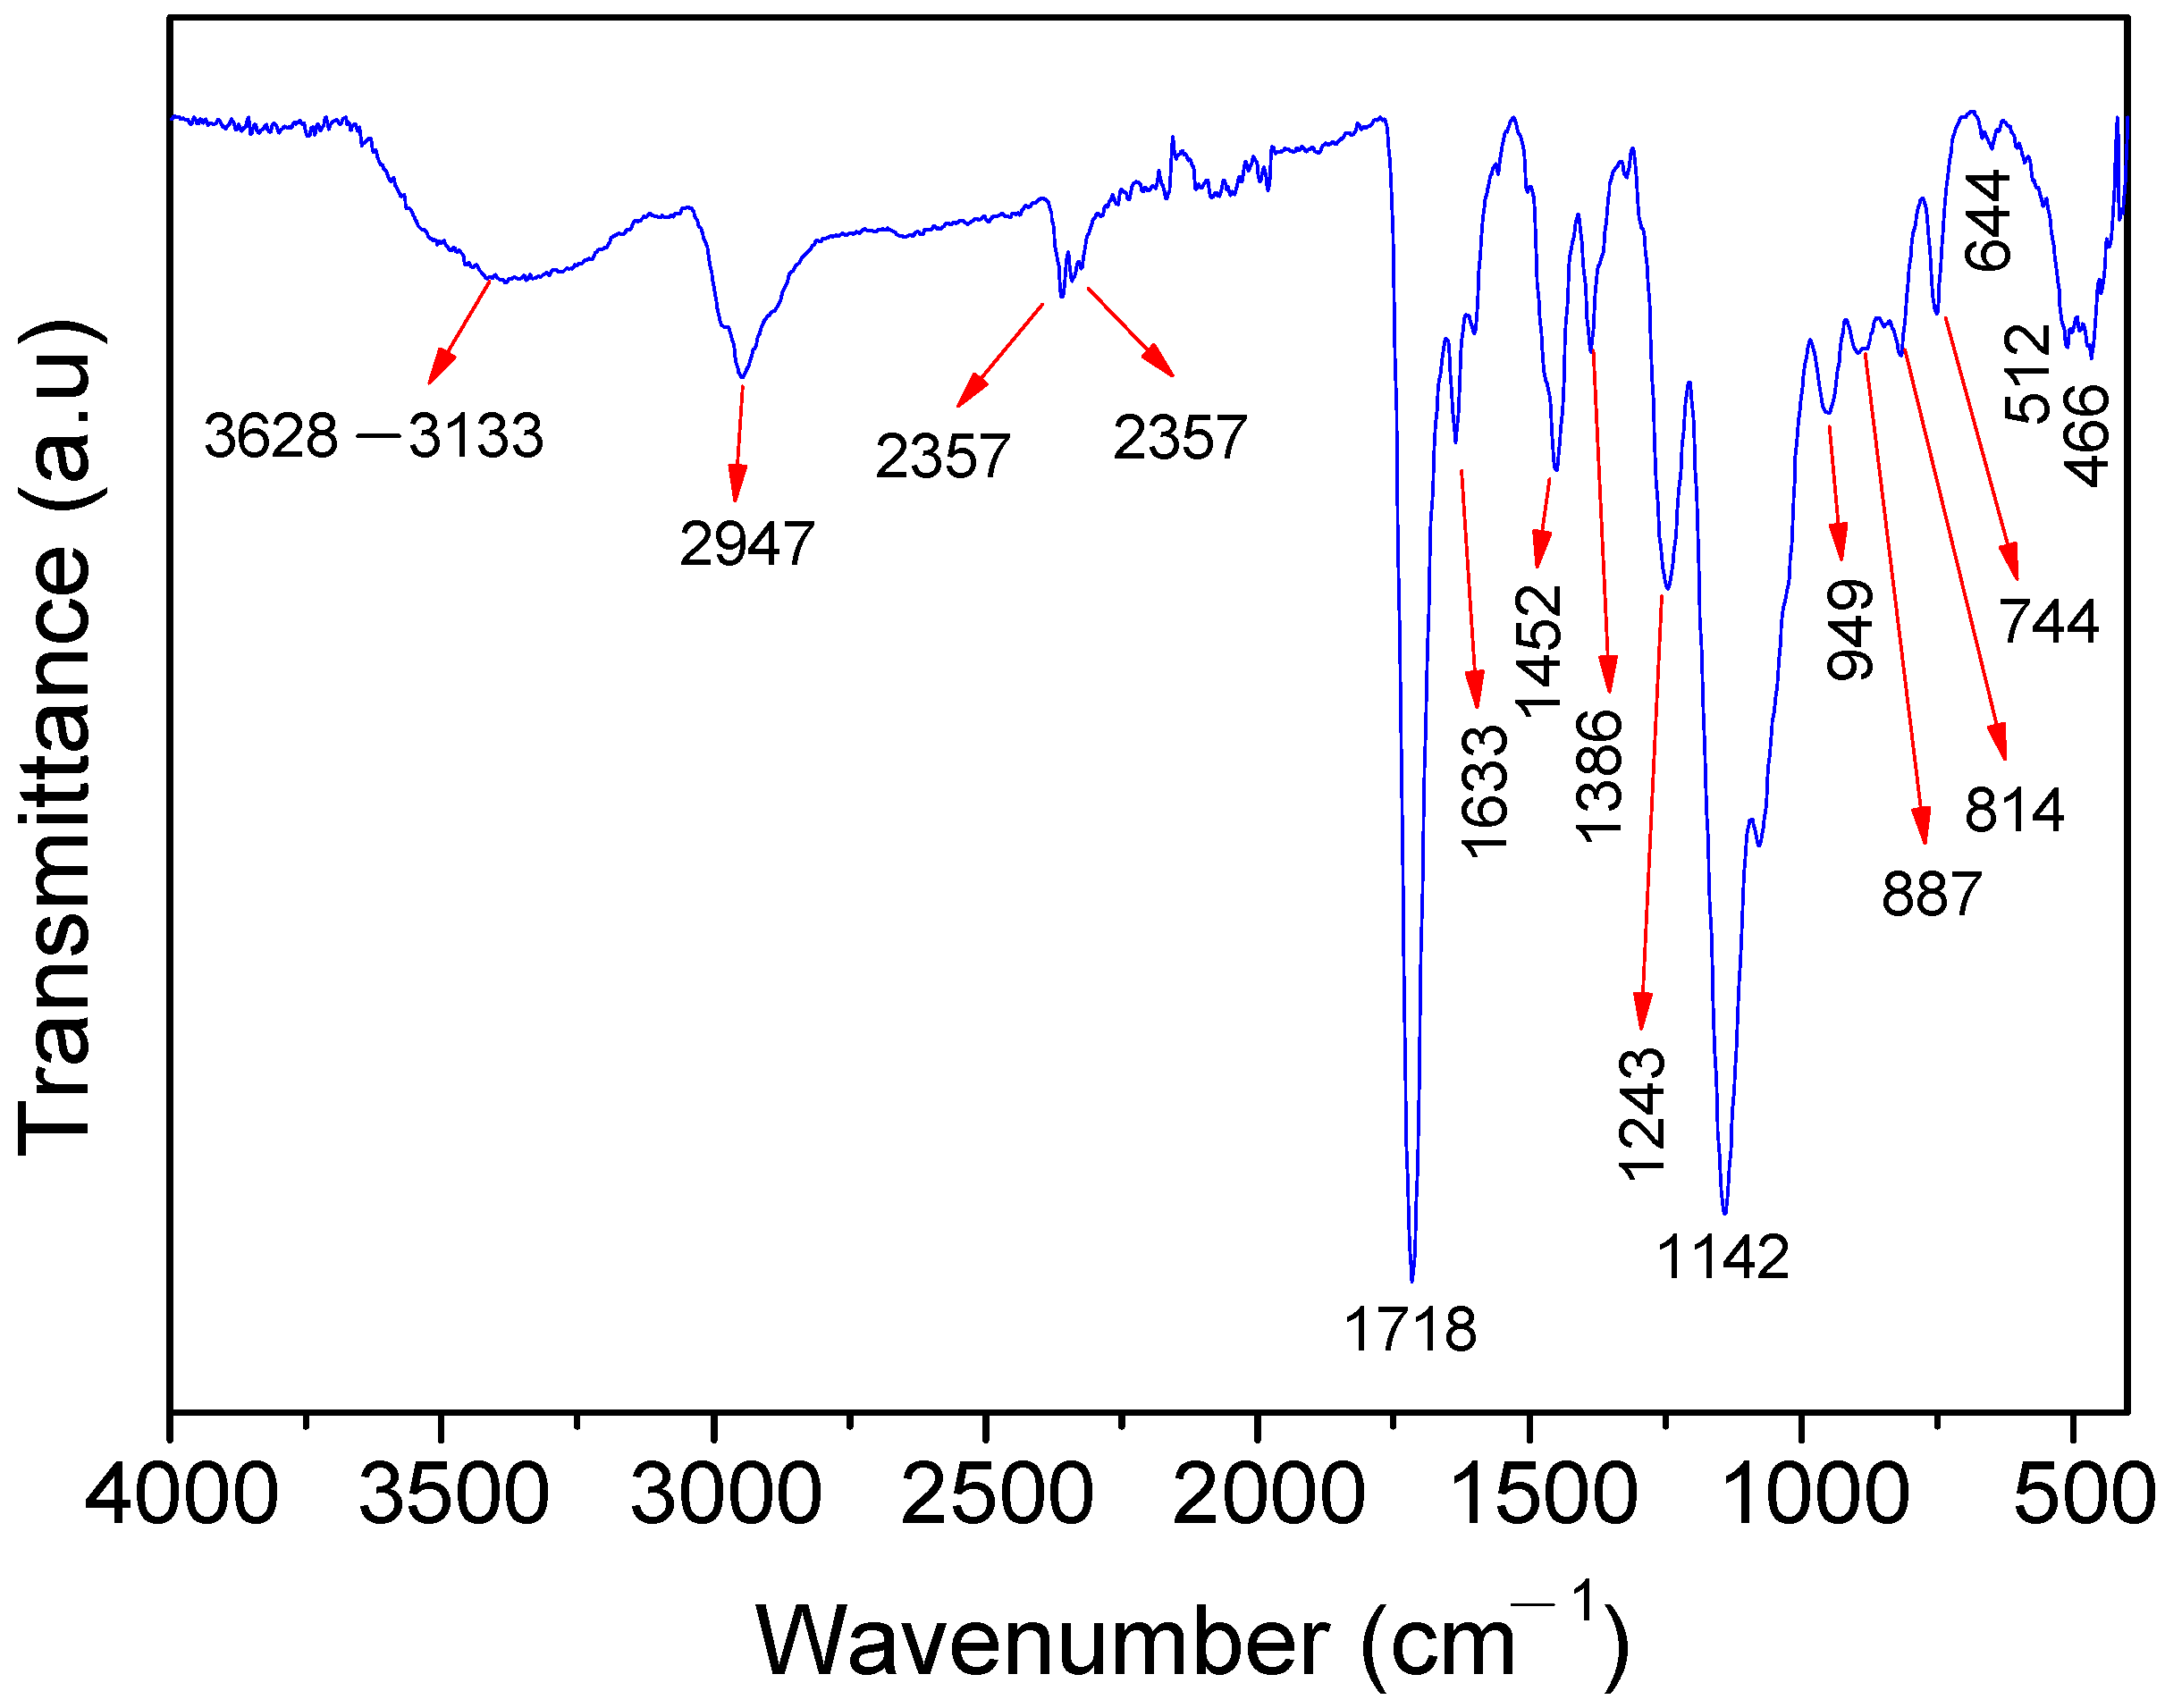
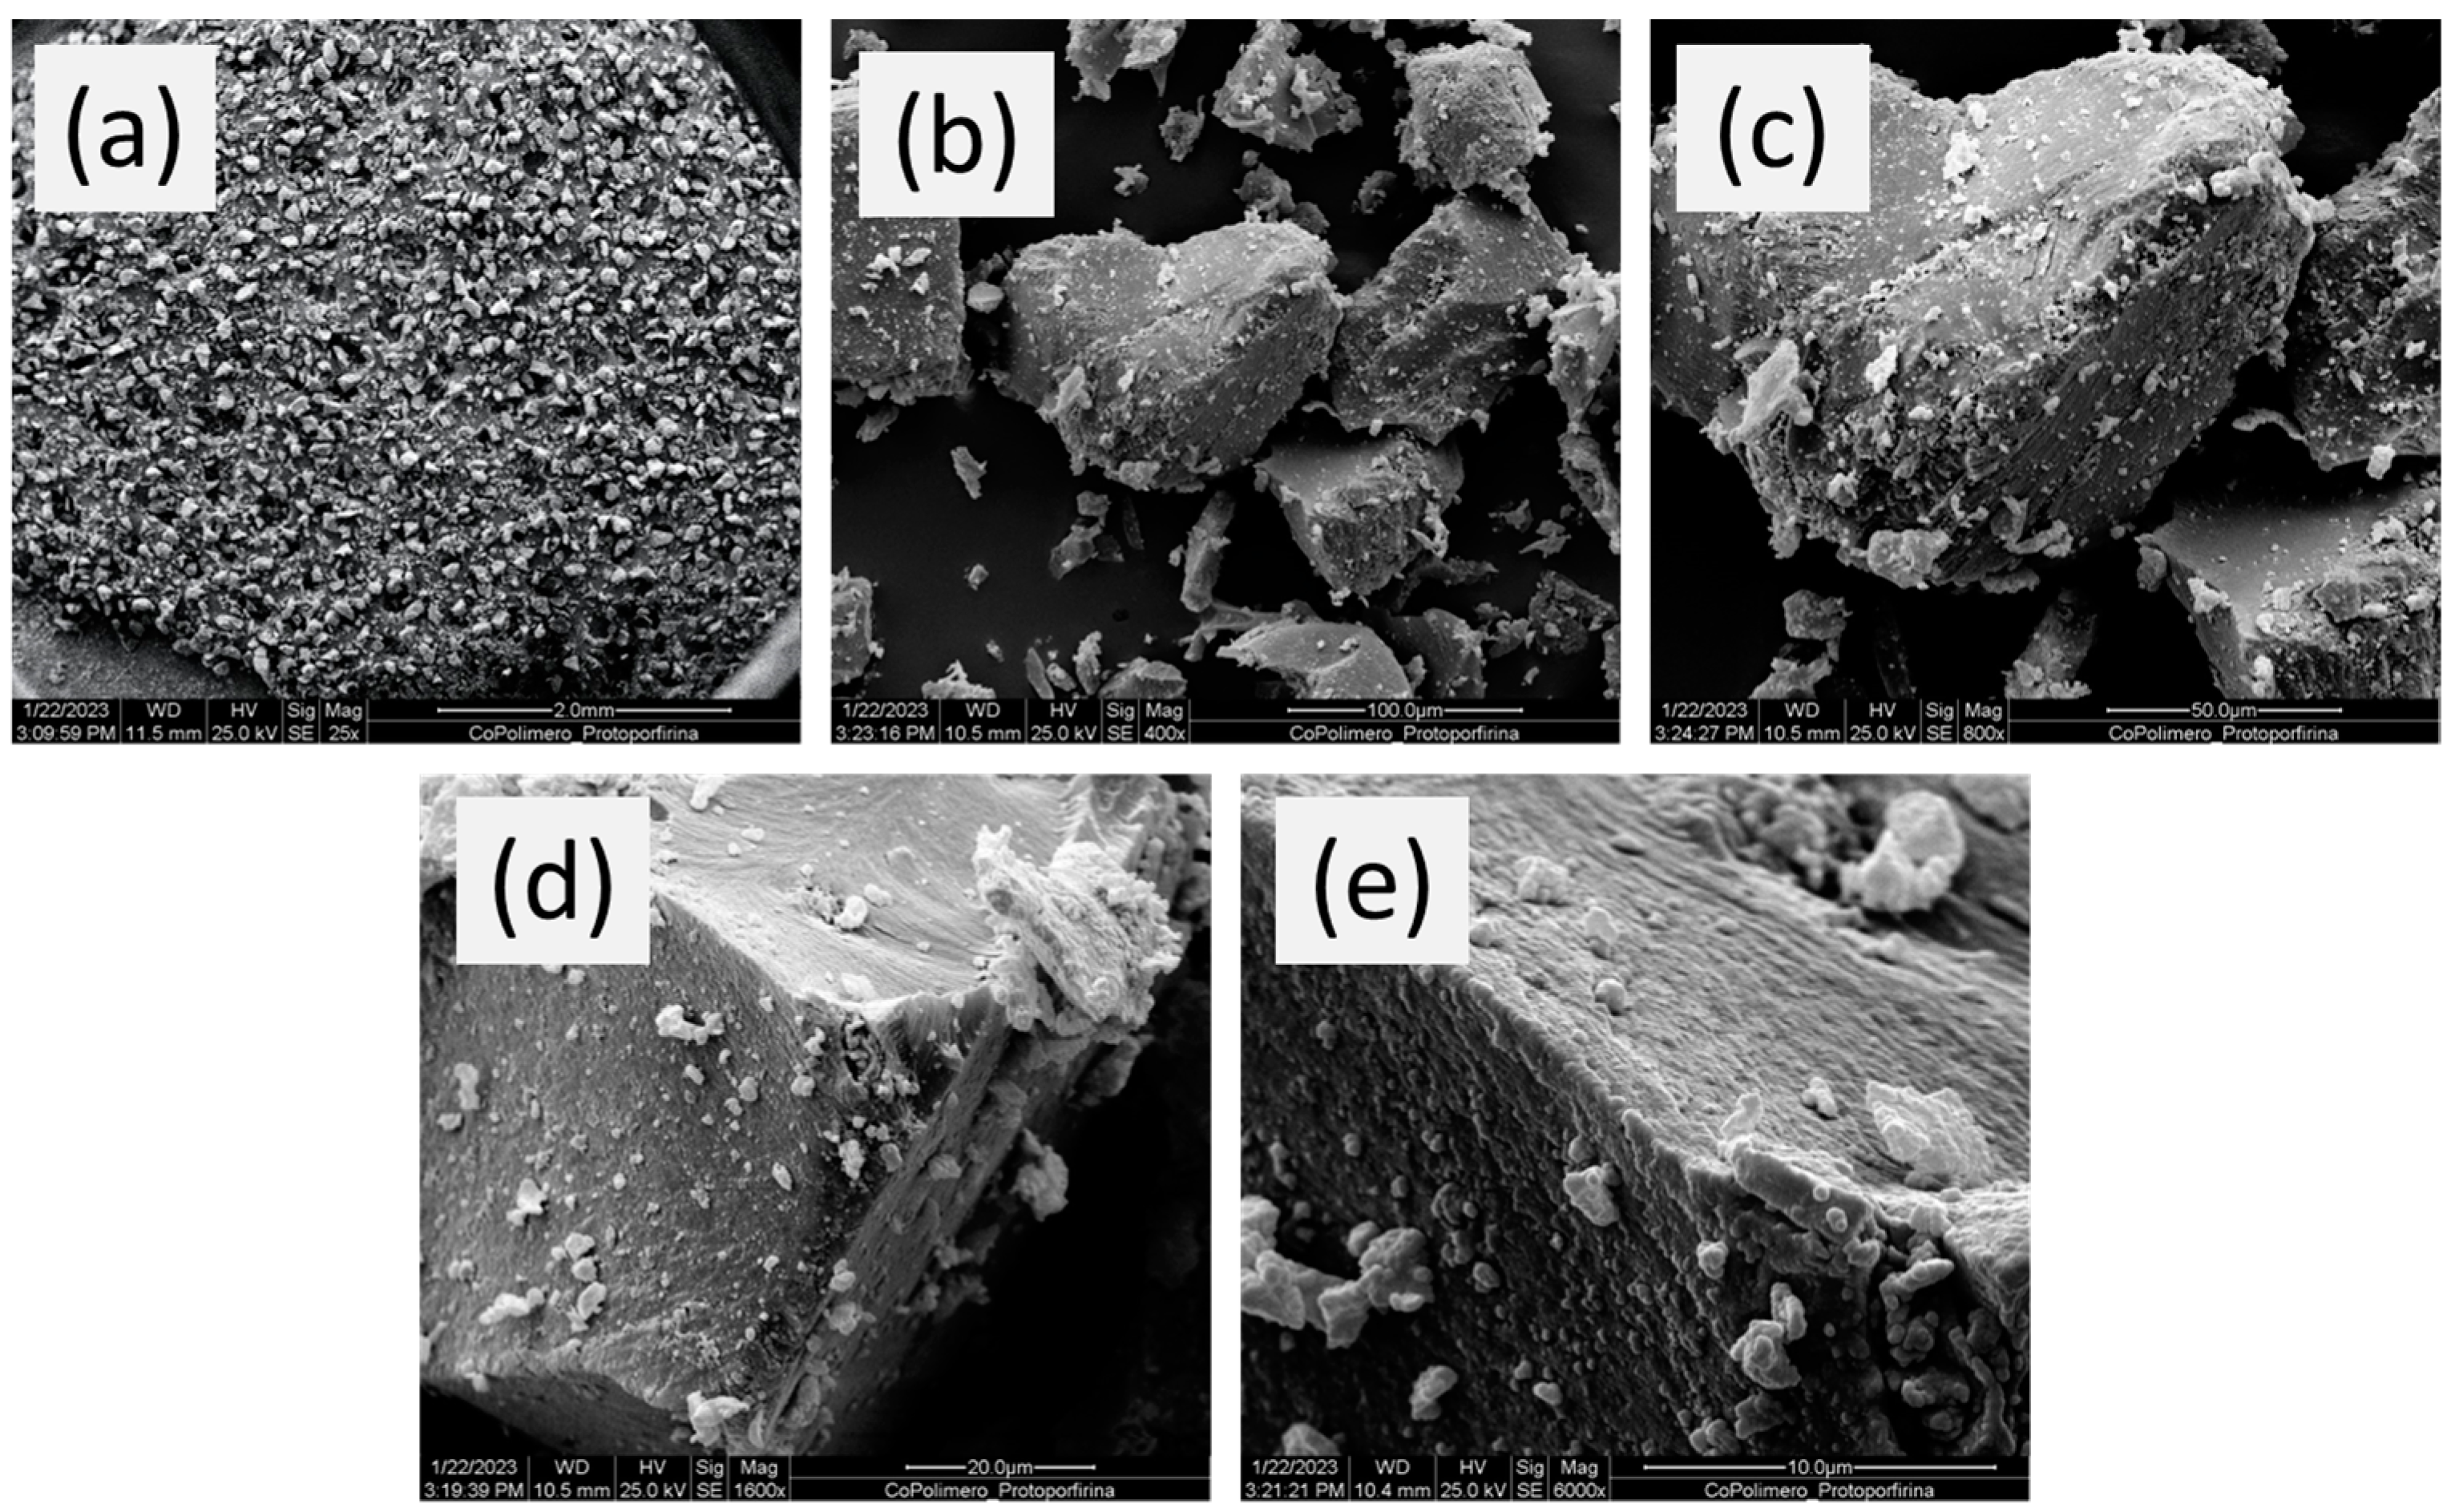
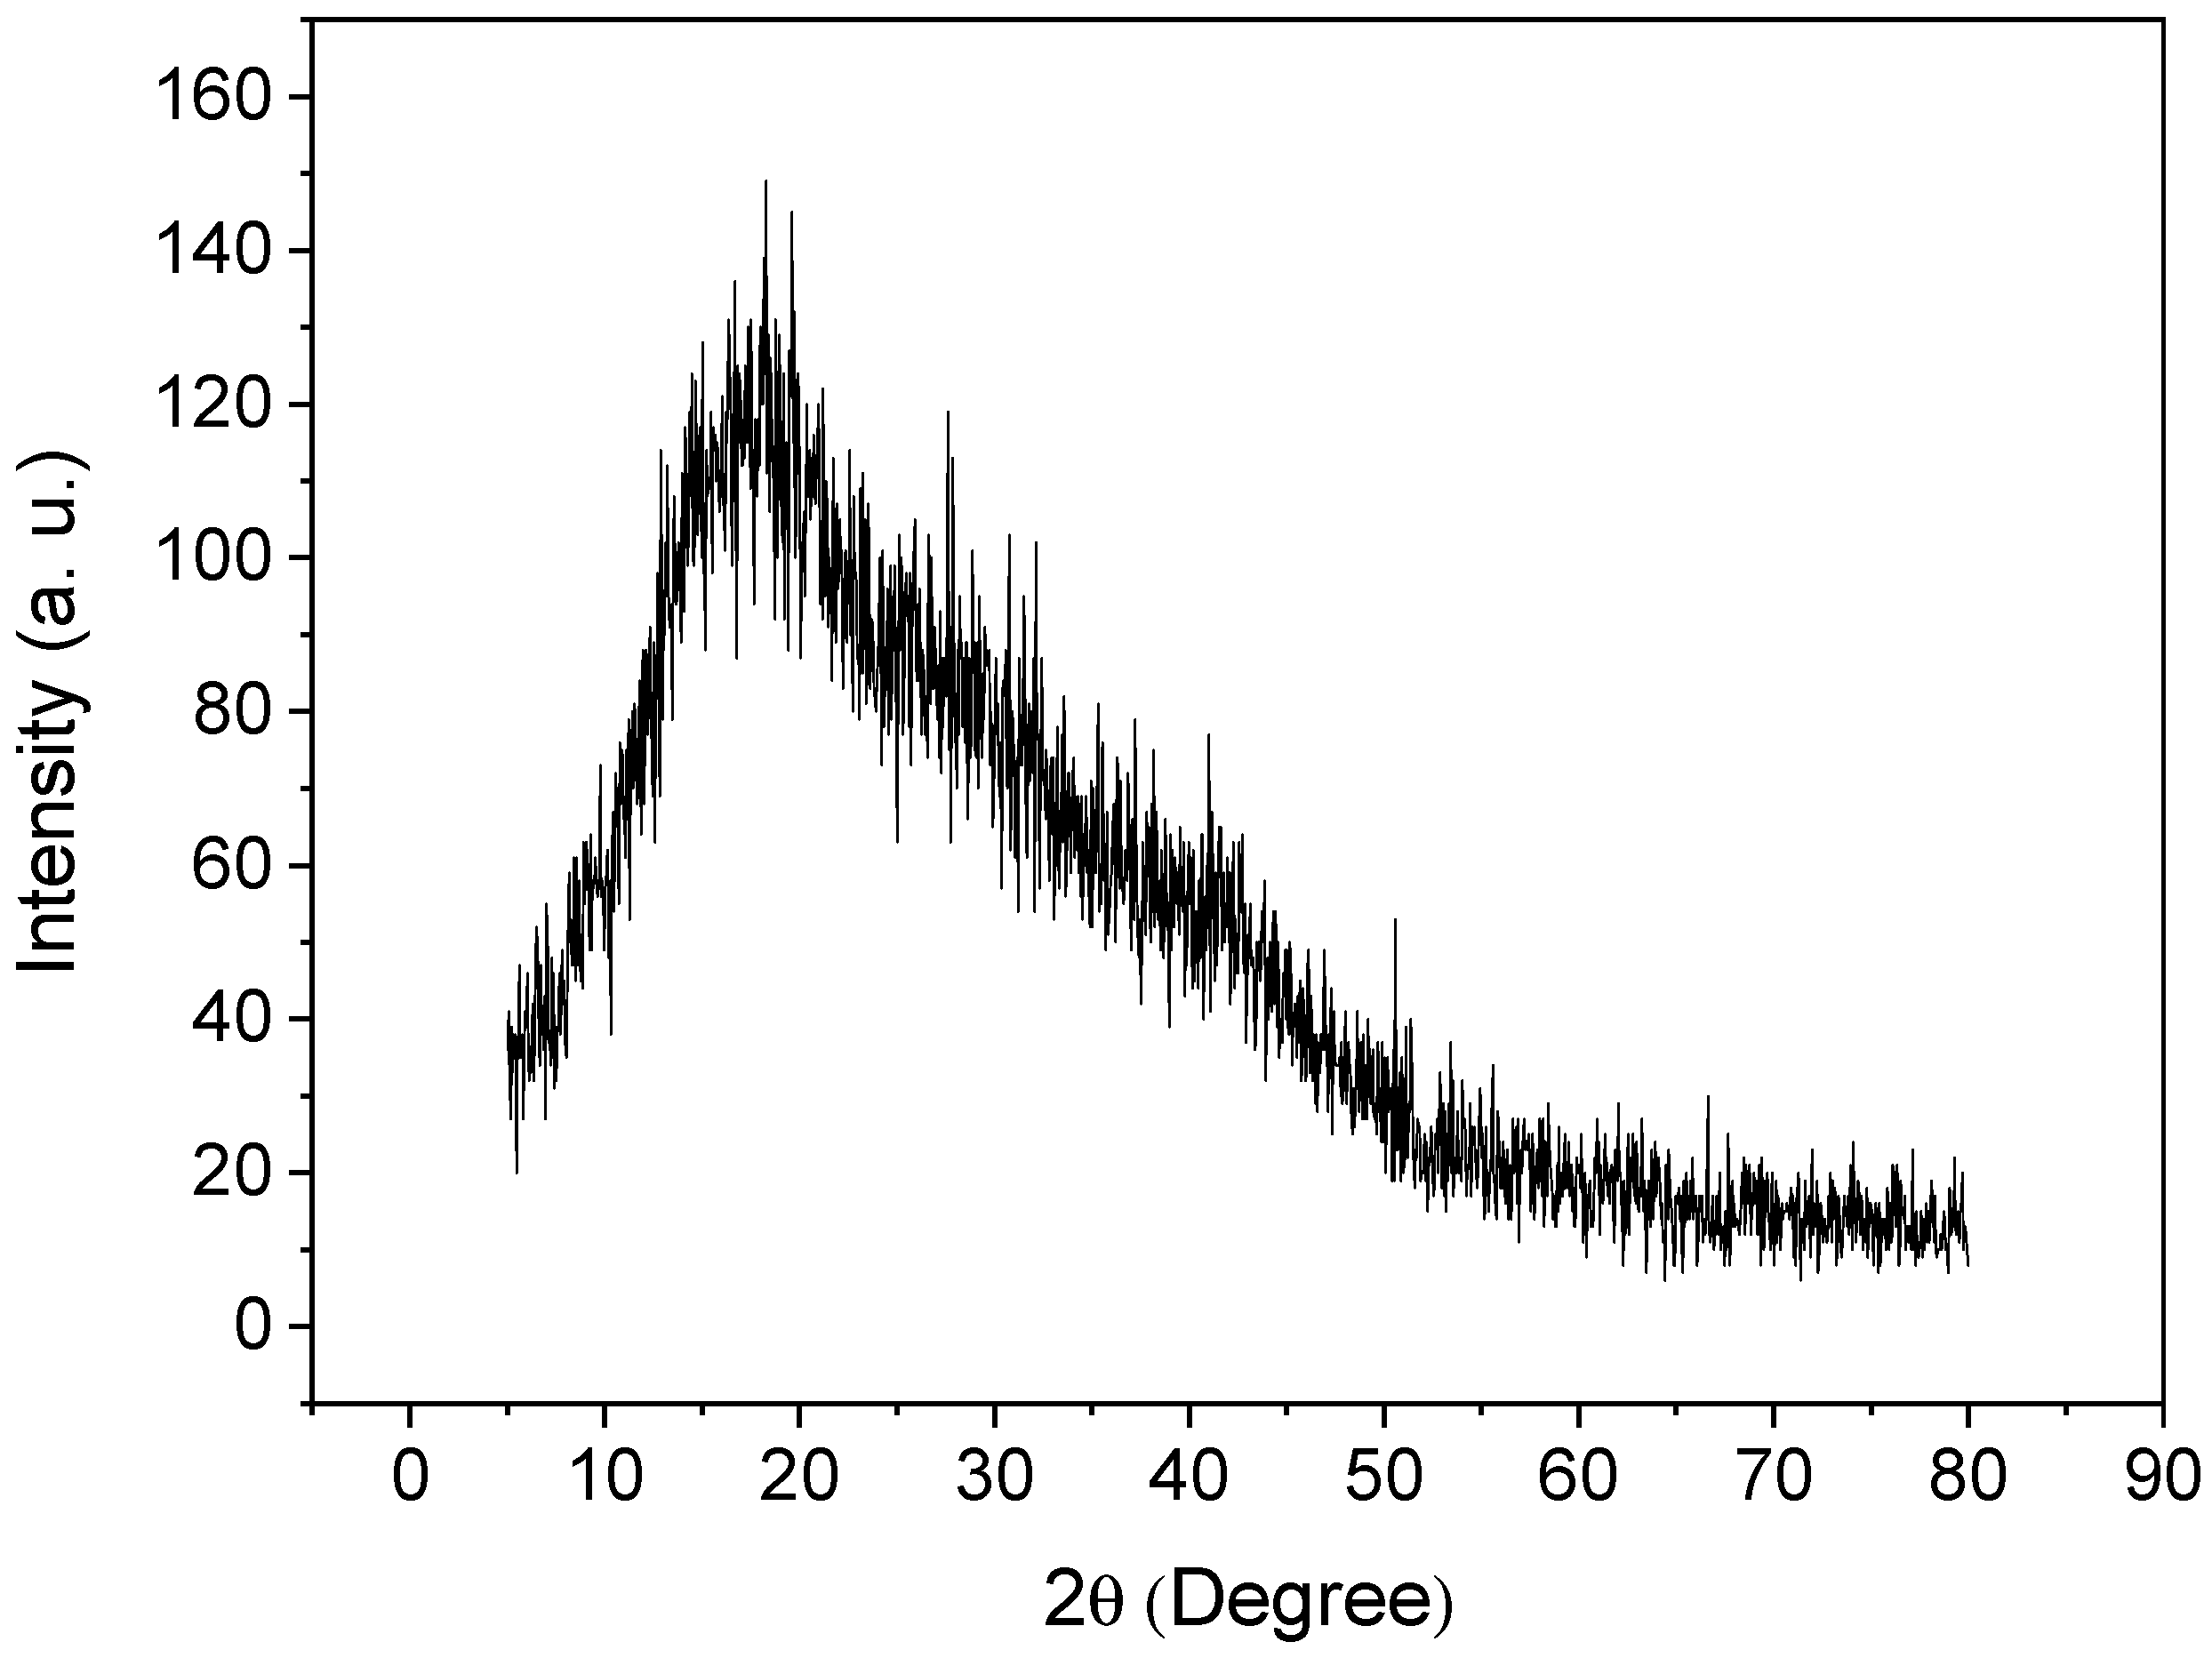
3.1. Characterized by FT-IR, SEM, and XRD

In Figure 2, the band around 3628 and 3133 cm−1 corresponds to the typical O-H and N-H stretching vibration [40,41]. The O-H group is present in the structure of the HEMA and in the physically adsorbed water, which attributes to the hydrophilic properties of the polymer. This, in turn, favors the exclusion of the macromolecules and the retention of the Cu2+ ions on the polymer surface. The N-H bond is present in the 4-PpIX structure. The band at 2947 cm−1 is attributed to the C-H asymmetric stretching of -CH2- and -CH3 from the PpIX, HEMA, and EGDMA [42]. The signals at 2357, 2333, and 644 cm−1 are assigned to the stretching vibration of the O=C-O bond present in the HEMA and EGDMA structures [43], whereas the intense absorption centered at 1718 cm−1 refers to the carbonyl groups’ (-C=O) stretching vibrations from the EGDMA, HEMA, and PpIX. The band at 1633 cm−1 can be attributed to the residual vinyl groups (CH2=CH-, asymmetric stretching) from the PpIX, HEMA, EGDMA, and 4-VP. This band also can be overlapped with the O-H bending vibration of the adsorbed water molecules [44]. The band at 1602 cm−1 corresponds to the C=C stretching and the C=N stretching of the 4-VP and PpIX ring [21,43]. The absorption bands at 1452 and 1386 cm−1 are due to the angular deformation of the -CH3 group [45], while the signals at 1243 and 1142 (band intensity) cm−1 are ascribed to the O-C(O)-C stretching vibration from the PpIX, HEMA, and EGDMA [46]. The bands around 1076, 512, and 466 cm−1 are attributed to the C-N stretching vibration [47]. Bands at 949, 887, 814, and 744 cm−1 refer to the bending out-of-plane (rocking and twisting) of the RCH=CH2 and aromatic hydrogen (Ar-H, rocking) from the PpIX and 4-VP [41].
The FT-IR spectra profile of the polymer confirms the successful polymerization, and that the Cu2+ ions (borderline acid) are capable of interacting spontaneously with the polymer through its different functional groups, classified as hard (-OH), borderline (Ar-NH), and soft (C=O, C=N, and C=C) bases, according to the hard–soft, acid–base classification of metal ions and ligands of Pearson [48].
Figure 3 shows the SEM images of the polymer. As one can see, irregular particles in both size and shape (non-spherical particles) are observed, which is typical of bulk polymerization in which the polymer was ground after synthesis. It is worth emphasizing that such a morphological feature is not a disadvantage in the FIA-FAAS use of the mini-column once the system is operated under low pressure. The images of the particles also reveal a rough surface, which might favor the mass transport of Cu2+ ions from the solution to the inner surface of the porous particles [49].
An X-ray diffractogram of poly(protoporphyrin-co-vinyl pyridine) is shown in Figure 4. As can be observed, the presence of one halo at 2θ = 17° indicates the lack of crystallinity of the polymer, as expected, and the amorphous structure of the material [49,50,51].

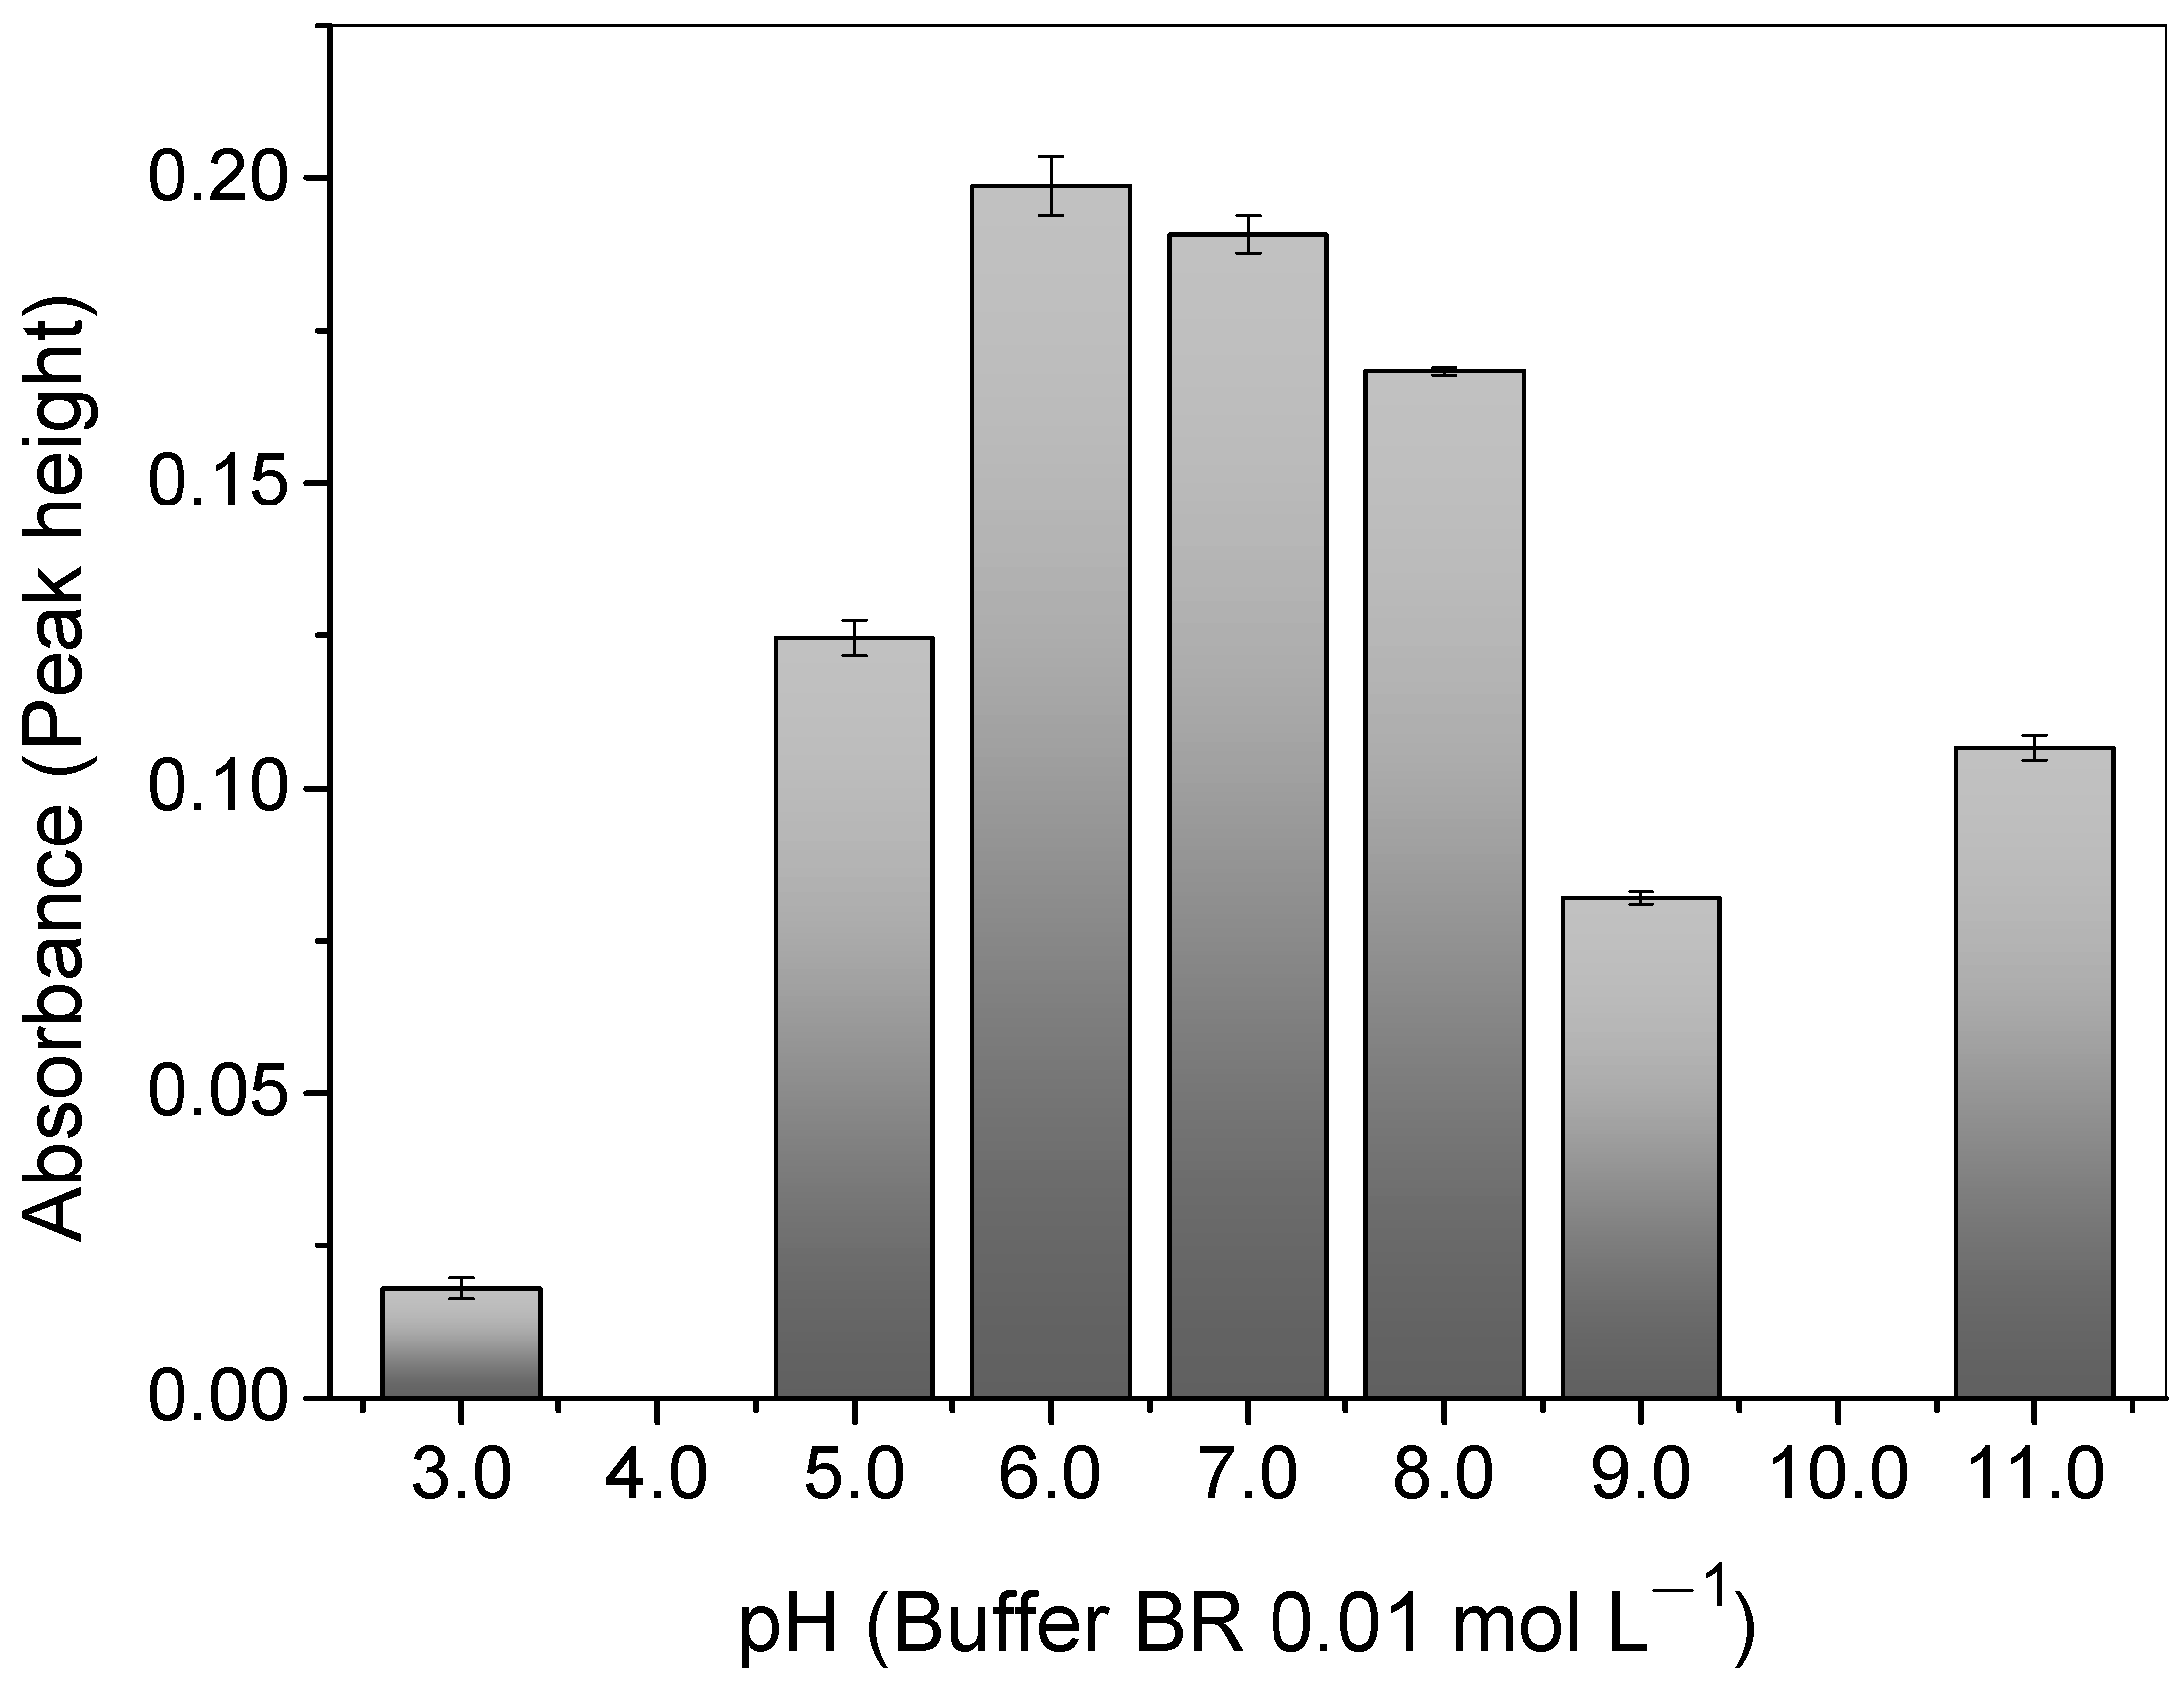
3.2. pH Effect on Cu2+ Adsorption

As can be seen in Figure 5, the pH plays an important role in the adsorption of Cu2+ ions onto the polymer once the pH value affects the chemical speciation of the 4-VP monomer present in the polymer surface and the copper in the solution. A relatively high adsorption of the copper was observed at a pH of 6.0, when the solution was buffered with 0.01 mol L−1 of BR. Such an outcome can be rationalized, bearing in mind that the N atom on the 4-VP ring (pka 5.62) is mostly deprotonated and has one lone electron pair available (σ-donor ability) [52] for the attraction of the Cu2+ ions through electrostatic interactions; this is the main chemical species at the mentioned pH [53].
The adsorption of the copper ions decreased at pH values below 6.0. This was because the N atom on the pyridine ring was protonated and loaded with a positive charge, generating a repulsion with the Cu2+ ions, which also had the same charge [52]. Similarly, under higher pH values, copper begins to form negative species, such as [Cu(OH)3 and Cu(OH)42−]) and precipitates of Cu(OH)2 (Kps = 4.8 × 10⁻²⁰) in the solution [36,53]. Therefore, the optimal pH value adopted was 6.0.

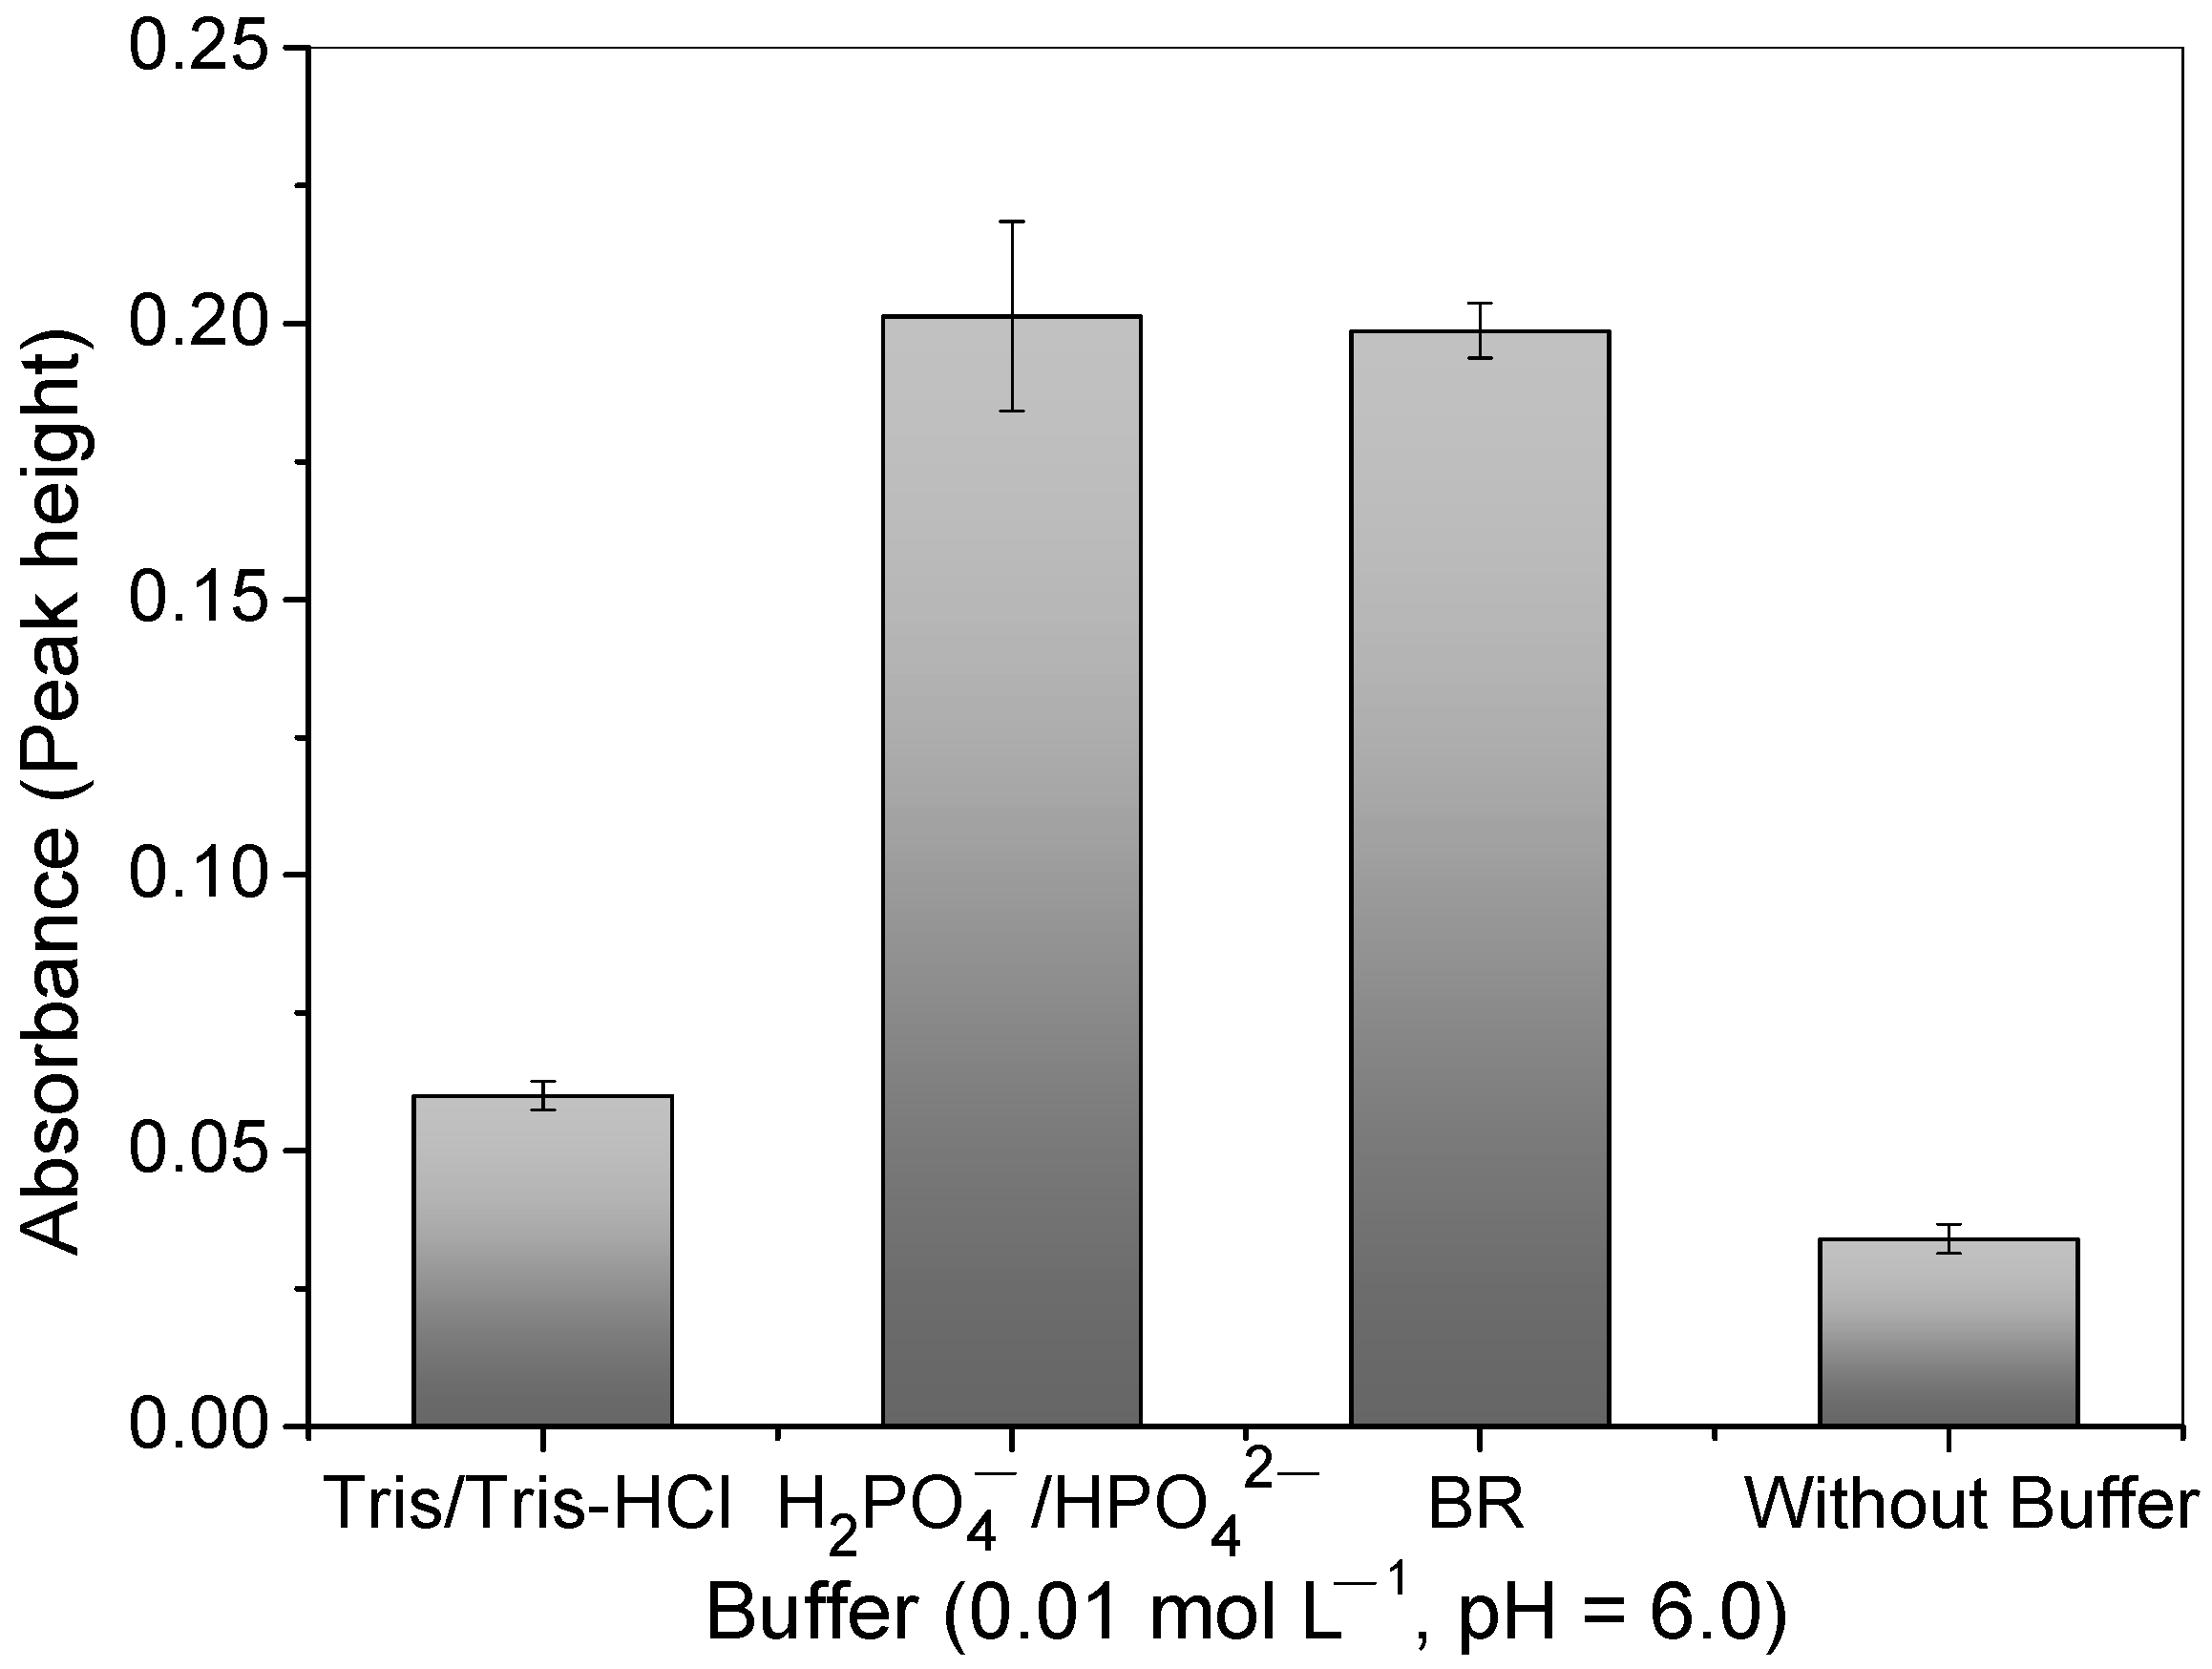
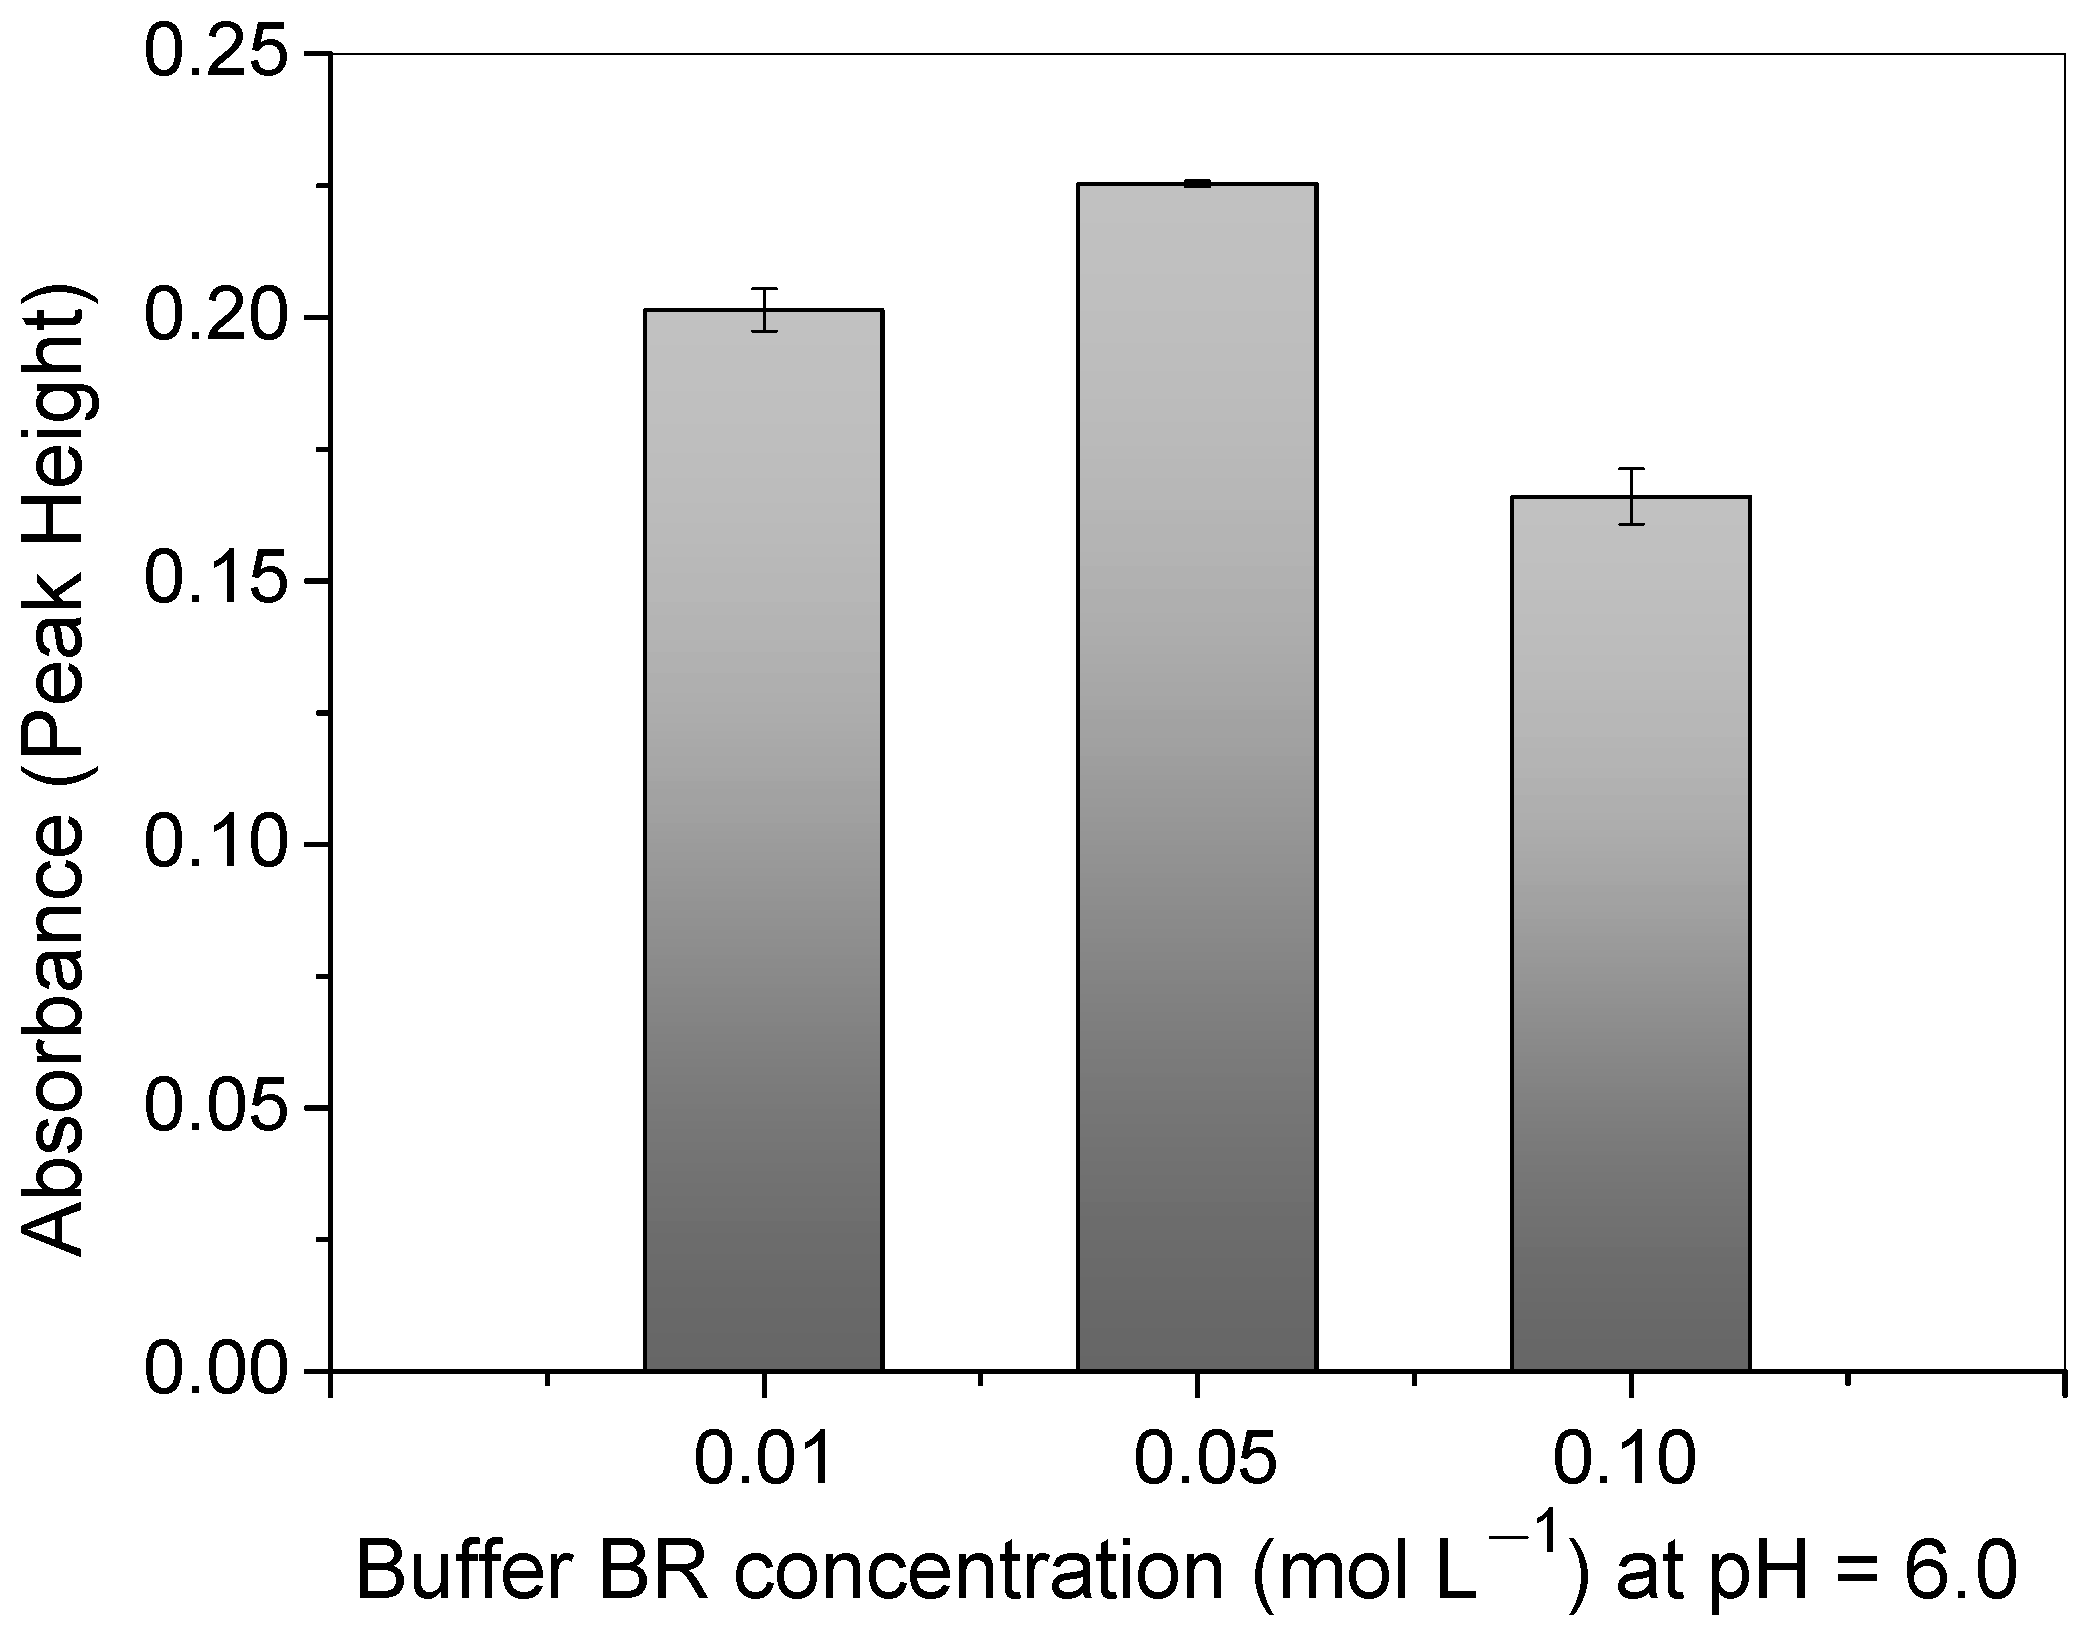
3.3. Influence of Buffer Solutions on Cu2+ Adsorption

After establishing the optimal pH for copper adsorption, the influence of different types of buffer solutions was investigated. Figure 6 illustrates that the presence of buffer solutions increased the Cu2+ ions’ adsorption, particularly with the H2PO4/H2PO42− and BR buffers. However, the precision of measurements was lower when using a phosphate buffer. Thus, the BR buffer provided a better buffer capacity and pH stability during the preconcentration step, accentuating the copper charge [Cu(H2O)6]2+ and electroneutrality of the N atom of 4-VP at a pH value of 6.0. In the absence of the buffer solution, it should be stressed that, as the elution was carried out by using 1.50 mol L−1 of HCl, residual acid existed in the mini-column; this significantly decreases the pH of the sample without using a buffer solution.
The low analytical signal for Cu2+ ions using the Tris/Tris-HCl buffer can be explained by the molecular structure of Tris(hydroxymethyl)aminomethane-HCl, which has three hydroxyl groups that can compete with the polymer when interacting with the Cu2+ ions, leading to less interaction between the Cu2+ and the polymer.
Regarding the BR buffer concentration in the solution, the difference in the absorbance signal between 0.01 and 0.05 mol L−1 was approximately 10.6 %, as can be observed in Figure 7. This confirms that the buffering capacity was better when higher concentrations of buffer were used. Thus, a concentration of 0.05 mol L−1 was selected for further experiments in this work. The analytical signal greatly decreased above the concentration of 0.05 mol L−1. This was most likely due to the great number of molecules which might interact with the copper ions and the surface of the polymer, hindering the adsorption process.

3.4. Influence of Flow Rate, Eluent Concentration, and Sample Volume on Cu2+ Adsorption

The flow rate in the FIA-FAAS system is a very important parameter to optimize when kinetics exerts an effect on adsorption. As is illustrated in Figure 8, the adsorption increased with the lowest flow rate (3.5 mL min−1), suggesting a slow kinetic for the mass transfer of Cu2+ ions toward the polymer surface. Thus, the slower the flow rate, the longer the contact time (4 min) and the Cu2+–polymer interaction.
On the other hand, a high flow rate (14.0 mL min−1) decreased the interaction between the Cu2+ ions and the polymer. However, this difference was found to be only 22.1%, which can be considered a low value in detriment to the improvements on the sample throughput obtained by using the highest flow rate (Section 3.6). Thus, 14.0 mL min−1 was chosen as the optimum flow rate value for the preconcentration method.
The eluent concentration (0.30–1.50 mol L−1 of HCl) and the sample volume (14.0 and 30.0 mL of 100.0 μg L−1 Cu2+ buffered with 0.01 mol L−1 of BR) were also investigated. According to the results, the optimum values for the eluent concentration and sample volume were found to be 0.40 mol L−1 and 30.0 mL, respectively. It was observed that 0.40 mol L−1 of HCl, despite being a low concentration, was sufficient for the quantitative removal of Cu2+ ions from the polymer without memory effect, and at the increase of the sample volume from 14.0 to 30.0 mL, the analytical signal was increased by 48.1%. Therefore, 0.40 mol L−1 of HCl and a sample volume of 30.0 mL were chosen as the optimum conditions.

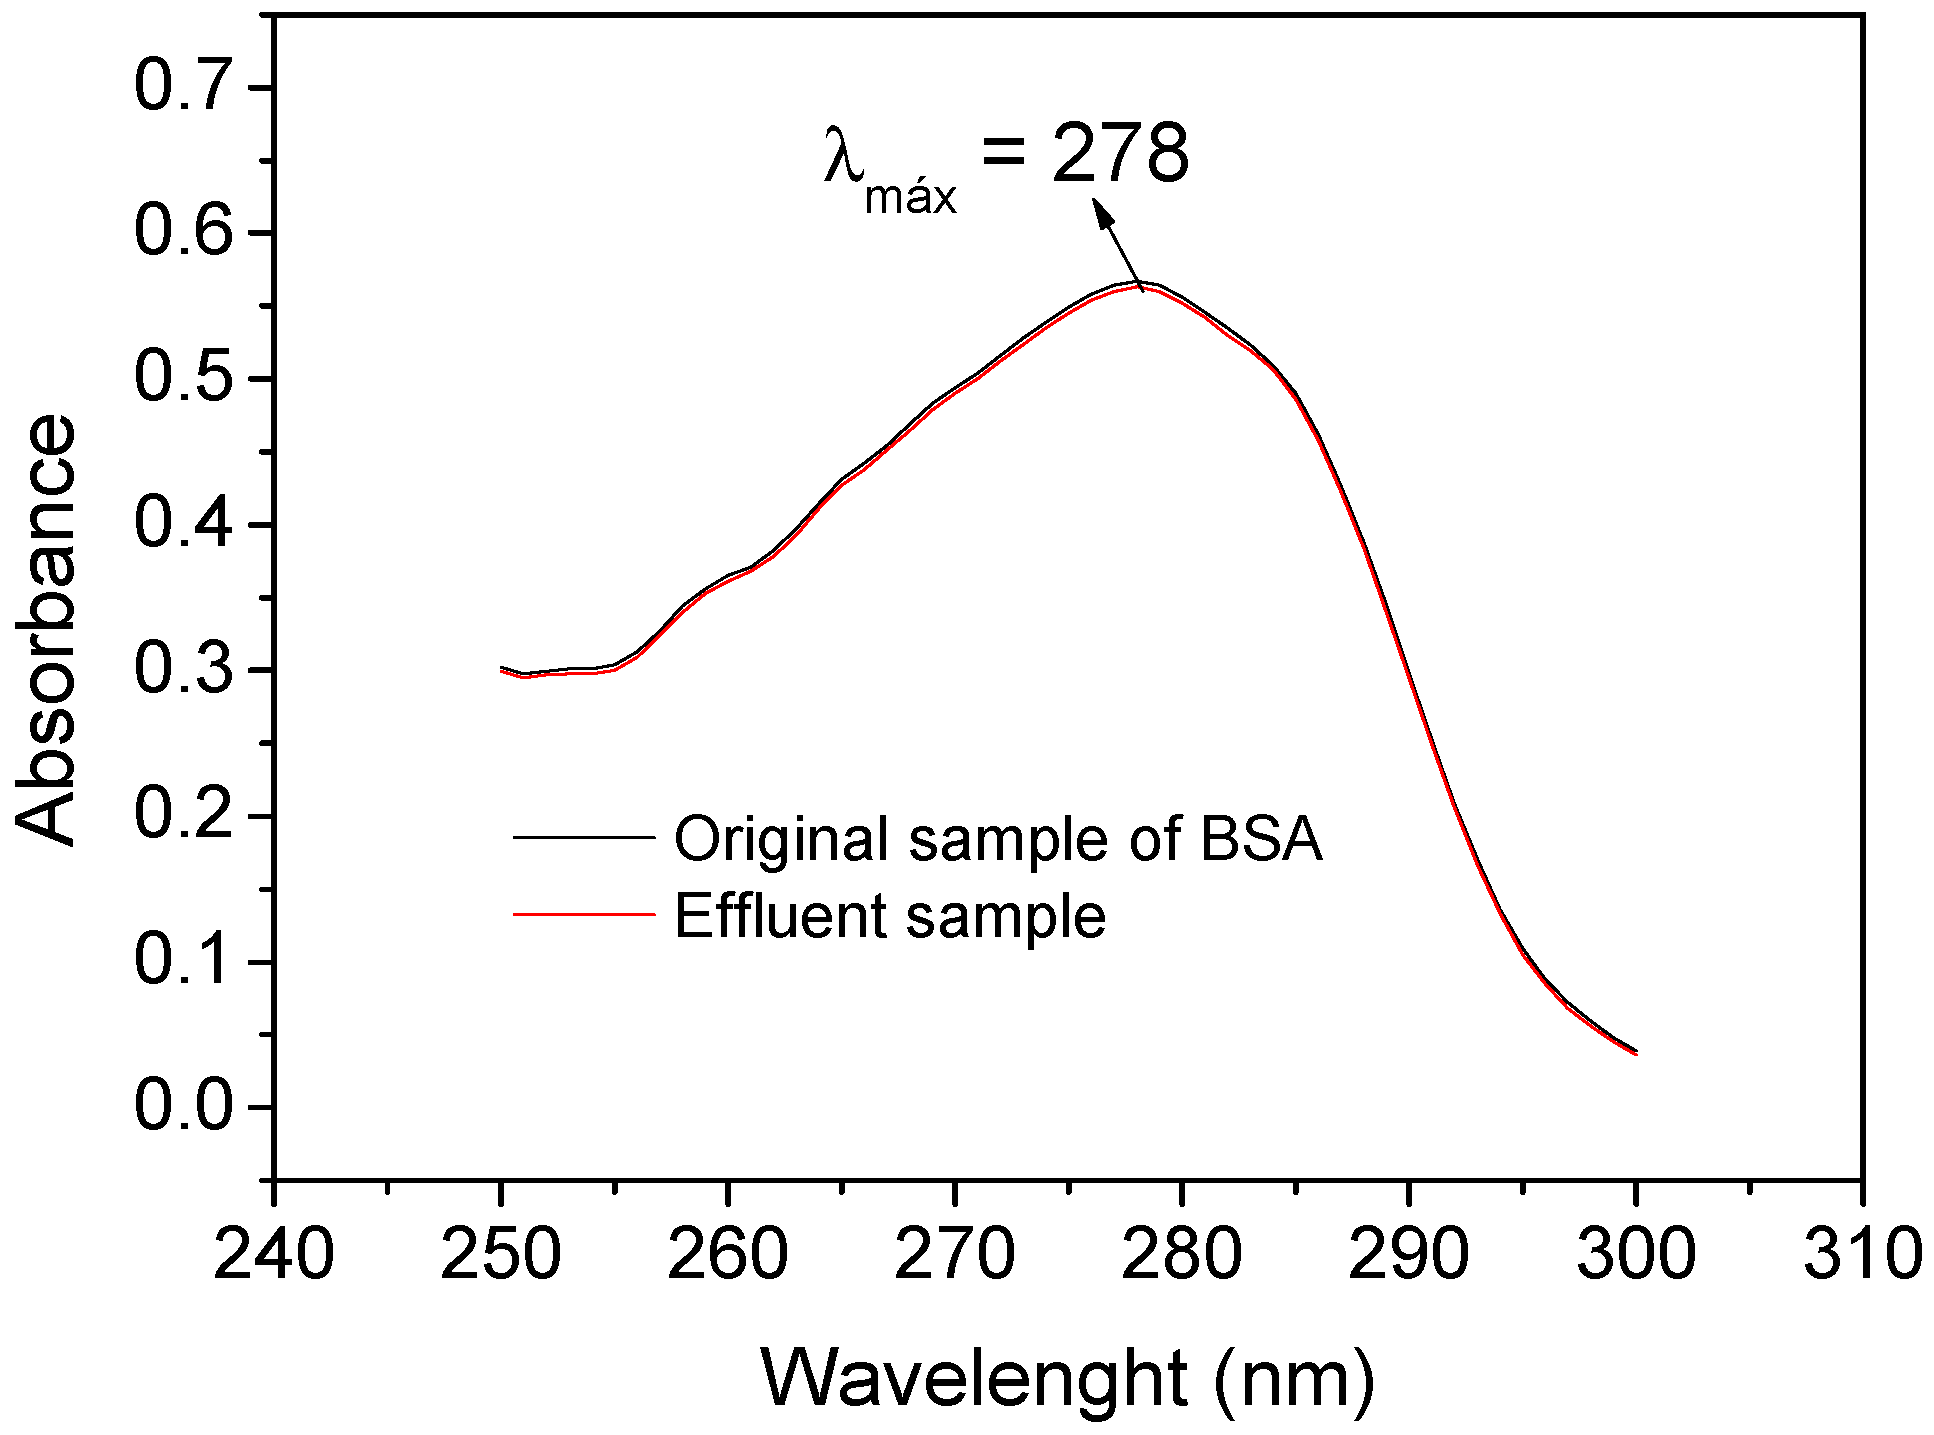
3.5. Study of Exclusion of Macromolecules

Figure 9 shows that the UV spectra from the original sample of BSA (black line) and the effluent sample (red line) were well-coincident, with an average absorbance (n = 3) of 0.567 ± 0.021 and 0.563 ± 0.027, respectively, obtaining an exclusion percentage of BSA of 99.68 ± 0.93 % by using the polymer. Similarly, an exclusion percentage for the HA macromolecule of 98.45 ± 5.68 % was obtained (UV spectra not shown). Thus, these results demonstrate that the polymer has satisfactory properties for the exclusion of both macromolecules.
The mechanism of macromolecule exclusion occurs by chemical barrier diffusion due to the hydrophilic properties of the polymer adsorbent, as previously mentioned in the FT-IR characterization, this is attributed to the O-H group; mainly, the 2-hydroxyethyl methacrylate (HEMA). This hydrophilic compound forms a water-external layer on the polymer surface. This layer interacts with the macromolecules through a hydrogen bond (chemical barrier diffusion), preventing the macromolecules’ access to the polymer matrix (restricted access) and favoring the internal diffusion of the Cu2+ ions towards the polymer pores [31,36,39,54].

3.6. Analytical Figures of Merit

Under the best experimental conditions, the Cu2+ ions’ preconcentration provided an analytical curve in the concentration range of 2.9 to 100.0 μg L−1, with the following linear equation: Abs = 2.951 × 10⁻³ ± 0.125 × 10⁻³ (Abs μg L−1) [Cu2+, (μg L−1)] + 0.0056. By using direct aspiration in FAAS without the preconcentration system, the linear equation (500–3000 μg L−1 of Cu2+ ions) was: Abs = 6.6 × 10⁻⁵ ± 0.0017 × 10⁻⁵ (Abs μg L−1) [Cu2+, (μg L−1)] + 0.0008. The two analytical curves were constructed using n = 3 for all concentrations. An analysis of variance (ANOVA) evidenced the linear relationship between the data and the absence of a lack of fit. The value of Fcal (MSregression/MSresidual error) = 12,643.24 was higher than the value of Ftab = 4.60. The value of Fcal (MSlack of fit/MSpure error) = 2.11 was lower than the value of Ftab (4.38) for the analytical curve with the preconcentration step. Regarding the analytical curve by using direct aspiration in FAAS, Fcal (MSregression/MSresidual error) = 6891.74 > Ftab (4.49), and Fcal (MSlack of fit/MSpure error) = 1.54 < Ftab (4.75). Thus, the quadratic model does not present a lack of fit. The value of R2 (determination coefficient) was 0.996, and the R2 adjusted was 0.999 for the analytical curve with the preconcentration step.
The values of the LOD and LOQ were found to be 0.9 and 2.9 μg L−1, respectively, which were lower than those of a similar method recently proposed by our research group [39]. The PF, CI, CE, and ST values estimated were 44.7-folds, 0.67 mL, 17.88 min−1, and 20 h−1, respectively.
The intra-day precision showed an RSD of 4.45% for 50.0 μg L−1 and 3.08% for 100.0 μg L−1, while the RSD for the inter-day precision was 4.76% for 50.0 μg L−1 and 4.80% for 100.0 μg L−1; these values were lower than 5.00% and were therefore considered satisfactory for this study.
This proposed preconcentration method was compared to some previously published methods for the determination of Cu2+ ions by FAAS (Table 1).
The limit of detection, preconcentration factor, and preconcentration volume of the proposed method of this study are comparable to or better than the works previously reported, which are referenced in Table 1 and Ref. [39]. It should be noted that the studies which obtained higher preconcentration factors used higher preconcentration volumes. Additionally, few works involving the FIA- FAAS system made use of a high sample throughput [61] as reported herein, which naturally makes the method very quick to perform. Withal, the synthesized polymer submitted in the FIA-FAAS system can exclude macromolecules (BSA and HA) if minimal pretreatment steps of the milk samples are employed; this as will be discussed in Section 3.8.

3.7. Tolerance of Other Ions in the Proposed Method

The analytical signal obtained from the preconcentration of the Cu2+ ions in a mixture with macronutrients or micronutrients/ions that are potentially toxic demonstrated a recovery percentage between 95.0 and 103.0% when compared with the original signal (only Cu2+ ions). Similarly, it was observed that, in the presence of the anions, an analytical signal recovery percentage of 96.0% was obtained. Thus, this study demonstrated that the proposed method can be applied for the determination of the Cu2+ ions without the interference of the metallic ions and anions analyzed herein.

3.8. Accuracy and Application

The proposed method was applied to quantify copper in bovine milk and water samples. Cu2+ ions were not naturally detected (<LOQ) in the water samples (S1–S3) or in some bovine milk samples (S4 and S5). However, as can be seen in Table 2, after recovery tests by the addition of 50.0 and 100.0 μg L−1 of Cu2+, recovery rates of 91.7 to 108.4% were achieved. These recovery rates were considered satisfactory for this study.
According to the paired t-test, Table 2 also shows that the Cu2+ concentration values found in the bovine milk samples S4** and S5**, which were only pretreated by pH adjustment (pH 6.0) and filtration, show no statistically significant difference at the 95.0% probability level about the bovine milk samples, S4* and S5*, which were pretreated by microwave-assisted acid digestion (reference technique). These results confirm the macromolecule exclusion capacity of the polymer, using only HEMA as a restricted-access molecule without needing to use immobilized BSA on the polymer surface, as usually is observed in RAM materials.

4. Conclusions

This study demonstrated the synthesis, analytical performance, and application in real samples (water and bovine milk) of a novel, restricted-access poly(protoporphyrin-co-vinyl pyridine) submitted to the FIA-FAAS system for the determination of the Cu2+ ions. The adsorbent containing HEMA as a hydrophilic group, which acted as a restricted-access molecule, was able to avoid the adsorption of macromolecules (BSA and HA). The characterization by FT-IR confirmed the functionalization of the reagents, mainly of the O-H group from the hydrophilic compound 2-hydroxyethyl methacrylate (HEMA). In addition, the polymer exhibited a rough surface in the SEM images which might favor the mass transport of Cu2+ toward the polymer surface. This result might justify the high flow rate (14.0 mL min−1) used in the FIA-FAAS system, thereby yielding a high sample throughput.
The analytical performance of this method provided a low LOD and LOQ when compared to some papers recently reported in the literature (2015-2022), bearing in mind the low sample volume preconcentrated (30.0 mL). The proposed method greatly contributes to the scientific field of analytical separation and demonstrates the feasibility of the use of restricted-access material for the preconcentration of metal ions using only HEMA, an area that is still little exploited. Using external calibration curves, it was possible to determine copper in milk samples and lake water, free of interferences and using a minimal pretreatment of samples, without using microwave-assisted acid digestion.

Author Contributions

Conceptualization, methodology, and validation: C.R.T.T.; review, editing, and visualization: F.A.C.S., L.A.B. and E.L. All authors have read and agreed to the published version of the manuscript.

Funding

Coordenação de Aperfeiçoamento de Nível Superior (CAPES), Finance Code 001, Conselho Nacional de Desenvolvimento Científico e Tecnológico (CNPq) (Grant No 307432/2017-3, 307505/2021-9, 420097/2021-0, 402387/2020-1, 401256/2020-0) and Instituto Nacional de Ciência e Tecnologia de Bioanalítica (INCT) (FAPESP Grant No 2014/50867-3 and CNPq Grant No 465389/2014-7).

Institutional Review Board Statement

Not applicable.

Informed Consent Statement

Not applicable.

Data Availability Statement

Data are available upon request from the corresponding author.

Acknowledgments

The authors acknowledge the financial support and fellowships of Coordenação de Aperfeiçoamento de Nível Superior (CAPES), Finance Code 001, Conselho Nacional de Desenvolvimento Científico e Tecnológico (CNPq) (Grant No 307432/2017-3, 307505/2021-9, 420097/2021-0, 402387/2020-1, 401256/2020-0) and Instituto Nacional de Ciência e Tecnologia de Bioanalítica (INCT) (FAPESP Grant No 2014/50867-3 and CNPq Grant No 465389/2014-7).

Conflicts of Interest

The authors declare no conflict of interest.

References

  1. Daniel, K.G.; Harbach, R.H.; Guida, W.C.; Dou, Q.P. Copper storage diseases: Menkes, Wilsons, and cancer. Front. Biosci. 2004, 9, 2652–2662. [Google Scholar] [PubMed]
  2. Pavelková, M.; Vysloužil, J.; Kubová, K.; Vetchý, D. Biological role of copper as an essential trace element in the human organism. Čes. Slov. Farm. 2018, 67, 143–153. [Google Scholar]
  3. Royer, A.; Sharman, T. Copper Toxicity. In StatPearls; StatPearls Publishing: Treasure Island, CA, USA, 2022. [Google Scholar]
  4. ANVISA-Agência Nacional de Vigilância Sanitária-RESOLUÇÃO-RDC Nº 269, de 22 de setembro de 2005. Available online: https://bvsms.saude.gov.br/bvs/saudelegis/anvisa/2005/rdc0269_22_09_2005.html (accessed on 12 December 2022).
  5. Evaluations of the Joint FAO/WHO Expert Committee on Food Additives (JECFA)–Copper. Available online: https://apps.who.int/food-additives-contaminants-jecfa-database/Home/Chemical/2824 (accessed on 18 January 2023).
  6. FAO—Food and Agriculture Organization of the United Nations. Milk and Dairy Products in Human Nutrition, 3rd ed.; FAO: Rome, Italy, 2013; p. 288. [Google Scholar]
  7. ATSDR—Agency for Toxic Substances and Disease Registry. Toxicological Profile for Copper. Available online: https://www.atsdr.cdc.gov/toxprofiles/tp132.pdf (accessed on 12 December 2022).
  8. JETRO—Japan External Trade Organization. Specifications and Standards for Foods, Food Additives, etc. Under the Food Sanitation Act (Abstract). Available online: https://www.jetro.go.jp/ext_images/en/reports/regulations/pdf/foodext2010e.pdf (accessed on 12 December 2022).
  9. CONAMA—Conselho Nacional do Meio Ambiente-RESOLUÇÃO Nº 357, de 17 de março de 2005. Available online: http://pnqa.ana.gov.br/Publicacao/RESOLUCAO_CONAMA_n_357.pdf (accessed on 12 December 2022).
  10. Ministry of Health (Brazil)-PORTARIA Nº 2.914, de 12 de dezembro de 2011. Available online: https://bvsms.saude.gov.br/bvs/saudelegis/gm/2011/prt2914_12_12_2011.html (accessed on 12 December 2022).
  11. EFSA. Scientific Opinion on Dietary Reference Values for copper. EFSA J. 2015, 13, 4253. [Google Scholar] [CrossRef]
  12. De Oliveira, A.F.; Da Silva, C.S.; Bianchi, S.R.; Nogueira, A.R.A. The use of diluted formic acid in sample preparation for macro- and microelements determination in foodstuff samples using ICP OES. J. Food Compost. Anal. 2017, 66, 7–12. [Google Scholar] [CrossRef]
  13. Radke, S.L.; Ensley, S.M.; Hansen, S.L. Inductively coupled plasma mass spectrometry determination of hepatic copper, manganese, selenium, and zinc concentrations in relation to sample amount and storage duration. J. Vet. Diagn. Investig. 2020, 32, 103–107. [Google Scholar]
  14. Bagherian, G.; Arab, M.C.; Shariati, H.E.; Ashrafi, M. Determination of copper(II) by flame atomic absorption spectrometry after its preconcentration by a highly selective and environmentally friendly dispersive liquid–liquid microextraction technique. J. Anal. Sci. Technol. 2019, 10, 3. [Google Scholar] [CrossRef]
  15. Nascentes, C.C.; Kamogawa, M.Y.; Fernandes, K.G.; Arruda, M.A.Z.; Nogueira, A.R.A.; Nóbrega, J.A. Direct determination of Cu, Mn, Pb, and Zn in beer by thermospray flame furnace atomic absorption spectrometry. Spectrochim. Acta. Part B At. Spectrosc. 2005, 60, 749–753. [Google Scholar] [CrossRef]
  16. Neri, T.S.; Rocha, D.P.; Muñoz, R.A.A.; Coelho, N.M.M.; Batista, A.D. Highly sensitive procedure for determination of Cu(II) by GFAAS using single-drop microextraction. Microchem. J. 2019, 147, 894–898. [Google Scholar] [CrossRef]
  17. Bulska, E.; Ruszczyńska, A. Analytical techniques for trace element determination. Phys. Sci. Rev. 2017, 2, 1–14. [Google Scholar]
  18. Shyam, G.S.S.; Adhikari, S.; Rohanifar, A.; Poudel, A.; Kirchhoff, J.R. Evolution of environmentally friendly strategies for metal extraction. Separations 2020, 7, 4. [Google Scholar]
  19. Kulal, D.K.; Loni, P.C.; Dcosta, C.; Some, S.; Kalambate, P.K. Cyanobacteria: As a promising candidate for heavy-metals removal. In Advances in Cyanobacterial Biology, 1st ed.; Kumar, P.S., Kumar, V.S., Kumar, A., Kumar, A.S., Eds.; Elsevier Inc.: New York, NY, USA, 2020; Volume 1, pp. 291–300. [Google Scholar]
  20. Brewer, A.; Florek, J.; Kleitz, F. A perspective on developing solid-phase extraction technologies for industrial-scale critical materials recovery. Green Chem. 2022, 24, 2752–2765. [Google Scholar] [CrossRef]
  21. Almeida, F.G.; Ferreira, M.P.; Segatelli, M.G.; Beal, A.; Spinosa, W.A.; Cajamarca, F.A.S.; Tarley, C.R.T. Synthesis and performance of cross-linked poly(vinylpyridine-co-protoporphyrin) for effective cobalt determination using a micro-packed column hyphenated system coupled to FAAS. React. Funct. Polym. 2021, 164, 104934. [Google Scholar]
  22. Silva, D.N.; Tarley, C.R.T.; Pereira, A.C. Development of a sensor based on modified carbon paste with com iron(III) protoporphyrin immobilized on SiNbZn silica matrix for L-tryptophan determination. Electroanalysis 2017, 29, 2793–2802. [Google Scholar] [CrossRef]
  23. Oliveira, T.F.; Ribeiro, E.S.; Segatelli, M.G.; Tarley, C.R.T. Enhanced sorption of Mn2+ ions from aqueous medium by inserting protoporphyrin as a pendant group in poly(vinylpyridine) network. J. Chem. Eng. 2013, 221, 275–282. [Google Scholar]
  24. Diniz, K.M.; Segatelli, M.G.; Tarley, C.R.T. Synthesis and adsorption studies of novel hybrid mesoporous copolymer functionalized with protoporphyrin for batch and on-line solid-phase extraction of Cd2+ ions. React. Funct. Polym. 2013, 73, 838–846. [Google Scholar]
  25. Tarley, C.R.T.; Diniz, K.M.; Cajamarca, F.A.S.; Segatelli, M.G. Study on the performance of micro-flow injection preconcentration method on-line coupled to thermospray flame furnace AAS using MWCNTs wrapped with polyvinylpyridine nanocomposites as adsorbent. RSC Adv. 2017, 7, 19296–19304. [Google Scholar] [CrossRef]
  26. Tarley, C.R.T.; Farias, N.C.B.; Fátima, G.L.; Oliveira, F.M.; Bonfílio, R.; Dragunski, D.C.; Clausen, D.N.; Segatelli, M.G. Crosslinked poly (4-vinylpyridine-ethylene glycol dimethacrylate) used for preconcentration of Cd(II) and its determination by flow injection flame atomic absorption spectrometry. J. AOAC Int. 2014, 97, 605–611. [Google Scholar]
  27. Oliveira, T.F.; Oliveira, F.M.; Segatelli, M.G.; Tarley, C.R.T. Evaluation of poly(vinylpyridine)-supported protoporphyrin resin for the sampling/separation of manganese(II) using a hyphenated FIA-FAAS system. Anal. Methods 2013, 5, 3264–3271. [Google Scholar]
  28. Geckeler, K.E. Synthesis and properties of hydrophilic polymers I. Preparation and metal complexation of poly(4-vinylp dine-co-N-allythiourea). Polym. J. 1993, 25, 115–122. [Google Scholar]
  29. Sacharm, M.; Anderson, K.E.; Ma, X. Protoporphyrin IX: The good, the bad, and the ugly. J. Pharmacol. Exp. Ther. 2021, 356, 267–275. [Google Scholar]
  30. Pessoa, C.A.; Gushikem, Y. Cobalt(II) metallated hematoporphyrin IX and protoporphyrin IX immobilized on niobium(V) oxide grafted on a silica gel surface: Electrochemical studies. J. Electroanal. Chem. 1999, 477, 158–163. [Google Scholar]
  31. Oliveira, L.L.G.; Suquila, F.A.C.; Figueiredo, E.C.; Segatelli, M.G.; Tarley, C.R.T. Restricted access material-ion imprinted polymer-based method for on-line flow preconcentration of Cd2+ prior to flame atomic absorption spectrometry determination. Microchem. J. 2020, 157, 105022. [Google Scholar]
  32. Souverain, S.; Rudaz, S.; Veuthey, J.L. Restricted access materials and large particle supports for on-line sample preparation: An attractive approach for biological fluids analysis. J. Chromatogr. 2004, B801, 141–156. [Google Scholar] [CrossRef]
  33. Cassiano, N.M.; Lima, V.V.; Oliveira, R.V.; Pietro, A.C.; Cass, Q.B. Development of restricted-access media supports and their application to the direct analysis of biological fluid samples via high-performance liquid chromatography. Anal. Bioanal. Chem. 2006, 384, 1462–1469. [Google Scholar] [CrossRef]
  34. Araújo-Neto, V.G.; Nobre, C.F.A.; De Paula, D.M.; Souza, L.C.; Silva, J.C.; Moreira, M.M.; Picanço, P.R.B.; Feitosa, V.P. Glycerol-dimethacrylate as alternative hydrophilic monomer for HEMA replacement in simplified adhesives. J. Mech. Behav. Biomed. Mater. 2018, 82, 95–101. [Google Scholar] [CrossRef]
  35. Queiroz, M.E.C.; Souza, I.D. Restricted access media. In Solid-Phase Extraction; Poole, C.F., Ed.; Elsevier: London, UK, 2020; pp. 129–149. [Google Scholar]
  36. Suquila, F.A.C.; De Oliveira, L.L.G.; Tarley, C.R.T. Restricted access copper imprinted poly(allylthiourea): The role of hydroxyethyl methacrylate (HEMA) and bovine serum albumin (BSA) on the sorptive performance of imprinted polymer. J. Chem. Eng. 2018, 350, 714–728. [Google Scholar]
  37. Currie, L.A. Nomenclature in evaluation of analytical methods including detection and quantification capabilities (IUPAC Recommendations 1995). Pure Appl. Chem. 1995, 67, 1699–1723. [Google Scholar] [CrossRef]
  38. Tarley, C.R.T.; Lima, F.G.; Nascimento, D.R.; Assis, A.R.S.; Ribeiro, E.; Diniz, K.M.; Bezerra, M.A.; Segatelli, M.G. Novel on-line sequential preconcentration system of Cr(III) and Cr(VI) hyphenated with flame atomic absorption spectrometry exploiting sorbents based on chemically modified silica. Talanta 2012, 100, 71–79. [Google Scholar]
  39. Suquila, F.A.C.; Tarley, C.R.T. Performance of restricted access copper-imprinted poly(allylthiourea) in an on-line preconcentration and sample clean-up FIA-FAAS system for copper determination in milk samples. Talanta 2019, 202, 460–468. [Google Scholar] [CrossRef] [PubMed]
  40. Mitsuzuka, A.; Fujii, A.; Ebata, T.; Mikami, N. Infrared spectroscopy of OH stretching vibrations of hydrogen-bonded tropolone-(H2O)n (n=1–3) and tropolone-(CH3OH)n (n=1 and 2) clusters. Chem. Phys. 1996, 105, 2618–2627. [Google Scholar] [CrossRef]
  41. Ibrahim, I.M.; Yunus, S.; Hashim, M.A. Relative performance of isopropylamine, pyrrole and pyridine as corrosion inhibitors for carbon steels in saline water at mildly elevated temperatures. Int. J. Sci. Eng. Res. 2013, 4, 1–12. [Google Scholar]
  42. Oliveira, F.M.; Somera, B.F.; Ribeiro, E.S.; Segatelli, M.G.; Yabe, M.J.; Galunin, E.; Tarley, C.R.T. Kinetic and isotherm studies of Ni2+ adsorption on poly(methacrylic acid) synthesized through a hierarchical double-imprinting method using a Ni2+ ion and cationic surfactant as templates. Ind. Eng. Chem. Res. 2013, 52, 8550–8557. [Google Scholar] [CrossRef]
  43. Grochowicz, M. Investigation of the thermal behavior of 4-vinylpyridine–trimethylolpropane trimethacrylate copolymeric microspheres. J. Therm. Anal. Calorim. 2014, 118, 1603–1611. [Google Scholar] [CrossRef]
  44. Cui, H.; Ren, W.; Lin, P.; Liu, Y. Structure control synthesis of iron oxide polymorph nanoparticles through an epoxide precipitation route. J. Exp. Nanosci. 2013, 8, 869–875. [Google Scholar] [CrossRef]
  45. Shah, B.; Shah, A.; Tailor, R. Characterization of hydroxybenzoic acid chelating resins: Equilibrium, kinetics, and isotherm profiles for Cd(II) and Pb(II) uptake. J. Serb. Chem. Soc. 2011, 76, 903–922. [Google Scholar]
  46. Basaglia, A.M.; Corazza, M.Z.; Segatelli, M.G.; Tarley, C.R.T. Synthesis of Pb(II)-imprinted poly(methacrylic acid) polymeric particles loaded with 1-(2-pyridylazo)-2-naphthol (PAN) for micro-solid phase preconcentration of Pb2+ on-line coupled to flame atomic absorption spectrometry. RSC Adv. 2017, 7, 33001–33011. [Google Scholar] [CrossRef]
  47. Afzali, D.; Afzali, M.; Ghanbarian, M. Preconcentration of trace amounts of cobalt(II) ions in water and agricultural products samples using of 5-(4-dimethylaminobenzylidene) rhodanin modified SBA-15 sorbent prior to FAAS determination. J. Environ. Anal. Chem. 2018, 98, 338–348. [Google Scholar] [CrossRef]
  48. Pearson, R.G. Chemical hardness and bond dissociation energies. J. Am. Chem. Soc. 1988, 110, 7684–7690. [Google Scholar]
  49. Sorokhaibam, L.G.; Ahmaruzzaman, M. Phenolic wastewater treatment: Development and applications of new adsorbent materials. In Industrial Wastewater Treatment, Recycling and Reuse, 1st ed.; Ranade, V.V., Bhandari, V.M., Eds.; Butterworth-Heinemann: Oxford, UK, 2014; Volume 1, pp. 323–368. [Google Scholar]
  50. Casarin, J.; Gonçalves, A.C.; Segatelli, M.G.; Tarley, C.R.T. Poly(methacrylic acid)/SiO2/Al2O3 based organic-inorganic hybrid adsorbent for adsorption of imazethapyr herbicide from aqueous medium. React. Funct. Polym. 2017, 121, 101–109. [Google Scholar]
  51. Ding, L.; Han, X.; Cao, L.; Chen, Y.; Ling, Z.; Han, J.; He, S.; Jiang, S. Characterization of natural fiber from manau rattan (Calamus manan) as a potential reinforcement for polymer-based composites. J. Bioresour. Bioprod. 2022, 7, 190–200. [Google Scholar]
  52. Chen, Y.; Zhao, W.; Zhang, J. Preparation of 4-vinylpyridine (4VP) resin and its adsorption performance for heavy metal ions. RSC Adv. 2017, 7, 4226–4236. [Google Scholar] [CrossRef]
  53. Cuppett, J.D.; Duncan, S.E.; Dietrich, A.M. Evaluation of copper speciation and water quality factors that affect aqueous copper tasting response. Chem. Senses 2006, 31, 689–697. [Google Scholar] [CrossRef] [PubMed]
  54. Oliveira, F.M.; Segatelli, M.G.; Tarley, C.R.T. Preparation of a new restricted access molecularly imprinted hybrid adsorbent for the extraction of folic acid from milk powder samples. Anal. Methods 2016, 8, 656–665. [Google Scholar] [CrossRef]
  55. Elci, A.; Kabakçi, E.; Elci, L. Solid-phase extractive preconcentration of trace copper as its calmagite anionic chelate using a polyaniline column for flame atomic absorption spectrometric determination. Anal. Lett. 2015, 48, 632–646. [Google Scholar] [CrossRef]
  56. Pourjavid, M.R.; Arabieh, M.; Yousefi, S.R.; Akbari, A.S. Interference free and fast determination of manganese(II), iron(III) and copper(II) ions in different real samples by flame atomic absorption spectroscopy after column graphene oxide-based solid phase extraction. Microchem. J. 2016, 129, 259–267. [Google Scholar]
  57. Jasmin, S.; Jan, M.R. Selective Solid Phase Extraction of Copper from Different Samples using Copper Ion-Imprinted Polymer. J. Anal. Chem. 2018, 73, 1146–1153. [Google Scholar]
  58. Rais, S.; Islam, A.; Ahmad, I.; Kumar, S.; Chauhan, A.; Javed, H. Preparation of a new magnetic ion-imprinted polymer and optimization using Box-Behnken design for selective removal and determination of Cu(II) in food and wastewater samples. Food Chem. 2021, 334, 127563. [Google Scholar]
  59. Turan, K.; Canlidinç, R.S.; Kalfa, O.M. Preconcentration of trace amount Cu(II) by solid-phase extraction method using activated carbon-based ion-imprinted sorbent. Turk. J. Chem. 2022, 46, 550–566. [Google Scholar]
  60. Gao, Y.; Zhou, R.-Y.; Yao, L.; Yin, W.; Yu, J.-X.; Yue, Q.; Xue, Z.; He, H.; Gao, B. Synthesis of rice husk-based ion-imprinted polymer for selective capturing Cu(II) from aqueous solution and re-use of its waste material in Glaser coupling reaction. J. Hazard. Mater. 2022, 424, 127203. [Google Scholar] [CrossRef]
  61. Andersen, J.R.; Pedersen, C.T. Physicochemical Analysis Methods. In Encyclopedia of Meat Sciences, 2nd ed.; Dikeman, M., Devine, C., Eds.; Elsevier Science Publishing Co. Inc.: New York, NY, USA, 2014; Volume 1, pp. 173–0179. [Google Scholar]
Figure 1. Scheme of the FIA-FAAS system: (a) preconcentration step—mini-column position in Line 1; (b) elution step—mini-column position in Line 2, using 0.40 mol L−1 HCl. The flow rate for the preconcentration/elution was 14.0 mL min−1, and the sample volume was 30.0 mL. Adapted with permission from [36], copyright publisher, 2018.
Separations 10 00122 g001
Figure 2. FTIR spectra of poly(protoporphyrin-co-vinyl pyridine).
Separations 10 00122 g002
Figure 3. SEM micro-photographs of poly(protoporphyrin-co-vinyl pyridine) at (a) 25, (b) 400, (c) 800, (d) 1600, and (e) 6000 times magnified with a scale of 2.0 mm, 100.0 μm, 50.0 μm, 20.0 μm, and 10.0 μm, respectively.
Separations 10 00122 g003
Figure 4. X-ray diffractogram for poly(protoporphyrin-co-vinyl pyridine).
Separations 10 00122 g004
Figure 5. Effect of pH on Cu2+ absorbance signal with a buffer of 0.01 mol L−1 of BR, using the polymer in the FIA system. Conditions: mass of polymer = 50.0 mg; concentration of Cu2+ = 100.0 μg L−1; sample volume = 14.0 mL; preconcentration/elution flow rate = 7.0 mL min−1; eluent = 1.50 mol L−1 HCl.
Separations 10 00122 g005
Figure 6. Influence of different buffers (Tris/Tris-HCl, H2PO4/H2PO42−, and BR) and no buffer at pH = 6.0 and 0.01 mol L−1 on Cu2+ absorbance signal using polymer in FIA system. Conditions: mass of polymer = 50.0 mg; concentration of Cu2+ = 100.0 μg L−1; sample volume = 14.0 mL; preconcentration/elution flow rate = 7.0 mL min−1; eluent = 1.50 mol L−1 HCl.
Separations 10 00122 g006
Figure 7. Study of BR buffer concentration at pH = 6.0 on Cu2+ absorbance signal using polymer in FIA system. Conditions: mass of polymer = 50.0 mg; concentration of Cu2+ = 100.0 μg L−1; sample loop = 14.0 mL; preconcentration/elution flow rate = 7.0 mL min−1; eluent = 1.50 mol L−1 HCl.
Separations 10 00122 g007
Figure 8. Optimization of sample flow rate for Cu2+ preconcentration via FIA system. Conditions: mass of polymer = 50.0 mg; concentration of Cu2+ = 100.0 μg L−1; sample loop = 14.0 mL; elution flow rate = 7.0 mL min−1; pH = 6.0; buffer = at 0.05 mol L−1 BR; eluent = 1.50 mol L−1 HCl.
Separations 10 00122 g008
Figure 9. Absorption spectra in the ultraviolet region (240–310 nm) of 1.20 g L−1 BSA solution at pH 6.0 buffered with 0.05 mol L−1 BR (Original sample of BSA—black line) and of the column effluent from the preconcentration step (Effluent sample—red line).
Separations 10 00122 g009
Table 1. Comparison of the analytical performance obtained by the proposed method with previously published methods using SPE for the determination of the Cu2+ ion by FAAS technique.
AdsorbentPreconcentration ModalityDetection ModeFigures of Merit SamplesRef.
LODLOQPFPVST
Polyaniline/CalmagiteSPE Off-lineFAAS1.98NI200.0NINIWater (drinking, bottled, sea)[55]
Graphene oxide/PTTSPEFAAS0.06NI280.01400NILeaves of spinach, honey, hair, blood,
and various water samples
[56]
IIPSPEFAASNININININIWater samples and industrial effluent water[57]
IIP-HEMA-BSASPE
Online
FI-FAAS1.103.6024.020.020Bovine and soybean milk[39]
Fe3O4@IIP-IDCSPE Off-lineFAAS1.034.5050.0NINIFood
samples and battery wastewater
[58]
IACSPE Off-lineFAAS0.03NI150.0750NITap water[59]
RH-CIIPSPEFAASNININININIWastewater[60]
poly(protoporphyrin-co-vinyl pyridine)SPE
Online
FIA-FAAS0.902.9044.730.020Water samples and milk samplesThis work
LOD: limit of detection (µg L−1); LOQ: limit of quantification (µg L−1); PF: preconcentration factor (-Folds); PV: preconcentration volume (mL): ST: sample throughput (h−1); NI: not informed; SPE: solid-phase extraction; FIA: flow injection analysis; FAAS: flame atomic absorption spectrometry; Graphene oxide/PTT: a graphene oxide (GO) packed column and 1-Phenyl-3-(2-thiophenylmethyl)thiourea; IIP: ion-imprinted polymer; IIP-HEMA-BSA: ion-imprinted polymer modified with 2-hydroxyethyl methacrylate (HEMA) and bovine serum (BSA); Fe3O4@IIP-IDC: magnetite and imprinted polymer with imidazole-4,5-dicarboxylic acid functionalized allyl chloride; IAC: imprinted activated carbon; RH-CIIP: rice husk (RH) with mesoporous silica MCM-41 employed as a supporter to fabricate copper ion-imprinted polymers.
Table 2. Values of Cu2+ concentration found in samples of water and bovine milk using FIA-FAAS system.
SamplesCu2+ (μg L−1)Recovery (%)
Amount AddedAmount Found ± SD a
S1
Igapó lake
0<LOQ-
5054 ± 492.1
100103 ± 8103.1
S2
Igapó lake
0<LOQ-
5047.8 ± 0.3104.6
10092 ± 491.7
S3
Igapó lake
0<LOQ-
5054 ± 2108.4
100102 ± 4101.8
S4 *
Bovine milk
0<LOQ-
5052± 6103.2
100107 ± 1106.8
S5 *
Bovine milk
0<LOQ-
5049 ± 598.2
10097 ± 996.7
S4 **
Bovine milk
0<LOQ-
5050 ± 6100.8
100101.9 ± 0.3101.9
S5 **
Bovine milk
0<LOQ-
5047 ± 394.8
10099.2 ± 0.399.2
a Results are expressed as mean value ± standard deviation (n = 3); SD: standard deviation; * pretreated samples by microwave-assisted acid digestion; ** samples pretreated only by pH adjustment (pH 6.0) and filtration (0.45 μm cellulose acetate membrane).
Disclaimer/Publisher’s Note: The statements, opinions and data contained in all publications are solely those of the individual author(s) and contributor(s) and not of MDPI and/or the editor(s). MDPI and/or the editor(s) disclaim responsibility for any injury to people or property resulting from any ideas, methods, instructions or products referred to in the content.

