Article

Just Suspended Speed Simulation in Torus Reactor Using Multiple Non-Linear Regression Model

1
LRTA Laboratory, University M’hamed Bouguerra, Boumerdes 35000, Algeria
2
LBSM Laboratory Ecole Normale Supérieure Kouba, Algiers 16000, Algeria
3
Laboratory of TPiTE, National School of Public Works (ENSTP), Kouba 16000, Algeria
4
Ecole Nationale Polytechnique, El Harrach 16200, Algeria
5
Nuclear Research Centre of Birine (CRNB), Djelfa 17200, Algeria
*
Author to whom correspondence should be addressed.
Separations 2023, 10(2), 117; https://doi.org/10.3390/separations10020117
Submission received: 15 December 2022 / Revised: 22 January 2023 / Accepted: 31 January 2023 / Published: 7 February 2023

Abstract

:
In the chemical and water treatment industries, it is necessary to achieve maximum contact between the solid and liquid phase, thus promoting the mass and heat transfer, to obtain a homogeneous solution. Increasing stirring speed is the most recommended solution in different types of reactors: stirred tank, column, and tubular. However, this inadvertently increases the energy consumption of the industry. Determination of the minimum speed, labeled the just suspended speed (Njs) and crucial to attaining homogeneity, has been widely investigated. Numerous studies have been carried out to assess formulas for determining the solid particle speed in various reactor types. Given the limitations of the existing formulations based on a generalization of a unique equation for computing Njs for all soil classifications, it appears that most formulas can only approximate complex phenomena that depend on several parameters. A novel formula was developed, and the results given in this paper demonstrate the effectiveness of generating significant uncertainties for the estimation of Njs. The purpose of this study was the elaboration of experiment-based data-driven formulas to calculate Njs for different particle size classes. Nonlinear multiple regression (MNLR) models were used to generate the new formulas. The gradient descent optimization algorithm was employed to solve the hyperparameters of each novel equation, utilizing supervised learning. A comparison of the data indicated that the unique formulas presented in this study outperformed empirical formulas and provide a useful means for lowering energy consumption, while increasing the heat and mass transfer in torus type reactors.

Graphical Abstract

1. Introduction

Reactors with impellers are used in a wide range of industrial processes, including reactions, dissolutions, crystallizations, separations, and many others, in which finely divided particles come into contact with a liquid. Suspending solids off the reactor bottom and bringing them into contact with the surrounding liquid is a common necessity in these systems to achieve the process goals [1].
Low stirring speeds are often used in a variety of stirred reactor units used in wastewater treatment and chemical reactions. As a result, solid particle deposition on the reactor wall is inevitable, resulting in mass and heat transfer limitations.
Manufacturers suggest increasing the agitation speed to suspend all particles, to obtain a complete suspension (just suspended speed Njs), resulting in a significant increase in energy consumption, as well as a decrease in the productivity and product quality [2]. Below the speed of suspending particles (Njs), the solid–liquid exchange surface is partially exploited, resulting in a reduction in the mass and heat transfer. However, above it, the increase in solid–liquid mass-transfer is insignificant, while the power consumption is substantial (Armenante & Kirwan, 1989) [3].
Laederach et al. (1984) [4] recommend intense mixing to achieve homogeneous phase distribution and complete suspension of the microorganisms in a loop bioreactor. They identified two limiting factors. One of these factors is the growth of microorganisms on the reactor wall, which leads to a thick precipitation layer and a reduction of active microorganisms in the working solution, as well as a decrease in productivity and product quality. To avoid the creation of these layers, the authors recommend the use of recirculating reactors, which have the disadvantage of high energy consumption [4]. Tanaka et al. (1989) noted that when a reactor is used to process a dispersion, the high pressure drop causes the dispersed particles to adhere to the reactor wall [5].
The lowest stirring speed that retains all particles in suspension (Njs) according to the reactor’s physical and geometrical parameters, as well as its operating conditions, was first determined by Zwietering (1958) [6]. Nienow et al. (1968) [7] presented graphical data for determining the impeller speeds at which particle suspension occurs in turbine-agitated vessels using Zwietering’s basic correlation. They concluded that the suspension speed is determined by the impeller clearance, fluid flow pattern, and particle distribution throughout the vessel. Baldi et al. (1977) [8] calculated the minimum agitator speed for a suspension. The distribution of particles with mono- and b-modal sizes was examined in fluids with varying physical properties. To investigate the factors that influenced the critical impeller speed for solid particle suspension, Njs, Rao et al. (1988) [9] employed three impeller types: disk turbine, pitched turbine downflow, and pitched turbine upflow. Impellers with inclined blades were proven to be more efficient than conventional disc turbines; the authors attempted to rationally explain the suspension mechanism, and a correlation for estimating Njs was proposed, which should be useful in reactor design. There are numerous techniques for visualizing and measuring mixing and flow, which have been extensively described by authors. The most common include visual observations, conductivity probes, optical probes, sampling, tomography, ultrasonic Doppler flowmeters (UDF), the pressure gauge technique (PGT), and steady cone radius methods (SCRM) [10,11].
In the laboratory, the use of transparent vessels is the most common method. Visual methods are therefore easy to perform coupled with picture or video recording [12].
A number of investigations have been carried out into how to adjust the speed of the stirrer to achieve full suspension under gaseous conditions [13,14]. They examined how floating solid particles were drawn down into aerated baffled tanks.
Relatively little attention has been paid to the study of the suspension of solid particles in a torus type reactor [15]. This distinct reactor can be used for biological reactions, as well as the treatment of high-viscosity liquids. The many advantages of this type of reactor have been mentioned by Sato et al. (1979) [16], Murakami et al. (1982) [17], and Nouri et al. (1997) [18].
It is noteworthy that the loop reactor’s heat exchange surface per unit volume is higher than that of a stirred tank reactor [10]. Moreover, since its structure is completely made of straight tubes, scaling up would not be complicated.
There have been numerous research works on the suspension of solids in torus reactors [2,19]. Some authors advised working at a high agitation speeds, to avoid solid particle deposition on the reactor’s wall and impeller [10,11,12,13,14].
The complete absence of dead volume in this type of reactor makes it suitable for fluid systems requiring defined flow conditions throughout the reaction space [20]. It was revealed that the wall pressure drops significantly at the bend of the torus reactor. When the reactor is operated at low speed to process liquid–liquid dispersion, this large pressure drop is thought to cause the dispersed droplet to adhere to the reactor wall [17]. In addition, the loop reactor is capable of liquid-phase bulk polymerization. The main advantage in the processing of highly viscous liquids and biochemical reactions is that the deposition of polymers on the reactor wall can be avoided under a high-Reynolds number operation [16]. Laederach et al. (1984) [4] tested a batch torus bioreactor with various fermentative growths and found that the biomass production in this reactor was nearly 40% higher than in a batch-stirred tank. Furthermore, unlike the stirred tank, no growth was observed at the torus reactor’s wall due to the high level of agitation used, implying that the entire biomass was mixed and participated in the mass transfer.
Researchers have measured the suspension speed of solid particles (Njs) in a torus reactor by employing a visual technique based on the steady bed angle method (SBAM) [2,19]. These authors provided a set of equations based on the torus and piped reactor geometry, as well as the characteristics of the fluids involved within flows [2].
To validate the proposed model, they used experimentally determined values of the suspending speed Njs. The particle diameter was included in the proposed equation, despite the fact that it is a statistical characteristic, unlike concentration and density.
However, they discovered several discrepancies between the model’s calculated values and those acquired experimentally. The statistical calculation performed by Alouache et al. (2019), in fact, highlighted this deviation [2].
One of the reasons that the empirical approach has failed could be the generalization of a single formula for computing the minimum speed for all solid classes [21]. To overcome the deviation reported by Alouache et al. (2019) [2], a cluster of solid class was introduced, along with a model of solid particle suspension phenomena in a torus reactor based on behavioral law, as per the ISO-14688-1: 2017 standard, which identifies and describes intermediate materials between soil and rock. This standard is applied for the description of soils for engineering purposes, soils that have been created by natural processes, by man, or that contain synthetic materials.
New formulas for calculating Njs are presented for each of the four solid classes: coarse silt, medium sand, fine sand, and coarse sand. In the torus reactor, the suggested new formulas consider the effects of concentration and density. The multiple non-linear regression method MNLR was used, and its hyperparameters were optimized using the gradient descent algorithm.
Including the class of solids in the model established by D50 obstructs understanding of the phenomenon, especially for coarse soils; for this reason, a model was developed for each class of solid. The MNLR method has been applied by researchers for the development of prediction models [21], where the results were very satisfying; however, there have been no known applications of the modeling of Njs in a torus reactor.
The goal of this research was to calculate the just-suspended speed (Njs) in a torus reactor by evaluating the dependence of (Njs) on the particle diameter D50, particle concentration, and solid–liquid density difference, as has been investigated by other researchers. The model built using the (MNLR) algorithm permitted predicting the fluid behavior by numerically deriving the lowest suspension speed of solid particles from the experimental data collected.

2. Materials and Methods

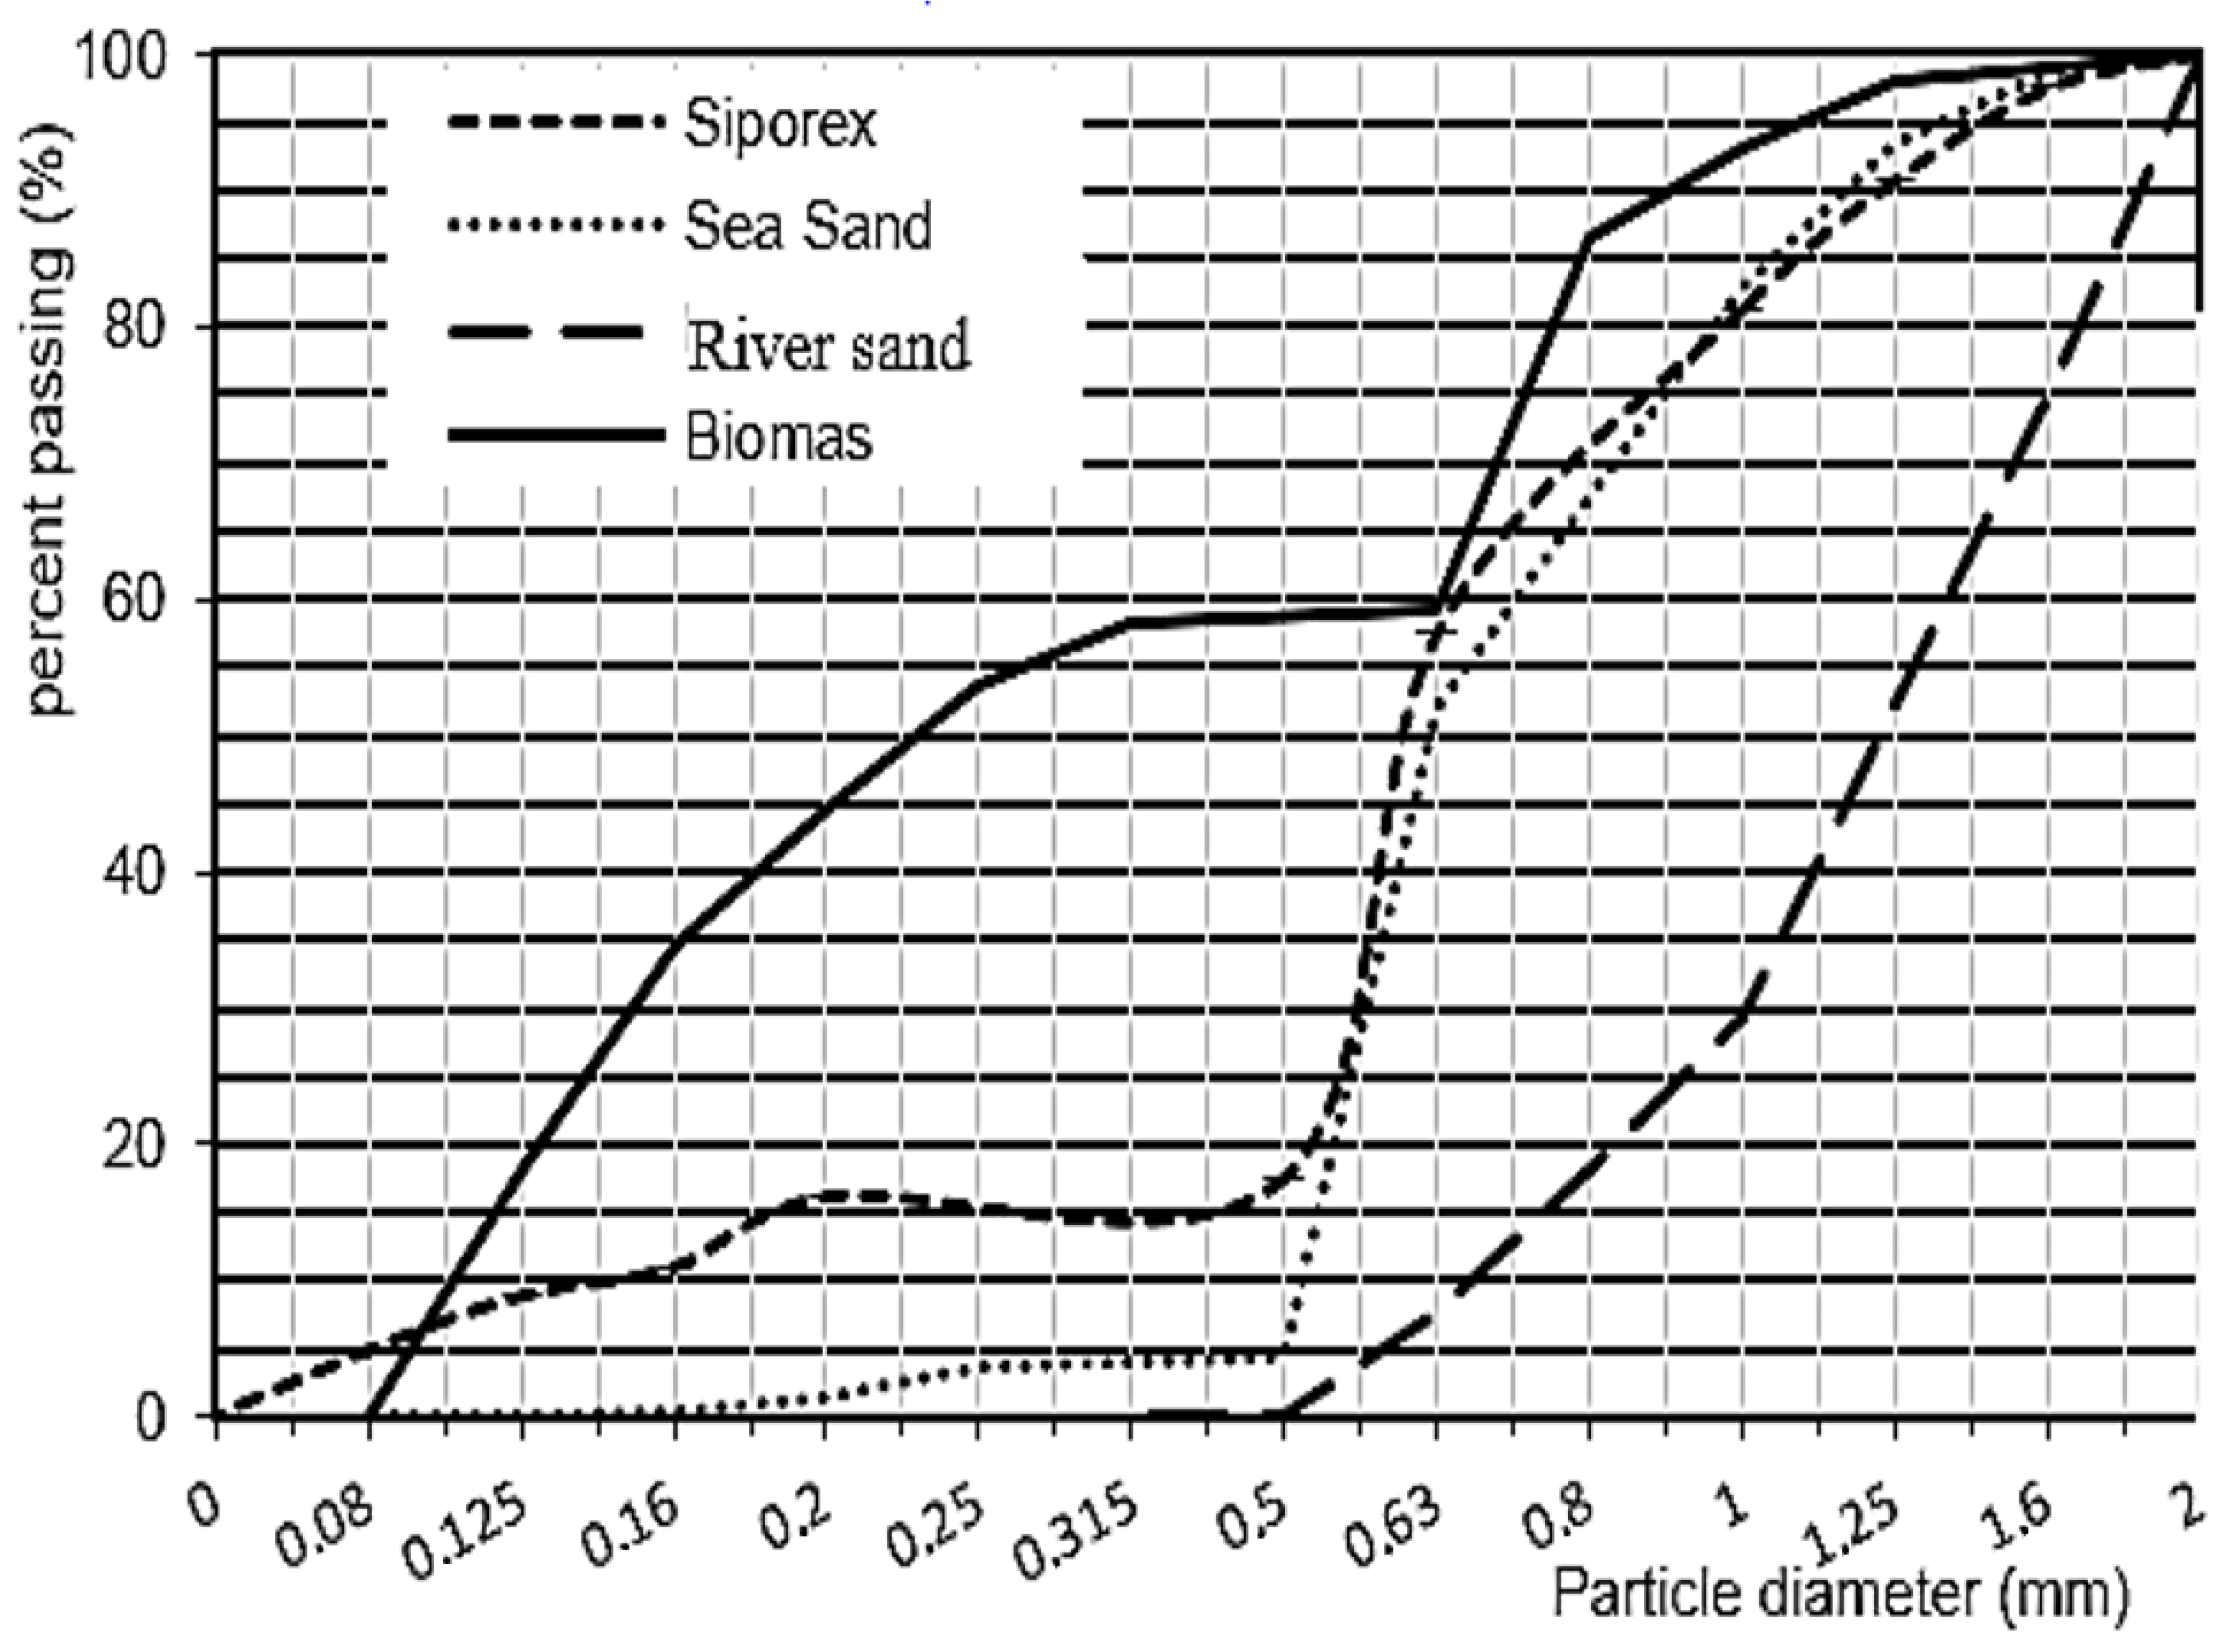
2.1. The Sieve Particle Size Analysis

Particle diameter is a statistical parameter. One cannot exactly know the value of the diameter of solid particles in a bulk solid sample. The sieving operation of the different solid samples allowed us to establish the particle size curve for each solid. This analysis enabled us to classify them and obtain the D50 diameters for each type of solid particle; the same classification of the solid particles was used by Adiguze et al. (2019) [22].

2.2. The Experimental Apparatus Description

The Figure 1 depicts the torus reactor used in this study; similar to those employed by others [2,18,23,24,25].
As shown in Figure 1a, the torus reactor was composed of a transparent tube of 1600 and 50 mm inner diameter (Dt) corresponding to a total volume of 3 L [19]. As shown in Figure 1b, a marine screw impeller was utilized for mixing, driven by a variable-speed stirring apparatus (Heidolph RZR 2021). Table 1 below shows the dimensions of the reactor and the marine screw impeller.
In Figure 1, Dt is the torus reactor inner diameter and Lt is the perimeter at diameter Rt. α is the angle of the settling bed in reactor circumference. The measurement of α is performed once a uniform settled bed formed on the reactor bottom, then the stirring started at the desired speed, and the particles were moved to make two distinct zones inside the reactor: a “well mixing zone”, where particles were suspended in the fluid; and a “transport zone”, where particles formed a bed on the reactor bottom.

2.3. Techniques and Methods for Measurement

Particle suspension has been the subject of extensive research [26,27,28,29,30], most of which was based on the visual approach for determining the just suspended speed (Njs). Experiments were conducted using a transparent torus reactor mounted on a glass table, with a mirror below it to make visual observations.
To identify the just suspended speed (Njs) in the torus reactor, Alouache et al. (2019) [2] developed a visualization-based experimental method (Steady Bed Angle Method, SBAM) [2].
The solid particles are initially fed into the reactor, which is filled with water to its full capacity, then, before starting testing, all the solid particles are suspended throughout the reactor perimeter using a high stirring speed [19].
Once the stirrer is turned off, the solid particles begin to settle on the bottom circumference, forming a uniform settled bed on the reactor bottom. The (Njs) is obtained for each solid concentration (Cv) by adjusting the rotation speed until the settling bed disappears [2]. According to Zwitering T.N. (1958), for Njs, no deposited particles remain on the reactor base for longer than 1 s [6].
A protractor with needles is used to determine α, the angle between the bed limits Figure 1a, which is then compared to (α0 = 360). The agitation speed at which no particles remain stable on the reactor bottom can be measured using the ratio R = 360 360 , which corresponds to a value of zero, as shown in Figure 2. As a result, the suspension is deemed complete [2].
The SBAM approach in a torus reactor proposed by Alouache et al. (2019) [2] was found to have the ability to avoid measurement subjectivity and result in high repeatability; similar statements were made by Brucato et al. (2010) [27]. Figure 2 illustrates how experimental Njs values were generated for each of the solid particles investigated by extrapolation.

2.4. Multiple Nonlinear Regression (MNLR) Model Optimization

The purpose of nonlinear regression is to fit a nonlinear model for a set of values, to determine the curve that most closely approximates the data curve of Y versus x. Multiple linear regression is a solution for identifying correlations between a result (the variable being explained) and several explanatory and independent variables.
For each of the four solid classes a new formula to calculate Njs was established: coarse silt, medium sand, fine sand and coarse sand. The suggested new formulas consider the effects of particle concentration and density. The multiple non-linear regression method was used, and its hyperparameters were optimized using the gradient descent algorithm.
The goal of multiple nonlinear regression (MNLR) analysis is to study the relationship between several independent or predictor variables and a dependent or criterion variable [21]. The assumption of the model is that the relationship between the dependent variable Njsi and the p vector of regressors ( d p D t ) , C v , and Δ ρ ρ are power. The following represents the MNLR equation:
N j s = k ( d p D t ) β ( C v ) δ ( Δ ρ / ρ ) σ
where k, β, σ, and δ are the slope or coefficient. For forecasting purposes, the nonlinear regression equation fits a forecasting model to an observed data set of output and input values [21]. With new additional observed input data, the fitted model can be used to estimate the value of Njs.
The supervised learning algorithm is used to execute the regression between the simulated and observed values, and the gradient descent algorithm is used to solve the hyperparameters of each new equation [21]. The gradient descent algorithm is, in reality, a method for minimizing a differentiable real function f ( x )   defined in Hilberttian space E, such as
x E f ( x )
We notice that f ( x ) is the gradient of f in x , and f ( x ) the derivative, therefore for every d E ,   f ( x ) . d = f ( x ) , d .
The gradient algorithm creates a set of iterates named x 1 ,   x 2 , E . It goes from x k to x k + 1 through the use of the following steps, until the stop test is satisfied:
Simulation: the calculation of f ( x k ) .
Stop test: if f ( x k ) ε , stop.
Calculation of the learning rate α k > 0 by a linear search rule on f in x k along the direction f ( x k ) .
New iteration: x k + 1 =   x k α k f ( x k ) [21].

2.5. Validation Criteria

Statistical criteria are often used to test the empirical equations derived from an MNLR analysis (R2, RSR, PBIAS). The coefficient of determination (R2), which ranges from 0 to 1, is an indicator of the fitting quality of a simple linear regression. It indicates the difference between the measured and the calculated values. R2 values close to 1 indicate perfect similarity, while values far from 1 indicate a low degree of similarity.
R 2 = [ i = 1 n ( N j s ( i ) N j s ¯ ) ( N j s c ( i ) N j s c ¯ ) i = 1 n N j s ( i ) N j s ¯ ¯ ) 2 i = 1 n ( N j s c ( i ) N j s c ¯ ) 2 ] 2
NJS(i) is the observed Njs by extrapolation.
NJSC(i) is the observed Njs calculated by empirical formula.
N J S ¯ is the average of Njs observed.
N J S C ¯ is the average of Njs calculated by empirical formula.
n   is measurement number.
RSR is a measure of the difference between the observed and simulated values. It is a dimensionless variable close to zero that indicates a relatively low variation and thus an excellent model simulation [2].
R S R   ( % ) = [ 100   ( i = 1 n ( N j s ( i ) N j s c ( i ) ) 2 i = 1 n ( N j s ( i ) N j s c ¯ ) 2 ) ]
Percent bias (PBIAS) is used to assess the average tendency of experimentally calculated Njs to be larger or less than their observed equivalents. The PBIAS “ideal value” result of 0 indicates an accurate model simulation. Negative numbers suggest an overestimation of Njs, whereas positive values indicate an underestimating (Moriasi et al., 2007) [31].
P B I A S   ( % ) = [ 100   ( i = 1 n ( N j s ( i ) N j s c ( i ) ) i = 1 n N j s ( i ) ) ]
Table 2 illustrates how to use the mentioned statistical criteria to validate the new Njs calculation formulas (Abeysingha et al., 2015; Alouache et al., 2019) [2,32].

3. Results and Discussion

The generalization of a single formula for computing the minimum speed for all solid classes failed [21]. To overcome this deviation, a cluster of solid class was introduced, along with a model of solid particle suspension phenomena in a torus reactor based on the behavioral law, as per the ISO-14688-1: 2017 standard.
First, the sieving operation of the different solid samples allowed us to establish the size curve for each solid. The results are shown in Figure 3. This analysis enabled us to obtain the D50 diameters for each type of solid particle. The commercial fine quartz had a D50 of 0.05 mm.
Solids particles were classified according to their density, bulk density, and average diameter D50. The results are presented in Table 3, as follows:

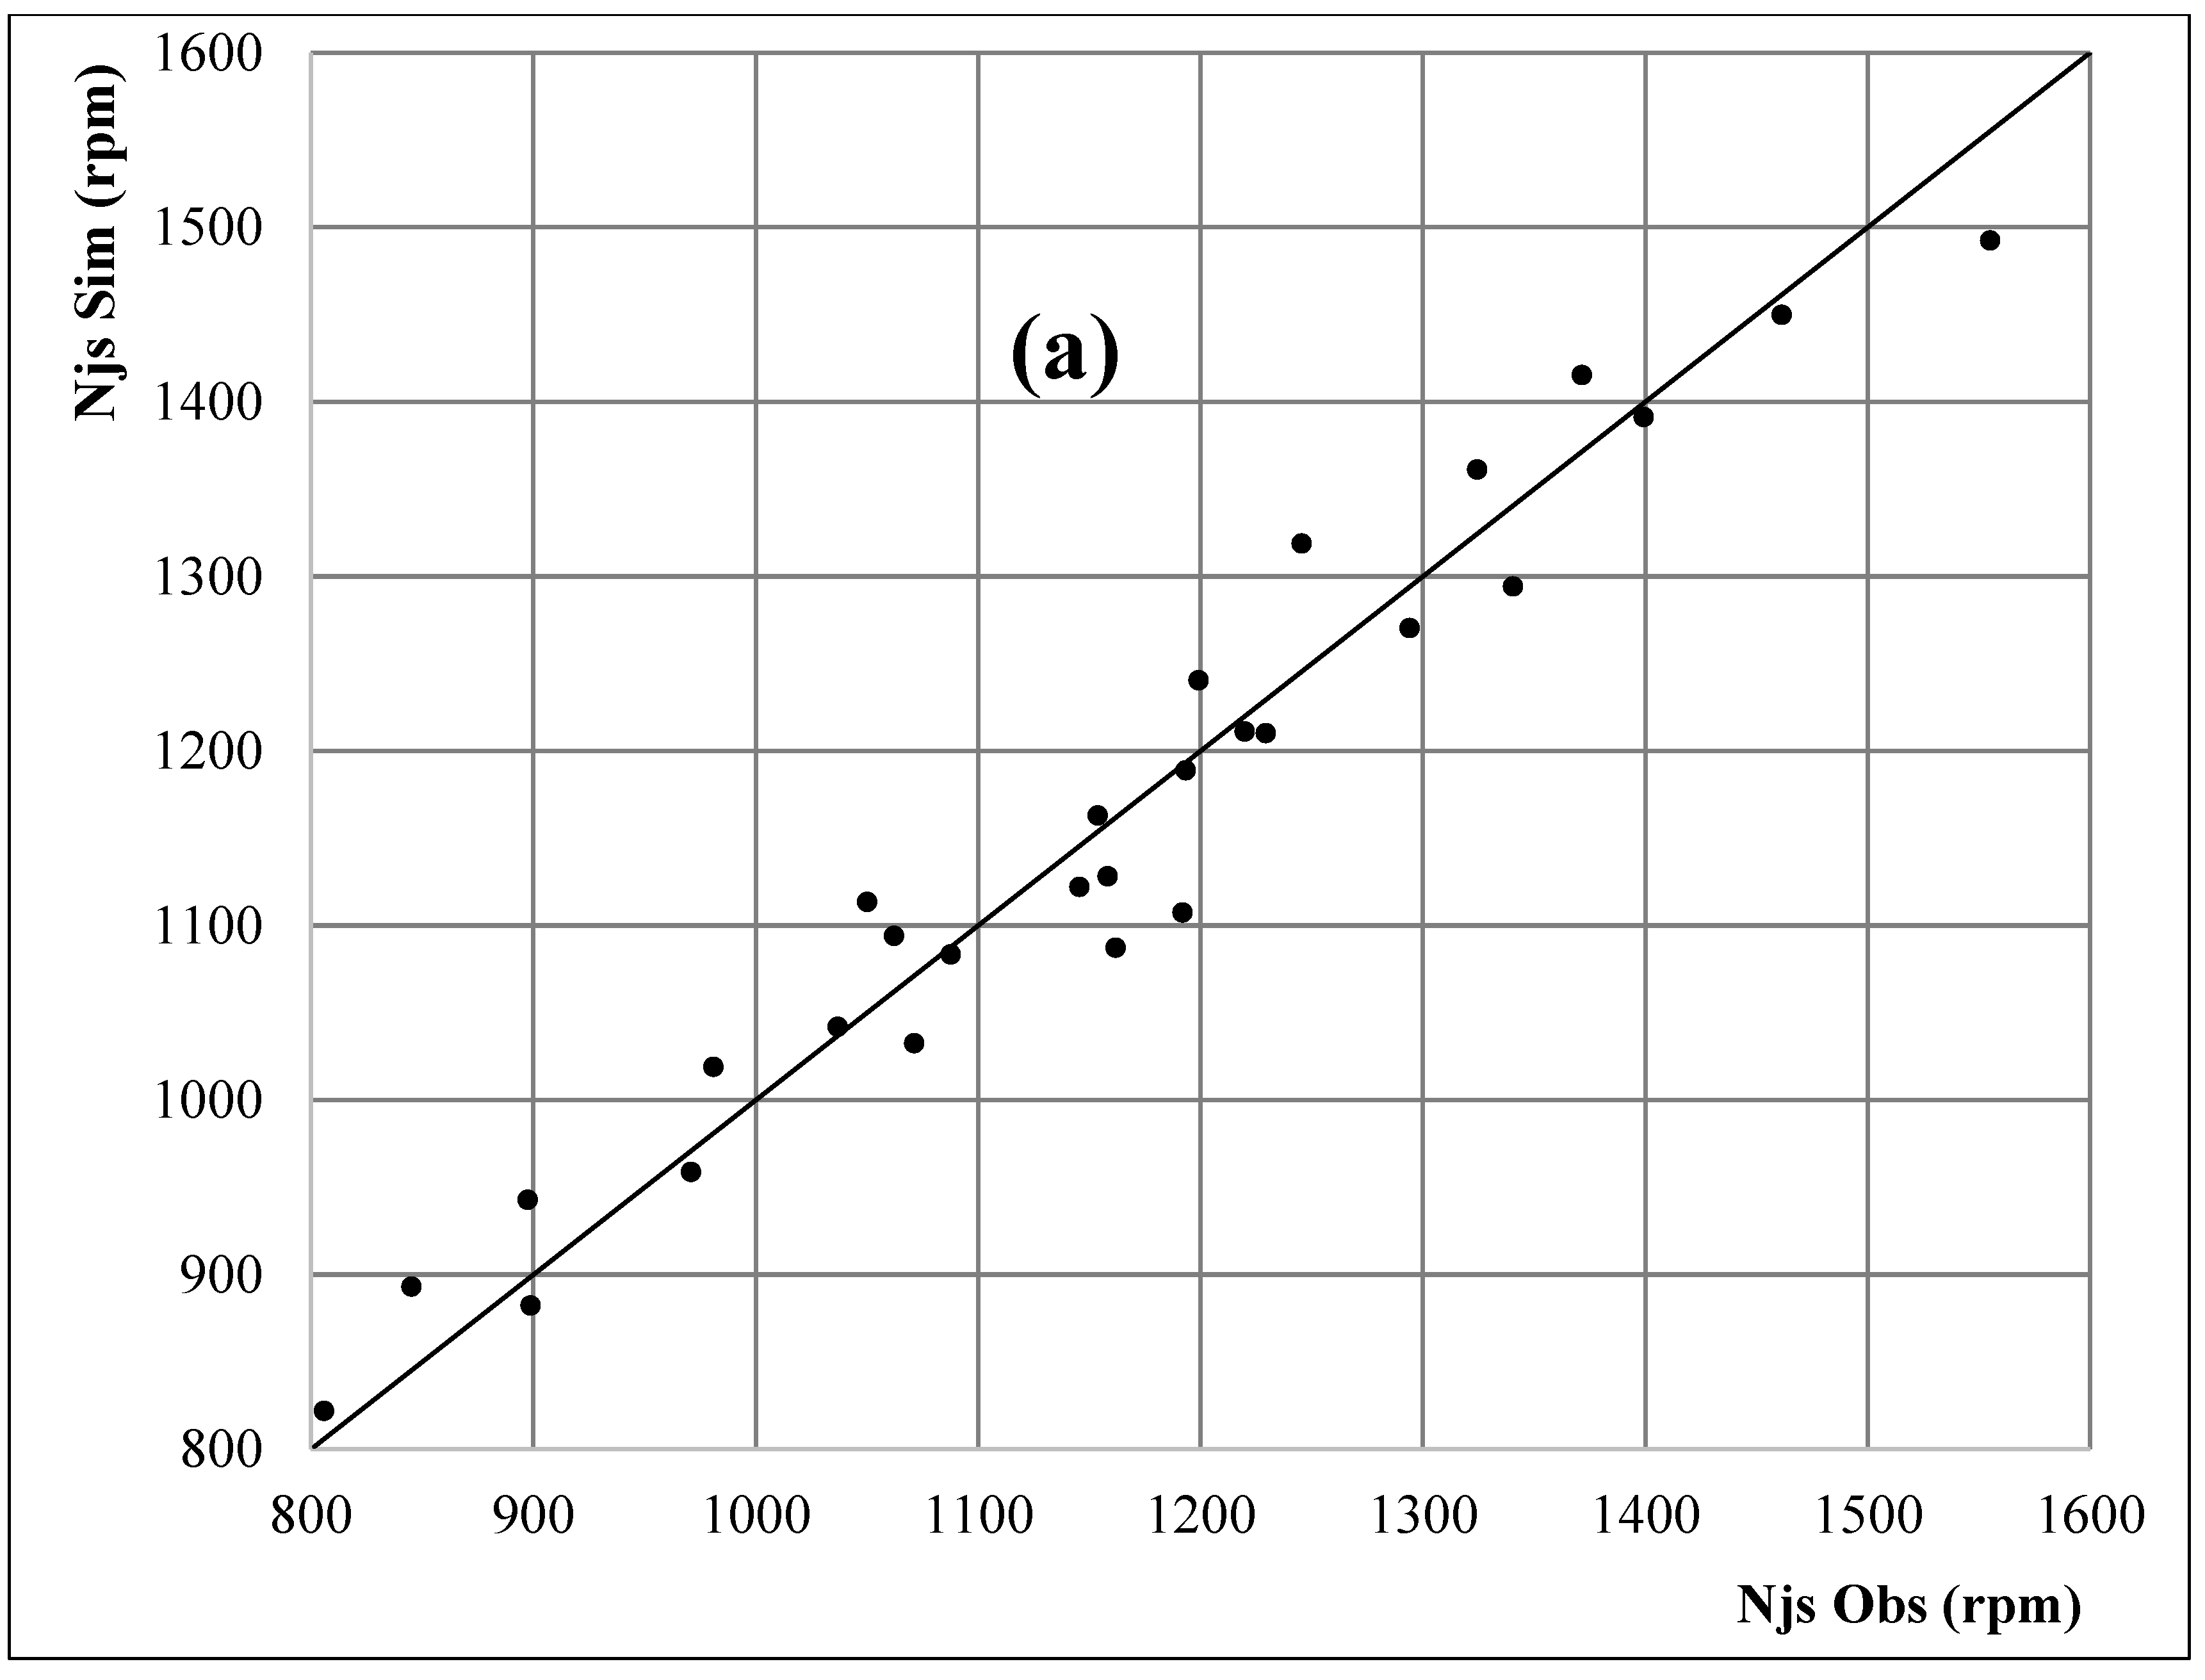
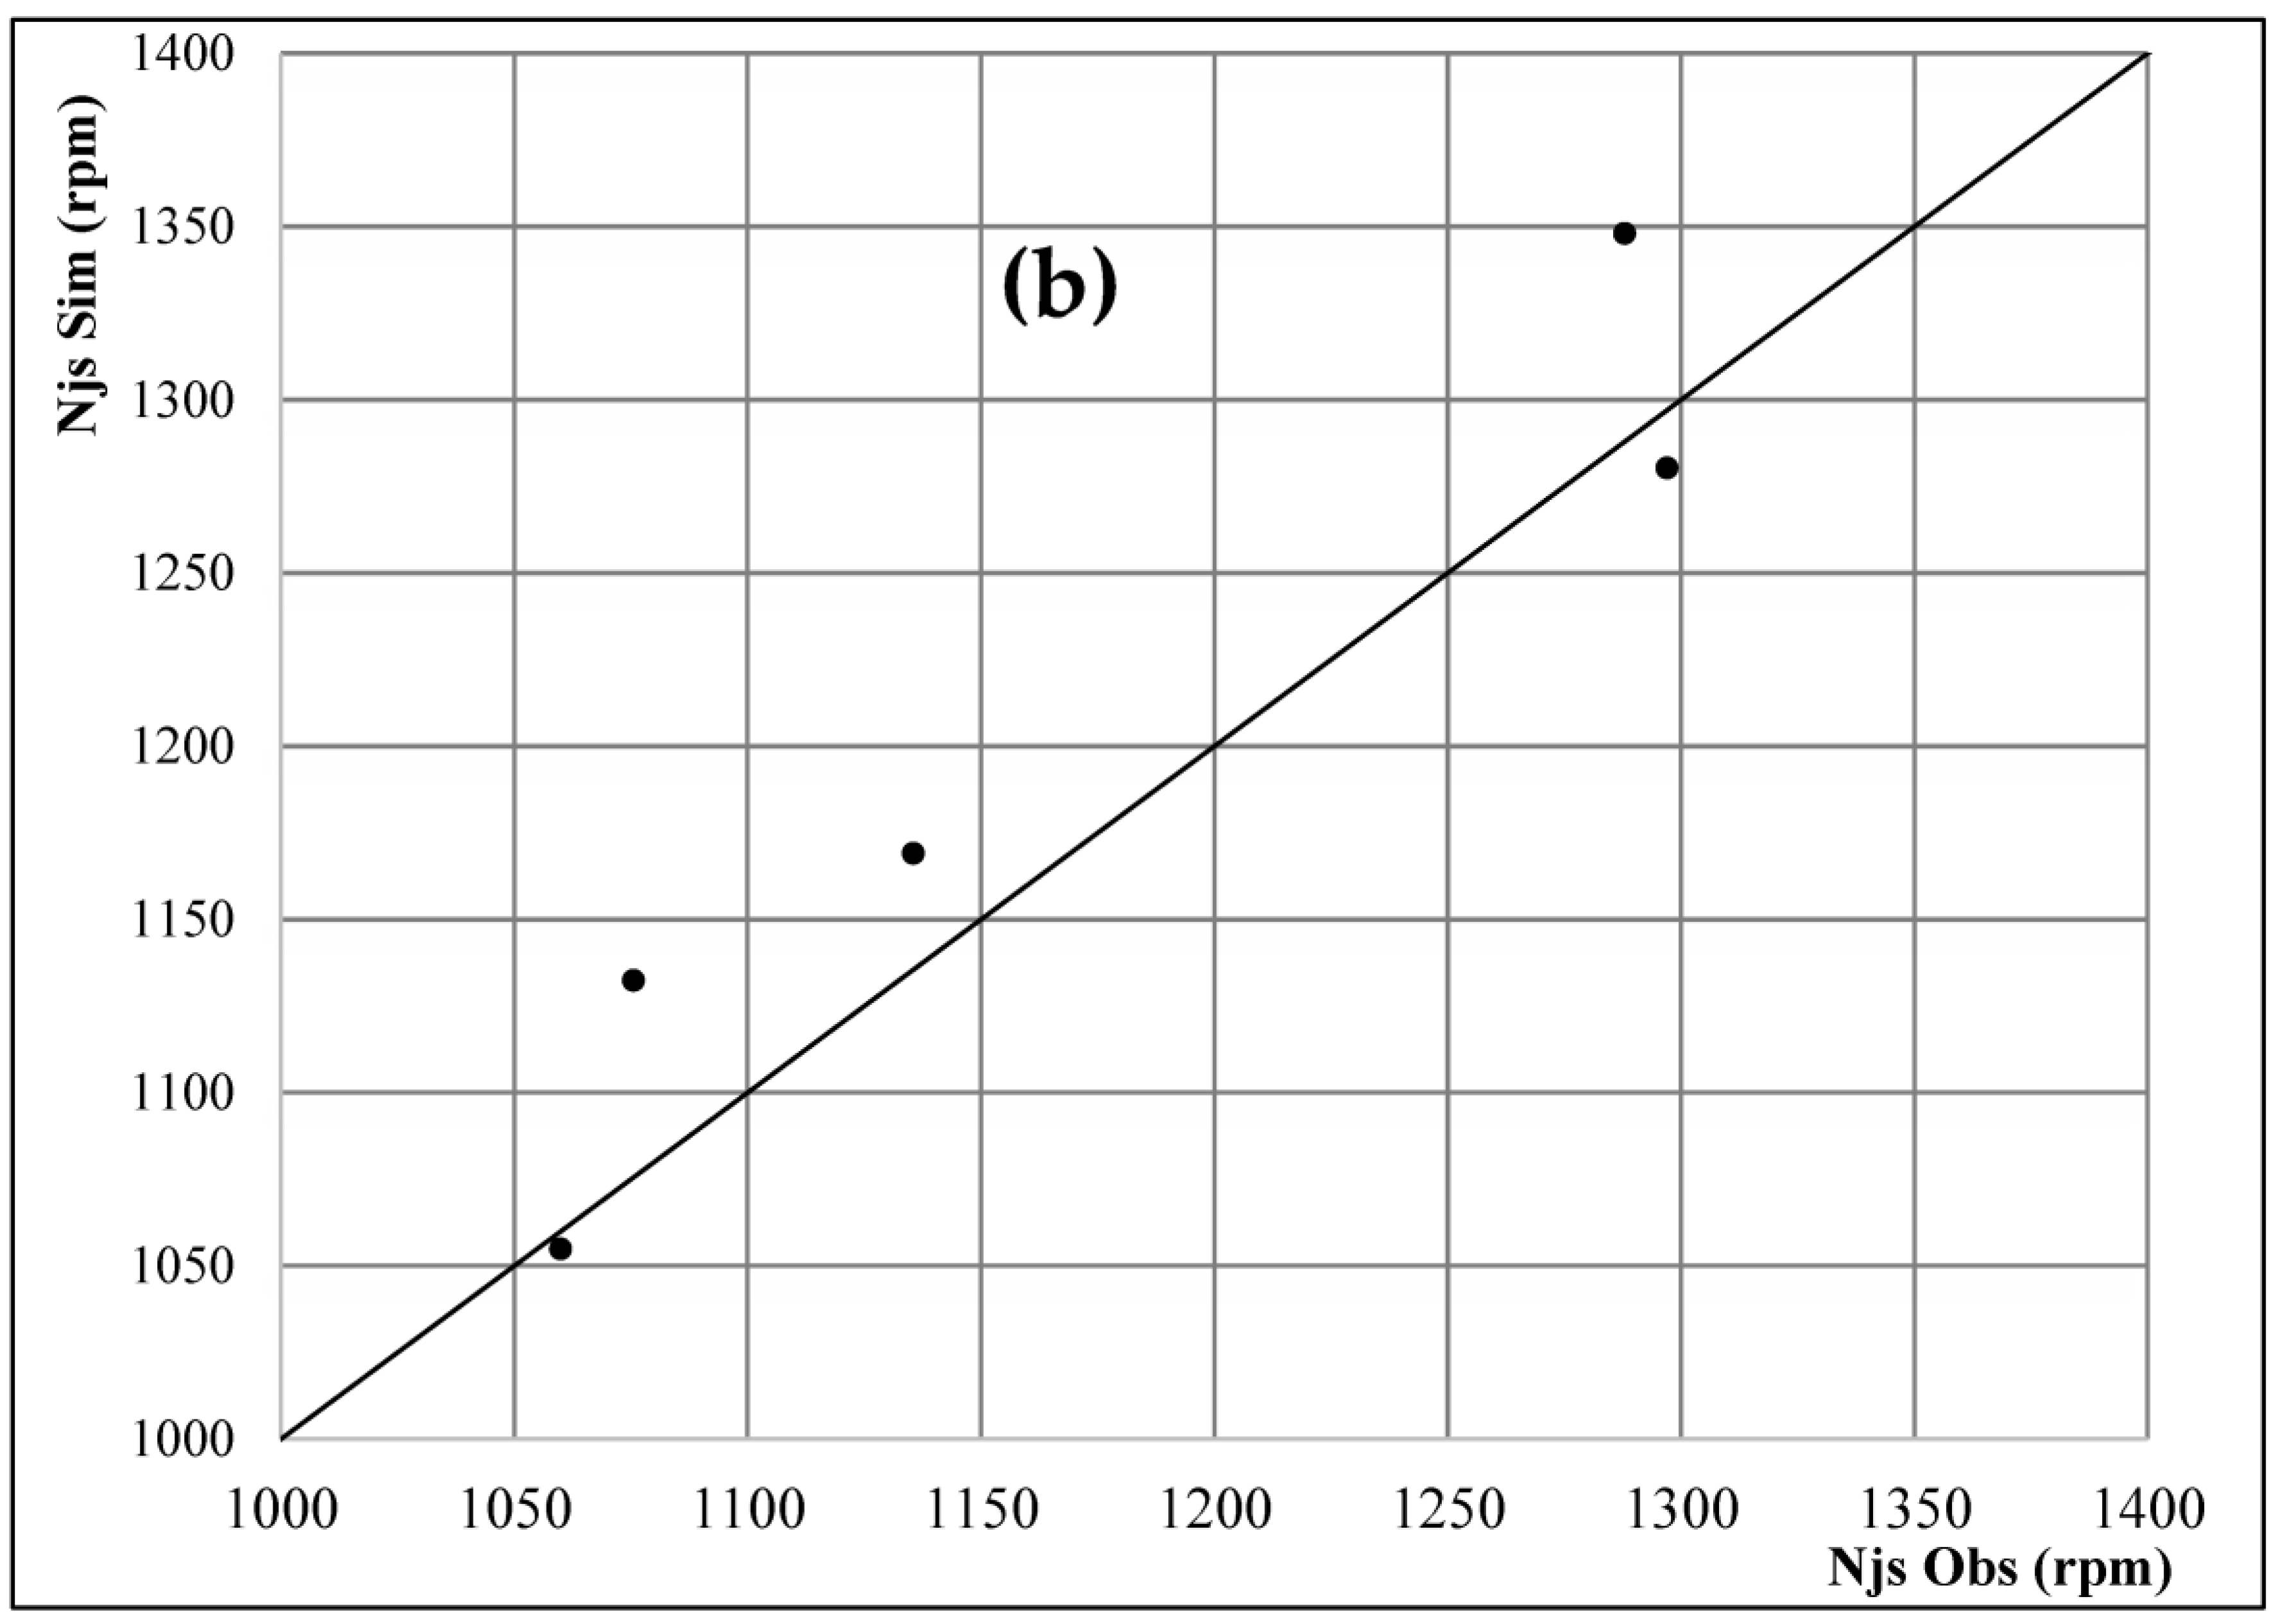
3.1. MNLR Simulation Results

The MNLR analysis used 80% of the experimental data to train the model and establish the empirical formula Figure 4a, and 20% to validate Figure 4b. The validation was performed for each solid class with the statistical indices (R2, RSR, PBIAS). In fact, the Q–Q plot allowed us to measure the difference between the simulated values and the experimental values. By plotting the experimental values against the simulated values, the closer the simulation was to reality, the closer the points were to the 45-degree line.
Following the gradient descent approach to adjusting the hyperparameters, the updated calculations of Njs for each soil type (defined according to particle size D50) are presented in Equation (5) below.
N j s = K · ( Δ ρ ρ ) 0.11 · C v 0.12 { K = 1019                 C o a r s e   s a n d K = 1132             M e d i u m   s a n d K = 971                                 F i n e   s a n d K = 901                               C o a r s e   s i l t
The MNLR analysis results are represented for each soil class, and significant results were obtained using the empirical equations. Table 4 summarizes the findings.
In view of the R2 values (R2 > 90), a good similarity between the calculated and measured values of Njs was obtained.
On the other hand, in respect to the RSR evaluation criterion, all values were also quite good (RSR < 32). This demonstrates the effectiveness of the results using the equations above. Finally, the PBIAS values ( | P B I A S | < 0.34) show that these equations allowed a very good simulation of the Njs for solid particles. The gap between those overestimated and underestimated was within an acceptable range.
Abacuses can be used to calculate the suspension velocity Njs as a function of the volume concentration Cv for various solid densities Figure 5. These abacuses represent a graphic illustration of the formulations presented in Equation (5), and they serve as new, simple, and handy tools for calculating Njs, by taking into account the distribution of soil classes. As it appears, Njs was more evident in the low-graded class than in the other classes. This was due to the suggested new formulations’ superior performance in medium- and coarse-grained solids. As the granulometry decreased, this factor deteriorated more than it did in the other classes, such as fine sand, due to the fact that each solid type had a particular rheological behavior.
For efficient use of these abacuses, first of all one must define the solid class, then, to determine Njs, it is easy to compare the value of solid concentration Cv to the ratio of solid density to liquid density.

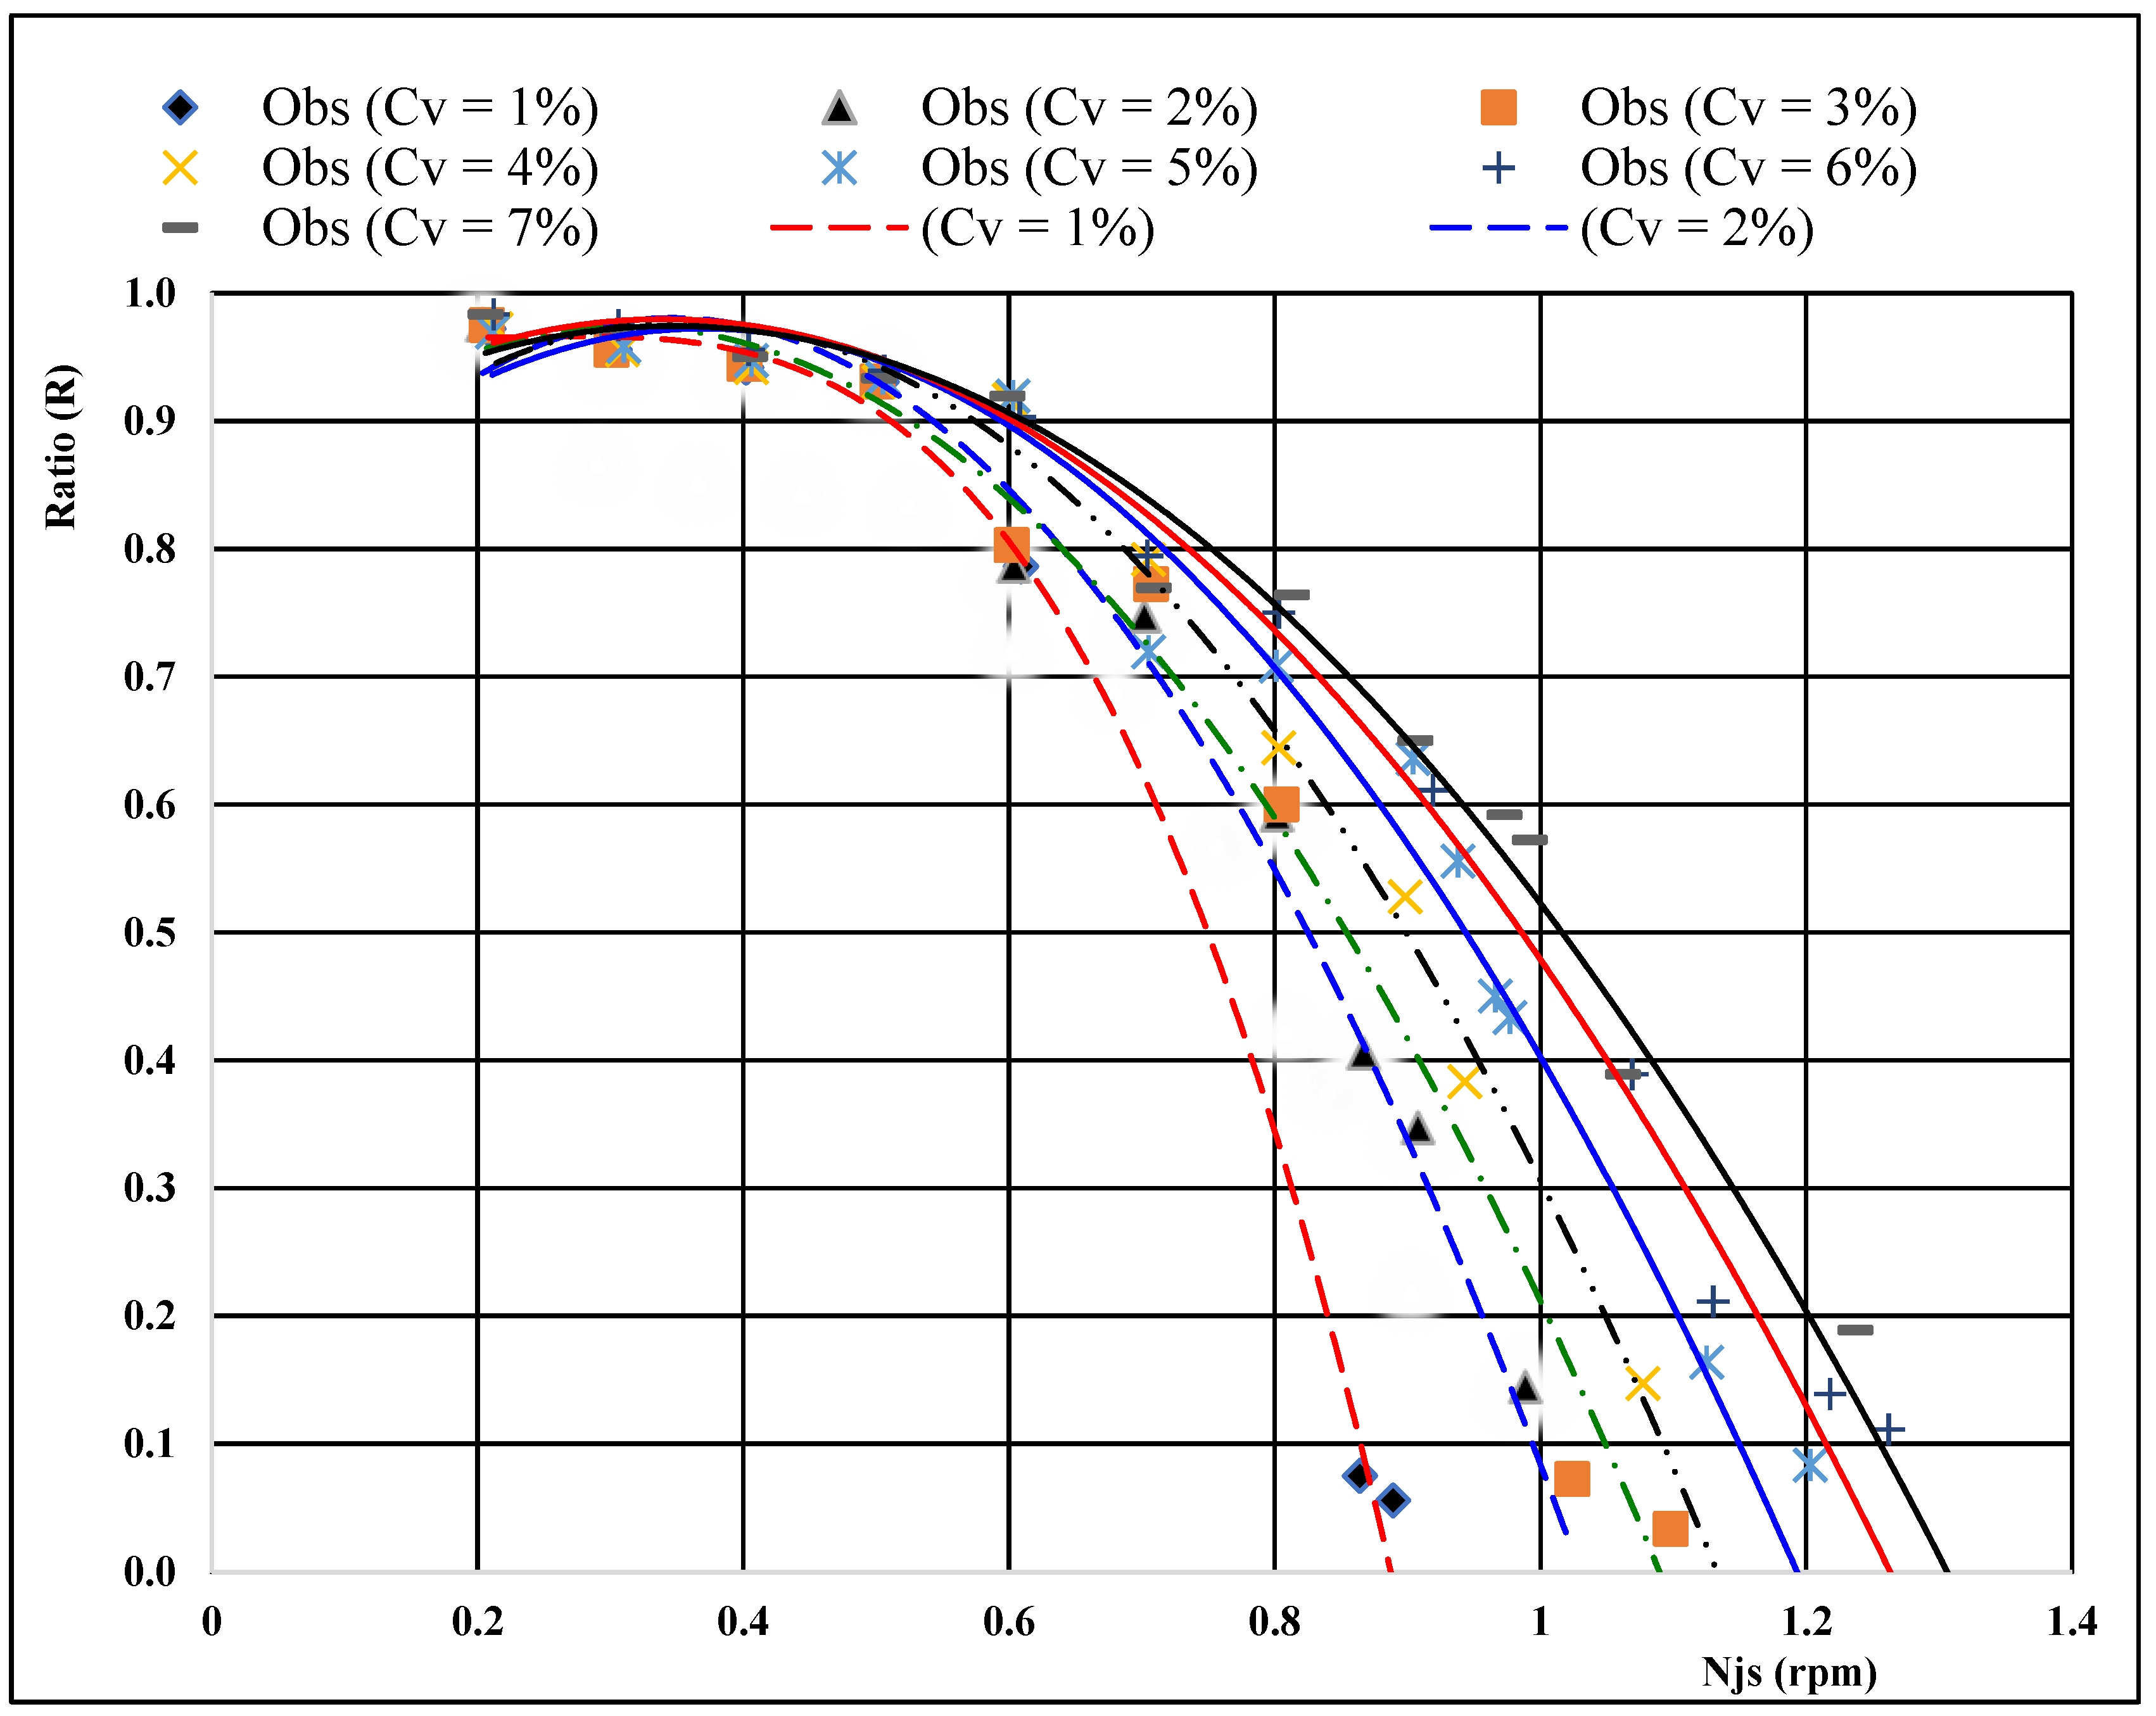
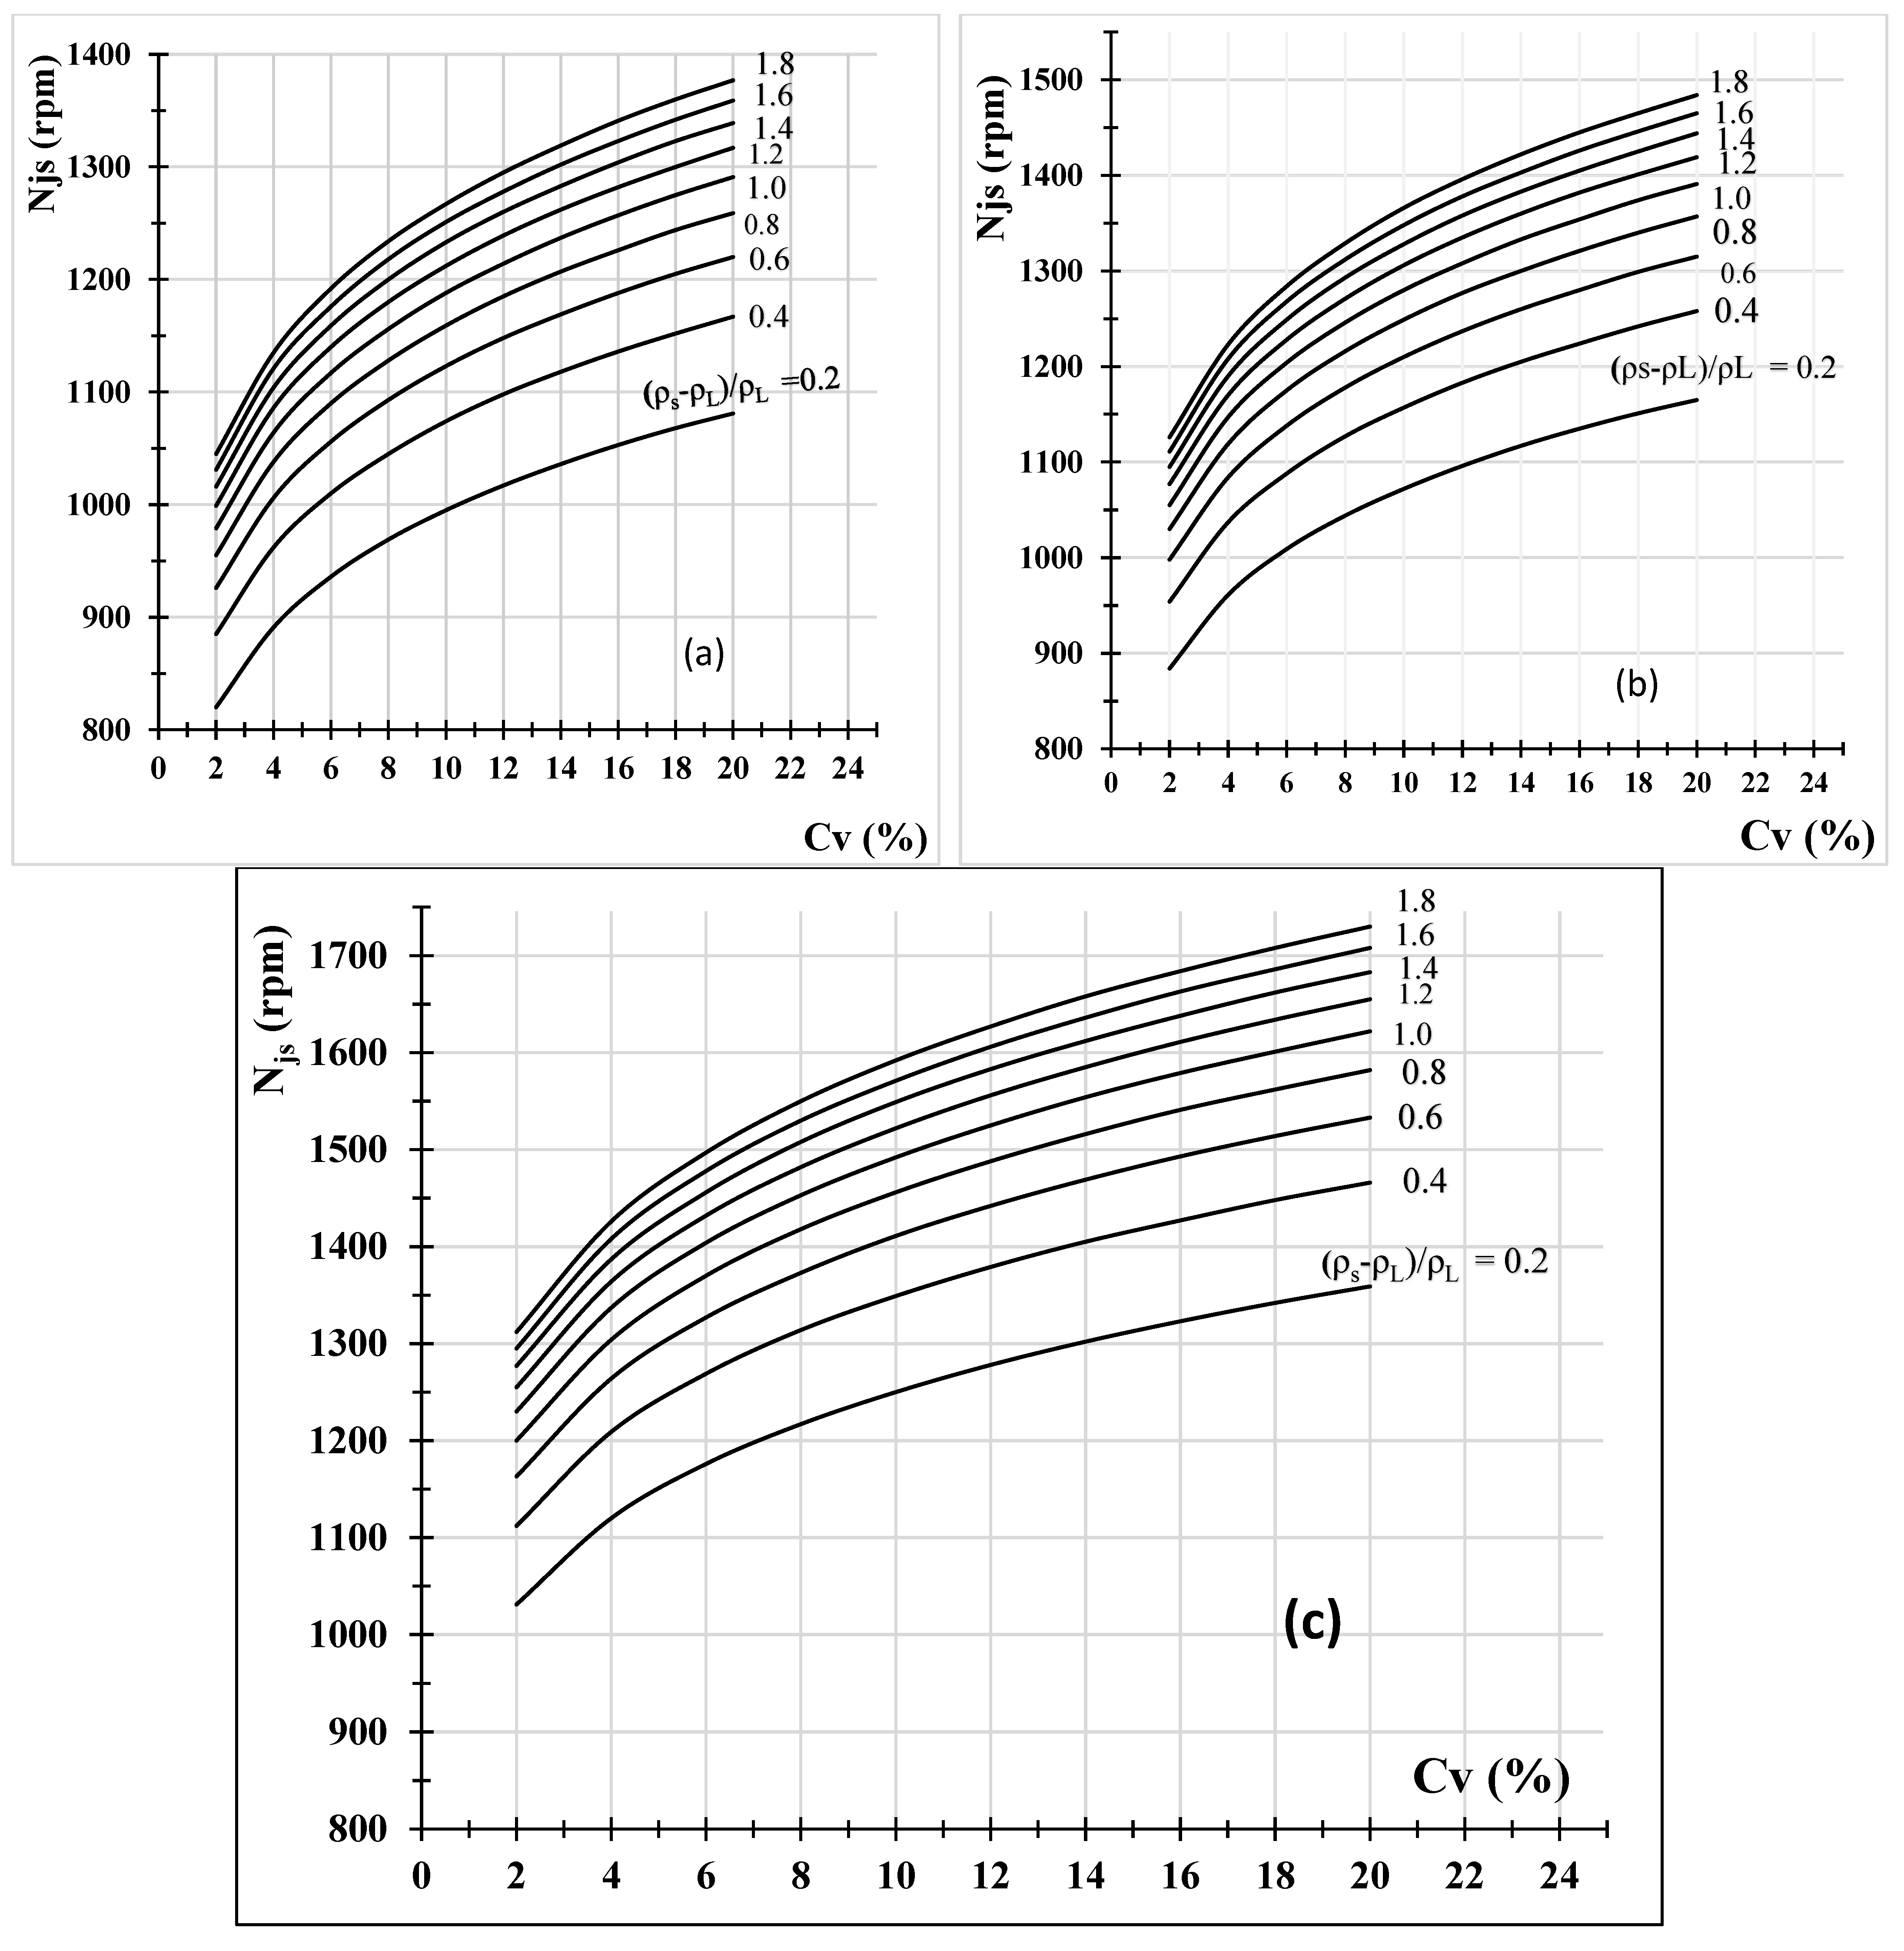
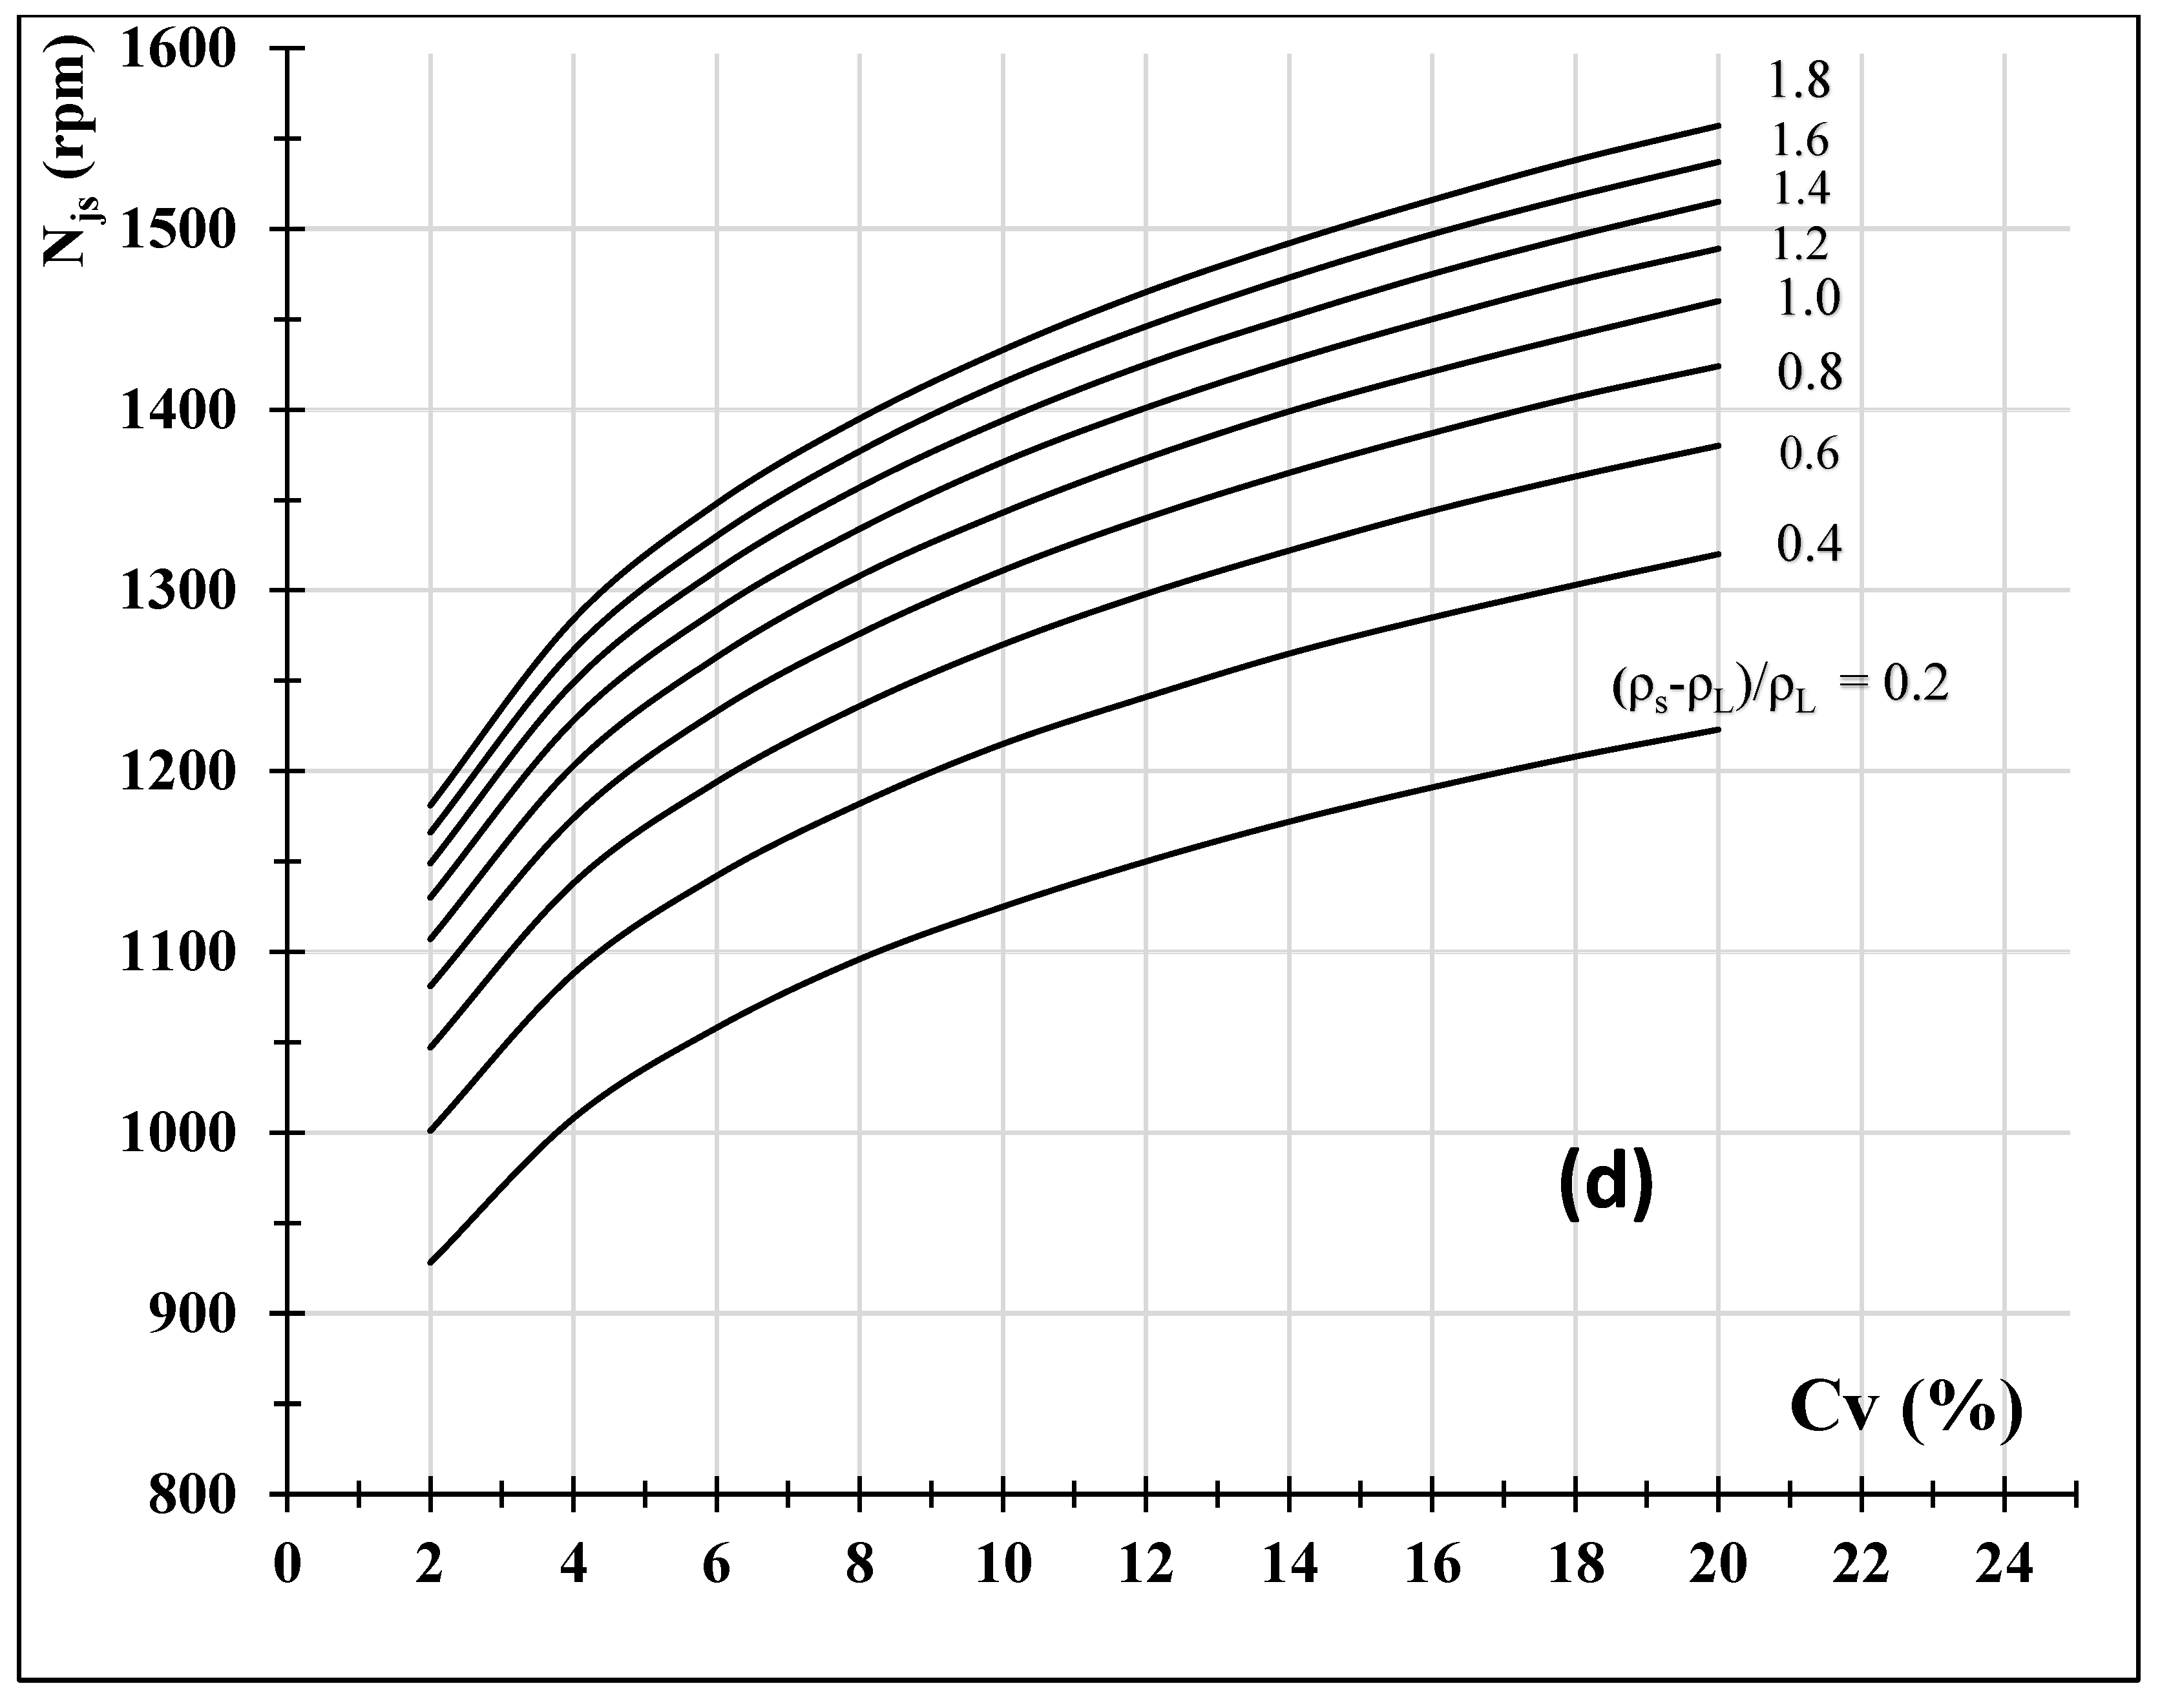
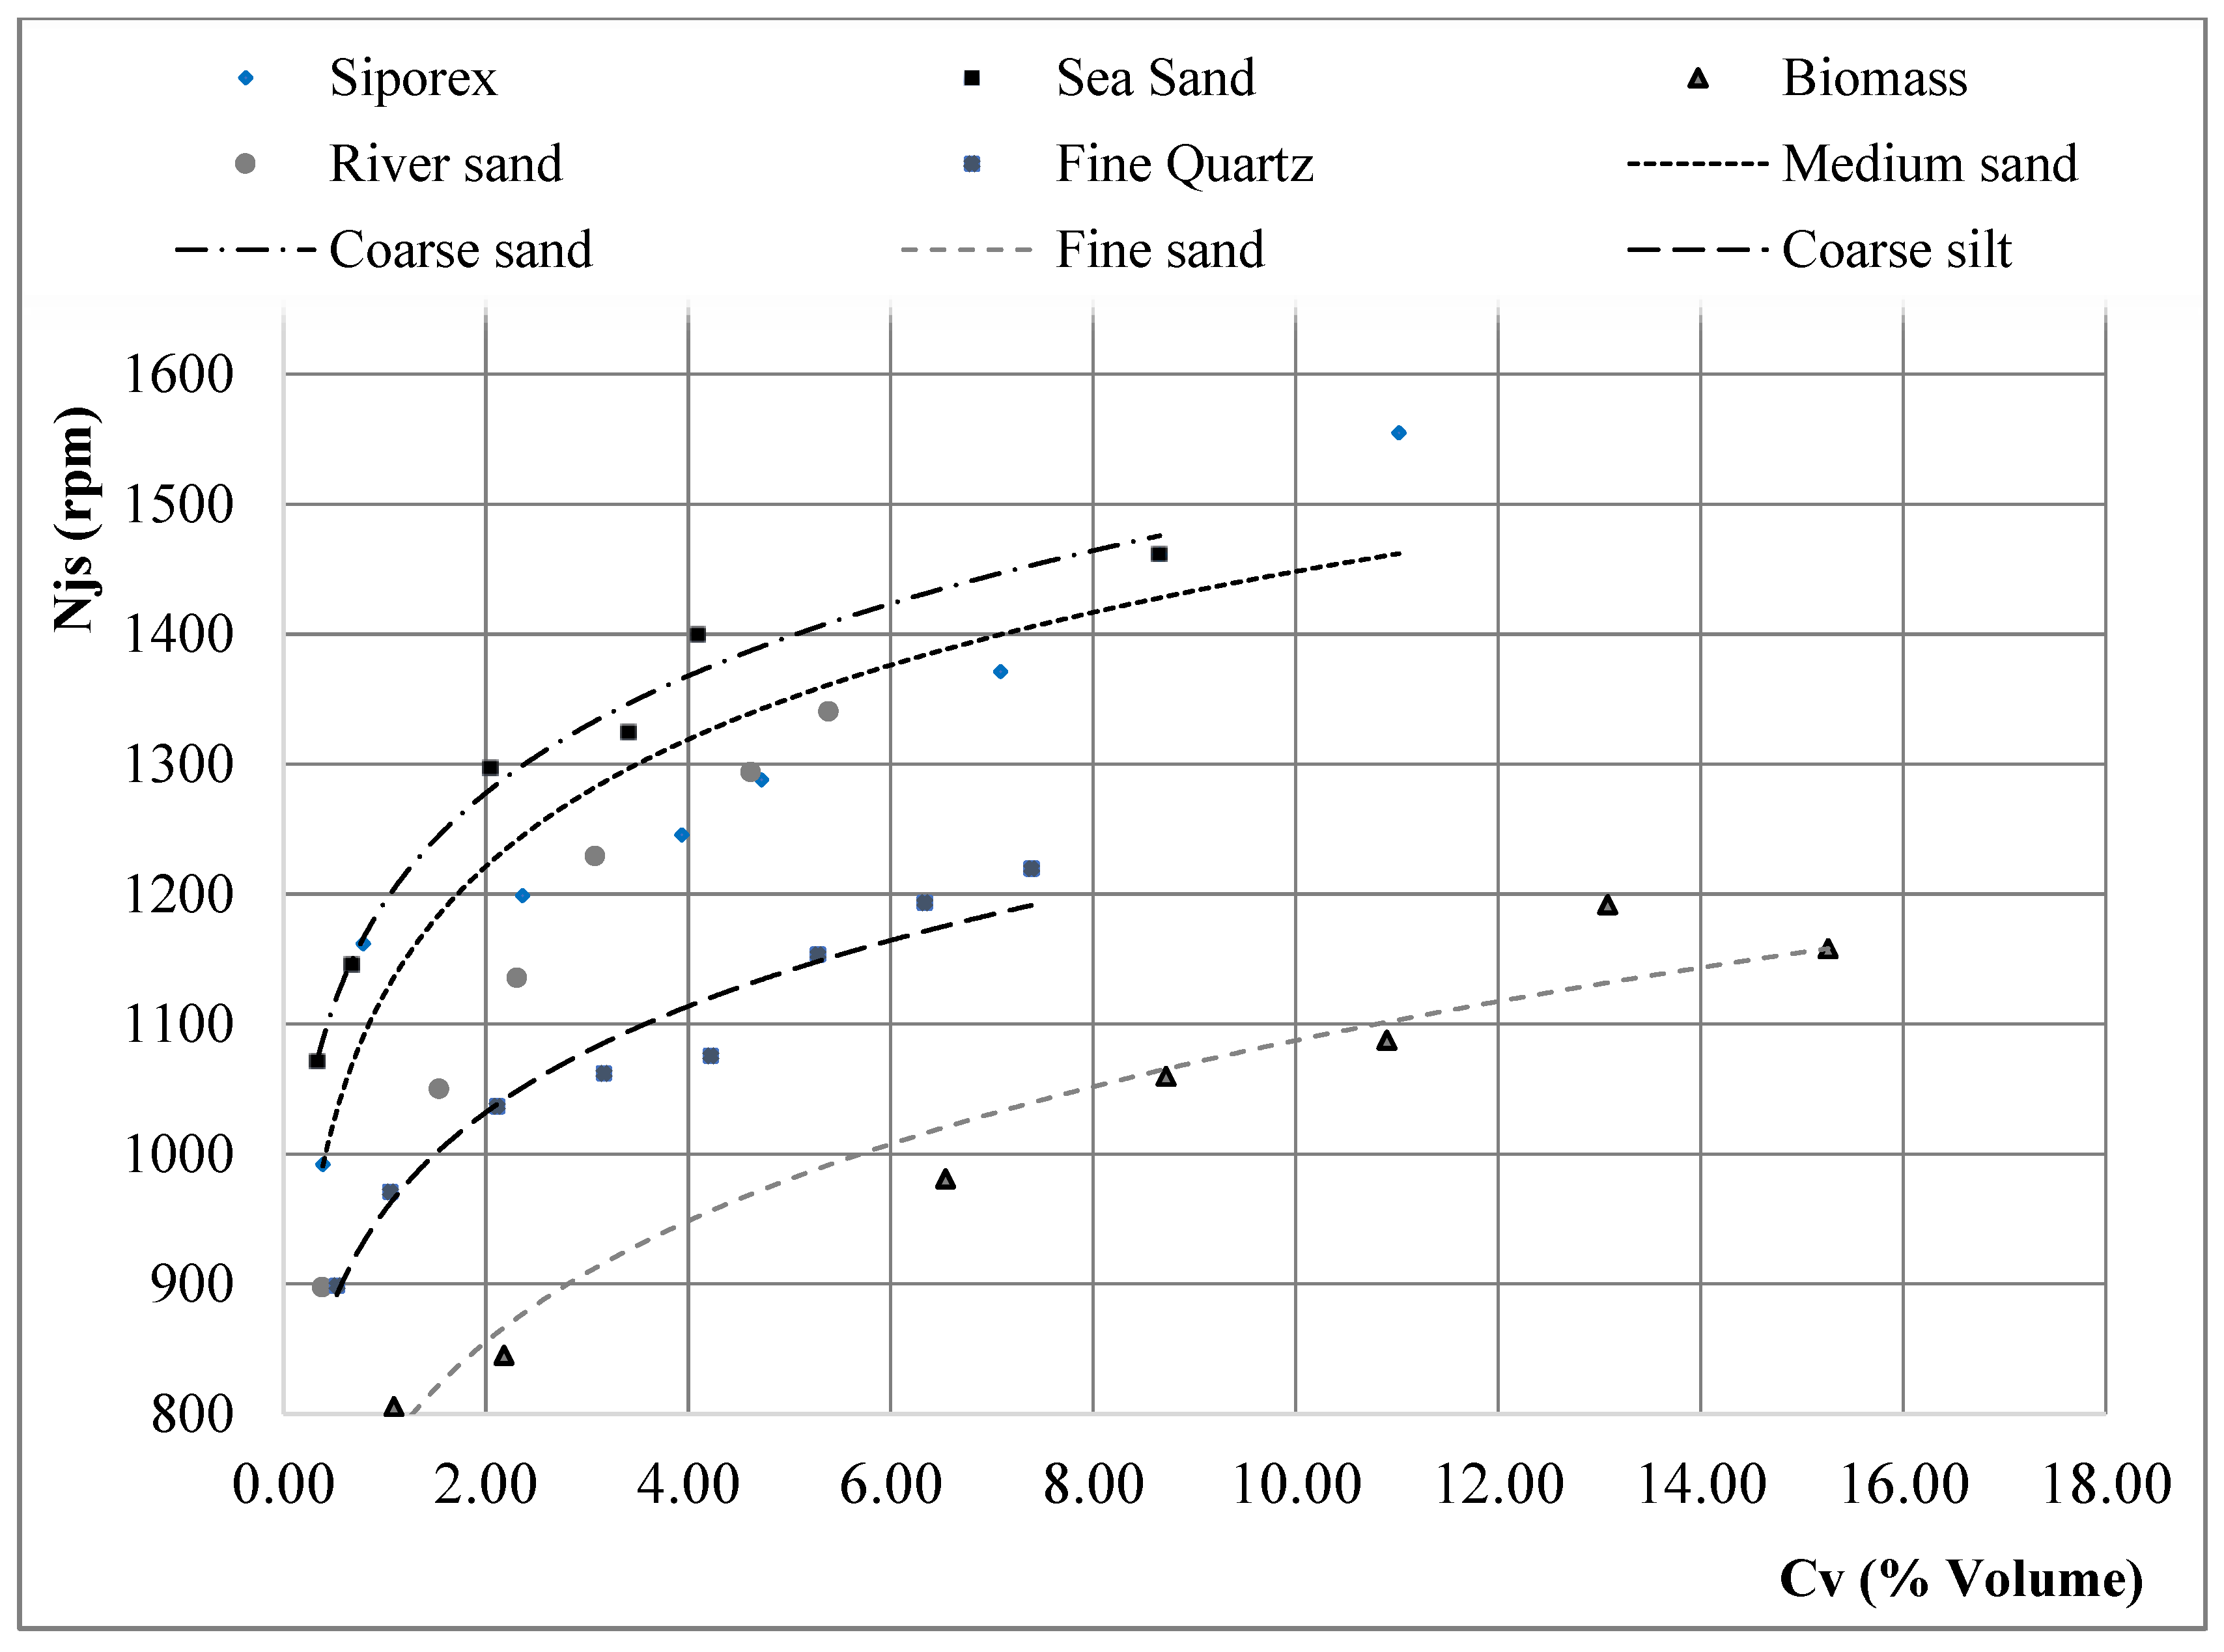
3.2. Effect of Particle Concentration

As indicated in Figure 6, we varied the concentration by volume Cv (percent v/v) for the different solid types. It was clear that increasing (Cv) increased the value of the velocity Njs, which lifted the settling bed and maintained all particles suspended. The same results were reported by Alouache et al. (2019) and Brucato et al. (2010) [2,27].
A noticeable dependence of Njs on the concentration was noted. We found that biomass had a low value of Njs compared to other types of solids with a relatively high density. The graph tendency is represented by a power function. The lines reporting the values of Njs for all particle sizes calculated using the proposed formula (Equation (5)) are illustrated within the same figure for comparison purposes. A noticeable convergence between the experimental and simulated values of Njs can be observed.

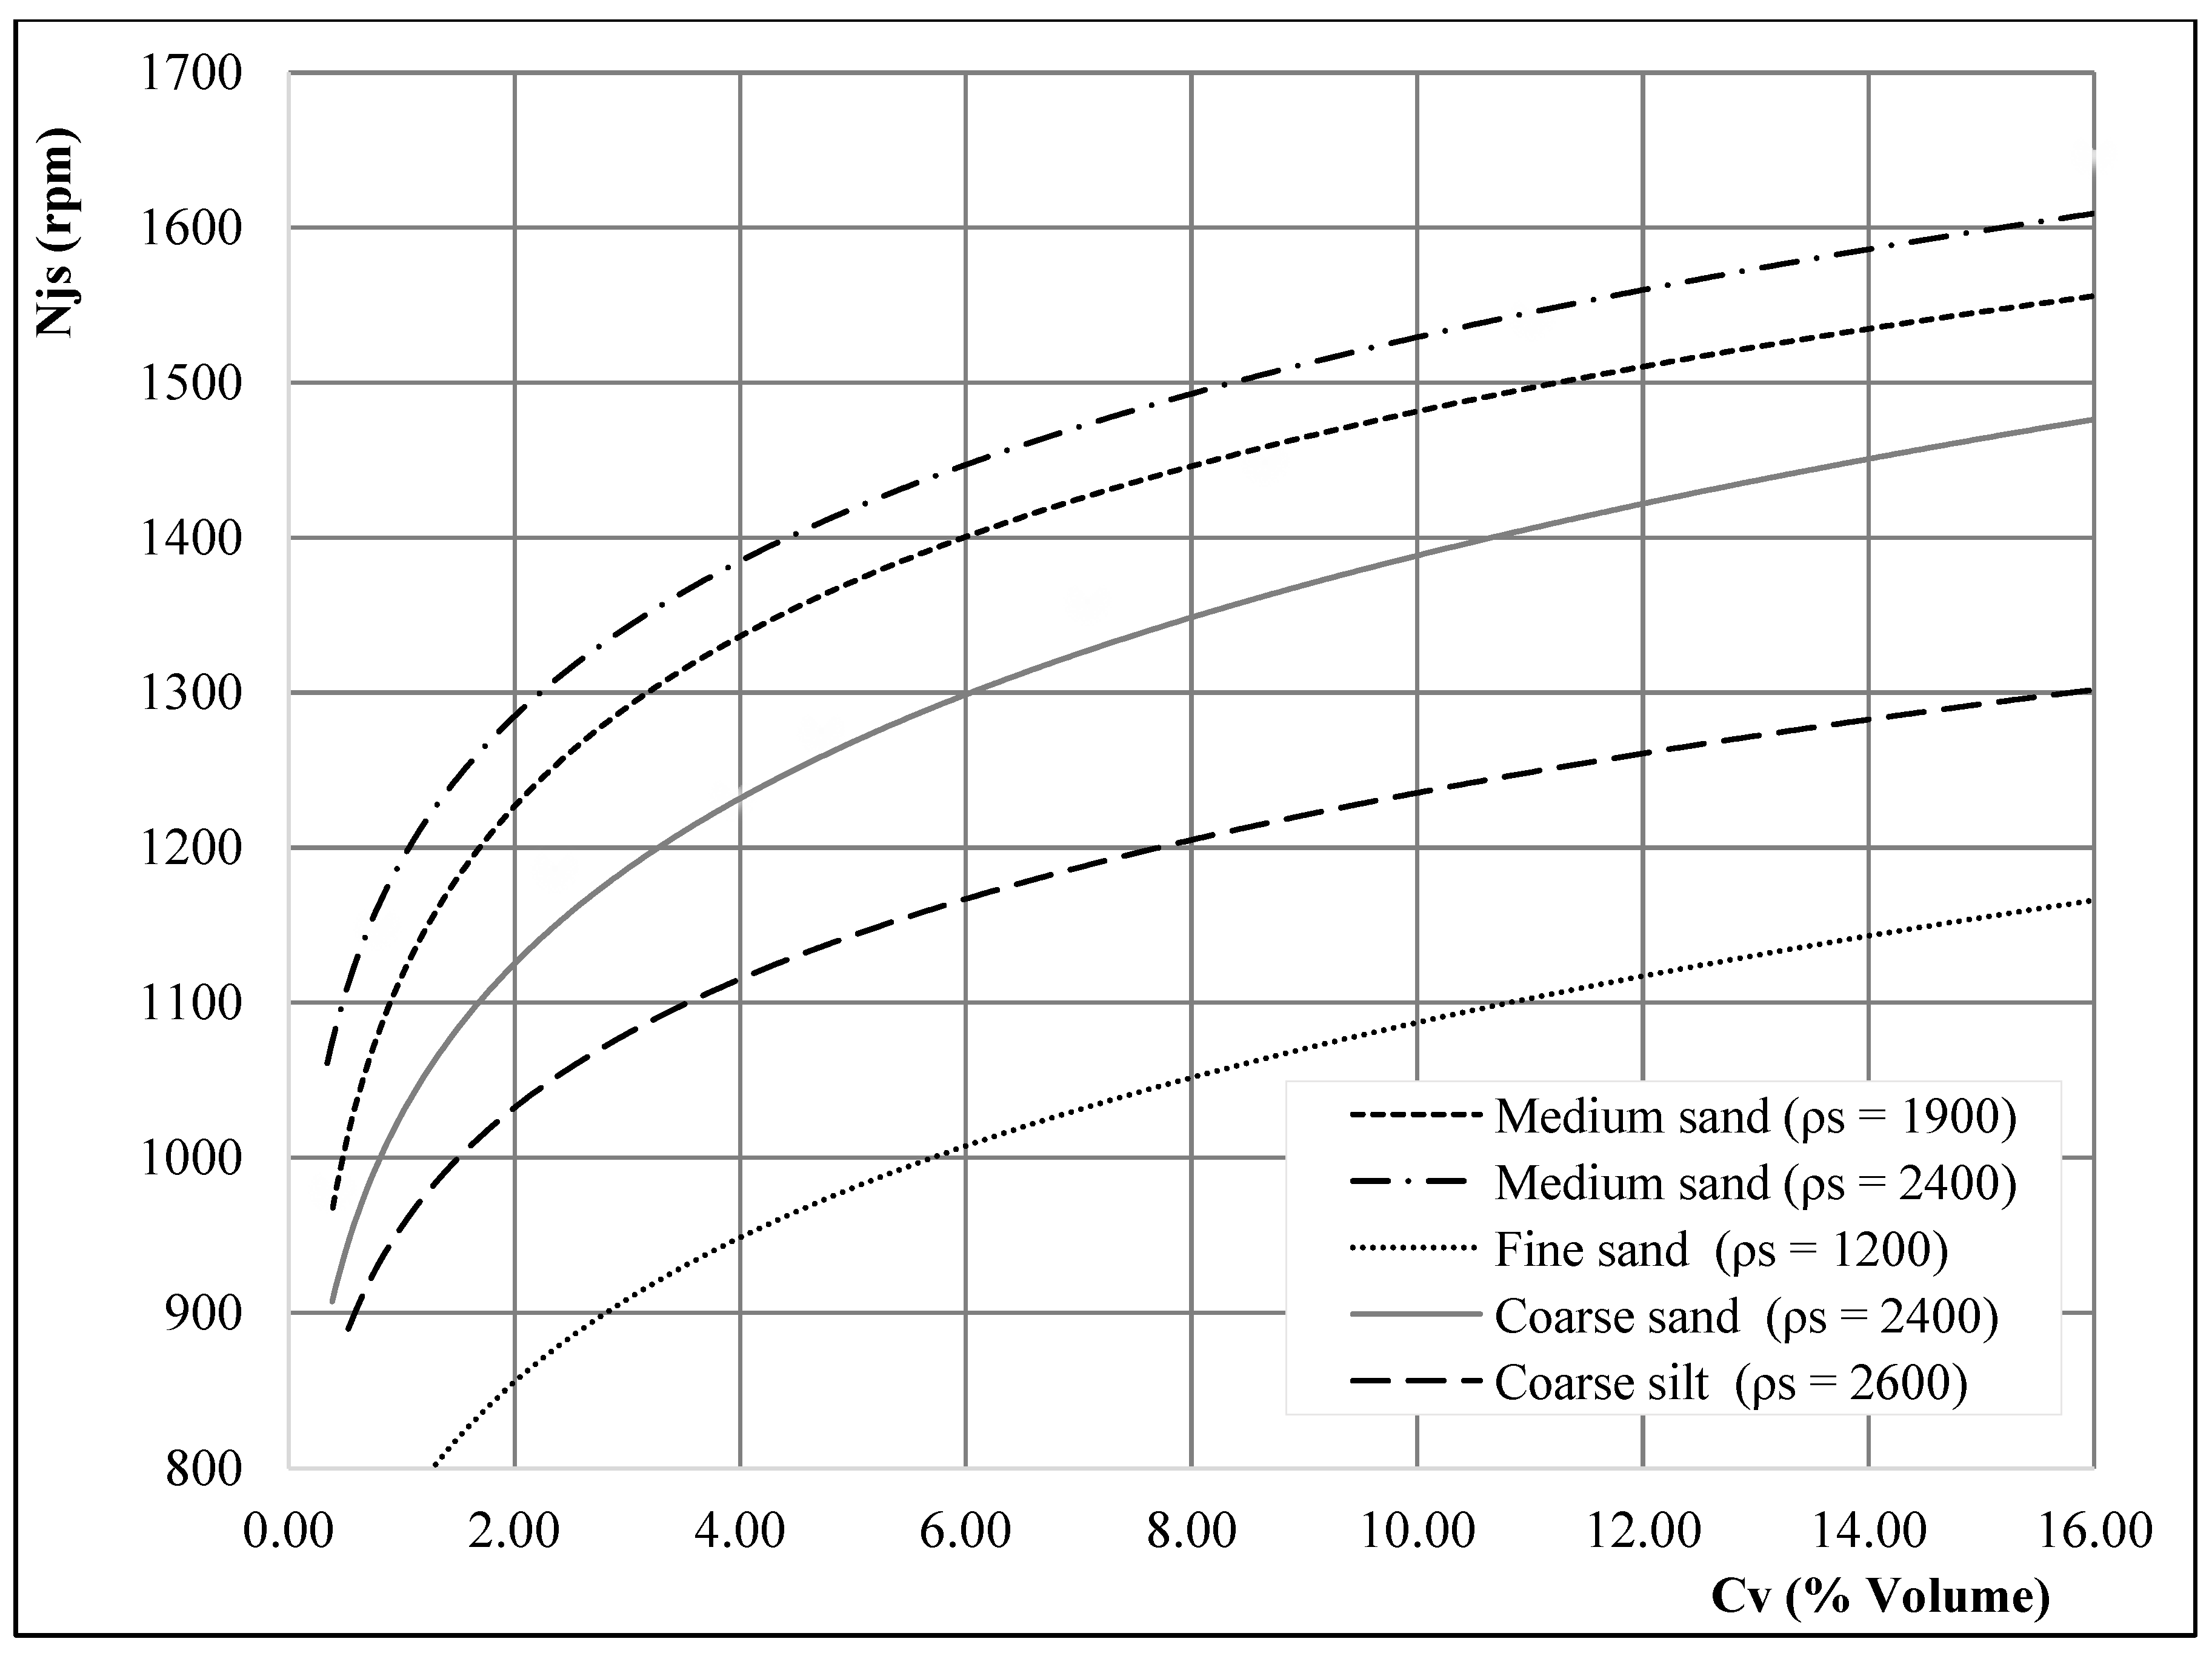
3.3. The Effect of Particle Density

Different types of material were studied, including siporex, sand, and biomass. These soils were classified based on their D50 values. The relative density varied between fine sand ( ρ s = 1.2), medium sand ( ρ s = 2.4), coarse sand ( ρ s = 2.4), coarse silt ( ρ s = 2.6), and medium sand ( ρ s   = 1.9). For the various densities, Figure 7 displays (Njs) as a function of volume concentration Cv (% by volume). The relative density of the solid particles had a significant impact on Njs. As the density increased, the just suspended speed required to assure the entire suspension in solution within the experimental error increased; we note that the same results were obtained by [2,27].
The variation of Njs with density seems to be illogical. It is clear that there are parameters that have more influence on Njs than density.
When looking at the solid classes, it can be concluded that the influence of particle size and geometry were more important than density. In Table 3, we can easily see this.
In the meantime, other researchers found that the concentration of solids had more influence on Njs, along with viscosity. They found that Njs decreased when the kinematic viscosity was increased [33]. However, all those hidden influences are included in the MNLR approach, making it a useful tool for this calculation.

4. Conclusions

The minimum speed for suspension in a torus reactor is influenced by the characteristics of the solid particles.
In this work, a novel model for the prediction of minimum suspension speed Njs for solid–liquid mixtures in a torus reactor was established. In a former paper, Alouache et al. (2019) [2], proposed a formula for Njs calculations. This formula was derived from the Zwitering formula coupled with a relation for the minimum liquid velocity necessary to prevent deposition and a relation between the impeller rotational speed and fluid velocity. The result was a general formula that expresses the Njs relation function of fluid and solid properties and the geometrical characteristics of the impeller and torus reactor. This formula gave good results for low density/size particles; however, for a larger particle size, the results were not quite as good. The authors’ approach was to propose a formula than compared the calculated values with experimental values, while our new model was built starting from experimental values divided into two parts: (80%) for model training, with the remaining data (20%) for validation.
As a result of this observation, generalizing a single formula for calculating Njs for all classes of solids seems to be erroneous, and would contribute to the failure of the empirical formula.
In this research, the solid particles were divided into classes of solids based on their density and particle diameter. The sieving operation gave their D50 diameter. In accordance with the standard ISO 14688-1:2017, the data were divided into classes of solids based on their D50 statistical diameter. The four solid classes (fine sand, medium sand, coarse sand, and coarse silt) available in the database were used in the study.
The purpose of this research was the development of new formulas for determining suspension velocities in a torus reactor for each class of material destined to be used in a chemical or biological process. The study was based on laboratory visual measurements of suspension speeds for several types of solid and using the same experimental equipment as Alouache et al. (2019) [2].
The measured experimental impeller speeds were extrapolated to derive the Njs values. Multiple nonlinear regression (MNLR) models were used to generate four new solid class formulas. A supervised learning algorithm was also used to solve the hyperparameters of each new equation, in order to develop efficient models, and the gradient descent approach was employed to optimize and minimize the difference between the observed Njs and the simulated Njs, using suggested novel formulas. The new formulas were evaluated and validated using a variety of statistical criteria (R2, RSR, and PBIAS).
Looking at the QQ plot of the observed versus simulated Njs in Figure 4, we can deduce that the values seem to be very good and the values of R2, RSR, and PBIAS confirm this. Indeed, the values of R2 (R2 > 90) show a great similarity between the calculated and measured values.
On the other hand, regarding the evaluation criterion RSR, all values are also very good (RSR < 32). This demonstrates the effectiveness of the results using the model in Equation (5). Finally, the PBIAS values (|PBIAS| < 0.34) show that these equations allowed a very good simulation of Njs values for solid particles. The difference between the overestimation and underestimation was within an acceptable range (see Table 2).
The results established that the novel formulas and measured data for the small particle size classes have a sufficient level of similarity and variability (fine sand, medium sand). Similarly, the results are considered very satisfactory for materials with large particle sizes (coarse sand, coarse silt). There is no doubt that as the particle size increased, the performance of the proposed new formulas remained good.
In comparison to the formulas developed by Alouache et al. (2019) [2], which cannot be extended to large particle sizes, the new formulas for calculating Njs performed significantly better. For each of these solid types, the suggested new formulas had a very good ability for simulating Njs.
This study also presents a new Njs estimating tool for each solid type, in the form of calculation abacuses. These abacuses relate to the new formulas and provide a more accurate and simple technique for estimating Njs in a torus reactor.
Figure 6 and Figure 7 show that for a fixed particle concentration, the influence of particle size and geometry is more important than density. If Table 3 is examined, it can be seen that Njs depends more on the bulk density of the solid particles than the density. The use of new methods such as tomography or imaging methods for the study of Njs in torus reactors will certainly have an interesting impact and could be a subject for future works.

Author Contributions

Conceptualization, L.N. and A.A.; methodology, H.E.S., A.A. and L.N.; software, M.A. and A.L.; validation, L.N., A.S. and A.L.; formal analysis, H.E.S., A.A., A.L., M.A. and M.M.; investigation, H.E.S., A.A., A.S. and A.L.; resources, L.N.; data curation, H.E.S., A.A., M.A. and L.N.; writing—original draft preparation, H.E.S. and A.A.; writing—review and editing, H.E.S., A.A., M.M., A.S. and L.N.; visualization, H.E.S., A.A., L.N., A.L. and M.A.; supervision, L.N.; project administration, L.N.; funding acquisition, L.N. All authors have read and agreed to the published version of the manuscript.

Funding

This project has been funded by the Université M’hamed Bougara de Boumerdes, Algeria, through the PRFU project number A16N01UN350120200002, 2020.

Institutional Review Board Statement

Not applicable.

Informed Consent Statement

Not applicable.

Data Availability Statement

Data are available in the manuscript.

Acknowledgments

The financial support of the PRFU project number A16N01UN350120200002 of Université M’hamed Bougara de Boumerdes, Algeria is gratefully acknowledged.

Conflicts of Interest

The authors declare no conflict of interest.

References

  1. Teoman, B.; Sirasitthichoke, C.; Potanin, A.; Armenante, P.M. Determination of the just-suspended speed, Njs, in stirred tanks using electrical resistance tomography (ERT). AIChE J. 2021, 67, e17354. [Google Scholar] [CrossRef]
  2. Alouache, A.; Selatnia, A.; Lefkir, A.; Halet, F.; Sayah, H.E.; Nadjemi, B. Determination of the just suspended speed for solid particle in torus reactor. Water Sci. Technol. 2019, 80, 48–58. [Google Scholar] [CrossRef]
  3. Armenante, P.M.; Kirwan, D.J. Mass transfer to microparticles in agitated systems. Chem. Eng. Sci. 1989, 44, 2781–2796. [Google Scholar] [CrossRef]
  4. Laederach, H.; Widmer, F. Le bioreacteur torique. Inf. Chim. 1984, 249, 157–160. [Google Scholar]
  5. Tanaka, M.; Sendai, T.; Hosogai, K. Flowing characteristics in a circular loop reactor. Chem. Eng. Res. Des. 1989, 67, 423–427. [Google Scholar]
  6. Zwietering, T.N. Suspending of solid particles in liquid by agitators. Chem. Eng. Sci. 1958, 8, 244–253. [Google Scholar] [CrossRef]
  7. Nienow, A.W. Suspension of solid particles in turbine agitated baffled vessels. Chem. Eng. Sci. 1968, 23, 1453–1459. [Google Scholar] [CrossRef]
  8. Baldi, G.; Conti, R.; Alaria, E. Complete suspension of particles in mechanically agitated vessels. Chem. Eng. Sci. 1977, 33, 21–25. [Google Scholar]
  9. Raghava Rao, K.; Rewatkar, V.; Joshi, J. Critical impeller speed for solid suspension in mechanically agitated contactors. AIChE J. 1988, 34, 1332–1340. [Google Scholar]
  10. Teoman, B.; Shastry, S.; Abdelhamid, S.; Armenante, P.M. Imaging method for the determination of the minimum agitation speed, Njs, for solids suspension in stirred vessels and reactors. Chem. Eng. Sci. 2021, 231, 116263. [Google Scholar] [CrossRef]
  11. Yang, F.; Zhang, C.; Sun, H.; Liu, W. Solid-liquid suspension in a stirred tank driven by an eccentric-shaft: Electrical resistance tomography measurement. Powder Technol. 2022, 411, 117943. [Google Scholar] [CrossRef]
  12. Paul, E.L.; Atiemo-Obeng, V.A.; Kresta, S.M. Handbook of Industrial Mixing: Science and Practice; Wiley-Blackwell: Hoboken, NJ, USA, 2004. [Google Scholar] [CrossRef]
  13. Bao, Y.; Hao, Z.; Gao, Z.; Shi, L.; Smith, J. Suspension of buoyant particles in a three phase stirred tank. Chem. Eng. Sci. 2005, 60, 2283–2292. [Google Scholar] [CrossRef]
  14. Tagawa, A.; Dohi, N.; Kawase, Y. Dispersion of floating solid particles in aerated stirred tank reactors: Minimum impeller speeds for off-surface and ultimately homogeneous solid suspension and solids concentration profiles. Ind. Eng. Chem. Res. 2006, 45, 818–829. [Google Scholar] [CrossRef]
  15. Norwood, D. Reactors. Jpn. Pat. Showa 1962, 37, 87–100. [Google Scholar]
  16. Sato, Y.; Murakami, Y.; Hirose, T.; Hashigushi, Y.; Ono, S.; Ichikawa, M. Flow pattern, circulation velocity and pressure loss in loop reactor. J Chem Eng Jpn 1979, 12, 448–453. [Google Scholar] [CrossRef]
  17. Murakami, Y.; Hirose, T.; Ono, S.; Eitoku, H.; Nishijima, T. Power Consumption and Pumping Characteristics in a Loop Reactor. Ind. Eng. Chem. Process Des. Dev. 1982, 21, 273–276. [Google Scholar] [CrossRef]
  18. Nouri, L.; Legrand, J.; Popineau, Y.; Belleville, P. Enzymatic hydrolysis of wheat proteins Part 2: Comparison of performance of batch-stirred and torus reactors. Chem. Eng. J. 1997, 65, 195–199. [Google Scholar] [CrossRef]
  19. Ali, A.; Ammar, S.; Farid, H.; Lefkir, A.; Sayah, H.; Boubekeur, N. Just Suspended Speed for Solid Particle Transport in TorusReactor. In Green Energy and Technology; Springer: Cham, Switzerland, 2019. [Google Scholar] [CrossRef]
  20. Legrand, J.; Gue, J.; Berot, S.; Popineau, Y.; Nouri, L. Acetylation of Pea Isolate in a Torus Microreactor. Biotechnol. Bioeng. 1997, 53, 409–414. [Google Scholar] [CrossRef]
  21. Annad, M.; Lefkir, A.; Mammar-Kouadri, M.; Bettahar, I. Development of a local scour prediction model clustered by soil class. Water Pract. Technol. 2021, 16, 1159–1172. [Google Scholar] [CrossRef]
  22. Adiguzel, D.; Bascetin, A. The investigation of effect of particle size distribution on flow behavior of paste tailings. J. Environ. Manag. 2019, 243, 393–401. [Google Scholar] [CrossRef]
  23. Belleville, P.; Nouri, L.; Legrand, J. Mixing characteristics in the torus reactor. Chem. Eng. Technol. 1992, 15, 282–289. [Google Scholar] [CrossRef]
  24. Nasrallah, N.; Legrand, J.; Bensmaili, A.; Nouri, L. Effect of impeller type on the mixing in torus reactors. Chem. Eng. Process. 2008, 47, 2175–2183. [Google Scholar] [CrossRef]
  25. Legrand, J.; Benmalek, N.; Imerzoukene, F.; Yeddou, A.-R.; Halet, F. Characterisation and comparison of the micromixing efficiency in torus and batch stirred reactors. Chem. Eng. J. 2008, 142, 78–86. [Google Scholar] [CrossRef]
  26. Armenante, P.M.; Huang, Y.T.; Li, T. Determination of the minimum agitation speed to attain the just dispersed state in solid-liquid and liquid-liquid reactors provided with multiples impellers. Chem. Eng. Sci. 1992, 47, 2865–2870. [Google Scholar] [CrossRef]
  27. Brucato, A.Ã.; Cipollina, A.; Micale, G.; Scargiali, F.; Tamburini, A. Particle suspension in top-covered unbaffled tanks. Chem. Eng. Sci. 2010, 65, 3001–3008. [Google Scholar] [CrossRef]
  28. Jirout, T.; Rieger, F. Impeller design for mixing of suspensions. Chem. Eng. Res. Des. 2011, 89, 1144–1151. [Google Scholar] [CrossRef]
  29. Kuzmani, N.; Zaneti, R.; Akrap, M. Impact of floating suspended solids on the homogenisation of the liquid phasein dual-impeller agitated vessel. Chem. Eng. Process. 2008, 47, 663–669. [Google Scholar] [CrossRef]
  30. Ravelet, F.; Bakir, F.; Khelladi, S.; Rey, R. Experimental study of hydraulic transport of large particles in horizontal pipes. Exp. Therm. Fluid Sci. 2013, 45, 187–197. [Google Scholar] [CrossRef]
  31. Moriasi, D.; Arnold, J.; Van Liew, M.; Bingner, R.; Harmel, R.; Veith, T. Model evaluation guidelines for systematic quantification of accuracy in watershed simulations. Trans. ASABE 2007, 50, 885–900. [Google Scholar] [CrossRef]
  32. Abeysingha, N.S.; Singh, M.; Sehgal, V.K.; Khanna, M.; Pathak, H.; Jayakody, P.; Srinivasan, R. Assessment of water yield and evapotranspiration over 1985 to 2010 in the Gomti River basin in India using the SWAT model. Curr. Sci. 2015, 108, 2202–2212. [Google Scholar]
  33. Tamburini, A.; Brucato, A.; Busciglio, A.; Cipollina, A.; Grisafi, F.; Micale, G.; Scargiali, F.; Vella, G. Solid-liquid suspensions in top-covered unbaffled vessels: Influence of particle size, liquid viscosity, impeller size, and clearance. Ind. Eng. Chem. Res. 2014, 53, 9587–9599. [Google Scholar] [CrossRef]
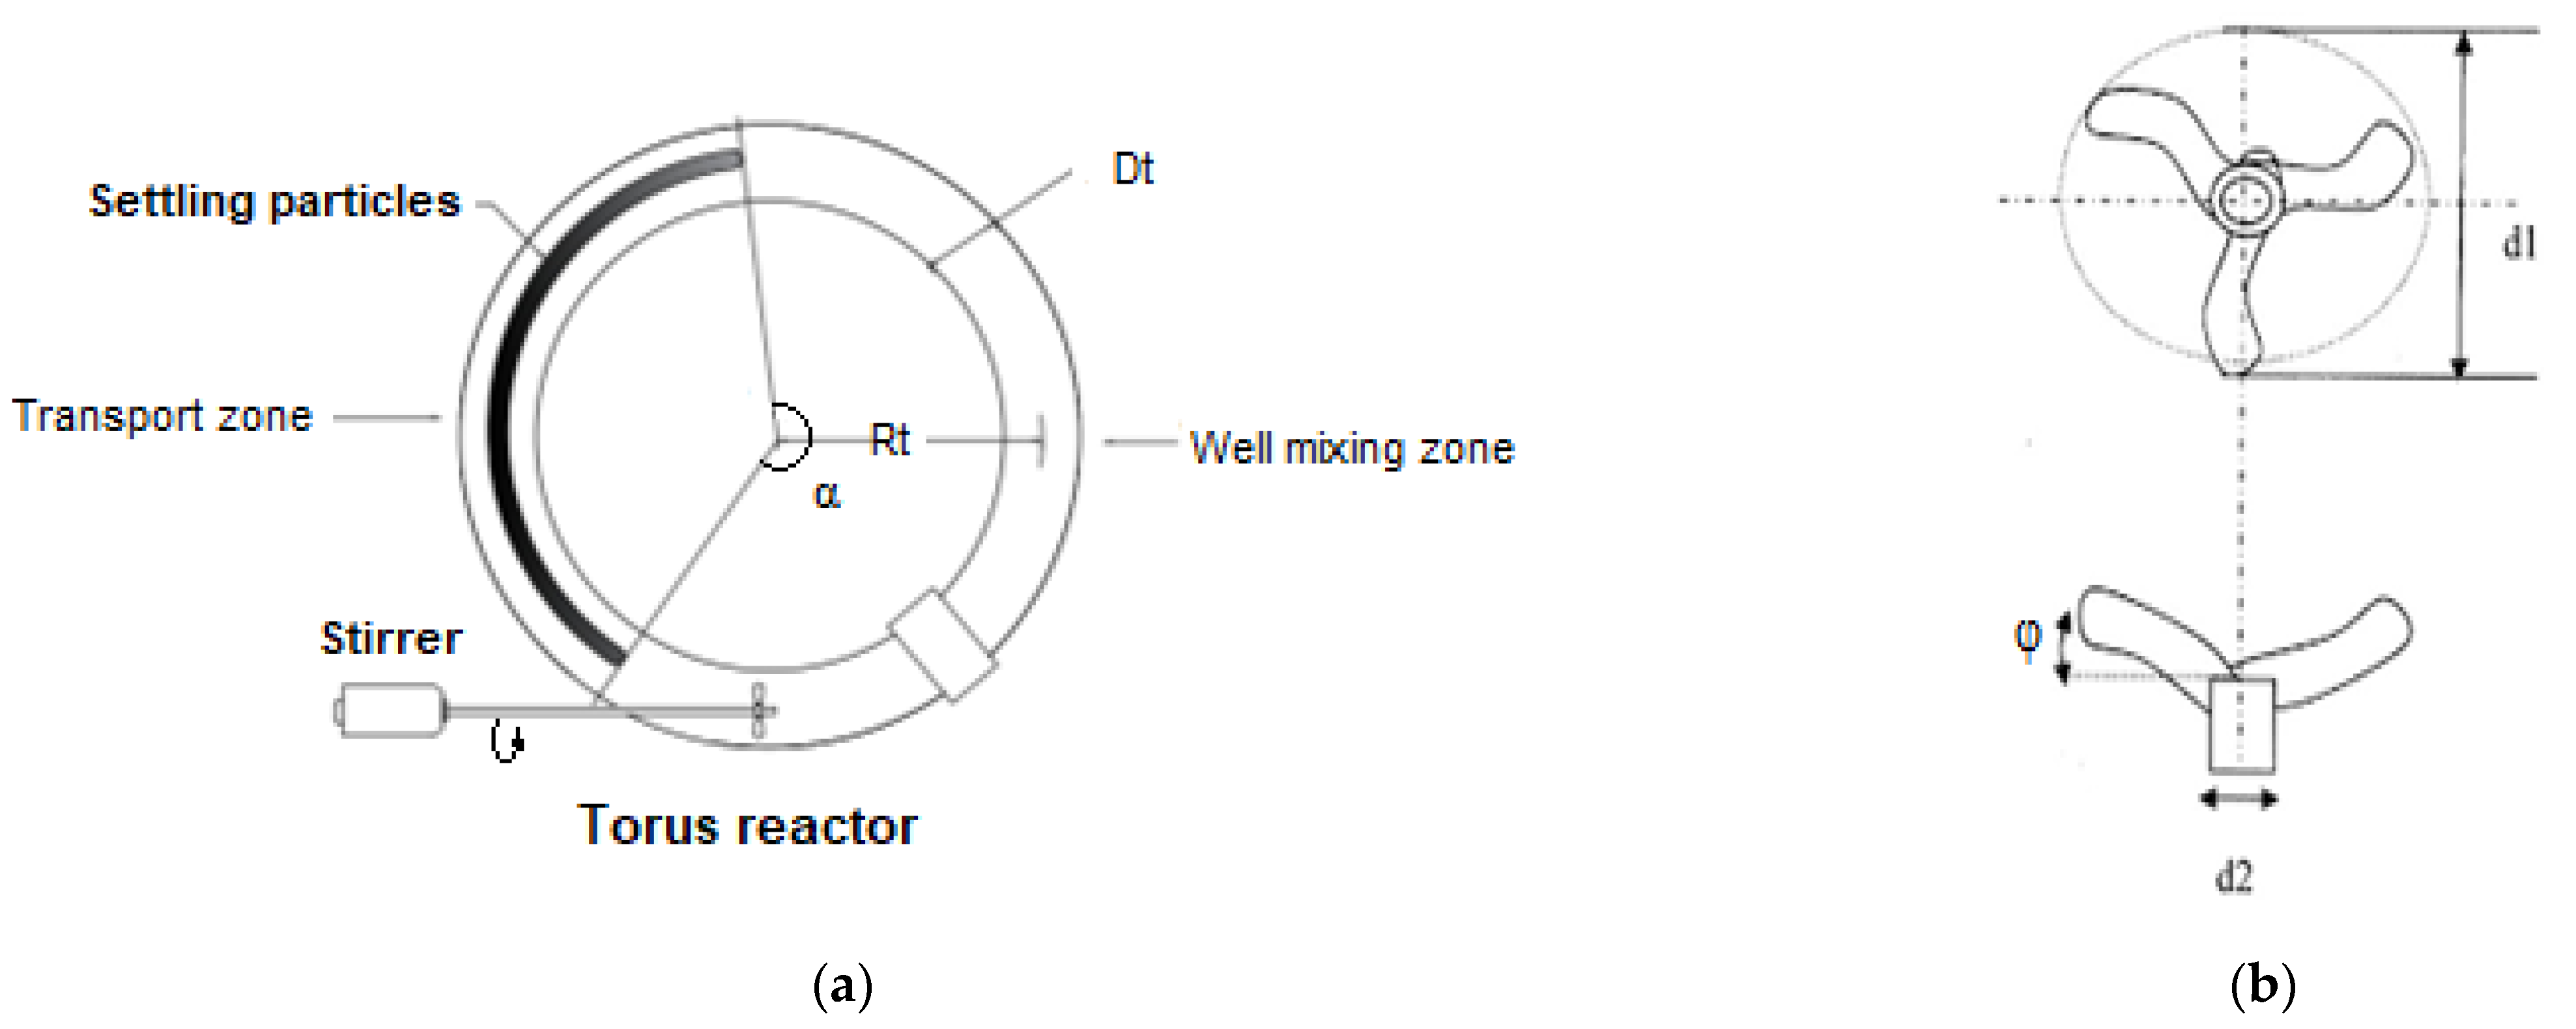
Figure 1. Torus reactor (a) description of settling bed (b). The marine screw impeller [2].
Separations 10 00117 g001
Figure 2. Example of determination of Njs by extrapolation.
Separations 10 00117 g002
Figure 3. Sieve size curves.
Separations 10 00117 g003
Figure 4. Q–Q plot curves: (a) training, (b) validation.
Separations 10 00117 g004aSeparations 10 00117 g004b
Figure 5. Njs calculation charts for different solid classes (a) Coarse silt (b) Fine sand (c) Medium sand (d) Coarse sand.
Separations 10 00117 g005aSeparations 10 00117 g005b
Figure 6. Effect of particle concentration on Njs.
Separations 10 00117 g006
Figure 7. Effect of particle density on Njs.
Separations 10 00117 g007
Table 1. The torus reactor and marine screw impeller characteristics.
torus reactorDt (mm)Lt (mm)Rt (mm)
501400250
marine screw impellerd1 (mm)d2 (mm) φ
40645°
Table 2. Performance evaluation according to the statistical criteria.
EvaluationR2 (%)RSR (%)PBIAS (%)
Very good 75 < R 2 < 100 0 < R S R < 50 | P B I A S | < 10
Good 65 < R 2 < 75 50 < R S R < 60 10 < | P B I A S | < 15
Satisfactory 50 < R 2 < 65 60 < R S R < 70 15 < | P B I A S | < 25
Unsatisfactory R 2 < 50 R S R > 70 | P B I A S | > 25
Table 3. Solid particle classification.
TypeD50 (mm)Density (kg/m3)Bulk Density (kg/m3)Diameter Range (mm)Class
River Sand1.55240013000.63 < dp < 2.00Coarse sand
Siporex0.6190006350.2 < dp < 0.63Medium sand
Sea Sand0.62240014640.2 < dp < 0.63Medium sand
Biomass0.1812004590.063 < dp < 0.2Fine sand
Fine Quartz0.0526009470.02 < dp < 0.063Coarse silt
Table 4. Validation criteria values.
Solid ClassesR2 (%)RSR (%)PBIAS (%)
TrainingCoarse sand97.9725.92−0.34
Medium sand90.6632.090.18
Fine sand94.8930.380.27
Coarse silt98.2913.90−0.06
Global95.1822.050.05
Validation 98.4720.38−0.35
Disclaimer/Publisher’s Note: The statements, opinions and data contained in all publications are solely those of the individual author(s) and contributor(s) and not of MDPI and/or the editor(s). MDPI and/or the editor(s) disclaim responsibility for any injury to people or property resulting from any ideas, methods, instructions or products referred to in the content.

