

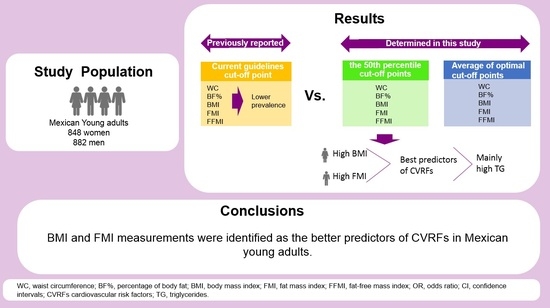
A New Approach Using BMI and FMI as Predictors of Cardio-Vascular Risk Factors among Mexican Young Adults
 , , ,
, , ,  and
and
Abstract
:
1. Introduction
2. Materials and Methods
2.1. Study Population
2.2. Anthropometric and Body Composition Measurements, and Blood Pressure
2.3. Biochemical Measurements
2.4. Definition of Cardiovascular Risk Factors
2.5. Statistics Analysis
3. Results
3.1. Characteristics of Study Participants
3.2. Optimal Cut-Off Points of Anthropometric and Body Composition Measures by ROC Curve Analysis
3.3. Association of Anthropometric and Body Composition Measures and Cardiovascular Risk Factors Using ROC Curve Analyses
3.4. Prevalence of Anthropometric and Body Composition Measures, and Cardiovascular Risk Factors
3.5. Odds Ratios of Cardiovascular Risk Factors by Anthropometric and Body Composition Measures
3.6. Correlations between Anthropometric and Body Composition Measures and Cardiovascular Risk Factors
3.7. Sensitivity and Specificity of Anthropometric and Body Composition Measurements in the Prediction of Cardiovascular Risk Factors
4. Discussion
5. Conclusions
Author Contributions
Funding
Institutional Review Board Statement
Informed Consent Statement
Data Availability Statement
Acknowledgments
Conflicts of Interest
References
- Boutari, C.; Mantzoros, C.S. A 2022 Update on the Epidemiology of Obesity and a Call to Action: As Its Twin COVID-19 Pandemic Appears to Be Receding, the Obesity and Dysmetabolism Pandemic Continues to Rage on. Metabolism 2022, 133, 155217–155224. [Google Scholar] [CrossRef] [PubMed]
- Khan, S.S.; Ning, H.; Wilkins, J.T.; Allen, N.; Carnethon, M.; Berry, J.D.; Sweis, R.N.; Lloyd-Jones, D.M. Association of Body Mass Index With Lifetime Risk of Cardiovascular Disease and Compression of Morbidity. JAMA Cardiol. 2018, 3, 280–287. [Google Scholar] [CrossRef] [PubMed]
- Barroso, M.; Goday, A.; Ramos, R.; Marín-Ibañez, A.; Guembe, M.J.; Rigo, F.; Tormo-Díaz, M.J.; Moreno-Iribas, C.; Cabré, J.J.; Segura, A.; et al. Interaction between Cardiovascular Risk Factors and Body Mass Index and 10-Year Incidence of Cardiovascular Disease, Cancer Death, and Overall Mortality. Prev. Med. 2018, 107, 81–89. [Google Scholar] [CrossRef] [PubMed]
- Tafeit, E.; Cvirn, G.; Lamprecht, M.; Hohensinn, M.; Moeller, R.; Hamlin, M.; Horejsi, R. Using Body Mass Index Ignores the Intensive Training of Elite Special Force Personnel. Exp. Biol. Med. 2019, 244, 873–879. [Google Scholar] [CrossRef]
- Linauskas, A.; Overvad, K.; Symmons, D.; Johansen, M.B.; Stengaard-Pedersen, K.; Thurah, A. Body Fat Percentage, Waist Circumference, and Obesity As Risk Factors for Rheumatoid Arthritis: A Danish Cohort Study. Arthritis Care Res. 2019, 71, 777–786. [Google Scholar] [CrossRef]
- Oliveira, P.M.D.; Almeida, F.; Maria, R.; Oliveira, S.; Mendes, L.L.; Netto, M.P.; Paula, A.; Cândido, C. Association between Fat Mass Index and Fat-Free Mass Index Values and Cardiovascular Risk in Adolescents. Rev. Paul. Pediatr. 2016, 34, 30–37. [Google Scholar] [CrossRef]
- Chan, R.S.M.; Woo, J. Prevention of Overweight and Obesity: How Effective Is the Current Public Health Approach. Int. J. Environ. Res. Public Health 2010, 7, 765–783. [Google Scholar] [CrossRef]
- Esmaillzadeh, A.; Mirmiran, P.; Azizi, F. Comparative Evaluation of Anthropometric Measures to Predict Cardiovascular Risk Factors in Tehranian Adult Women. Public Health Nutr. 2006, 9, 61–69. [Google Scholar] [CrossRef] [PubMed]
- Silveira, E.A.; Pagotto, V.; Barbosa, L.S.; de Oliveira, C.; Das Graças Pena, G.; Velasquez-Melendez, G. Accuracy of BMI and Waist Circumference Cut-off Points to Predict Obesity in Older Adults. Cien. Saude Colet. 2020, 25, 1073–1082. [Google Scholar] [CrossRef]
- Tutunchi, H.; Ebrahimi-Mameghani, M.; Ostadrahimi, A.; Asghari-Jafarabadi, M. What Are the Optimal Cut-off Points of Anthropometric Indices for Prediction of Overweight and Obesity? Predictive Validity of Waist Circumference, Waist-to-Hip and Waist-to-Height Ratios. Health Promot. Perspect. 2020, 10, 142–148. [Google Scholar] [CrossRef]
- Macek, P.; Biskup, M.; Terek-Derszniak, M.; Krol, H.; Smok-Kalwat, J.; Gozdz, S.; Zak, M. Optimal Cut-off Values for Anthropometric Measures of Obesity in Screening for Cardiometabolic Disorders in Adults. Sci. Rep. 2020, 10, 11253. [Google Scholar] [CrossRef] [PubMed]
- Khader, Y.; Batieha, A.; Jaddou, H.; El-Khateeb, M.; Ajlouni, K. The Performance of Anthropometric Measures to Predict Diabetes Mellitus and Hypertension among Adults in Jordan. BMC Public Health 2019, 19, 1416. [Google Scholar] [CrossRef] [PubMed]
- Woldegebriel, A.G.; Fenta, K.A.; Aregay, A.B.; Aregay, A.D.; Mamo, N.B.; Wubayehu, T.W.; Bayray, A.; Mulugeta, A. Effectiveness of Anthropometric Measurements for Identifying Diabetes and Prediabetes among Civil Servants in a Regional City of Northern Ethiopia: A Cross-Sectional Study. J. Nutr. Metab. 2020, 2020, 8425912. [Google Scholar] [CrossRef] [PubMed]
- Mansour, A.A.; Al-Jazairi, M.I. Cut-off Values for Anthropometric Variables That Confer Increased Risk of Type 2 Diabetes Mellitus and Hypertension in Iraq. Arch. Med. Res. 2007, 38, 253–258. [Google Scholar] [CrossRef]
- Al-Bachir, M.; Bakir, M.A. Predictive Value of Body Mass Index to Metabolic Syndrome Risk Factors in Syrian Adolescents. J. Med. Case Rep. 2017, 11, 170. [Google Scholar] [CrossRef]
- Sekgala, M.D.; Opperman, M.; Mpahleni, B.; Mchiza, Z.J.R. Anthropometric Indices and Cut-off Points for Screening of Metabolic Syndrome among South African Taxi Drivers. Front. Nutr. 2022, 9, 974749. [Google Scholar] [CrossRef]
- Shiwaku, K.; Anuurad, E.; Enkhmaa, B.; Nogi, A.; Kitajima, K.; Yamasaki, M.; Yoneyama, T.; Oyunsuren, T.; Yamane, Y. Predictive Values of Anthropometric Measurements for Multiple Metabolic Disorders in Asian Populations. Diabetes Res. Clin. Pract. 2005, 69, 52–62. [Google Scholar] [CrossRef]
- Macias, N.; Quezada, A.D.; Flores, M.; Valencia, M.E.; Denova-Gutiérrez, E.; Quiterio-Trenado, M.; Gallegos-Carrillo, K.; Barquera, S.; Salmerón, J. Accuracy of Body Fat Percent and Adiposity Indicators Cut off Values to Detect Metabolic Risk Factors in a Sample of Mexican Adults. BMC Public Health 2014, 14, 341–349. [Google Scholar] [CrossRef]
- Darbandi, M.; Pasdar, Y.; Moradi, S.; Jan Mohamed, H.J.; Hamzeh, B.; Salimi, Y. Discriminatory Capacity of Anthropometric Indices for Cardiovascular Disease in Adults: A Systematic Review and Meta-Analysis. Prev. Chronic Dis. 2021, 17, E131–E142. [Google Scholar] [CrossRef]
- VanItallie, T.; Yang, M.-Y.; Heymsfield, S.; Funk, R.; Boileau, R. Height-Normalized Indices of the Body’s Fat-Free Mass and Fat Mass: Potentially Useful Indicators of Nutritional Status. Am. J. Clin. Nutr. 1990, 52, 953–959. [Google Scholar] [CrossRef]
- Grundy, S.M.; Cleeman, J.I.; Daniels, S.R.; Donato, K.A.; Eckel, R.H.; Franklin, B.A.; Gordon, D.J.; Krauss, R.M.; Savage, P.J.; Smith, S.C.; et al. Diagnosis and Management of the Metabolic Syndrome: An American Heart Association/National Heart, Lung, and Blood Institute Scientific Statement. Circulation 2005, 112, 2735–2752. [Google Scholar] [CrossRef] [PubMed]
- Owolabi, E.O.; Ter Goon, D.; Adeniyi, O.V.; Ajayi, A.I. Optimal Waist Circumference Cut-off Points for Predicting Metabolic Syndrome among Low-Income Black South African Adults. BMC Res. Notes 2018, 11, 22. [Google Scholar] [CrossRef] [PubMed]
- Cornier, M.-A.; Després, J.-P.; Davis, N.; Grossniklaus, D.A.; Klein, S.; Lamarche, B.; Lopez-Jimenez, F.; Rao, G.; St-Onge, M.-P.; Towfighi, A.; et al. Assessing Adiposity: A Scientific Atatement from the American Heart Association. Circulation 2011, 124, 1996–2019. [Google Scholar] [CrossRef] [PubMed]
- Kyle, U.G.; Piccoli, A.; Pichard, C. Body Composition Measurements: Interpretation Finally Made Easy for Clinical Use. Curr. Opin. Clin. Nutr. Metab. Care 2003, 6, 387–393. [Google Scholar] [CrossRef] [PubMed]
- Cederholm, T.; Bosaeus, I.; Barazzoni, R.; Bauer, J.; Van Gossum, A.; Klek, S.; Muscaritoli, M.; Nyulasi, I.; Ockenga, J.; Schneider, S.M.; et al. Diagnostic Criteria for Malnutrition—An ESPEN Consensus Statement. Clin. Nutr. 2015, 34, 335–340. [Google Scholar] [CrossRef]
- Wilson, O.W.A.; Zou, Z.H.; Bopp, M.; Bopp, C.M. Comparison of Obesity Classification Methods among College Students. Obes. Res. Clin. Pract. 2019, 13, 430–434. [Google Scholar] [CrossRef]
- Al-Lawati, J.A.; Jousilahti, P. Body Mass Index, Waist Circumference and Waist-to-Hip Ratio Cut-off Points for Categorisation of Obesity among Omani Arabs. Public Health Nutr. 2008, 11, 102–108. [Google Scholar] [CrossRef]
- Gallagher, D.; Heymsfield, S.B.; Heo, M.; Jebb, S.A.; Murgatroyd, P.R.; Sakamoto, Y. Healthy Percentage Body Fat Ranges: An Approach for Developing Guidelines Based on Body Mass Index. Am. J. Clin. Nutr. 2000, 72, 694–701. [Google Scholar] [CrossRef]
- Jensen, M.D.; Ryan, D.H.; Apovian, C.M.; Ard, J.D.; Comuzzie, A.G.; Donato, K.A.; Hu, F.B.; Hubbard, V.S.; Jakicic, J.M.; Kushner, R.F.; et al. 2013 AHA/ACC/TOS Guideline for the Management of Overweight and Obesity in Adults: A Report of the American College of Cardiology/American Heart Association Task Force on Practice Guidelines and the Obesity Society. J. Am. Coll. Cardiol. 2014, 63, 2985–3023. [Google Scholar] [CrossRef]
- Peine, S.; Knabe, S.; Carrero, I.; Brundert, M.; Wilhelm, J.; Ewert, A.; Denzer, U.; Jensen, B.; Lilburn, P. Generation of Normal Ranges for Measures of Body Composition in Adults Based on Bioelectrical Impedance Analysis Using the Seca MBCA. Int. J. Body Compos. Res. 2013, 11, 67–76. [Google Scholar]
- Agbim, U.; Carr, R.M.; Pickett-Blakely, O.; Dagogo-Jack, S. Ethnic Disparities in Adiposity: Focus on Non-Alcoholic Fatty Liver Disease, Visceral, and Generalized Obesity. Curr. Obes. Rep. 2019, 8, 243–254. [Google Scholar] [CrossRef] [PubMed]
- Ito, H.; Nakasuga, K.; Ohshima, A.; Maruyama, T.; Kaji, Y.; Harada, M.; Fukunaga, M.; Jingu, S.; Sakamoto, M. Detection of Cardiovascular Risk Factors by Indices of Obesity Obtained from Anthropometry and Dual-Energy X-Ray Absorptiometry in Japanese Individuals. Int. J. Obes. 2003, 27, 232–237. [Google Scholar] [CrossRef] [PubMed]
- Tseng, C.H.; Chong, C.K.; Chan, T.T.; Bai, C.H.; You, S.L.; Chiou, H.Y.; Su, T.C.; Chen, C.J. Optimal Anthropometric Factor Cutoffs for Hyperglycemia, Hypertension and Dyslipidemia for the Taiwanese Population. Atherosclerosis 2010, 210, 585–589. [Google Scholar] [CrossRef]
- Deurenberg-Yap, M.; Chew, S.K.; Deurenberg, P. Elevated Body Fat Percentage and Cardiovascular Risks at Low Body Mass Index Levels among Singaporean Chinese, Malays and Indians. Obes. Rev. 2002, 3, 209–215. [Google Scholar] [CrossRef] [PubMed]
- Liu, P.; Ma, F.; Lou, H.; Liu, Y. The Utility of Fat Mass Index vs. Body Mass Index and Percentage of Body Fat in the Screening of Metabolic Syndrome. BMC Public Health 2013, 13, 629–637. [Google Scholar] [CrossRef]
- Lin, W.-Y.; Lee, L.-T.; Lo, H.; Hsia, H.-H.; Liu, I.-L.; Lin, R.-S.; Shau, W.-Y.; Huang, K.-C. Optimal Cut-off Values for Obesity: Using Simple Anthropometric Indices to Predict Cardiovascular Risk Factors in Taiwan. Int. J. Obes. 2002, 26, 1232–1238. [Google Scholar] [CrossRef]
- Rodrigues De Oliveira, B.; Izze Da, E.; Magalhães, S.; Luanna, M.; Martins Bragança, B.; Nascimento, C.C.; Coelho, S.; Peixoto Lima, N.; Bettiol, H.; Barbieri, M.A.; et al. Performance of Body Fat Percentage, Fat Mass Index and Body Mass Index for Detecting Cardiometabolic Outcomes in Brazilian Adults. Nutrients 2023, 15, 2974. [Google Scholar] [CrossRef]
- Ramírez-Vélez, R.; Correa-Bautista, J.E.; Sanders-Tordecilla, A.; Ojeda-Pardo, M.L.; Cobo-Mejía, E.A.; Castellanos-Vega, R.d.P.; García-Hermoso, A.; González-Jiménez, E.; Schmidt-Riovalle, J.; González-Ruíz, K. Percentage of Body Fat and Fat Mass Index as a Screening Tool for Metabolic Syndrome Prediction in Colombian University Students. Nutrients 2017, 9, 1009. [Google Scholar] [CrossRef]
- Głuszek, S.; Ciesla, E.; Głuszek-Osuch, M.; Kozieł, D.; Kiebzak, W.; Wypchło, Ł.; Suliga, E. Anthropometric Indices and Cut-off Points in the Diagnosis of Metabolic Disorders. PLoS ONE 2020, 15, e0235121–e0235134. [Google Scholar] [CrossRef]
- Raposo, L.; Severo, M.; Santos, A.C. Adiposity Cut-off Points for Cardiovascular Disease and Diabetes Risk in the Portuguese Population: The PORMETS Study. PLoS ONE 2018, 13, e0191653. [Google Scholar] [CrossRef]
- Wang, Z.; Ma, J.; Si, D. Optimal Cut-off Values and Population Means of Waist Circumference in Different Populations. Nutr. Res. Rev. 2010, 23, 191–199. [Google Scholar] [CrossRef] [PubMed]
- Schaefer, S.E.; Salazar, M.; Bruhn, C.; Saviano, D.; Boushey, C.; Van Loan, M.D. Influence of Race, Acculturation, and Socioeconomic Status on Tendency toward Overweight in Asian-American and Mexican-American Early Adolescent Females. J. Immigr. Minor. Health 2009, 11, 188–197. [Google Scholar] [CrossRef] [PubMed]
- Kimoto, R.; Ronquillo, D.; Caamaño, M.C.; Martinez, G.; Schubert, L.; Rosado, J.L.; Garcia, O.; Long, K.Z. Food, Eating and Body Image in the Lives of Low Socioeconomic Status Rural Mexican Women Living in Queretaro State, Mexico. Health Place 2014, 25, 34–42. [Google Scholar] [CrossRef] [PubMed]
- Rodríguez-Ramírez, S.; Mundo-Rosas, V.; Jiménez-Aguilar, A.; Shamah-Levy, T. Analysis of the Mexican National Health and Nutrition Survey. Salud Publica Mex 2006, 51, 562–573. [Google Scholar]
- Bei-Fan, Z. Predictive Values of Body Mass Index and Waist Circumference for Risk Factors of Certain Related Diseases in Chinese Adults: Study on Optimal Cut-off Points of Body Mass Index and Waist Circumference in Chinese Adults. Asia Pac. J. Clin. Nutr. 2002, 11, S685–S693. [Google Scholar] [CrossRef]
- Iqbal, R.K.; Nasrullah, M.F.; Ikram, S. How Obesity Affects Our Health. Natl. J. Health Sci. 2019, 4, 113–118. [Google Scholar] [CrossRef]
- Hu, F.B.; Wang, B.; Chen, C.; Jin, Y.; Yang, J.; Stampfer, M.J.; Xu, X. Body Mass Index and Cardiovascular Risk Factors in a Rural Chinese Population. Am. J. Epidemiol. 2000, 151, 88–97. [Google Scholar] [CrossRef]
- Knowles, K.M.; Paiva, L.L.; Sanchez, S.E.; Revilla, L.; Lopez, T.; Yasuda, M.B.; Yanez, N.D.; Gelaye, B.; Williams, M.A. Waist Circumference, Body Mass Index, and Other Measures of Adiposity in Predicting Cardiovascular Disease Risk Factors among Peruvian Adults. Int. J. Hypertens. 2011, 2011, 931402. [Google Scholar] [CrossRef]
- De Schutter, A.; Lavie, C.J.; Arce, K.; Menendez, S.G.; Milani, R.V. Correlation and Discrepancies Between Obesity by Body Mass Index and Body Fat in Patients With Coronary Heart Disease. J. Cardiopulm. Rehabil. Prev. 2013, 33, 77–83. [Google Scholar] [CrossRef]
- Kim, H.Y.; Kim, J.K.; Shin, G.G.; Han, J.A.; Kim, J.W. Association between Abdominal Obesity and Cardiovascular Risk Factors in Adults with Normal Body Mass Index: Based on the Sixth Korea National Health and Nutrition Examination Survey. J. Obes. Metab. Syndr. 2019, 28, 262–270. [Google Scholar] [CrossRef]
- Correa-Rodríguez, M.; González-Ruíz, K.; Rincón-Pabón, D.; Izquierdo, M.; García-Hermoso, A.; Agostinis-Sobrinho, C.; Sánchez-Capacho, N.; Roa-Cubaque, M.A.; Ramírez-Vélez, R. Normal-Weight Obesity Is Associated with Increased Cardiometabolic Risk in Young Adults. Nutrients 2020, 12, 1106. [Google Scholar] [CrossRef] [PubMed]
- Bello-Chavolla, O.Y.; Vargas-Vázquez, A.; Antonio-Villa, N.E.; Del Razo-Olvera, F.M.; Elías-López, D.; Aguilar-Salinas, C.A. A High Incidence of Metabolic Syndrome Traits in Mexicans Points at Obesity-Related Metabolic Dysfunction. Diabetes Metab. Syndr. Obes. 2021, 14, 1073–1082. [Google Scholar] [CrossRef] [PubMed]
- Rodríguez-Ramírez, S.; Martinez-Tapia, B.; González-Castell, D.; Cuevas-Nasu, L.; Shamah-Levy, T. Westernized and Diverse Dietary Patterns Are Associated With Overweight-Obesity and Abdominal Obesity in Mexican Adult Men. Front. Nutr. 2022, 9, 891619. [Google Scholar] [CrossRef] [PubMed]
- Ho, S.; Chen, Y.; Woo, J.; Leung, S.; Lam, T.; Janus, E. Association between Simple Anthropometric Indices and Cardiovascular Risk Factors. Int. J. Obes. 2001, 25, 1689–1697. [Google Scholar] [CrossRef] [PubMed]
- Domínguez-Reyes, T.; Quiroz-Vargas, I.; Salgado-Bernabé, A.B.; Salgado-Goytia, L.; Muñoz-Valle, J.F.; Parra-Rojas, I. Anthropometric Measurements as Predictive Indicators of Metabolic Risk in a Mexican Population. Nutr. Hosp. 2017, 34, 96–101. [Google Scholar] [CrossRef] [PubMed]
- Dobbelsteyn, C.; Joffres, M.; MacLean, D.; Flowerdew, G. A Comparative Evaluation of Waist Circumference, Waist-to-Hip Ratio and Body Mass Index as Indicators of Cardiovascular Risk Factors. The Canadian Heart Health Surveys. Int. J. Obes. 2001, 25, 652–661. [Google Scholar] [CrossRef]
- Rezende, F.A.C.; Rosado, L.E.F.P.L.; Ribeiro, R.d.C.L.; Vidigal, F.d.C.; Vasques, A.C.J.; Bonard, I.S.; Carvalho, C.R.d. Body Mass Index and Waist Circumference: Association with Cardiovascular Risk Factors. Arq. Bras. Cardiol. 2006, 87, 728–734. [Google Scholar] [CrossRef]
- Menke, A.; Muntner, P.; Wildman, R.P.; Reynolds, K.; He, J. Measures of Adiposity and Cardiovascular Disease Risk Factors. Obesity 2007, 15, 785–795. [Google Scholar] [CrossRef]
- Jung, U.J.; Choi, M. Obesity and Its Metabolic Complications: The Role of Adipokines and the Relationship between Obesity, Inflammation, Insulin Resistance, Dyslipidemia and Nonalcoholic Fatty Liver Disease. Int. J. Mol. Sci. 2014, 15, 6184–6223. [Google Scholar] [CrossRef]
- Bredella, M.A. Sex Differences in Body Composition; Springer: Cham, Switzerland, 2017; pp. 9–27. [Google Scholar] [CrossRef]
- Hajian-Tilaki, K.; Heidari, B. Comparison of Abdominal Obesity Measures in Predicting of 10-Year Cardiovascular Risk in an Iranian Adult Population Using ACC/AHA Risk Model: A Population Based Cross Sectional Study. Diabetes Metab. Syndr. Clin. Res. Rev. 2018, 12, 991–997. [Google Scholar] [CrossRef]
- Guan, X.; Sun, G.; Zheng, L.; Hu, W.; Li, W.; Sun, Y. Associations between Metabolic Risk Factors and Body Mass Index, Waist Circumference, Waist-to-Height Ratio and Waist-to-Hip Ratio in a Chinese Rural Population. J. Diabetes Investig. 2016, 7, 601–606. [Google Scholar] [CrossRef] [PubMed]
- Gharipour, M.; Sarrafzadegan, N.; Sadeghi, M.; Andalib, E.; Talaie, M.; Shafie, D.; Aghababaie, E. Predictors of Metabolic Syndrome in the Iranian Population: Waist Circumference, Body Mass Index, or Waist to Hip Ratio? Cholesterol 2013, 2013, 198384. [Google Scholar] [CrossRef] [PubMed]
- Motala, A.A.; Esterhuizen, T.; Pirie, F.J.; Omar, M.A.K. The Prevalence of Metabolic Syndrome and Determination of the Optimal Waist Circumference Cutoff Points in a Rural South African Community. Diabetes Care 2011, 34, 1032–1037. [Google Scholar] [CrossRef] [PubMed]
- Heinrich, K.M.; Jitnarin, N.; Suminski, R.R.; Berkel, L.V.; Hunter, C.M.; Alvarez, L.; Brundige, A.R.; Peterson, A.L.; Foreyt, J.P.; Haddock, C.K.; et al. Obesity Classification in Military Personnel: A Comparison of Body Fat, Waist Circumference, and Body Mass Index Measurements. Mil. Med. 2008, 173, 67–73. [Google Scholar] [CrossRef] [PubMed]
- Vikram, N.K.; Pandey, R.M.; Misra, A.; Sharma, R.; Rama Devi, J.; Khanna, N. Non-Obese (Body Mass Index < 25 Kg/M2) Asian Indians with Normal Waist Circumference Have High Cardiovascular Risk. Nutrition 2003, 19, 503–509. [Google Scholar] [CrossRef]
- Kyle, U.G.; Schutz, Y.; Dupertuis, Y.M.; Pichard, C. Body Composition Interpretation: Contributions of the Fat-Free Mass Index and the Body Fat Mass Index. Nutrition 2003, 19, 597–604. [Google Scholar] [CrossRef]
- Srikanthan, P.; Karlamangla, A.S. Muscle Mass Index As a Predictor of Longevity in Older Adults. Am. J. Med. 2014, 127, 547–553. [Google Scholar] [CrossRef]
- Brambilla, P.; Bedogni, G.; Heo, M.; Pietrobelli, A. Waist Circumference-to-Height Ratio Predicts Adiposity Better than Body Mass Index in Children and Adolescents. Int. J. Obes. 2013, 37, 943–946. [Google Scholar] [CrossRef]
- Lee, K. Muscle Mass and Body Fat in Relation to Cardiovascular Risk Estimation and Lipid-Lowering Eligibility. J. Clin. Densitom. 2017, 20, 247–255. [Google Scholar] [CrossRef]
- Marinou, K.; Tousoulis, D.; Antonopoulos, A.S.; Stefanadi, E.; Stefanadis, C. Obesity and Cardiovascular Disease: From Pathophysiology to Risk Stratification. Int. J. Cardiol. 2010, 138, 3–8. [Google Scholar] [CrossRef]
- Kim, B.C.; Kim, M.K.; Han, K.; Lee, S.-Y.; Lee, S.-H.; Ko, S.-H.; Kwon, H.-S.; Merchant, A.T.; Yim, H.W.; Lee, W.-C.; et al. Low Muscle Mass Is Associated with Metabolic Syndrome Only in Nonobese Young Adults: The Korea National Health and Nutrition Examination Survey 2008–2010. Nutr. Res. 2015, 35, 1070–1078. [Google Scholar] [CrossRef] [PubMed]
- Ghachem, A.; Lagacé, J.-C.; Brochu, M.; Dionne, I.J. Fat-Free Mass and Glucose Homeostasis: Is Greater Fat-Free Mass an Independent Predictor of Insulin Resistance? Aging Clin. Exp. Res. 2018, 31, 447–454. [Google Scholar] [CrossRef] [PubMed]
- Paddon-Jones, D. Interplay of Stress and Physical Inactivity on Muscle Loss: Nutritional Countermeasures. J. Nutr. 2006, 136, 2123–2126. [Google Scholar] [CrossRef] [PubMed]
- Denison, H.J.; Cooper, C.; Sayer, A.A.; Robinson, S.M. Prevention and Optimal Management of Sarcopenia: A Review of Combined Exercise and Nutrition Interventions to Improve Muscle Outcomes in Older People. Clin. Interv. Aging 2015, 2015, 859–869. [Google Scholar] [CrossRef]
- Huh, J.Y. The Role of Exercise-Induced Myokines in Regulating Metabolism. Arch. Pharmacal Res. 2018, 41, 14–29. [Google Scholar] [CrossRef]
- Phu, S.; Boersma, D.; Duque, G. Exercise and Sarcopenia. J. Clin. Densitom. 2015, 18, 488–492. [Google Scholar] [CrossRef]
- Ferrara, L.A.; Capaldo, B.; Mancusi, C.; Lee, E.T.; Howard, B.V.; Devereux, R.B.; de Simone, G. Cardiometabolic Risk in Overweight Subjects with or without Relative Fat-Free Mass Deficiency: The Strong Heart Study. Nutr. Metab. Cardiovasc. Dis. 2014, 24, 271–276. [Google Scholar] [CrossRef]
- Scott, D.; Park, M.; Kim, T.; Ryu, J.; Hong, H.; Yoo, H.; Baik, S.; Jones, G.; Choi, K. Associations of Low Muscle Mass and the Metabolic Syndrome in Caucasian and Asian Middle-Aged and Older Adults. J. Nutr. Health Aging 2016, 20, 248–255. [Google Scholar] [CrossRef]
- Zhang, H.; Lin, S.; Gao, T.; Feng, Z.; Cai, J.; Sun, Y.; Ma, A. Association Between Sarcopenia and Metabolic Syndrome in Middle-Aged and Older Non-Obese Adults: A Systematic Review and Meta-Analysis. Nutrients 2018, 10, 364. [Google Scholar] [CrossRef]
- Lu, C.-W.; Yang, K.-C.; Chang, H.-H.; Lee, L.-T.; Chen, C.-Y.; Huang, K.-C. Sarcopenic Obesity Is Closely Associated With Metabolic Syndrome. Obes. Res. Clin. Pract. 2013, 7, e301–e307. [Google Scholar] [CrossRef]
- Srikanthan, P.; Horwich, T.B.; Tseng, C.H. Relation of Muscle Mass and Fat Mass to Cardiovascular Disease Mortality. Am. J. Cardiol. 2016, 117, 1355–1360. [Google Scholar] [CrossRef] [PubMed]
- Park, S.-J.; Ryu, S.-Y.; Park, J.; Choi, S.-W. Association of Sarcopenia with Metabolic Syndrome in Korean Population Using 2009–2010 Korea National Health and Nutrition Examination Survey. Metab. Syndr. Relat. Disord. 2019, 17, 494–499. [Google Scholar] [CrossRef] [PubMed]


| Total | Female | Male | p | |
|---|---|---|---|---|
| (n = 1730) | (n = 848) | (n = 882) | ||
| Age (y) | 18.9 ± 0.1 | 18.9 ± 1.3 | 18.9 ± 1.4 | 0.6800 |
| Height (cm) | 166.1 ± 0.2 | 159.7 ± 5.8 | 172.2 ± 6.2 | <0.0001 |
| Weight (kg) | 65.1 ± 0.3 | 58.5 ± 11.1 | 71.2 ± 13.5 | <0.0001 |
| WC (cm) | 78.5 ± 0.3 | 74.8 ± 10.0 | 82.1 ± 10.7 | <0.0001 |
| BF (%) | 25.3 ± 0.2 | 29.9 ± 6.9 | 20.8 ± 6.7 | <0.0001 |
| BMI (kg/m2) | 23.5 ± 0.1 | 22.9 ± 3.9 | 24.0 ± 4.1 | <0.0001 |
| FMI (kg/m2) | 6.1 ± 0.1 | 7.1 ± 2.8 | 5.2 ± 2.6 | <0.0001 |
| FFMI (kg/m2) | 17.3 ± 0.1 | 15.8 ± 1.5 | 18.66 ± 2.2 | <0.0001 |
| SBP (mmHg) | 109.1 ± 0.3 | 104.7 ± 10.2 | 113.1 ± 11.1 | <0.0001 |
| DBP (mmHg) | 70.6 ± 0.2 | 69.0 ± 8.7 | 72.0 ± 8.9 | <0.0001 |
| GLC (mg/dL) | 84.9 ± 0.3 | 83.1 ± 13.9 | 86.4 ± 14.1 | <0.0001 |
| TC (mg/dL) | 161.2 ± 0.7 | 161.5 ± 29 | 160.9 ± 30.4 | 0.3877 |
| TG (mg/dL) | 103.6 ± 1.5 | 91.6 ± 46.5 | 115.0 ± 72.4 | <0.0001 |
| HDL-c (mg/dL) | 50.9 ± 0.3 | 54.0 ± 13.8 | 47.8 ± 11.1 | <0.0001 |
| LDL-c (mg/dL) | 89.7 ± 0.6 | 89.1 ± 23.5 | 90.1 ± 23.9 | 0.3999 |
| Women | Men | ||||||||
|---|---|---|---|---|---|---|---|---|---|
| Optimal Cut-Point | Sen (%) | 1-Spe (%) | AUC (95% CI) | Optimal Cut-Point | Sen (%) | 1-Spe (%) | AUC (95% CI) | ||
| WC | BP | 86.6 | 0.2131 | 0.1073 | 0.54 (0.48–0.60) | 83.0 | 0.5349 | 0.3425 | 0.62 (0.58–0.66) |
| GLC | 64.6 | 0.9643 | 0.8453 | 0.51 (0.40–0.62) | 91.9 | 0.2917 | 0.1655 | 0.56 (0.47–0.64) | |
| TC | 72.8 | 0.6269 | 0.4655 | 0.43 (0.36–0.51) | 88.0 | 0.4938 | 0.2210 | 0.65 (0.58–0.72) | |
| TG | 74.5 | 0.6228 | 0.3929 | 0.64 (0.60–0.68) | 81.9 | 0.5831 | 0.5315 | 0.64 (0.60–0.67) | |
| HDL-c | 72.1 | 0.6667 | 0.4753 | 0.62 (0.58–0.65) | 81.9 | 0.5402 | 0.3839 | 0.59 (0.55–0.63) | |
| LDL-c | 63.4 | 0.1842 | 0.1134 | 0.48 (0.39–0.58) | 83.2 | 0.6327 | 0.3902 | 0.61 (0.53–0.69) | |
| Average | 72.3 | 84.9 | |||||||
| BF% | BP | 33.7 | 0.4672 | 0.2517 | 0.62 (0.57–0.68) | 20.9 | 0.5648 | 0.3752 | 0.61 (0.57–0.65) |
| GLC | 28.3 | 0.7857 | 0.5907 | 0.56 (0.45–0.66) | 26.1 | 0.4583 | 0.1942 | 0.65 (0.57–0.73) | |
| TC | 26.6 | 0.7761 | 0.6816 | 0.51 (0.44–0.57) | 21.9 | 0.6667 | 0.3720 | 0.67 (0.60–0.73) | |
| TG | 32.6 | 0.5175 | 0.2754 | 0.63 (0.59–0.67) | 22.2 | 0.5150 | 0.2796 | 0.64 (0.60–0.67) | |
| HDL-c | 29.7 | 0.6033 | 0.4424 | 0.59 (0.55–0.63) | 22.8 | 0.4626 | 0.2753 | 0.61(0.57–0.64) | |
| LDL-c | 29.3 | 0.7105 | 0.5302 | 0.58 (0.50–0.66) | 21.9 | 0.6327 | 0.3854 | 0.60 (0.51–0.68) | |
| Average | 30 | 22.6 | |||||||
| BMI | BP | 27.3 | 0.2705 | 0.1087 | 0.59 (0.54–0.65) | 23.3 | 0.5548 | 0.3270 | 0.64 (0.60–0.68) |
| GLC | 23.8 | 0.5000 | 0.3276 | 0.54 (0.43–0.65) | 24.9 | 0.5833 | 0.3261 | 0.64 (0.57–0.72) | |
| TC | 24.4 | 0.7761 | 0.6969 | 0.51 (0.44–0.57) | 25.5 | 0.5802 | 0.2734 | 0.67 (0.61–0.73) | |
| TG | 24.3 | 0.4912 | 0.2415 | 0.65 (0.61–0.69) | 23.8 | 0.5995 | 0.3476 | 0.63 (0.60–0.67) | |
| HDL-c | 21.3 | 0.7080 | 0.5082 | 0.62 (0.58–0.66) | 24.5 | 0.4828 | 0.3015 | 0.60 (0.56–0.64) | |
| LDL-c | 21.1 | 0.7895 | 0.6104 | 0.58 (0.49–0.66) | 24.6 | 0.5918 | 0.3481 | 0.62 (0.54–0.70) | |
| Average | 23.7 | 24.4 | |||||||
| FMI | BP | 8.1 | 0.4508 | 0.2655 | 0.62 (0.56–0.67) | 5.0 | 0.5615 | 0.3614 | 0.62 (0.59–0.66) |
| GLC | 6.5 | 0.6786 | 0.4994 | 0.55 (0.45–0.66) | 5.3 | 0.6458 | 0.3753 | 0.65 (0.57–0.73) | |
| TC | 7.5 | 0.7164 | 0.6279 | 0.51 (0.44–0.57) | 6.6 | 0.4815 | 0.2022 | 0.67 (0.61–0.74) | |
| TG | 7.6 | 0.5351 | 0.2802 | 0.64 (0.60–0.69) | 5.1 | 0.5749 | 0.3184 | 0.64 (0.60–0.68) | |
| HDL-c | 6.7 | 0.5787 | 0.4033 | 0.60 (0.56–0.64) | 5.2 | 0.5144 | 0.3315 | 0.61 (0.57–0.65) | |
| LDL-c | 6.4 | 0.7105 | 0.5117 | 0.58 (0.50–0.67) | 5.6 | 0.3361 | 0.3361 | 0.61 (0.53–0.69) | |
| Average | 7.1 | 5.5 | |||||||
| FFMI | BP | 15.8 | 0.5164 | 0.4237 | 0.54 (0.48–0.59) | 18.9 | 0.5482 | 0.3201 | 0.63 (0.59–0.67) |
| GLC | 15.5 | 0.6786 | 0.5371 | 0.54 (0.43–0.65) | 18.9 | 0.6042 | 0.3789 | 0.60 (0.51–0.68) | |
| TC | 16.8 | 0.8209 | 0.7596 | 0.51 (0.43–0.56) | 19.1 | 0.6049 | 0.3508 | 0.63 (0.57–0.70) | |
| TG | 15.8 | 0.6184 | 0.3961 | 0.62 (0.58–0.66) | 18.8 | 0.5395 | 0.3573 | 0.60 (0.56–0.64) | |
| HDL-c | 16.1 | 0.4904 | 0.2942 | 0.61 (0.58–0.65) | 18.6 | 0.592 | 0.4476 | 0.58 (0.54–0.62) | |
| LDL-c | 16.2 | 0.5000 | 0.3402 | 0.55 (0.46–0.65) | 19.1 | 0.551 | 0.3481 | 0.60 (0.52–0.69) | |
| Average | 16 | 18.9 |
| Model *,†,‡ | High WC | High BF% | High BMI | High FMI | High FFMI | |
|---|---|---|---|---|---|---|
| High BP | 1 | 1.41 (0.93–2.13) | 2.54 (1.67–2.85) | 2.08 (1.38–3.15) | 2.23 (1.48–3.31) | 0.89 (0.58–1.36) |
| 2 | 1.36 (0.92–2.00) | 2.08 (1.39–3.11) | 1.61 (1.08–2.38) | 2.01 (1.34–3.00) | 0.75 (0.51–1.11) | |
| 3 | 1.28 (0.87–1.90) | 2.00 (1.34–2.98) | 1.81 (1.22–2.68) | 1.95 (1.32–2.89) | 0.81 (0.55–1.20) | |
| High GLC | 1 | 1.08 (0.47–2.48) | 1.35 (0.59–2.13) | 1.19 (0.51–2.74) | 1.42 (0.64–3.12) | 0.56 (0.22–1.39) |
| 2 | 1.16 (0.55–2.48) | 1.59 (0.73–3.43) | 1.85 (0.84–4.07) | 1.84 (0.84–4.03) | 0.63 (0.29–1.37) | |
| 3 | 1.08 (0.50–2.31) | 1.69 (0.78–3.65) | 1.89 (0.89–4.03) | 1.21 (0.57–2.58) | 0.73 (0.34–1.55) | |
| High TC | 1 | 0.76 (0.42–1.38) | 0.79 (0.42–1.48) | 0.76 (0.41–1.41) | 0.71 (0.39–1.28) | 0.88 (0.51–1.52) |
| 2 | 0.57 (0.34–0.96) | 1.27 (0.77–2.10) | 1.04 (0.63–1.72) | 1.10 (0.67–1.82) | 1.00 (0.62–1.70) | |
| 3 | 0.59 (0.36–0.98) | 1.19 (0.72–1.96) | 0.83 (0.49–1.43) | 0.99 (0.60–1.65) | 1.24 (0.73–2.10) | |
| High TG | 1 | 3.03 (2.15–4.27) | 2.92 (2.03–4.20) | 3.27 (2.29–4.66) | 3.23 (2.29–4.54) | 0.45 (0.31–0.66) |
| 2 | 2.69 (1.94–3.73) | 2.40(1.74–3.32) | 2.87 (2.06–3.99) | 2.43 (1.76–3.37) | 0.44 (0.32–0.61) | |
| 3 | 2.69 (1.92–3.77) | 2.28 (1.65–3.15) | 3.07 (2.21–4.27) | 2.85 (2.06–3.95) | 0.49 (0.32–0.62) | |
| Low HDL-c | 1 | 1.97 (1.44–2.68) | 2.05 (1.48–2.85) | 2.07 (1.50–2.84) | 2.17 (1.59–2.95) | 0.45 (0.33–0.62) |
| 2 | 1.96 (1.49–2.59) | 1.87 (1.42–2.47) | 2.05 (1.55–2.71) | 1.99 (1.51–2.64) | 0.54 (0.41–0.71) | |
| 3 | 2.16 (1.62–2.86) | 1.86 (1.41–2.45) | 2.11 (1.58–2.83) | 1.98 (1.50–2.62) | 0.46 (0.34–0.61) | |
| High LDL-c | 1 | 1.10 (0.54–2.26) | 1.38 (0.67–2.85) | 1.57 (0.79–3.13) | 1.32 (0.65–2.64) | 0.85 (0.41–1.73) |
| 2 | 0.90 (0.47–1.73) | 2.01 (1.01–3.98) | 1.58 (0.81–3.08) | 2.25 (1.12–4.53) | 0.80 (0.41–1.54) | |
| 3 | 0.89 (0.46–1.71) | 1.90 (0.97–3.72) | 1.22 (0.63–2.38) | 1.58 (0.82–3.03) | 0.62 (0.32–1.19) |
| Model *,†,‡ | High WC | High BF% | High BMI | High FMI | High FFMI | |
|---|---|---|---|---|---|---|
| High BP | 1 | 3.30 (2.20–4.96) | 2.34 (1.70–3.23) | 2.28 (1.90–3.51) | 2.30 (1.71–3.08) | 0.51 (0.34–0.77) |
| 2 | 2.23 (1.66–3.00) | 2.08 (1.55–2.78) | 2.72 (2.02–3.67) | 2.22 (1.65–2.97) | 0.41 (0.30–0.55) | |
| 3 | 2.59 (1.91–3.53) | 2.09 (1.55–2.83) | 2.64 (1.95–3.55) | 2.33 (1.73–3.13) | 0.37 (0.27–0.49) | |
| High GLC | 1 | 1.62 (0.79–3.36) | 2.72 (1.51–4.90) | 2.85 (1.57–5.14) | 2.87 (1.56–5.29) | 0.37 (0.13–1.05) |
| 2 | 1.23 (0.68–2.21) | 2.08 (1.12–3.86) | 2.19 (1.18–4.08) | 2.10 (1.13–3.90) | 0.45 (0.24–0.84) | |
| 3 | 1.26 (0.69–2.30) | 2.70 (1.49–4.88) | 2.44 (1.35–4.42) | 2.45 (1.36–4.44) | 0.41 (0.22–0.74) | |
| High TC | 1 | 3.24 (1.94–5.41) | 2.83 (1.77–4.52) | 3.11 (1.95–4.96) | 2.90 (1.80–4.68) | 0.59 (0.29–1.21) |
| 2 | 2.26 (1.38–3.67) | 2.34 (1.43–3.82) | 2.52 (1.53–4.16) | 2.42 (1.48–3.97) | 0.51 (0.32–0.83) | |
| 3 | 2.44 (1.53–3.88) | 2.82 (1.77–4.50) | 2.94 (1.83–4.73) | 2.82 (1.76–4.52) | 0.43 (0.27–0.68) | |
| High TG | 1 | 3.69 (2.44–5.57) | 3.36 (2.43–4.63) | 3.24 (2.40–4.38) | 3.13 (2.34–4.17) | 0.68 (0.47–0.98) |
| 2 | 2.55 (1.92–3.38) | 2.78 (2.10–3.69) | 2.75 (2.07–3.67) | 2.96 (2.23–3.95) | 0.53 (0.40–0.70) | |
| 3 | 2.78 (2.06–2.74) | 2.87 (2.14–3.85) | 2.30 (2.24–4.01) | 3.05 (2.28–4.08) | 0.48 (0.36–0.63) | |
| Low HDL-c | 1 | 2.50 (1.70–3.69) | 2.51 (1.84–3.43) | 2.26 (1.69–3.03) | 2.22 (1.67–2.94) | 0.79 (0.55–1.14) |
| 2 | 1.77 (1.34–2.33) | 1.82 (1.38–2.41) | 1.92 (1.45–2.54) | 1.95 (1.47–2.57) | 0.54 (0.41–0.72) | |
| 3 | 1.95 (1.46–2.60) | 2.33 (1.75–3.11) | 2.15 (1.62–2.86) | 2.17 (1.63–2.88) | 0.54 (0.41–0.72) | |
| High LDL-c | 1 | 1.76 (0.87–3.54) | 1.69 (0.93–3.09) | 2.61 (1.46–4.68) | 2.42 (1.34–4.38) | 0.66 (0.27–1.58) |
| 2 | 1.77 (0.97–3.21) | 1.98 (1.08–3.63) | 2.12 (1.15–3.92) | 2.14 (1.16–3.96) | 0.47 (0.25–0.87) | |
| 3 | 2.03 (1.13–3.63) | 2.35 (1.32–4.22) | 2.39 (1.33–4.31) | 2.32 (1.29–4.16) | 0.55 (0.31–0.98) |
| Cut-Off Point *,†,‡ | WC | BF% | BMI | FMI | FFMI | ||||||
|---|---|---|---|---|---|---|---|---|---|---|---|
| Sen % | 1-Spe % | Sen % | 1-Spe % | Sen % | 1-Spe % | Sen % | 1-Spe % | Sen % | 1-Spe % | ||
| High BP | 1 | 0.328 | 0.263 | 0.377 | 0.201 | 0.369 | 0.229 | 0.426 | 0.255 | 0.705 | 0.674 |
| 2 | 0.598 | 0.539 | 0.623 | 0.459 | 0.459 | 0.329 | 0.549 | 0.397 | 0.434 | 0.377 | |
| 3 | 0.557 | 0.488 | 0.648 | 0.472 | 0.598 | 0.485 | 0.639 | 0.490 | 0.566 | 0.499 | |
| High GLC | 1 | 0.286 | 0.270 | 0.286 | 0.223 | 0.286 | 0.248 | 0.357 | 0.277 | 0.786 | 0.674 |
| 2 | 0.571 | 0.546 | 0.607 | 0.478 | 0.500 | 0.343 | 0.464 | 0.417 | 0.464 | 0.383 | |
| 3 | 0.536 | 0.496 | 0.607 | 0.494 | 0.643 | 0.496 | 0.679 | 0.506 | 0.607 | 0.505 | |
| High TC | 1 | 0.224 | 0.274 | 0.194 | 0.229 | 0.209 | 0.252 | 0.224 | 0.284 | 0.701 | 0.676 |
| 2 | 0.433 | 0.557 | 0.522 | 0.479 | 0.313 | 0.351 | 0.418 | 0.419 | 0.343 | 0.389 | |
| 3 | 0.373 | 0.508 | 0.552 | 0.493 | 0.507 | 0.501 | 0.522 | 0.511 | 0.493 | 0.510 | |
| High TG | 1 | 0.425 | 0.213 | 0.355 | 0.177 | 0.399 | 0.194 | 0.477 | 0.218 | 0.794 | 0.635 |
| 2 | 0.706 | 0.489 | 0.618 | 0.432 | 0.518 | 0.285 | 0.583 | 0.358 | 0.522 | 0.335 | |
| 3 | 0.658 | 0.439 | 0.645 | 0.444 | 0.680 | 0.435 | 0.654 | 0.460 | 0.654 | 0.455 | |
| Low HDL-c | 1 | 0.345 | 0.214 | 0.296 | 0.173 | 0.323 | 0.193 | 0.365 | 0.216 | 0.773 | 0.607 |
| 2 | 0.649 | 0.471 | 0.569 | 0.418 | 0.442 | 0.278 | 0.514 | 0.348 | 0.494 | 0.305 | |
| 3 | 0.591 | 0.428 | 0.586 | 0.432 | 0.605 | 0.424 | 0.605 | 0.442 | 0.597 | 0.442 | |
| High LDL-c | 1 | 0.289 | 0.272 | 0.289 | 0.223 | 0.342 | 0.244 | 0.342 | 0.277 | 0.711 | 0.677 |
| 2 | 0.526 | 0.548 | 0.632 | 0.475 | 0.395 | 0.346 | 0.526 | 0.414 | 0.500 | 0.380 | |
| 3 | 0.474 | 0.499 | 0.658 | 0.49 | 0.605 | 0.496 | 0.684 | 0.504 | 0.553 | 0.506 | |
| Cut-Off Point *,†,‡ | WC | BF% | BMI | FMI | FFMI | ||||||
|---|---|---|---|---|---|---|---|---|---|---|---|
| Sen % | 1-Spe % | Sen % | 1-Spe % | Sen % | 1-Spe % | Sen % | 1-Spe % | Sen % | 1-Spe % | ||
| High BP | 1 | 0.229 | 0.096 | 0.362 | 0.212 | 0.452 | 0.267 | 0.522 | 0.343 | 0.877 | 0.795 |
| 2 | 0.468 | 0.289 | 0.452 | 0.305 | 0.525 | 0.317 | 0.485 | 0.315 | 0.548 | 0.322 | |
| 3 | 0.615 | 0.442 | 0.598 | 0.446 | 0.651 | 0.432 | 0.631 | 0.454 | 0.645 | 0.448 | |
| High GLC | 1 | 0.208 | 0.138 | 0.479 | 0.251 | 0.563 | 0.317 | 0.646 | 0.390 | 0.917 | 0.818 |
| 2 | 0.396 | 0.348 | 0.583 | 0.342 | 0.583 | 0.376 | 0.583 | 0.361 | 0.604 | 0.387 | |
| 3 | 0.563 | 0.499 | 0.667 | 0.488 | 0.688 | 0.496 | 0.667 | 0.506 | 0.688 | 0.505 | |
| High TC | 1 | 0.321 | 0.122 | 0.469 | 0.242 | 0.580 | 0.305 | 0.630 | 0.381 | 0.889 | 0.816 |
| 2 | 0.543 | 0.331 | 0.580 | 0.332 | 0.630 | 0.363 | 0.605 | 0.350 | 0.605 | 0.378 | |
| 3 | 0.679 | 0.481 | 0.679 | 0.479 | 0.728 | 0.484 | 0.704 | 0.496 | 0.679 | 0.498 | |
| High TG | 1 | 0.223 | 0.083 | 0.390 | 0.173 | 0.466 | 0.233 | 0.548 | 0.301 | 0.850 | 0.804 |
| 2 | 0.466 | 0.268 | 0.482 | 0.256 | 0.523 | 0.291 | 0.512 | 0.274 | 0.496 | 0.330 | |
| 3 | 0.627 | 0.412 | 0.629 | 0.404 | 0.638 | 0.414 | 0.651 | 0.417 | 0.591 | 0.460 | |
| Low HDL-c | 1 | 0.210 | 0.097 | 0.368 | 0.195 | 0.431 | 0.264 | 0.514 | 0.331 | 0.839 | 0.813 |
| 2 | 0.431 | 0.298 | 0.457 | 0.273 | 0.491 | 0.320 | 0.474 | 0.307 | 0.477 | 0.348 | |
| 3 | 0.583 | 0.448 | 0.580 | 0.444 | 0.595 | 0.449 | 0.606 | 0.455 | 0.595 | 0.463 | |
| High LDL-c | 1 | 0.224 | 0.136 | 0.367 | 0.257 | 0.531 | 0.318 | 0.868 | 0.721 | 0.878 | 0.820 |
| 2 | 0.510 | 0.341 | 0.551 | 0.343 | 0.592 | 0.376 | 0.842 | 0.684 | 0.551 | 0.390 | |
| 3 | 0.633 | 0.493 | 0.653 | 0.489 | 0.694 | 0.496 | 0.921 | 0.835 | 0.694 | 0.504 | |
| Author | CVRFs Included | Population | WC (cm) | BF% (%) | BMI (kg/m2) | FMI (kg/m2) |
|---|---|---|---|---|---|---|
| Macias et al. 2014 [18] | SBP, GLC, TG, HDL-c | Mexican adults 20–65 years | W = 86–91 M = 92–94 | W = 42.3–44.0 M = 29.6–30.5 | W =25.3–27.2 M = 26.3–27.2 | |
| Ito et al. 2003 [32] | BP, GLC, TC, TG, glycated hemoglobin | Japanese adults 20–79 years | W = 72 M = 84 | W= 35.0 M= 24.0 | W = 22.5 M = 23.5 | |
| Tseng et al. 2010 [33] | BP, GLC, TG, HDL-c | Taiwanese adults 25–75 years | W = 74–83 M = 85–87 | W = 22.10–23.21 M = 23.74–26.26 | ||
| Lin et al. 2002 [36] | BP, GLC, TC, TG, HDL-c, LDL-c | Taiwanese adults W= 37.0 ± 11.1 years M= 37.3 ± 10.9 years | W = 71.5 M = 80.5 | W = 22.1 M = 23.6 | ||
| Liu et al. 2013 [35] | GLC, TC, TG, HDL-c, LDL-c, CRP | Chinese adults 20–79 years | W = 71.5 M = 80.5 | W = 21.35 M = 23.95 | W = 23.85 M = 27.45 | W = 7.9 M = 7.0 |
| Deurenberg-Yap et al. 2002 [34] | BP, GLC, TC, TG | Singaporean Chinese, Malays, and Indians 18–75 years | W = 75.0–80.0 M = 80.0–85.0 | W = 24.0 M0 24.0 | ||
| Rodrigues et al. 2023 [37] | BP, GLC, TC, TG, HDL-c, LDL-c, CRP, glycated hemoglobin | Brazilian adults Group 1 = 30 years Groups 2 = 37–39 years | Group 1: W = 37.4–39.7 M = 25.2–27.8 Groups 2: W = 38.5–42.2 M = 26.1–27.8 | Group 1: W = 25.4–27.2 M = 26.3–27.3 Groups 2: W = 27.2–29.6 M = 28.3–29.0 | Groups 1: W = 9.5–10.8 M = 6.3–7.5 Groups 2: W = 10.2–12.2 M = 7.3–7.8 | |
| Ramírez-Vélez et al. 2017 [38] | BP, GLC, TC, TG, HDL-c, LDL-c | Colombian adults 18–35 years | W= 38.9 M= 25.5 | W = 11.8 M = 6.9 | ||
| Al-Lawati et al. 2008 [27] | BP, GLC, TG, HDL-c | Omani Arab adults ≥20 years | W = 84.5 M = 80.0 | W = 26.8 M = 23.2 | ||
| Głuszek et al. 2020 [39] | BP, GLC, TG, HDL-c | Polish Caucasian 55.7 ± 5.4 years | W = 87.0 M = 97.0 | W = 27.2 M = 27.1 | ||
| Raposo et al. 2018 [40] | BP, GLC, TC, TG, HDL-c, CRP | Portuguese adults ≥18 years | W = 89.0 M = 93.5 | W = 26.5 M = 27.0 |
Disclaimer/Publisher’s Note: The statements, opinions and data contained in all publications are solely those of the individual author(s) and contributor(s) and not of MDPI and/or the editor(s). MDPI and/or the editor(s) disclaim responsibility for any injury to people or property resulting from any ideas, methods, instructions or products referred to in the content. |
© 2023 by the authors. Licensee MDPI, Basel, Switzerland. This article is an open access article distributed under the terms and conditions of the Creative Commons Attribution (CC BY) license (https://creativecommons.org/licenses/by/4.0/).
Share and Cite
Salinas-Mandujano, R.G.; Reynoso-Camacho, R.; Salgado, L.M.; Ramos-Gomez, M.; Pérez-Ramírez, I.F.; Aguilar-Galarza, A.; Moreno-Celis, U.; Anaya-Loyola, M.A. A New Approach Using BMI and FMI as Predictors of Cardio-Vascular Risk Factors among Mexican Young Adults. Eur. J. Investig. Health Psychol. Educ. 2023, 13, 2063-2081. https://doi.org/10.3390/ejihpe13100146
Salinas-Mandujano RG, Reynoso-Camacho R, Salgado LM, Ramos-Gomez M, Pérez-Ramírez IF, Aguilar-Galarza A, Moreno-Celis U, Anaya-Loyola MA. A New Approach Using BMI and FMI as Predictors of Cardio-Vascular Risk Factors among Mexican Young Adults. European Journal of Investigation in Health, Psychology and Education. 2023; 13(10):2063-2081. https://doi.org/10.3390/ejihpe13100146
Chicago/Turabian StyleSalinas-Mandujano, Rocío Guadalupe, Rosalía Reynoso-Camacho, Luis Miguel Salgado, Minerva Ramos-Gomez, Iza F. Pérez-Ramírez, Adriana Aguilar-Galarza, Ulisses Moreno-Celis, and Miriam Aracely Anaya-Loyola. 2023. "A New Approach Using BMI and FMI as Predictors of Cardio-Vascular Risk Factors among Mexican Young Adults" European Journal of Investigation in Health, Psychology and Education 13, no. 10: 2063-2081. https://doi.org/10.3390/ejihpe13100146