Article

Advanced Process Analytical Technology in Combination with Process Modeling for Endpoint and Model Parameter Determination in Lyophilization Process Design and Optimization

1
Institute for Separation and Process Technology, Clausthal University of Technology, 38678 Clausthal-Zellerfeld, Germany
2
Martin Christ Gefriertrocknungsanlagen GmbH, 37520 Osterode am Harz, Germany
*
Author to whom correspondence should be addressed.
Processes 2021, 9(9), 1600; https://doi.org/10.3390/pr9091600
Submission received: 27 July 2021 / Revised: 31 August 2021 / Accepted: 3 September 2021 / Published: 7 September 2021
(This article belongs to the Special Issue Towards Autonomous Operation of Biologics and Botanicals)

Abstract

:
Lyophilization is widely used in the preservation of thermolabile products. The main shortcoming is the long processing time. Lyophilization processes are mostly based on a recipe that is not changed, but, with the Quality by Design (QbD) approach and use of Process Analytical Technology (PAT), the process duration can be optimized for maximum productivity while ensuring product safety. In this work, an advanced PAT approach is used for the endpoint determination of primary drying. Manometric temperature measurement (MTM) and comparative pressure measurement are used to determine the endpoint of the batch while a modeling approach is outlined that is able to calculate the endpoint of every vial in the batch. This approach can be used for process development, control and optimization.

1. Introduction

Lyophilization, or freeze-drying, is widely used in the manufacturing of biologics because it comprises gentle drying conditions that keep temperature-sensitive product safe [1,2,3]. Freeze-drying consists of three steps. In the freezing step, the water of the product solution is transformed to ice. During the primary drying phase, the pressure in the drying chamber is reduced and the shelf temperature can be increased. In this phase, frozen water is removed by sublimation from the product. The last phase, the so-called secondary drying, removes the water by desorption. Here, the shelf temperature is increased and the pressure may be decreased. The main advantages of this drying method are [4,5,6]:
-
High storage stability;
-
Gentle removal of water;
-
Short reconstitution time;
-
Accurate dosing;
-
Aseptic handling.
Long processing times, expensive equipment and maintenance are some shortcomings [4,5,6].
The demand for lyophilization technology will rise because of the increasing number of biological products that are in development [7,8,9]. This increased demand triggers a change in process development from trial-and-error to a quality-by-design-based approach using mathematical models and Process Analytical Technology in order to deepen process understanding and accelerate process development [10,11].
In 2004, the US Food and Drug Administration (FDA) presented the guidance for Industry PAT [12] in order to initiate a shift in process development from rigorous testing to a risk-based approach. Crucial elements of the Quality by Design (QbD) approach are the detection, insight and control of critical product and process parameter [12,13]. QbD assists process development and ensures manufacturing efficiency.
In this work, an advanced PAT method for endpoint determination of primary drying is outlined. Manometric temperature measurement (MTM) and comparative pressure measurement are used to determine the endpoint of the whole batch. Furthermore, a pseudo-stationary process model is validated with an experimental Design of Experiments on a pilot scale freeze dryer. The simulated results are in good agreement with the experiments. The process model is useful for process development, control and optimization, while MTM and comparative pressure measurement can be used together as the forwarding condition of primary drying.

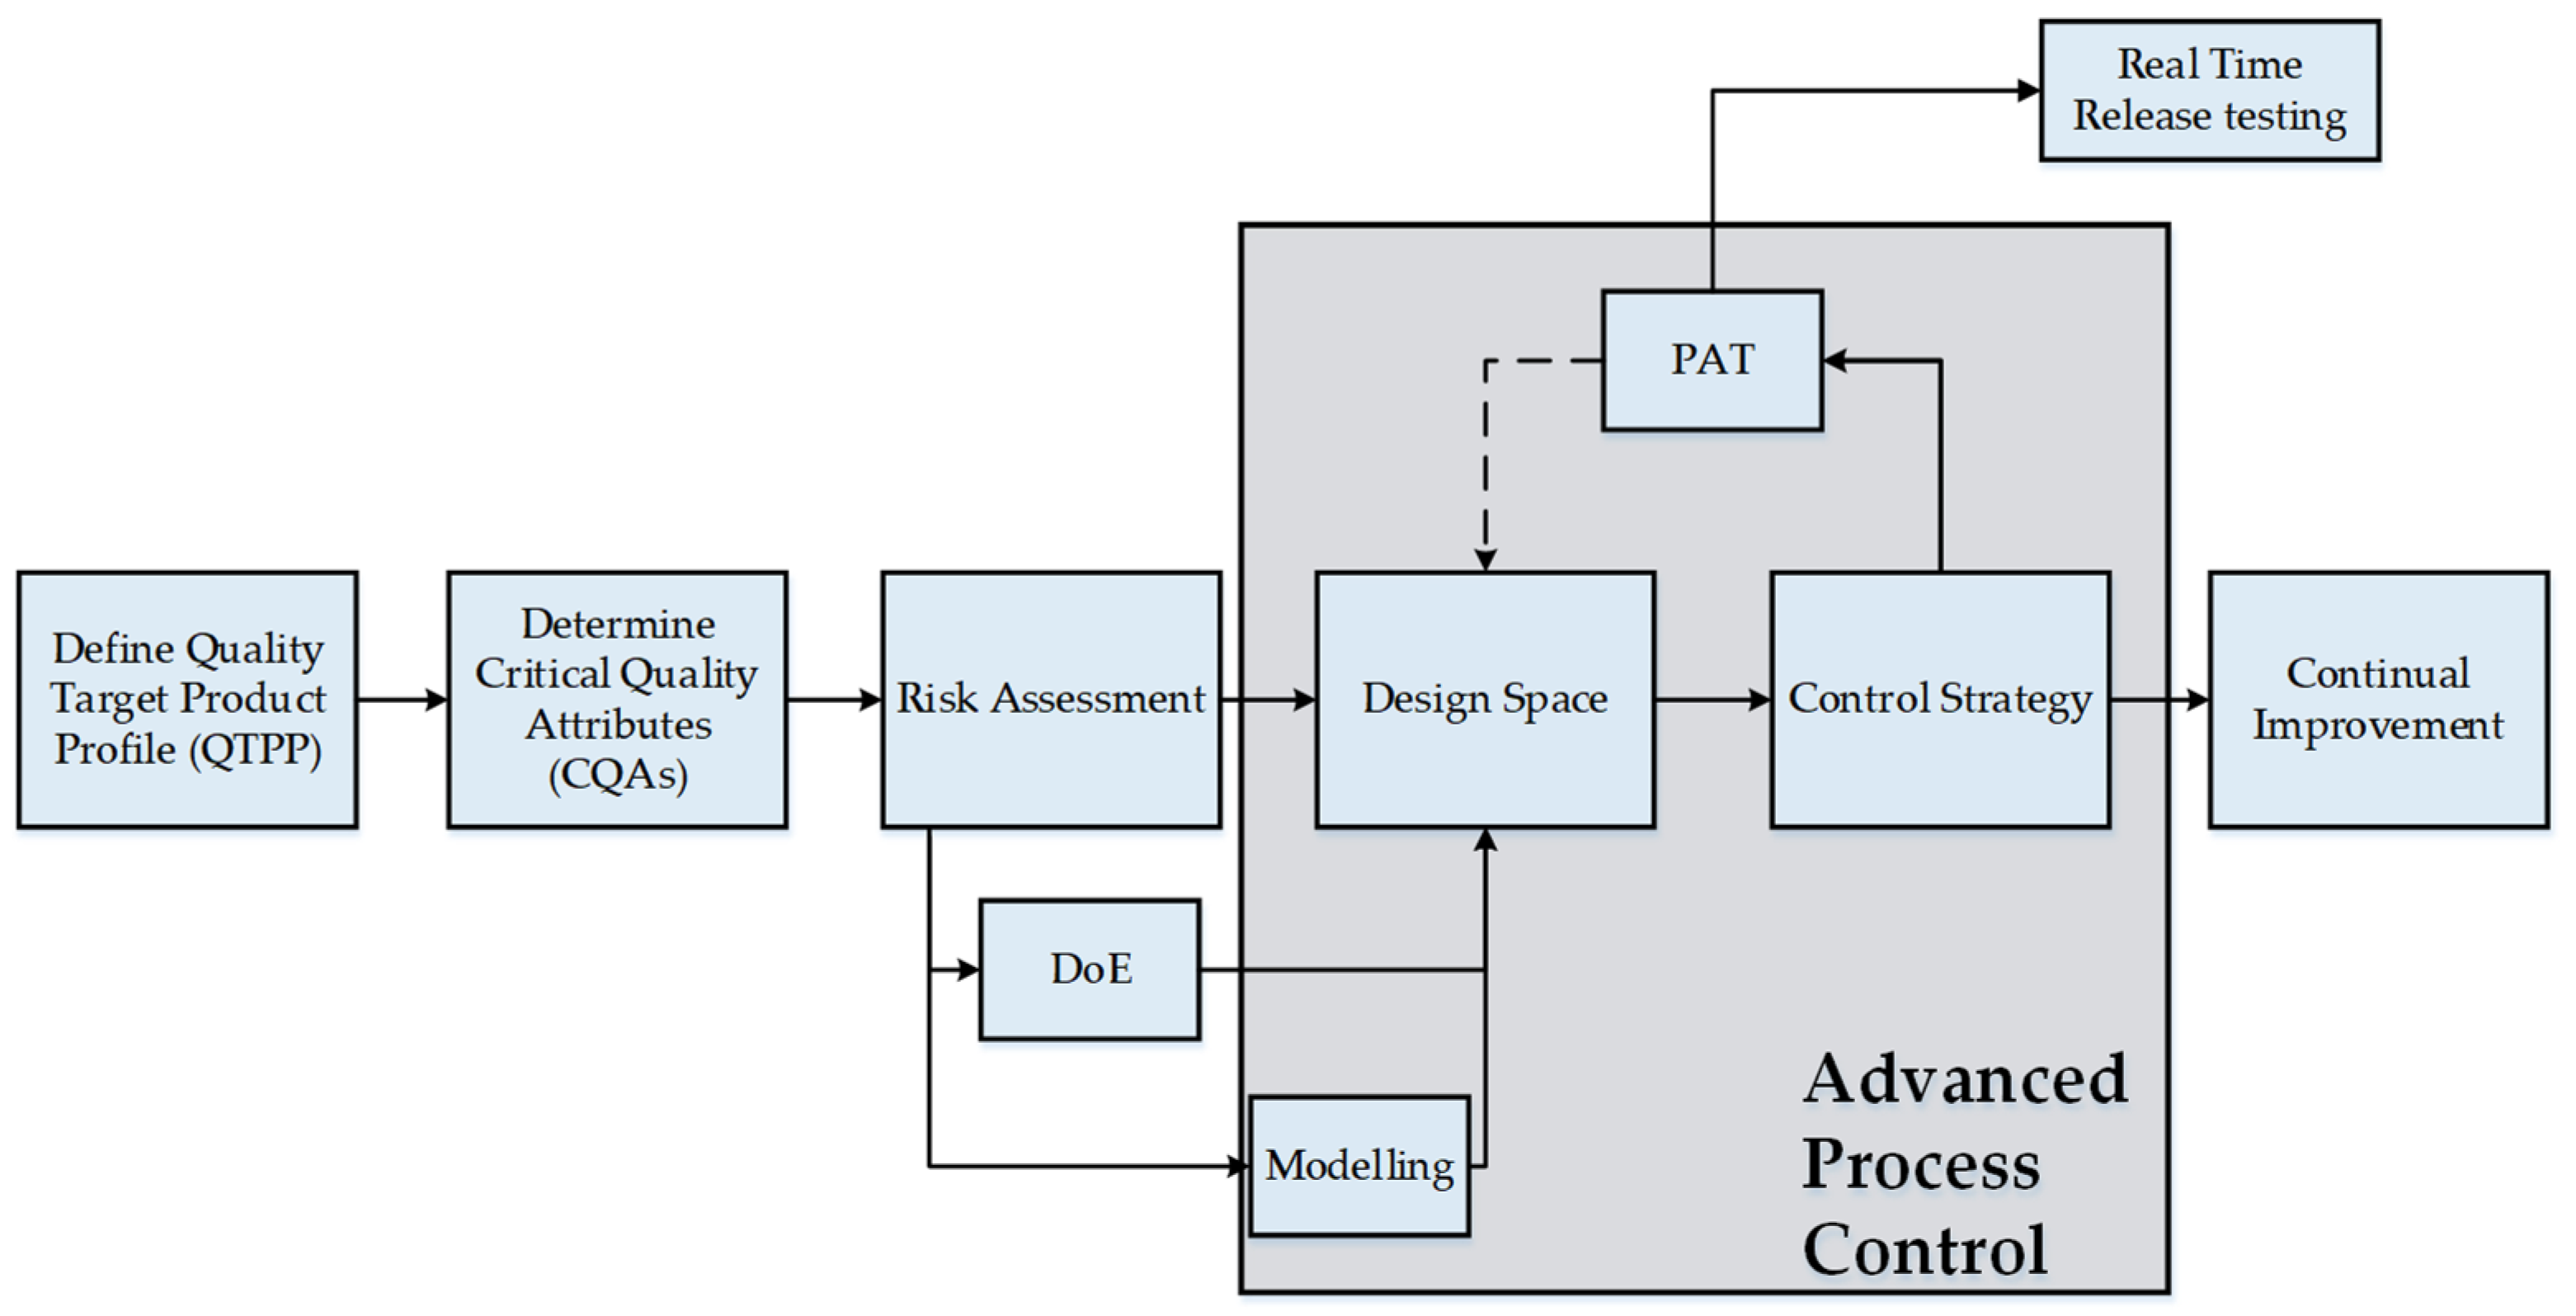
2. Quality by Design in Lyophilization

QbD is a concept that establishes continuous data-driven and risk-based process improvement. An exemplary QbD workflow is shown in Figure 1. First, the Critical Quality Attributes (CQA) of the final product have to be decided.
A lyophilized product has to meet the following CQAs:
-
Product integrity and stability;
-
Drug potency;
-
Reconstitution time;
-
Cake appearance.
The CQA are a result of the sum of different process parameters. Process parameters that effect the CQA are Critical Process Parameters (CPP). In lyophilization, the main CPP in each stage are the shelf temperature, chamber pressure and phase duration:
-
Freezing: temperature, rate;
-
Annealing: temperature, time;
-
Primary drying: temperature, pressure, duration;
-
Secondary drying: temperature, pressure, duration.
The CPP have to be identified by risk assessment and are measured by the implemented PAT [12]. In the risk assessment, the Ishikawa diagram presents possible impact factors by category while the Occurrence Impact diagram makes a quantitative assessment for the severeness and frequency of different scenarios. Both are shown in Figure 2.
The failure mode effects analysis (FMEA) is based on prior experience. The derived scoring for the Occurrence Impact diagram is shown in Table 1.
Validated pyhsico-chemical process models deepen process knowledge because they describe the separated physical effects by a coupled mass and energy balance. For Lyophilization, a broad range of models has been developed [15,16,17,18,19,20,21,22,23,24,25,26,27,28,29,30,31,32,33,34]. In combination, PAT and modeling can result in advanced autonomous process control, and real-time release testing can be the final benefit.
Another important aspect of QbD is the Design Space. It describes the effects of material and process parameter on the CQA. Inside the chosen Design Space, the necessary product quality has been assured. Therefore, manufacturing inside the Design Space does not need regulatory post approval [13].
For lyophilization, different quality by design-based process development strategies have been exemplified [18,35,36,37,38].

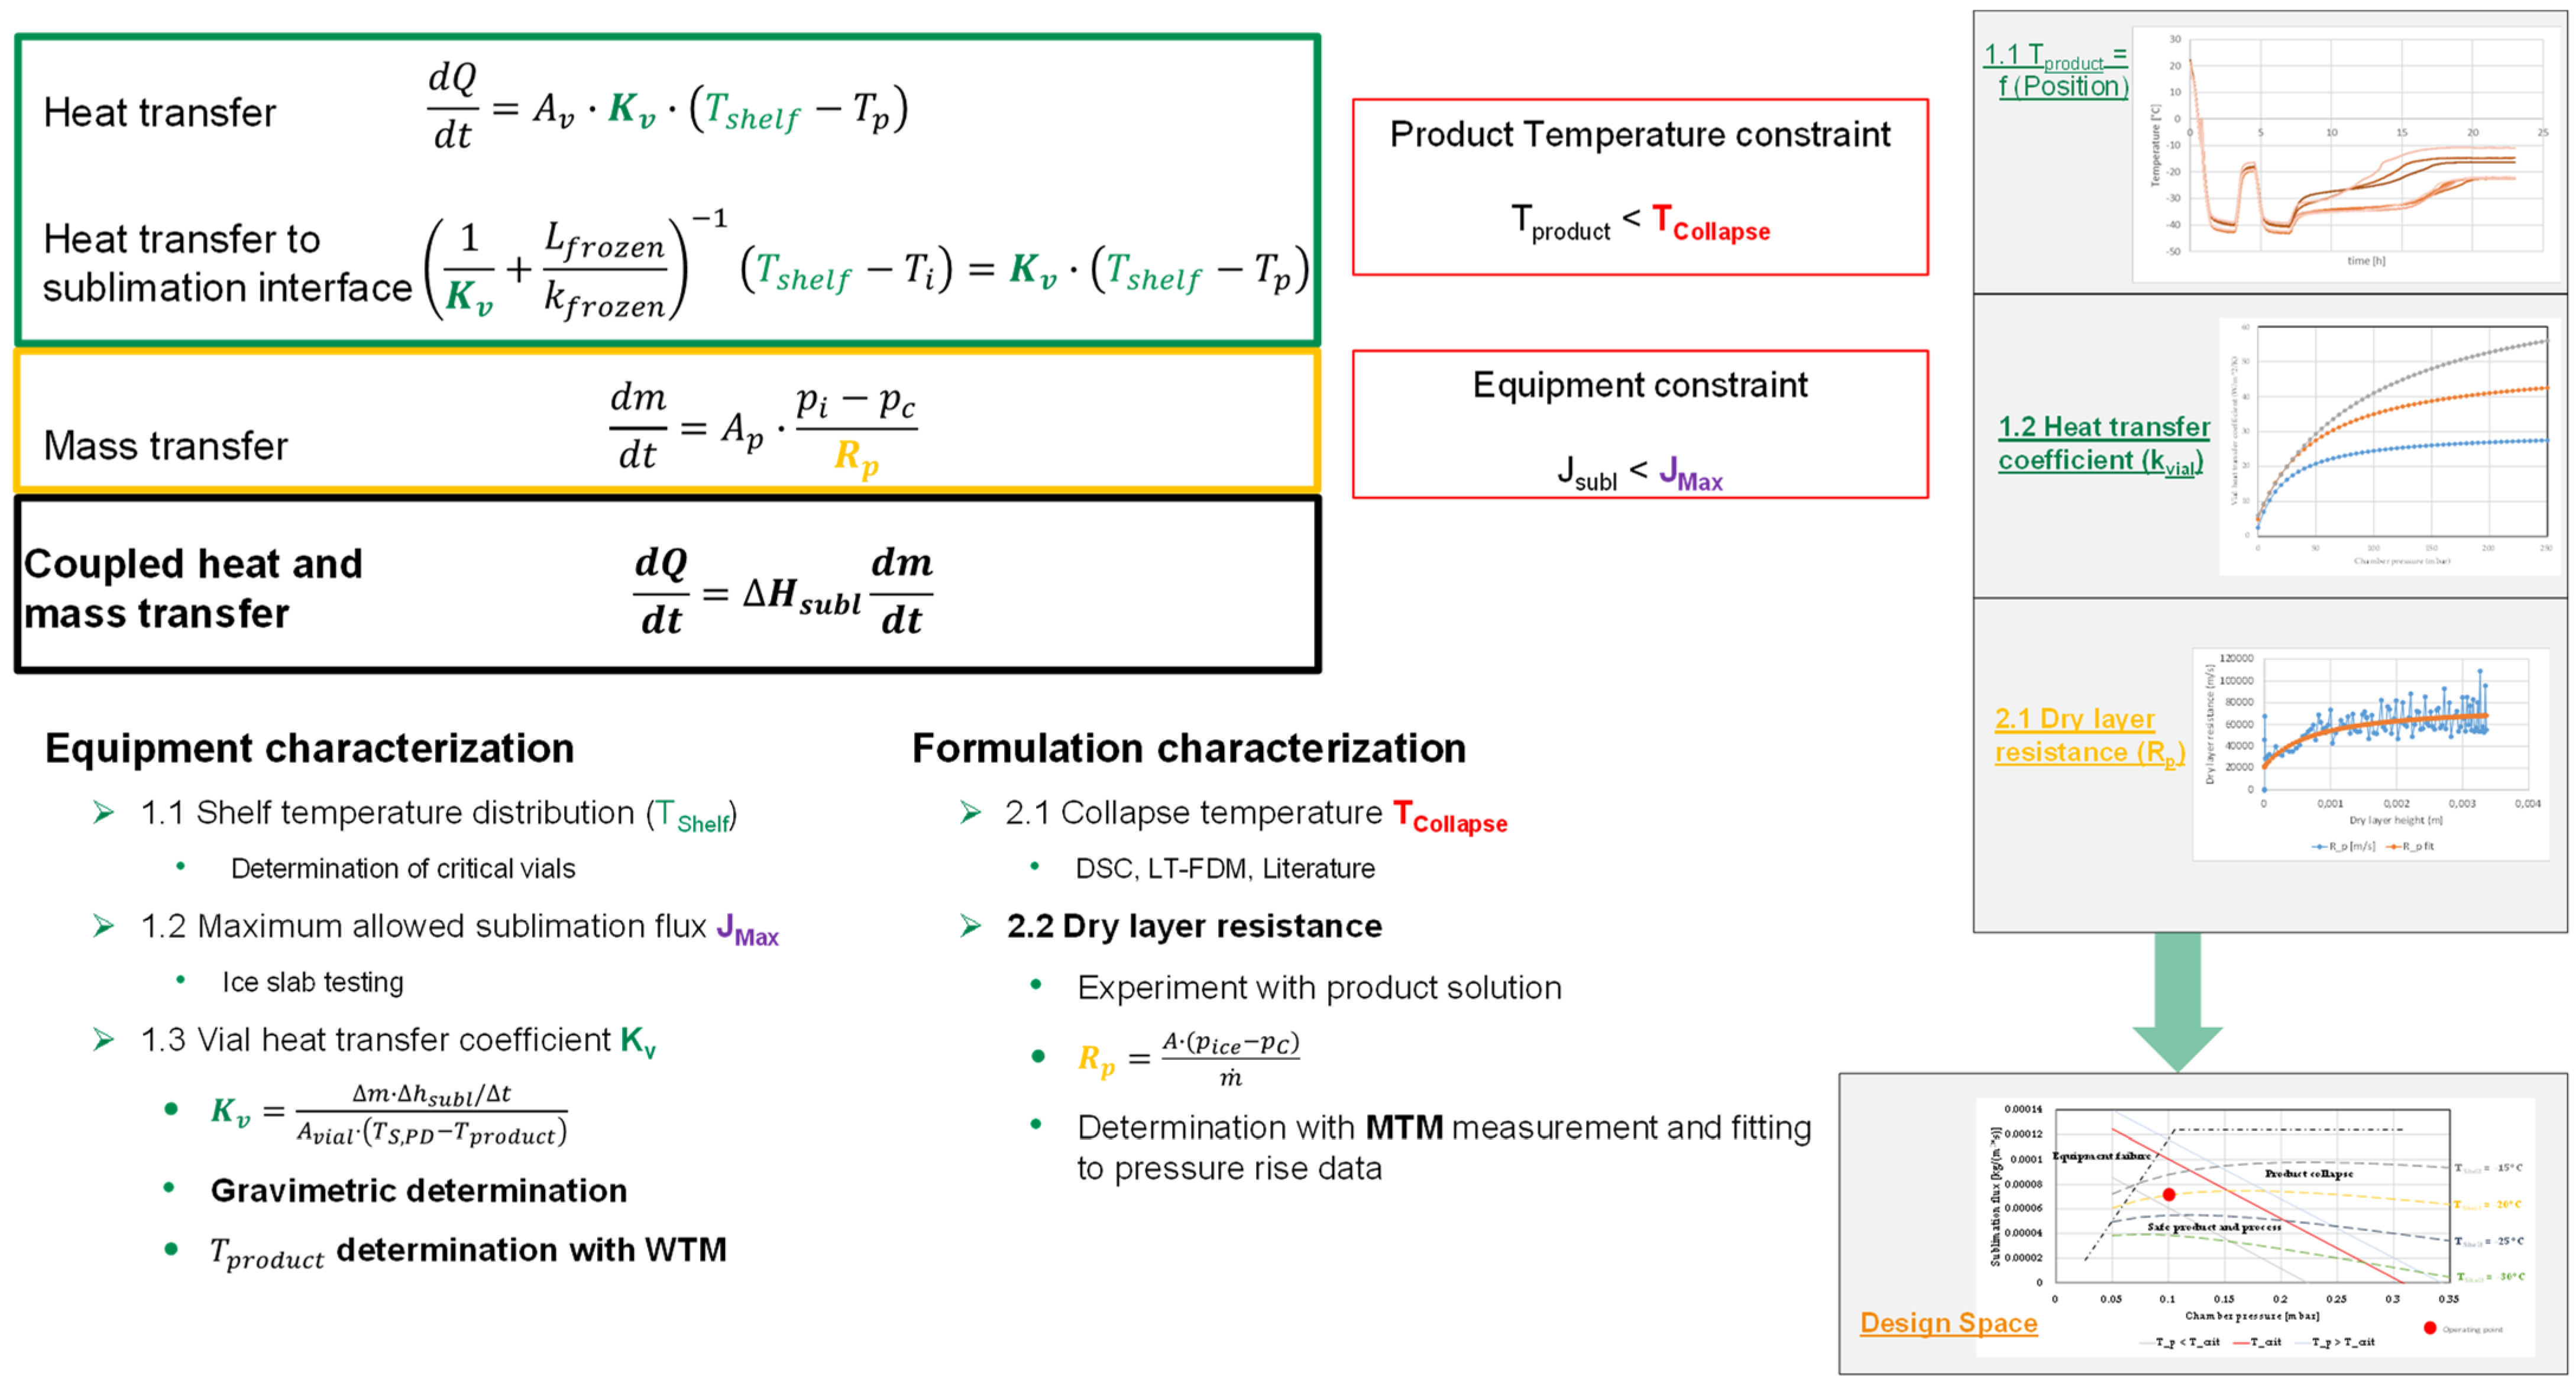
3. Steady State Modeling of Primary Drying Phase

The benefits of modeling in lyophilization are:
-
Allows process design;
-
Deepens process understanding;
-
Failure analysis;
-
Accelerated process development;
-
Technology transfer and Scale up.
Modeling is, furthermore, a key part of the QbD approach because the definition of the Design Space requires a multi-parameter optimization that would result in a significant experimental effort. Physico-chemical models are able to reduce the experimental workload by model-assisted process design (s. Figure 3). Validated process models are able to assist process development in combination with a few experiments on a laboratory scale.
Here, a pseudo-stationary model of the heat and mass transfer of the primary drying phase is used to establish a design space in which the lyophilized product can be considered safe. An exact derivation can be found in study [24]. In this model, pseudo-stationary conditions are assumed for the heat and mass transfer. This is reasonable due to the slow kinetic of the sublimation process; therefore, all heat supplied from the shelf is used for sublimation and the heat accumulation in both phases is neglected. Furthermore, the inert gas is neglected and a mono-dimensional model can describe the heat and mass transfer.
The coupled heat and mass transfer is described by:
K v · ( T S T P ) · A v = Δ H s u b l R P ( p i p c ) · A p
where Kv is the heat transfer coefficient, TS is the inlet shelf temperature, TP is the product temperature on the vial bottom, Δ H s u b l is the sublimation enthalpy, Rp is the dry layer resistance, pi is the partial vapor pressure on the sublimation interface and pc is the chamber pressure. The left-hand side of the equation describes the effective heat supplied from the bottom, while the right-hand side describes the heat used for the sublimation of ice. Since heat accumulation is neglected, the heat transfer in the frozen layer can be described by:
K v · ( T S T P ) = ( 1 K v + L f r o z e n λ f r o z e n ) 1 ( T S T i )
where Lfrozen is the length of the frozen area, λ f r o z e n is the heat conductivity of the frozen product and Ti is the product temperature on the sublimation interface. The partial vapor pressure of water on the sublimation interface is calculated with the new sublimation-pressure equation with the sublimation interface temperature [40].
The vial heat transfer coefficient Kv and the dry layer resistance RP are the model parameters and need to be determined. Experimental aspects and a discussion of the different determination methods can be found in literature [41,42].
Kv describes the heat transfer from the shelf into the vial and is described by:
K v = Δ Q / Δ t A v · ( T S T p )
Δ Q stands for the necessary heat to provide for sublimation and is the product of sublimed mass and the sublimation enthalpy. Δ t describes the duration of primary drying of the experiment beginning from the point of pressure drop to experiment completion. A v is the cross-sectional outside area of the vial. Furthermore, Kv can be split in the different contributions of the heat transfer.
K v = k c o n d + k r + k g c
k c o n d describes the direct conduction of the shelf to the vial, while k r and k g c quantify the heat transfer by radiation or gas conduction. The radiative heat transfer is more dominant in the edge vials.
Therefore, Kv is dependent on the vial type and position, the used freeze dryer and the process conditions [42]. The chamber pressure in the primary drying has a direct influence on the product temperature since it alters the heat transfer. An increase in chamber pressure decreases the driving force of sublimation but the higher heat transfer results in higher product temperature on the sublimation interface. This in turn increases the vapor pressure and results in an increase in the driving force. The pressure dependence of Kv can be described by:
K v = C 1 + C 2 · p c 1 + C 3 · p c
Different procedures are used to obtain Kv:
-
Gravimetric vial sublimation tests [33,42];
-
Tunable Diode Laser Adsorption Spectroscopy (TDLAS) [42,43,44];
-
Pressure rise test [45,46,47].
RP describes the resistance of the dried layer to vapor flow from the sublimation interface and is defined as:
R p = A p · p i p c m ˙
Ap is the internal cross-sectional area of the vial, p i and p c are the pressure at the sublimation front and in the chamber, respectively, and m ˙ is the sublimation rate. Rp has a direct influence on the product temperature. A high resistance leads to higher product temperatures and vice versa. Therefore, products with low RP can be subjected to aggressive drying cycles. The resistance of the dried phase increases during the freeze-drying process due to an increase in the dry layer height. This can be described by:
R p = R 1 + R 2 · L d r y 1 + R 3 · L d r y
The dry layer resistance depends on: the freezing protocol, the formulation, the manufacturing environment and the freeze dryer. Amorphous substances can also show a dependence on process conditions if microcollapse occurs.
For the determination of RP, different procedures are available:
-
TDLAS [48];
-
Pressure rise test [45,46,47,49];
-
Equation using specific surface area [50];
-
Model parameter fitting to experimental product temperature profiles [51,52];
-
Special weighing device, microbalance [53];
-
Gravimetric method by sequential stoppering of the vials.

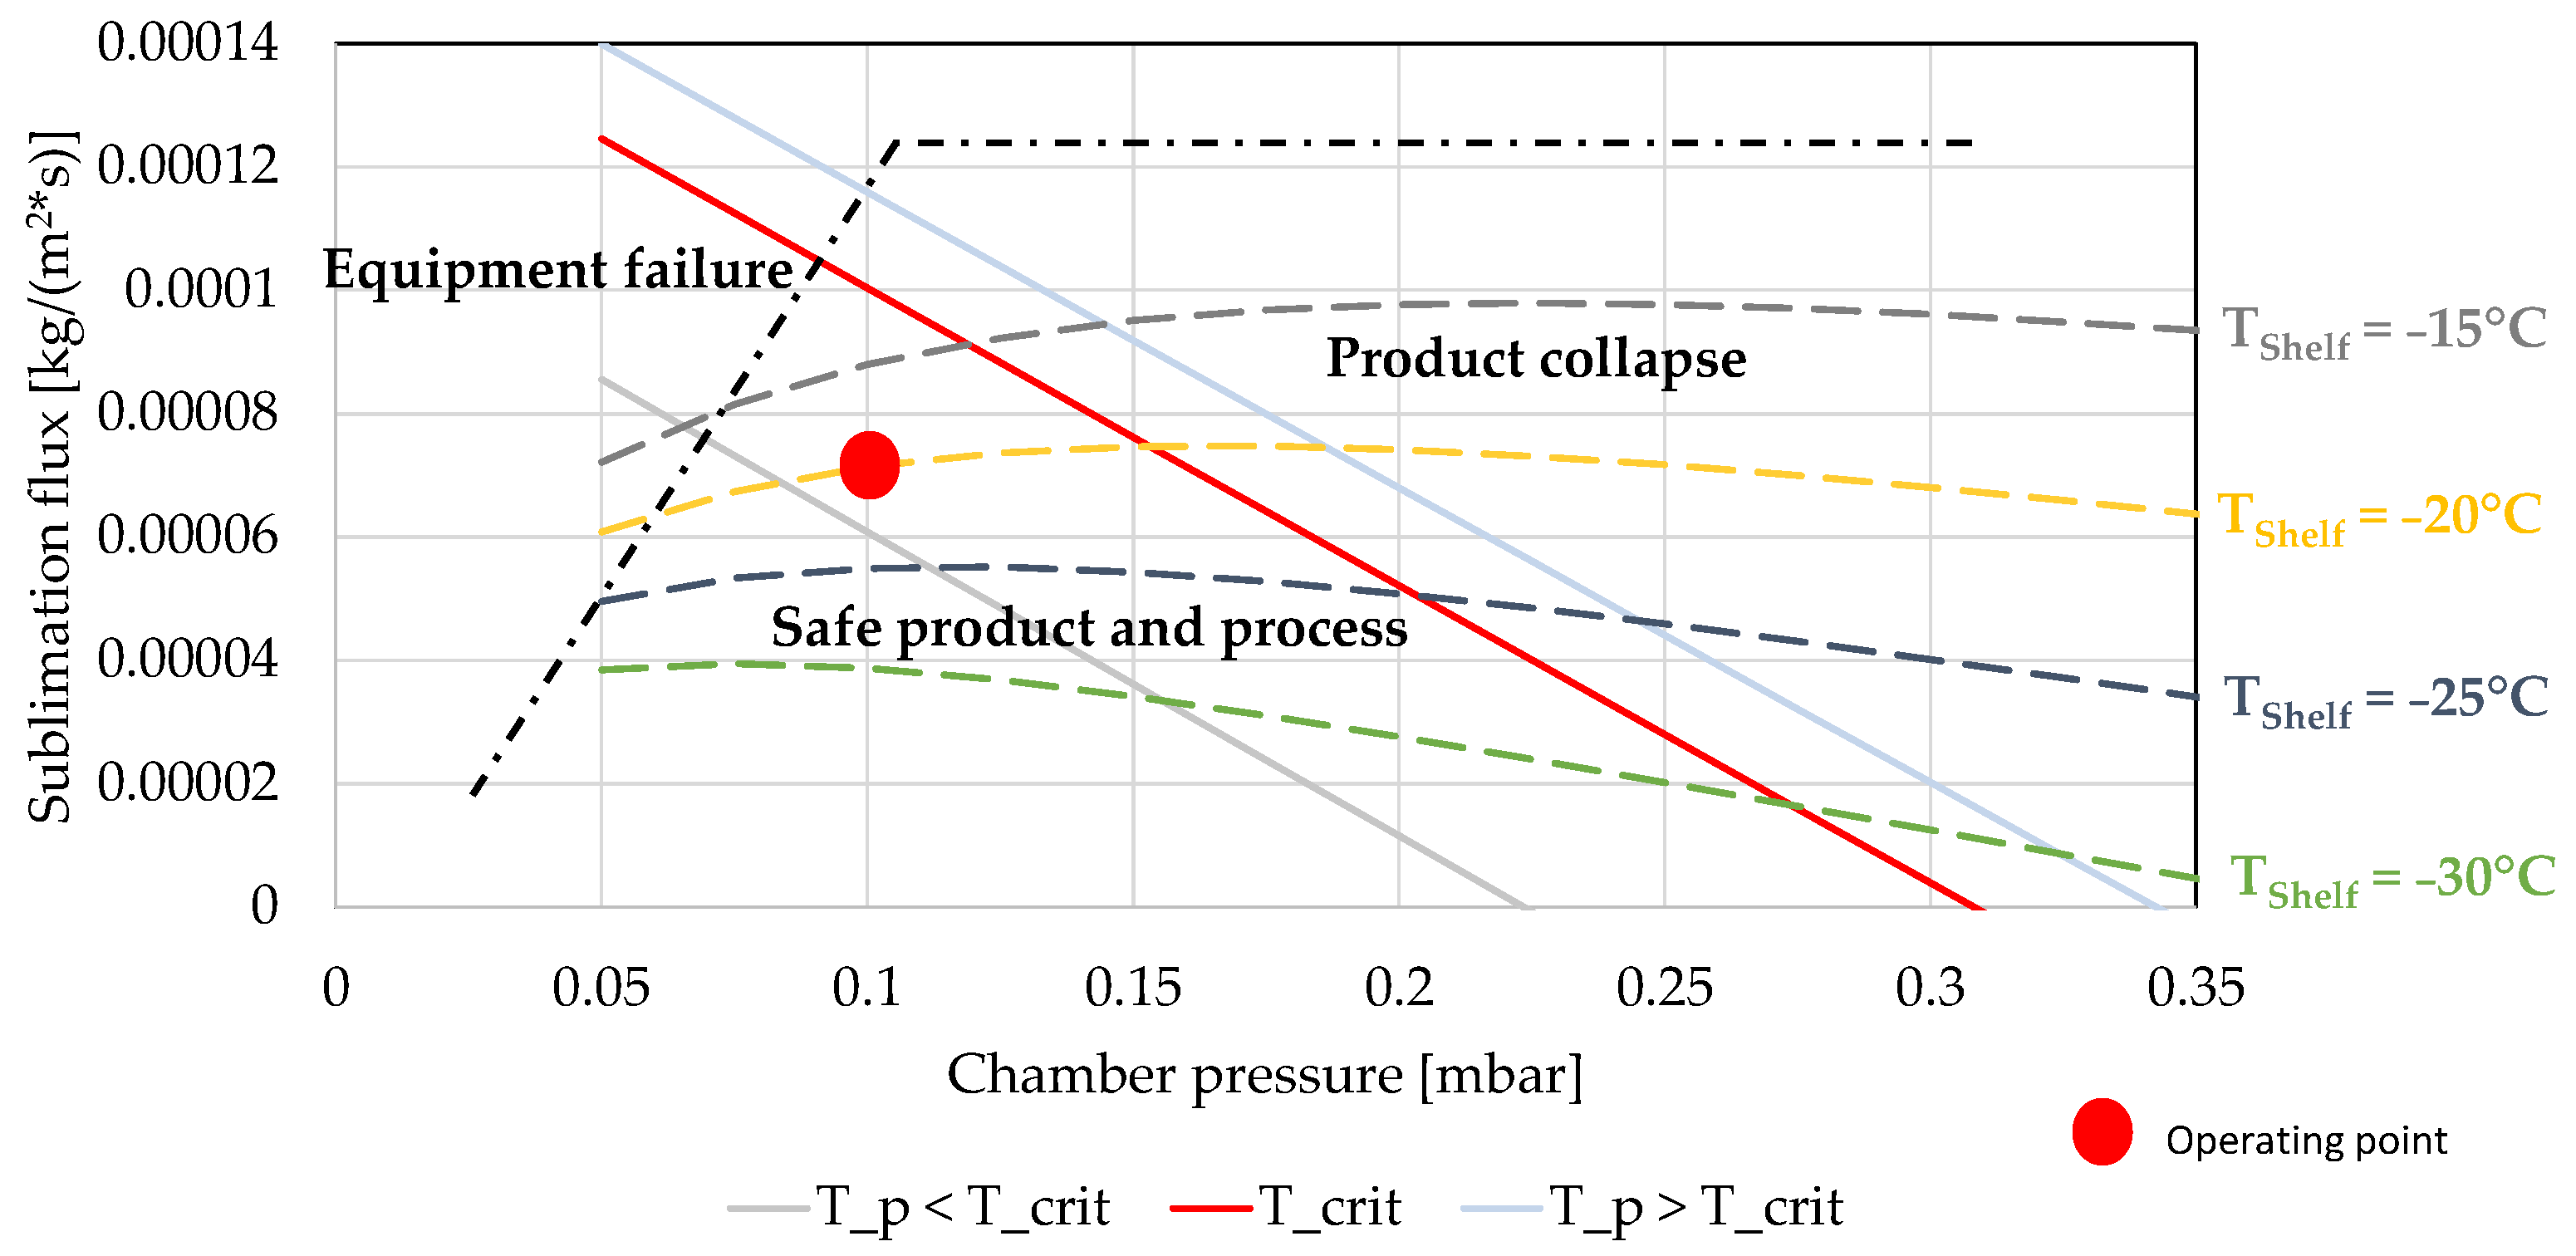
4. Construction of the Design Space

The Design Space is a multidimensional room that describes the effects of material and process parameters on the final product [13].
In lyophilization, two constraints are dominant. First, the product temperature must not exceed the critical temperature of the formulation. For crystalline excipients, it is the eutectic temperature and for amorphous formulations it is the collapse temperature. An exceeding of this temperature would result in a loss of structure and cake elegance. This could lead to a whole batch rejection. Second, the used equipment has maximum capacities to ensure pressure control. Therefore, the sublimation flux has to be kept under a certain limit. This limit is related to choked flow, refrigeration capacities and possible transport of particles. A loss in pressure control must be prevented because it can result in a critical increase in product temperature.
The product temperature is not set directly but is a result of shelf temperature and chamber pressure. Therefore, a different set of shelf temperatures and chamber pressures can result in the same product temperature. The Design Space that can be constructed by the stationary heat and mass transfer equation describes this interplay. The exact procedure to build the Design Space is described elsewhere [54]. In Figure 4, an exemplified Design Space is shown. The product temperature isotherms have a linear dependence on the chamber pressure while the shelf temperature isotherms are not linear. The critical temperature in this design space is marked in red. Every combination of shelf temperature and chamber pressure that results in a product temperature under the critical product temperature line can be considered safe. Furthermore, the Design Space considers the equipment constraint. The pressure-dependent line describes the choked flow regime, while the horizontal line exemplifies the equipment failure if the refrigeration capacity is exceeded or if parts of the formulation are transported.
It has to be noted that the Design Space alters during the drying because of the increase in the dry layer height. Therefore, a process that is considered safe at first can result in a collapsed product if the process conditions are not adapted. Furthermore, an intra-batch variance of product temperature profiles is seen in a freeze dryer caused by higher radiative heat transfer for the edge vials. The difference in product temperatures is shown in Figure 5.
Edge vials are the temperature-limiting vials, while center vials define the shortest drying time. An optimization for edge vials could lead to insufficient drying of center vials, while an optimization solely for center vials could lead to an exceeding of the critical temperature in the edge vials. Both modes would cause quality loss. Therefore, in process development and optimization, both vial classes, edge and center, have to be considered for an optimal process design. The Design Space further depends on the used equipment, and with this approach a technology transfer is possible [33,34].

5. Process Analytical Technology for Lyophilization

A wide variety of PAT approaches are available to measure different properties of the lyophilization process. They can be classified in different categories, e.g., single vial vs. batch or invasive vs. non-invasive.
Most commonly, thermocouples or resistance thermal detectors are used to measure the product temperature of selected vials during the drying process. The measurement is sensitive to the location of the sensing device, and it has to be kept in mind that the probed vials dry differently since the invasive probe leads to a lower supercooling. Newer technologies that measure the product temperature wireless have been presented, e.g., TEMPRIS, WTMplus. The big advantages are the passive operation of the probes and the usage in automatic loading systems that allows for a higher flexibility in the positioning [55,56].
The predominant measurement techniques for the chamber pressure are the Pirani gauge and the capacitance manometer. The Pirani reading is highly dependent on the gas composition since the gas atmosphere cools a heated wire and the chamber pressure is obtained from the wire resistance. In contrast, the capacitance manometer measures the chamber pressure independent of the gas composition. It corresponds the chamber pressure to the deflection of a membrane and the so resulting voltage. Together, Pirani and capacitance measurements can be used as comparative pressure measurements to determine the endpoint of primary drying [56]. At the end of primary drying, the gas composition shifts from water to nitrogen and the pressure readings are approaching each other.
Emerging PAT to observe different properties of the lyophilized product and the progress of drying are:
-
TDLAS;
-
Mass spectrometry (MS);
-
Near-infrared spectroscopy (NIR);
-
Raman spectroscopy;
-
MTM.
TDLAS allows for the measurement of the gas component by the absorption of electromagnetic energy at specific wavelengths [55,56]. In lyophilization, the beam wavelength is tuned to the water vapor adsorption spectra. It only needs optical access to the duct for continuous online monitoring of the freeze-drying process, but the duct needs to be of sufficient length to allow for the measurement. This technology enables the measurement of gas velocity, water vapor flow and endpoint determination.
The quadrupole MS allows for the identification of residual gas based on the mass charge ratio. The drying time determined by MS is essentially the same as the Pirani gauge but the MS can also detect extractables from stoppers, silica oil, leaks and other gas components [56]. It allows for primary and secondary drying endpoint determination. The main drawbacks are the high cost, the complex installation since the device is not steam sterilizable and the device has to be calibrated for every formulation.
NIR and Raman show high potential as inline PAT in the manufacturing of biologics and can be used in lyophilization [57,58,59,60,61,62,63]. Raman and NIR are single vial measurement methods that allow for the measurement of different critical product and process characteristics. For the Raman measurement, the probe is placed on top of the vial while NIR probes are placed at the vial bottom. The combination of Raman and NIR enables the drying endpoint detection. Additionally, Raman and NIR supply valuable data for process development and optimization [63]. The introduction into manufacturing scale is limited due to the complex installation.
MTM uses data from the pressure rise test to estimate product temperature at the sublimation interface, the dry layer resistance and the vial heat transfer coefficient [46,49,64]. Different algorithms can analyze the pressure rise data. They are exemplified in literature [65]. The pressure rise experiments are conducted at defined time intervals. The valve between the drying and condenser chamber is closed and the pressure rise is recorded during the test interval. Then, the MTM equation is fitted to the data by an algorithm and yields the product resistance and the vapor pressure of ice at the sublimation front [55]:
p ( t ) = p i ( p i p 0 ) · e x p [ ( 3.461 · N · A p · T s V · ( R p + R s ) ) · t ] + 0.465 · p i · Δ T · [ 1 0.811 · e x p ( 0.114 L f r o z e n · t ) ] + X · t  
p(t) describes the increase in chamber pressure during the pressure rise test, p0 is the chamber pressure before the test, N is the number of dried vials, V is the drying chamber volume, Δ T is the product temperature difference at the sublimation interface and the ground and X is a variable for the linear pressure increase.
It has to be kept in mind that the increase in the pressure during the measurement only rises to the vapor pressure of the coldest vial and that the MTM data are accurate until 2/3 of primary drying because the number of vials still drying alters [46,55]. However, the pi value can still be used to determine the endpoint of primary drying [55]. During the pressure rise test, an increase in product temperature is possible, which can lead to the collapse of the product if the process is near the edge of failure. MTM is a useful tool for process monitoring and model parameter determination.

6. Materials and Methods

6.1. Product Mixture and Instruments

The 50 g/L mannitol solution was prepared by dissolving d-mannitol (≥98%, Sigma-Aldrich, St. Louis, MO, USA) in purified water (arium™pro, Sartorius AG, Göttingen, Germany). A laboratory-scale LC 1200 S (Sartorius AG, Göttingen, Germany) is used to measure the weights.

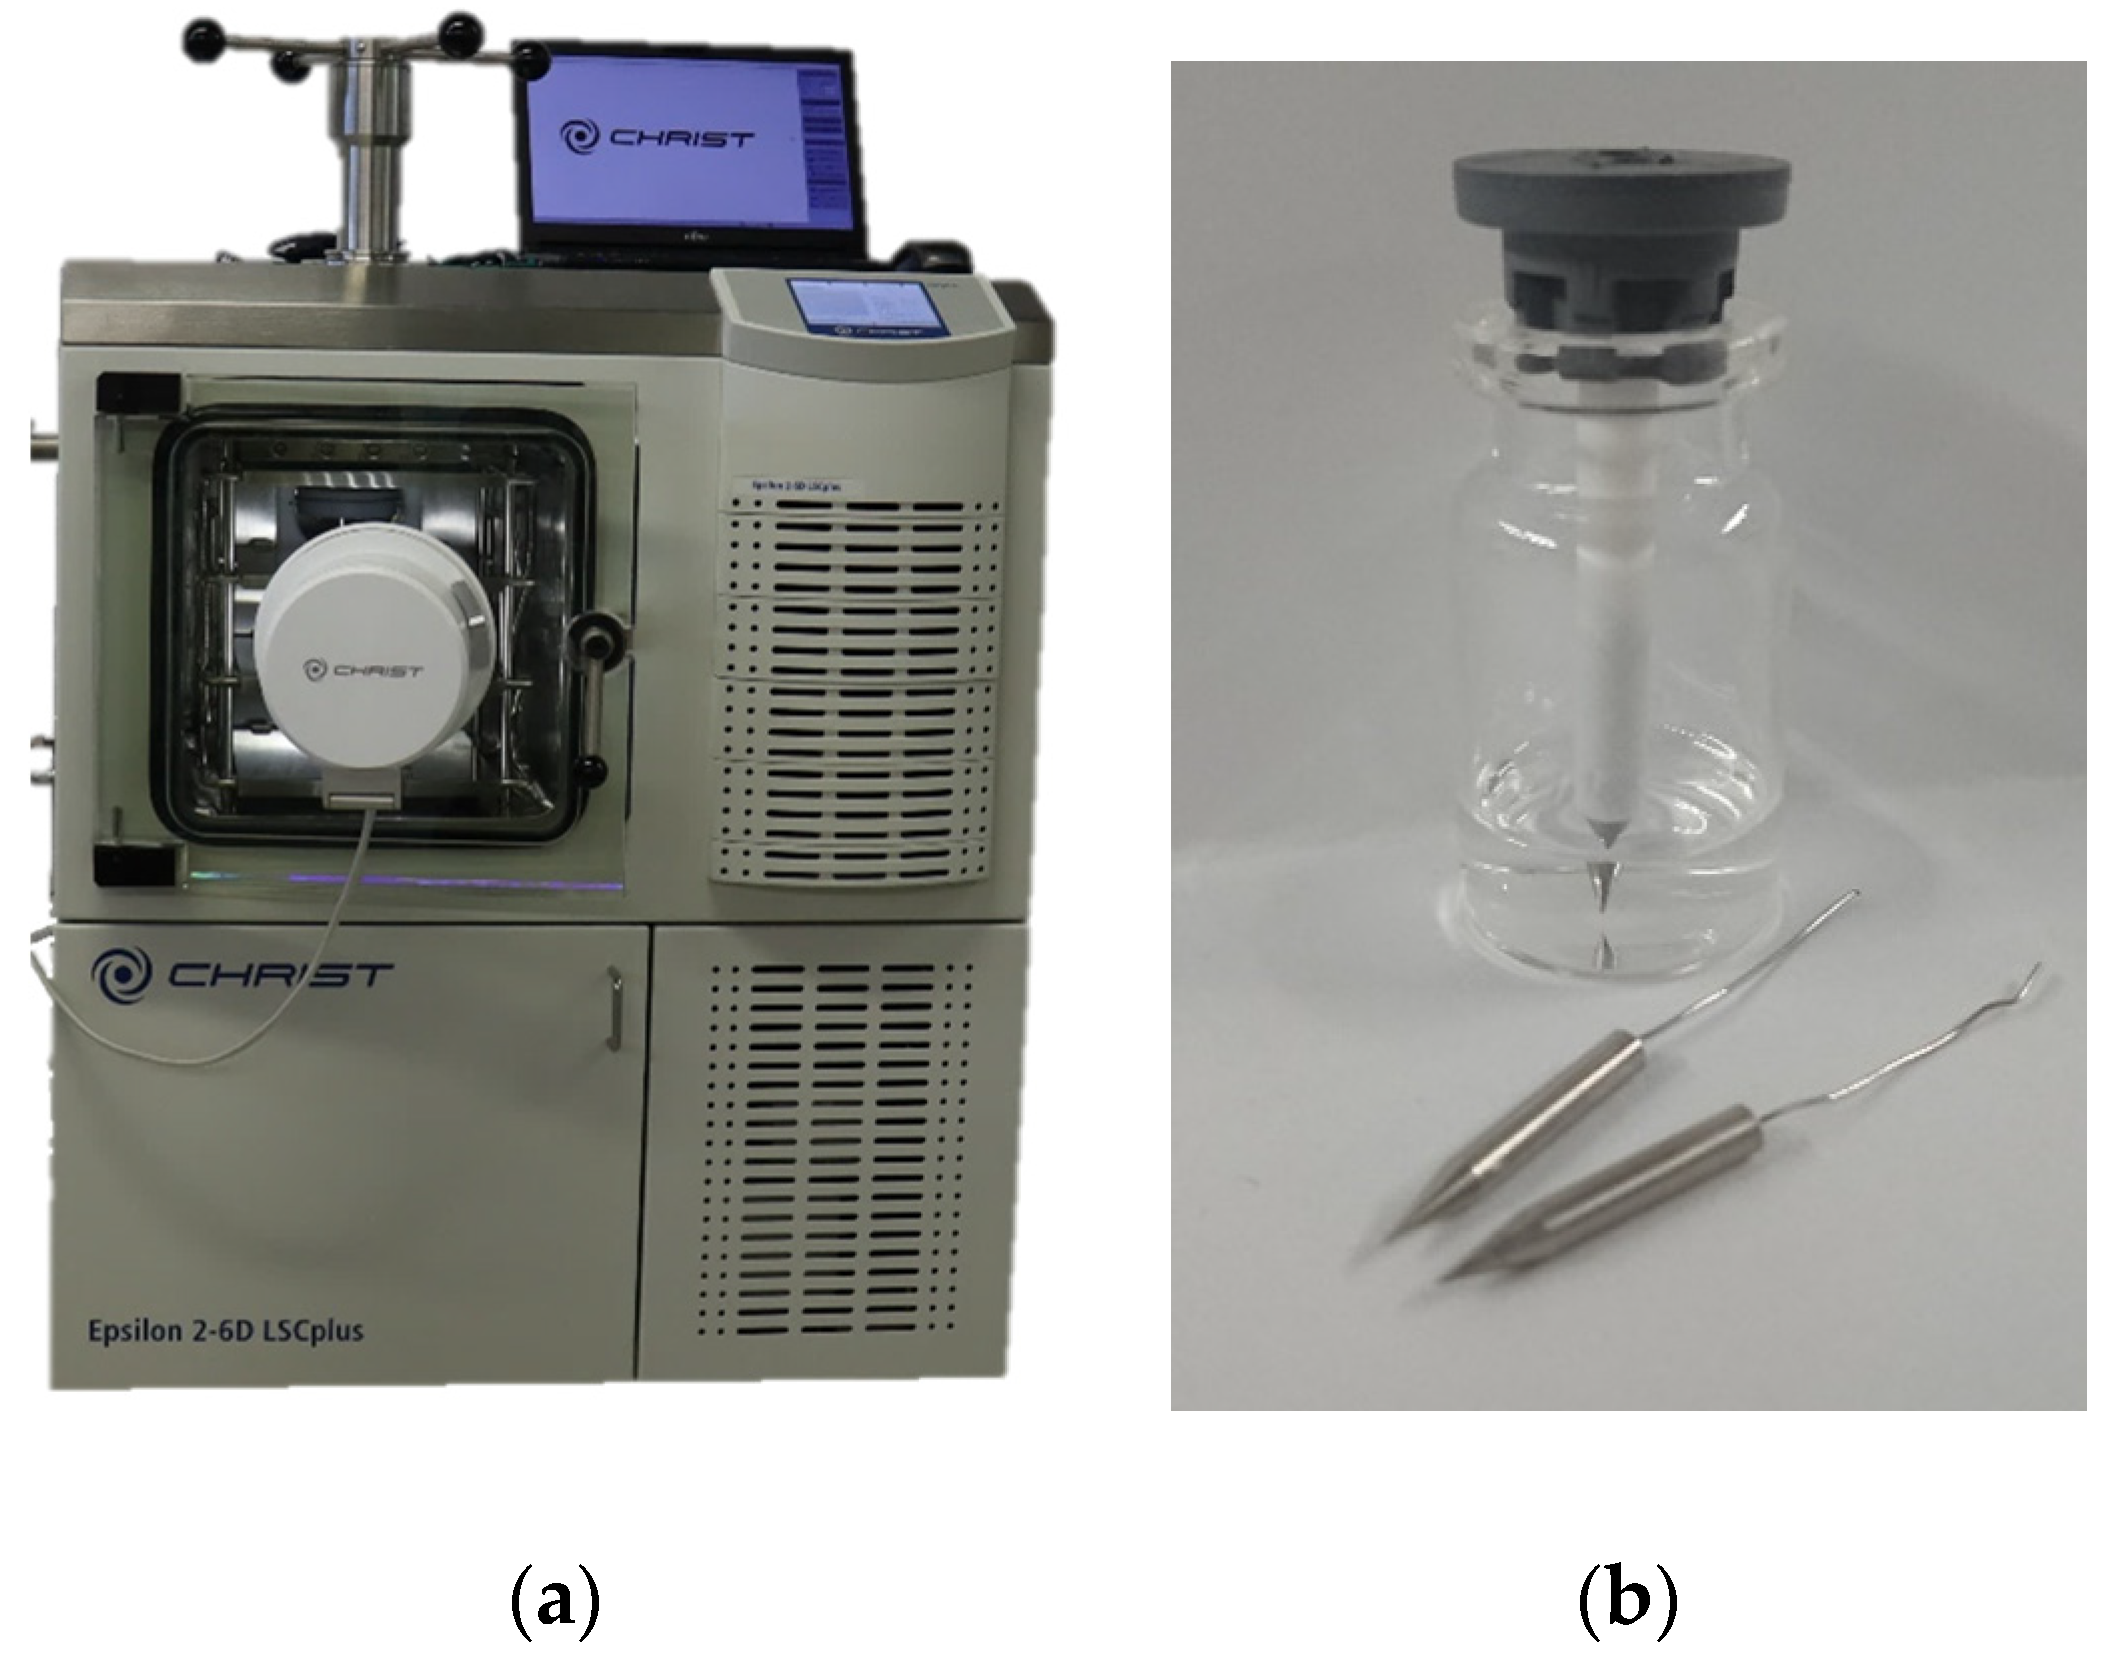
6.2. Freeze-Drying Equipment

All freeze-drying experiments were carried out in an Epsilon 2-6D LSCplus pilot freeze dryer (Martin Christ Gefriertrocknungsanlagen GmbH, Osterode am Harz, Germany), see Figure 6a. A total of 2 mL of the product solution was filled into 6R injection vials (Martin Christ Gefriertrocknungsanlagen GmbH, Osterode am Harz, Germany) with an eppendorf Research® plus 0.5–5 mL pipette (Eppendorf AG, Hamburg, Germany). In total, 135 vials were used and loaded on the middle shelf of the freeze dryer. “Wireless Temperature Measurement plus” (WTMplus) sensors (Martin Christ Gefriertrocknungsanlagen GmbH, Osterode am Harz, Germany) measured the product temperature during the whole freeze-drying process, see Figure 6b. The sensors were placed centrally on the vial bottom and the LPCplus process visualization software (Martin Christ Gefriertrocknungsanlagen GmbH, Osterode am Harz, Germany) recorded the data.

6.3. Experimental Runs

The freeze-drying cycle of the product mixture was adopted from literature [66]. At first, the shelf temperature was lowered to −45 °C at a temperature ramp of 0.2 °C/min and afterwards this temperature was held for 6 h. Next, the drying steps were executed. The shelf temperature and the chamber pressure for the primary drying phase vary as depicted in the Design of Experiments (DoE) (Table 2). The forwarding condition was implemented with comparative pressure measurement and set to 15%. The temperature ramp to increase the shelf temperature is 1 °C/min. The chamber pressure has been varied between 20% and 90% of ice pressure at the lowest shelf temperature in order to evaluate a system with high and low driving force and the shelf temperature has been chosen inside a range suitable for the drying of mannitol without collapse.

6.4. Software

The DoE was generated by JMP (JMP Inc., SAS Institute, Cary, NC, USA). During freeze-drying, all data are collected by LPCplus and the MTM data were analyzed by MTMplus Analyse (Martin Christ Gefriertrocknungsanlagen GmbH, Osterode am Harz, Germany).

6.5. Overall Vial Heat Transfer Coefficient

In this study, KV is determined by the gravimetric method. This procedure is more labour intensive but results in individual values for KV and has been used in different studies before. The 6R vials were filled with 2 mL water and loaded onto the shelf. A selection of vials are weighed before the freeze-drying procedure is started. For scheduling ease, the vials have been frozen overnight and then primary drying began. The shelf temperature and chamber pressure of the primary drying phase are the same as in the DoE depicted above. Primary drying is aborted as soon as the first measured product temperature reaches the shelf temperature within 1 °C difference. The vacuum is broken and the vials are unloaded and then weighed again after thawing. The product temperature of the closest probed vial is taken as the product temperature of the weighed vial. The necessary temperature data are collected by LPCplus.

6.6. Dry Layer Resistance

Different procedures can be used to determine the product resistance. In this study, the value is determined by MTM. During primary drying, the valve in the connecting duct is closed and the pressure rise data inside the drying chamber is collected. An optimized periodic MTM is used. The time interval is 10 min and the measurement duration can be up to 30 s depending on the pressure rise. If no significant increase in pressure rise is detected for 3 s, the MTM is finished and the valve opens. The MTM equation is fitted to the pressure rise data by a Levenberg–Marquardt algorithm implemented into the MTMplus Analyse software. During MTM, the increase in chamber pressure leads to an increased heat transfer and could possibly damage the product. The optimized measurement has the advantage that the temperature increase in the product is low. The MTM duration is only kept to the length required to reach equilibrium vapor pressure; thus, the product is exposed to the increased heat transfer for a shorter time compared to the classical method where the duration is a fixed time.

7. Results

First, the results of the model parameter determination concept are shown. Therefore, the same primary drying setpoints are used as depicted in Table 2. The experiments have been conducted twice. The model parameter determination concept is summarized in Figure 7. During the experiments, the pressure has always been controllable; therefore, no ice slab testing has been used. The eutectic temperature of mannitol has been identified to be around −1.5 °C [66].

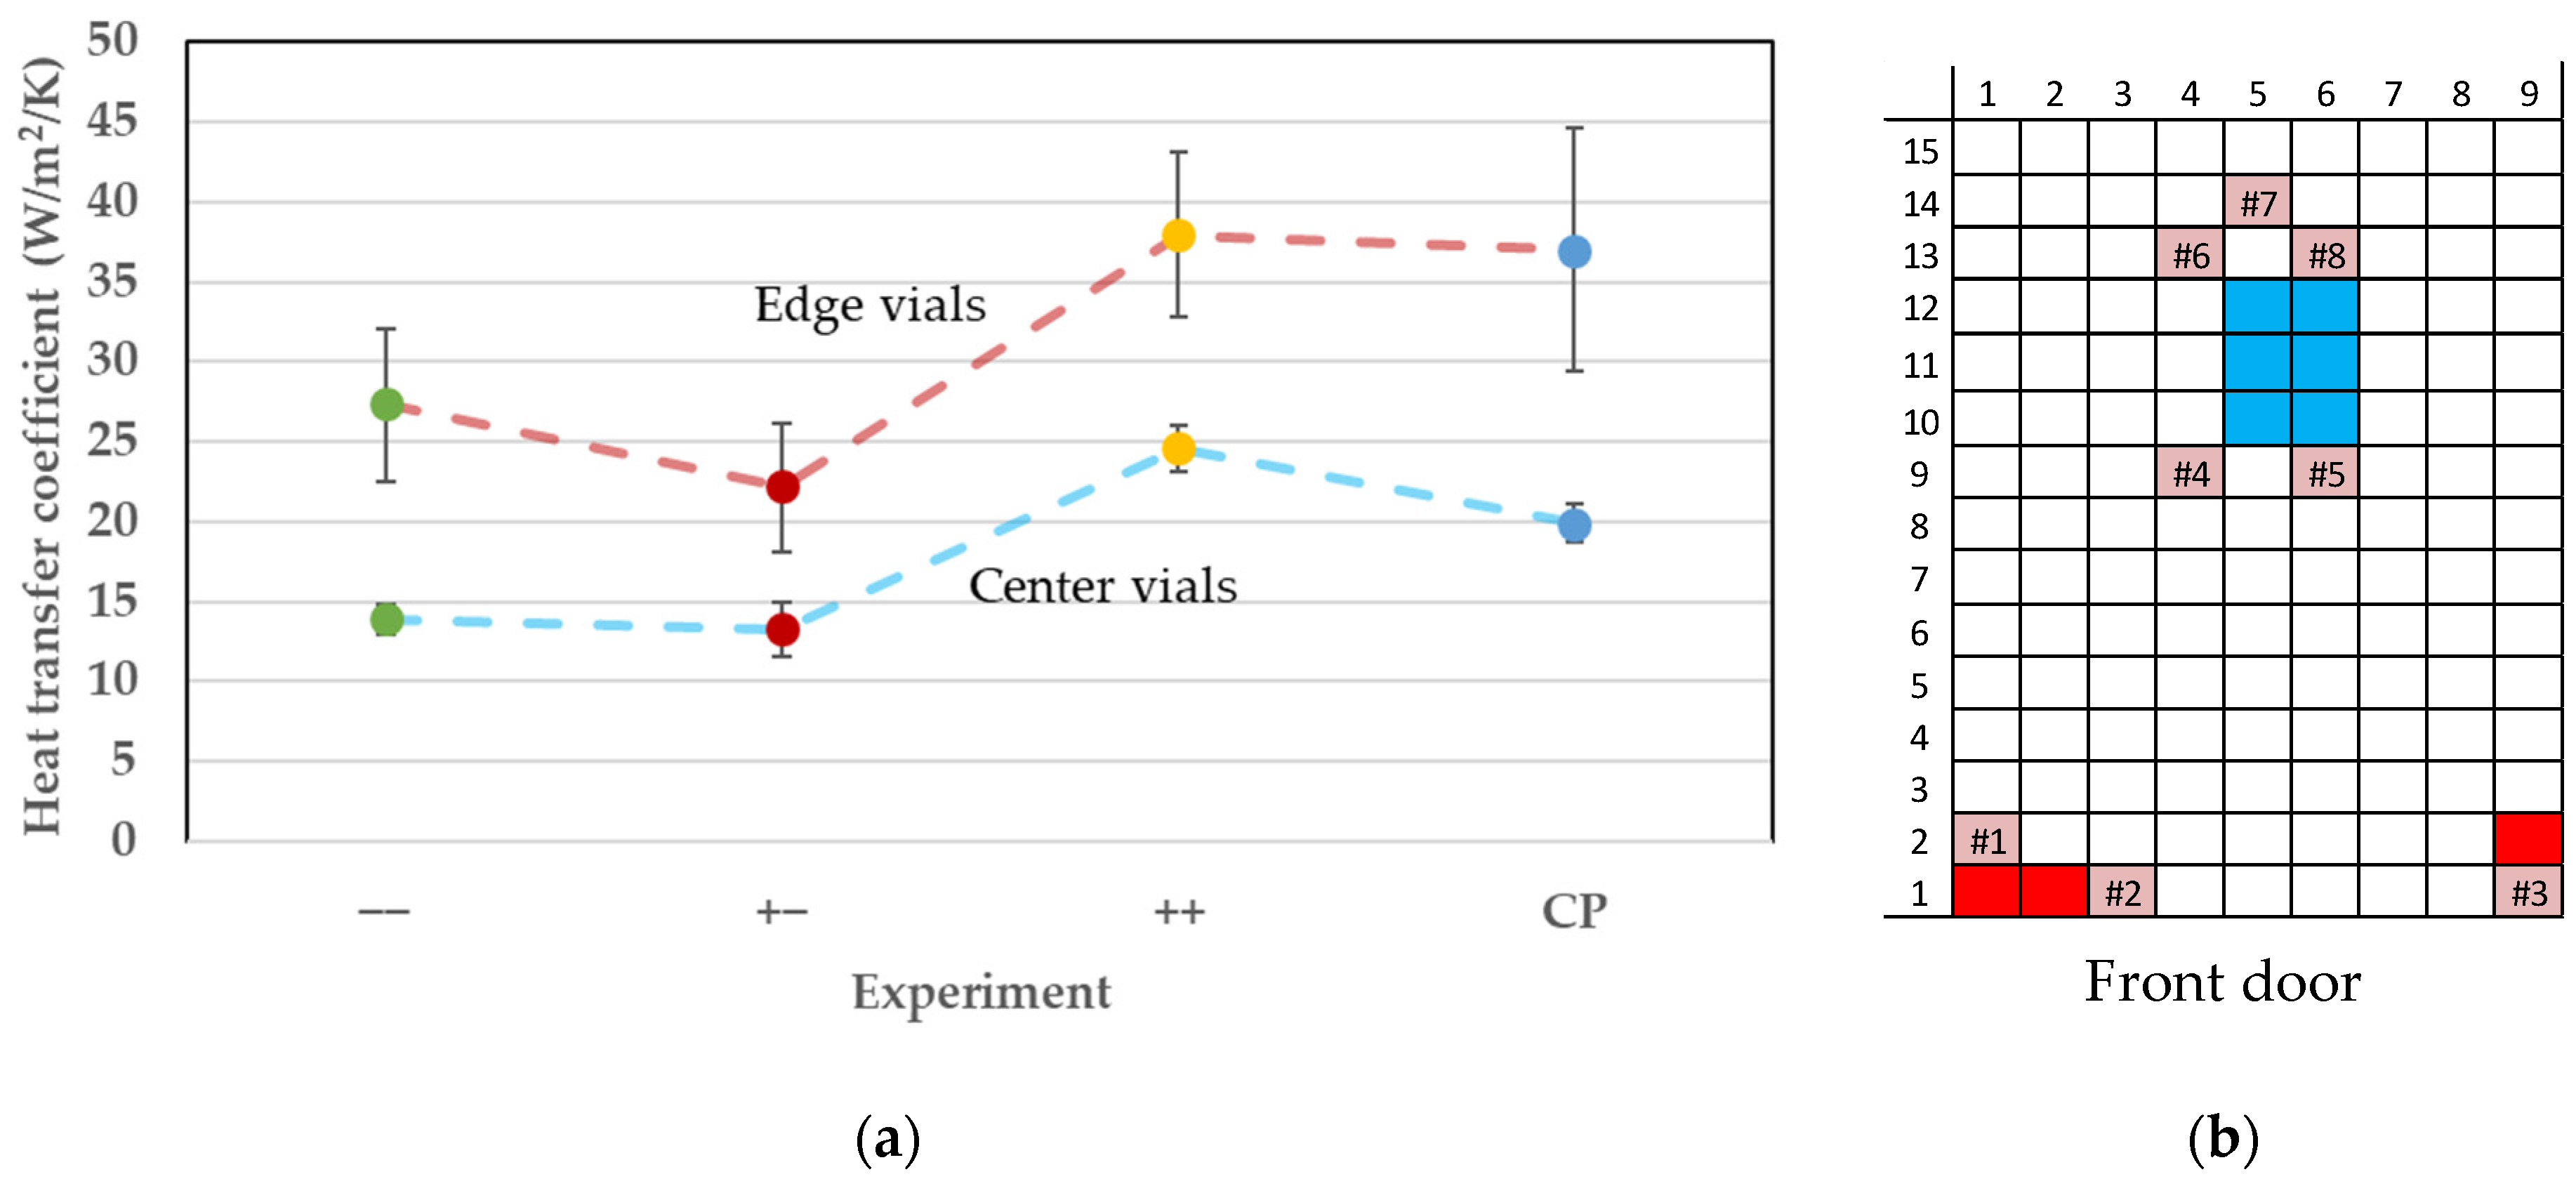
7.1. Vial Heat Transfer Coefficient

The vial heat transfer coefficient has been determined by ice sublimation tests. A selection of edge and center vials have been used to quantify the impact of the vial position on the vial heat transfer coefficient. For ease of presentation, the vials are grouped into edge and center vials. The heat transfer coefficient of each vial has been determined and the results are shown in Figure A1. Positions and category of the weighed vials and the WTMplus sensors are shown in Figure 8b. The resulting vial heat transfer coefficients are shown in Figure 8a. The error is shown as the standard deviation of the heat transfer coefficient of the vials in the group.
In all experiments, the edge vials showed a significantly higher heat transfer coefficient. They receive a higher energy input during primary drying because of an increased radiative contribution, the so-called edge effect. The center vials show a more uniform coefficient. Here, the heat input is mainly caused by conduction from the shelf. An increase in chamber pressure leads to an increased heat transfer coefficient regardless of the vial position caused by an improved gas. An increase in shelf temperature leads to a decrease in the edge effect. The edge vials still show a higher heat transfer coefficient, but the deviation is decreased. Inside the investigated shelf temperatures, no significant increase in vial heat transfer coefficient in the center vials is seen.

7.2. Dry Layer Resistance

The dry layer resistance is determined by MTM. This measurement is able to calculate the dry layer resistance of the coldest vial. The parameters of Equation (7) are determined by the minimization of the sum of square errors. The parameters are summarized in Table 3.
The dry layer resistance showed no dependence on the process parameter of the primary drying phase.

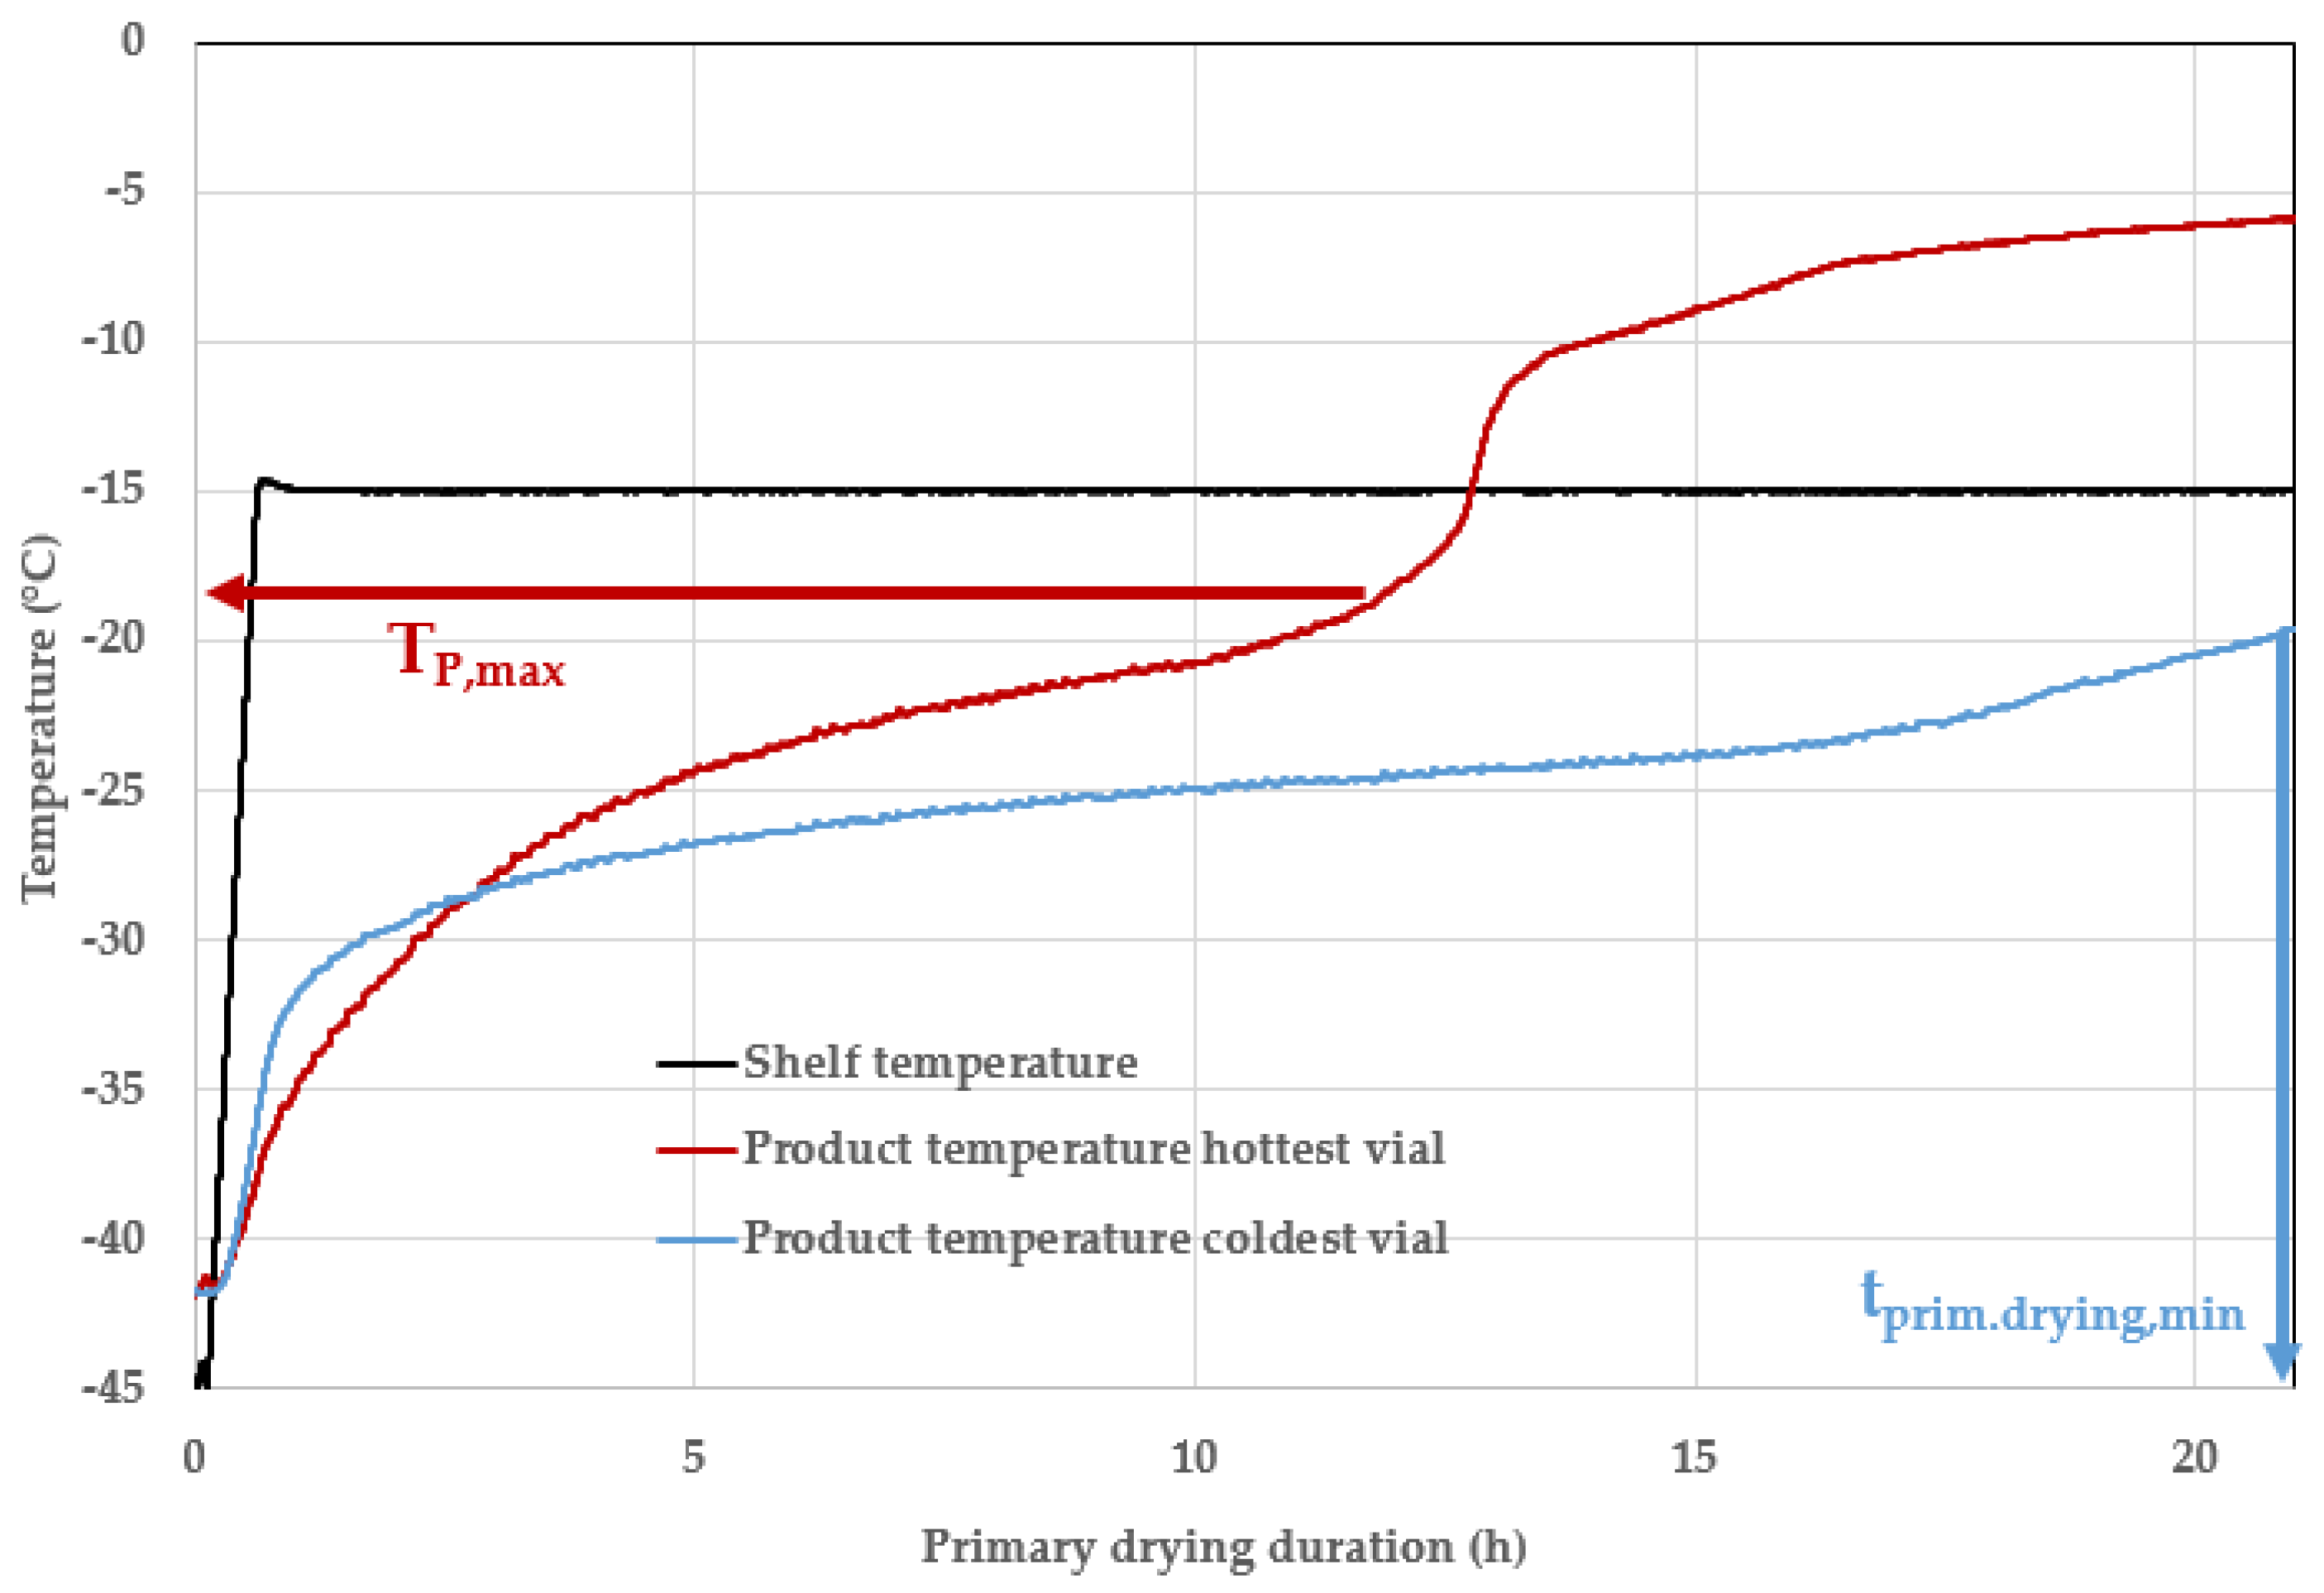
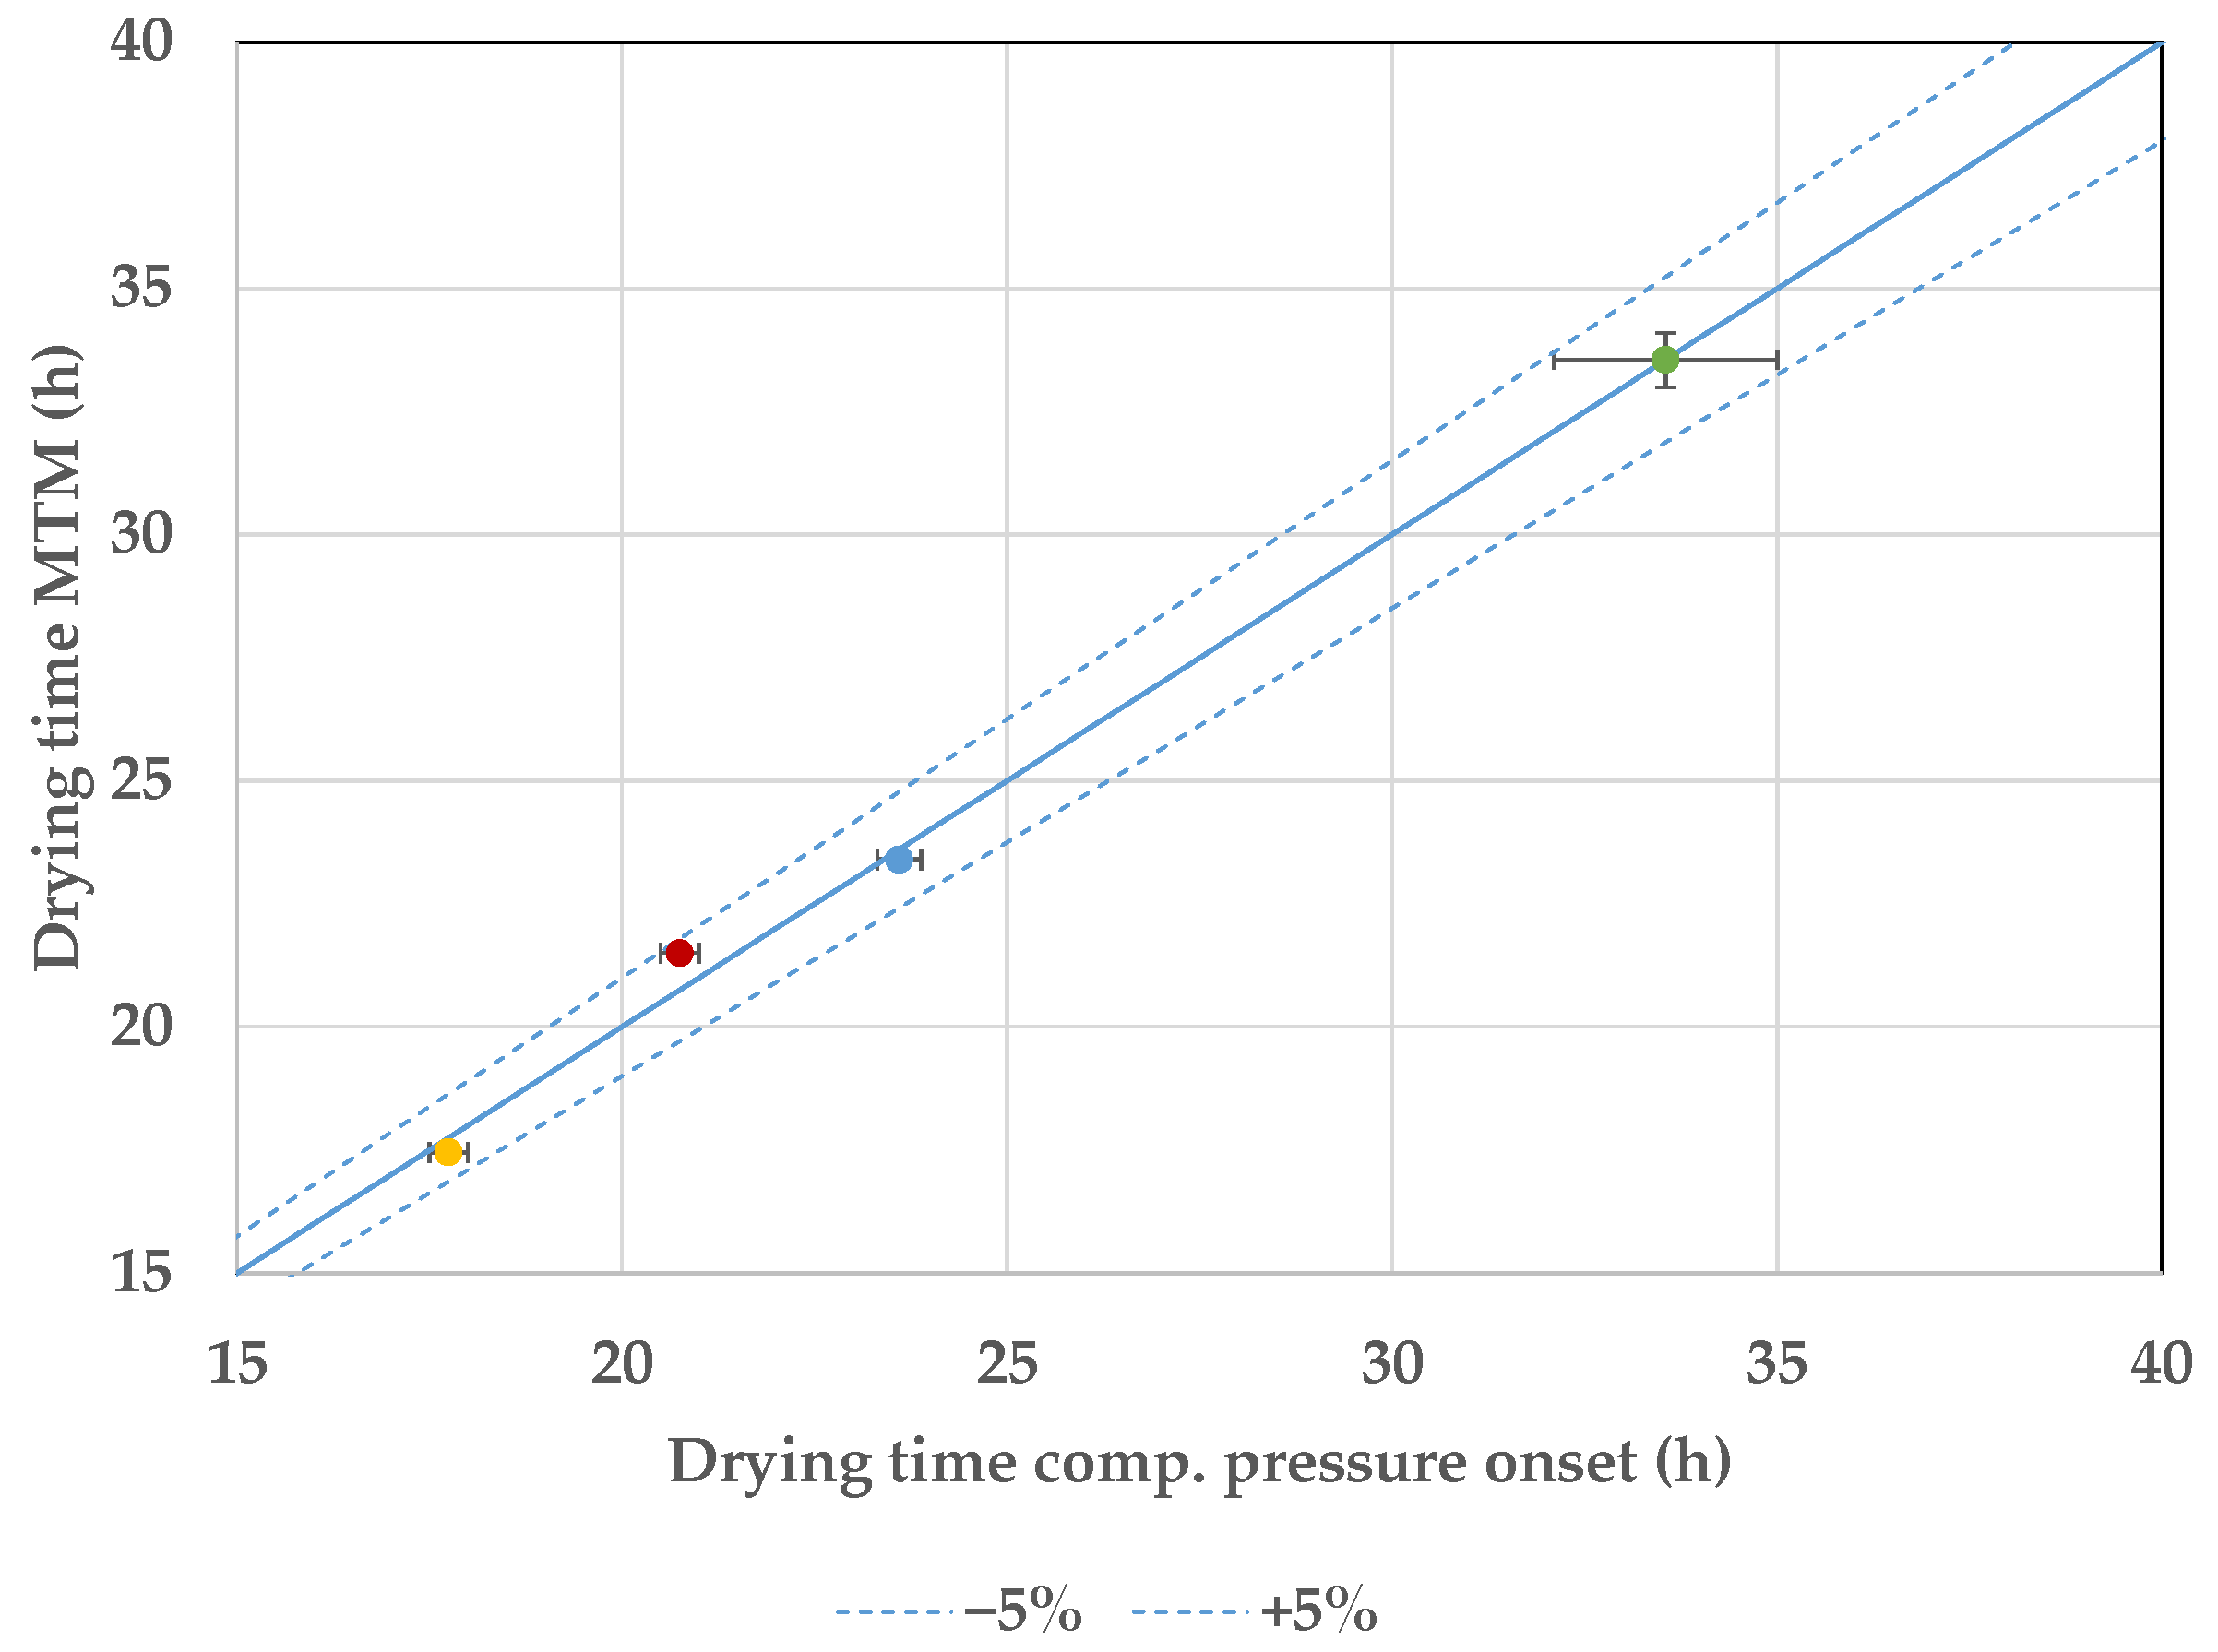
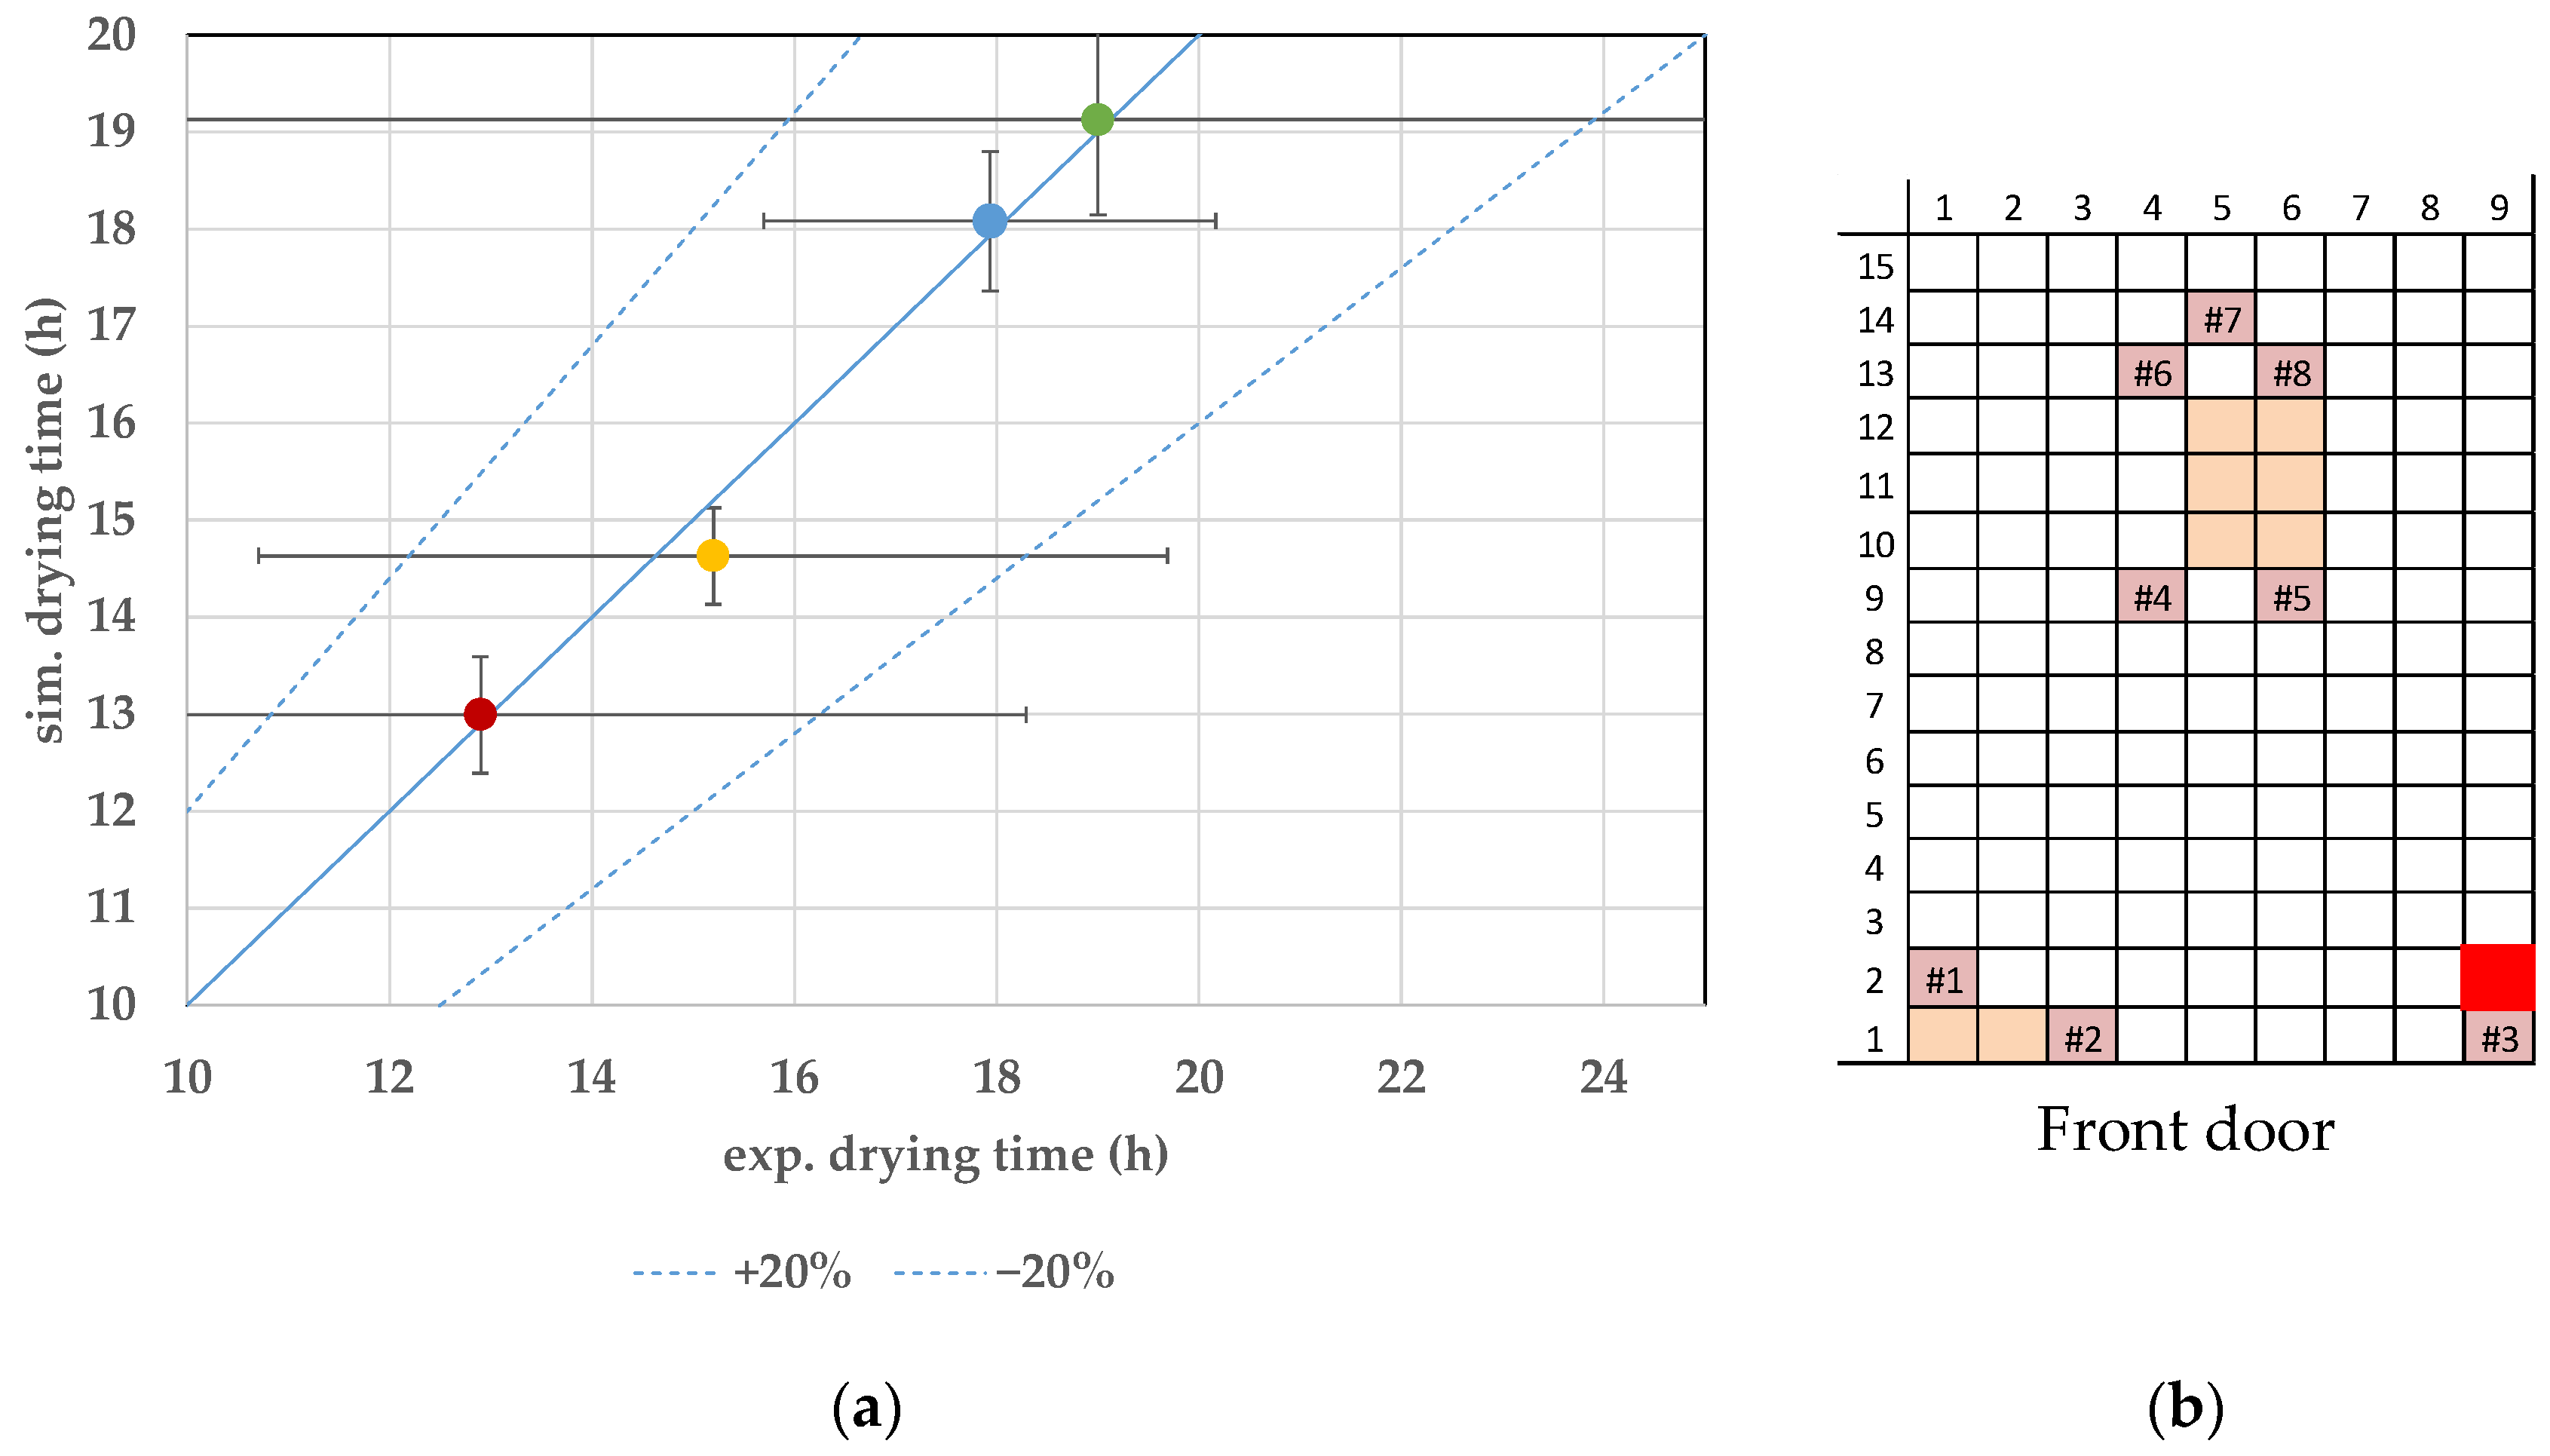
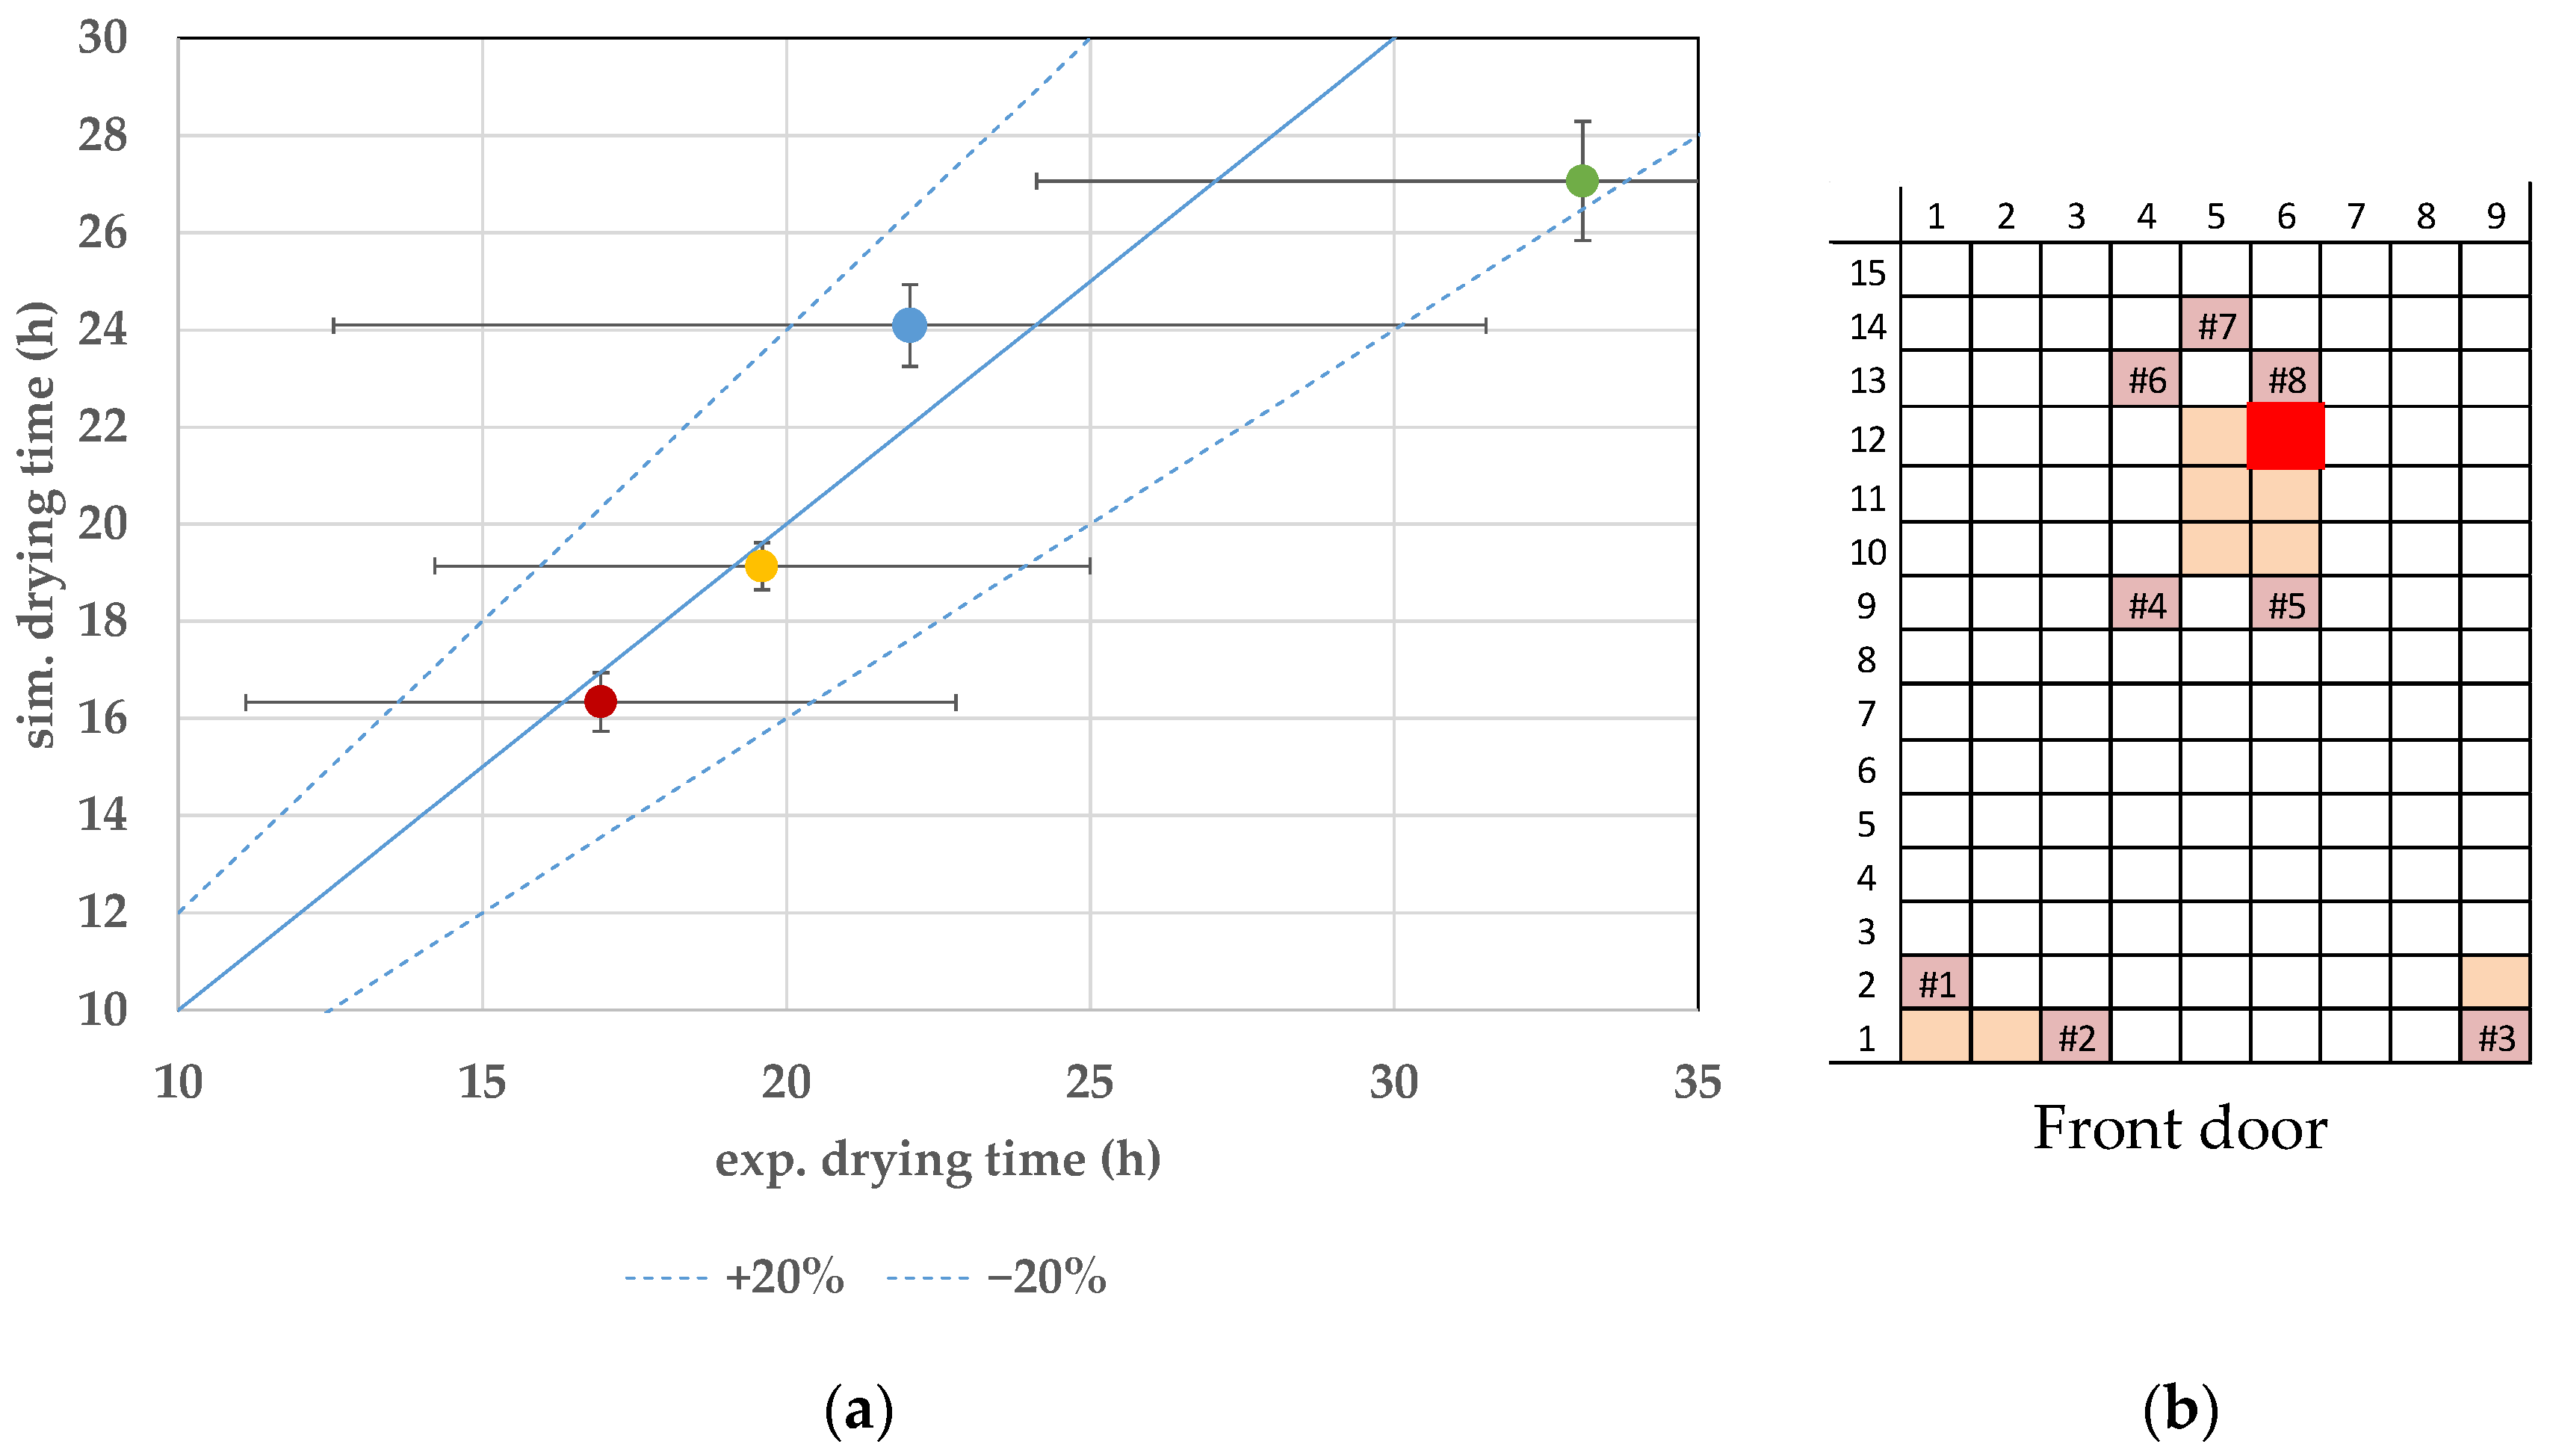
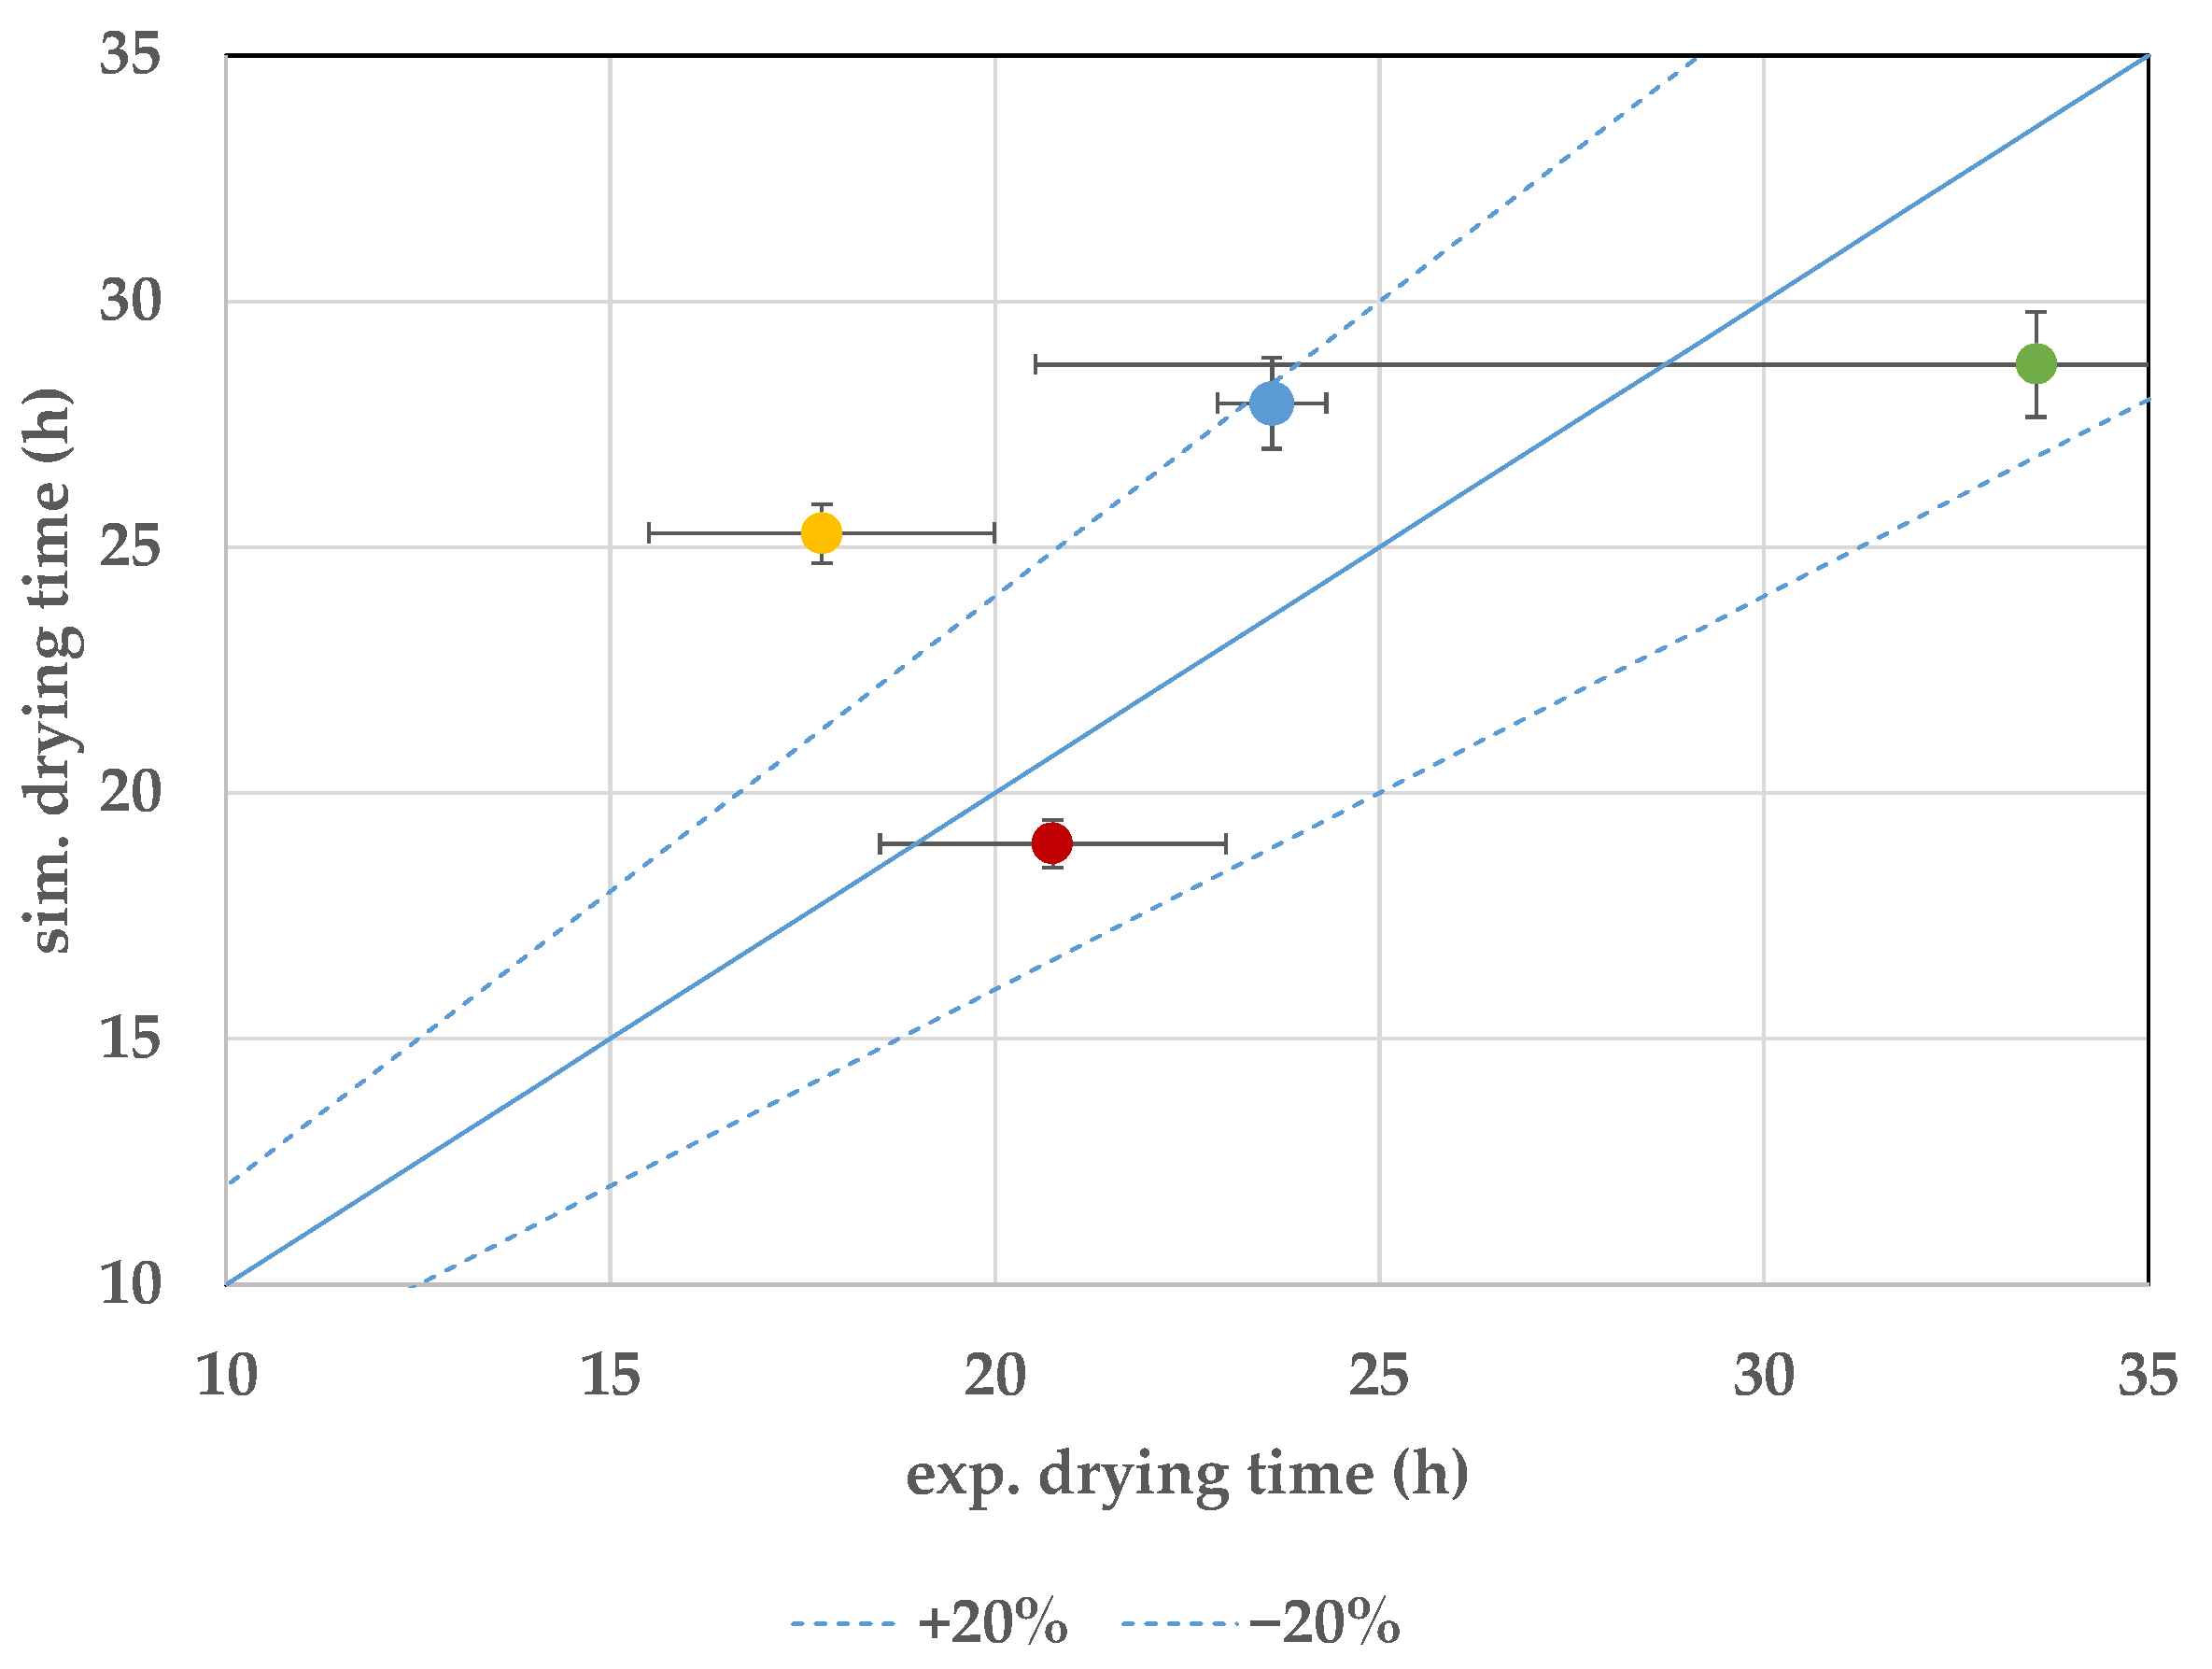
7.3. Endpoint Determination

The endpoint of primary drying is a critical process parameter. If the secondary drying started too early, the loss of elegance of the freeze-dried cake can be the result. An increase in the primary drying time above the endpoint of the slowest vial does not cause product loss, but it unnecessarily lengthens the process duration. Therefore, the detection of the primary drying endpoint is necessary to ensure product safety, while maintaining the highest productivity and efficiency of the process.
In this study, the endpoint of primary drying is detected by different PATs (summarized in Table 4). The WTMplus sensors can determine the primary drying endpoint for individual vials but the invasive nature of the sensor reduces the representativity for similar vials. MTM and comparative pressure detect the endpoint of the slowest-drying vials. The proposed modeling approach is able to close the gap between this PAT because it can predict the endpoint of primary drying for each vial given that the model parameters are distinctly determined.
In this chapter, the experimental error is calculated by reproducibility for 95% security, while the simulation error has been evaluated by 100 Monte-Carlo-Simulations, where the model parameters have been randomly varied.
First, the batch methods MTM and comparative pressure measurement are compared. Both PATs are non-invasive and able to determine the primary drying endpoint of the slowest-drying vial. The comparison for the different experiments is shown in Figure 9. The MTM criteria is shown together with the comparative pressure measurement in a parity plot. The onset of comparative pressure measurement is in good agreement with the MTM endpoint. Both measurements show the fastest primary drying in the experiment with the high shelf temperature and chamber pressure. MTM detects the endpoint at 17.45 h and comparative pressure at 17.75 h. A low shelf temperature and chamber pressure result in the slowest drying. Here, the endpoint lays at 33.55 h for both measurement techniques. The MTM endpoint for the experiment with the low shelf temperature and high chamber pressure could not be detected since the pressure increase has been too low. This setpoint has been the most inefficient with a primary drying time of 43.8 h.
Furthermore, the applied forwarding condition lays between the onset and midset of comparative pressure measurement (s. Figure A2). The implementation of the forwarding condition alone reduced the primary drying time compared to the original freeze drying recipe (experiment−−) by around 30% from 48 to 34 h. All experiments yielded elegant cakes without detectable collapse or shrinkage. That concludes that the forwarding condition establishes a safe window for primary drying.
In Figure 10, the experimental primary drying endpoint is compared with the simulated endpoint. Since Vial 2.9 is an edge vial, the simulated endpoint is compared to the experimental endpoint determined by the nearest WTMplus sensor. The simulated results show good agreement with the experiments. The experiment with the high shelf temperature and low chamber pressure led to the shortest primary drying duration of 12.9 h in the experiments and 12.99 h in the simulation, while the experiment with the low shelf temperature and chamber pressure showed the slowest primary drying with 19 h in the experiments and 19.12 h in the simulations. An increase in shelf temperature leads to a higher energy input for sublimation; therefore, the sublimation flux increases and the necessary primary drying time decreases. A further improvement of the heat transfer by a rise in chamber pressure leads to slower primary drying based on the decrease in driving force. Here, the increase in heat transfer by improved gas conduction is not able to overcome the decreased pressure difference between the sublimation front and the chamber pressure.
Figure 11 shows the simulated and experimental primary drying endpoints for vial 12.9. The closest WTMplus sensor has determined the experimental drying endpoint. Compared to vial 2.9, vial 12.6 finishes drying later. This difference is caused by the edge effect. Vial 2.9 receives a higher radiative heat transfer compared to vial 12.6 and therefore dries faster.
The simulated and experimental drying endpoints for vial 12.6 show good agreement. The fastest drying process is seen in the experiment with the high shelf temperature and low pressure. Here, the experimental endpoint lays at 16.95 h and the simulation endpoint at 16.33 h, while the experiments with the low shelf temperature and chamber pressure showed the longest durations, with 33.1 and 27.1 h, respectively.
The design space model is able to calculate the primary drying endpoint of each vial once the model parameters are determined. MTM is able to determine the dry layer resistance of the lyophilized cake. Together with known product and shelf temperature, the vial heat transfer coefficient can be determined. MTM determines the slowest-drying vial; therefore, the simulated endpoints are compared to the comparative pressure onset results (s. Figure 12). The experimental and simulated drying endpoint are in good agreement.
The highest deviation can be detected in the experiment with the high shelf temperature and chamber pressure. In this experiment, the difference between the pressure on the sublimation front and the chamber pressure is smaller and leads to a smaller pressure rise during MTM. Therefore, the deviations in the fitted values are higher and the vial heat transfer is underestimated. MTM-determined values for the vial heat transfer are more precisely determined in experiments with the high shelf temperature and low chamber pressure. Here, the sublimation rate is high, and the high driving force leads to a more significant pressure increase. This results in a more precise determination of the model parameter. The simulated drying endpoint for the setpoint with the high shelf temperature and low chamber pressure is 18.9 h, while the experimentally determined endpoint is 20.75 h.
Lastly, pareto plots are used to determine the significant process parameter. The fractional factoriell DoE allows for the consideration of interactions. The plots are shown in Figure 13. In the experiment and simulation, the shelf temperature and the interaction between shelf temperature and chamber pressure are significant. An increase in shelf temperature shortens the primary drying endpoint because it provides the necessary heat for sublimation. The heat transfer can additionally be improved by a rise in chamber pressure. The interaction between shelf temperature and chamber pressure is significant and can decrease the drying duration.
In the experiments, the chamber pressure shows no significance while in the simulation it is significant. This is due to the fact that the dry layer resistance for the experiment with the low shelf temperature and high chamber pressure could not be determined because of a low pressure increase. These experiments are considered in the experimental pareto chart. Simulation and experiments show similar significant process parameters. The increased shelf temperature provides the necessary energy for sublimation, while the chamber pressure provides the necessary driving force for sublimation.

8. Discussion and Conclusions

This paper proposes a distinct method for the endpoint determination by different PAT and a modeling approach. This is the first step towards offline process optimization and can be further developed for online process control. Mannitol has been used as an excipient because it is a widely used bulking agent to create elegant cakes. A design space model has been developed. Necessary model parameters have been determined. Ice sublimation tests have been used to determine the vial heat transfer coefficient and MTM to determine the dry layer height. The vial heat transfer depends on the chamber pressure and the edge vials show a stronger dependence on the shelf temperature. The dry layer height showed no dependence on the process conditions of the primary drying.
The endpoint of primary drying is a CPP. The primary drying step has to be optimized in order to gain the highest productivity while maintaining product safety. Different PAT can be used for endpoint determination. In this study, WTMplus sensors, comparative pressure measurement and MTM have been used. WTMplus sensors are able to determine the endpoint for individual vials while MTM and the comparative pressure measurement determine the endpoint of the whole batch. An experimental fractional factorial DoE has been used for experiments.
At first, MTM was compared to the comparative pressure measurement. The MTM endpoint is in good agreement with the comparative pressure measurement endpoint and is therefore capable of reliably determining the endpoint. MTM has been shown to be a useful tool for endpoint and model parameter determination, but it has to be kept in mind that the pressure increase during the measurement could lead to collapse. In our experiments, the optimized MTM algorithm reduces the measurement time and no significant increase in product temperature could be detected.
To validate the endpoint results of the model, simulated results have been compared to experimental WTM. The simulated endpoints are in good agreement with the experiments. The design space model is able to predict the drying endpoint for different vial positions with good precision and accuracy.
Therefore, the modeling approach is able to calculate the primary drying endpoint of the vials depending on the position. It closes the gap between the batch methods that are able to determine the slowest-drying vial and the individual temperature sensors that determine individual drying endpoints but lead to deviations because of their invasive nature. It can be used for process development to optimize the freeze drying cycle in early process development and to further on reduce the experimental workload to determine the design space.
The presented, data-driven approach for endpoint determination has been shown to be successful. A deeper understanding of the interaction of critical process parameters in primary drying was gained. This approach will be tested for amorphous substances and should further on be used for on- and offline endpoint determination and freeze-drying recipe development and optimization.

Author Contributions

A.J. performed experiments, modeling and simulation and wrote this paper. P.K. and F.H. supported with laboratory and piloting equipment as well as expert knowledge regarding operation and objectives. J.S. is responsible for conception and supervision. All authors have read and agreed to the published version of the manuscript.

Funding

This research received no external funding.

Acknowledgments

We gratefully acknowledge the support of P. Knerr and F. Harms from Martin Christ Gefriertrocknungsanlagen GmbH for kindly providing the Epsilon 2-6D LSCplus as well as ongoing advice and support. The authors acknowledge support by Open Access Publishing Fund of Clausthal University of Technology.

Conflicts of Interest

The authors declare no conflict of interest.

Symbols and Abbreviations

Latin symbols
ApInner-cross sectional aream2
AvOuter-cross sectional aream2
HsublSublimationenthalpyJ/kg
KvVial heat transfer coefficientJ/(m2·K·s)
LLengthm
NNumber of vials-
pPressurePa
QHeatJ
RpDry layer resistancem/s
TTemperatureK
tTimes
XVariable for linear pressure increasePa/s
Greek symbols
ΔDifference-
λHeat conductivityW/m/K
Indices
0Value at measurement start
cChamber
dryDry layer
frozenFrozen layer
iSublimation interface
pProduct
sShelf
Abbrevations
CPPCritical Process Parameter
CQACritical Quality Attributes
DoEDesign of Experiments
FDAUS Food and Drug Administration
FMEAFailure Mode Effect Analysis
MSMass spectrometry
MTMManometric temperature measurement
NIRNear-infrared spectroscopy
PATProcess Analytical Technology
QbDQuality by Design
TDLASTunable Diode Laser Adsorption Spectroscopy
WTMplusWireless Temperature Measurment plus

Appendix A

Figure A1. The heat transfer coefficient of each vial. (a) Position-specific values of KV; (b) Vial position and category.
Processes 09 01600 g0a1
Figure A2. Forwarding condition compared to comparative pressure measurement on- and midset.
Processes 09 01600 g0a2

References

  1. Butreddy, A.; Dudhipala, N.; Janga, K.Y.; Gaddam, R.P. Lyophilization of Small-Molecule Injectables: An Industry Perspective on Formulation Development, Process Optimization, Scale-Up Challenges, and Drug Product Quality Attributes. AAPS PharmSciTech 2020, 21, 252. [Google Scholar] [CrossRef]
  2. Depreter, F.; Pilcer, G.; Amighi, K. Inhaled proteins: Challenges and perspectives. Int. J. Pharm. 2013, 447, 251–280. [Google Scholar] [CrossRef]
  3. Langford, A.; Bhatnagar, B.; Walters, R.; Tchessalov, S.; Ohtake, S. Drying technologies for biopharmaceutical applications: Recent developments and future direction. Dry. Technol. 2018, 36, 677–684. [Google Scholar] [CrossRef]
  4. Pisano, R.; Arsiccio, A.; Capozzi, L.C.; Trout, B.L. Achieving continuous manufacturing in lyophilization: Technologies and approaches. Eur. J. Pharm. Biopharm. 2019, 142, 265–279. [Google Scholar] [CrossRef] [PubMed]
  5. Emami, F.; Vatanara, A.; Park, E.J.; Na, D.H. Drying Technologies for the Stability and Bioavailability of Biopharmaceuticals. Pharmaceutics 2018, 10, 131. [Google Scholar] [CrossRef] [PubMed] [Green Version]
  6. FDA. Lyophilization of Parenteral (7/93). FDA [Online]. 3 November 2018. Available online: https://www.fda.gov/inspections-compliance-enforcement-and-criminal-investigations/inspection-guides/lyophilization-parenteral-793 (accessed on 3 December 2020).
  7. Difranco, N. Lyophilization of Pharmaceuticals: An Overview. Lubrizol CDMO [Online]. 8 October 2019. Available online: https://lubrizolcdmo.com/blog/lyophilization-of-pharmaceuticals-an-overview/ (accessed on 3 December 2020).
  8. Mirasol, F. Lyophilization Presents Complex Challenges. BioPharm Int. 2020, 33, 22–24. [Google Scholar]
  9. Thomas, F. Changing Perceptions: An Understanding of Lyophilization Advancements. Pharm. Technol. 2019, 43, 32–34. [Google Scholar]
  10. Kasper, J.C.; Winter, G.; Friess, W. Recent advances and further challenges in lyophilization. Eur. J. Pharm. Biopharm. 2013, 85, 162–169. [Google Scholar] [CrossRef] [PubMed]
  11. Kawasaki, H.; Shimanouchi, T.; Kimura, Y. Recent Development of Optimization of Lyophilization Process. J. Chem. 2019, 2019, 9502856. [Google Scholar] [CrossRef]
  12. FDA. PAT—A Framework for Innovative Pharmaceutical Development, Manufacturing, and Quality Assurance. FDA [Online]. 11 June 2020. Available online: https://www.fda.gov/regulatory-information/search-fda-guidance-documents/pat-framework-innovative-pharmaceutical-development-manufacturing-and-quality-assurance (accessed on 15 February 2021).
  13. ICH. Pharamceutical Development Q8 (R2). Available online: https://database.ich.org/sites/default/files/Q8%28R2%29%20Guideline.pdf (accessed on 12 July 2021).
  14. Helgers, H.; Schmidt, A.; Lohmann, L.J.; Vetter, F.L.; Juckers, A.; Jensch, C.; Mouellef, M.; Zobel-Roos, S.; Strube, J. Towards Autonomous Operation by Advanced Process Control—Process Analytical Technology for Continuous Biologics Antibody Manufacturing. Processes 2021, 9, 172. [Google Scholar] [CrossRef]
  15. Klepzig, L.S.; Juckers, A.; Knerr, P.; Harms, F.; Strube, J. Digital Twin for Lyophilization by Process Modeling in Manufacturing of Biologics. Processes 2020, 8, 1325. [Google Scholar] [CrossRef]
  16. Aydin, E.S.; Yucel, O.; Sadikoglu, H. Modelling and simulation of a moving interface problem: Freeze drying of black tea extract. Heat Mass Transf. 2017, 53, 2143–2154. [Google Scholar] [CrossRef]
  17. Song, C.S.; Nam, J.H. A numerical study on freeze drying characteristics of cylindrical products with and without container. Int. J. Transp. Phenom. 2005, 7, 241–254. [Google Scholar]
  18. Fissore, D.; Pisano, R.; Barresi, A.A. Applying quality-by-design to develop a coffee freeze-drying process. J. Food Eng. 2014, 123, 179–187. [Google Scholar] [CrossRef] [Green Version]
  19. Mascarenhas, W.J.; Akay, H.U.; Pikal, M.J. A computational model for finite element analysis of the freeze-drying process. Comput. Methods Appl. Mech. Eng. 1997, 148, 105–124. [Google Scholar] [CrossRef]
  20. Pikal, M.J.; Mascarenhas, W.J.; Akay, H.U.; Cardon, S.; Bhugra, C.; Jameel, F.; Rambhatla, S. The Nonsteady State Modeling of Freeze Drying: In-Process Product Temperature and Moisture Content Mapping and Pharmaceutical Product Quality Applications. Pharm. Dev. Tech. 2005, 10, 17–32. [Google Scholar] [CrossRef] [PubMed]
  21. Ravnik, J.; Golobič, I.; Sitar, A.; Avanzo, M.; Irman, Š.; Kočevar, K.; Cegnar, M.; Zadravec, M.; Ramšak, M.; Hriberšek, M. Lyophilization model of mannitol water solution in a laboratory scale lyophilizer. J. Drug Deliv. Sci. Technol. 2018, 45, 28–38. [Google Scholar] [CrossRef]
  22. Sheehan, P.; Liapis, A.I. Modeling of the primary and secondary drying stages of the freeze drying of pharmaceutical products in vials: Numerical results obtained from the solution of a dynamic and spatially multi-dimensional lyophilization model for different operational policies. Biotechnol. Bioeng. 1998, 60, 712–728. [Google Scholar] [CrossRef]
  23. Srinivasan, G.; Muneeshwaran, M.; Raja, B. Numerical investigation of heat and mass transfer behavior of freeze drying of milk in vial. Heat Mass Transf. 2019, 55, 2073–2081. [Google Scholar] [CrossRef]
  24. Velardi, S.A.; Barresi, A.A. Development of simplified models for the freeze-drying process and investigation of the optimal operating conditions. Chem. Eng. Res. Des. 2008, 86, 9–22. [Google Scholar] [CrossRef]
  25. Vilas, C.; Alonso, A.A.; Balsa-Canto, E.; López-Quiroga, E.; Trelea, I.C. Model-Based Real Time Operation of the Freeze-Drying Process. Processes 2020, 8, 325. [Google Scholar] [CrossRef] [Green Version]
  26. Fissore, D.; Barresi, A.A. Scale-up and Process Transfer of Freeze-Drying Recipes. Dry. Technol. 2011, 29, 1673–1684. [Google Scholar] [CrossRef] [Green Version]
  27. Fissore, D.; Pisano, R. Computer-Aided Framework for the Design of Freeze-Drying Cycles: Optimization of the Operating Conditions of the Primary Drying Stage. Processes 2015, 3, 406–421. [Google Scholar] [CrossRef]
  28. Fissore, D.; Pisano, R.; Barresi, A.A. Advanced approach to build the design space for the primary drying of a pharmaceutical freeze-drying process. J. Pharm. Sci. 2011, 100, 4922–4933. [Google Scholar] [CrossRef]
  29. Koganti, V.R.; Shalaev, E.Y.; Berry, M.R.; Osterberg, T.; Youssef, M.; Hiebert, D.N.; Kanka, F.A.; Nolan, M.; Barrett, R.; Scalzo, G.; et al. Investigation of design space for freeze-drying: Use of modeling for primary drying segment of a freeze-drying cycle. AAPS PharmSciTech 2011, 12, 854–861. [Google Scholar] [CrossRef] [PubMed] [Green Version]
  30. Leys, L.; Vanbillemont, B.; van Bockstal, P.J.; Lammens, J.; Nuytten, G.; Corver, J.; Vervaet, C.; de Beer, T. A primary drying model-based comparison of conventional batch freeze-drying to continuous spin-freeze-drying for unit doses. Eur. J. Pharm. Biopharm. 2020, 157, 97–107. [Google Scholar] [CrossRef] [PubMed]
  31. Shivkumar, G.; Kazarin, P.S.; Strongrich, A.D.; Alexeenko, A.A. LyoPRONTO: An Open-Source Lyophilization Process Optimization Tool. AAPS PharmSciTech 2019, 20, 328. [Google Scholar] [CrossRef] [PubMed] [Green Version]
  32. Vanbillemont, B.; Nicolaï, N.; Leys, L.; de Beer, T. Model-Based Optimisation and Control Strategy for the Primary Drying Phase of a Lyophilisation Process. Pharmaceutics 2020, 12, 181. [Google Scholar] [CrossRef] [PubMed] [Green Version]
  33. Zhou, D.; Shang, S.; Tharp, T.; Jameel, F.; Sinha, K.; Nere, N.K. Leveraging Lyophilization Modeling for Reliable Development, Scale-up and Technology Transfer. AAPS PharmSciTech 2019, 20, 263. [Google Scholar] [CrossRef] [PubMed]
  34. Zhu, T.; Moussa, E.M.; Witting, M.; Zhou, D.; Sinha, K.; Hirth, M.; Gastens, M.; Shang, S.; Nere, N.; Somashekar, S.C.; et al. Predictive models of lyophilization process for development, scale-up/tech transfer and manufacturing. Eur. J. Pharm. Biopharm. 2018, 128, 363–378. [Google Scholar] [CrossRef] [PubMed]
  35. Arsiccio, A.; Pisano, R. Application of the Quality by Design Approach to the Freezing Step of Freeze-Drying: Building the Design Space. J. Pharm. Sci. 2018, 107, 1586–1596. [Google Scholar] [CrossRef]
  36. Jameel, F.; Hershenson, S.; Khan, M.A.; Martin-Moe, S. (Eds.) Quality by Design for Biopharmaceutical Drug Product Development; Springer: New York, NY, USA, 2015; ISBN 978-1-4939-2315-1. [Google Scholar]
  37. Mockus, L.N.; Paul, T.W.; Pease, N.A.; Harper, N.J.; Basu, P.K.; Oslos, E.A.; Sacha, G.A.; Kuu, W.Y.; Hardwick, L.M.; Karty, J.J.; et al. Quality by design in formulation and process development for a freeze-dried, small molecule parenteral product: A case study. Pharm. Dev. Technol. 2011, 16, 549–576. [Google Scholar] [CrossRef]
  38. Pisano, R.; Fissore, D.; Barresi, A.A.; Brayard, P.; Chouvenc, P.; Woinet, B. Quality by design: Optimization of a freeze-drying cycle via design space in case of heterogeneous drying behavior and influence of the freezing protocol. Pharm. Dev. Technol. 2013, 18, 280–295. [Google Scholar] [CrossRef] [PubMed]
  39. Sixt, M.; Uhlenbrock, L.; Strube, J. Toward a Distinct and Quantitative Validation Method for Predictive Process Modelling—On the Example of Solid-Liquid Extraction Processes of Complex Plant Extracts. Processes 2018, 6, 66. [Google Scholar] [CrossRef] [Green Version]
  40. Wagner, W.; Riethmann, T.; Feistel, R.; Harvey, A.H. New Equations for the Sublimation Pressure and Melting Pressure of H2O Ice Ih. J. Phys. Chem. Ref. Data 2011, 40, 43103. [Google Scholar] [CrossRef] [Green Version]
  41. Giordano, A.; Barresi, A.A.; Fissore, D. On the use of mathematical models to build the design space for the primary drying phase of a pharmaceutical lyophilization process. J. Pharm. Sci. 2011, 100, 311–324. [Google Scholar] [CrossRef] [PubMed]
  42. Wegiel, L.A.; Ferris, S.J.; Nail, S.L. Experimental Aspects of Measuring the Vial Heat Transfer Coefficient in Pharmaceutical Freeze-Drying. AAPS PharmSciTech 2018, 19, 1810–1817. [Google Scholar] [CrossRef]
  43. Gieseler, H.; Kessler, W.J.; Finson, M.; Davis, S.J.; Mulhall, P.A.; Bons, V.; Debo, D.J.; Pikal, M.J. Evaluation of tunable diode laser absorption spectroscopy for in-process water vapor mass flux measurements during freeze drying. J. Pharm. Sci. 2007, 96, 1776–1793. [Google Scholar] [CrossRef] [PubMed]
  44. Kuu, W.Y.; Nail, S.L. Rapid freeze-drying cycle optimization using computer programs developed based on heat and mass transfer models and facilitated by tunable diode laser absorption spectroscopy (TDLAS). J. Pharm. Sci. 2009, 98, 3469–3482. [Google Scholar] [CrossRef]
  45. Milton, N.; Pikal, M.J.; Roy, M.L.; Nail, S.L. Evaluation of manometric temperature measurement as a method of monitoring product temperature during lyophilization. PDA J. Pharm. Sci. Technol. 1997, 51, 7–16. [Google Scholar]
  46. Tang, X.C.; Nail, S.L.; Pikal, M.J. Evaluation of manometric temperature measurement (MTM), a process analytical technology tool in freeze drying, part III: Heat and mass transfer measurement. AAPS PharmSciTech 2006, 7, 97. [Google Scholar] [CrossRef] [Green Version]
  47. Liapis, A.I.; Sadikoglu, H. Dynamic pressure rise in the drying chamber as a remote sensing method for monitoring the temperature of the product during the primary drying stage of freeze drying. Dry. Technol. 1998, 16, 1153–1171. [Google Scholar] [CrossRef]
  48. Kuu, W.Y.; O’Bryan, K.R.; Hardwick, L.M.; Paul, T.W. Product mass transfer resistance directly determined during freeze-drying cycle runs using tunable diode laser absorption spectroscopy (TDLAS) and pore diffusion model. Pharm. Dev. Technol. 2011, 16, 343–357. [Google Scholar] [CrossRef]
  49. Tang, X.C.; Nail, S.L.; Pikal, M.J. Evaluation of manometric temperature measurement, a process analytical technology tool for freeze-drying: Part II measurement of dry-layer resistance. AAPS PharmSciTech 2006, 7, 93. [Google Scholar] [CrossRef] [PubMed] [Green Version]
  50. Rambhatla, S.; Ramot, R.; Bhugra, C.; Pikal, M.J. Heat and mass transfer scale-up issues during freeze drying: II. Control and characterization of the degree of supercooling. AAPS PharmSciTech 2004, 5, e58. [Google Scholar] [CrossRef] [PubMed] [Green Version]
  51. Kuu, W.Y.; Hardwick, L.M.; Akers, M.J. Rapid determination of dry layer mass transfer resistance for various pharmaceutical formulations during primary drying using product temperature profiles. Int. J. Pharm. 2006, 313, 99–113. [Google Scholar] [CrossRef] [PubMed]
  52. Rajniak, P.; Moreira, J.; Tsinontides, S.; Pham, D.; Bermingham, S. Integrated use of mechanistic models and targeted experiments for development, scale-up and optimization of lyophilization cycles: A single vial approach for primary drying. Dry. Technol. 2020, 1–16. [Google Scholar] [CrossRef]
  53. Barresi, A.A.; Pisano, R.; Fissore, D.; Rasetto, V.; Velardi, S.A.; Vallan, A.; Parvis, M.; Galan, M. Monitoring of the primary drying of a lyophilization process in vials. Chem. Eng. Process. Process Intensif. 2009, 48, 408–423. [Google Scholar] [CrossRef] [Green Version]
  54. Patel, S.M.; Pikal, M.J. Lyophilization process design space. J. Pharm. Sci. 2013, 102, 3883–3887. [Google Scholar] [CrossRef] [PubMed]
  55. Schneid, S. Investigation of Novel Process Analytical Technology (PAT) Tools for Use in Freeze-Drying Processes. Ph.D. Thesis, Friedrich-Alexander-Universität Erlangen-Nürnberg (FAU), Erlangen, Germany, 2010. [Google Scholar]
  56. Patel, S.M.; Pikal, M. Process analytical technologies (PAT) in freeze-drying of parenteral products. Pharm. Dev. Technol. 2009, 14, 567–587. [Google Scholar] [CrossRef]
  57. Kauppinnen, A. Raman and Near-Infrared Spectroscopic Methods for In-Line Monitoring of Freeze-Drying Process. Ph.D. Thesis, University of Eastern Finland, Kuopio, Finland, 2015. [Google Scholar]
  58. De Beer, T.; Burggraeve, A.; Fonteyne, M.; Saerens, L.; Remon, J.P.; Vervaet, C. Near infrared and Raman spectroscopy for the in-process monitoring of pharmaceutical production processes. Int. J. Pharm. 2011, 417, 32–47. [Google Scholar] [CrossRef] [PubMed] [Green Version]
  59. Brülls, M.; Folestad, S.; Sparén, A.; Rasmuson, A. In-situ near-infrared spectroscopy monitoring of the lyophilization process. Pharm. Res. 2003, 20, 494–499. [Google Scholar] [CrossRef] [PubMed]
  60. Mensink, M.A.; van Bockstal, P.-J.; Pieters, S.; de Meyer, L.; Frijlink, H.W.; van der Voort Maarschalk, K.; Hinrichs, W.L.J.; de Beer, T. In-line near infrared spectroscopy during freeze-drying as a tool to measure efficiency of hydrogen bond formation between protein and sugar, predictive of protein storage stability. Int. J. Pharm. 2015, 496, 792–800. [Google Scholar] [CrossRef] [Green Version]
  61. Kauppinen, A.; Toiviainen, M.; Korhonen, O.; Aaltonen, J.; Järvinen, K.; Paaso, J.; Juuti, M.; Ketolainen, J. In-line multipoint near-infrared spectroscopy for moisture content quantification during freeze-drying. Anal. Chem. 2013, 85, 2377–2384. [Google Scholar] [CrossRef] [PubMed]
  62. De Beer, T.R.M.; Allesø, M.; Goethals, F.; Coppens, A.; Heyden, Y.V.; de Diego, H.L.; Rantanen, J.; Verpoort, F.; Vervaet, C.; Remon, J.P.; et al. Implementation of a process analytical technology system in a freeze-drying process using Raman spectroscopy for in-line process monitoring. Anal. Chem. 2007, 79, 7992–8003. [Google Scholar] [CrossRef]
  63. De Beer, T.R.M.; Vercruysse, P.; Burggraeve, A.; Quinten, T.; Ouyang, J.; Zhang, X.; Vervaet, C.; Remon, J.P.; Baeyens, W.R.G. In-line and real-time process monitoring of a freeze drying process using Raman and NIR spectroscopy as complementary process analytical technology (PAT) tools. J. Pharm. Sci. 2009, 98, 3430–3446. [Google Scholar] [CrossRef]
  64. Tang, X.C.; Nail, S.L.; Pikal, M.J. Freeze-drying process design by manometric temperature measurement: Design of a smart freeze-dryer. Pharm Res 2005, 22, 685–700. [Google Scholar] [CrossRef]
  65. Fissore, D.; Pisano, R.; Barresi, A.A. On the Methods Based on the Pressure Rise Test for Monitoring a Freeze-Drying Process. Dry. Technol. 2010, 29, 73–90. [Google Scholar] [CrossRef] [Green Version]
  66. Kim, A.I.; Akers, M.J.; Nail, S.L. The physical state of mannitol after freeze-drying: Effects of mannitol concentration, freezing rate, and a noncrystallizing cosolute. J. Pharm. Sci. 1998, 87, 931–935. [Google Scholar] [CrossRef]
  67. Patel, S.M.; Jameel, F.; Pikal, M.J. The effect of dryer load on freeze drying process design. J. Pharm. Sci. 2010, 99, 4363–4379. [Google Scholar] [CrossRef]
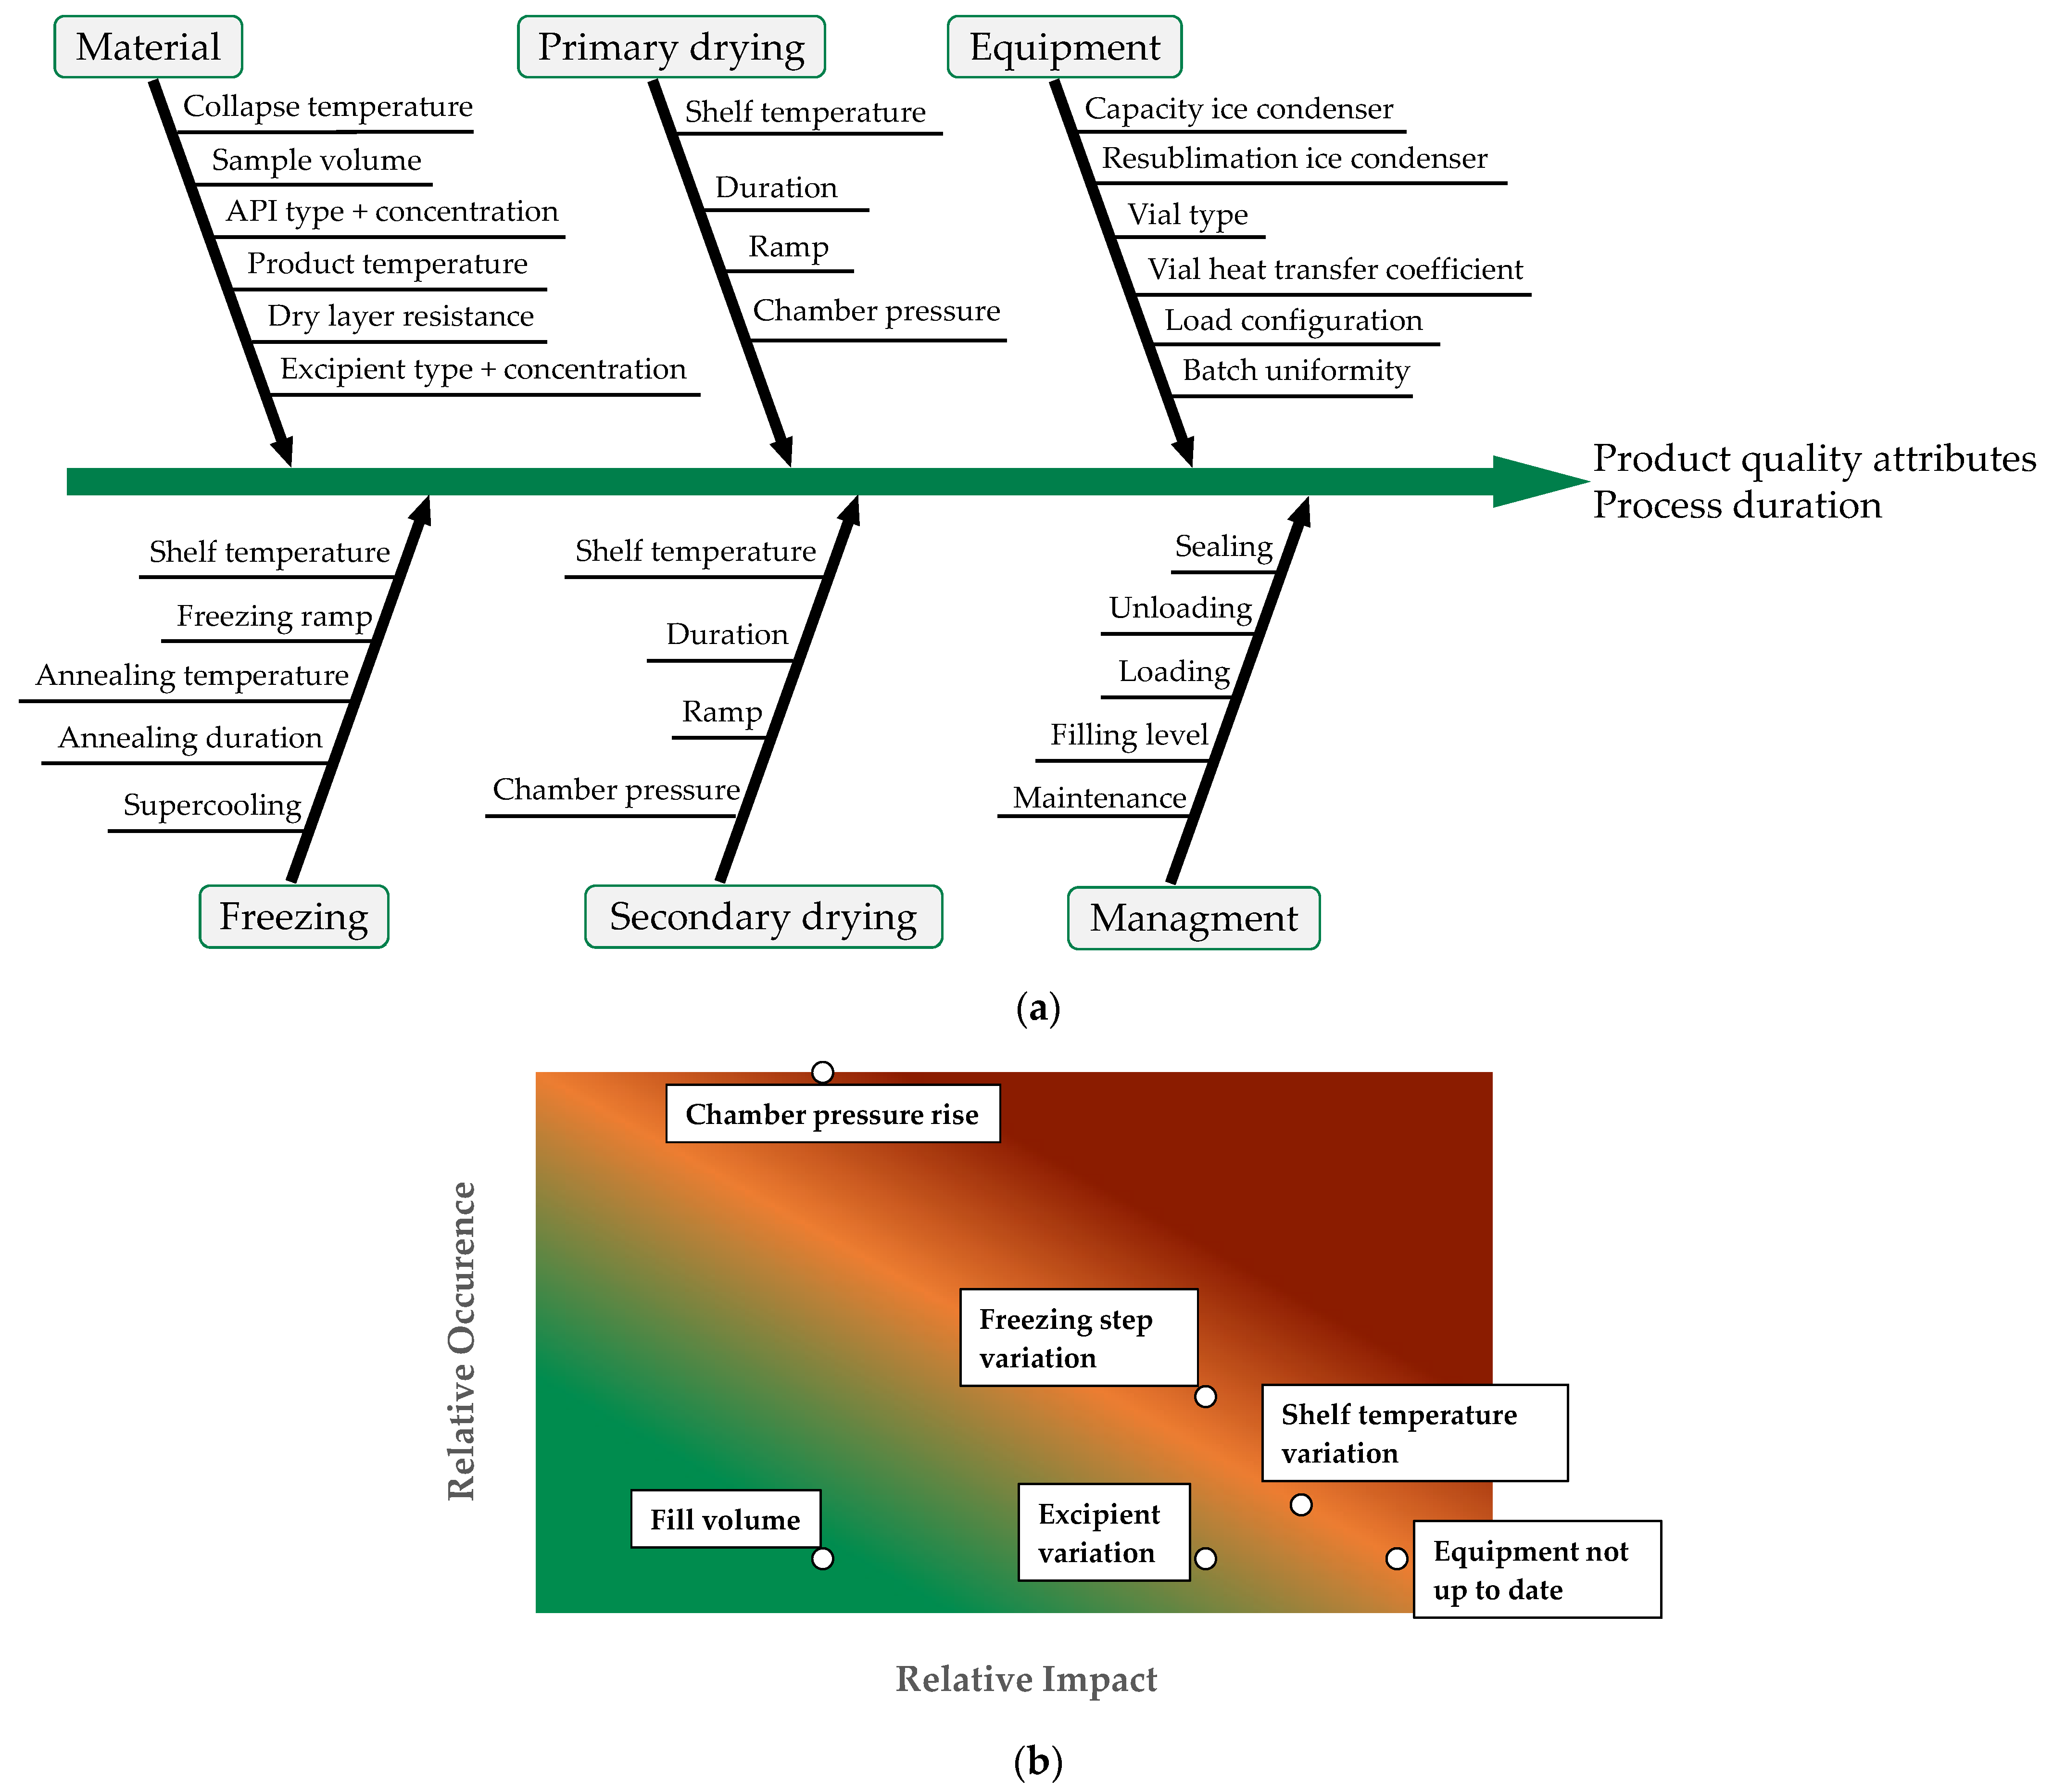
Figure 1. QbD process development strategy [14].
Processes 09 01600 g001
Figure 2. Risk assessment: (a) Ishikawa diagram; (b) Occurrence Impact diagram.
Processes 09 01600 g002
Figure 3. Physico-chemical process model in process development adopted from [39].
Processes 09 01600 g003
Figure 4. Exemplified Design Space (solid line: product temperature isotherms, dashed line: shelf temperature isotherms, dashed dot line: equipment constraint).
Processes 09 01600 g004
Figure 5. Product temperature variance inside a pilot freeze dryer.
Processes 09 01600 g005
Figure 6. (a) Freeze-dryer Epsilon 2-6D. (b) WTMplus sensor [15].
Processes 09 01600 g006
Figure 7. Model parameter determination concept.
Processes 09 01600 g007
Figure 8. (a) Vial heat transfer coefficients for edge and center vials for various process conditions. (b) Vial position and category (red: edge vials, blue: center vials).
Processes 09 01600 g008
Figure 9. Comparison of primary drying endpoint of MTM and comparative pressure measurement onset (red: +−, yellow: ++, blue: CP, green: −−).
Processes 09 01600 g009
Figure 10. (a) Parity plot between the simulated and experimental primary drying endpoints for vial 2.9 (red: +−, yellow: ++, blue: CP, green: −−). (b) Vial position.
Processes 09 01600 g010
Figure 11. (a) Parity plot between the simulated and experimental primary drying endpoints for vial 12.6 (red: +−, yellow: ++, blue: CP, green: −−). (b) Vial position.
Processes 09 01600 g011
Figure 12. Parity plot between the simulated and experimental primary drying endpoints for the slowest-drying vial (red: +−, yellow: ++, blue: CP, green: −−).
Processes 09 01600 g012
Figure 13. Pareto chart of standardized effects for primary drying endpoint (blue bars: absolute value of t-ratio, black dashed line: significance boundary). (a) Experiment. (b) Simulation.
Processes 09 01600 g013
Table 1. QbD risk assessment: FMEA.
RiskImpactOccurrenceComment
Shelf temperature variation82Shelf temperature affects drying rate in both phases, too high value could cause collapse but a low value leads to long drying times, once freeze drying recipe is set, temperature easy to control
Chamber pressure rise310High pressure could lead to melt back, during MTM pressure is increased in an interval that is safe for the product
Freezing step variation74Freezing step sets the foundation for drying phases, once freezing recipe is set the temperature can be controlled easily but stochastic nature of nucleation still leads to small deviations in ice crystal size
Equipment not up to date91Uncalibrated measurement units lead deviation from recipe, prevention through maintenance intervals
Excipient variation71Formulation has high impact because it sets the failure mode, once formulation is set, composition can be good controlled
Fill level31Increased height can lead to collapse if the process is rigorously optimized, but fill level can be controlled easily
Table 2. Experimental design of experiments.
# Primary Drying
Shelf Temperature (°C)Chamber Pressure (mbar)
1+−−150.133
2++−150.57
3−−−250.133
4+−−150.133
5++−150.57
6−−−250.133
7−+−250.57
8−+−250.57
9CP−200.352
10CP−200.352
11CP−200.352
Table 3. Parameters of dry layer resistance.
ParameterValue
R1 (m/s)50,555.24 ± 5895.69
R2 (1/s)2.06 × 107 ± 1.14 × 10⁷
R3 (1/m)147.41 ± 214.03
Table 4. Endpoint determination for different PATs.
PATEndpoint Determination
MTMPartial pressure of ice equals chamber pressure [56,64]
Comparative pressureOnset of capacitance manometer [33,67]
WTMplusSharp increase in product temperature [56]
ModelComplete sublimation of water
Publisher’s Note: MDPI stays neutral with regard to jurisdictional claims in published maps and institutional affiliations.

