Article

Fast and Flexible mRNA Vaccine Manufacturing as a Solution to Pandemic Situations by Adopting Chemical Engineering Good Practice—Continuous Autonomous Operation in Stainless Steel Equipment Concepts

Institute for Separation and Process Technology, Clausthal University of Technology, 38678 Clausthal-Zellerfeld, Germany
*
Author to whom correspondence should be addressed.
Processes 2021, 9(11), 1874; https://doi.org/10.3390/pr9111874
Submission received: 24 September 2021 / Revised: 8 October 2021 / Accepted: 17 October 2021 / Published: 21 October 2021
(This article belongs to the Special Issue Towards Autonomous Operation of Biologics and Botanicals)

Abstract

:
SARS-COVID-19 vaccine supply for the total worldwide population has a bottleneck in manufacturing capacity. Assessment of existing messenger ribonucleic acid (mRNA) vaccine processing shows a need for digital twins enabled by process analytical technology approaches in order to improve process transfer for manufacturing capacity multiplication, a reduction in out-of-specification batch failures, qualified personal training for faster validation and efficient operation, optimal utilization of scarce buffers and chemicals and speed-up of product release by continuous manufacturing. In this work, three manufacturing concepts for mRNA-based vaccines are evaluated: Batch, full-continuous and semi-continuous. Technical transfer from batch single-use to semi-continuous stainless-steel, i.e., plasmid deoxyribonucleic acid (pDNA) in batch and mRNA in continuous operation mode, is recommended, in order to gain: faster plant commissioning and start-up times of about 8–12 months and a rise in dose number by a factor of about 30 per year, with almost identical efforts in capital expenditures (CAPEX) and personnel resources, which are the dominant bottlenecks at the moment, at about 25% lower operating expenses (OPEX). Consumables are also reduceable by a factor of 6 as outcome of this study. Further optimization potential is seen at consequent digital twin and PAT (Process Analytical Technology) concept integration as key-enabling technologies towards autonomous operation including real-time release-testing.

1. Introduction

With the onset of the COVID-19 pandemic in December 2019, the need for rapid and scalable delivery of vaccines have become urgent. Instead of the typical time-to-market of 5–10 years, vaccines are now being accelerated to approval in less than nine months [1,2,3]. This shifts the bottleneck in sufficient supply back to production processes, which therefore also need to be developed and built in less than nine months, starting with laboratory studies, and ending with technically ready production equipment. As the example of mRNA has shown, early investment in promising technologies has been a key element in the rapid fight against the pandemic [4,5,6].
Nevertheless, time-to-market and capacity have shown that the current state of the art and methods of process development and production have not been fast enough to make vaccines available to the entire population in a timely fashion [7,8].
In addition to the bottlenecks in material supply and the technical limitations of current manufacturing technology [9,10,11], the shortage of skilled personnel has become apparent [12].
The heavy reliance on single use technology has meant that within a short period of time, enhanced demand has led to shortages, creating unnecessary further delays in product manufacturing. Various manufacturers have therefore already publicly discussed the advantages and disadvantages of single use (SU) technology compared to stainless steel (SS) equipment against this background [13,14].
Further developments in the automation of Cleaning in Place/Sterilization in Place (CIP/SIP) procedures have, on the one hand, reduced the consumption of water for injection (WFI) caused by SS cleaning procedures and, on the other hand, reduced the personnel and time required [15,16].
Further challenges are logistics and the provision of critical raw materials [17].
If the concepts that have been demanded for decades, such as Quality by Design (QbD)-based process development and Good Manufacturing Practice (GMP)-compliant continuous manufacturing, had already been state of the art when the pandemic began, it would have been possible to scale up and make vaccine production available more quickly. Accordingly, the implementation of real-time release testing must continue to be pursued, especially to overcome the lengthy Quality assurance/Quality control (QA/QC) in the production of mRNA vaccines [18,19].
QbD-based process development typically starts with the definition of quality attributes and Quality Target Product Profiles (QTPPs) [20]. To ensure these, a design space is needed. This is usually defined by the process parameters determined in a risk assessment. The criticality of these parameters is traditionally determined in experiments, e.g., statistical experimental designs or through validated process models. The design space is the basis for developing a control strategy that aims to ensure that the quality attributes defined at the outset are maintained at all times [21].
A lot of work has shown that the digital twin and Process Analytical Technology (PAT) are the key technologies needed to make the control strategy feasible (Figure 1). Recently, Helgers [22] and Udugama et al. [23] have described the steps towards the digital twin as follows. Starting from simple balance equations to validated process models, the digital twin is ultimately a digital representation of the physical process. With the real-time transmission of measurement data enabled by PAT and model-based advanced process control, the optimization of the physical process is possible in real time.
The objective of the present study is to evaluate the gains in speed, capacity, CAPEX/OPEX/TOTEX, personnel and consumables efforts as well as cost of a switch from the current batch-wise production to a continuous production and an associated switch from SU to SS equipment.

2. Materials and Methods

2.1. Model Overview

The models and methods used in this work have already been published for all separation and reaction steps by Schmidt et al. [24]. A more detailed description of the in vitro transcription including capping (IVT + C) can be found in the recently published work on model development and validation by Helgers et al. [22]. Due to the sophisticated chromatography schedule investigated here, the associated methods are described in more detail hereinafter.

2.1.1. Adsorptive Purification Processes

For purification, monolithic adsorption as described before, as well as chromatography, was modelled. The monolith was modelled using the basic mass transfer model, Equation (1), which is explained in detail in an earlier paper [24].
δ c δ t = V ˙ A ( z ) δ c δ z + D · δ 2 c δ z 2 ( 1 ε ) ε · δ q δ t
In this model, c is the concentration in the fluid bulk phase, V ˙ is the volume flow, A(z) the flown through area, D is the dispersive mass transfer, ε the voidage of the monolith and q the solid phase concentration.
Chromatography was modelled using a lumped pore diffusion model [25], the fluid mass balance is given in Equation (2). The mass balance of the stationary phase is given in
ε p · δ c p δ t + ( 1 ε p ) δ q δ t = 6 d P · ( 1 ε S ) ε S · k e f f · ( c c p )
δ q δ t = 6 d P · k e f f · ( c c p )
Here, ε P is the overall porosity, c P is the concentration in the pores, t as time, q is the load, d P is the mean diameter of the resin particle, ε S is the voidage and k e f f is the effective mass transport coefficient.
Adsorption was modelled using a Langmuir kinetics (Equation (4)), while previously determined [24]. For the chromatographic modelling an assumption was made, that the same binding capacity and similar separation efficiencies can be reached. Examples for chromatographic separation of mRNA using hydrophobic-anion chromatography for a mixed-mode separation and C18 reversed phase separation can be found in the literature [26,27,28,29,30,31].
q = q m a x · K e q · c 1 + K e q · c
In this equation, q m a x is the maximum loading capacity and K e q is the Langmuir coefficient. K e q and q m a x are related to the Henry coefficient H (Equation (5)) [25]. Eluent influence is described by Equations (6) and (7) defining a 1 , a 2 , b 1 and b 2 as correlation coefficients [32,33].
q m a x · K e q = H
q m a x = b 1 · c p + b 2
H = a 1 · c p a 2
The mass transfer coefficient k e f f is given by Equation (8). Where k f is the film mass transfer coefficient, r p the particle radius and D p the pore diffusion coefficient.
k e f f = 1 1 k f + r p D p
D p is calculated according to the correlation of Carta [34] and k f according to Wilson and Wilson/Geankoplis [35]. The molecular radii are calculated from the molecular weight of the molecule, also described by Carta [34].
For the chromatographic resins, Nuvia aPrime 4a and SiliaSphere C18 were chosen. The resins were chosen based on their separation mechanism, which is hydrophobic anion exchange for aPrime 4a and C18 reversed-phase (RP) for SiliaSphere. Both resins also have large pores of around 1000 Å [36,37], allowing pore diffusion to take place. As monoliths, BIA CIMmultusTM PrimaS and Oligo dT18 were modelled.

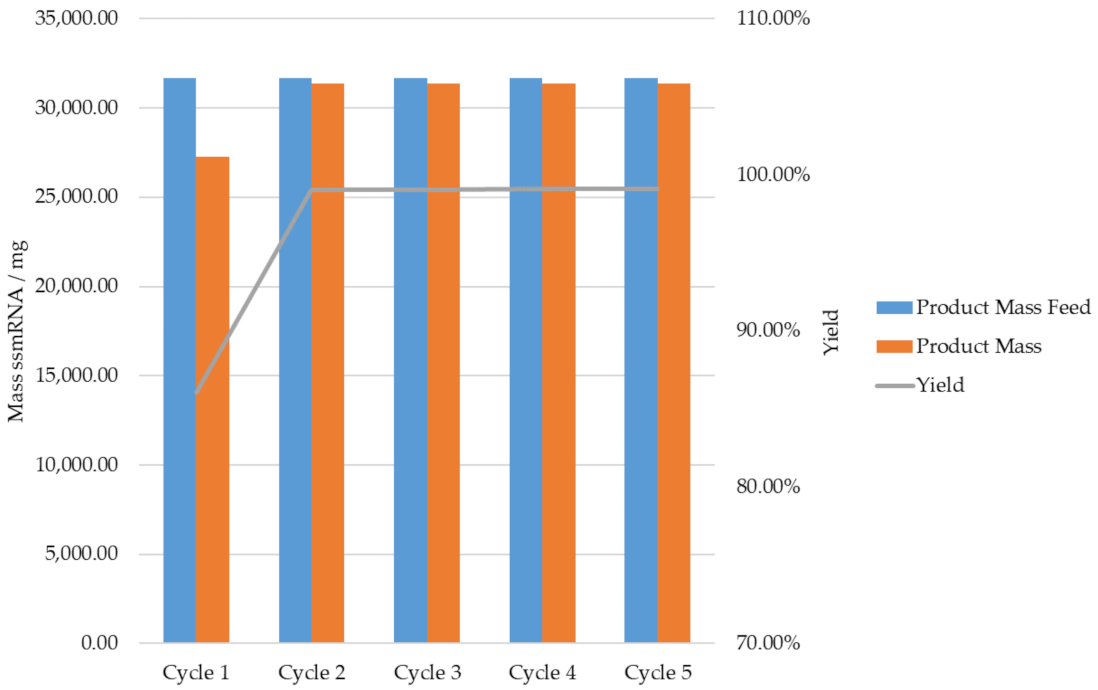
2.1.2. Continuous Adsorptive Processes

There are many different concepts to realize continuous chromatography shown in previous work [38,39,40,41,42]. The selection of the concept in process development highly depends on the circumstances of the separation task. As shown in the previous work [24], in the mixed-mode chromatography (MMC) purification step after transcription, the product is obtained in a center-cut during the gradient. In the reversed phase, the product is eluted in a step-gradient, after the impurities are thoroughly washed out.
The center-cut of the target component leads to a reduced yield, as product is lost in the cut-out fractions. In our calculations this reduced the step yield to 90%. A possible solution to this yield loss is to use multicolumn countercurrent solvent gradient purification (MCSGP) [43]. This allows the lost product to be recycled in the cut-out parts of the chromatogram. In the RP purification, binding capacity is limiting for process efficiency, as the product is selectively captured from the process stream. To increase the resin capacity usage, different multicolumn chromatography concepts can be employed. We decided to use a 3-column periodic countercurrent chromatography (PCC) [39] and compare it to a switched 2-column concept, the simplest way to realize a continuous chromatography process [42].
All discussed continuous chromatography concepts do not employ changing flow direction, as found in simulated moving bed chromatography. As such, these concepts can be applied to monolithic separations as well.

2.2. Cost Estimation

As in other studies [44,45], the cost references used in this work were taken from the literature, and where possible from vendors accessible on the internet [46,47]. The process parameters and synthesis are described in the paper by Schmidt et al. [24] and are based on scientific literature [44,45] and patents [48]. The drug concentration corresponds to that of the Cominarty™ mRNA vaccine available on the market [49]. The baseline scenario corresponds to the process published by Schmidt et al. [24] with approximately 10 million doses per batch. The associated flow diagram is shown in Figure 2. The cost estimation method used can be found in detail in the literature [50,51]. It is the “Lang factors-method for approximation of capital investment”.

3. Results

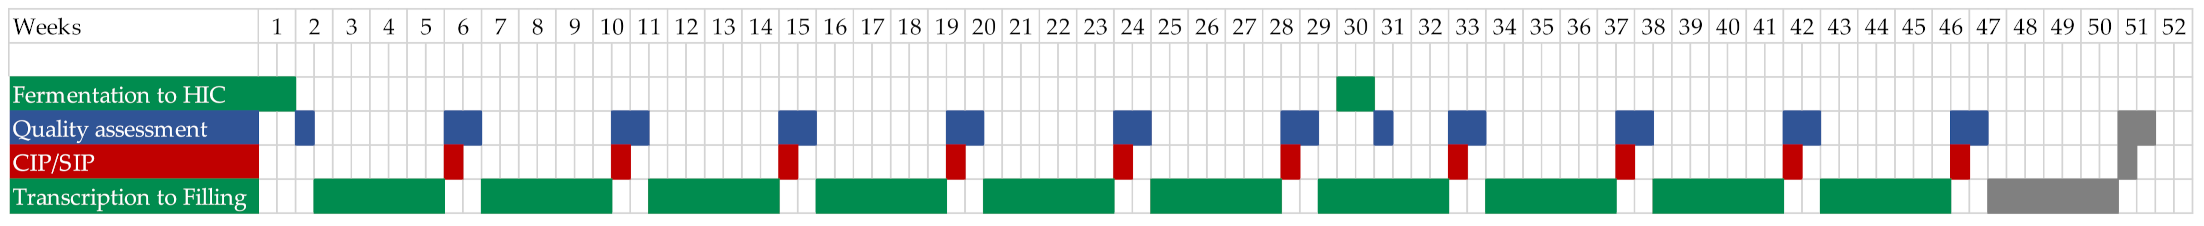
3.1. General Process Design and Schedule Scenarios

The base scenario for batch plasmid deoxyribonucleic acid (pDNA) manufacturing is shown in Figure 3. The most time-consuming steps are the three-day fed-batch fermentation and the quality controls. In (a), the next process step starts as soon as the previous one is completely finished. From the start of fermentation, at least six working days of process time are required before quality tests can start. Thus, a released batch would be available after nine working days at the earliest, and the last process step, without weekend shifts, would fall into the second week. The lowest possible process time with sequential arrangement of the process steps is shown in (b). Here, it is assumed that the subsequent process step immediately follows the previous one. This assumes close timing of process preparation (gray). This reduces the time required to linearized pDNA to four working days, which is a reduction in time of almost more than factor 2. Thus, in any case, the actual process is completed in one week. If weekend shifts are used, quality control can also be completed by the second week. This process scenario represents the best-case scenario for batch production of linearized pDNA, including QC/QA.
The base scenario for batch pDNA manufacturing is shown in Figure 4. The most time-consuming steps are lyophilization and quality control. Analogous to the considerations in pDNA production, in (a) the next process step starts as soon as the previous one is completely finished. From the start of IVT + C, at least 4 working days of process time are required before quality tests can start. Thus, a released batch would be available after 7 working days at the earliest before the LNP (lipid nanoparticle) formulation can start. The lowest possible process time with sequential arrangement of the process steps is shown in (b). Here, it is assumed that the subsequent process step immediately follows the previous one. This assumes close timing of process preparation (gray). This reduces the time required to purify mRNA to about 2.5 working days. Thus, the actual process is completed in one working week including quality control, so that in any case the LNP formulation can start in the second week. This process scenario represents the best case for batch production of purified mRNA including QC/QA and is related to a time reduction by at least factor 2, which is equivalent to doubling yearly capacity.
The basic scenario for the continuous production of mRNA is shown in Figure 5. In the first two weeks of the scenario, a 200 L fed-batch is run for pDNA production, followed by linearization and quality control. The amount of pDNA produced there is sufficient for the equivalent of 30 batches of IVT. In the scenario discussed, one continuous IVT corresponds to four batches of IVT, accordingly the amount of pDNA is sufficient for approximately seven continuous IVT campaigns. Each of these campaigns takes four weeks, with transcription taking three weeks and quality control and CIP/SIP taking a total of one week. Analogous to the productions presented so far, the next IVT starts as soon as the previous campaign is fully completed.
In order to provide sufficient pDNA, another fed-batch fermentation will be performed in parallel to the seventh IVT. Thus, a total of 11 continuous IVT campaigns can be performed per year, taking into account one failed process here, so that a total of 10 successful campaigns can be performed per year in the discussed scenario.
The lowest possible process time when the process steps are arranged sequentially is shown in (Figure 4b). It is assumed that the next continuous IVT immediately follows the previous one and that the result of the QC/QA, which takes 72 h, is not waited for. This can save a total of 10 weeks, allowing two more continuous campaigns to be completed. This process scenario represents the best case for continuous production of purified mRNA including QC/QA, where the capacity increases by a factor 1.25 thanks to the additional 10 weeks of processing, when compared to batch production. Summing up, there is a reduction in time by a factor of 2, which corresponds to the increase in capacity.

CAPEX/OPEX

The cost study shows that the manufacturing costs are at their highest in the case of batch production (EUR 0.38 per dose). The main cost factor is raw materials, with a share of 74%. The second highest costs are caused by the personnel necessary for operation, monitoring and quality control with a share of 15%.
The advantage of the established batch-wise production is offset by a more cost-intensive production. Furthermore, even with the tightest scheduling, a maximum of four campaigns per month is possible per production line. An increase in production capacity is currently not considered technically feasible in the related literature [45]. The cost of pDNA production is EUR 0.03 per dose. Relative to the retail price of EUR 15–20 per dose [52], the cost of pDNA production is not significant.
Considering semi-continuous manufacturing, where pDNA continues to be produced on a batch-by-batch basis, a significant cost reduction is achievable due to continuous in vitro transcription and purification (cf. Table 1). As a result, the production costs decrease to EUR 0.295 per dose. Proportionally, the costs for the raw materials increase and account for 96% of the production costs in this scenario, whereas the personnel costs decrease to 1%, since more doses can be produced with fewer personnel by factor of about 30.
In the case of fully continuous manufacturing, where the pDNA is also manufactured continuously, the relatively low cost of pDNA manufacturing results in similar cost structures as in semi-continuous manufacturing.
However, in the case of continuous in vitro transcription, recycling of the most costly raw materials, namely T7 RNA polymerase and cap analog, lends itself to this approach. The former is not consumed in the reaction as it is a catalyst, whereas the Cap Analog is reacted but by default is present in excess of up to 99% [22,44] and therefore recycling would be economically preferable. The concept of recycling has already been discussed in the literature [53].
In this study, a process model recently developed by Helgers et al. was used to design and optimize the IVT [22]. The design space determined with this model is shown as a contour plot in Figure 6. The batch reactor achieves the highest space–time yields with high input quantities of nucleotides and T7 RNA polymerase. With these and other optimizations, the optimal operating point has been found (Figure 7). In the context of this study, a plug-flow reactor (PFR) was designed for the semi-continuous and continuous production of mRNA, which was also investigated with the process model. The associated design space reveals an optimal space–time yield with a combination of low reactor volume and high throughput. Further results of the study can be found in Helgers et al. [22]. Based on this PFR design, four different scenarios were developed. The first was a three- or five-day campaign corresponding to the production capacity of a 40 or 1200 L (factor of 30) batch to circumvent the technical limitation of 40 L in batch production. The other scenarios are a 12-day campaign corresponding to the production capacity of two 40 or 1200 L batches and a 26-day campaign corresponding to the capacity of four batches. These four scenarios are the initial parameters for the development and optimization of continuous purification by chromatography as discussed in Section 3.2.

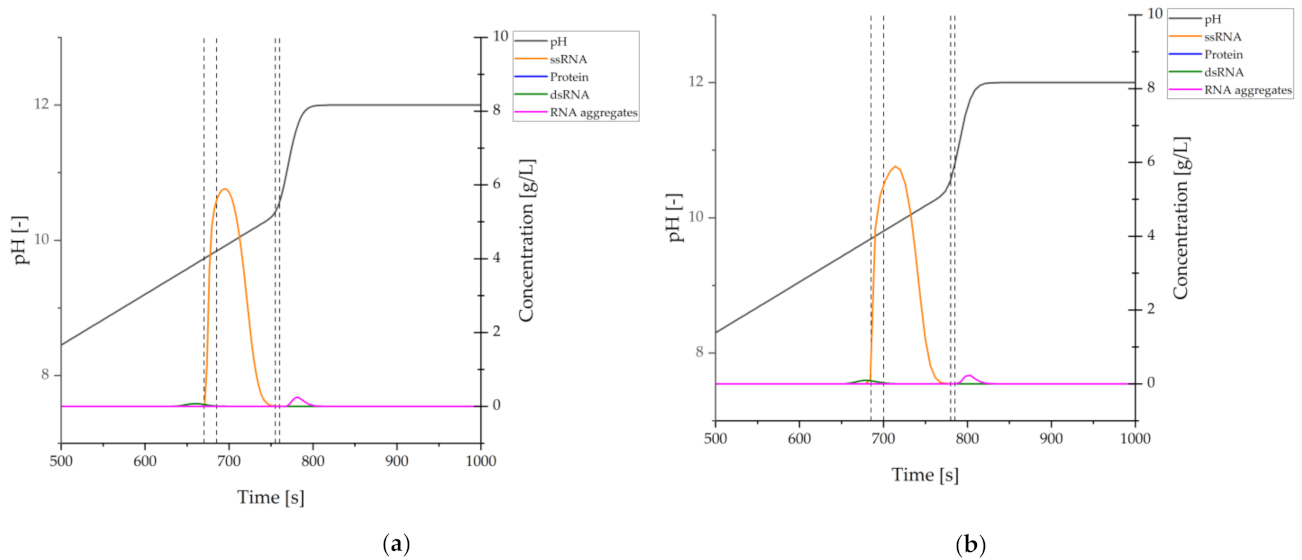
3.2. Purification of mRNA with Mixed-Mode Chromatography

After transcription, the mRNA fragments have to be separated from the transcription proteins, as well as double-stranded mRNA (ds-mRNA) and RNA aggregates [54].
To realize an efficient batch separation, which we used as a benchmark, the upper end of the recommended flow rate for the monolith was chosen [55]. The resulting chromatogram can be found in Figure 8a. At a flow rate of 435 L/h four batches are needed in one hour to process the 16.667 L/h process stream. This is due to the limiting loading capacity of the monolith allowing an injection of 4.2 L feed. Higher injection volumes lead to a product loss as the target component peak elutes earlier and more product is lost in the first fraction. As one separation takes 1765 s, two 8 L columns are needed. The presented separation leads to a yield of 86% and a productivity of 165.8 g/(L∙d). In one run, 27.2 g mRNA is purified, which is in the same range as the yields given by the supplier [56].

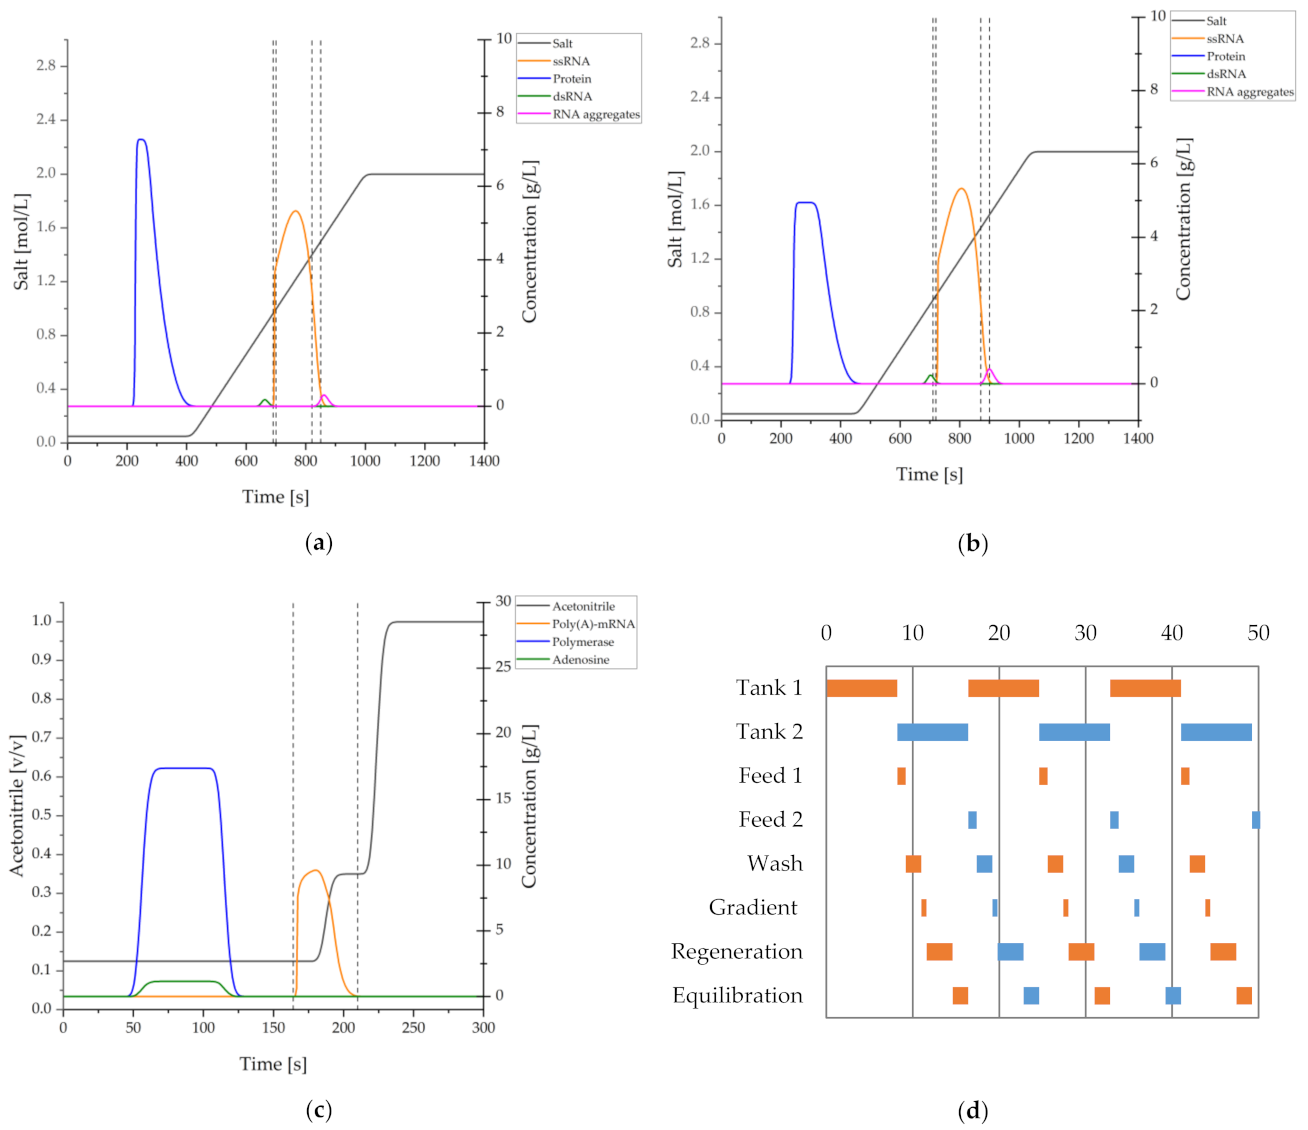
3.3. Purification of Poly-mRNA with Reversed-Phase Chromatography

In the reversed-phase purification process, the polymerized mRNA (Poly(A)-mRNA) is separated from the Polymerase and adenosine, which are both non-binding impurities in the higher eluent concentration of 12.5% [24]. The resulting separation process can be found in Figure 8b. The same flow rate was utilized to process the mixture. In one run, 19.33 L feed can be injected, without major product breakthrough. One run, including monolith regeneration, takes 1025 s. With one column, the whole stream can be purified in two runs. The presented separation leads to a yield of 98.5% as some product is lost during the column wash. The resulting productivity is 809.6 g/(L∙d). In one run, 76.769 g is purified.

3.3.1. Continuous Processing Using Monoliths

To scale continuous monolith processes, the flow rate of the process needs to be adapted, since the monolith itself is not continuously scalable. Monoliths are available in 8 L and 0.8 L scales. A scale-up factor which can be used for monolith scaling is the acquired product per run. Using this factor, the different scenarios can be calculated to show which scale is appropriate for the process volume. The scaling was limited to the recommended flow rates for the monoliths, which are 120–480 L/h for the 8 L monolith and 12–90 L/h for the 0.8 L monolith, respectively.
In Table 2, the resulting process flow rates for the continuous processes are given. The resulting flow rates are calculated for one monolith. The only scenario which is easily scalable to a continuous process is the 16.67 L/h scenario. When two monoliths are used, the resulting flow rate for the MMC-MCSGP is 491.2 L/h, for the reversed phase process the resulting flow rate is 157.45 L/h for a two-column process. These flow rates can be increased by introducing idle times into the continuous process or with the usage of smaller monoliths. The usage of smaller monoliths, however, would call for slightly smaller monoliths of 6–7 L resin volume, as the usage of 0.8 L monoliths increases the flow rate by factor 10. This would be theoretically possible to realize, but would call for multiple process setups. Hence, we decided to not consider these possibilities, as the multiplying overhead costs such as pumps, piping and personnel was deemed economically unfeasible [40,57,58].
The application of a MCSGP-like process to the mixed-mode process leads to a significant process yield increase, and since the flow rate is still at the upper end of the recommended range, the productivity increases significantly. In the resulting chromatograms shown in Figure 9, the effects of the peak recycling can be observed. The target component peak broadens and elutes earlier during the gradient at pH = 9.68 instead of 9.72.
In Figure 10, an overview on the loaded and eluted mRNA is given for the first five cycles of MCSGP. The loaded mass is the mRNA found in the newly injected volume, excluding the recycled fractions. From this course, the yield for the MCSGP process reaches 99.09% for the fifth cycle, resulting in an overall productivity of 188.8 g/(L∙d), corresponding to a 13.8% increase when compared to the batch process.
In the case of reversed-phase chromatography, a smaller monolith would be needed to realize a process with good productivity or avoiding idle times, as it was already discussed above. If the flow rate is lowered to the above-mentioned 157.45 L/h, this would result in a productivity of 184.04 g/(L∙d), and would therefore be no feasible option when compared to a batch process. Alternatively, employing a PCC, or capture-SMB process to increase resin usage, the capacity gain of 5.55% for our parameters would result in a productivity of 211.04 g/(L∙d).
Based on these results, the preferred process is a capture-SMB process with idle times, but most preferable would be the use of a monolith with a volume of 2.7 L, which is not commercially available. Therefore, suitable alternatives are discussed hereafter.

3.3.2. Bead-Based Solutions

The effects of employing an MCSGP system to a classical chromatographic column are comparable to the effects observed in the monolithic separation. For scaling, the flow velocity was set to 300 cm/h. The resulting chromatograms are given in Figure 11a for cycle one and in Figure 11b for cycle five. In these chromatograms, the same peak broadening can be observed as with the monolithic separation, which is typical for the MCSGP process [43]. The productivity for the chromatographic batch separation is 264.34 g/(L∙d) with a yield of 86.9%. Employing the MCSGP process, the yield is increased to 98.65% and productivity to 292.72 g/(L∙d) resulting in a 10.7% increase. The slight increase in productivity mainly results from the freely adjustable column size, as the thermodynamic parameters were kept from the monolith.
This effect, of a freely scalable column increasing the productivity while flow rate is kept at the optimum condition, becomes clearly visible in the reversed phase purification step. In the RP purification, the velocity was increased to 1000 cm/h, since RP-chromatography is normally operated at higher flow rates. For the batch separation, an 18.09 L column was used. This leads to a higher productivity of 1212.9 g/(L∙d). The main advantage of scalable column can be observed when scaling down the columns for continuous use. For a two-column switching process, this results in a 2.47 L column, while the productivity can be maintained at 1221.2 g/(L∙d). The resulting chromatogram and the time schedule are given in Figure 11c,d. If a higher column load is used, when employing systems such as PCC or capture-SMB, the productivity can be further increased to 1269.6 g/(L∙d). Using a constant velocity and method, the productivity is same for every column diameter and therefore the different process scales can be easily calculated.
In summary, by employing a bead-based continuous chromatography process instead of the monolith batch process for MMC, productivity increases by a factor of 2, while buffer usage is decreased from 3.17 L/gProduct to 2.18 L/gProduct. Most significantly, as operator shortage is one of the main limiting factors in upscaling mRNA production, the bead-based process can be scaled up by increasing the column diameter, which does not increase operator demand. A doubled capacity in batch monolithic separation, however, would also double the number of operators needed in the purification step, as a second operation has to be built.
In the reversed phase process the productivity is increased 1.6-fold and buffer usage is decreased from 1.98 L/gProduct to 1.72 L/gProduct. Regarding the operators, the same scale applies as in the MMC step.
Comparing the process alternatives, in the standard process, where 40 L of feed are processed each week, 232.3 g mRNA is purified in the MMC step. The production capacity employing the 5.7 L bead-based column in continuous operation is increased 50-fold. The same factor applies for the RP-step, while in this step the column size decreases to 2.5 L.
In addition to making scaling more efficient for operator requirement in continuous processing, the operator requirement also decreases overall as other critical steps, such as single-use equipment replacement, do not occur.
So, even if the same number of operators in continuous chromatography operation would be needed as in batch, the increased efficiency by continuous processing over 4 weeks, leads to a decrease in personnel requirements by a factor of 4 for non-necessary monolith change, connectors and CIP/SIP for non-disposable equipment parts.

4. Discussion

The outcome of this study is that it shows the clear advantages in throughput and cost-of-goods of switching from batch-wise to continuous manufacturing of mRNA which leads to a potential reduction in manufacturing costs by a factor of 4.5 (i.e., from EUR 0.380 per dose to EUR 0.085 per dose).
In the following, the results of the study presented here regarding critical raw materials, equipment technology, manufacturing mode and process control and their impact on risks and bottlenecks related to supply, personnel, quality, speed and costs are discussed.

4.1. Critical Raw Materials

Linearised pDNA is currently the template of the in vitro transcription processes for the synthesis of mRNA vaccines [59]. pDNA as raw material costs less than EUR 0.03 per dose as the outcome of our study and can be found in literature as low as EUR 0.005 per dose [7,44] and therefore insignificant to the total manufacturing costs.
However, the decision to purchase pDNA or to manufacture it inhouse should depend on if and to which extend process know-how, facilities and qualified staff are available or if any of these needs to be build-up.
Additionally, direct control over supply regarding one of the key-starting materials for IVT is one of the strongest arguments for in-house production, however cGMP compliant production [60] and quality guidelines [20,61,62,63,64,65,66,67] need to be met.
Companies who invested early in QbD-based process development are therefore in an advantageous position. Authorities such as EMA explicitly state that advanced therapy medicinal products (ATMP) manufacturers should apply risk-based approaches for their starting material production. In addition to the fact that the ATMP manufacturer will have to compete with other competitors for materials, contract suppliers must on a regular basis be controlled, which can lead to delays in production, if any irregularities are encountered. Though highly cost-intensive and also critical for production, to our knowledge, there is no mRNA vaccine manufacturer who does produce Cap-Analog and T7-Polymerase enzyme in-house.
The most critical raw materials are T7 RNA polymerase and cap analog, which consumption is reduced by factor of about four, due to the recycling employed in this study.

4.2. Manufacturing Mode

Given the fact that fundamental separation principles and reaction methods remain the same in batch and continuous manufacturing—other than the improvements discussed for chromatography, such as increased capacity by factor of about 50—there is no significant advantage in critical raw material utilization by one production mode over the other.
However, as this study shows, and as other research groups pointed out as well [53], there is the unique opportunity to recycle the starting material in continuous IVT. While in batch and continuous IVT, especially cap analog and T7-Polymerase need to be present in excess for high yields of correctly capped mRNA [22], only in in continuous reaction pathways recycle-loops can be implemented in the process. Discard of up to 99% of both components are reported in batch-wise production [44]. Hence, the longer the continuous production campaign and therefore recycling is maintained, the larger the benefit of continuous over batch manufacturing becomes.
Since costs-of-goods in mRNA manufacturing is calculated here to consist of 74–96% of the raw materials, a reduction is found of cost-of-goods due to recycling by up to a factor of 4.5.
Moreover, time efficiency in batch manufacturing can only be optimized by tight scheduling of preparation, processing as well as CIP/SIP steps, each of which directly delay the manufacturing process. This results in a capacity improvement of a factor of 50 for the chromatography.
The manufacturing mode affects how quality must be controlled. In batch production, the quality of the linearized pDNA template as well as the purified active mRNA substance prior to LNP encapsulation, can only be secured via offline-controls. This increases the time to release the final drug product and therefore decelerates the vaccine availability. This is critical in a pandemic scenario.
One of the major advantages associated with continuous manufacturing is the possibility to perform RTRT.
This however, requires automation of the process and a highly holistic PAT implementation combined with preferably a digital twin to enable real-time prediction of critical quality attributes. A discussed below, we found a relief of personnel requirements, mainly for operators but also laboratory staff for QC/QA, due to continuous manufacturing by a factor of more than 30.
Considering the necessary amount of pDNA as starting material for IVT, a single 200 L fed-batch fermentation is sufficient to cover approximately 30–40 batch IVT (each 40 L working volume). Due to the low quantity of pDNA required per quantity of mRNA, continuous production does not offer a significant cost advantage in this quantity scenario. The well-known fed-batch technique in pDNA production is preferable here due to its higher technical maturity.

4.3. Equipment Technology

The availability of single-use equipment can lead to bottlenecks in the manufacturing of biologics, including mRNA, as it is highly dependent on consumables and requires a more robust supply chain. Major impact in the supply chain is in high demand for consumables. The longest raw material, devices and equipment lead times are reported to be up to 12–18 months [14]. Single-use (SU) technology is also inherently linked to personnel trained in quick switch and reconnect procedures, which increases the stress load on the staff. However, despite these disadvantages, the complete evasion of SU technology is not feasible, since it is by now present in every manufacturing step to some degree, when not inherently necessary, e.g., in case of filtration steps. The trend to go completely SU, including skids, sensors, piping, etc. is risky, as it increases not only the stress load on staff during the switch and reconnect times, as mentioned, but also unnecessarily deepens the dependency on constant resupply. This, in face of a pandemic scenario, in highly unfavorable as in combination with the already tight batch schedules, the availability of sufficient quantities of vaccine can thus be unnecessarily delayed [13].
Therefore, stainless steel equipment is leading the charge for large-scale manufacturing [13].
Some found that WFI usage is reduced, when compared to stainless steel, since no direct CIP/SIP water is necessary [68].
However, in view of the priority of securing large quantities of vaccine in a short period of time, such technological decisions would be contrary to the societal objectives. Additionally, CIP/SIP technology is subject of constant efficiency increases by automation, improved sensor and equipment design, therefore decreasing the amount of WFI necessary [69].
In combination with the switch from batch to continuous manufacturing, encouraged not only by the scientific community [70,71,72,73] but also by authorities [74], the WFI-usage becomes an insignificant factor for the technology decision. Moreover, SU technology for continuous manufacturing is not as readily available, when compared to batch.

4.4. Process Control

The unit operations for a fully continuous process have been proposed and their feasibility is well documented [70,75]. Recent improvements focus on digital twins [63] and advanced process control [62,66]. Implementation of an advanced control strategy requires sensors, in-line or at-line analytics, which have to be chosen in early process development, e.g., for the chromatography units, which are the key technology for product purity [62,66].
First in-line studies started naturally with the first unit operation, cultivation, either operated as a fed-batch or perfusion, with a broad application portfolio [58,76,77,78,79]. Nevertheless, the whole downstream still has to follow.
Due to its equipment complexity, continuous chromatography has a long tradition in advanced process control concepts [80,81,82] for autonomous operation. Break-through operations in capturing, such as periodic counter-current chromatography (PCC) and multi-column solvent gradient purification (MSCGP) processing [38,39] could easily be controlled by inline UV detection [40,83] since the switch criteria are defined by target component breakthrough. Any more complex off-line analytics and model-based calculations are therefore not necessary, but possible of course [75]. In addition to UV sum signal detection, diode-array detector (DAD) concepts of peak deconvolution have successfully been applied to the separation of mAbs [62,84]. This approach could specify side components at least in main groups to fine-tune the switch criteria if intended.
In general, the PAT is not limited to in-line analytics but is a consistent technology approach which is integrated into the QbD philosophy demanded by regulatory authorities. It includes process control in order to gain real time release testing (RTRT) as a benefit in quality assurance (QA) efforts reduction as improved product quality. RTRT has to correlate to critical product quality attributes such as bio-efficacy by titer, purity and bioactivity. State of the art QA are off-line analytical methods such as Protein A and size exclusion chromatography (SEC), enzyme-linked immunosorbent assay (ELISA), infrared spectroscopy as well as glycosylation analytics via HPLC or HPLC-mass spectrometry [85,86,87]. The feasibility of RTRT by online PAT tools is still yet to be proven.
For process development, a sophisticated PAT concept has to be developed parallel to upstream processing (USP) and downstream processing (DSP) modeling, later on supporting model validation [20,63,64,65,88,89], piloting and production. Parallel to model validation, piloting and production the developed PAT method and the partial least squares regression (PLSR) system have to be further refined. In addition to appropriate PAT, digital twins for the whole process are a central key technology for achieving RTRT. It has been proven that for all unit operations, such distinct validated process models are available as digital twins [20,58,62,65,70,89,90,91,92].
In summary, digital-twin based process automation reduces the number of operators required by factor of 2 and lowers their stress level drastically. In addition, product quality is subject to less fluctuation due to the continuous production method and the steady-state thus ensured, which has a lower time-to-market due to PAT-supported RTRT as well as lower batch failure rates which enlarges productivity by about 20% alone

5. Conclusions

The present study investigates the impact of switching from batch-wise mRNA production to continuous. It was shown that manufacturing costs could be reduced by about 25% (factor of four) by continuous in vitro transcription.
The largest savings can be achieved by reducing personnel and consumables per campaign; in the semi-continuous case, a reduction in consumable costs by a factor of six and a reduction in personnel efforts (proportional to costs) by a factor of 20 is possible.
In the fully continuous case, savings of a factor of 7.5 (consumables) and a factor of 30 (personnel) can be achieved. Due to the significant share of raw materials in the manufacturing costs (74–97%), these factors are not reflected proportionally in the manufacturing costs. If a recycling strategy for the most cost-intensive starting materials (T7 RNA polymerase and cap analog), which has already been discussed in the literature, is implemented, the raw material costs can be reduced by a factor of about four.
Combining the above cost reduction approaches leads to a potential reduction in manufacturing costs by a factor of about five (i.e., from EUR 0.380 per dose to EUR 0.085 per dose).
Certain key-enabling technologies are needed to implement continuous manufacturing; firstly, a digital representation of the physical process is needed to enable process control. Initial work on the Digital Twin for continuous in vitro transcription has recently appeared and, for example, also enables optimization of continuous mRNA production to maximize space–time yield [22].
On the other hand, process analysis technologies are needed to enable the necessary real-time monitoring of all process steps. The feasibility and development strategies for this have already been demonstrated for other biotechnological products [93].
The existing tools are now available for next research steps which will demonstrate the technical feasibility on laboratory scale and scale-up with aid of the existing validated process models. PAT methods available could directly by industrialized as well as advanced process control strategies.

Author Contributions

Conceptualization, J.S.; resources, J.S.; writing—original draft preparation, A.S., H.H., F.L.V., A.J. and J.S.; writing—review and editing, A.S., H.H., F.L.V., A.J. and J.S.; supervision, J.S. All authors have read and agreed to the published version of the manuscript.

Funding

This research received no external funding.

Institutional Review Board Statement

Not applicable.

Informed Consent Statement

Not applicable.

Acknowledgments

The authors would like to acknowledge their institute’s laboratory and mechanical, electrical workshop colleagues, especially Reinhard Ditz for conceptional discussions, paper review and English editing, Frank Steinhäuser and Volker Strohmeyer as well as Thomas Knebel and Alina Hengelbrock for conceptional discussions and Annika Leibold for excellent laboratory work. The authors acknowledge financial support by Open Access Publishing Fund of Clausthal University of Technology.

Conflicts of Interest

The authors declare no conflict of interest.

References

  1. European Medicines Agency. COVID-19: How EMA Fast-Tracks Development Support and Approval of Medicines and Vaccines. Press Release. Available online: https://www.ema.europa.eu/en/news/covid-19-how-ema-fast-tracks-development-support-approval-medicines-vaccines (accessed on 24 September 2021).
  2. FDA. Emergency Use Authorization for Vaccines Explained. Available online: https://www.fda.gov/vaccines-blood-biologics/vaccines/emergency-use-authorization-vaccines-explained (accessed on 24 September 2021).
  3. Davis, N. How Has a Covid Vaccine Been Developed So Quickly? Analysis: Funding and High Public Interest Contributed to Slashing of Research and Approval Time. Available online: https://www.theguardian.com/society/2020/dec/08/how-has-a-covid-vaccine-been-developed-so-quickly (accessed on 24 September 2021).
  4. Bill & Melinda Gates Foundation. Bill & Melinda Gates Foundation, Wellcome, and Mastercard Launch Initiative to Speed Development and Access to Therapies for COVID-19: Press Release. Available online: https://www.gatesfoundation.org/Media-Center/Press-Releases/2020/03/COVID-19-Therapeutics-Accelerator (accessed on 11 March 2021).
  5. Brors, P.; Hofmann, S. Dietmar Hopp Will Mit Curevac “Rennen um Besten Impfstoff Gewinnen”. Available online: https://www.handelsblatt.com/unternehmen/management/der-risikoinvestor-dietmar-hopp-will-mit-curevac-rennen-um-besten-impfstoff-gewinnen/26154156.html?ticket=ST-13985126-bIPozoMDRzkCluynaUe7-ap3 (accessed on 11 March 2021).
  6. Wikipedia. Andreas und Thomas Strüngmann. Available online: https://de.wikipedia.org/wiki/Andreas_und_Thomas_Str%C3%BCngmann (accessed on 24 September 2021).
  7. Beaumont, P. How Are Covid Vaccines Produced and Why Have There Been Delays? The Newness of Some of the Technology and Gaps in Global Preparedness Have Led to Bottlenecks. Available online: https://www.theguardian.com/society/2021/mar/19/how-are-covid-vaccines-produced-and-why-have-there-been-delays (accessed on 24 September 2021).
  8. Lupkin, S. The U.S. Paid Billions To Get Enough COVID Vaccines Last Fall. What Went Wrong? Available online: https://www.npr.org/sections/health-shots/2021/08/25/1029715721/pfizer-vaccine-operation-warp-speed-delay?t=1632300860357 (accessed on 24 September 2021).
  9. Tapper, J. Global Covid Vaccine Rollout Threatened by Shortage of Vital Components: Pharmaceutical Firms Warn of Delays to Items Such as the Large Bags in Which Vaccine Cells Are Grown. Available online: https://www.theguardian.com/world/2021/apr/10/global-covid-vaccine-rollout-threatened-by-shortage-of-vital-components (accessed on 24 September 2021).
  10. Barnhill, C. The COVID-19 Vaccine Supply Chain: Potential Problems and Bottlenecks. Available online: https://scm.ncsu.edu/scm-articles/article/the-covid-19-vaccine-supply-chain-potential-problems-and-bottlenecks (accessed on 24 September 2021).
  11. WTO. Indicative List of Trade-Related Bottlenecks and Trade-Facilitating Measures on Critical Products to Combat Covid-19: Information Note. Available online: https://www.wto.org/english/tratop_e/covid19_e/bottlenecks_report_e.pdf (accessed on 24 September 2021).
  12. Kansteiner, F. The Next Big COVID-19 Bottleneck? A Shortage of Trained Vaccine Workers, Experts Say. Available online: https://www.fiercepharma.com/manufacturing/next-big-covid-19-bottleneck-a-shortage-trained-vaccine-workers-pharmas-and (accessed on 24 September 2021).
  13. Samsung Biologics. Economics of Stainless Steel and Single-Use Systems. Available online: https://samsungbiologics.com/media/science-technology-view?boardSeq=989&schBoardCtgryCcd=&schString=&schBoardYear=&boardDtm=1607353200000&page=2 (accessed on 24 September 2021).
  14. Samsung Biologics. Key Considerations in Choosing Stainless Steel vs. Single Use Bioprocessing. Available online: https://samsungbiologics.com/media/science-technology-view?boardSeq=1254&schBoardCtgryCcd=&schString=&schBoardYear=&boardDtm=1624806000000&page=1 (accessed on 24 September 2021).
  15. Sommerfeld, S.; Strube, J. Challenges in biotechnology production—Generic processes and process optimization for monoclonal antibodies. Chem. Eng. Process. Process. Intensif. 2005, 44, 1123–1137. [Google Scholar] [CrossRef]
  16. Strube, J.; Sommerfeld, S.; Lohrmann, M. Process Development and Optimization for Biotechnology Production—Monoclonal Antibodies. In Bioseparation and Bioprocessing, 2nd ed.; Subramanian, G., Ed.; Wiley-VCH: Weinheim, Germany, 2007. [Google Scholar]
  17. Biospace. New capacity Helps Eliminate Bottleneck for COVID-19 Vaccines. Available online: https://www.biospace.com/article/releases/new-capacity-helps-eliminate-bottleneck-for-covid-19-vaccines/ (accessed on 24 September 2021).
  18. Christensen, J. Quality Issue at Baltimore Vaccine Plant Delays Some of Johnson & Johnson’s Vaccine. Available online: https://edition.cnn.com/2021/03/31/health/johnson--johnson-vaccine-manufacturing-problem/index.html (accessed on 24 September 2021).
  19. Rees, V. EDQM Releases New Guidelines for COVID-19 Vaccine Quality Testing. Available online: https://www.europeanpharmaceuticalreview.com/news/133928/edqm-releases-new-guidelines-for-covid-19-vaccine-quality-testing/ (accessed on 24 September 2021).
  20. Schmidt, A.; Strube, J. Distinct and Quantitative Validation Method for Predictive Process Modeling with Examples of Liquid-Liquid Extraction Processes of Complex Feed Mixtures. Processes 2019, 7, 298. [Google Scholar] [CrossRef] [Green Version]
  21. Uhlenbrock, L.; Sixt, M.; Strube, J. Quality-by-Design (QbD) process evaluation for phytopharmaceuticals on the example of 10-deacetylbaccatin III from yew. Resour.-Effic. Technol. 2017, 3, 137–143. [Google Scholar] [CrossRef]
  22. Helgers, H.; Hengelbrock, A.; Schmidt, A.; Strube, J. Digital Twin for Continuous mRNA Production: Submitted; MDPI: Basel, Switzerland, 2021. [Google Scholar]
  23. Udugama, I.A.; Lopez, P.C.; Gargalo, C.L.; Li, X.; Bayer, C.; Gernaey, K.V. Digital Twin in biomanufacturing: Challenges and opportunities towards its implementation. Syst. Microbiol. Biomanuf. 2021, 1, 257–274. [Google Scholar] [CrossRef]
  24. Schmidt, A.; Helgers, H.; Vetter, F.L.; Juckers, A.; Strube, J. Digital Twin of mRNA-Based SARS-COVID-19 Vaccine Manufacturing towards Autonomous Operation for Improvements in Speed, Scale, Robustness, Flexibility and Real-Time Release Testing. Processes 2021, 9, 748. [Google Scholar] [CrossRef]
  25. Guiochon, G. Fundamentals of Preparative and Nonlinear Chromatography, 2nd ed.; Elsevier Acad. Press: Amsterdam, The Netherlands, 2006; ISBN 9780123705372. [Google Scholar]
  26. Halan, V.; Maity, S.; Bhambure, R.; Rathore, A.S. Multimodal Chromatography for Purification of Biotherapeutics—A Review. Curr. Protein Pept. Sci. 2019, 20, 4–13. [Google Scholar] [CrossRef] [PubMed]
  27. Matos, T.; Queiroz, J.A.; Bülow, L. Plasmid DNA purification using a multimodal chromatography resin. J. Mol. Recognit. 2014, 27, 184–189. [Google Scholar] [CrossRef] [PubMed]
  28. Kanavarioti, A. HPLC methods for purity evaluation of man-made single-stranded RNAs. Sci. Rep. 2019, 9, 1019. [Google Scholar] [CrossRef] [PubMed] [Green Version]
  29. Silva-Santos, A.R.; Alves, C.P.; Monteiro, G.; Azevedo, A.M.; Prazeres, D.M.F. Multimodal chromatography of supercoiled minicircles: A closer look into DNA-ligand interactions. Sep. Purif. Technol. 2019, 212, 161–170. [Google Scholar] [CrossRef]
  30. Dickman, M.J. Ion Pair Reverse-Phase Chromatography: A Versatile Platform for the Analysis of RNA; Chromatography Today: St. Albans, UK, 2011. [Google Scholar]
  31. Levine, A.; Ono, T.; Hirose, T. HPLC Purification of mRNA with Reverse Phase and Size Exclusion Chromatography. 2019. Available online: https://www.nacalai.co.jp/global/download/pdf/TIDES_2019_poster_mrna.pdf (accessed on 24 September 2021).
  32. Seidel-Morgenstern, A. Experimental determination of single solute and competitive adsorption isotherms. J. Chromatogr. A 2004, 1037, 255–272. [Google Scholar] [CrossRef] [PubMed]
  33. Zobel-Roos, S. Entwicklung, Modellierung und Validierung von Integrierten Kontinuierlichen Gegenstrom-Chromatographie-Prozessen. Ph.D. Thesis, Technische Universität Clausthal, Clausthal-Zellerfeld, Germany, 2018. [Google Scholar]
  34. Carta, G.; Rodrigues, A.E. Diffusion and convection in chromatographic processes using permeable supports with a bidisperse pore structure. Chem. Eng. Sci. 1993, 48, 3927–3935. [Google Scholar] [CrossRef]
  35. Wilson, E.J.; Geankoplis, C.J. Liquid Mass Transfer at Very Low Reynolds Numbers in Packed Beds. Ind. Eng. Chem. Fund. 1966, 5, 9–14. [Google Scholar] [CrossRef]
  36. Roberts, J.A.; Kimerer, L.; Carta, G. Effects of molecule size and resin structure on protein adsorption on multimodal anion exchange chromatography media. J. Chromatogr. A 2020, 1628, 461444. [Google Scholar] [CrossRef] [PubMed]
  37. SiliCycle. SiliaSphere™ Spherical Silica Gels. Available online: https://www.google.com/url?sa=t&rct=j&q=&esrc=s&source=web&cd=&ved=2ahUKEwj1zZWdkvTxAhWS_rsIHRAhC1sQFjAAegQIBxAD&url=https%3A%2F%2Fwww.dichrom.com%2Fapp%2Fdownload%2F5805621860%2FSiliCycle-SiliaSphere-Brochure.pdf&usg=AOvVaw08hBaUHAqY3MNET7RJL3gx (accessed on 24 September 2021).
  38. Müller-Späth, T.; Aumann, L.; Melter, L.; Ströhlein, G.; Morbidelli, M. Chromatographic separation of three monoclonal antibody variants using multicolumn countercurrent solvent gradient purification (MCSGP). Biotechnol. Bioeng. 2008, 100, 1166–1177. [Google Scholar] [CrossRef] [PubMed]
  39. Godawat, R.; Brower, K.; Jain, S.; Konstantinov, K.; Riske, F.; Warikoo, V. Periodic counter-current chromatography -- design and operational considerations for integrated and continuous purification of proteins. Biotechnol. J. 2012, 7, 1496–1508. [Google Scholar] [CrossRef]
  40. Strube, J. Technische Chromatographie: Auslegung, Optimierung, Betrieb und Wirtschaftlichkeit; TU Dortmund., Habilitation.: 1999; Shaker: Aachen, Germany, 2000; ISBN 3826568974. [Google Scholar]
  41. Zobel, S.; Helling, C.; Ditz, R.; Strube, J. Design and Operation of Continuous Countercurrent Chromatography in Biotechnological Production. Ind. Eng. Chem. Res. 2014, 53, 9169–9185. [Google Scholar] [CrossRef]
  42. Jungbauer, A. Continuous downstream processing of biopharmaceuticals. Trends Biotechnol. 2013, 31, 479–492. [Google Scholar] [CrossRef]
  43. Aumann, L.; Morbidelli, M. A continuous multicolumn countercurrent solvent gradient purification (MCSGP) process. Biotechnol. Bioeng. 2007, 98, 1043–1055. [Google Scholar] [CrossRef]
  44. Labarta, I.; Hoffman, S.; Simpkins, A. Manufacturing Strategy for the Production of 200 Million Sterile Doses of an mRNA Vaccine for COVID-19; Senior Design Reports; University of Pennsylvania: Philadelphia, PA, USA, 2021. [Google Scholar]
  45. Kis, Z.; Kontoravdi, C.; Shattock, R.; Shah, N. Resources, Production Scales and Time Required for Producing RNA Vaccines for the Global Pandemic Demand. Vaccines 2020, 9, 3. [Google Scholar] [CrossRef]
  46. Merck KGaA. Sigma Aldrich. Available online: https://www.sigmaaldrich.com/DE/de (accessed on 24 September 2021).
  47. VWR. Available online: https://de.vwr.com/store/ (accessed on 24 September 2021).
  48. Von der Mülbe, F.; Reidel, L.; Ketterer, T.; Gontcharova, L.; Pascolo, S.; Probst, J.; Schmid, A.; Bauer, S. Method for Producing RNA. U.S. Patent 10711315B2, 14 July 2020. [Google Scholar]
  49. Weise, E.; Weintraub, K. A COVID-19 Vaccine Life Cycle: From DNA to Doses. 2021. Available online: https://eu.usatoday.com/in-depth/news/health/2021/02/07/how-covid-vaccine-made-step-step-journey-pfizer-dose/4371693001/ (accessed on 6 March 2021).
  50. Peters, M.S.; Timmerhaus, K.D.; West, R.E. Plant Design and Economics for Chemical Engineers; McGraw-Hill: New York, NY, USA, 2003. [Google Scholar]
  51. Green, D.W.; Southard, M.Z. Perry’s Chemical Engineers’ Handbook; McGraw-Hill Education: New York, NY, USA, 2019; ISBN 0071834087. [Google Scholar]
  52. Abrams Kaplan, D.; Wehrwein, P. The Price Tags on the COVID-19 Vaccines. Available online: https://www.managedhealthcareexecutive.com/view/the-price-tags-on-the-covid-19-vaccines (accessed on 24 September 2021).
  53. Rosa, S.S.; Prazeres, D.M.F.; Azevedo, A.M.; Marques, M.P.C. mRNA vaccines manufacturing: Challenges and bottlenecks. Vaccine 2021, 39, 2190–2200. [Google Scholar] [CrossRef]
  54. BIA Separations. Purification of mRNA with CIMmultus PrimaS™: Technical Note. 2020. Available online: https://www.biaseparations.com/en/library/technical-notes/1088/purification-of-mrna-with-cimmultus-primastm (accessed on 24 September 2021).
  55. BIA Separations. Monolith Technology. Available online: https://www.biaseparations.com/en/featured/messenger-rna (accessed on 24 September 2021).
  56. Urbas, L. CIM Monolithic Columns for Purification and Analytics of Biomolecules. 2021. Available online: https://hp-ne.com/wp-content/uploads/2021/03/High_Purit-general_presentation.pdf (accessed on 24 September 2021).
  57. Ullmann’s Encyclopedia of Industrial Chemistry; Wiley-VCH Verlag GmbH & Co. KGaA: Weinheim, Germany, 2000; ISBN 3527306730.
  58. Kornecki, M.; Strube, J. Accelerating Biologics Manufacturing by Upstream Process Modelling. Processes 2019, 7, 166. [Google Scholar] [CrossRef] [Green Version]
  59. Sartorius AG. Preparing for the Emergence of mRNA Therapeutics. Available online: https://www.sartorius.com/en/applications/biopharmaceutical-manufacturing/mrna-production?utm_source=bing&utm_medium=cpc&utm_campaign=ww_en_search_BIA%20Application%20mRNA (accessed on 24 September 2021).
  60. Davies, J.G.; Gao, D.; Kim, Y.J.; Harris, R.; Cash, P.W.; Schofield, T.L.; Zhang, R.; Qin, Q. ICH Q5C Stability Testing of Biotechnological/Biological Products. In ICH Quality Guidelines: An Implementation Guide; Wiley: Hoboken, NJ, USA, 2017; p. 345. [Google Scholar]
  61. Kornecki, M.; Schmidt, A.; Strube, J. PAT as key-enabling technology for QbD in pharmaceutical manufacturing A conceptual review on upstream and downstream processing. Chim. Oggi-Chem. Today 2018, 36, 44–48. [Google Scholar]
  62. Zobel-Roos, S.; Mouellef, M.; Ditz, R.; Strube, J. Distinct and Quantitative Validation Method for Predictive Process Modelling in Preparative Chromatography of Synthetic and Bio-Based Feed Mixtures Following a Quality-by-Design (QbD) Approach. Processes 2019, 7, 580. [Google Scholar] [CrossRef] [Green Version]
  63. Zobel-Roos, S.; Schmidt, A.; Mestmäcker, F.; Mouellef, M.; Huter, M.; Uhlenbrock, L.; Kornecki, M.; Lohmann, L.; Ditz, R.; Strube, J. Accelerating Biologics Manufacturing by Modeling or: Is Approval under the QbD and PAT Approaches Demanded by Authorities Acceptable Without a Digital-Twin? Processes 2019, 7, 94. [Google Scholar] [CrossRef] [Green Version]
  64. Huter, M.J.; Strube, J. Model-Based Design and Process Optimization of Continuous Single Pass Tangential Flow Filtration Focusing on Continuous Bioprocessing. Processes 2019, 7, 317. [Google Scholar] [CrossRef] [Green Version]
  65. Roth, T.; Uhlenbrock, L.; Strube, J. Distinct and Quantitative Validation for Predictive Process Modelling in Steam Distillation of Caraway Fruits and Lavender Flower Following a Quality-By-Design (QbD) Approach. Processes 2020, 8, 594. [Google Scholar] [CrossRef]
  66. Zobel-Roos, S.; Mouellef, M.; Siemers, C.; Strube, J. Process Analytical Approach towards Quality Controlled Process Automation for the Downstream of Protein Mixtures by Inline Concentration Measurements Based on Ultraviolet/Visible Light (UV/VIS) Spectral Analysis. Antibodies 2017, 6, 24. [Google Scholar] [CrossRef] [Green Version]
  67. Barresi, A.A.; Fissore, D. In-Line Product Quality Control of Pharmaceuticals in Freeze-Drying Processes. In Modern Drying Technology; Tsotsas, E., Mujumdar, A.S., Eds.; Wiley-VCH Verlag GmbH & Co. KGaA: Weinheim, Germany, 2011; pp. 91–154. ISBN 9783527631667. [Google Scholar]
  68. Pietrzykowski, M.; Flanagan, W.; Pizzi, V.; Brown, A.; Sinclair, A.; Monge, M. An environmental life cycle assessment comparison of single-use and conventional process technology for the production of monoclonal antibodies. J. Clean. Prod. 2013, 41, 150–162. [Google Scholar] [CrossRef]
  69. Schmidt, A.; Uhlenbrock, L.; Strube, J. Technical Potential for Energy and GWP Reduction in Chemical–Pharmaceutical Industry in Germany and EU—Focused on Biologics and Botanicals Manufacturing. Processes 2020, 8, 818. [Google Scholar] [CrossRef]
  70. Kornecki, M.; Schmidt, A.; Lohmann, L.; Huter, M.; Mestmäcker, F.; Klepzig, L.; Mouellef, M.; Zobel-Roos, S.; Strube, J. Accelerating Biomanufacturing by Modeling of Continuous Bioprocessing—Piloting Case Study of Monoclonal Antibody Manufacturing. Processes 2019, 7, 495. [Google Scholar] [CrossRef] [Green Version]
  71. Srai, J.S.; Badman, C.; Krumme, M.; Futran, M.; Johnston, C. Future Supply Chains Enabled by Continuous Processing—Opportunities and Challenges. May 20–21, 2014 Continuous Manufacturing Symposium. J. Pharm. Sci. 2015, 104, 840–849. [Google Scholar] [CrossRef] [PubMed] [Green Version]
  72. Subramanian, G. Continuous Biomanufacturing—Innovative Technologies and Methods; Wiley-VCH Verlag GmbH & Co. KGaA: Weinheim, Germany, 2017; ISBN 9783527699902. [Google Scholar]
  73. Walther, J.; Godawat, R.; Hwang, C.; Abe, Y.; Sinclair, A.; Konstantinov, K. The business impact of an integrated continuous biomanufacturing platform for recombinant protein production. J. Biotechnol. 2015, 213, 3–12. [Google Scholar] [CrossRef] [PubMed]
  74. FDA. Guidance for Industry: PAT—A Framework for Innovative Pharmaceutical Development, Manufacturing, and Quality Assurance. 2004. Available online: https://www.fda.gov/downloads/drugs/guidances/ucm070305.pdf (accessed on 19 February 2018).
  75. Feidl, F.; Vogg, S.; Wolf, M.; Podobnik, M.; Ruggeri, C.; Ulmer, N.; Wälchli, R.; Souquet, J.; Broly, H.; Butté, A.; et al. Process-wide control and automation of an integrated continuous manufacturing platform for antibodies. Biotechnol. Bioeng. 2020, 117, 1367–1380. [Google Scholar] [CrossRef] [PubMed]
  76. Claßen, J.; Aupert, F.; Reardon, K.F.; Solle, D.; Scheper, T. Spectroscopic sensors for in-line bioprocess monitoring in research and pharmaceutical industrial application. Anal. Bioanal. Chem. 2017, 409, 651–666. [Google Scholar] [CrossRef]
  77. Kornecki, M.; Strube, J. Process Analytical Technology for Advanced Process Control in Biologics Manufacturing with the Aid of Macroscopic Kinetic Modeling. Bioengineering 2018, 5, 25. [Google Scholar] [CrossRef] [PubMed] [Green Version]
  78. Santos, R.M.; Kessler, J.-M.; Salou, P.; Menezes, J.C.; Peinado, A. Monitoring mAb cultivations with in-situ raman spectroscopy: The influence of spectral selectivity on calibration models and industrial use as reliable PAT tool. Biotechnol. Prog. 2018, 34, 659–670. [Google Scholar] [CrossRef]
  79. Abu-Absi, N.R.; Kenty, B.M.; Cuellar, M.E.; Borys, M.C.; Sakhamuri, S.; Strachan, D.J.; Hausladen, M.C.; Li, Z.J. Real time monitoring of multiple parameters in mammalian cell culture bioreactors using an in-line Raman spectroscopy probe. Biotechnol. Bioeng. 2011, 108, 1215–1221. [Google Scholar] [CrossRef]
  80. Suvarov, P.; Wouwer, A.V.; Lee, J.W.; Seidel-Morgensten, A.; Kienle, A. Control of incomplete separation in simulated moving bed chromatographic processes. IFAC-PapersOnLine 2016, 49, 153–158. [Google Scholar] [CrossRef]
  81. Engell, S.; Toumi, A. Optimization and control of chromatography. In European Symposium on Computer-Aided Process Engineering—14, Proceedings of the 37th European Symposium of the Working Party on Computer-Aided Process Engineering, ESCAPE-14, Lisbon, Portugal, 16–19 May 2004, 1st ed.; Barbosa-Póvoa, A., Matos, H., Eds.; Elsevier: Amsterdam, The Netherlands, 2004; pp. 9–22. ISBN 9780444516947. [Google Scholar]
  82. Strube, J.; Klatt, K.U.; Noeth, G.; Greifenberg, J.; Bocker, S.; Kansy, H.; Jahn, P.; Justen, B. Modular Valve System for Countercurrent Chromatography Process. U.S. Patent 8,658,040, 25 February 2014. [Google Scholar]
  83. Böcker, S.; Greifenberg, J.; Jähn, P.; Justen, B.; Kansy, H.; Klatt, K.; Noeth, G.; Strube, J. Process for the Preparation of Chemical and Pharmaceutical Products with Integrated Multi-Column Chromatography. Patent DE102004025000A1, 8 December 2005. [Google Scholar]
  84. Brestrich, N.; Briskot, T.; Osberghaus, A.; Hubbuch, J. A tool for selective inline quantification of co-eluting proteins in chromatography using spectral analysis and partial least squares regression. Biotechnol. Bioeng. 2014, 111, 1365–1373. [Google Scholar] [CrossRef]
  85. Buijs, J.; Norde, W.; Lichtenbelt, J.W.T. Changes in the Secondary Structure of Adsorbed IgG and F(ab‘)2 Studied by FTIR Spectroscopy. Langmuir 1996, 12, 1605–1613. [Google Scholar] [CrossRef]
  86. ICH. Endorsed Guide for ICH Q8/Q9/Q10 Implementation; International Conference on Harmonisation of Technical Requirements for Registration of Pharmaceuticals for Human Use: Geneva, Switzerland , 2011. [Google Scholar]
  87. Wasalathanthri, D.P.; Feroz, H.; Puri, N.; Hung, J.; Lane, G.; Holstein, M.; Chemmalil, L.; Both, D.; Ghose, S.; Ding, J.; et al. Real-time monitoring of quality attributes by in-line Fourier transform infrared spectroscopic sensors at ultrafiltration and diafiltration of bioprocess. Biotechnol. Bioeng. 2020, 117, 3766–3774. [Google Scholar] [CrossRef]
  88. Sixt, M.; Uhlenbrock, L.; Strube, J. Toward a Distinct and Quantitative Validation Method for Predictive Process Modelling—On the Example of Solid-Liquid Extraction Processes of Complex Plant Extracts. Processes 2018, 6, 66. [Google Scholar] [CrossRef] [Green Version]
  89. Lohmann, L.J.; Strube, J. Accelerating Biologics Manufacturing by Modeling: Process Integration of Precipitation in mAb Downstream Processing. Processes 2020, 8, 58. [Google Scholar] [CrossRef] [Green Version]
  90. Klepzig, L.S.; Juckers, A.; Knerr, P.; Harms, F.; Strube, J. Digital Twin for Lyophilization by Process Modeling in Manufacturing of Biologics. Processes 2020, 8, 1325. [Google Scholar] [CrossRef]
  91. Uhlenbrock, L.; Jensch, C.; Tegtmeier, M.; Strube, J. Digital Twin for Extraction Process Design and Operation. Processes 2020, 8, 866. [Google Scholar] [CrossRef]
  92. Huter, M.J.; Jensch, C.; Strube, J. Model Validation and Process Design of Continuous Single Pass Tangential Flow Filtration Focusing on Continuous Bioprocessing for High Protein Concentrations. Processes 2019, 7, 781. [Google Scholar] [CrossRef] [Green Version]
  93. Helgers, H.; Schmidt, A.; Lohmann, L.J.; Vetter, F.L.; Juckers, A.; Jensch, C.; Mouellef, M.; Zobel-Roos, S.; Strube, J. Towards Autonomous Operation by Advanced Process Control—Process Analytical Technology for Continuous Biologics Antibody Manufacturing. Processes 2021, 9, 172. [Google Scholar] [CrossRef]
Figure 1. Levels of a Digital Twin, Starting from a Steady-State-Model, over a Dynamic Model, a Validated Model and a Digital Shadow to a Model-Based Control [22,23].
Processes 09 01874 g001
Figure 2. Flowsheet of base-scenario adapted from Schmidt et al. [24].
Processes 09 01874 g002
Figure 3. Batch pDNA production schedule. Scheduled with downtime between unit-operations due to preparation and CIP/SIP procedures (a) and with no processing downtime (b). Preparation (gray); Processing (green); CIP/SIP (dark red); Quality control (blue). Numbers on the x-axis represent hours.
Processes 09 01874 g003
Figure 4. Batch mRNA production schedule. Scheduled with downtime between unit-operations due to preparation and CIP/SIP procedures (a) and with no processing downtime (b). Preparation (gray); Processing (green); CIP/SIP (dark red); Quality control (blue).
Processes 09 01874 g004
Figure 5. Continuous mRNA production schedule.
Processes 09 01874 g005
Figure 6. Contour plots as results of the multi-parameter-at-a-time (DoE) sensitivity study with STY (space time yield) as target value when reaching 90% of the maximum mRNA concentration (a) Batch reactor, ATP concentration over T7 RNA polymerase concentration; (b) Tubular reactor, reactor volume over flow rate from [22].
Processes 09 01874 g006
Figure 7. Concentration profiles obtained by Monte-Carlo simulations. (a) Batch reactor; (b) Tubular reactor [22].
Processes 09 01874 g007
Figure 8. (a) Chromatogram of the batch separation on BIA CIMmultus PrimaS. (b) Chromatogramm of the batch separation on BIA CIMmultus Oligo dT18. Fraction cut points as dashed lines.
Processes 09 01874 g008
Figure 9. MCSGP chromatograms of the monolithic MMC separation; (a) is the chromatogram of cycle 1 and (b) is the chromatogram of cycle 5.
Processes 09 01874 g009
Figure 10. Overview on the fed and eluted mass in the product fraction of monolithic MCSGP.
Processes 09 01874 g010
Figure 11. (a) Chromatogramm of the first cycle of bead-based MCSGP. (b) Chromatogramm of the fifth cycle of bead-based MCSGP. (c) Chromatogramm of the bead-based reversed-phase chromatography. (d) Scheduling of the two-column switching continuous process; numbers on the x-axis represent hours.
Processes 09 01874 g011
Table 1. Total annual operating costs (OPEX) and capital investment costs (CAPEX) necessary for the production of 400 million doses per year.
ScenarioBatchMixedContinuous
OPEX (M EUR/year)454.3352.5385.4
CAPEX (M EUR)46.543.734.8
Production Costs per dose (EUR)0.3800.2950.295
Table 2. Resulting flow rates for MMC and RP for an 8 L monolith. Green: within working velocity, yellow: at limit of working velocity, red: outside of recommended working range.
ScenarioProcessed mRNAInput DownstreamRuns MMCCV/h MMCFlow Rate MMCInput RPRuns MMCCV/h RPFlow Rate RP
1126.50 g/h16.67 L/h4.6 1/h122.8 1/h982.4 L/h39.27 L/h1.6 1/h39.4 1/h314.9 L/h
275.90 g/h10.00 L/h2.8 1/h73.7 1/h589.5 L/h23.56 L/h1.0 1/h23.6 1/h188.9 L/h
363.25 g/h8.33 L/h2.3 1/h61.4 1/h491.2 L/h19.64 L/h0.8 1/h19.7 1/h157.4 L/h
458.38 g/h7.69 L/h2.1 1/h56.7 1/h453.4 L/h18.13 L/h0.8 1/h18.2 1/h145.3 L/h
Publisher’s Note: MDPI stays neutral with regard to jurisdictional claims in published maps and institutional affiliations.

