
In Situ Bio-Methanation Modelling of a Randomly Packed Gas Stirred Tank Reactor (GSTR)

 , , and
Abstract
:1. Introduction
2. Materials and Methods
2.1. The Influent
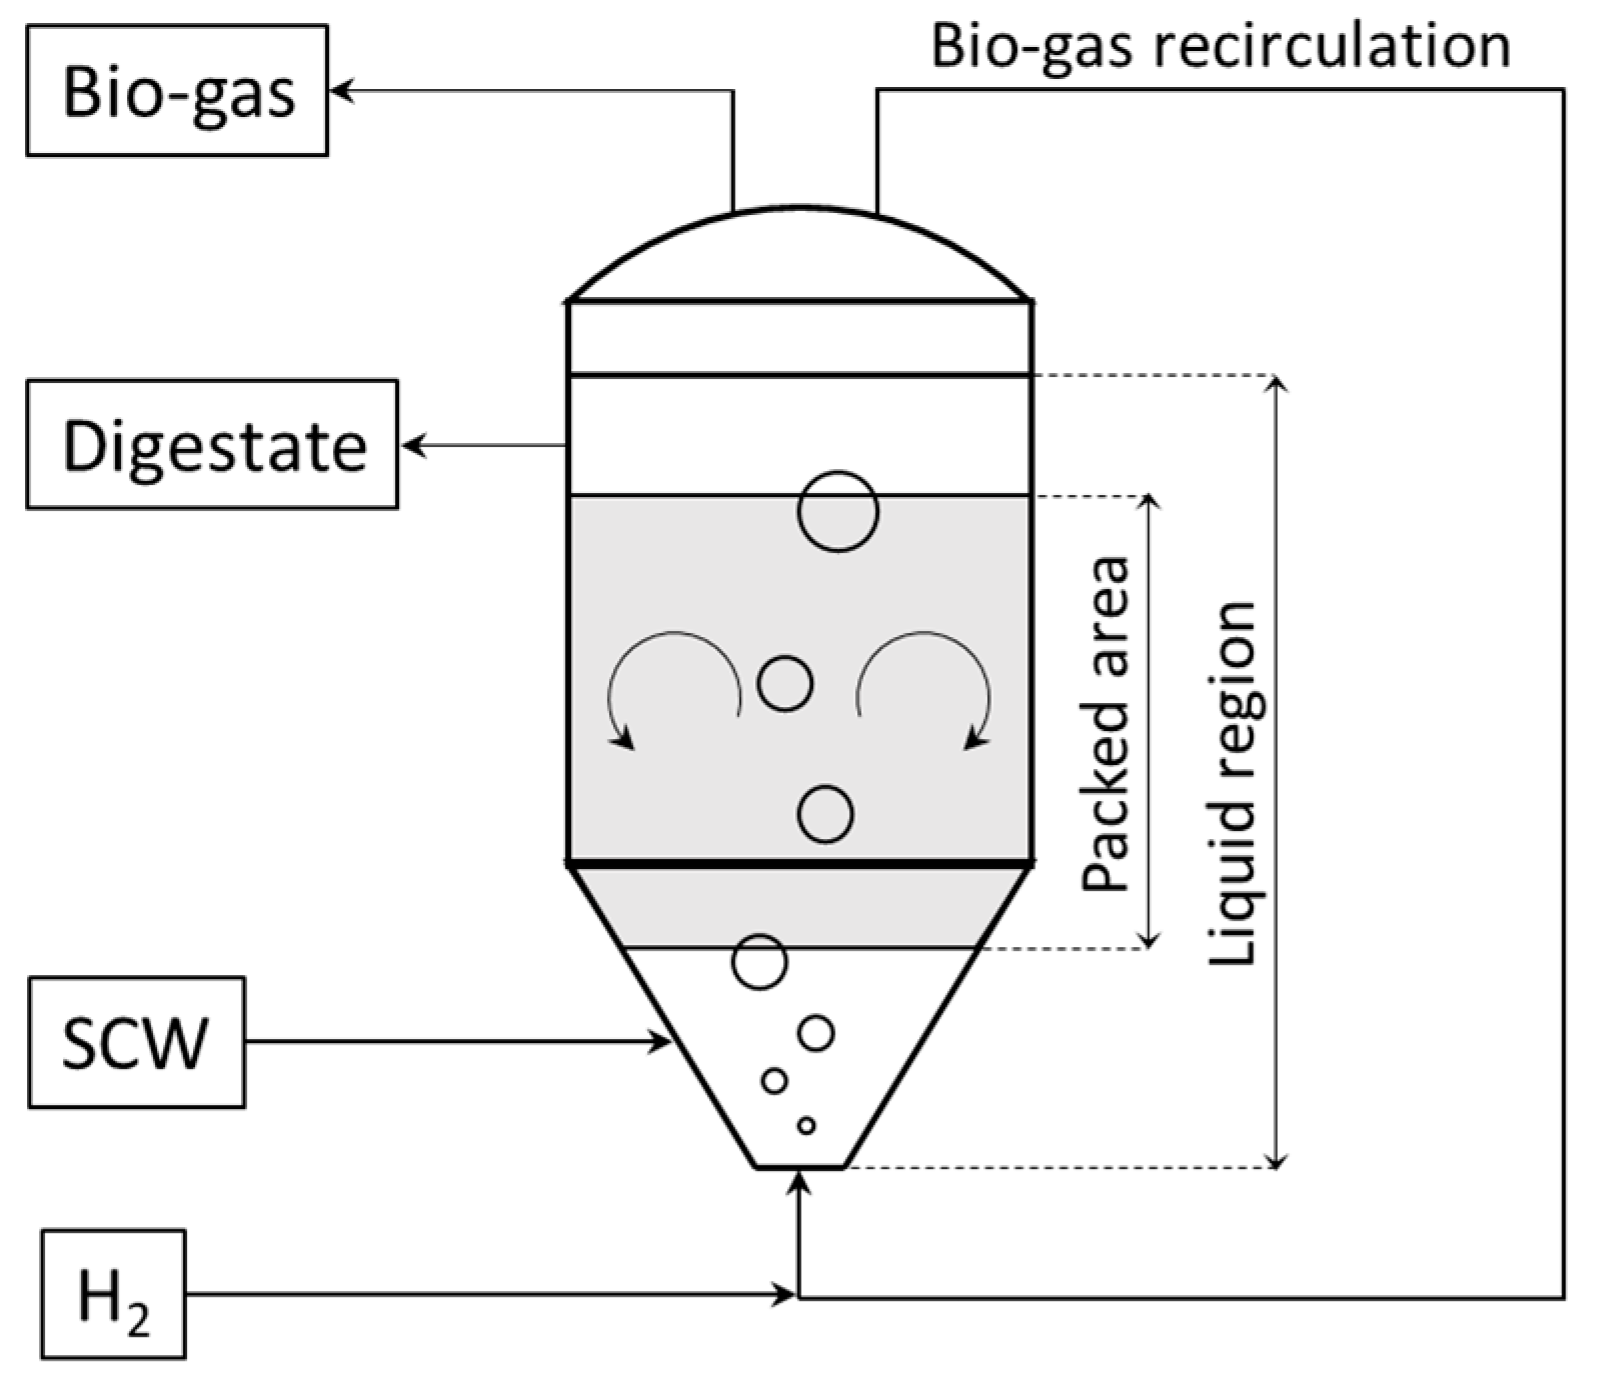
2.2. The Process
2.3. Analytical Methods
2.4. Model Assumptions and Description
2.4.1. Bio-Methanation Modeling
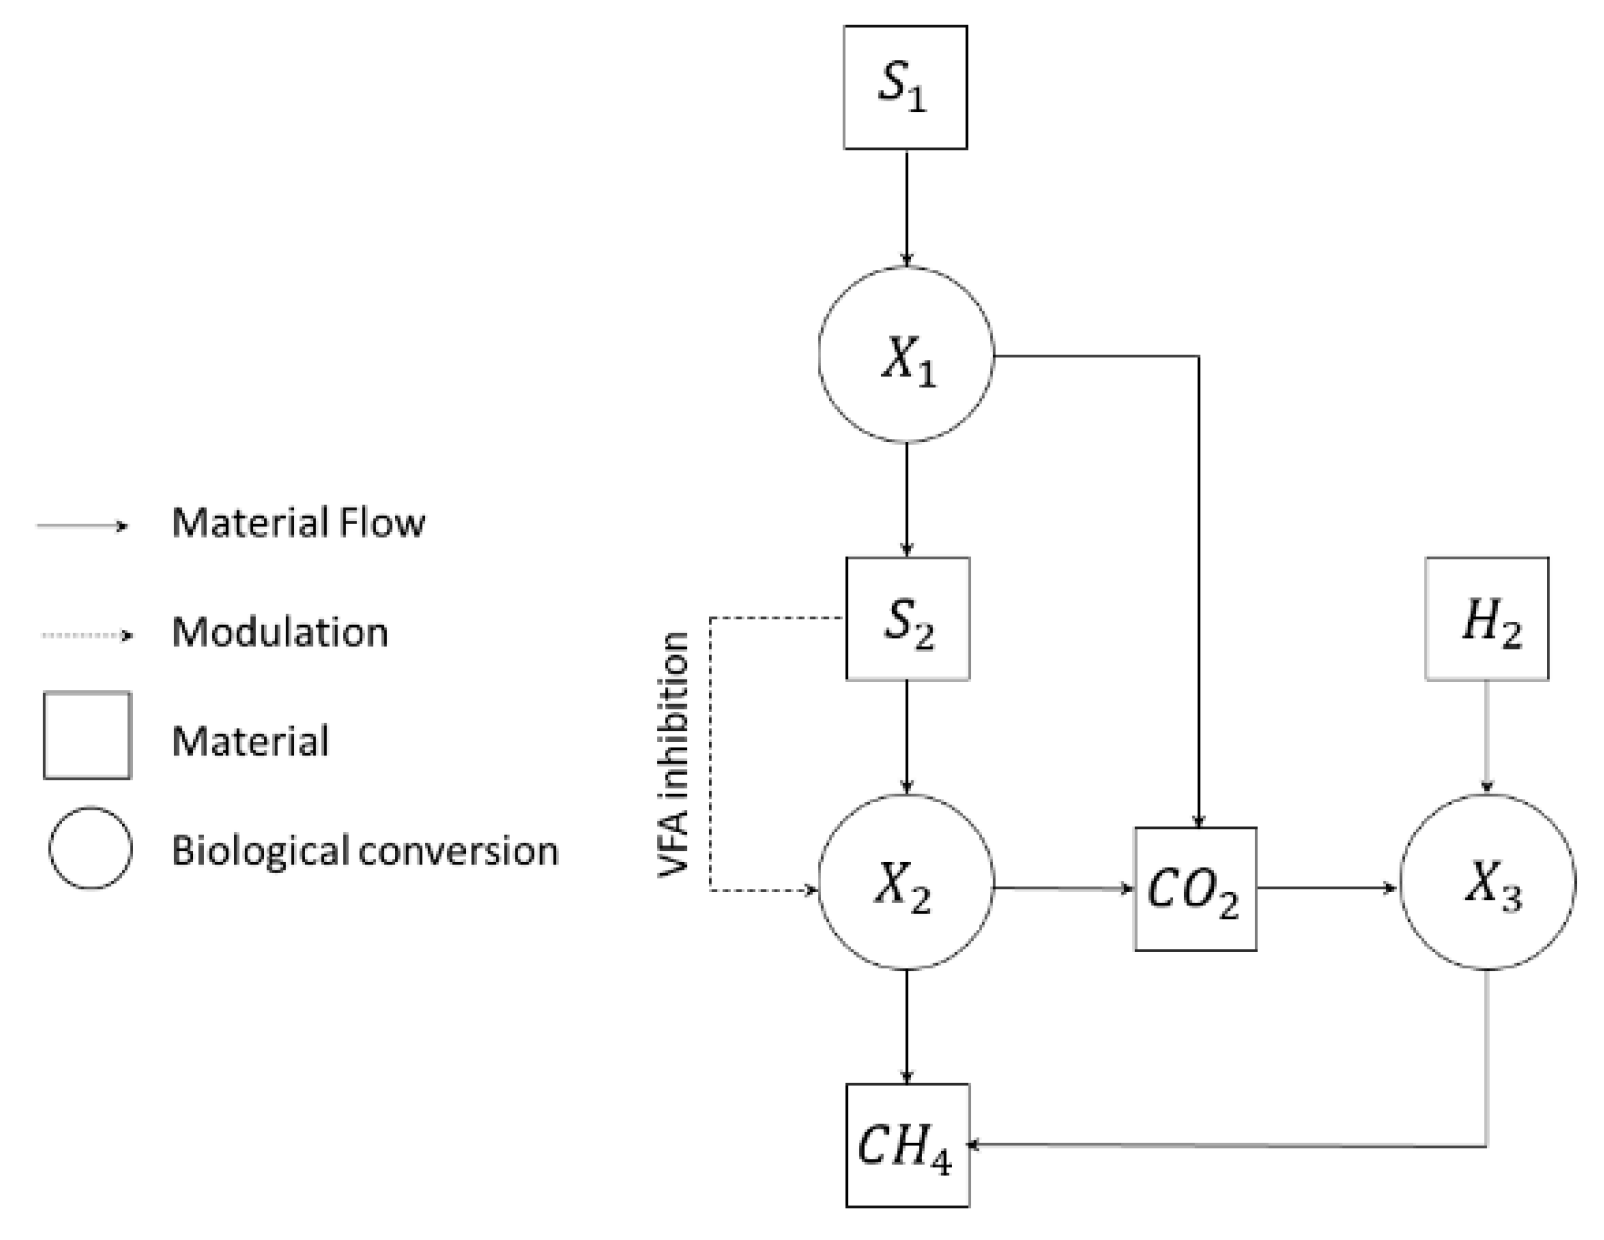
2.4.2. Biological Reactions: Stoichiometry and Kinetics
2.4.3. Mass Balances
2.5. Parameter Estimation
- Parameter Estimation related to the Anaerobic Digestion by evaluating the stationary state of the system. As will be explained in the result section, the unknown parameters to determine are: all the yield parameters related to the reactions r1 and r2, the mass transfer coefficients and the parameter α.
- Evaluation of the remaining parameters by a dynamic simulation fitting during Bio-methanation. It will be later explained how the only parameter to fit will be the hydrogen mass transfer coefficient .
2.5.1. Determination of the AD Stationary State
- The concentration of CO2 in the liquid phase was supposed to be at equilibrium conditions since it is a highly soluble gas [23]. Combining Equations (13) and (14) and setting to zero the time derivative terms, the following equation was obtained were k4 was fixed from literature since it is low impact on the system sensitivity again considering the work of Bernard et al. [19].
- The concentration of CH4 in the liquid solution happens to be so low that it was neglected the term that it takes it into account for the evaluation of the parameter k6. The latter was calculated by combining Equations (13) and (14) and setting to zero the time derivative terms which led to the expression reported below.
2.5.2. Dynamic Fitting
3. Results and Discussion
3.1. Anaerobic Digestion Mode
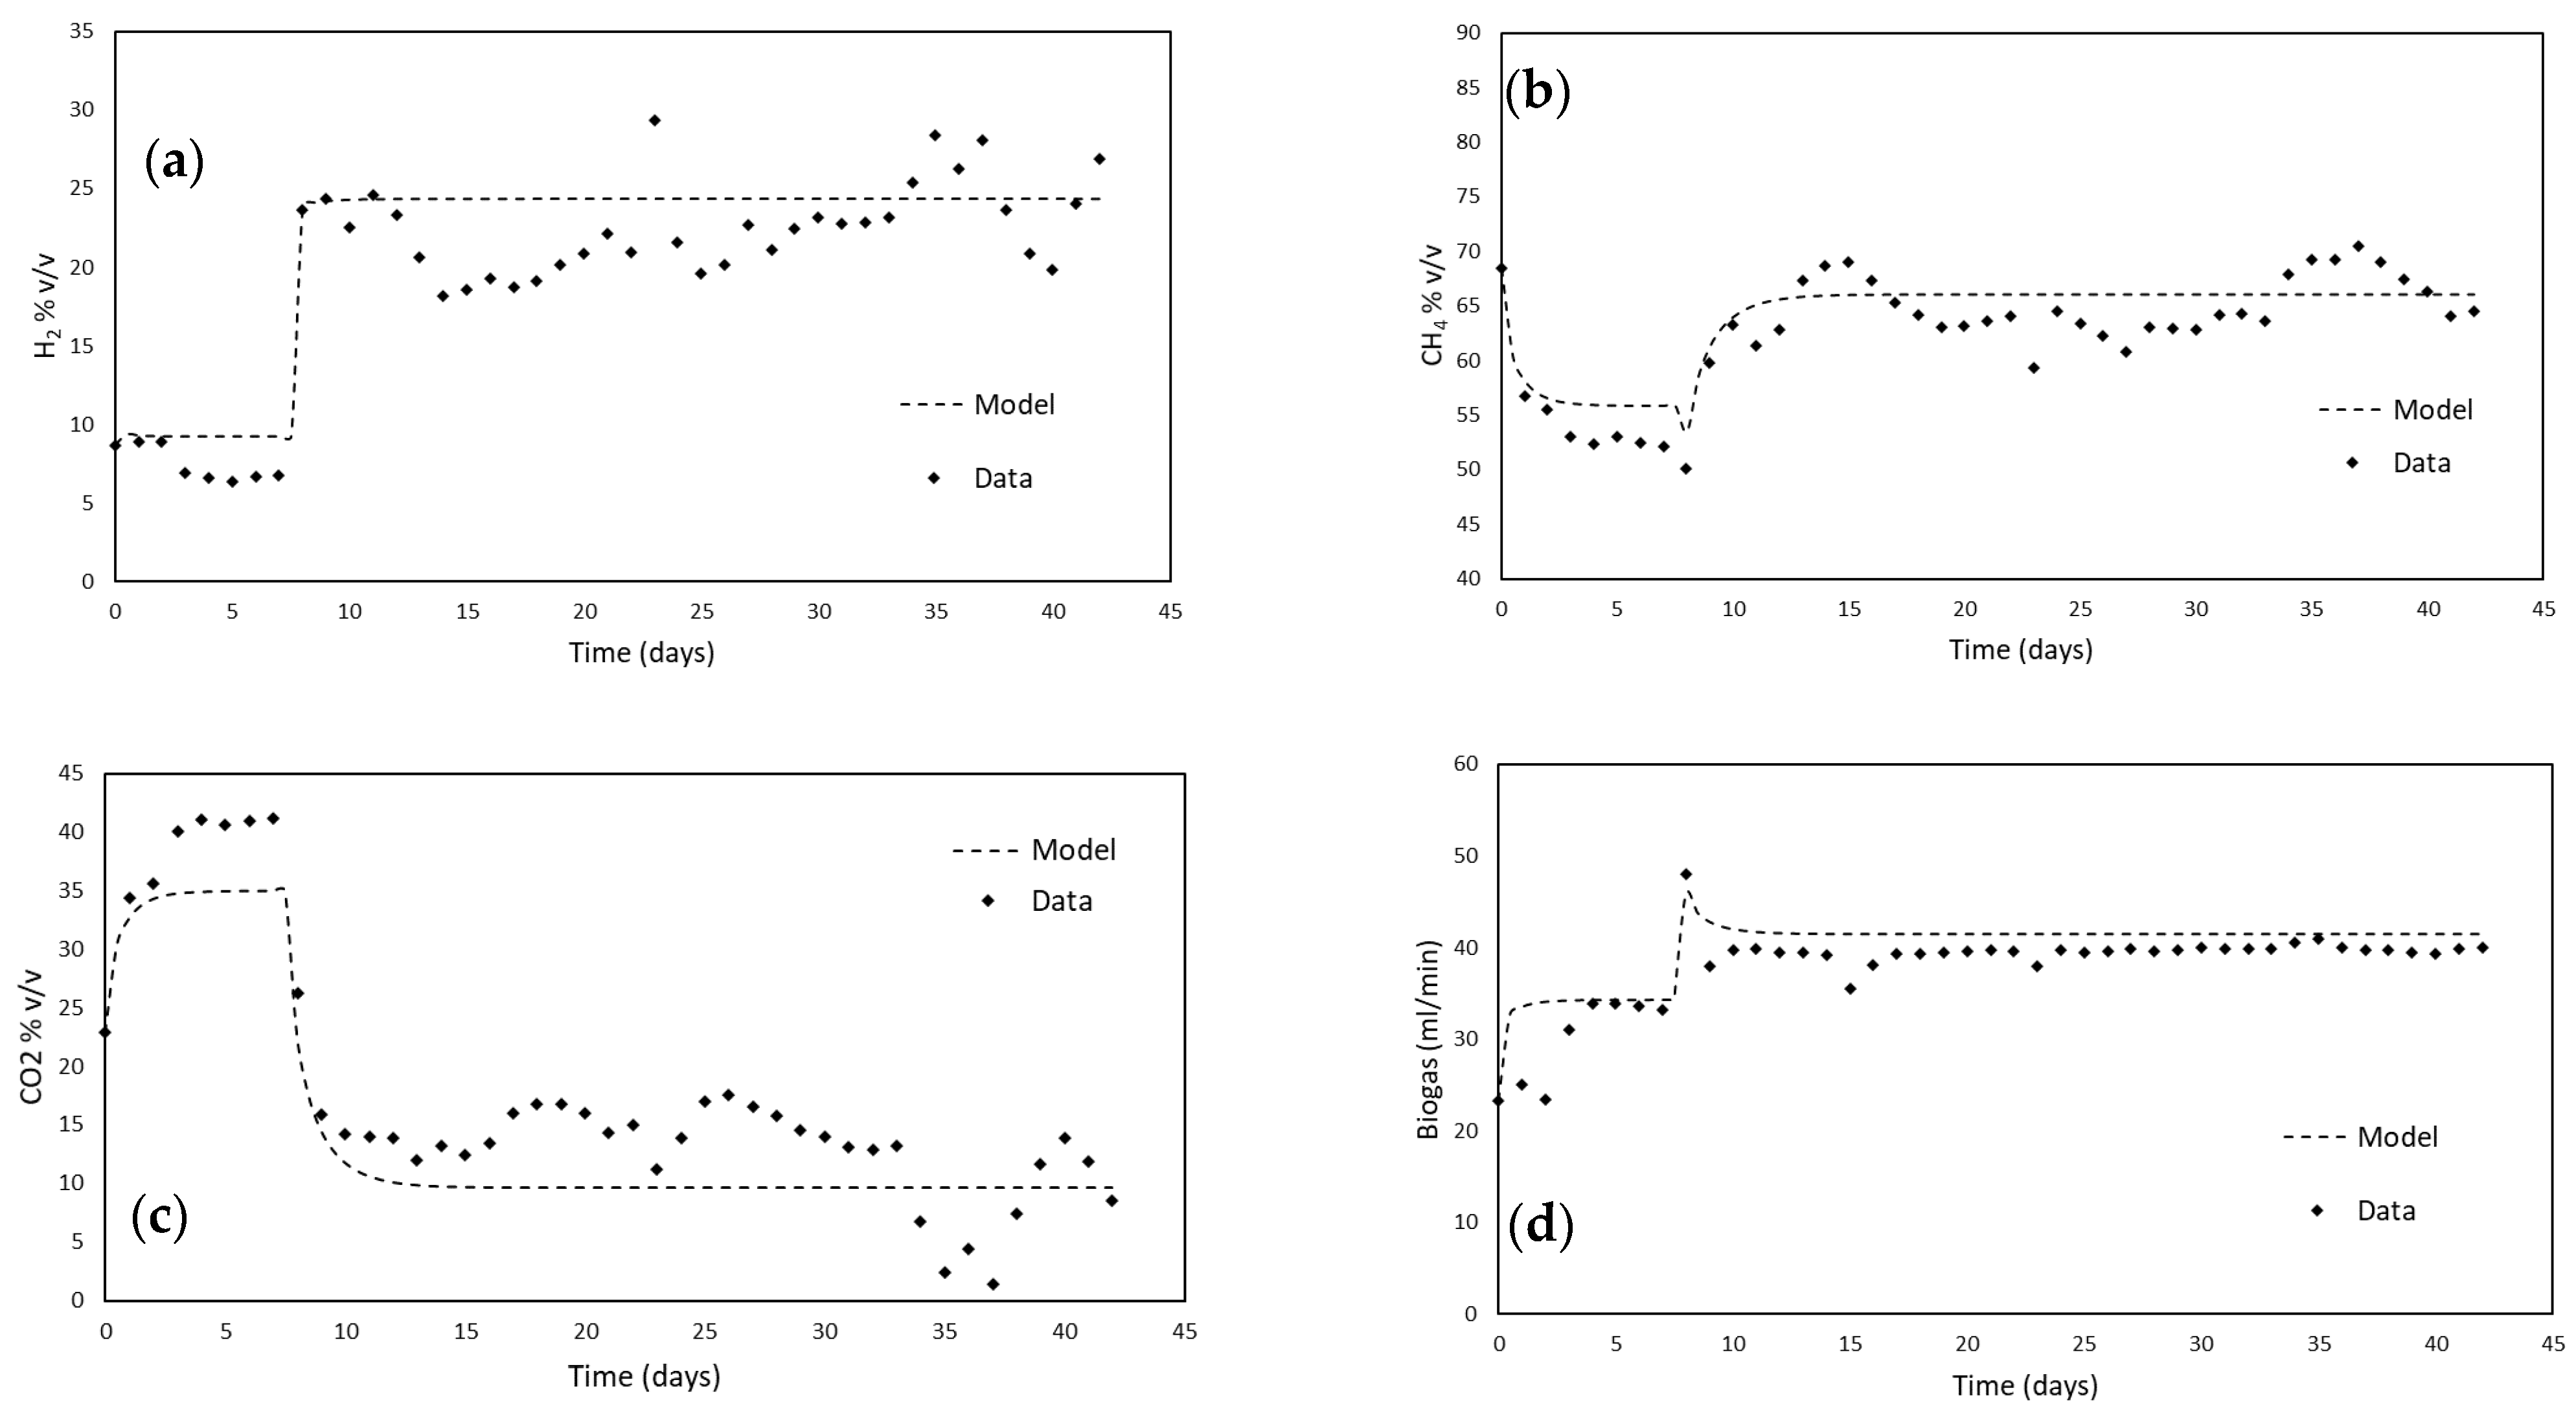
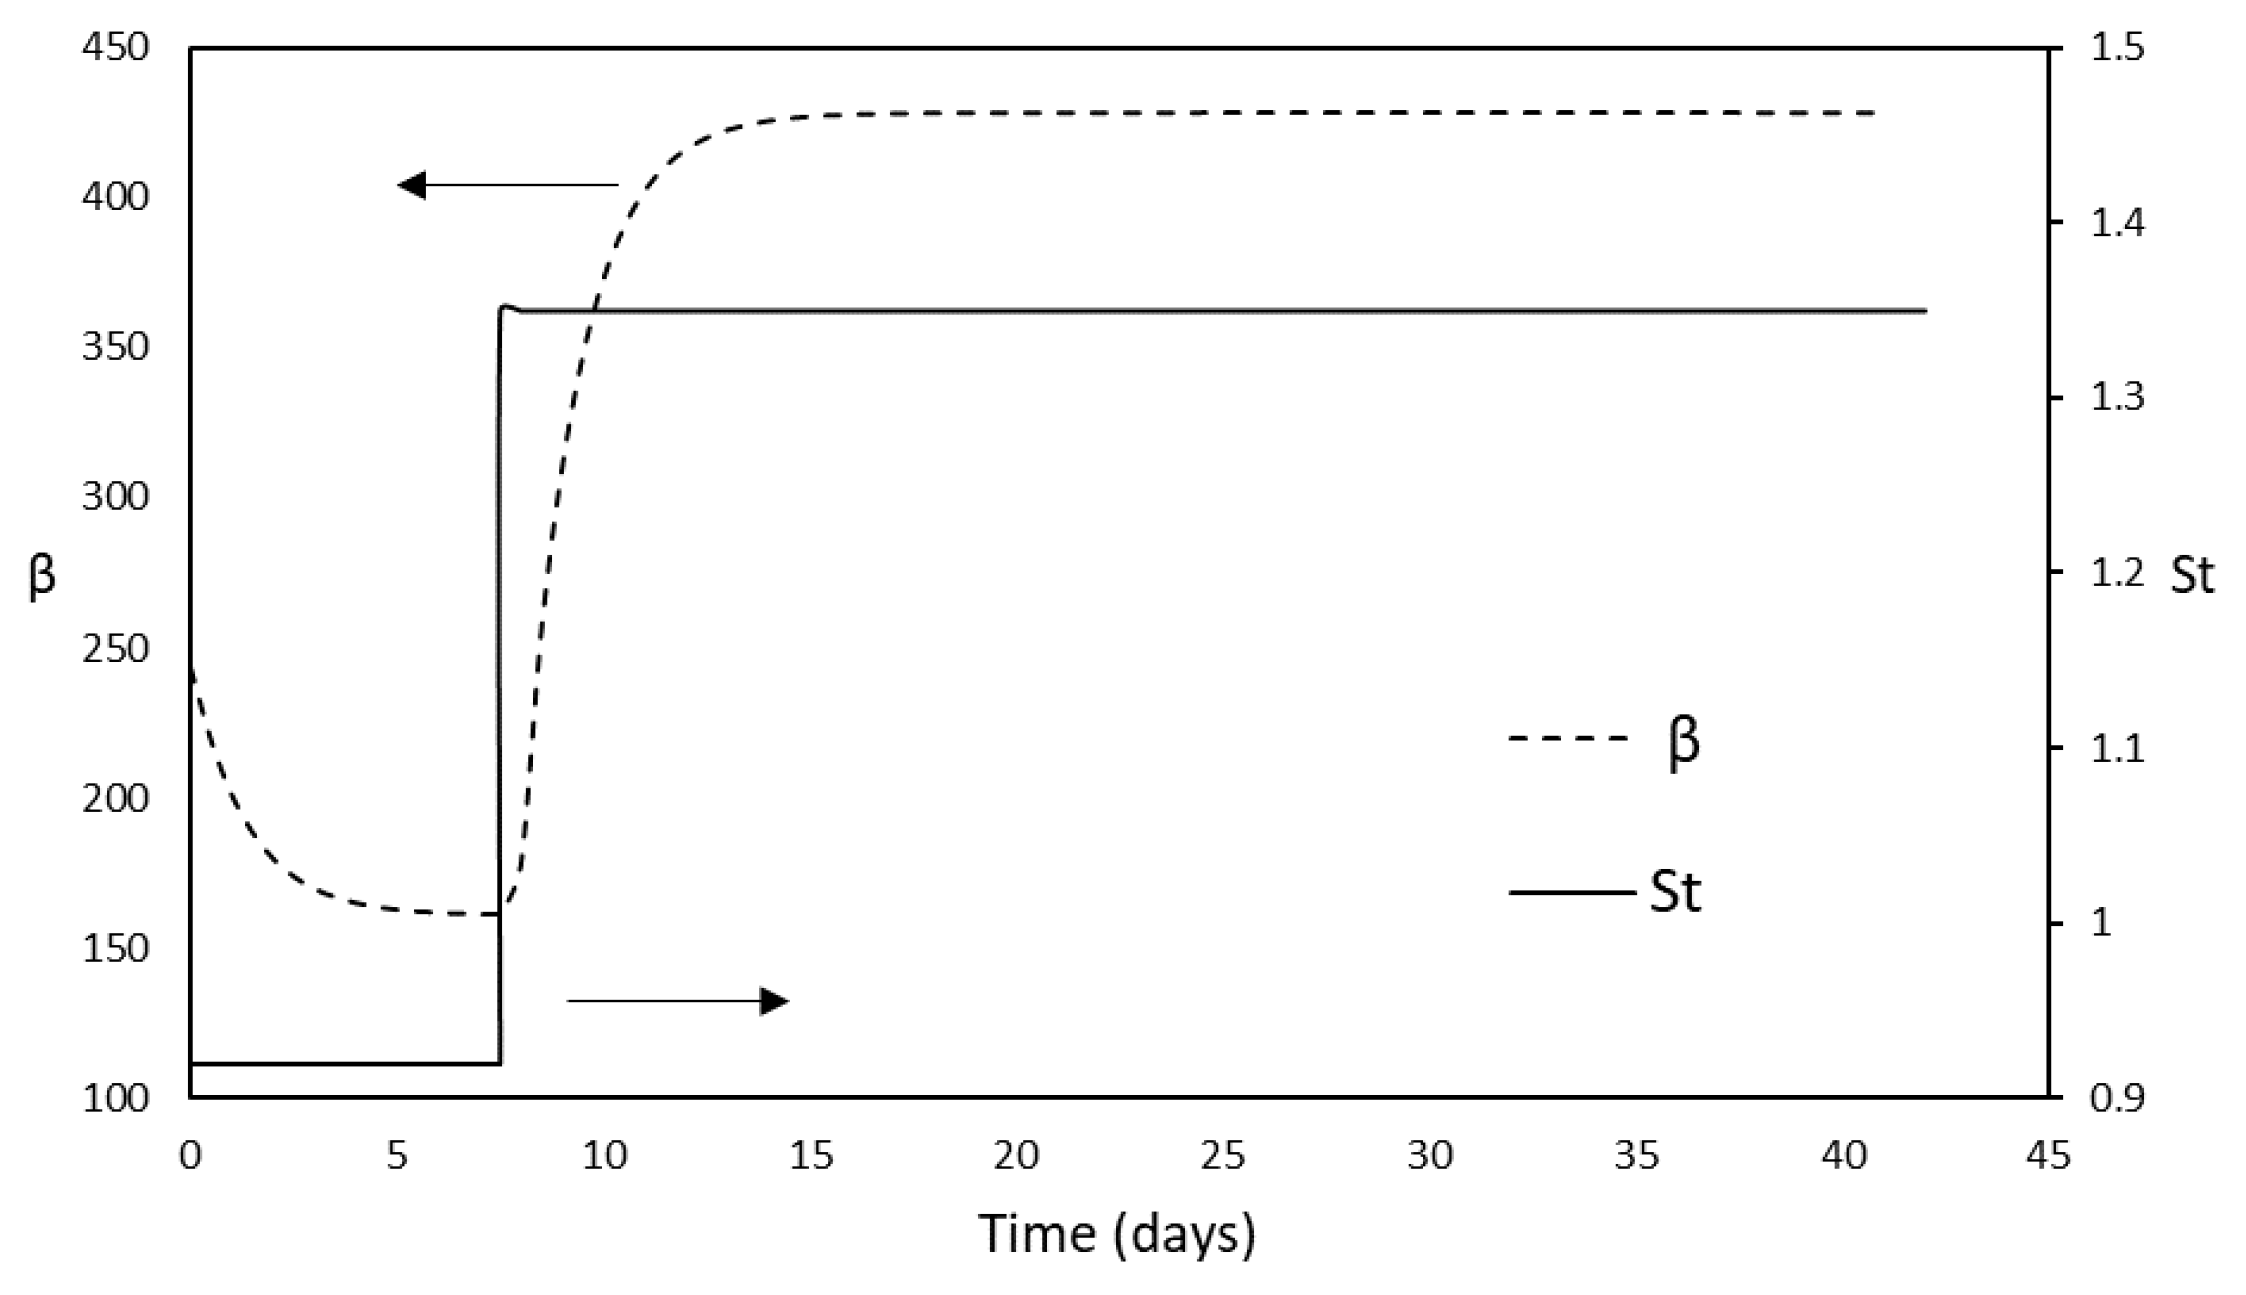
3.2. Bio-Methanation Mode
- = 1.26 g/L
- = 5.03 g/L
- = 6.3 mg/L
4. Conclusions
Author Contributions
Funding
Institutional Review Board Statement
Informed Consent Statement
Data Availability Statement
Conflicts of Interest
Abbreviations
| AD | Anaerobic Digestion |
| BM | Bio-Methanation |
| CSTR | Continuous Stirred Tank Reactor |
| GSTR | Gas Stirred Tank Reactor |
| HRT | Hydraulic Retention Time |
| SCW | Second Cheese Whey |
| VFAs | Volatile Fatty Acids |
| VSS | Volatile Suspended Solids |
| Symbols | |
| D | Dilution (1/d) |
| Di | Diffusivity of component i (cm2/s) |
| Hi | Henry’s constant of component i (mol/L Pa) |
| KH2 | Half saturation constant associated with H2 (µmol/L) |
| KL,H2 | Hydrogen mass transfer coefficient (1/d) |
| KS1 | Half saturation constant associated with S1 (g/L) |
| KS2 | Half saturation constant associated with S2 (mmol/L) |
| KI | Inhibition constant associated with S2 (mmol/L) |
| k1 | Yield for lactose consumption |
| k2 | Yield for VFA formation (mmol/g) |
| k3 | Yield for VFA consumption (mmol/g) |
| k4 | Yield for CO2 formation from acidogenesis (mmol/g) |
| k5 | Yield for CO2 formation from acetoclastic methanogenesis (mmol/g) |
| k6 | Yield for CH4 formation from acetoclastic methanogenesis (mmol/g) |
| k8 | Yield for Methanobacterium thermoautotrophicum growth (gVSS/mol) |
| k9 | Yield for CO2 consumption from idrogenotrophic methanogenesis |
| k10 | Yield for CH4 production idrogenotrophic methanogenesis |
| m | Maintenance coefficient (mol/g d) |
| qmax | Maximum hydrogen specific production rate (mol/g d) |
| St | Stanton dimensionless number |
| S1 | Organic substrate consumed by the biomass X1 (g/L) |
| S2 | Volatile Fatty Acids (mmol/L) |
| VL | Reactor liquid volume (L) |
| X1 | Acidogenic bacteria (g/L) |
| X2 | Acetoclastic methanogen archaea (g/L) |
| X3 | Methanobacterium thermoautotrophicum biomass (g/L) |
| Greek symbols | |
| α | Fraction of the total non-immobilized biomass |
| β | Dimensionless number |
| γ | Biomass fration of the acidogenic microbial population |
| µ1,max | Maximum acidogenic biomass growth rate (1/d) |
| µ2,max | Maximum acetoclastic methanogenic biomass growth rate (1/d) |
References
- Angelidaki, I.; Chen, X.; Cui, J.; Kaparaju, P.; Ellegaard, L. Thermophilic anaerobic digestion of source-sorted organic fraction of household municipal solid waste: Start-up procedure for continuously stirred tank reactor. Water Res. 2006, 40, 2621–2628. [Google Scholar] [CrossRef] [PubMed]
- Mata-Alvarez, J.; Dosta, J.; Romero-Güiza, M.S.; Fonoll, X.; Peces, M.; Astals, S. A critical review on anaerobic co-digestion achievements between 2010 and 2013. Renew. Sustain. Energy Rev. 2014, 36, 412–427. [Google Scholar] [CrossRef]
- Aryal, N.; Kvist, T. Alternative of biogas injection into the Danish gas grid system—A study from demand perspective. ChemEngineering 2018, 2, 43. [Google Scholar] [CrossRef] [Green Version]
- Angelidaki, I.; Treu, L.; Tsapekos, P.; Luo, G.; Campanaro, S.; Wenzel, H.; Kougias, P.G. Biogas upgrading and utilization: Current status and perspectives. Biotechnol. Adv. 2018, 36, 452–466. [Google Scholar] [CrossRef] [PubMed] [Green Version]
- Götz, M.; Lefebvre, J.; Mörs, F.; McDaniel Koch, A.; Graf, F.; Bajohr, S.; Reimert, R.; Kolb, T. Renewable Power-to-Gas: A technological and economic review. Renew. Energy 2016, 85, 1371–1390. [Google Scholar] [CrossRef] [Green Version]
- Luo, G.; Angelidaki, I. Co-digestion of manure and whey for in situ biogas upgrading by the addition of H2: Process performance and microbial insights. Appl. Microbiol. Biotechnol. 2013, 97, 1373–1381. [Google Scholar] [CrossRef]
- Bassani, I.; Kougias, P.G.; Treu, L.; Angelidaki, I. Biogas Upgrading via Hydrogenotrophic Methanogenesis in Two-Stage Continuous Stirred Tank Reactors at Mesophilic and Thermophilic Conditions. Environ. Sci. Technol. 2015, 49, 12585–12593. [Google Scholar] [CrossRef]
- Andrews, J.F.; Graef, S.P. Dynamic Modeling and Simulation of the Anaerobic Digestion Process. Adv. Chem. 1971, 105, 126–162. [Google Scholar]
- Angelidaki, I.; Ellegraard, L.; Aharing, B.K. A Mathematical model for dynamic Simulation of Anaerobic Digestion of Complex Substrates: Focusing on Ammonia Inhibition. Biotechnol. Bioeng. 1993, 42, 159–166. [Google Scholar] [CrossRef] [PubMed]
- Zaher, U.; Pandey, P.; Chen, S. A simple elemental continuity based model application to study the anaerobic microbial activity for the treatment of dairy manure. Appl. Math. Model. 2009, 33, 3553–3564. [Google Scholar] [CrossRef]
- Angelidaki, I.; Ellegaard, L.; Ahring, B.K. A comprehensive model of anaerobic bioconversion of complex substrates to biogas. Biotechnol. Bioeng. 1999, 63, 363–372. [Google Scholar] [CrossRef]
- Batstone, D.J.; Keller, J.; Angelidaki, I.; Kalyuzhnyi, S.V.; Pavlostathis, S.G.; Rozzi, A.; Sanders, W.T.; Siegrist, H.; Vavilin, V.A. The IWA Anaerobic Digestion Model No 1 (ADM1). Water Sci. Technol. 2002, 45, 65–73. [Google Scholar] [CrossRef] [PubMed]
- Lovato, G.; Alvarado-Morales, M.; Kovalovszki, A.; Peprah, M.; Kougias, P.G.; Rodrigues, J.A.D.; Angelidaki, I. In-situ biogas upgrading process: Modeling and simulations aspects. Bioresour. Technol. 2017, 245, 332–341. [Google Scholar] [CrossRef] [PubMed] [Green Version]
- Hill, D.T. A Comprehensive Dynamic Model for Animal Waste Methanogenesis. Trans. ASAE 1982, 25, 1374–1380. [Google Scholar] [CrossRef]
- Bensmann, A.; Hanke-Rauschenbach, R.; Heyer, R.; Kohrs, F.; Benndorf, D.; Reichl, U.; Sundmacher, K. Biological methanation of hydrogen within biogas plants: A model-based feasibility study. Appl. Energy 2014, 134, 413–425. [Google Scholar] [CrossRef]
- Schill, N.; Van Gulik, W.M.; Voisard, D.; Von Stockar, U. Continuous cultures limited by a gaseous substrate: Development of a simple, unstructured mathematical model and experimental verification with Methanobacterium thermoautotrophicum. Biotechnol. Bioeng. 1996, 51, 645–658. [Google Scholar] [CrossRef]
- Lembo, G.; Rosa, S.; Miritana, V.M.; Marone, A.; Massini, G.; Fenice, M.; Signorini, A. Thermophilic anaerobic digestion of second cheese whey: Microbial community response to H2 addition in a partially immobilized anaerobic hybrid reactor. Processes 2021, 9, 43. [Google Scholar] [CrossRef]
- APHA. Standard Methods for Examination of Water and Wastewater; American Public Health Association/American Water Works Association/Water Environment Federation: Washington, DC, USA, 2005. [Google Scholar]
- Bernard, O.; Hadj-Sadok, Z.; Dochain, D.; Genovesi, A.; Steyer, J.P. Dynamical model development and parameter identification for an anaerobic wastewater treatment process. Biotechnol. Bioeng. 2001, 75, 424–438. [Google Scholar] [CrossRef]
- Yang, Q.; Luo, K.; Li, X.M.; Wang, D.B.; Zheng, W.; Zeng, G.M.; Liu, J.J. Enhanced efficiency of biological excess sludge hydrolysis under anaerobic digestion by additional enzymes. Bioresour. Technol. 2010, 101, 2924–2930. [Google Scholar] [CrossRef]
- Fardeau, M.L.; Peillex, J.P.; Belaïch, J.P. Energetics of the growth of Methanobacterium thermoautotrophicum and Methanococcus thermolithotrophicus on ammonium chloride and dinitrogen. Arch. Microbiol. 1987, 148, 128–131. [Google Scholar] [CrossRef]
- Ghosh, S.; Pohland, F.G. Kinetics of substrate assimilation and product formation in anaerobic digestion. J. Water Pollut. Control Fed. 1974, 46, 748–759. [Google Scholar]
- Pauss, A.; Andre, G.; Perrier, M.; Guiot, S.R. Liquid-to-Gas mass transfer in anaerobic processes: Inevitable transfer limitations of methane and hydrogen in the biomethanation process. Appl. Environ. Microbiol. 1990, 56, 1636–1644. [Google Scholar] [CrossRef] [PubMed] [Green Version]
- Sanchez, J.M.; Arijo, S.; Muñoz, M.A.; Moriñigo, M.A.; Borrego, J.J. Microbial colonization of different support materials used to enhance the methanogenic process. Appl. Microbiol. Biotechnol. 1994, 41, 480–486. [Google Scholar] [CrossRef]


| Parameter | Meaning | Unit | Value | Reference |
|---|---|---|---|---|
| µ1,max | Maximum acidogenic biomass growth rate | d−1 | 1.2 | [22] |
| KS1 | Half saturation constant associated with S1 | g L−1 | 0.78 | [19] |
| µ2,max | Maximum acetoclastic methanogenic biomass growth rate | d−1 | 7.1 | [19] |
| KS2 | Half saturation constant associated with S2 | mmol L−1 | 9.28 | [19] |
| KI | Inhibition constant associated with S2 | mmol L−1 | 256 | [19] |
| qmax | Maximum hydrogen specific production rate | mol g−1 d−1 | 21.3 | [16] |
| KH2 | Half saturation constant associated with CLH2 | µmol L−1 | 5.6 | [16] |
| m | maintenance coefficient | mol g−1 d−1 | 1.72 | [16] |
| Gas | Diffusivity Coefficient 1 (Di) (cm2 s−1) (105) | Henry’s Constant 1 (1/Hi) (mol L−1 Pa−1) |
|---|---|---|
| H2 | 4.65 | 7.40 × 10⁻⁹ |
| CH4 | 1.57 | 1.12 × 10⁻⁹ |
| CO2 | 1.98 | 2.70 × 10⁻⁹ |
| Parameter | Meaning | Unit | Value |
|---|---|---|---|
| k8 | Yield for Methanobacterium thermoautotrophicum growth | gVSS/mol | 0.443 |
| k9 | Yield for CO2 consumption | molCO2/molH2 | 0.166 |
| k10 | Yield for CH4 production | molCH4/molH2 | 0.179 |
| Parameter | Value ± SD |
|---|---|
| Biogas flow rate (mL/min) | 30.8 ± 2.1 |
| CH4% v/v | 51.21 ± 1.04 |
| CO2% v/v | 49.28 ± 2.36 |
| Biomass in digestate () (gVSS/L) | 6.3 ± 0.1 |
| Biomass immobilized () (gVSS/L) | 7.51 ± 0.3 |
| Parameter | Meaning | Unit | Value | Reference |
|---|---|---|---|---|
| k1 | Yield for lactose consumption | - | 78.2 | This work |
| k2 | Yield for VFA formation | mmol/g | 116.5 | [19] |
| k3 | Yield for VFA consumption | mmol/g | 29 | This work |
| k4 | Yield for CO2 formation from acidogenesis | mmol/g | 50.6 | [19] |
| k5 | Yield for CO2 formation from acetoclastic methanogenesis | mmol/g | 208 | This work |
| k6 | Yield for CH4 formation from acetoclastic methanogenesis | mmol/g | 275 | This work |
| Recirculation Flowrate (L/min) | |
|---|---|
| 100 | 4 |
| 220 | 6 |
Publisher’s Note: MDPI stays neutral with regard to jurisdictional claims in published maps and institutional affiliations. |
© 2021 by the authors. Licensee MDPI, Basel, Switzerland. This article is an open access article distributed under the terms and conditions of the Creative Commons Attribution (CC BY) license (https://creativecommons.org/licenses/by/4.0/).
Share and Cite
Mazzeo, L.; Signorini, A.; Lembo, G.; Bavasso, I.; Di Palma, L.; Piemonte, V. In Situ Bio-Methanation Modelling of a Randomly Packed Gas Stirred Tank Reactor (GSTR). Processes 2021, 9, 846. https://doi.org/10.3390/pr9050846
Mazzeo L, Signorini A, Lembo G, Bavasso I, Di Palma L, Piemonte V. In Situ Bio-Methanation Modelling of a Randomly Packed Gas Stirred Tank Reactor (GSTR). Processes. 2021; 9(5):846. https://doi.org/10.3390/pr9050846
Chicago/Turabian StyleMazzeo, Leone, Antonella Signorini, Giuseppe Lembo, Irene Bavasso, Luca Di Palma, and Vincenzo Piemonte. 2021. "In Situ Bio-Methanation Modelling of a Randomly Packed Gas Stirred Tank Reactor (GSTR)" Processes 9, no. 5: 846. https://doi.org/10.3390/pr9050846