Article

New Method to Evaluate the Crosslinking Degree of Resin Finishing Agent with Cellulose Using Kjeldahl Method and Arrhenius Formula

1
Key Laboratory of Science and Technology of Eco-Textile, Ministry of Education, Jiangnan University, Wuxi 214122, China
2
Zhejiang Haoyu Science and Technology Co., Ltd., Hangzhou 312300, China
*
Author to whom correspondence should be addressed.
Processes 2021, 9(5), 767; https://doi.org/10.3390/pr9050767
Submission received: 31 March 2021 / Revised: 24 April 2021 / Accepted: 26 April 2021 / Published: 27 April 2021
(This article belongs to the Special Issue Modelling and Optimization of Chemical Reactors)

Abstract

:
In anti-wrinkle finishing, the crosslinking degree of fabric is mainly determined by wrinkle recovery angle, stiffness, and viscosity, these indicators can only reflect the finishing effect from a macro perspective, which cannot reflect whether the crosslinking is sufficient, and it is difficult to quantify the crosslinking degree. In this paper, we combined the Kjeldahl method with the Arrhenius formula and proposed a method to analyze the crosslinking degree of dimethyloldihydroxyethyleneurea (two-dimensional (2D) resin) with cotton cellulose during delayed-cure finishing for the first time. The nitrogen content of completed fabrics during storage was measured by the Kjeldahl method, and the reaction rate equation of the 2D resin and cellulose under normal temperature conditions was calculated. The results show that the nitrogen content is more suitable to indicate the crosslinking degree, and the apparent activation energy was 28.271 kJ/mol and the pre-finger factor was 0.622, which indicated that the 2D resin was prone to cross-linking with cotton fabrics during storage. During long-term storage, the relative errors between the calculated and measured values of the nitrogen content were within ±5%, and the accuracy was higher than the traditional evaluation method. The stability of 2D resins during the storage of delayed-curing finishing was also analyzed through this method.

1. Introduction

In recent years, with improvements in people’s living standards, clothing performance requirements have increased gradually [1]. Clothing, such as shirts and suits, has high requirements in terms of garment shape, and the garment should not wrinkle before completion [2,3,4]. Therefore, a delayed-cure process is often used in garment manufacture, in which the fabric is padded with a crosslinking agent, and curing is undertaken after garment manufacture. Normally, fabric and garment factories are separated; the finishing agent is impregnated in the fabric factory and the garment is completed in the garment factory before being cured and shaped. The sensitized fabric is stored and transported, during which a slow cross-linking reaction occurs between the finishing agents and cellulose. Folds form wrinkles that are not removed easily, which affects the performance of the finished garment [5,6]. Therefore, an increase in the stability of the fabric during storage is of high research value, and delayed curing has become a topic of great interest in the field of anti-wrinkle finishing.
Since 2003, the delayed-cure procedure has been investigated by an increased number of researchers. Yuan [5] studied the delayed-cure processing technology of wool easy-care fabrics. Lam [7] improved the stability of the delayed-cure system by additive addition, such as triethanolamine. Yuan [6] conducted a range of experiments on the storage conditions of delayed-cure durable press finished fabrics. Li [8] highlighted problems in the processing of post-cure anti-wrinkle shirts with pure cotton; resin and cellulose pre-crosslinking during storage affected the shirt quality significantly. Future strategic research directions for delayed curing focuses on improvements in the storage stability of sensitized fabrics and the rapid and accurate evaluation of the crosslinking degree of delayed-cure finishing.
The following methods have been used to evaluate the delayed-cured storage stability of cotton fabrics and to measure the crosslinking degree of cotton fabrics during storage. (1) Cellulose degradation method [9], cellulose can be degraded by cellulase into glucose-based water-soluble sugar. The crosslinking degree can be analyzed by measuring the glucose concentration in the solution. The crosslinking reaction between the finishing agent and cellulose reduces the hydrolysis efficiency of cellulase. (2) Cellulose swelling method [10,11], the finished fabric is treated with a certain concentration of sulfuric acid, the fiber swells, gels, and the fabric stiffens. However, the finishing agent is crosslinked between the cellulose macromolecules, and its network structure will close the amorphous area of the cellulose, hinder the penetration and diffusion of sulfuric acid into the fiber, and affect the swelling and gelation of the fiber. Therefore, measurement of the bending stiffness of the fabric can determine the crosslinking degree between the finishing agent and cellulose. (3) Copper ethylene diamine viscosity method [12], the fabric is dissolved in a defined concentration of copper ethylene diamine solution, and the crosslinking degree between the cellulose and the finishing agent is determined by testing the solution viscosity. However, these three methods only reflect the finishing effect of the fabric from a macro perspective and cannot reflect whether crosslinking occurs or whether the crosslinking agent has completely reacted. (4) Cellulose dyeing method [13,14], after anti-wrinkle finishing, the crosslinking degree of cellulose is analyzed through changes in the hydrophilicity and directness of the cotton fiber. The polarity of the formed crosslinking bond is used to attract the oppositely charged substances, but this adsorption or rejection has no linear quantitative relationship, so it cannot accurately reflect the crosslinking degree. The above detection methods are mostly qualitative or semi-quantitative analysis, with low accuracy, and cannot quickly evaluate the storage stability of the delayed-cured cotton fabrics. Therefore, it is necessary to find an evaluation method to quickly detect the crosslinking degree and the storage stability.
This work uses the reaction kinetics and Arrhenius formulas to predict the storage stability of cotton fabrics after two-dimensional (2D) resin finishing and proposed the Kjeldahl method to evaluate rapidly the storage stability of cotton fabrics after delayed-cure finishing. The Kjeldahl method was used to analyze the crosslinking degree between N-methylol finishing agents and fabrics. The Kjeldahl method provides an accurate method to determine the total nitrogen in a compound or mixture [15,16,17]. Under a catalyst, the sample was digested with concentrated sulfuric acid to convert all organic nitrogen into inorganic ammonium salt (a), and the ammonium salt was converted into ammonia under alkaline conditions (b), which was distilled with steam and absorbed by excess boric acid solution (c). The boric acid solution was titrated by standard hydrochloric acid (d), the nitrogen content of the sample was calculated from the amount of hydrochloric acid (Scheme 1) [17]. The N-methylol finishing agent contains the characteristic element N. The nitrogen content of the finished fabrics that were stored at 40 °C, 50 °C, 60 °C, 70 °C, and 80 °C was tested by the Kjeldahl method. Combined with the Arrhenius formula, the reaction rate equation at different temperatures was calculated as the change in N content. The degree of crosslinking of the cotton fabric after 2D resin finishing was evaluated by the reaction rate equation. The crosslinking mechanism between the 2D resin and cellulose is presented in Scheme 2 The rate equation was used to predict the crosslinking degree under storage at 20 °C and 30 °C, and the accuracy of the equation was verified by combining the actual measured values.

2. Experimental

2.1. Materials and Chemicals

Cotton fabric (100%) with133 warp yarns per 2.54 cm and 100 wefts per 2.54 cm, weighs 133 g/m2, desized, scoured by the supplier (Shandong Ruyi Group Co., Ltd. Jining, China). 2D resin (DM-3511), Catalysis agent (MgCl2·6H2O), Silicone smoothing agent (JF-5097) were purchased from Guangdong Demei Fine Chemical Co., Ltd., Foshan, China. Concentrated sulfuric acid, copper sulfate, potassium sulfate, boric acid, methyl red, bromocresol green, ethanol, hydrochloric acid (HCl), and sodium hydroxide were purchased from Sinopharm Chemical Reagent Co., Ltd., Shanghai, China.

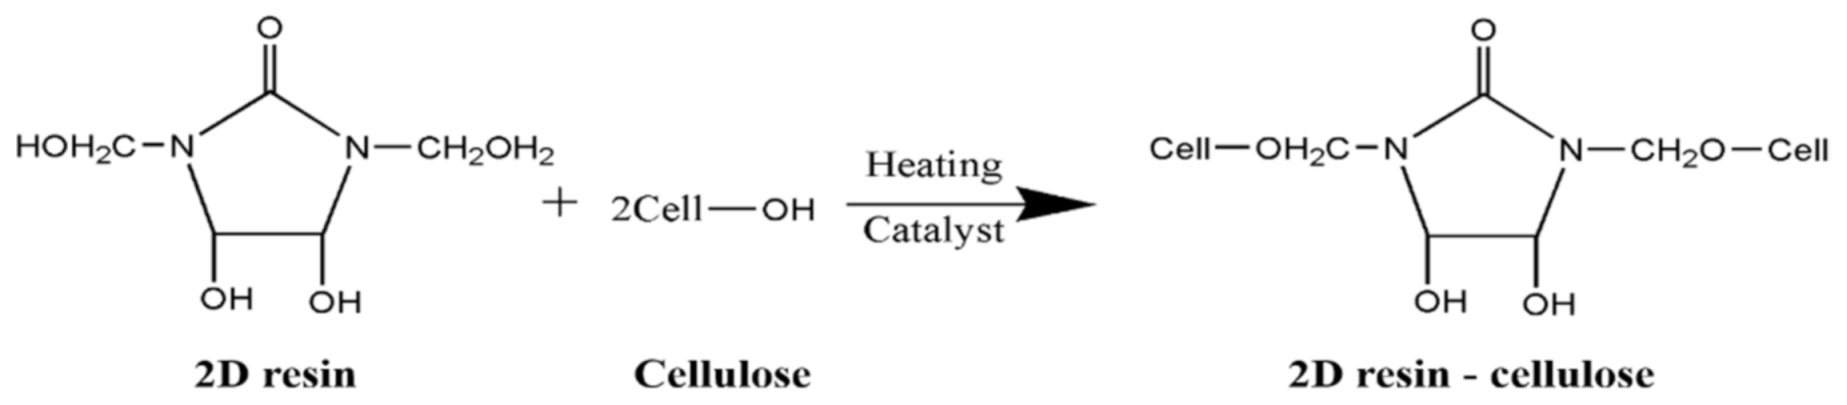
2.2. Finishing Process of 2D Resin

We combined 2D resin (150 g/L), MgCl2·6H2O (30 g/L), and distilled water to form the finishing solution and added a silicone smoothing agent (JF-5097) 5 g/L.
The pro-cure process (pad-dry-cure method) involves the fabric being padded using a two-bowl horizontal laboratory padder (Yalinuo, China) to attain a wet pickup of 90%. Impregnated fabrics were dried at 100 °C for 3 min, then cured at 160 °C for 3.5 min.
The delayed-cure process involves the fabric being padded using a two-bowl horizontal laboratory padder to attain a wet pickup of 80%. Impregnated fabrics were dried at 60 °C (Control the wet pickup of 5~8%). Then, the fabrics were stored in the sealed bag at the corresponding temperature.

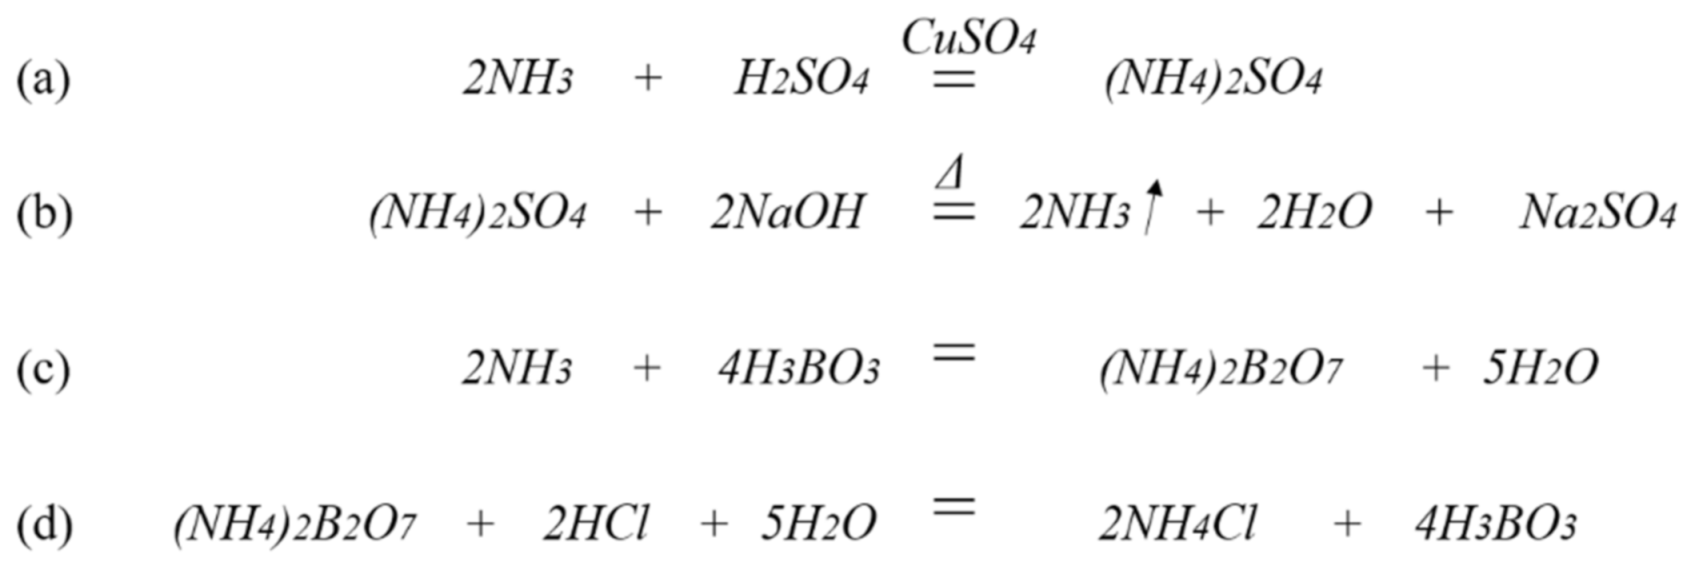
2.3. Nitrogen Content of Finished Fabric (Kjeldahl Method)

The samples were ultrasonically washed with deionized water of pH = 10 for 20 min (to remove the unreacted 2D resin), dried naturally, and equilibrated in a standard environment (the relative temperature is 25 ± 1 °C and relative humidity is 65 ± 2%) for 24 h.
The nitrogen content of the finished fabric was found according to the procedure of Ma et al. with slight modification [17]. We accurately weighed 0.5 g of the finished fabrics, cut them into pieces, and transferred them into a 500 mL nitrogen bottle. We then added 0.2 g copper sulfate, 6 g potassium sulfate, and 20 mL concentrated sulfuric acid to the bottle, transferred the solution to the nitrification furnace (Shanghai Xianjian Instruments Co., Ltd., Shanghai, China) for nitration (for the nitration method, set the first stage temperature to 300 °C, let it react for 20 min, then increase the temperature to 450 °C, continue the reaction until the color of the sample turns blue-green, at which time the nitration is complete). After the sample was completely nitrated, we continued heating for 0.5 h to ensure that the color does not fade. We removed the nitrogen bottle, after cooling, transferred it to the Kjeldahl nitrogen analyzer for distillation, and absorbed it with 0.2% boric acid. After the distillation was complete, titrated with a 0.1 mol/L hydrochloric acid standard solution (the indicator was 1 part of 0.1% methyl red ethanol solution and 5 parts of 0.1% bromocresol green ethanol solution for temporary use) was carried out, and the nitrogen content of the sample was calculated. We performed three parallel experiments and took the average value.
The nitrogen content was calculated according to Equation (1):
X = V 1 V 2 N 0.014 m 10 100 %
where X was the combined nitrogen content of the sample, %. V1 was the consumed volume of the hydrochloric acid standard solution of the sample, mL; V2 was the volume of sulfuric acid or hydrochloric acid standard solution consumed by the reagent blank, mL. N was the equivalent concentration of the standard hydrochloric acid solution and 0.014 was the ratio of 1 mL, 1 N sulfuric acid, or standard Hydrochloric acid solution equivalent to the grams of nitrogen. m was the mass of the sample, g.

2.4. Wrinkle Recovery Angles (WRA)

Wrinkle Recovery Angles were measured according to the AATCC Testing Method 66-2017e “Test Method for Wrinkle Recovery of Woven Fabrics: Recovery Angle”. Six samples in the warp direction (three face-to-face folds, three back-to-back folds) and six samples in the weft direction (three face-to-face folds, three back-to-back folds) were used for a total of 12, each set of three was averaged. Depending on the congruency, all warp readings were averaged and, separately, all weft readings.

3. Results and Discussion

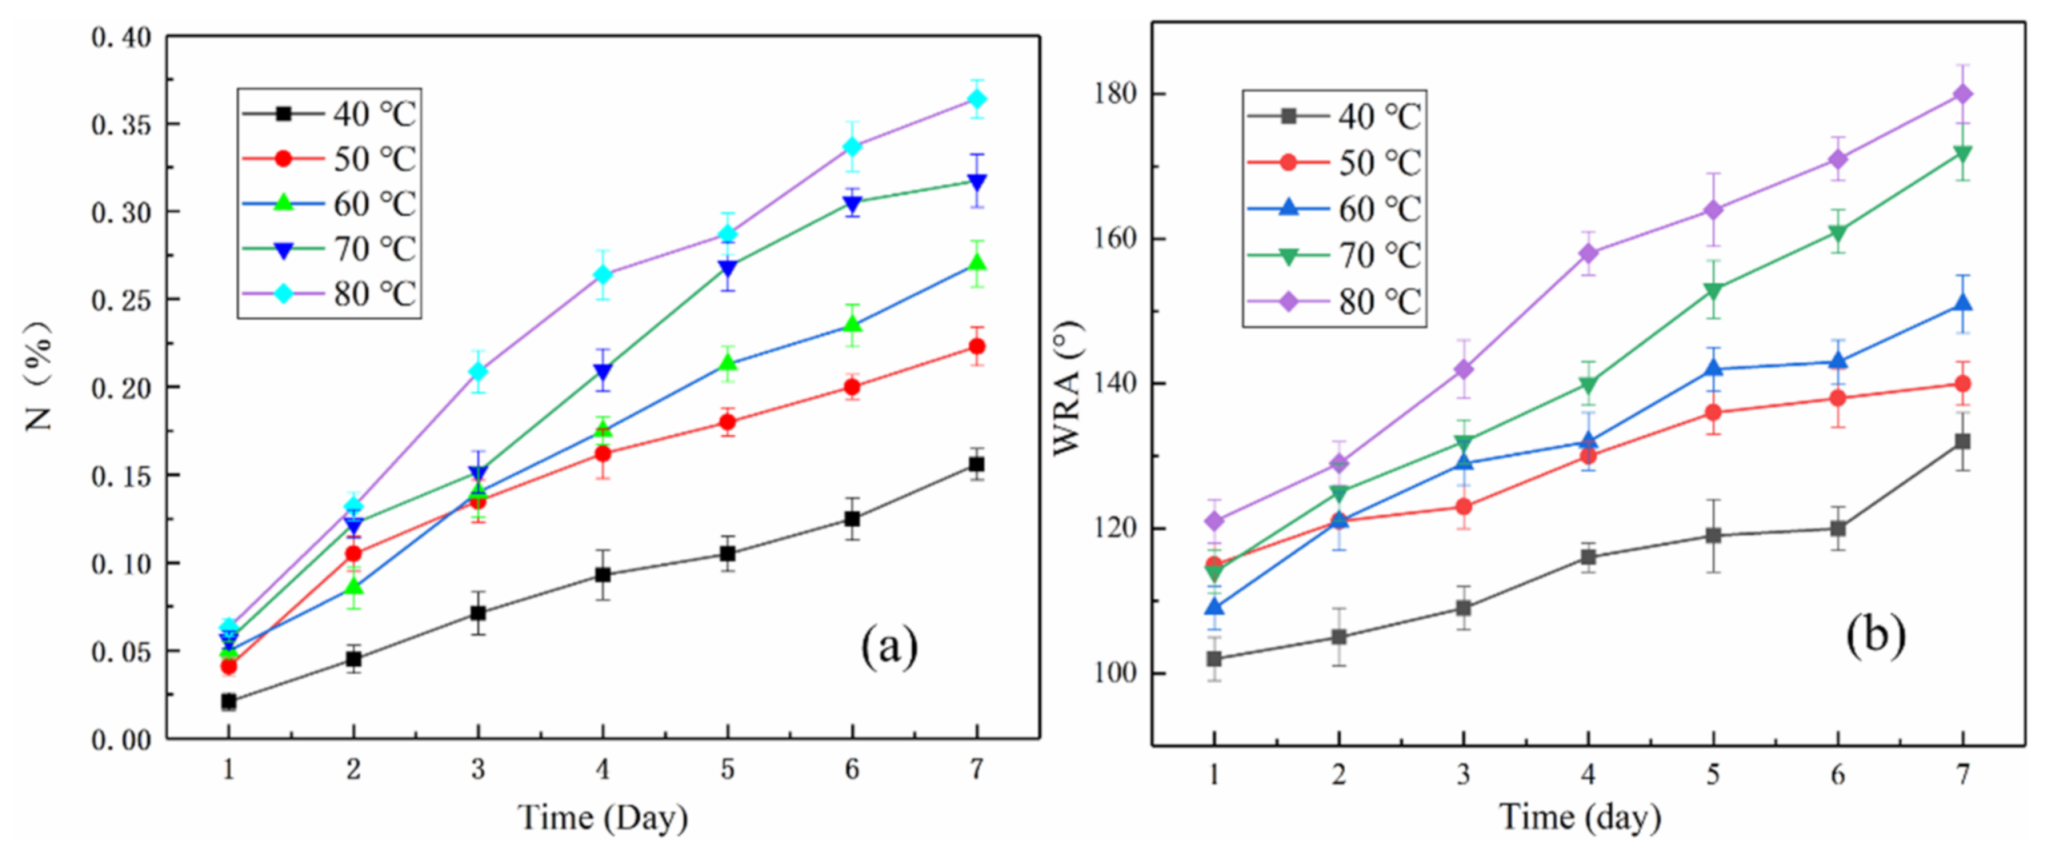
3.1. Nitrogen Content and WRA with Storage Time

The cotton fabrics were finished with 2D resin and stored at 40 °C, 50 °C, 60 °C, 70 °C, and 80 °C. The WRA and nitrogen content of the fabric were tested daily and changes after storage were analyzed for 7 days. The results are shown in Figure 1.
From Figure 1, the changing trend of WRA with storage time is basically consistent with the change of nitrogen content. After storage for 1 day, the nitrogen content of the fabric at different temperatures changed slightly at ~0.05%. After storage for 3 days, the nitrogen contents increased at different temperatures. After storage for 7 days, the nitrogen content of the fabrics stored at 40 °C, 50 °C, 60 °C, 70 °C, and 80 °C was 0.16%, 0.23%, 0.27%, 0.32%, and 0.36%, respectively (The specific data was referred to Tables S1 and S2). The combined nitrogen contents of the cotton fabric were influenced by storage time and temperature. As the storage time and temperature increased, the nitrogen content and WRA increased. When the temperature rises from 40 °C to 80 °C, the increase of WRA becomes larger. At the same temperature, with the extension of storage time, the change of WRA also increases. The changes in nitrogen content and WRA under different storage conditions conformed to the change law of a pseudo-first-order reaction [10,18], which served as the basis for the reaction kinetics and calculation of the Arrhenius formula.

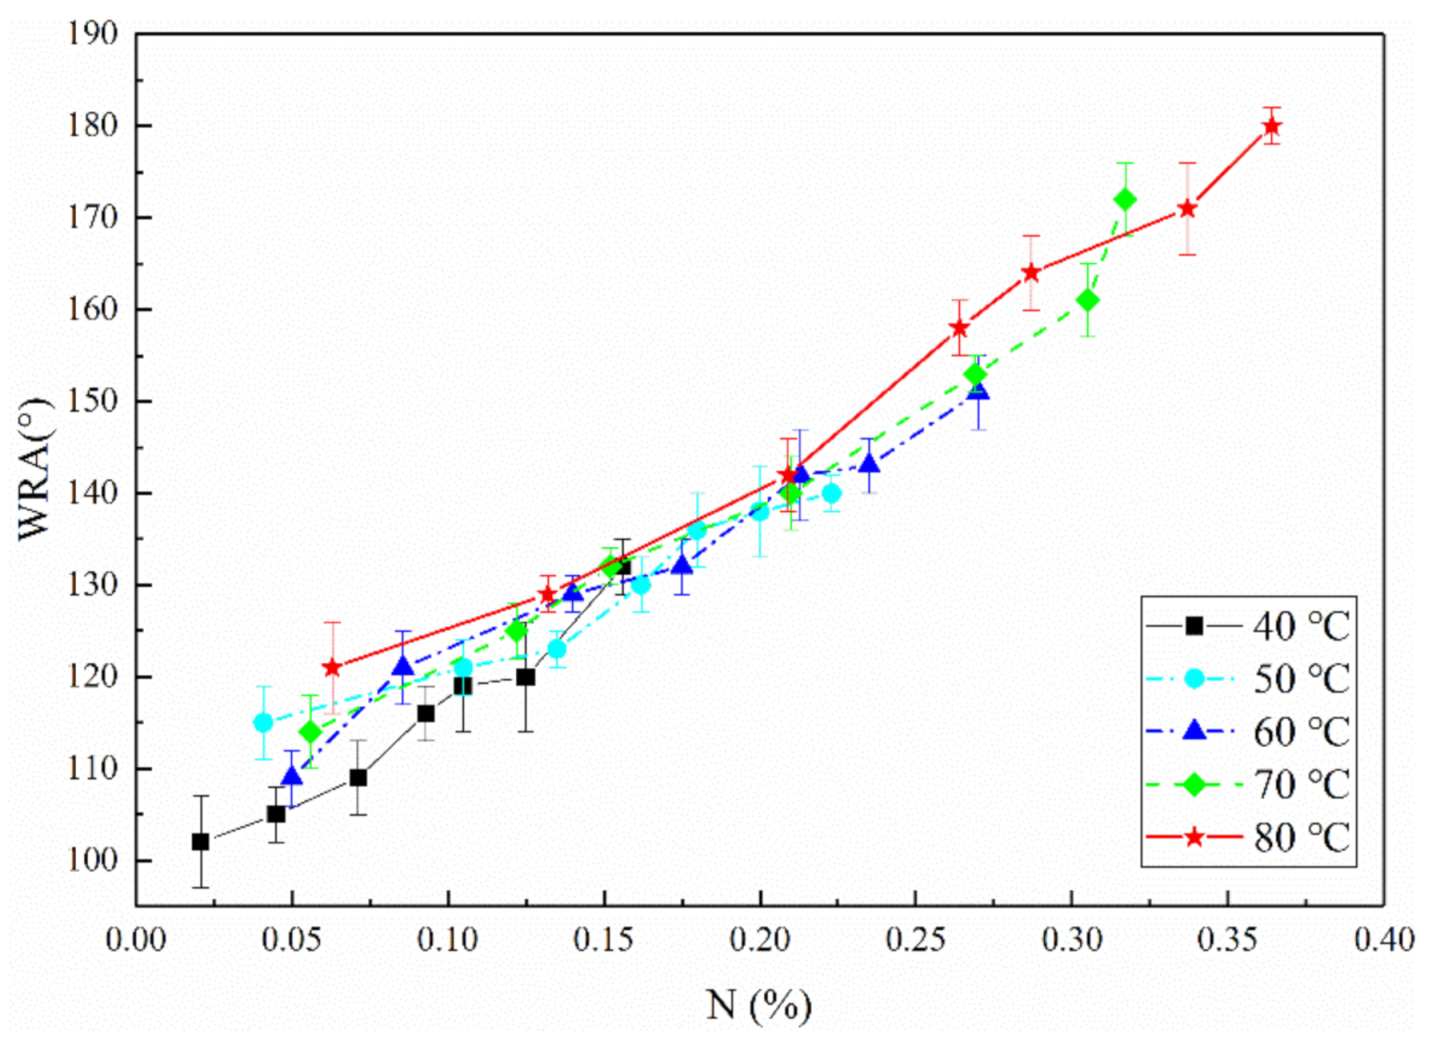
3.2. Relationship between Nitrogen Content and WRA

In order to further analyze the relationship and correlation between nitrogen content and WRA and find the reason why nitrogen content is better than WRA to evaluate storage stability, we analyzed the change of WRA with nitrogen content as shown in Figure 2.
Figure 2 shows that at the same storage temperature, the nitrogen content and WRA increased gradually with an increase in storage time (such as 60 °C). Under different storage temperatures, the nitrogen content increased with an increase in storage temperature, which showed that the crosslinking degree between the 2D resin and cellulose increased, and the WRA of the fabric increased slightly. Overall, as the storage temperature increased, the 2D resin was more likely to crosslink with cellulose, which affected the storage stability of the sensitized fabric.
The curve of WRA and the nitrogen content showed a positive correlation, but the relationship was not linear. The main reason was that crosslinking between the 2D resin and cotton cellulose can occur in many ways [19,20,21]. Among them, single-end crosslinking did not cause a change in WRA, only when both ends were crosslinked with cellulose did the WRA increase. Therefore, the change of nitrogen content before and after finishing was a more feasible approach than the WRA to characterize the crosslinking degree of fabric accurately.

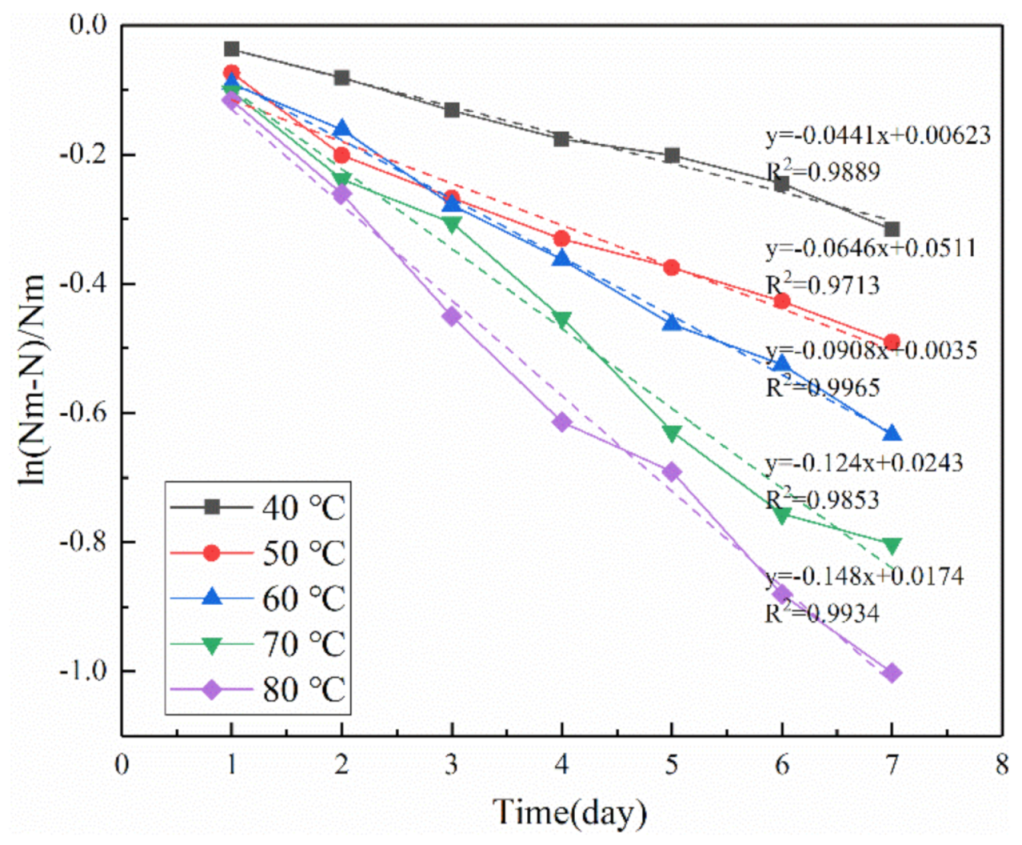
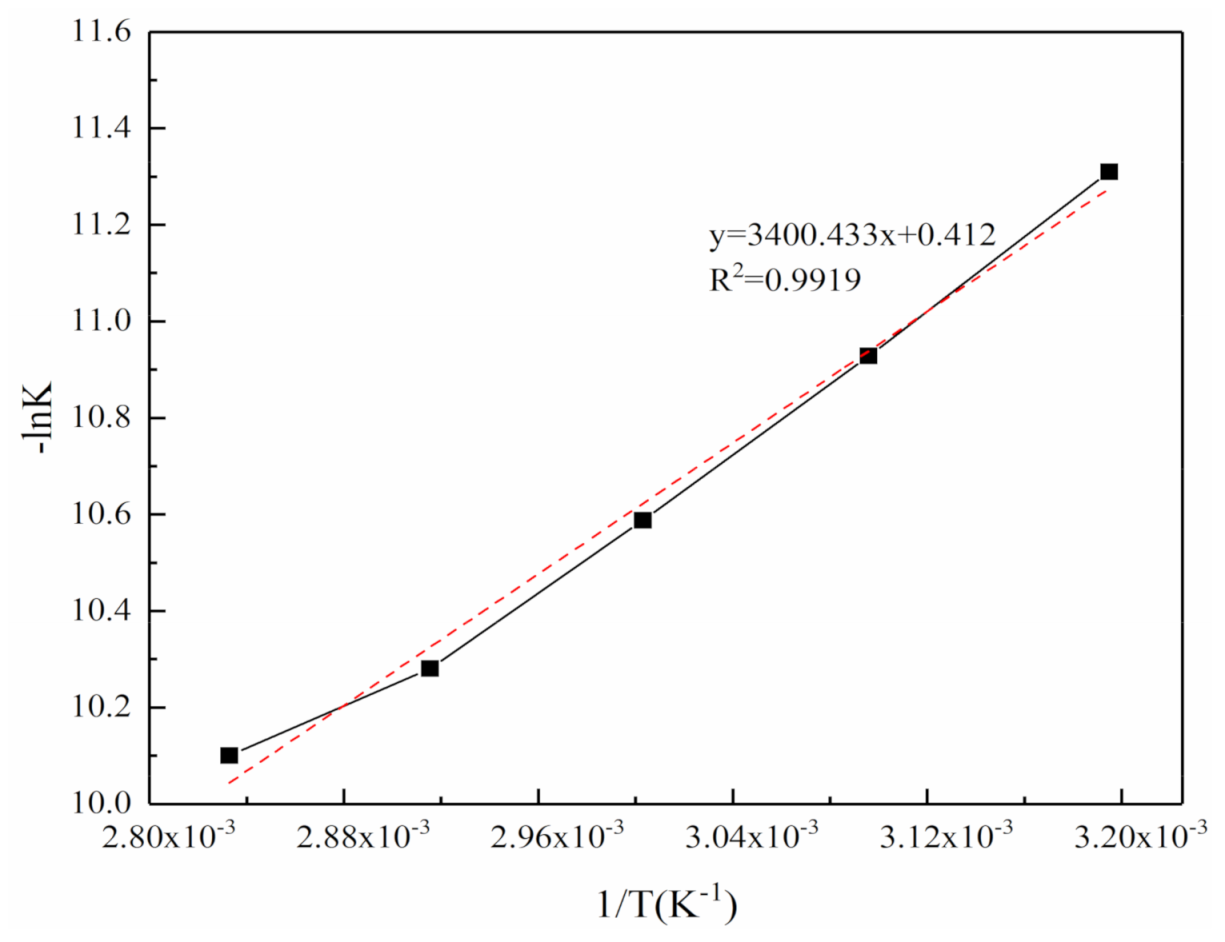
3.3. Calculation of Arrhenius Formula

The Arrhenius equation is an empirical formula for the relationship between the chemical reaction rate constants and the temperature established by Arrhenius of Sweden [22,23,24,25]. The premise of the Arrhenius empirical formula is that the activation energy Ea is a constant that is independent of temperature, which is consistent with the experimental results within a certain temperature range. The cross-linking methods of 2D resin and cellulose at different temperatures were consistent, so the Arrhenius formula was suitable for this cross-linking reaction.
(a) Calculation of the Rate Constant of Reaction. The crosslinking reaction between the 2D resin and cotton fabrics was characterized as a pseudo-first-order reaction. The reaction rate was dependent on the reactant concentration and temperature [26,27]. Under constant-temperature conditions, the equation was as follows:
r = d b 1 d t = k b 1 a b 2 c b 3 d
where r is the reaction rate; k is the reaction rate constant; b1 is the concentration of 2D resin; b2 is the catalyst concentration; b3 is the concentration of hydroxyl groups in the fiber that is involved in the reaction; and a, c, and d is the reaction order. During delayed curing, the catalyst concentration remained unchanged before and after finishing, the fiber hydroxyl concentration remained almost unchanged, the reaction order was 1, and Equation (2) was simplified to Equation (3):
r = d b 1 d t = k b 1
Equation (3) variables were separated and integrated into Equation (4):
ln b 1 ln b 0 = k t
where b0 is the mass concentration at the beginning of the reaction (t = 0), and b1 is the concentration of the finishing agent after storage for time t.
The change in 2D resin concentration during the reaction kinetics study is represented by the change in the nitrogen content of the fabric. b0 and b1 changed by Nm and NmN (Nm was 0.575% and was the nitrogen content of the fabric after padding, drying, and curing. N was the nitrogen content after storage time t). Therefore, Equation (4) was changed to Equation (5):
ln N m N N m = k t
(b) Calculation of Activation Energy. The relationship between reaction rate and temperature is given by the Arrhenius formula [28,29,30], which is expressed as Equation (6):
K = A e E a R T
The integral equation of Equation (6) is as follow:
ln K = ln A E a R T
where K is the reaction rate constant, A is the pre-factor (which is also termed the frequency factor), Ea is the apparent activation energy, R is the molar gas constant (8.314 J/(mol·K)), and T is the absolute temperature (K).
From Equation (5), the reaction rate constant (k) can be calculated by measuring the nitrogen content of the fabric and substituted into Equation (7) to calculate the values of Ea and A. The reaction rate constant of the nitrogen content at any temperature was calculated, compared with the actual measured rate constant of nitrogen content, and the applicability of the Kjeldahl method to evaluate the delayed-cure stability was analyzed.

3.4. Reaction Rate of under Different Storage Conditions

For Equation (5), the nitrogen content at the different storage conditions in Figure 3 was analyzed to obtain the relationship between ln(NmN)/Nm and the storage time with linear fitting. The results are shown in Figure 3.
Figure 3 shows the nitrogen content after storage at 40 °C, 50 °C, 60 °C, 70 °C, and 80 °C. The change of ln(NmN)/Nm was linear with storage time (The specific data was referred to Table S3). The fitting functions are: y = −0.0441x + 0.00623, R2 = 0.9889, y = −0.0646x + 0.0511, R2 = 0.9713, y = −0.0908x + 0.0035, R2 = 0.9965, y = −0.124x + 0.0243, R2 = 0.9853, y = −0.148x + 0.0174, R2 = 0.9934, where y is ln(NmN)/Nm and x is time. The slopes of the fitting functions are the reaction rates (k) under different storage conditions. Linear fitting verified that the cross-linking reaction between the 2D resin and cotton fabric conformed to the pseudo-first-order reaction equation.
The reaction rates (k) after storage at 40 °C, 50 °C, 60 °C, 70 °C, and 80 °C were 0.0441, 0.0646, 0.0908, 0.124, and 0.148, respectively. Because the units of k and t in Equation (5) were (24 h)−1 and °C when substituted into Equation (7), the units needed to be converted to s−1 and thermodynamic temperature T. After the unit conversion, the reaction rate K and 1/T were analyzed, and the fitting equation in Figure 4 was Y = 3400.433X + 0.412, R2 = 0.9919 (The specific data was referred to Table S4). Therefore, combined with Arrhenius Equation (6), the Ea of a 2D resin combined with cotton fabric under these process conditions was 28.271 kJ/mol, and A was 0.662. The activation energy of this finish system was low, which indicated that the 2D resin was prone to cross-linking with cotton fabrics during storage.

3.5. Accuracy of the Reaction Rate Evaluation Method

According to the fitting equation between the temperature (1/T) and reaction rate constant (K) in Figure 4, the calculated reaction rates of cotton fabric treated with a 2D resin that was stored at 20 °C and 30 °C were 0.0217 (24 h)−1 and 0.0333 (24 h)−1, respectively. The measured nitrogen content of the fabric after storage at 20 °C and 30 °C for 5 days was 0.0477% and 0.0713%, respectively. By combining Equation (5), the rate equation of 20 °C and 30 °C was y = −0.0217x + 0.0219 and y = −0.0333x + 0.0314, where y is ln(NmN)/Nm and x is time.
Using these two rate equations, the nitrogen content of the finished fabric after long-term storage at 20 °C and 30 °C was predicted and compared with the measured nitrogen content of the fabric, and the crosslinking degree between the 2D resin and the fabric was analyzed [31]. The calculated and measured values of the nitrogen content, and WRA after long-term storage at 20 °C and 30 °C are shown in Table 1.
The nitrogen content increased with storage time, and the temperature increase also increased the crosslinking degree between the fabric and 2D resin. The nitrogen content of fabrics stored at 20 °C for 30 days reached 0.2542% and accounted for 44.21% of the nitrogen content (Nm = 0.575%) that was applied to the 2D resin on the fabric. The nitrogen content of the fabrics stored at 30 °C for 30 days was 0.3412%, and 59.34% of the nitrogen content applied to the fabric. This result indicated that the crosslinking degree of the 2D resin of cellulose was low, and the finished fabric should be stored at a low temperature for a long time during the delayed curing of the 2D resin. When the finished fabrics were stored for an extended period at 20 °C and 30 °C, the relative error between the calculated and measured values of the nitrogen content was within ±5%, which indicates that the Kjeldahl method and the Arrhenius formula was feasible for analyzing the crosslinking degree between 2D resin and fabric.

4. Conclusions

We analyzed the change in nitrogen content of the fabric before and after storage, combined with the Arrhenius formula, and proposed an accurate method to determine the crosslinking degree of cotton fabric with 2D resin in delayed-cure finishing. Compared with traditional evaluation methods, such as viscosity and WRA, this method had a simpler operation, more accurate data, and could be used for quantitative analysis. There was a linear correlation between the nitrogen content and WRA during storage, which indicated that the crosslinking degree can be predicted by measuring the nitrogen content. Under storage conditions of 40 °C, 50 °C, 60 °C, 70 °C, and 80 °C, the nitrogen content of the finished fabric was changed with time following the pseudo-reaction kinetics. With the Arrhenius formula, the calculated reaction rate equation of 2D resin combined with cotton fabric was Y = 3400.433X + 0.412, R2 = 0.9919, where Y is −lnK, X was 1/T. The apparent activation energy Ea was 28.271 kJ/mol and the pre-finger factor A was 0. This equation was used to analyze the nitrogen content of the finished fabric after long-term storage at 20 °C and 30 °C, and the relative error between the calculated and the experimental value was within ±5%, which showed that this method was suitable to analyze the degree of cross-linking between the fabric and 2D resin in delayed-cure finishing accurately. This analysis method is only applicable to the delayed curing of anti-wrinkle finishing with agents containing nitrogen, whether it can be applied to other anti-wrinkle finishing methods remains to be verified.

Supplementary Materials

The following are available online at https://www.mdpi.com/article/10.3390/pr9050767/s1, Table S1: Nitrogen content with storage time under different storage temperatures, Table S2: WRA (b) with storage time under different storage temperatures, Table S3: ln(NmN)/Nm with storage time under different storage temperatures, Table S4: 1/T and −lnK under different storage temperatures.

Author Contributions

Conceptualization, X.F. and J.Z.; Software, S.X.; Writing—original draft preparation, J.L.; Writing—review and editing, D.W. All authors have read and agreed to the published version of the manuscript.

Funding

This research received no external funding.

Institutional Review Board Statement

Not applicable.

Informed Consent Statement

Not applicable.

Acknowledgments

This work was financially supported by the National Key R&D Program of China (2017YFB0309202) and the Postgraduate Research & Practice Innovation Program of Jiangsu Provence (1062050205198056).

Conflicts of Interest

The authors declare no conflict of interest.

References

  1. Chakraborty, J.N.; Goyal, A.; Jain, S.; Jindal, C. Performance of durable press finish on cotton with modified DMDHEU, citric acid, BTCA and maleic acid. Tekstilec 2018, 61, 289–297. [Google Scholar] [CrossRef]
  2. Chang, H.-L.; Chen, C.-C. Crosslinking of Cotton with DMDMDHEU in the Presence of Sodium Chloride. Text. Res. J. 2016, 66, 803–809. [Google Scholar] [CrossRef]
  3. Dehabadi, V.A.; Buschmann, H.J.; Gutmann, J.S. Durable press finishing of cotton fabrics: An overview. Text. Res. J. 2013, 83, 1974–1995. [Google Scholar] [CrossRef]
  4. Harifi, T.; Montazer, M. Past, present and future prospects of cotton cross-linking: New insight into nano particles. Carbohydr. Polym. 2012, 88, 1125–1140. [Google Scholar] [CrossRef]
  5. Yuan, H.; Zhou, X.; Zhang, Y.; Zhou, L. Application of non-formaldehyde reaction system to post cure durable press finish. Dye Finish. 2017, 43, 35–38. [Google Scholar]
  6. Yuan, H.; Zhou, X.; Zhang, Y.; Zhou, L. Storage conditions of sensitized fabrics for post cure durable press finish. Dye Finish. 2016, 16, 16–20. [Google Scholar]
  7. Lam, Y.L.; Kan, C.W.; Yuen, C.W. Wrinkle-resistant finishing with dimethyloldihydroxyethyleneurea (DMDHEU)—The effect of co-catalyst. Text. Res. J. 2011, 81, 1419–1426. [Google Scholar] [CrossRef]
  8. Li, B.; Dong, Y.; Wang, P.; Cui, G. Release behavior and kinetic evaluation of formaldehyde from cotton clothing fabrics finished with DMDHEU-based durable press agents in water and synthetic sweat solution. Text. Res. J. 2015, 86, 1738–1749. [Google Scholar] [CrossRef]
  9. Yasin, S.; Behary, N.; Perwuelz, A.; Guan, J.P.; Chen, G.Q. Degradation Kinetics of Organophosphorus Flame Retardant from Cotton Fabric. Appl. Mech. Mater. 2017, 864, 54–58. [Google Scholar] [CrossRef]
  10. Ziifle, H.M.; Benerito, R.R.; Gonzales, E.J.; Berni, R.J. Kinetics of the Reactions of Ethyleneurea Derivatives with Cotton Cellulose. Text. Res. J. 2016, 38, 925–930. [Google Scholar] [CrossRef]
  11. Welo, L.A.; Ziifle, H.M.; Loeb, L. Swelling Capacities of Fibers in Water. Text. Res. J. 2016, 22, 254–261. [Google Scholar] [CrossRef]
  12. Reeves, W.A.; Drake, G.L., Jr.; McMillan, O.J., Jr.; Guthrie, J.D. Insolubility in Cuprammonium Hydroxide as a Means of Detecting Crosslinking in Chemically Modified Cotton. Text. Res. J. 2016, 25, 41–46. [Google Scholar] [CrossRef]
  13. Li, S.; Freeman, H.S.; Boyter, H. One-Step Pad Dyeing and DP Finishing of Cotton: Part 2. Mechanism of Dye Fixation Using DMDHEU. Aatcc J. Res. 2015, 2, 13–20. [Google Scholar] [CrossRef]
  14. Mohsin, M.; Rasheed, A.; Farooq, A.; Ashraf, M.; Shah, A. Environment friendly finishing of sulphur, vat, direct and reactive dyed cotton fabric. J. Clean. Prod. 2013, 53, 341–347. [Google Scholar] [CrossRef]
  15. Terrero, M.A.; Faz, N.; Ondoo, S.; Muoz, M.n. Impacts of Raw and Purified Pig Slurry on Carbon and Nitrogen Contents in Mediterranean Agricultural Soil—ScienceDirect. Soil Manag. Clim. Chang. 2018, 207–219. [Google Scholar]
  16. Kavvadias, V.; Papadopoulou, M.; Vavoulidou, E.; Theocharopoulos, S.; Psarras, G. Effects of Carbon Inputs on Chemical and Microbial Properties of Soil in Irrigated and Rainfed Olive Groves. Soil Manag. Clim. Chang. 2018, 137–150. [Google Scholar]
  17. Fadeeva, V.; Tikhova, V.; Nikulicheva, O. Elemental analysis of organic compounds with the use of automated CHNS analyzers. J. Anal. Chem. 2008, 63, 1094–1106. [Google Scholar] [CrossRef]
  18. Poon, C.; Kan, C. Optimization Of Wrinkle Resistant Finishing With Dimethyloldihydroxyethyleneurea (Dmdheu) Using Titanium Dioxide As Co-Catalyst. Cellul. Chem. Technol. 2016, 50, 889–894. [Google Scholar]
  19. Meyer, U.; Müller, K.; Zollinger, H. The Temperature Dependence of the Rate of Crosslinking with Formaldehyde and of the Hydrolysis of Cotton Cellulose. Text. Res. J. 1976, 46, 880–886. [Google Scholar] [CrossRef]
  20. Madan, G.; Patel, S.; Baddi, N.; Mehta, P. Physical Chemistry of Crosslinking: Part I: Thermodynamics of Cellulose in Aqueous Solution of Crosslinking Agents. Text. Res. J. 1976, 46, 329–342. [Google Scholar] [CrossRef]
  21. Haule, L.V.; Carr, C.M.; Rigout, M. Investigation into the removal of an easy-care crosslinking agent from cotton and the subsequent regeneration of lyocell-type fibres. Cellulose 2014, 21, 2147–2156. [Google Scholar] [CrossRef] [Green Version]
  22. Ellery, A.J.; Simpson, M.J.; Mccue, S.W.; Baker, R.E. Characterizing transport through a crowded environment with different obstacle sizes. J. Chem. Phys. 2014, 140, 054108. [Google Scholar] [CrossRef] [Green Version]
  23. Fu, Y.; Michopoulos, J.; Song, J.H. Coarse-grained molecular dynamics simulations of epoxy resin during the curing process. Comput. Mater. Sci. 2015, 107, 24–32. [Google Scholar] [CrossRef]
  24. Fu, Y.; Song, J.H. Heat flux expressions that satisfy the conservation laws in atomistic system involving multibody potentials. J. Comput. Phys. 2015, 294, 191–207. [Google Scholar] [CrossRef]
  25. Fu, Y.; Michopoulos, J.G.; Song, J.H. On Investigating the Thermomechanical Properties of Cross-linked Epoxy Via Molecular Dynamics Analysis. Microscale Thermophys. Eng. 2017, 21, 8–25. [Google Scholar] [CrossRef]
  26. Chen, J.C.; Chen, C.C. Crosslinking of Cotton Cellulose with Pre-reacted DMDMDHEU-AA. Part I: Physical Properties of Treated Fabrics. Text. Res. J. 2001, 71, 514–518. [Google Scholar] [CrossRef]
  27. Chen, J.C. Crosslinking of Cotton Cellulose with Pre-reacted DMDMDHEU-AA Part II: Reaction Kinetics. Text. Res. J. 2001, 71, 609–612. [Google Scholar] [CrossRef]
  28. Chen, J.C.; Yao, W.H.; Chen, C.H.; Chen, C.C. Dyeing kinetics from a finite bath of direct dyes on DMDHEU-AA crosslinked cotton. Text. Res. J. 2002, 72, 55–60. [Google Scholar]
  29. Chen, J.C.; Chiu, S.T.; Chen, C.C. Crosslinking of sulfonated cotton cellulose. III. Agent distribution and reaction kinetics. Text. Res. J. 2000, 70, 386–390. [Google Scholar] [CrossRef]
  30. Han, T.Y.; Chen, C.C. Crosslinking of Sulfonated Cotton Cellulose:Part I: Crosslinking and Physical Properties of DMDHEU-Treated Fabrics. Text. Res. J. 1998, 68, 115–120. [Google Scholar] [CrossRef]
  31. Chen, J.; Yao, W.; Chen, C.; Chen, C. Degree of crosslinked cotton cellulose with prereacted DMDHEU-AA. J. Appl. Polym. Sci. 2001, 82, 1580–1586. [Google Scholar] [CrossRef]
Scheme 1. Reaction mechanism of the Kjeldahl method.
Processes 09 00767 sch001
Scheme 2. Proposed crosslinking mechanism between 2D resin and cellulose.
Processes 09 00767 sch002
Figure 1. Nitrogen content (a) and WRA (b) with storage time under different storage temperatures.
Processes 09 00767 g001
Figure 2. Relationship between nitrogen content and WRA.
Processes 09 00767 g002
Figure 3. Variation Fitting curves of ln(NmN)/Nm with storage time.
Processes 09 00767 g003
Figure 4. Fitting curves of −lnK and 1/T.
Processes 09 00767 g004
Table 1. Calculated and measured values of nitrogen content after long-term storage.
Storage ConditionsNitrogen Content (%)Crosslinking Degree (%)Relative Error
(%)
WRA (°)
Calculated
(CV)
Measured
(MV)
Calculated
(CV)
Measured
(MV)
20 °C10 Days0.10190.097217.7616.90−4.61118 ± 5
15 Days0.15060.157426.1927.374.52130 ± 3
20 Days0.19420.188733.7732.82−2.83140 ± 4
30 Days0.24840.254243.2044.212.33145 ± 4
30 °C10 Days0.14860.153425.8426.683.23127 ± 3
15 Days0.21400.203637.2235.41−4.86139 ± 6
20 Days0.26930.274546.8347.741.93158 ± 4
30 Days0.35590.341261.9059.34−4.13176 ± 5
Publisher’s Note: MDPI stays neutral with regard to jurisdictional claims in published maps and institutional affiliations.

