Author Contributions
Conceptualization, W.W. and Y.L.; methodology, M.K.O. and S.Y.; software, M.K.O.; validation, J.L. and B.Z.; formal analysis, W.W., Y.L., M.K.O., and B.Z.; writing—original draft preparation, M.K.O.; writing—review and editing, M.K.O. and W.W.; and project administration, S.Y. All authors have read and agreed to the published version of the manuscript.
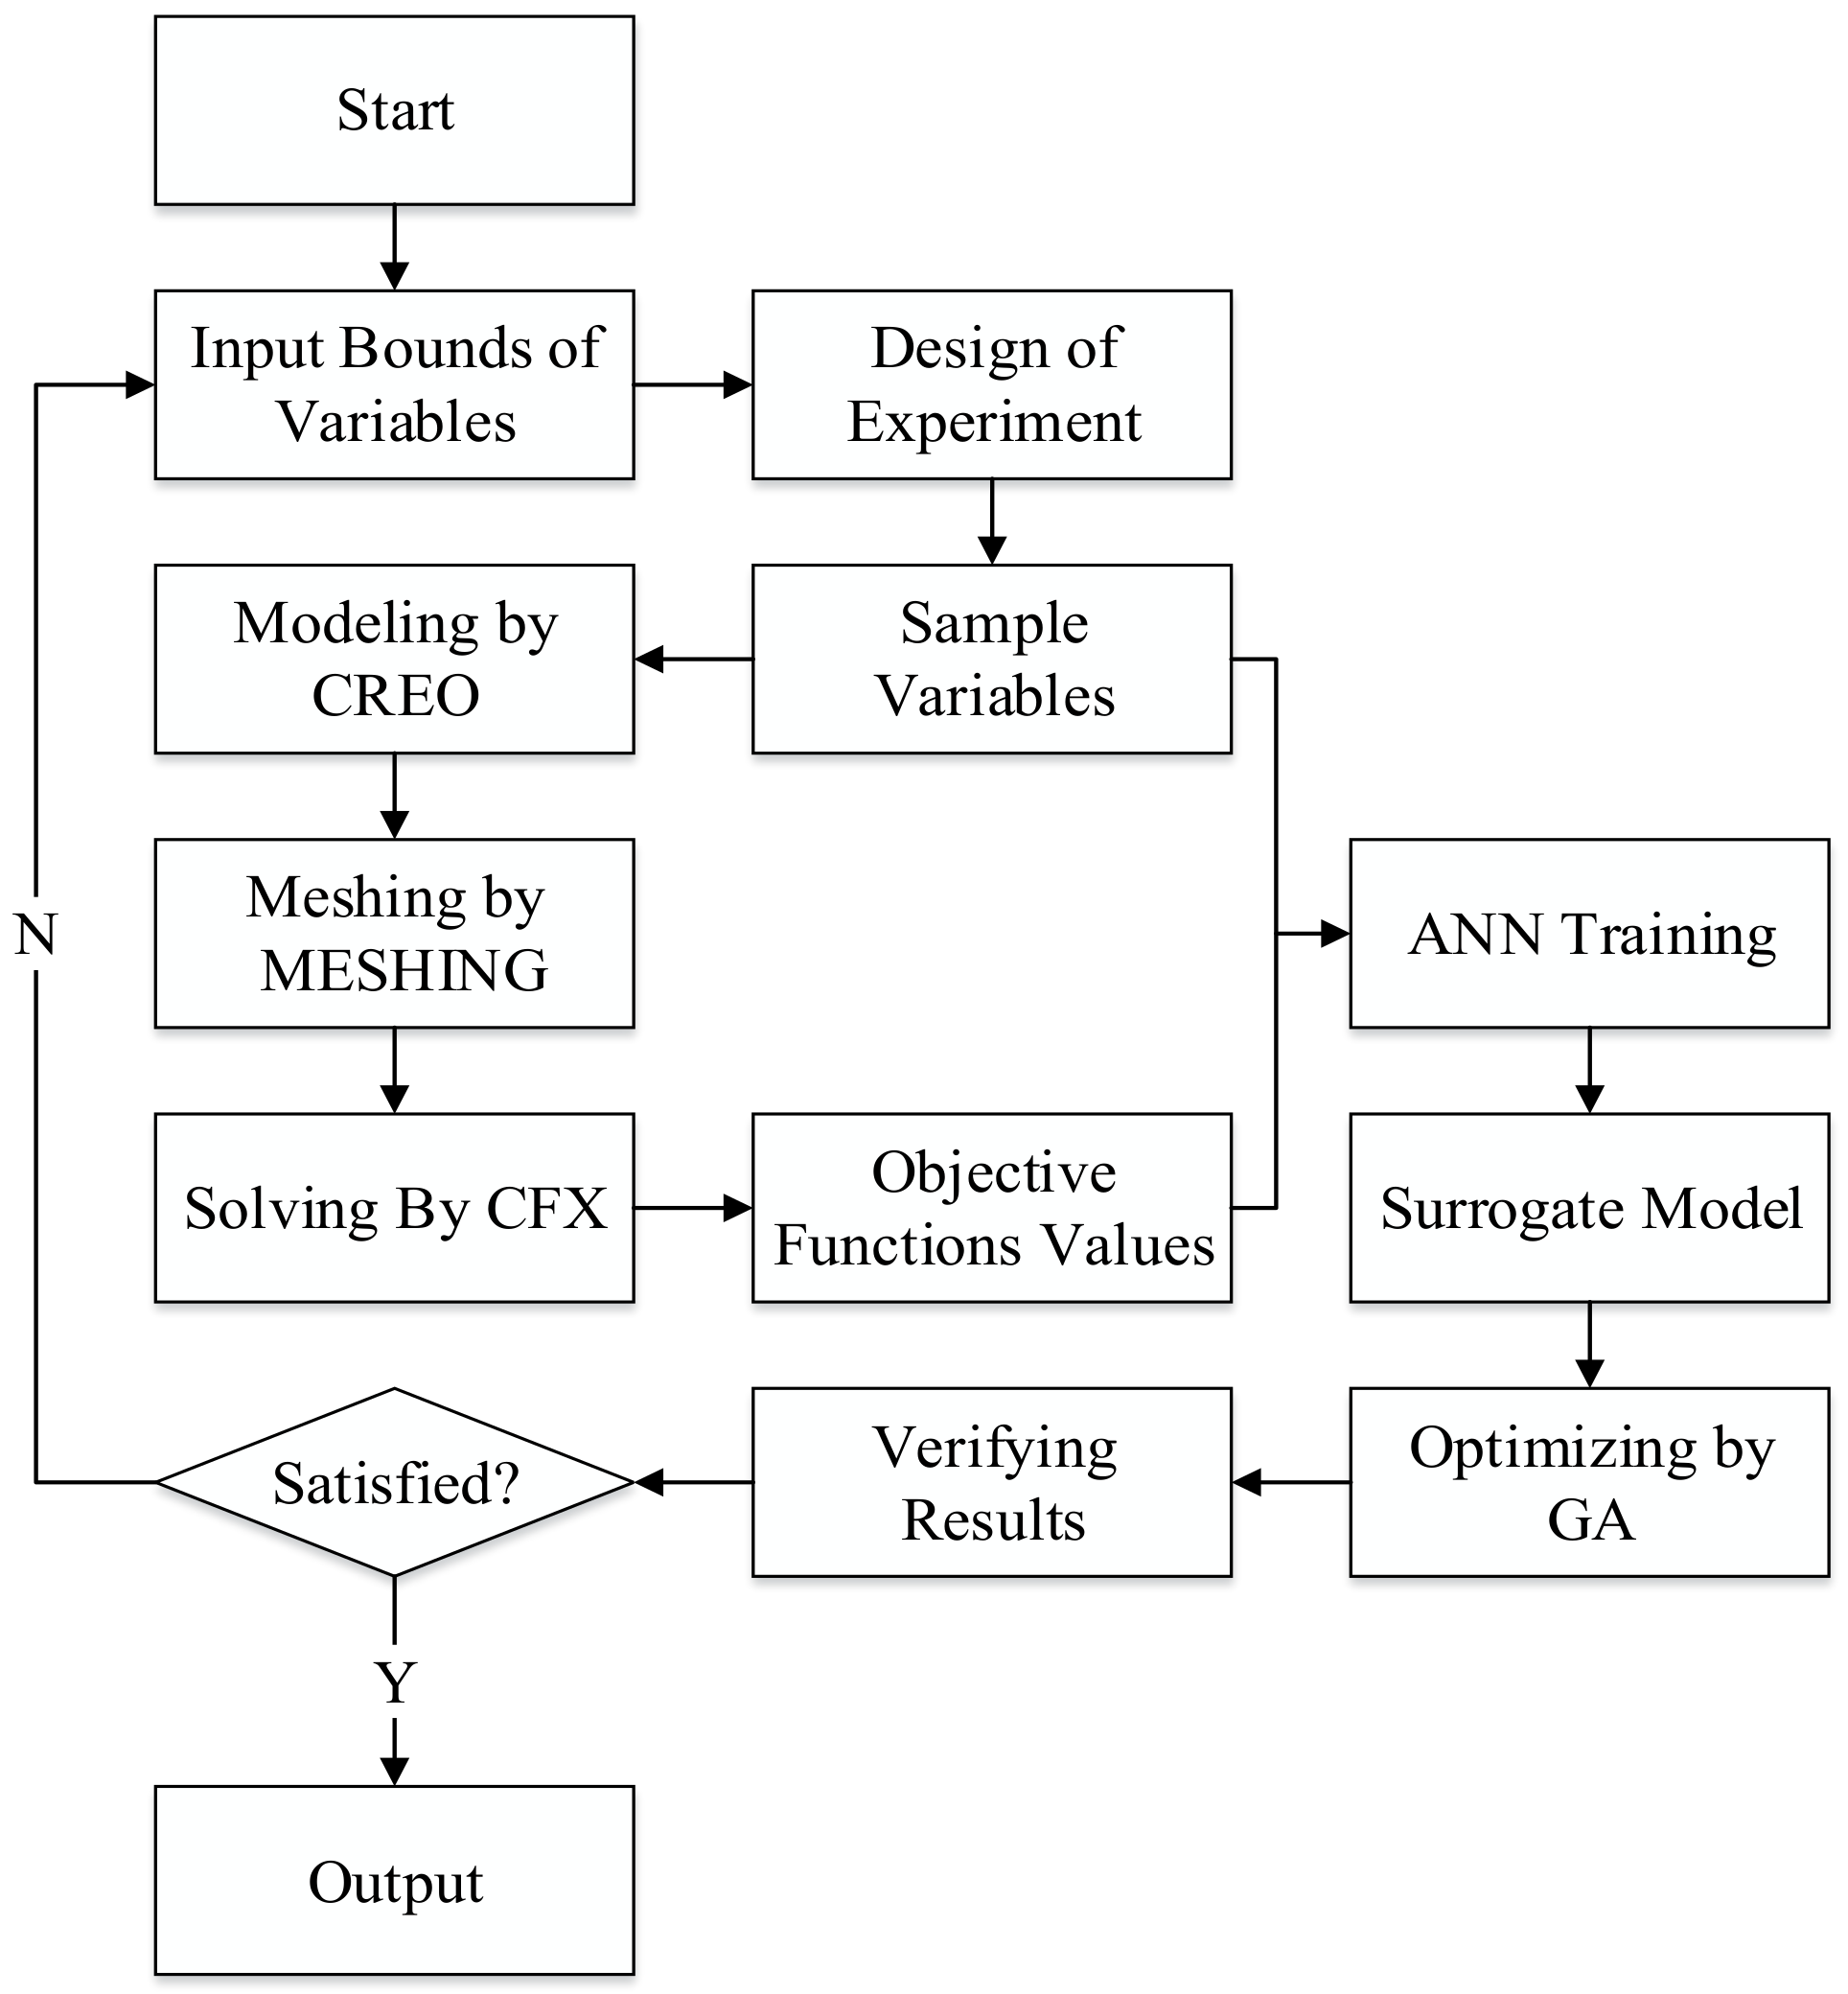
Figure 1.
Flowchart of optimization process.
Figure 1.
Flowchart of optimization process.
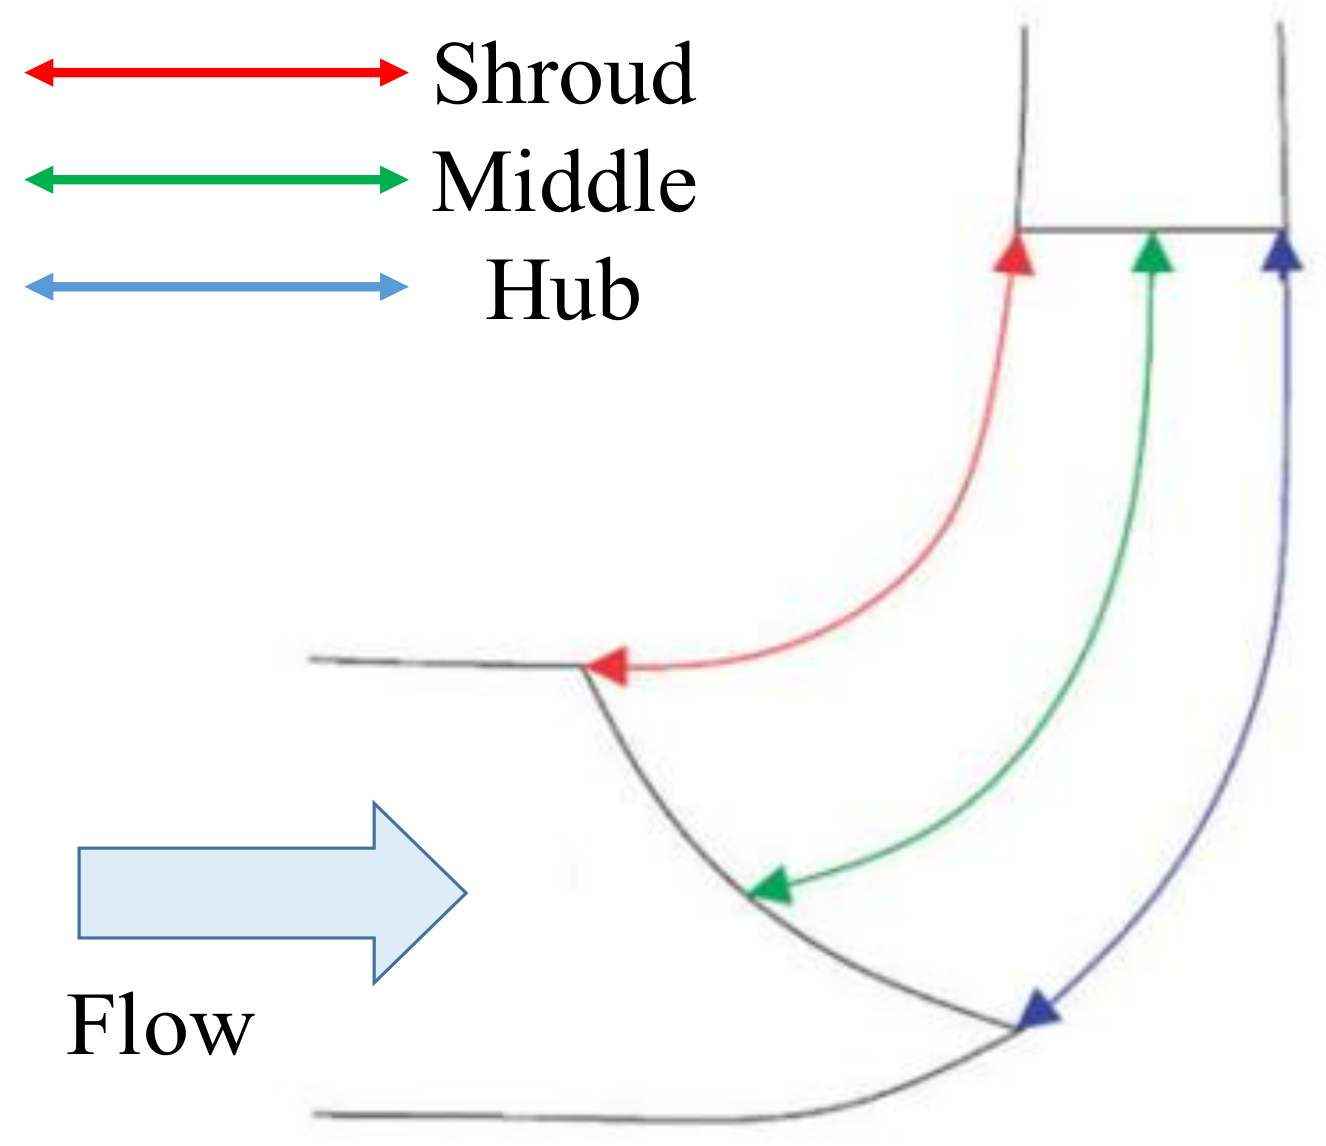
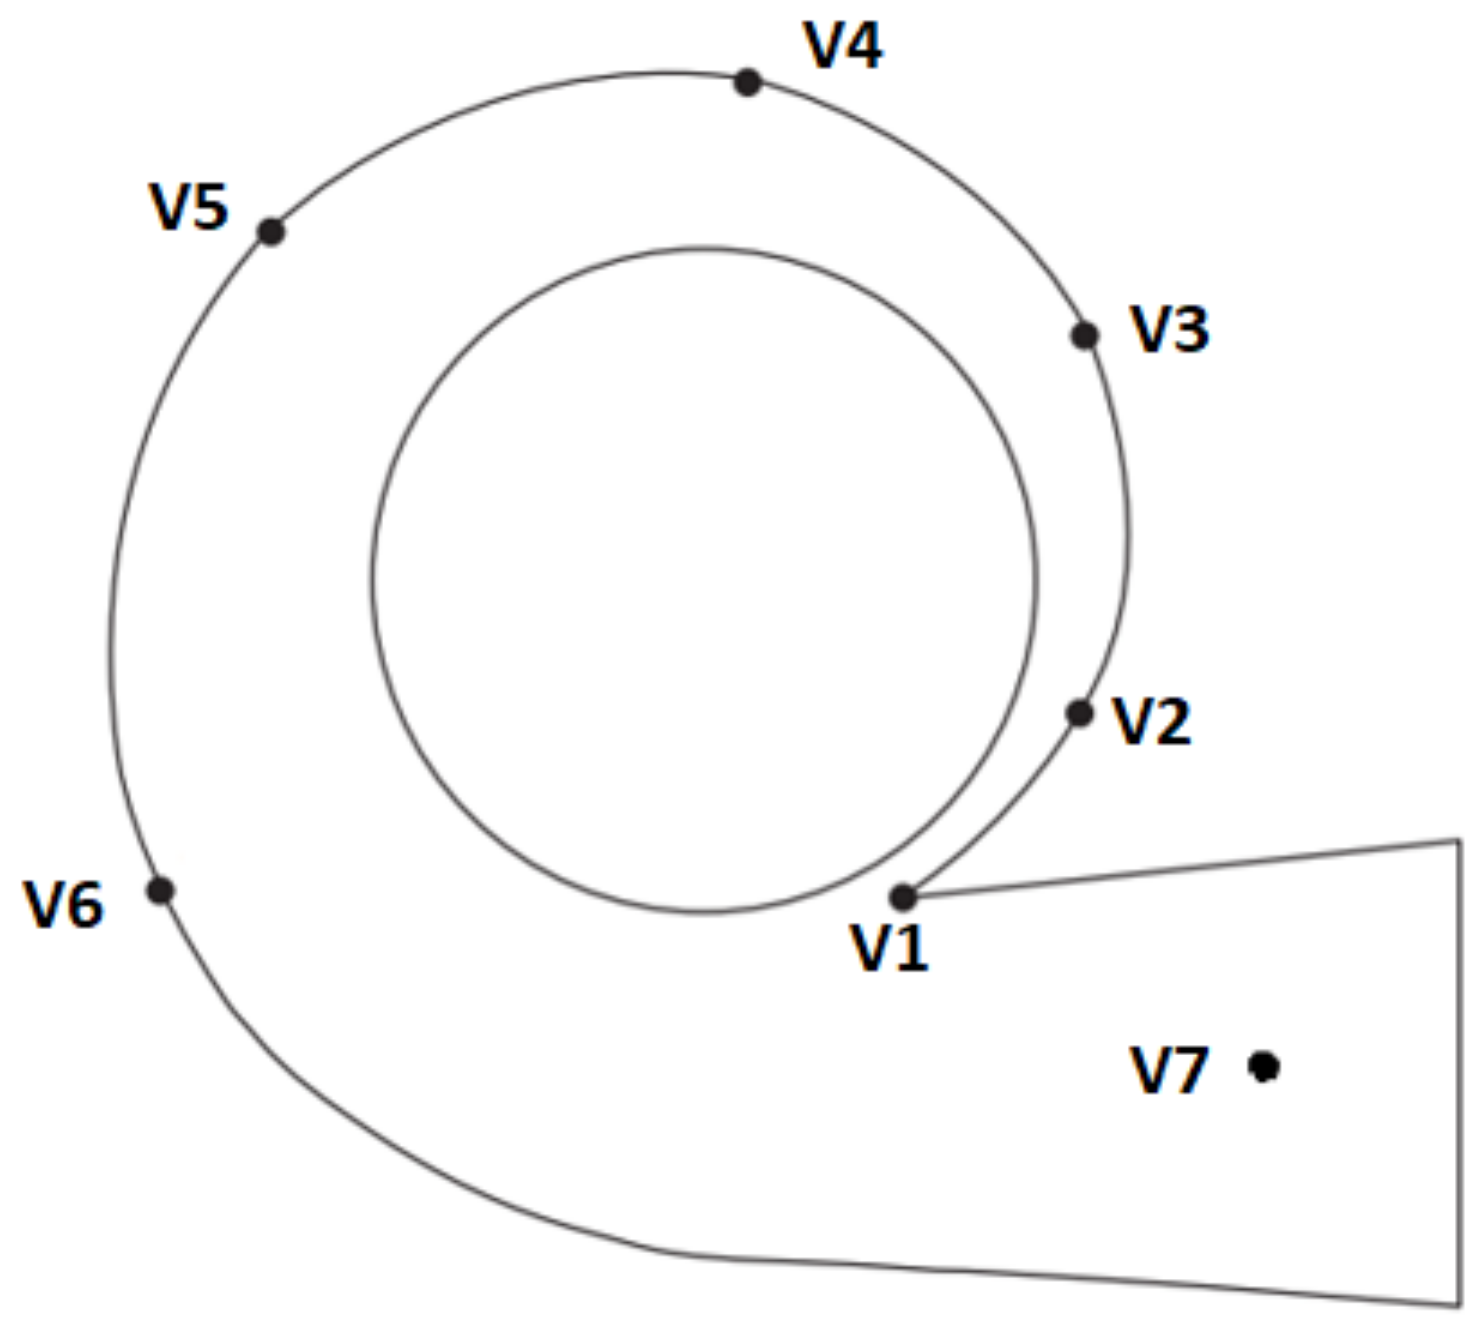
Figure 2.
Meridional shape.
Figure 2.
Meridional shape.
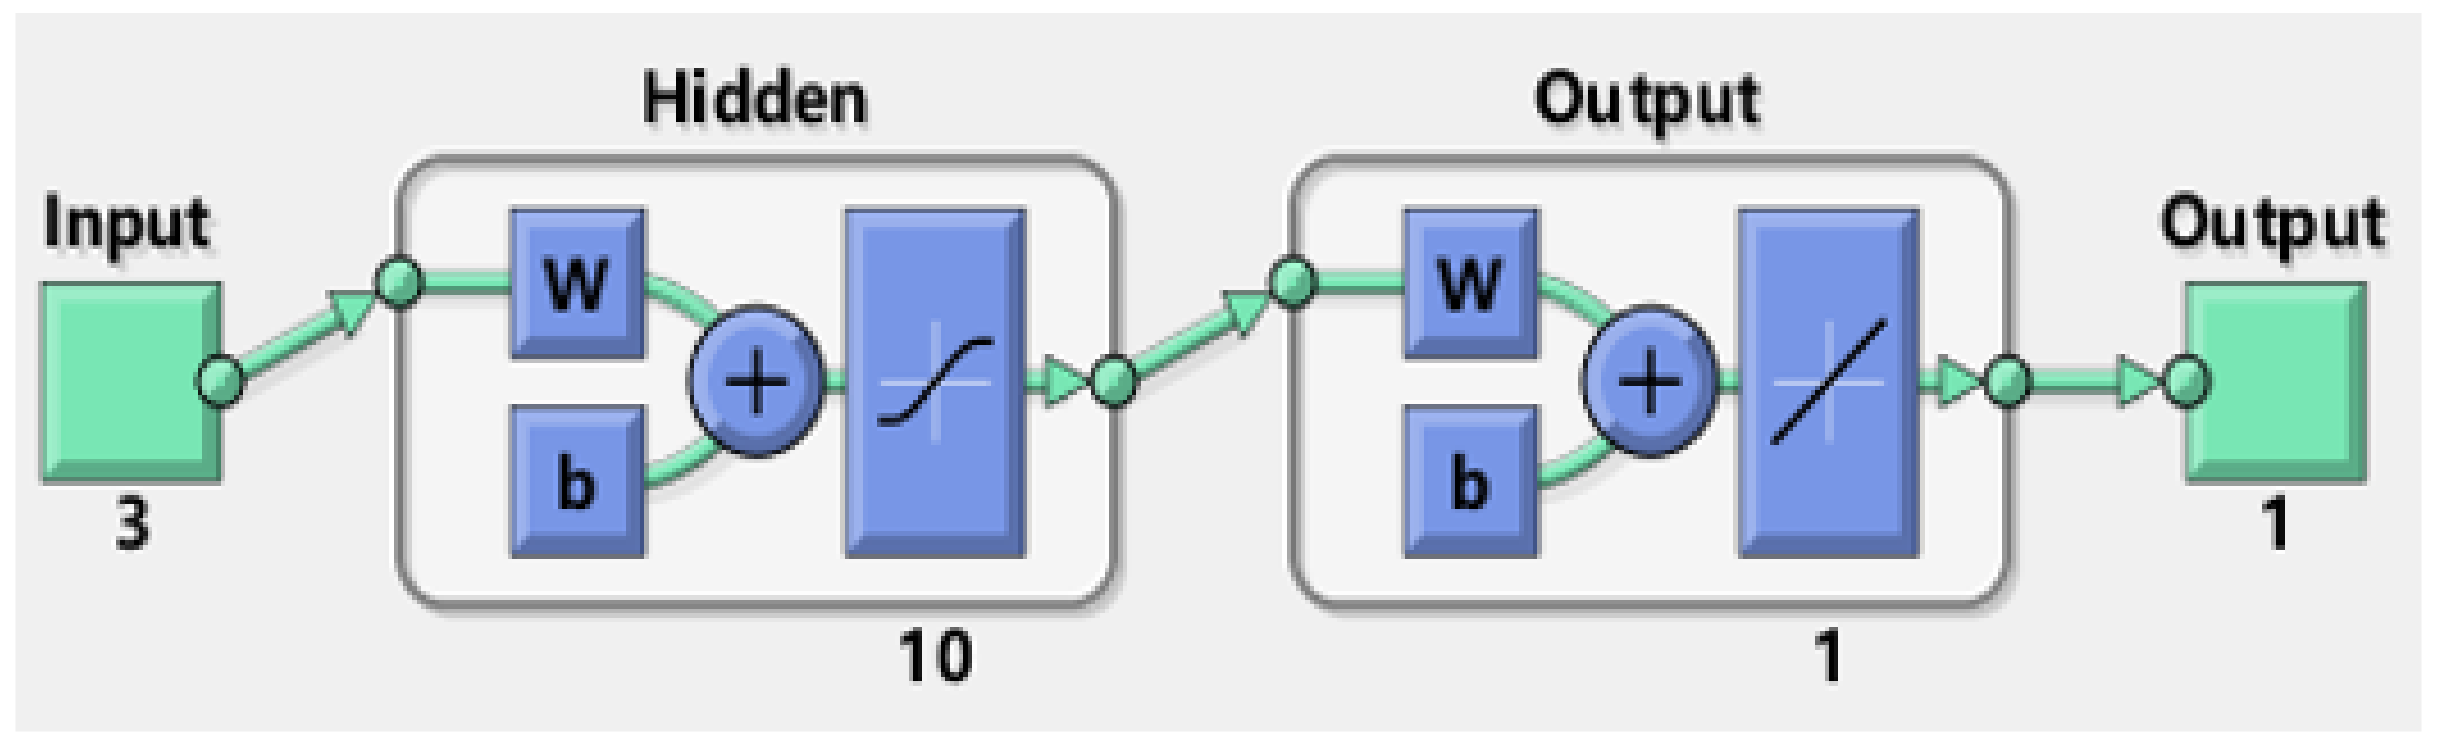
Figure 3.
Artificial neural network (ANN) structure for the required net positive suction head (NPSHr) objective.
Figure 3.
Artificial neural network (ANN) structure for the required net positive suction head (NPSHr) objective.
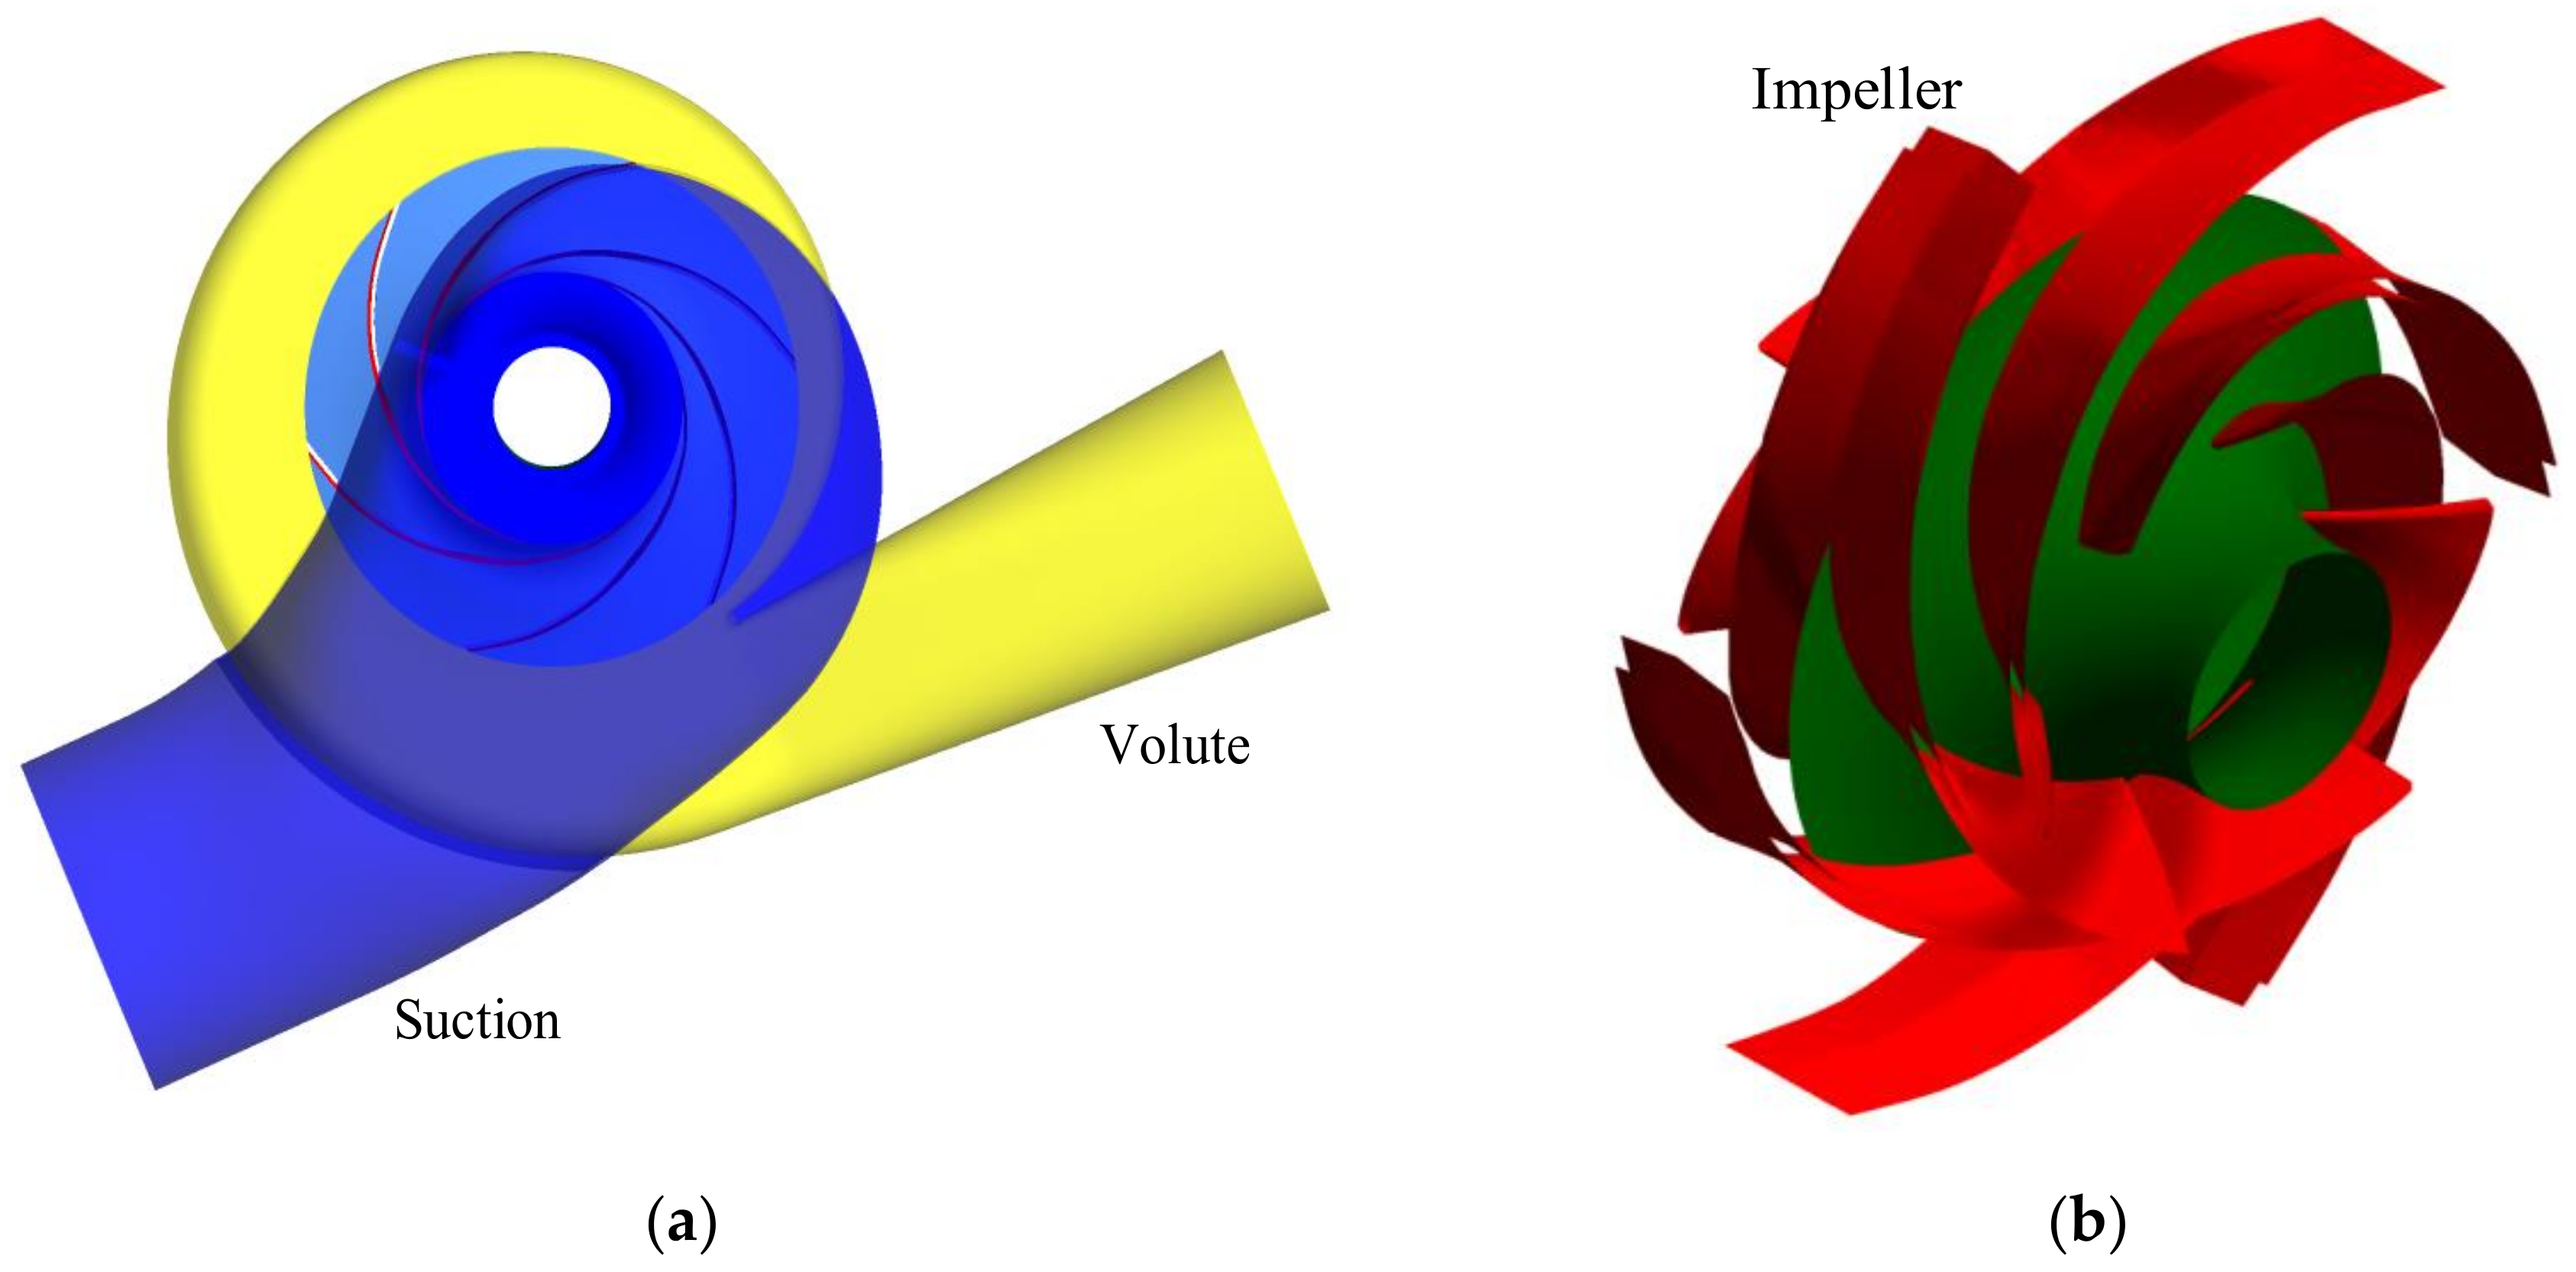
Figure 4.
Computational domain of impeller, suction and volute.
Figure 4.
Computational domain of impeller, suction and volute.
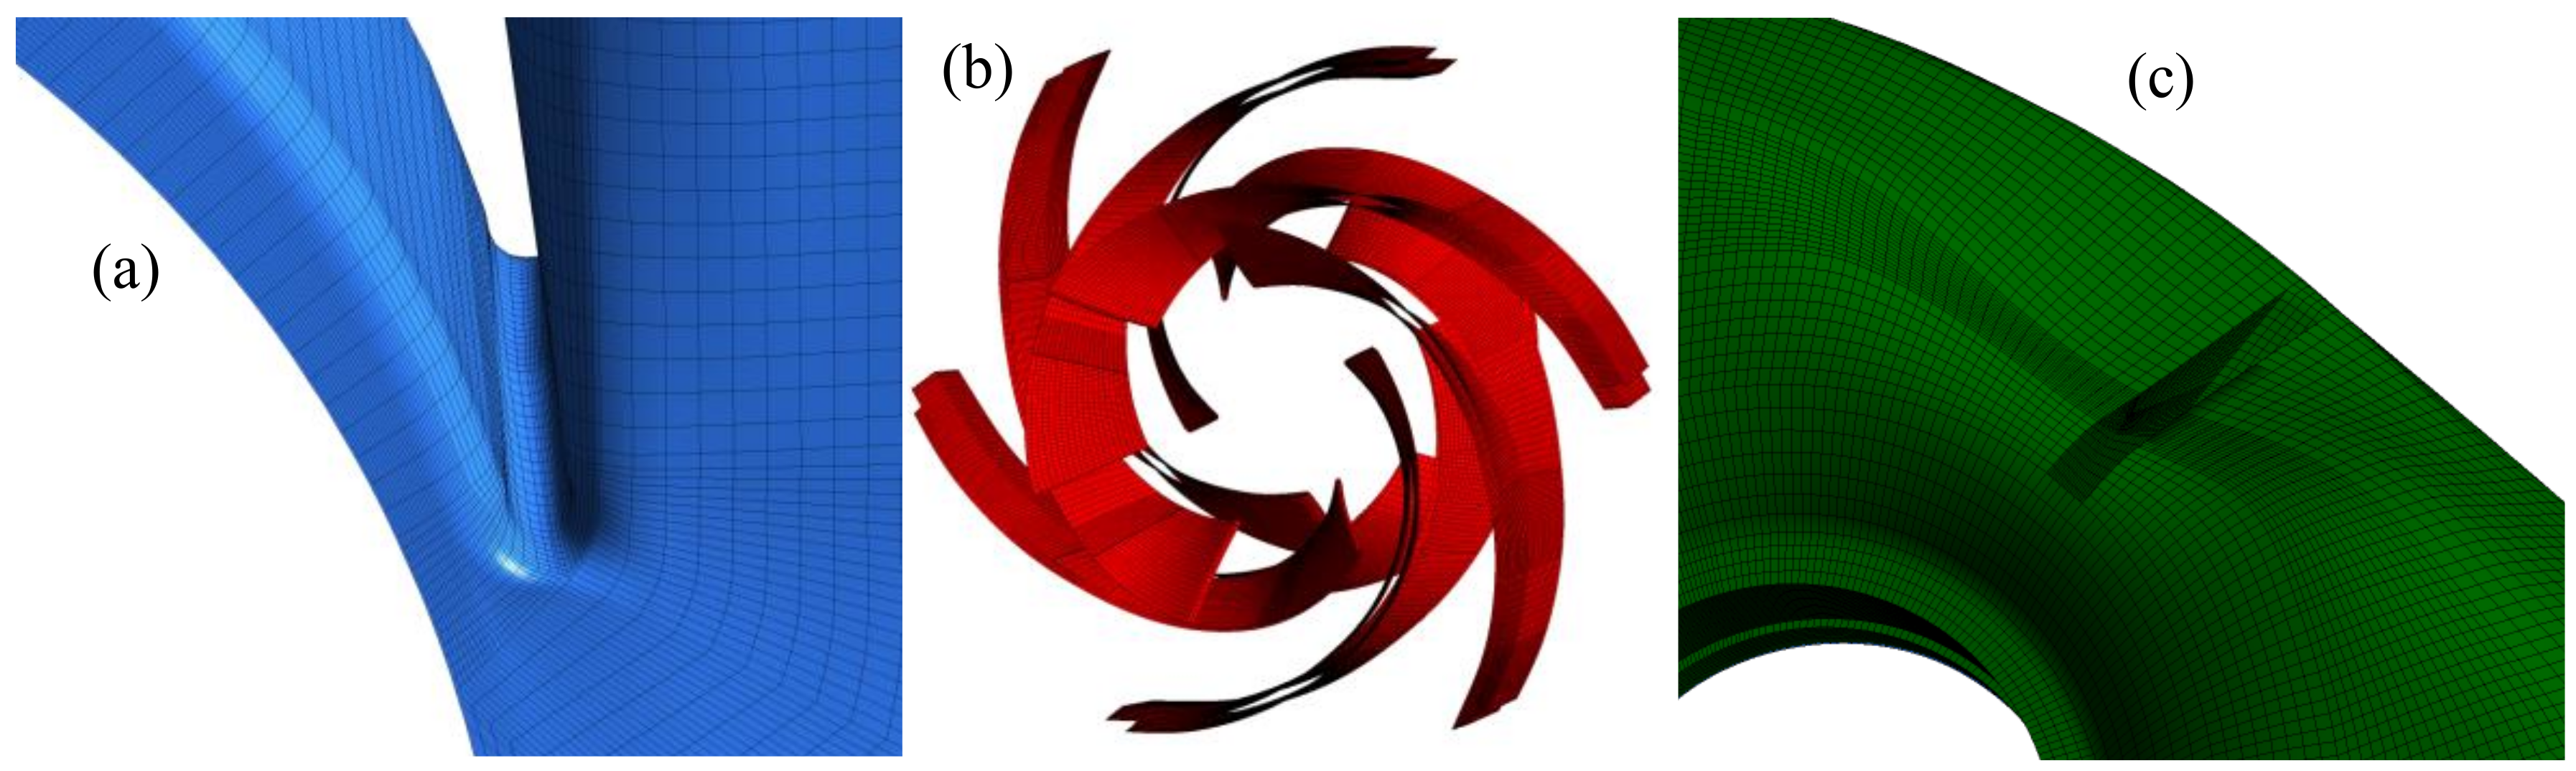
Figure 5.
Mesh of calculation domain: (a) volute tongue, (b) impeller, and (c) suction tongue.
Figure 5.
Mesh of calculation domain: (a) volute tongue, (b) impeller, and (c) suction tongue.
Figure 6.
Monitors points in the volute.
Figure 6.
Monitors points in the volute.
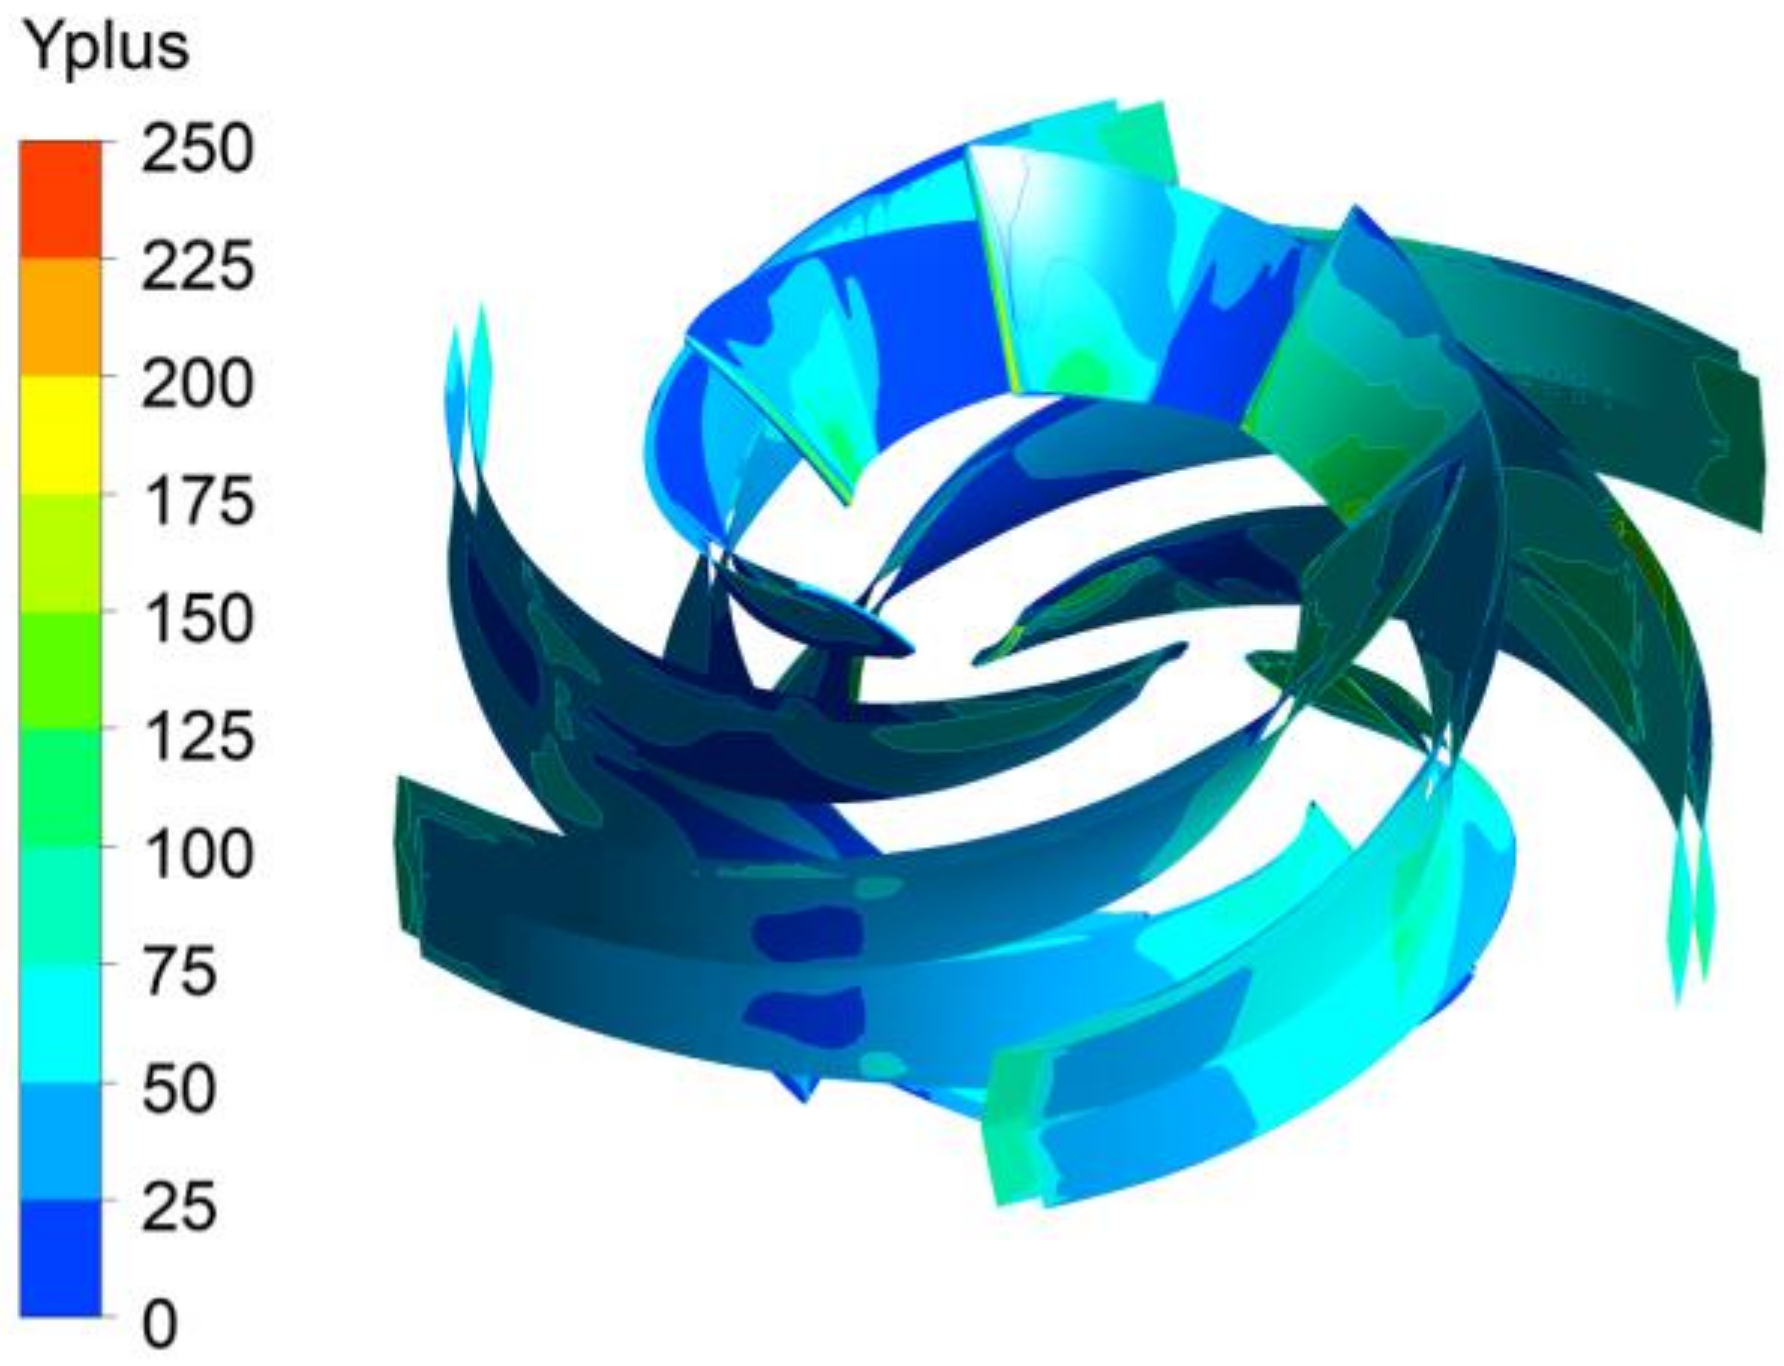
Figure 7.
Yplus distribution on blade surface.
Figure 7.
Yplus distribution on blade surface.
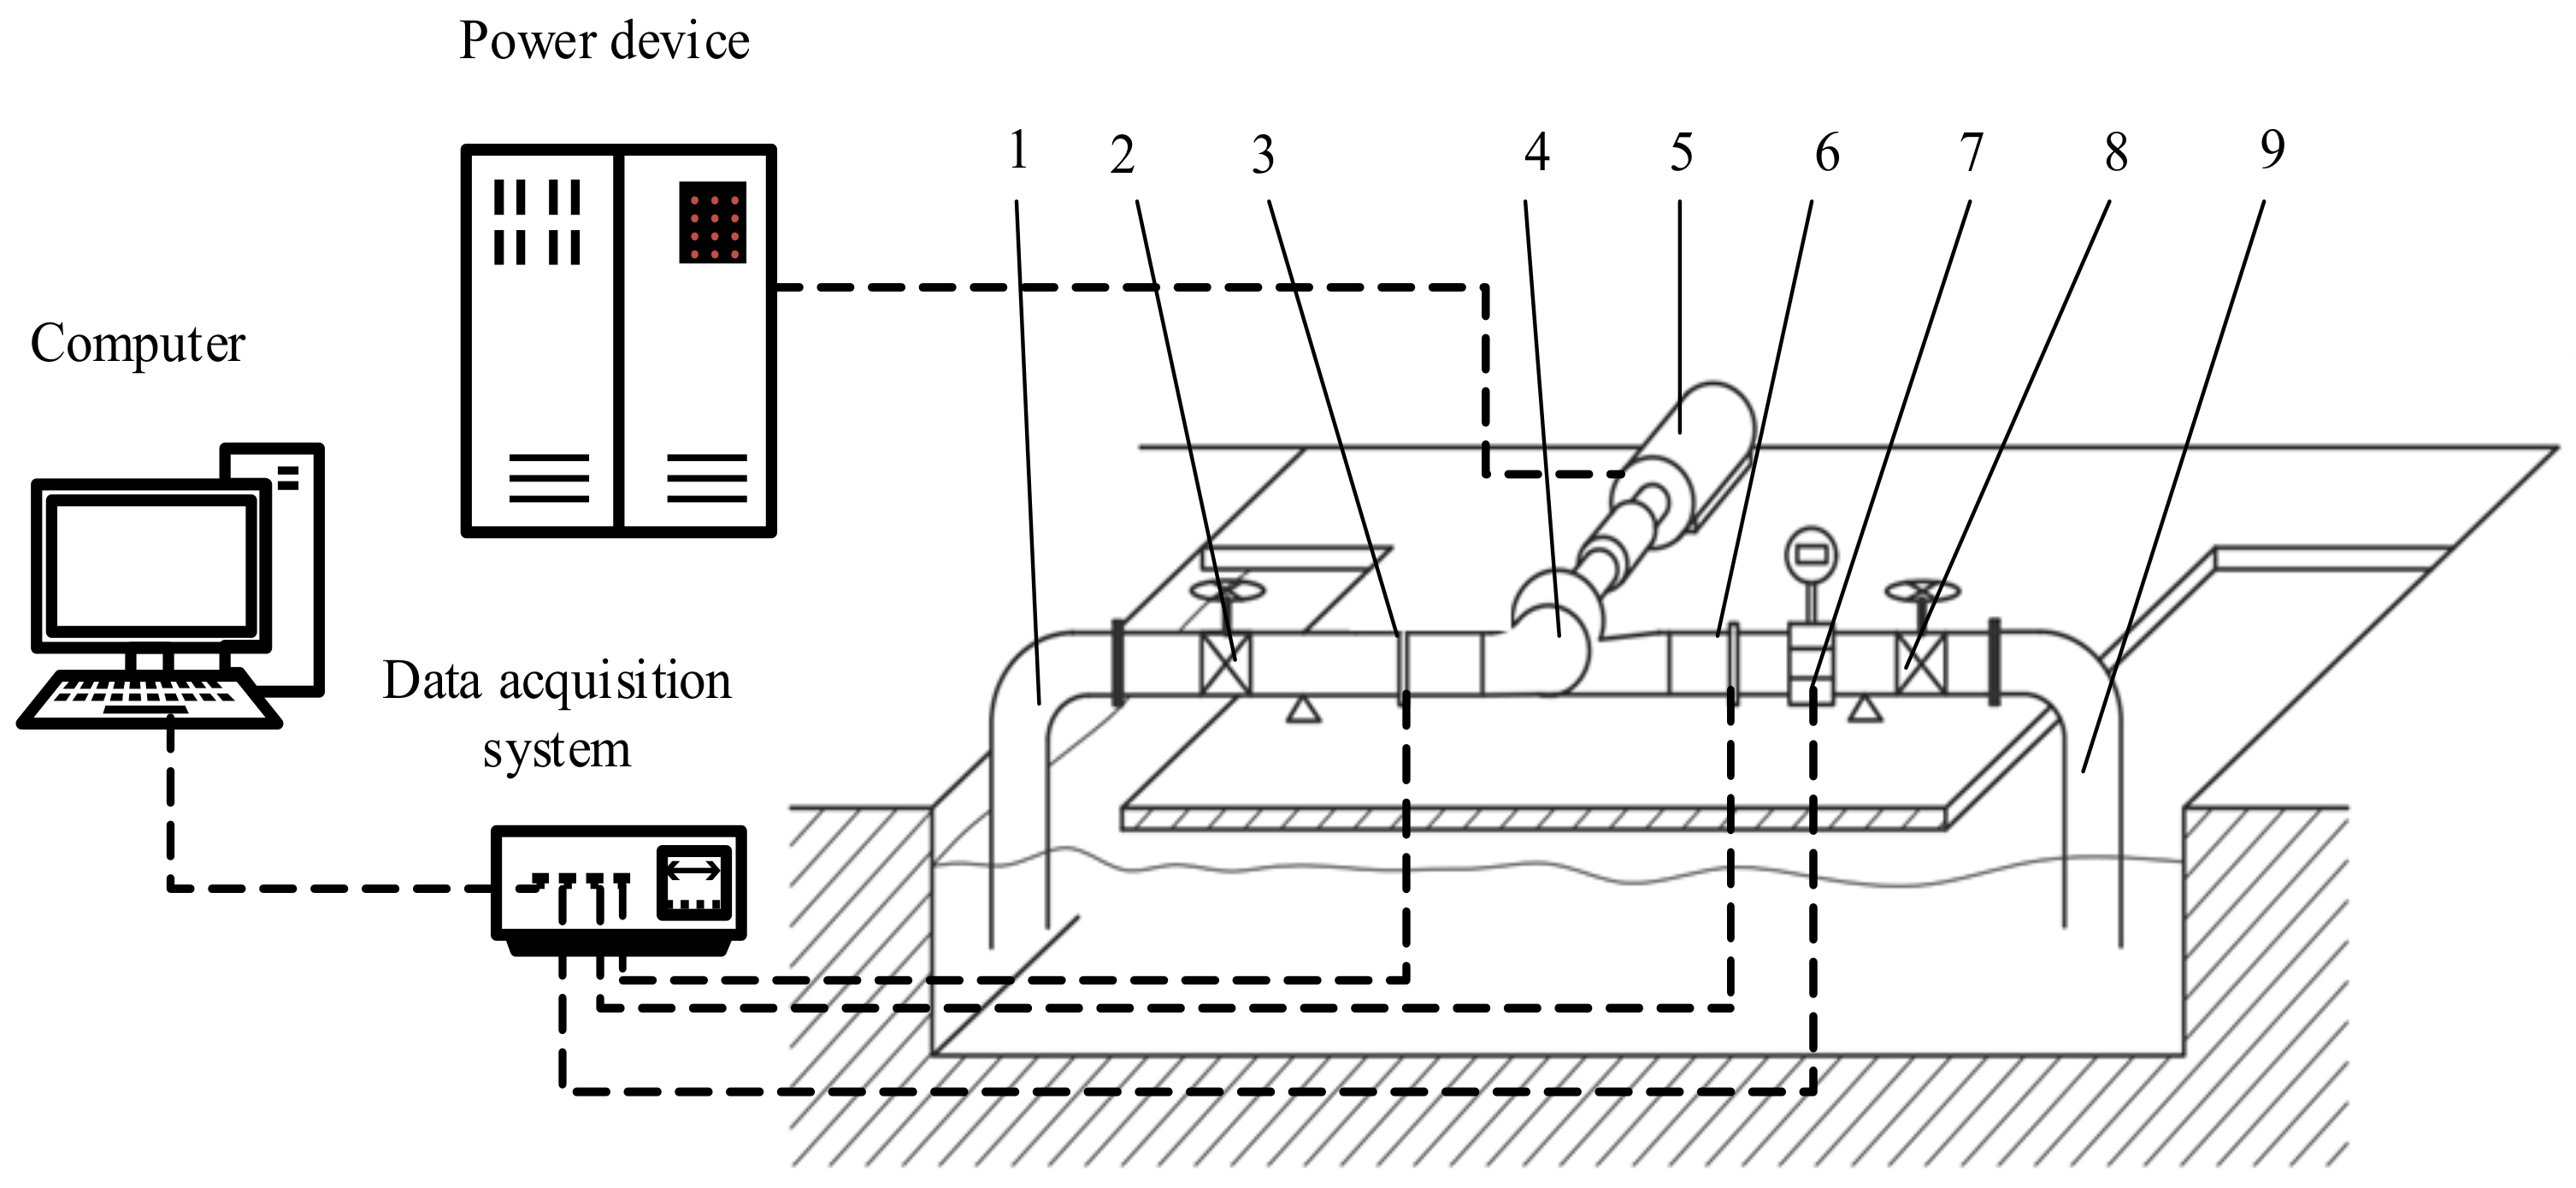
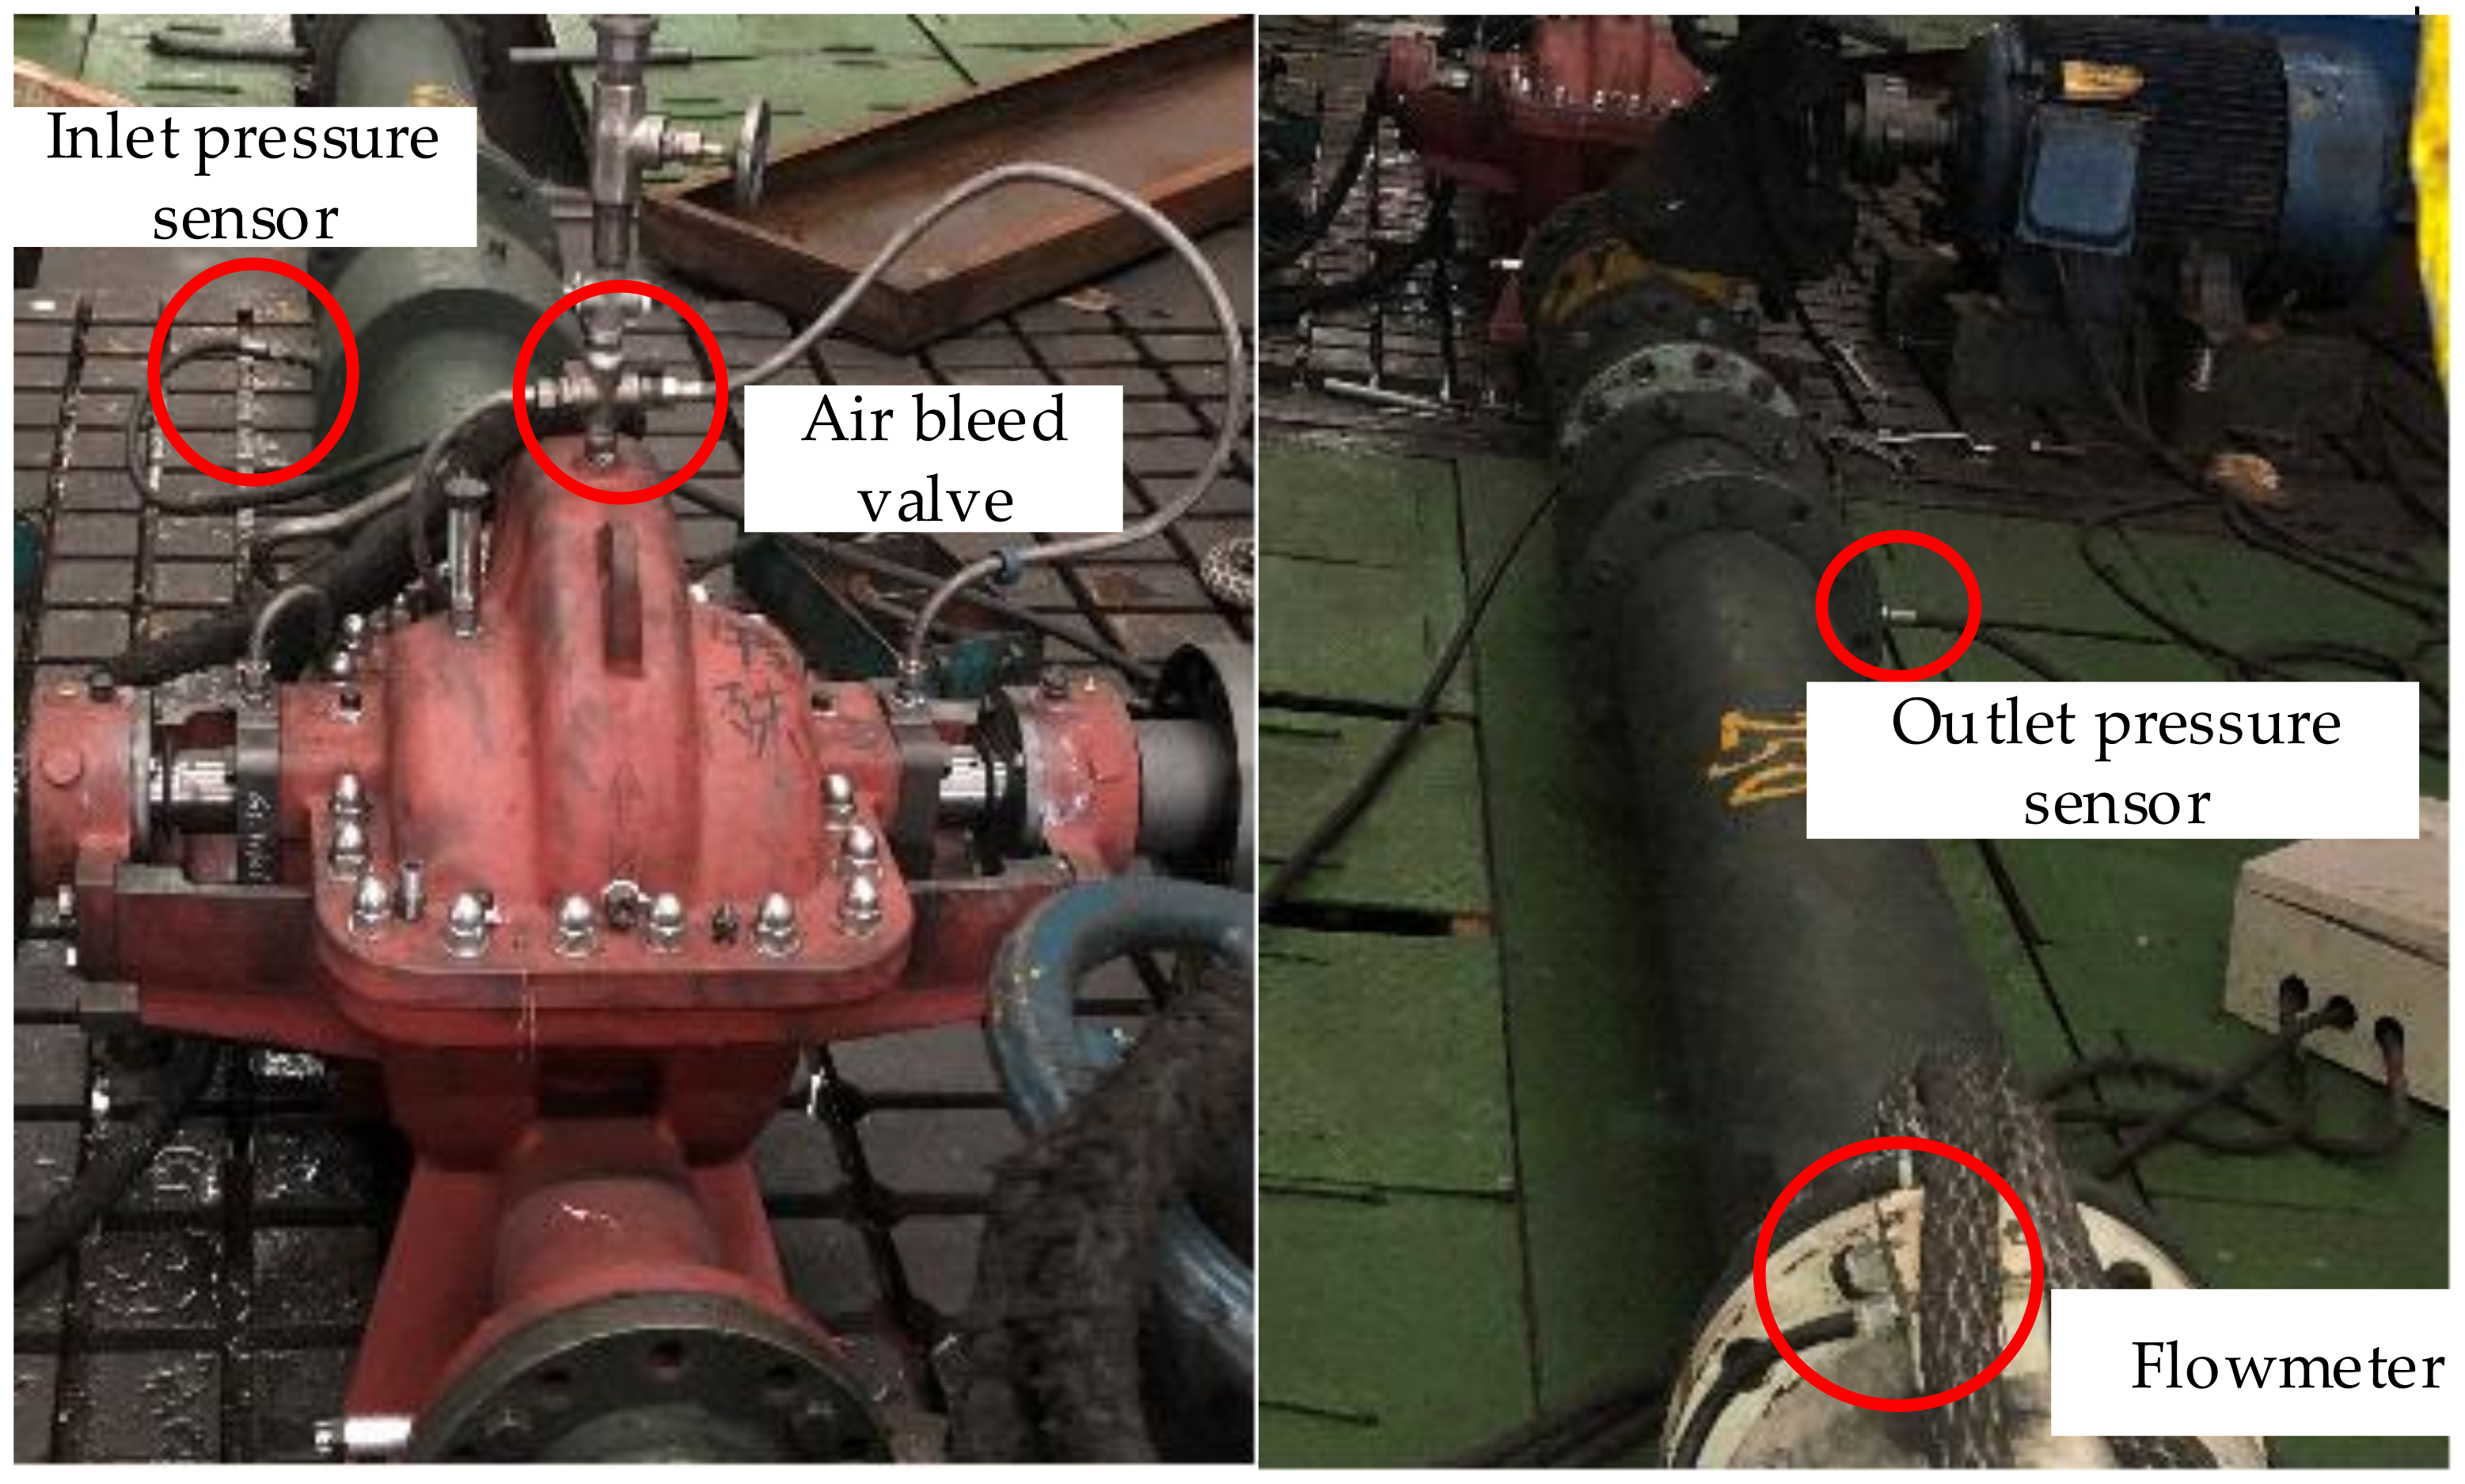
Figure 8.
Schematics of the test setup. 1: Inlet pipe, 2(8): Valve, 3(6): Pressure transducer, 4: Tested pump, 5: Driven motor, 7: Magnetic flow meter, and 9: Outlet pipe.
Figure 8.
Schematics of the test setup. 1: Inlet pipe, 2(8): Valve, 3(6): Pressure transducer, 4: Tested pump, 5: Driven motor, 7: Magnetic flow meter, and 9: Outlet pipe.
Figure 9.
Experimental setup.
Figure 9.
Experimental setup.
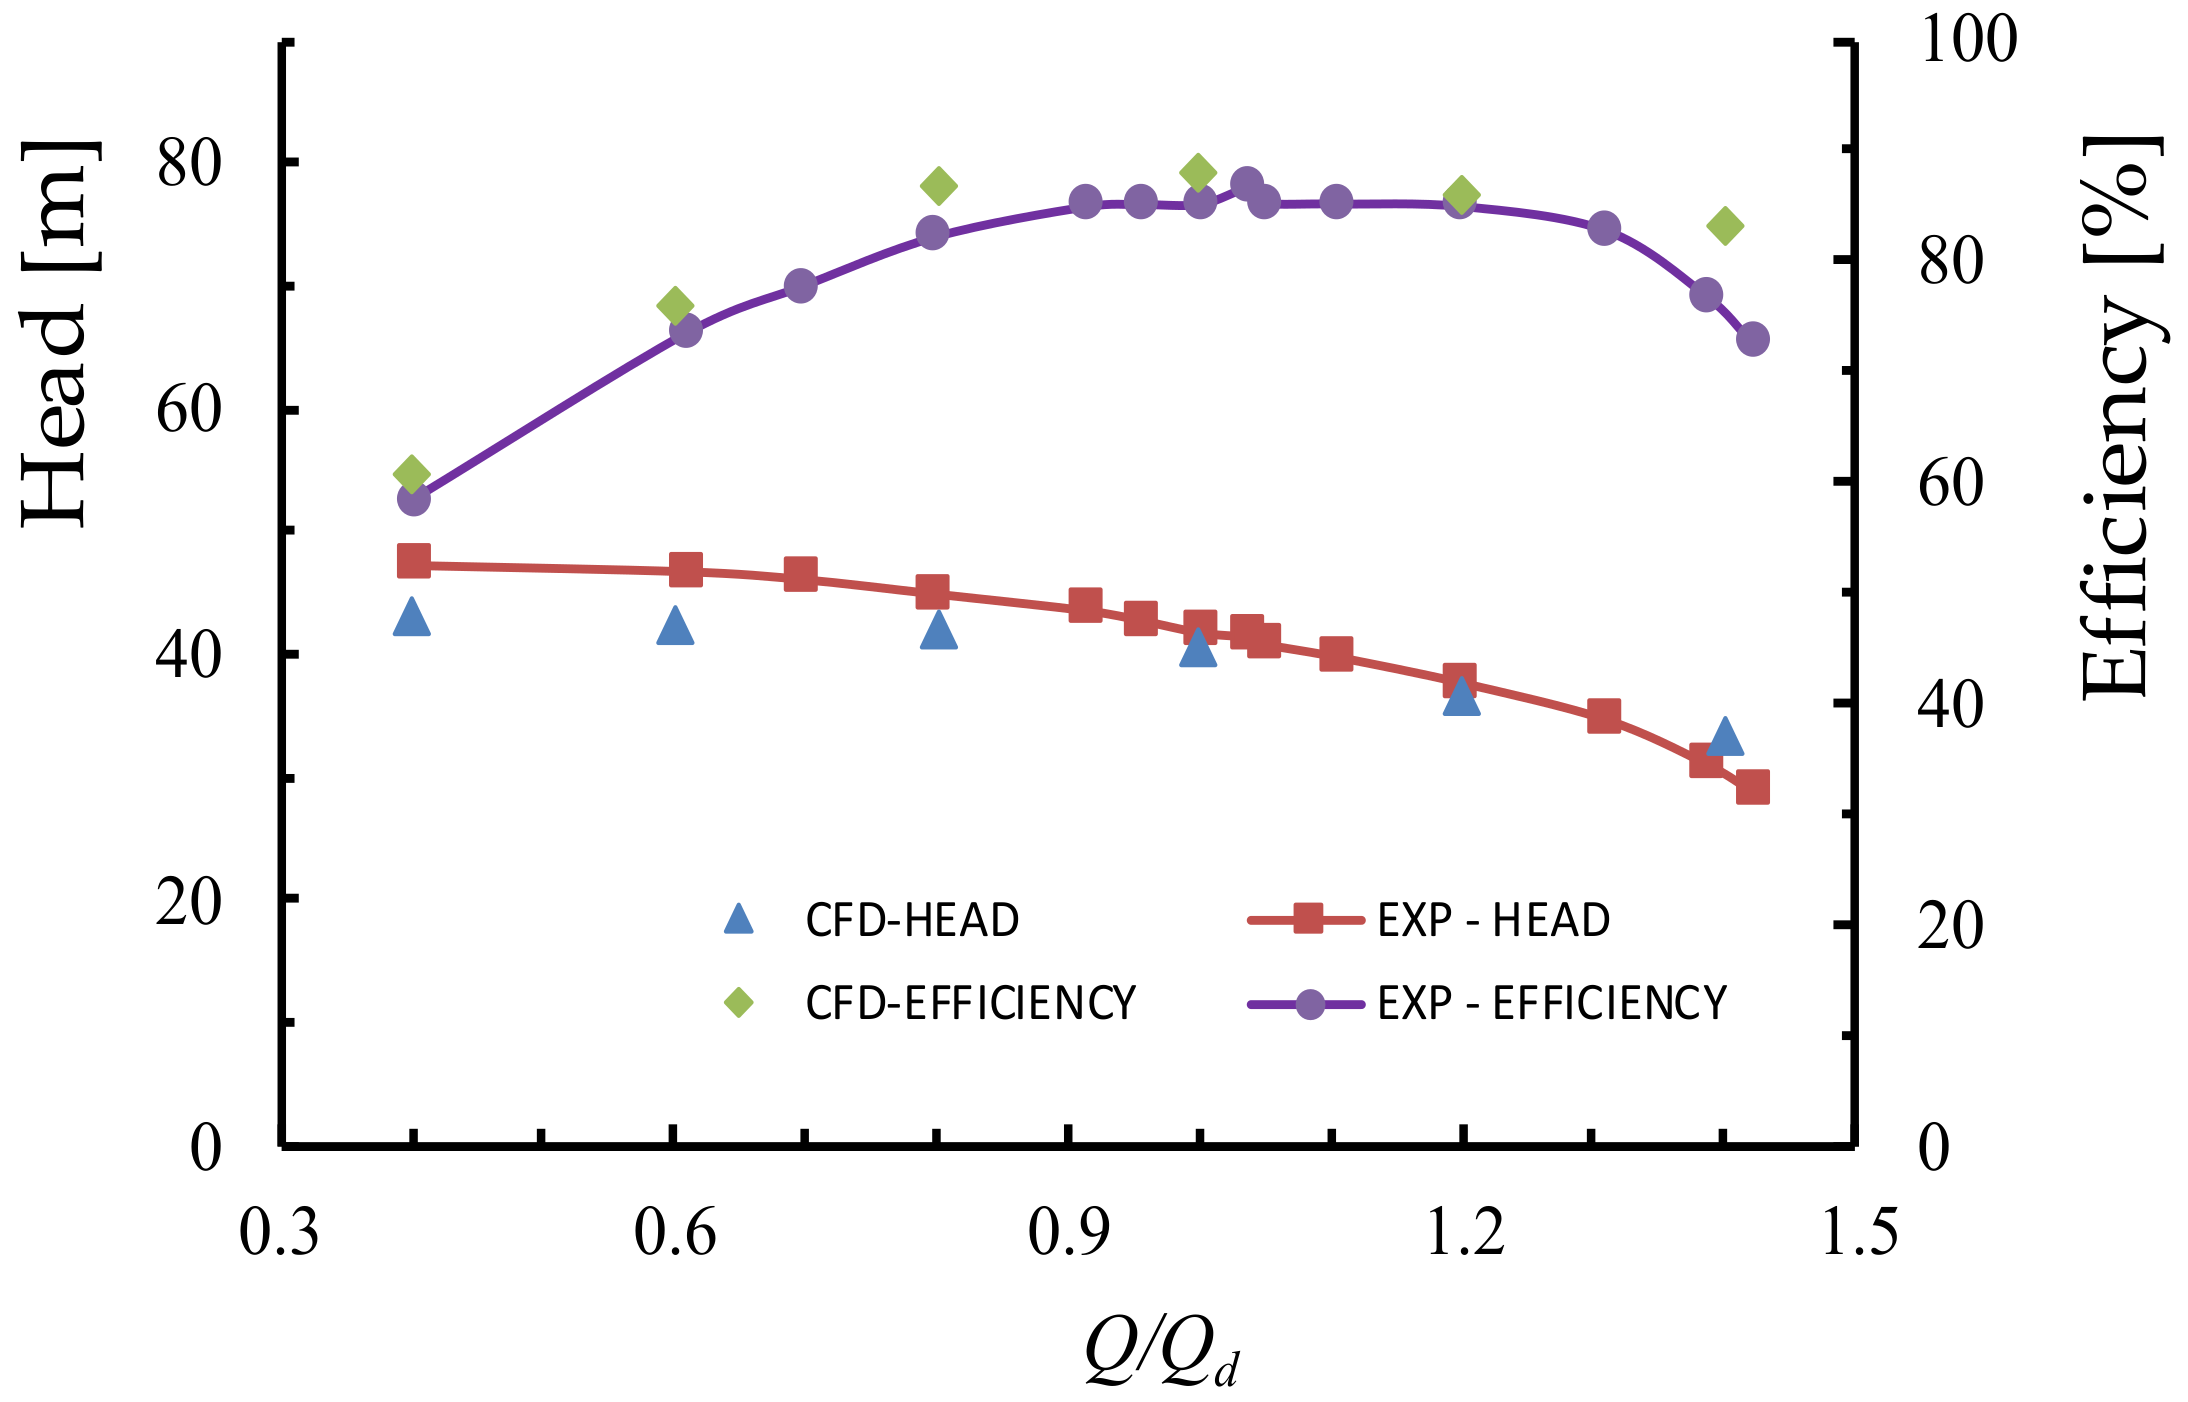
Figure 10.
Validation with test results.
Figure 10.
Validation with test results.
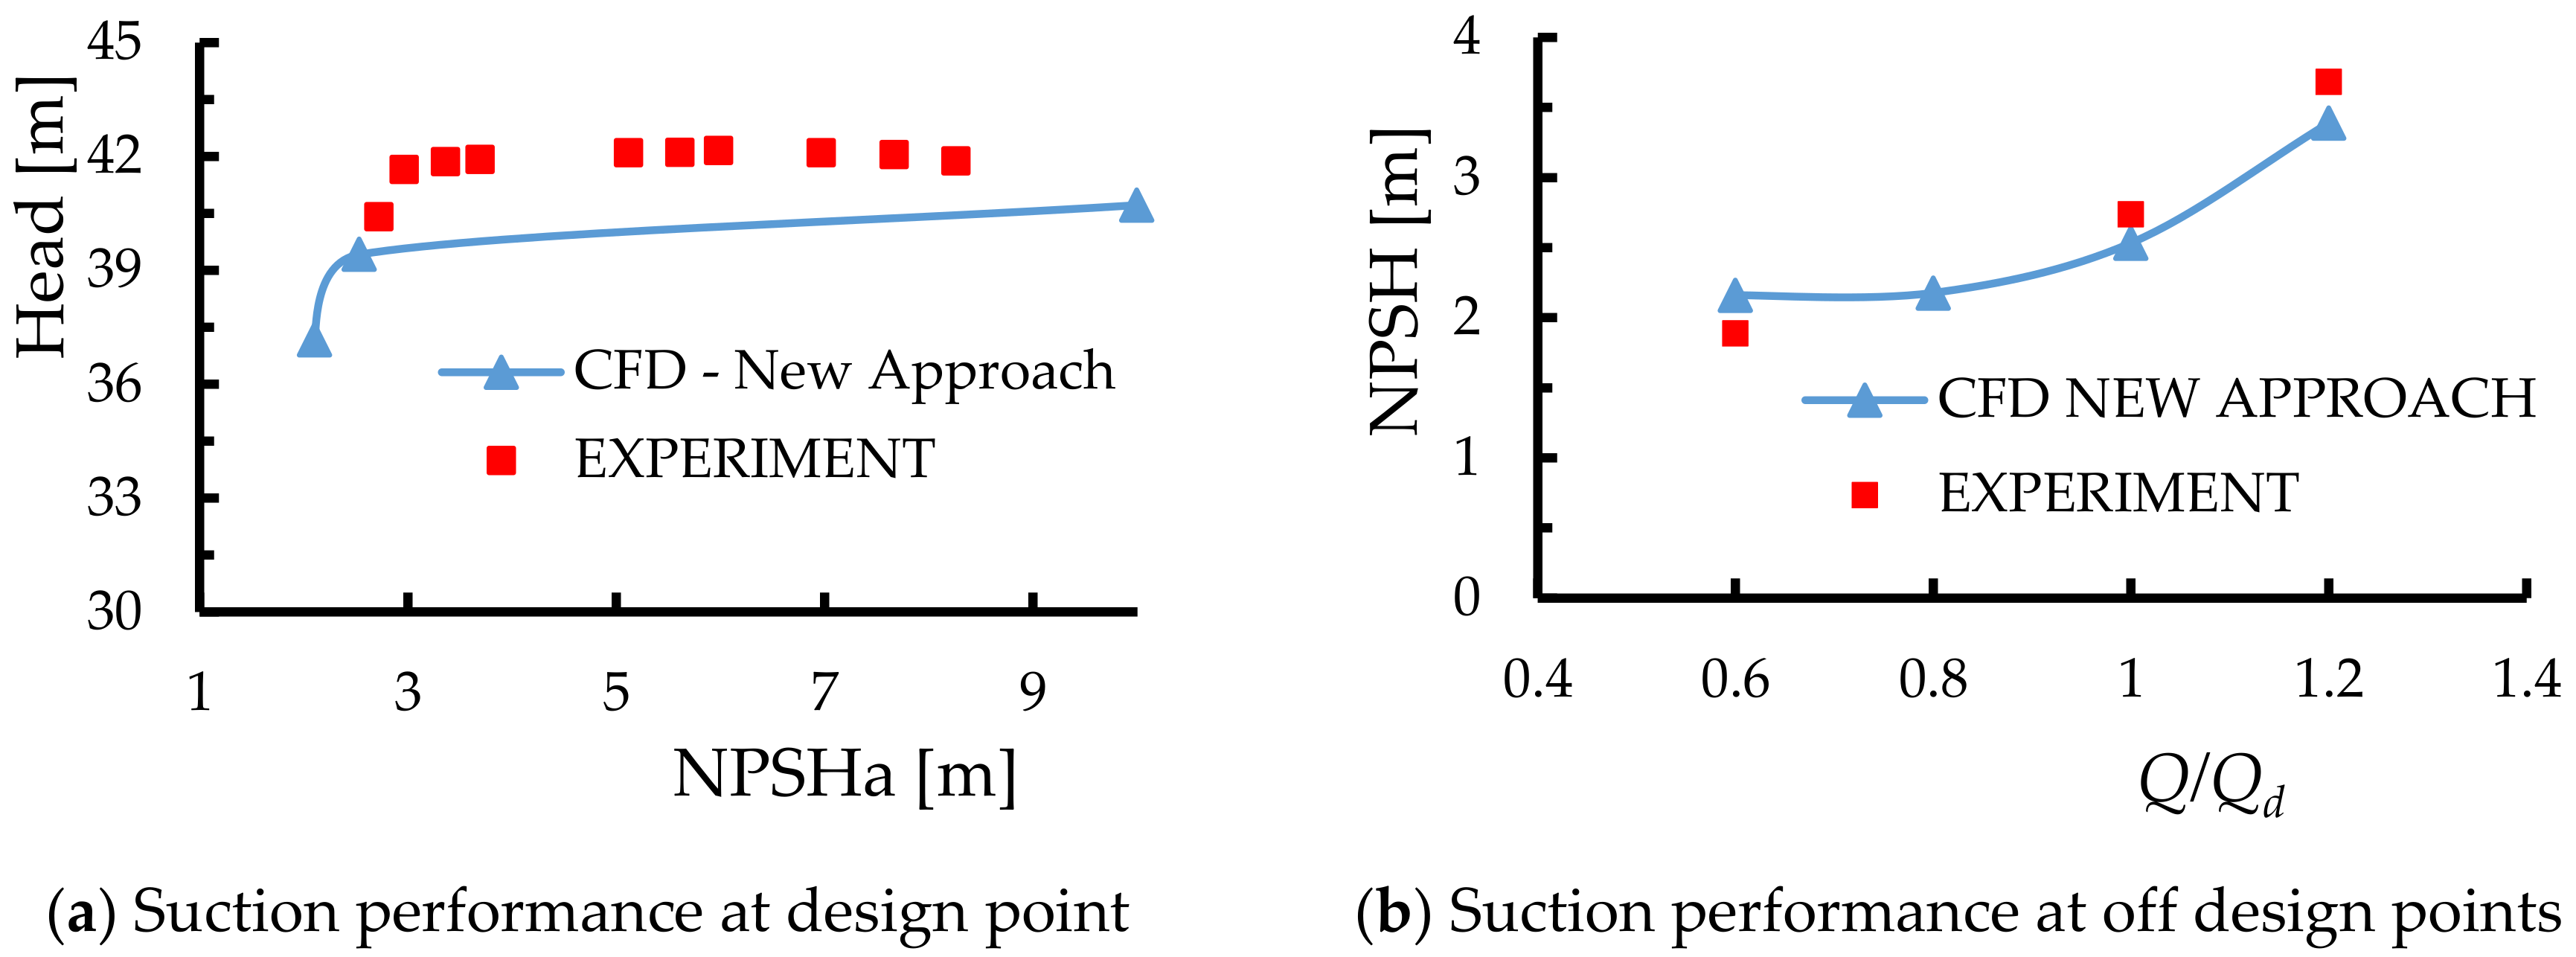
Figure 11.
Comparison of suction performance with test results at design and off design points.
Figure 11.
Comparison of suction performance with test results at design and off design points.
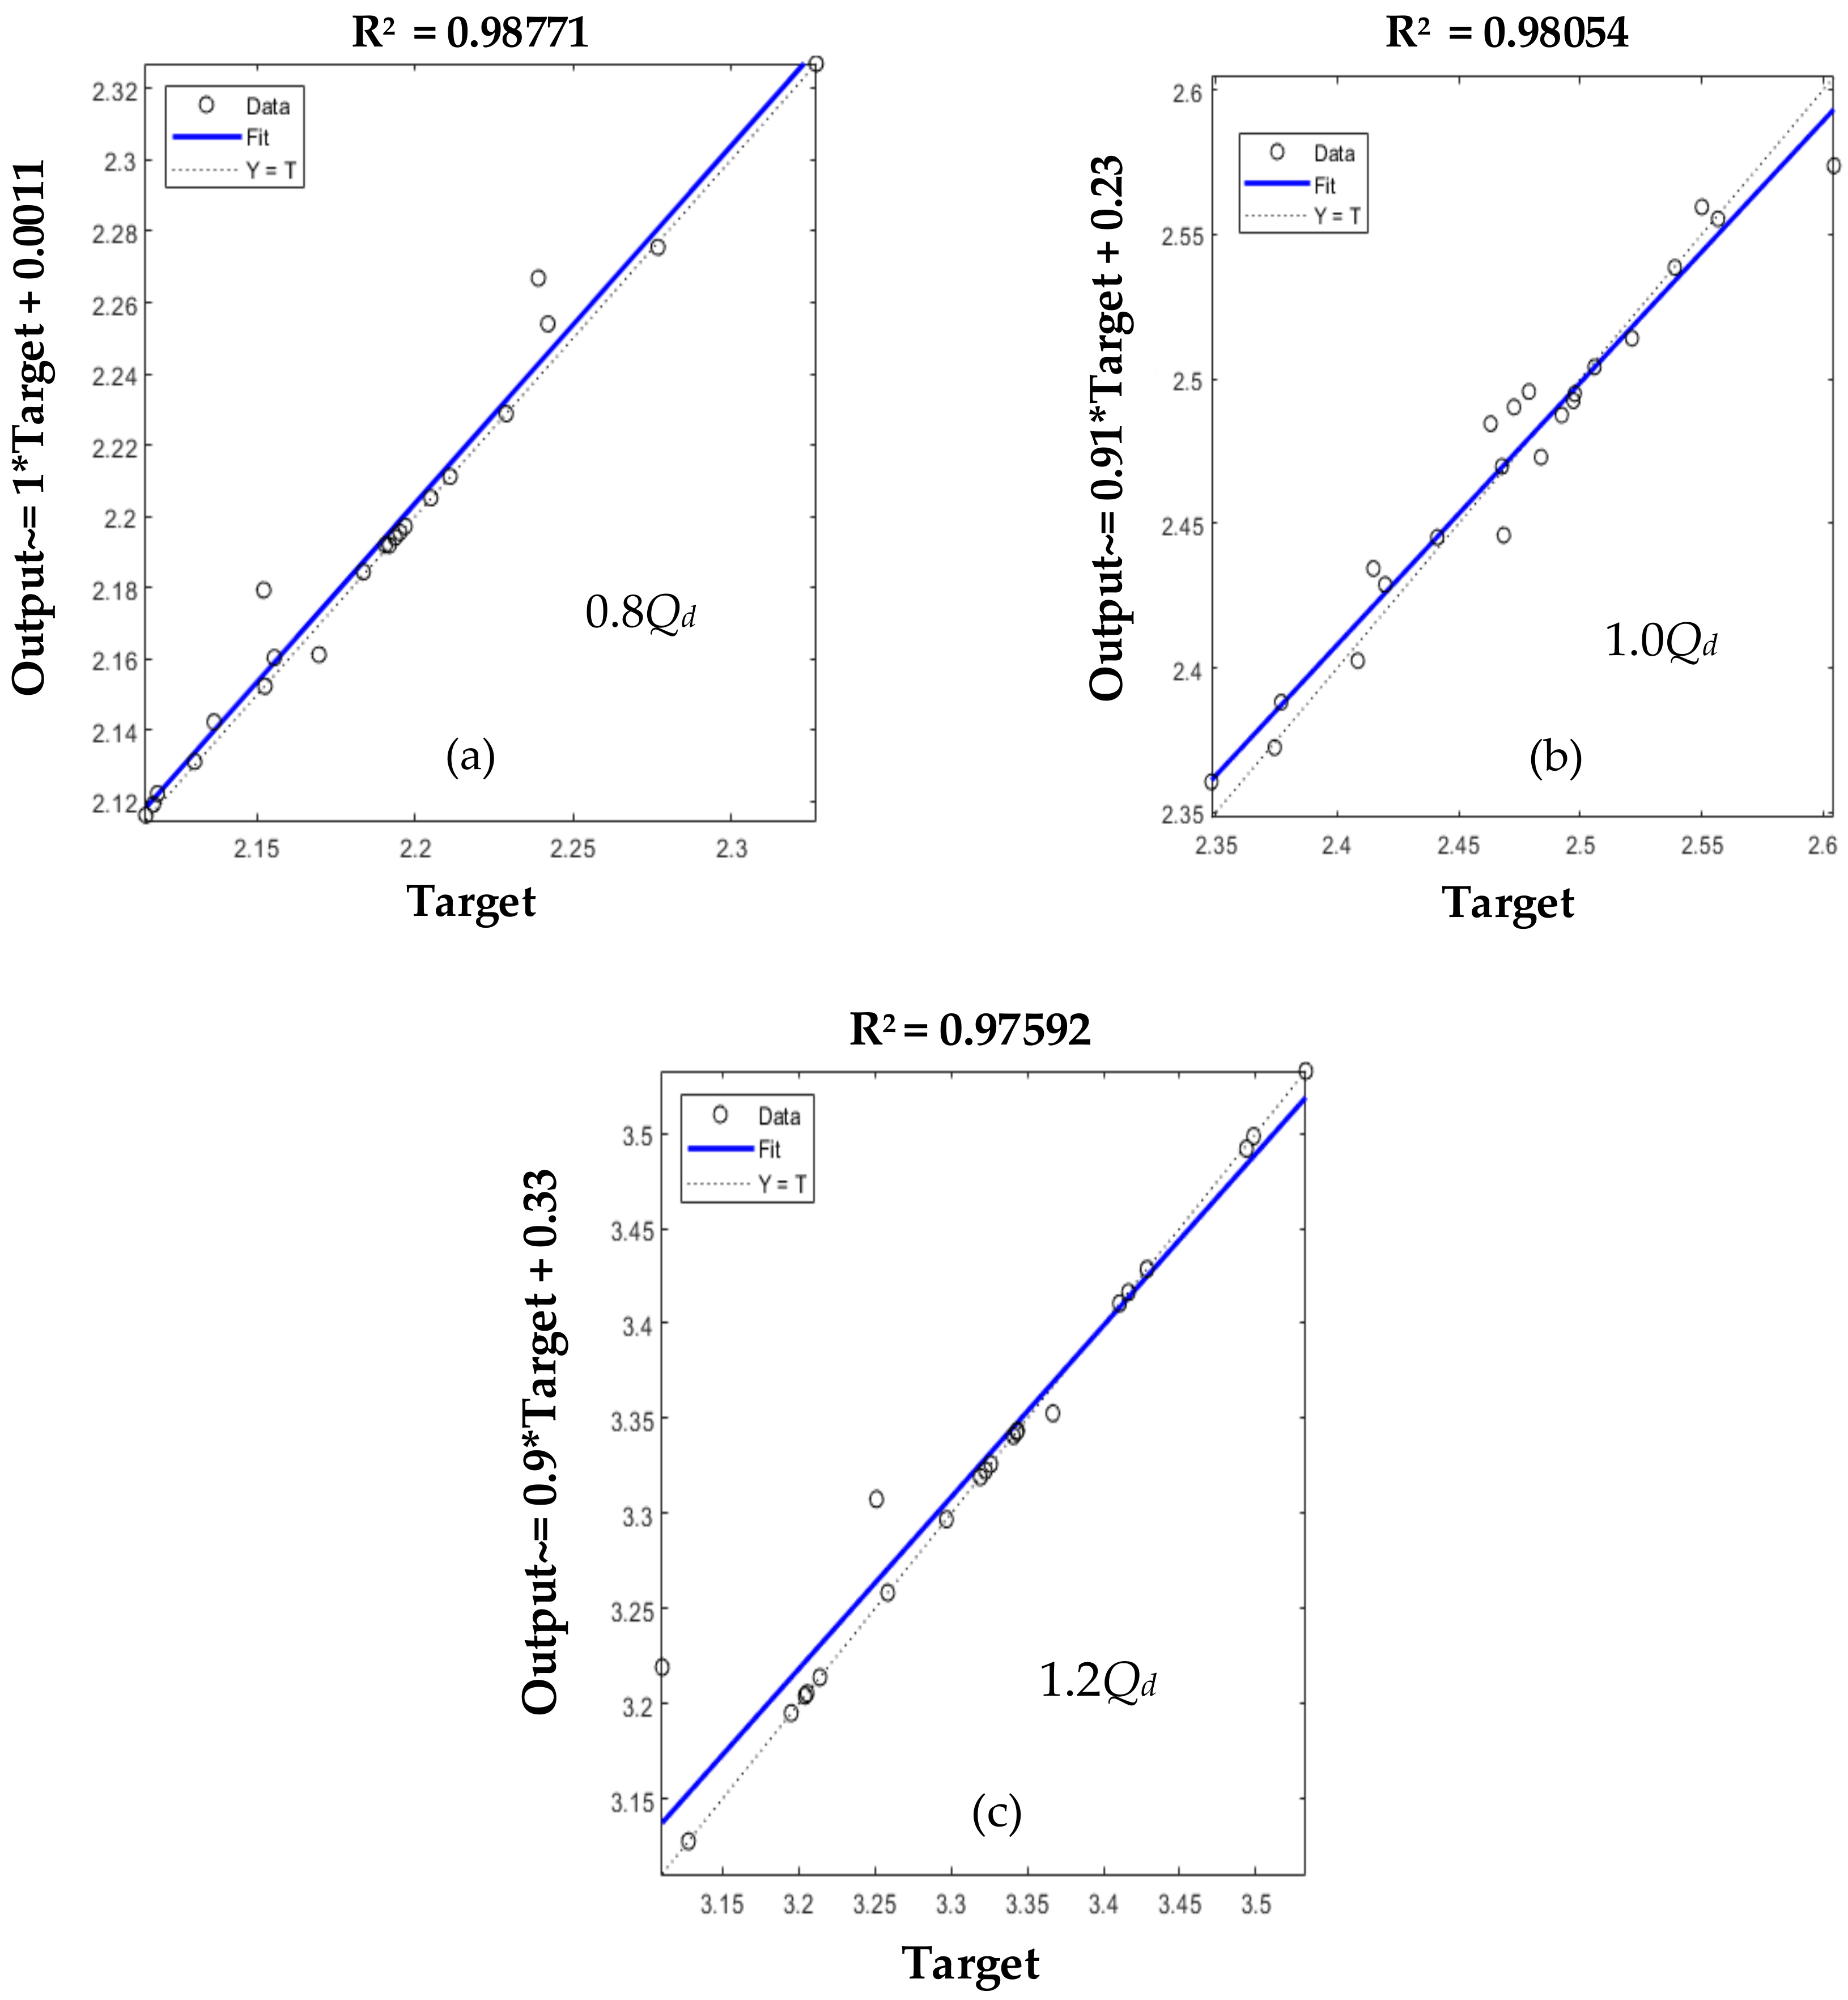
Figure 12.
R2 analysis of NPSHr at 0.8Qd, 1.0Qd and 1.2Qd.
Figure 12.
R2 analysis of NPSHr at 0.8Qd, 1.0Qd and 1.2Qd.
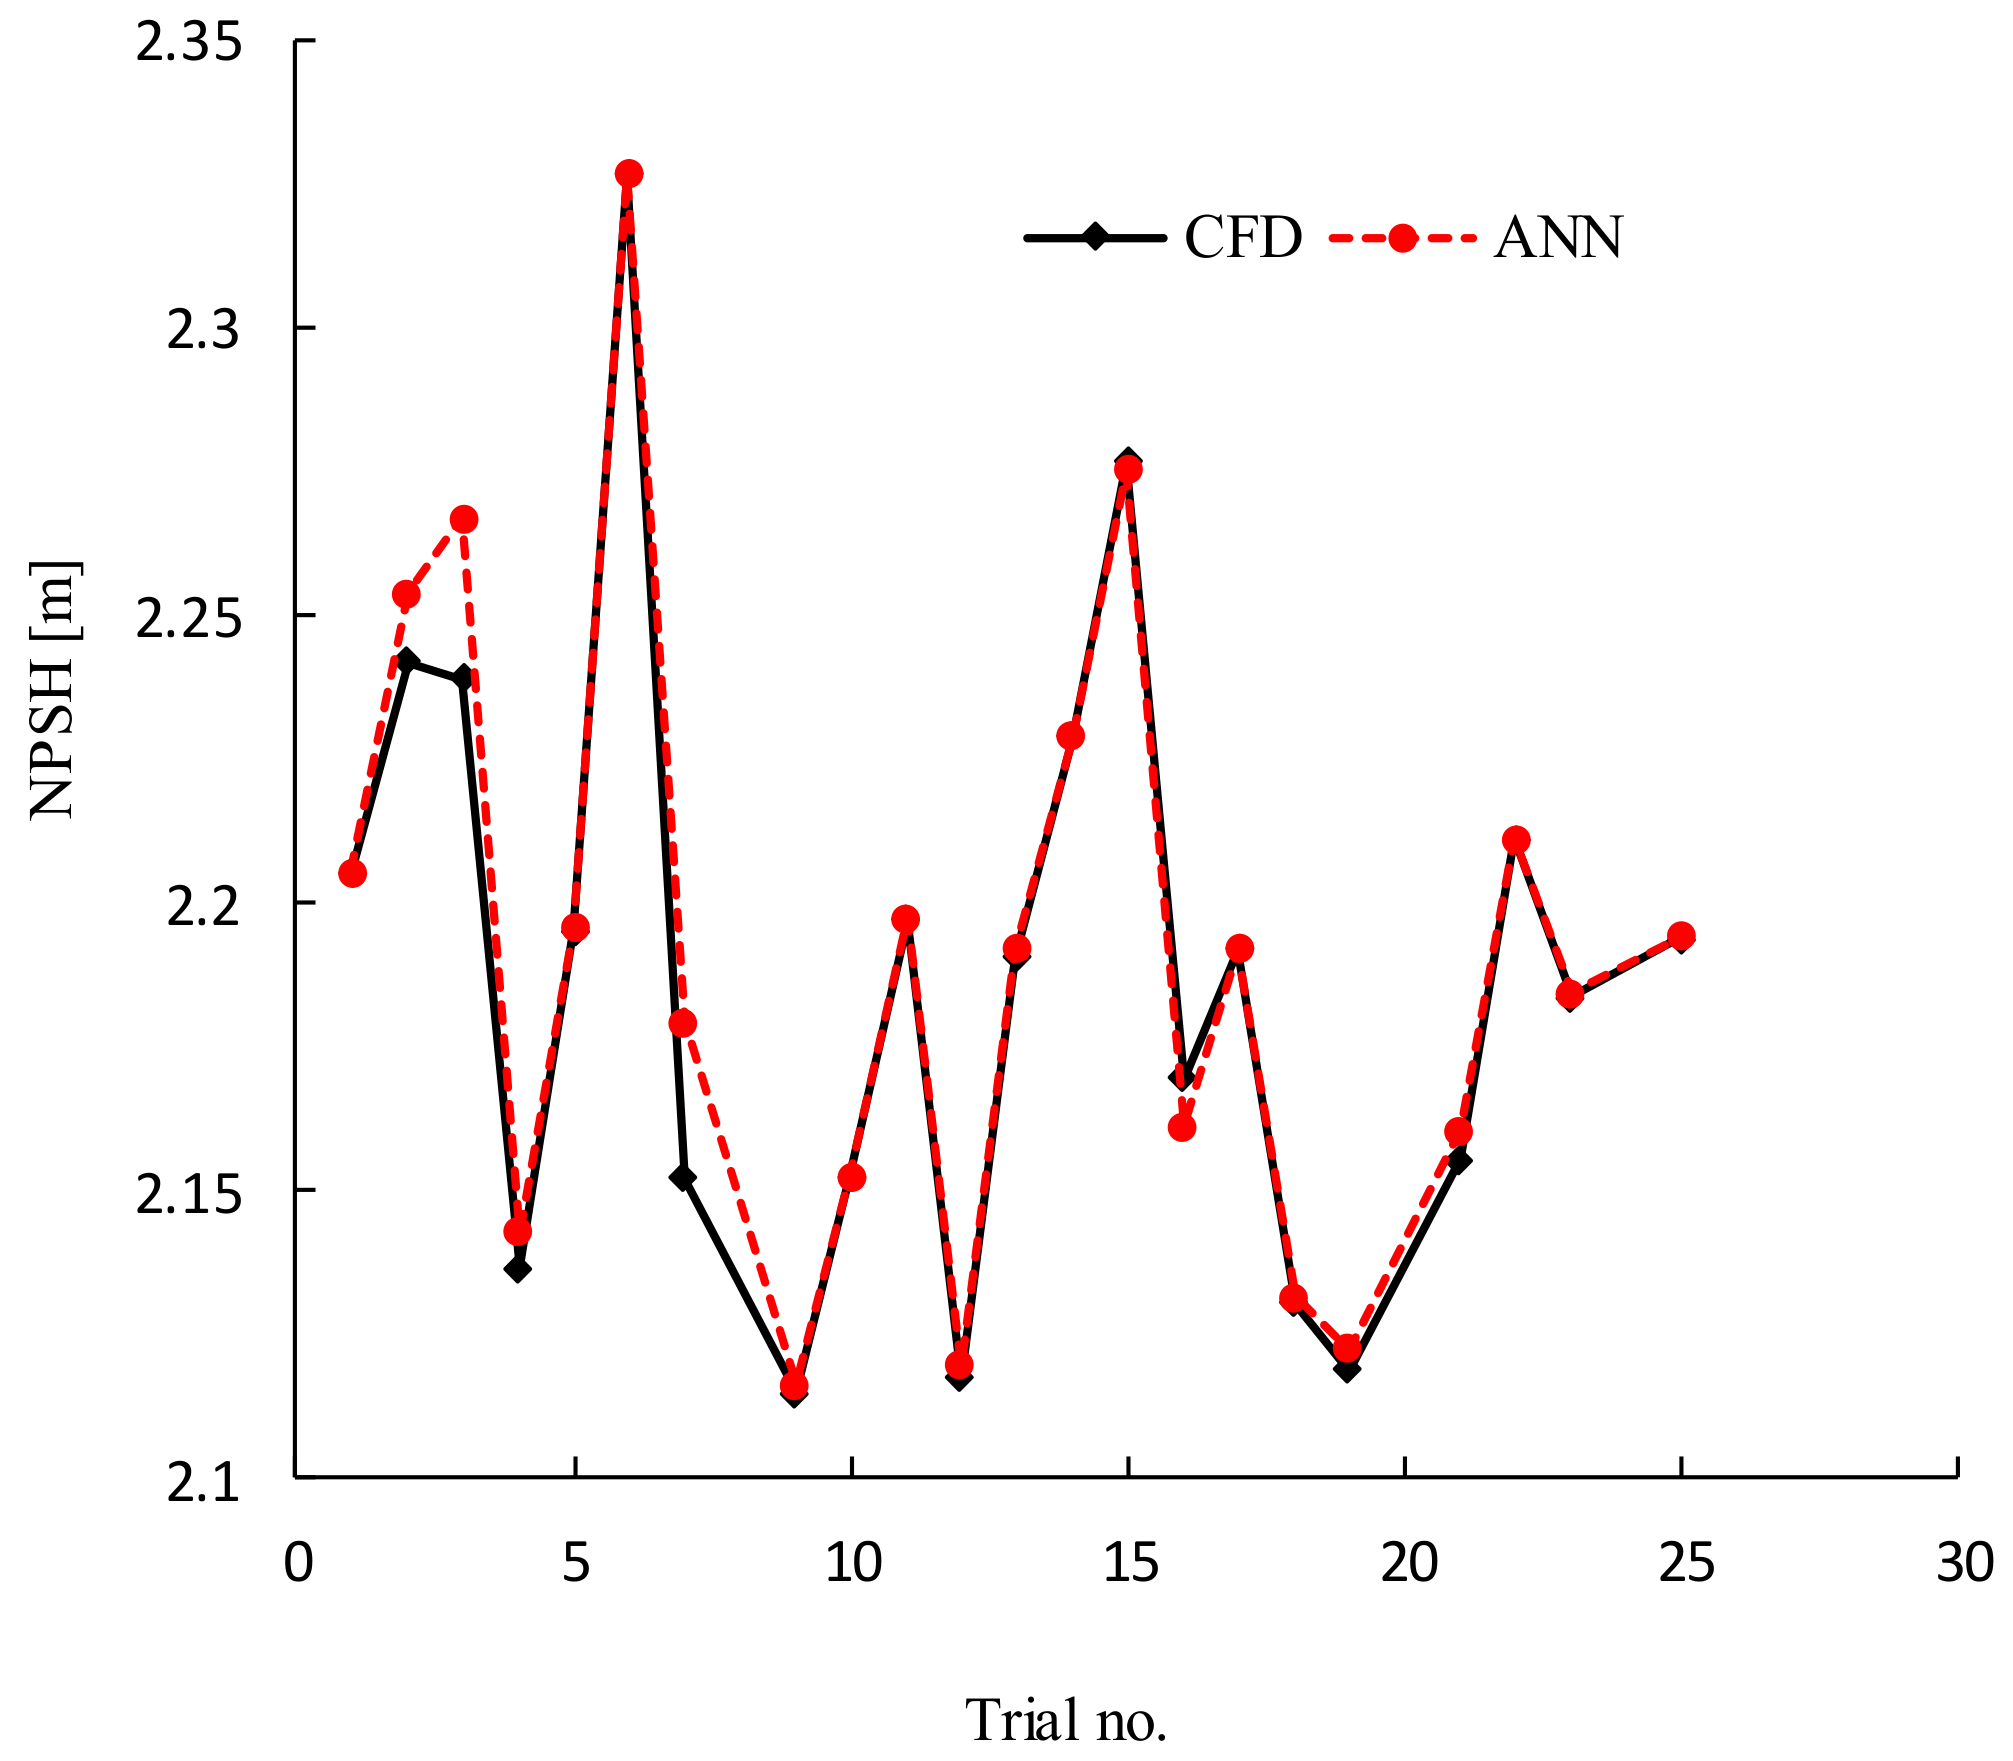
Figure 13.
Validation of ANN NPSHr prediction with CFD at 0.8Qd。
Figure 13.
Validation of ANN NPSHr prediction with CFD at 0.8Qd。
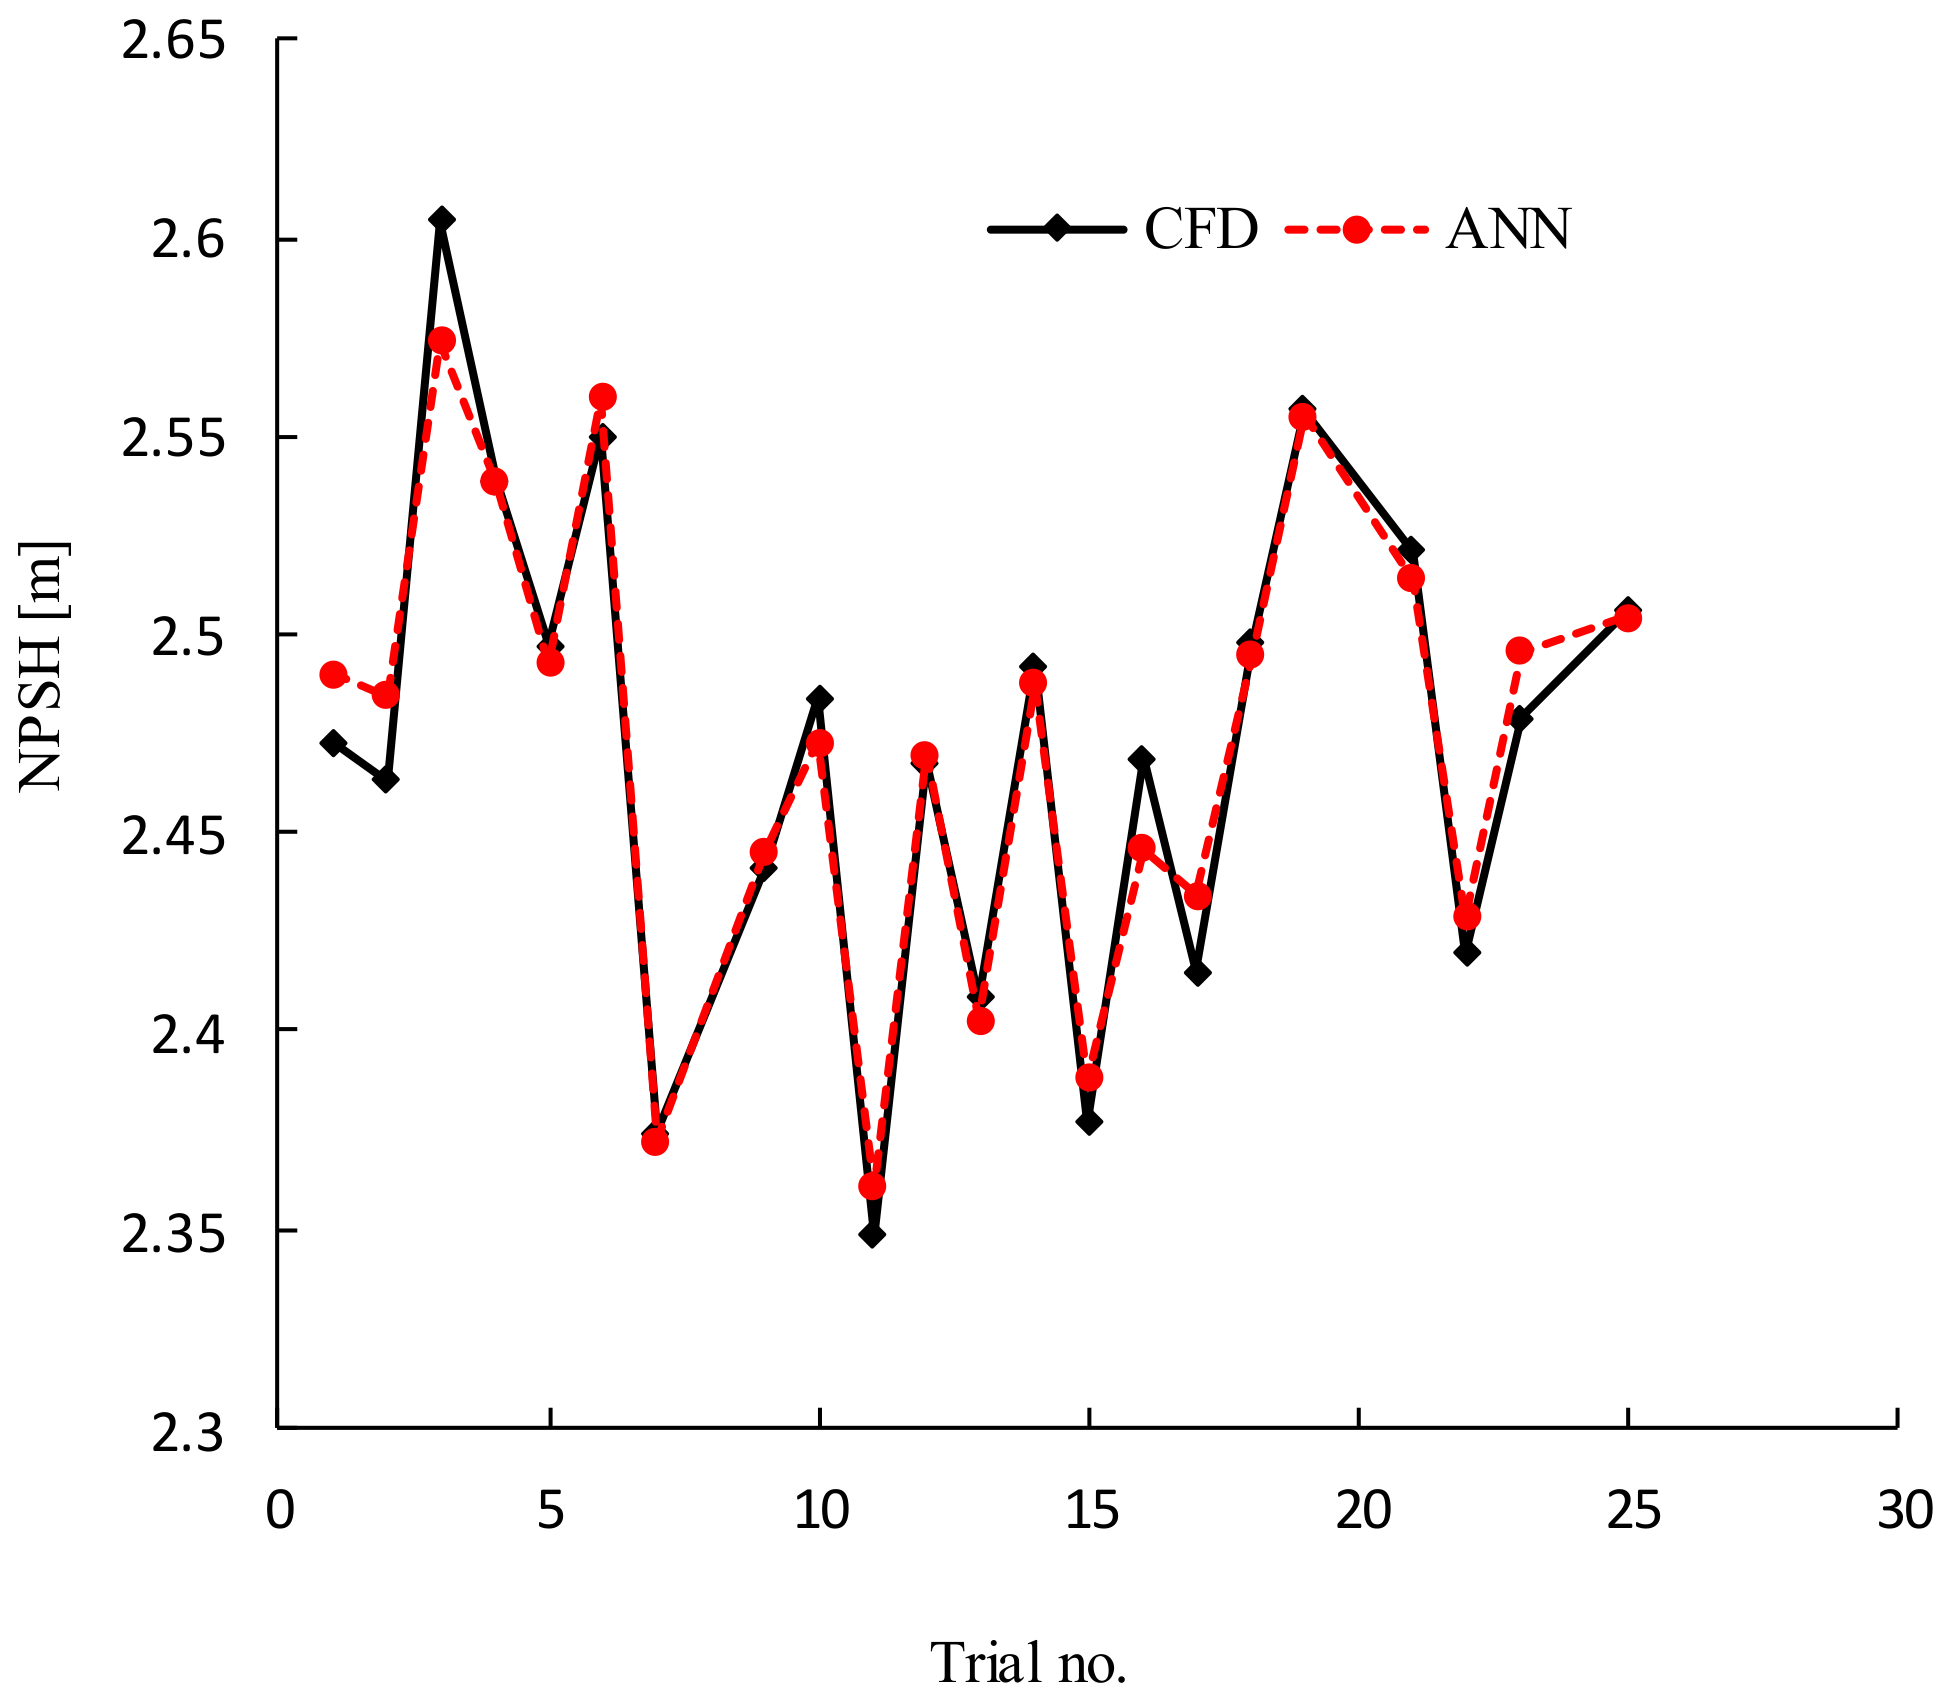
Figure 14.
Validation of ANN prediction with CFD at 1.0 Qd。
Figure 14.
Validation of ANN prediction with CFD at 1.0 Qd。
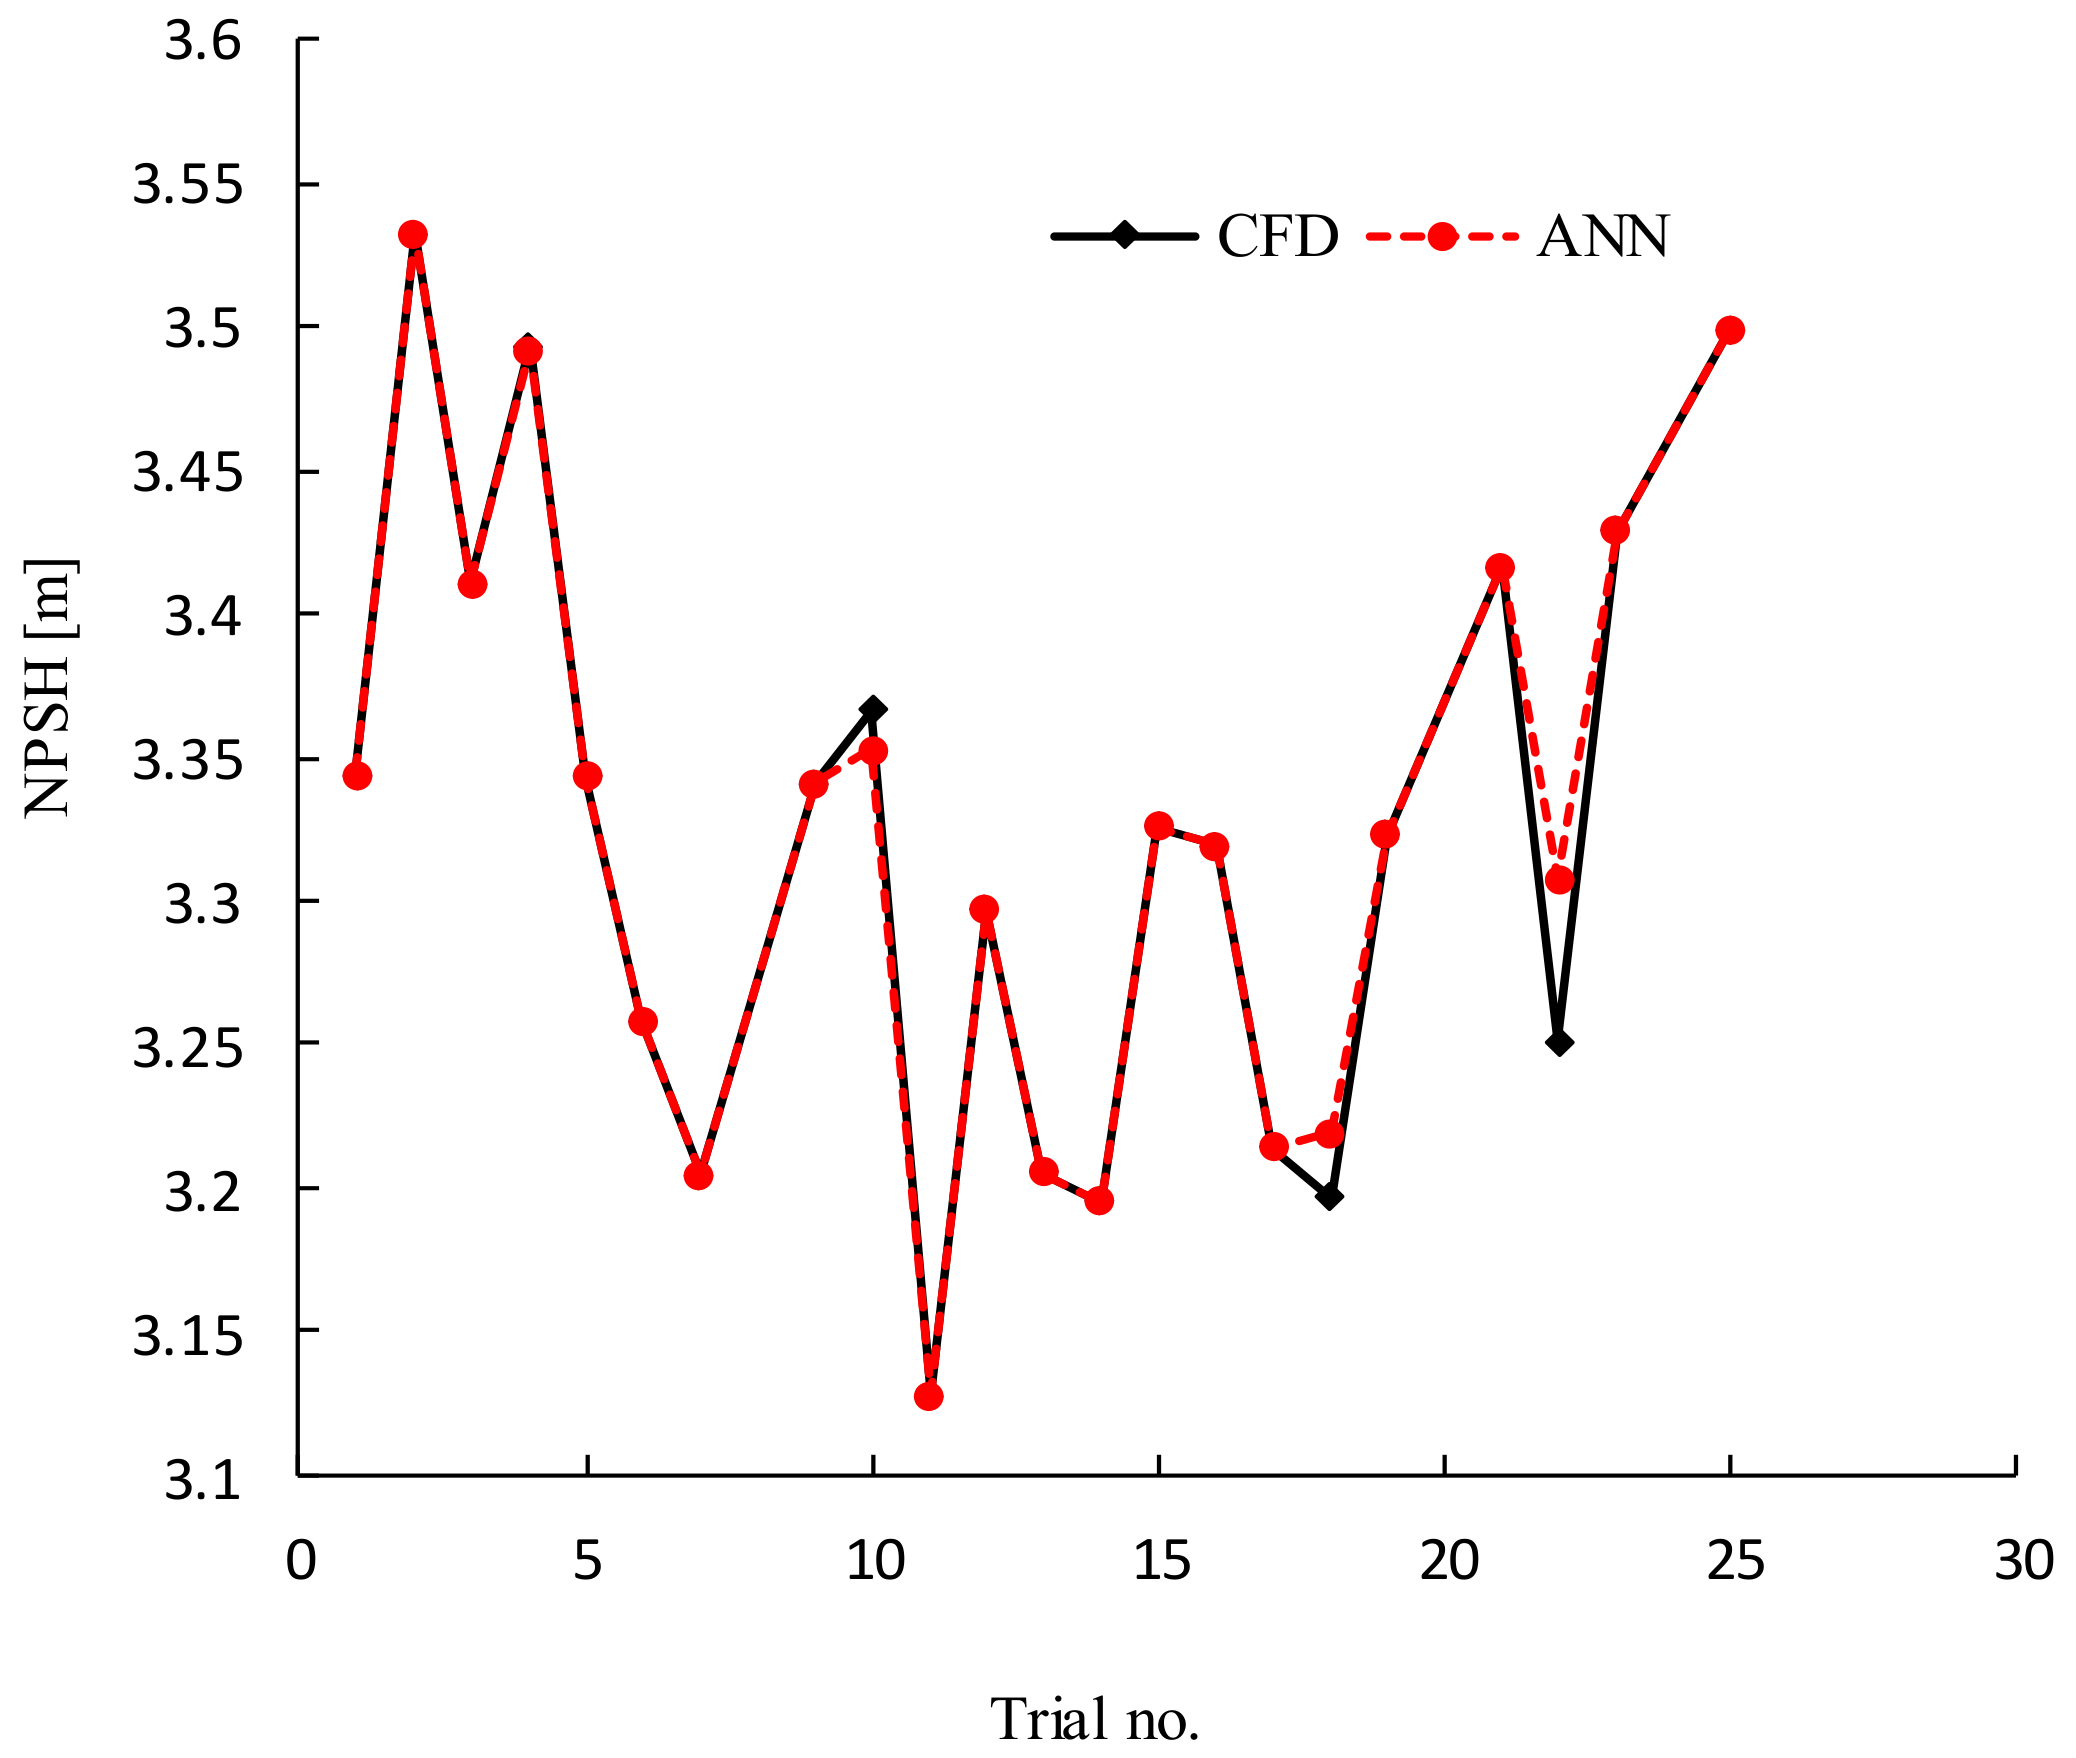
Figure 15.
Validation of ANN prediction with CFD at 1.2 Qd。
Figure 15.
Validation of ANN prediction with CFD at 1.2 Qd。
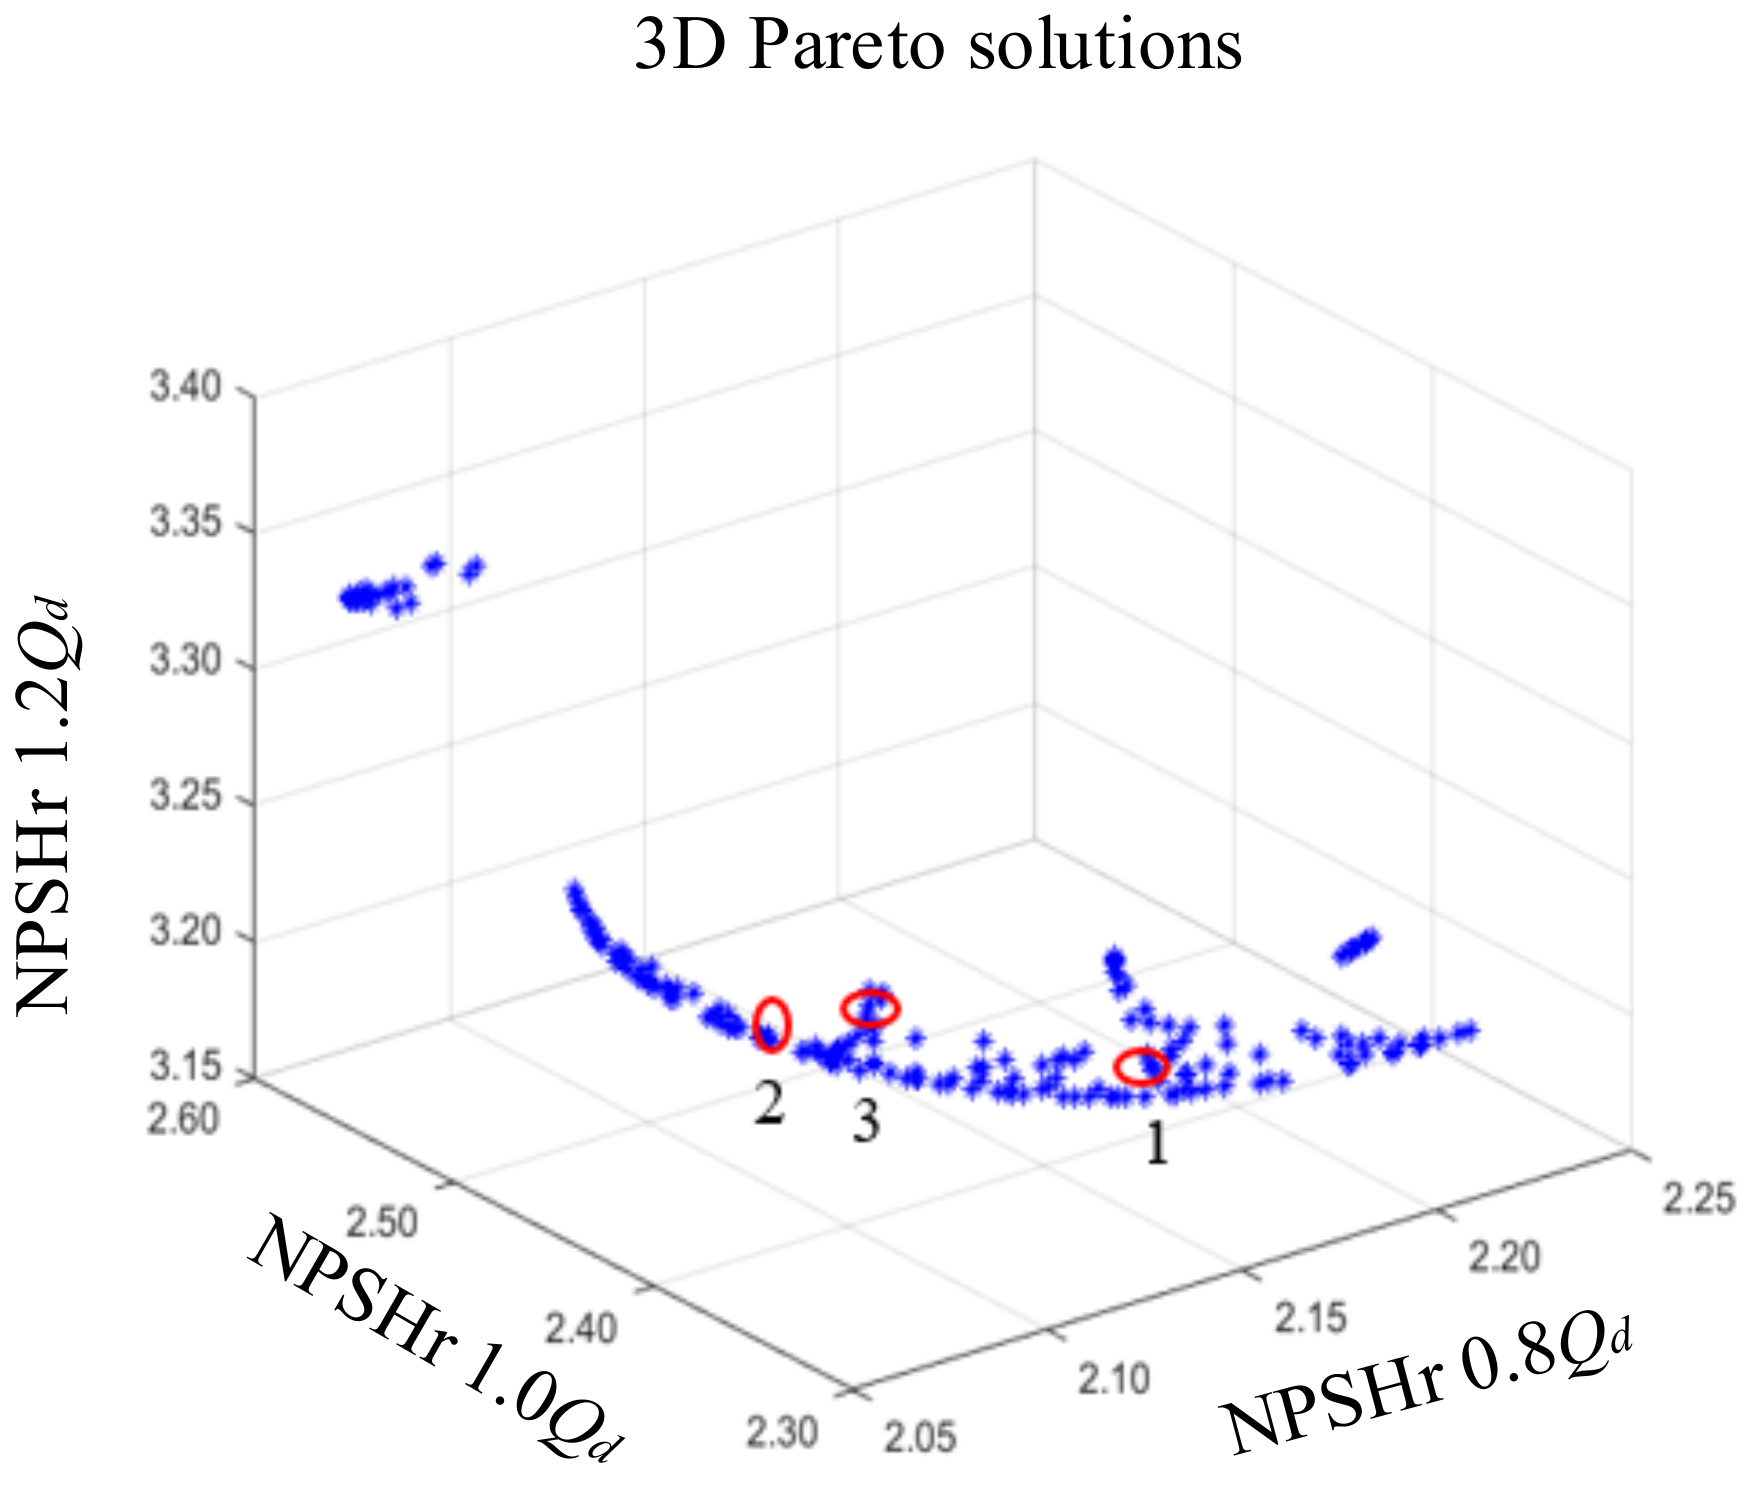
Figure 16.
Pareto-frontiers from ANN.
Figure 16.
Pareto-frontiers from ANN.
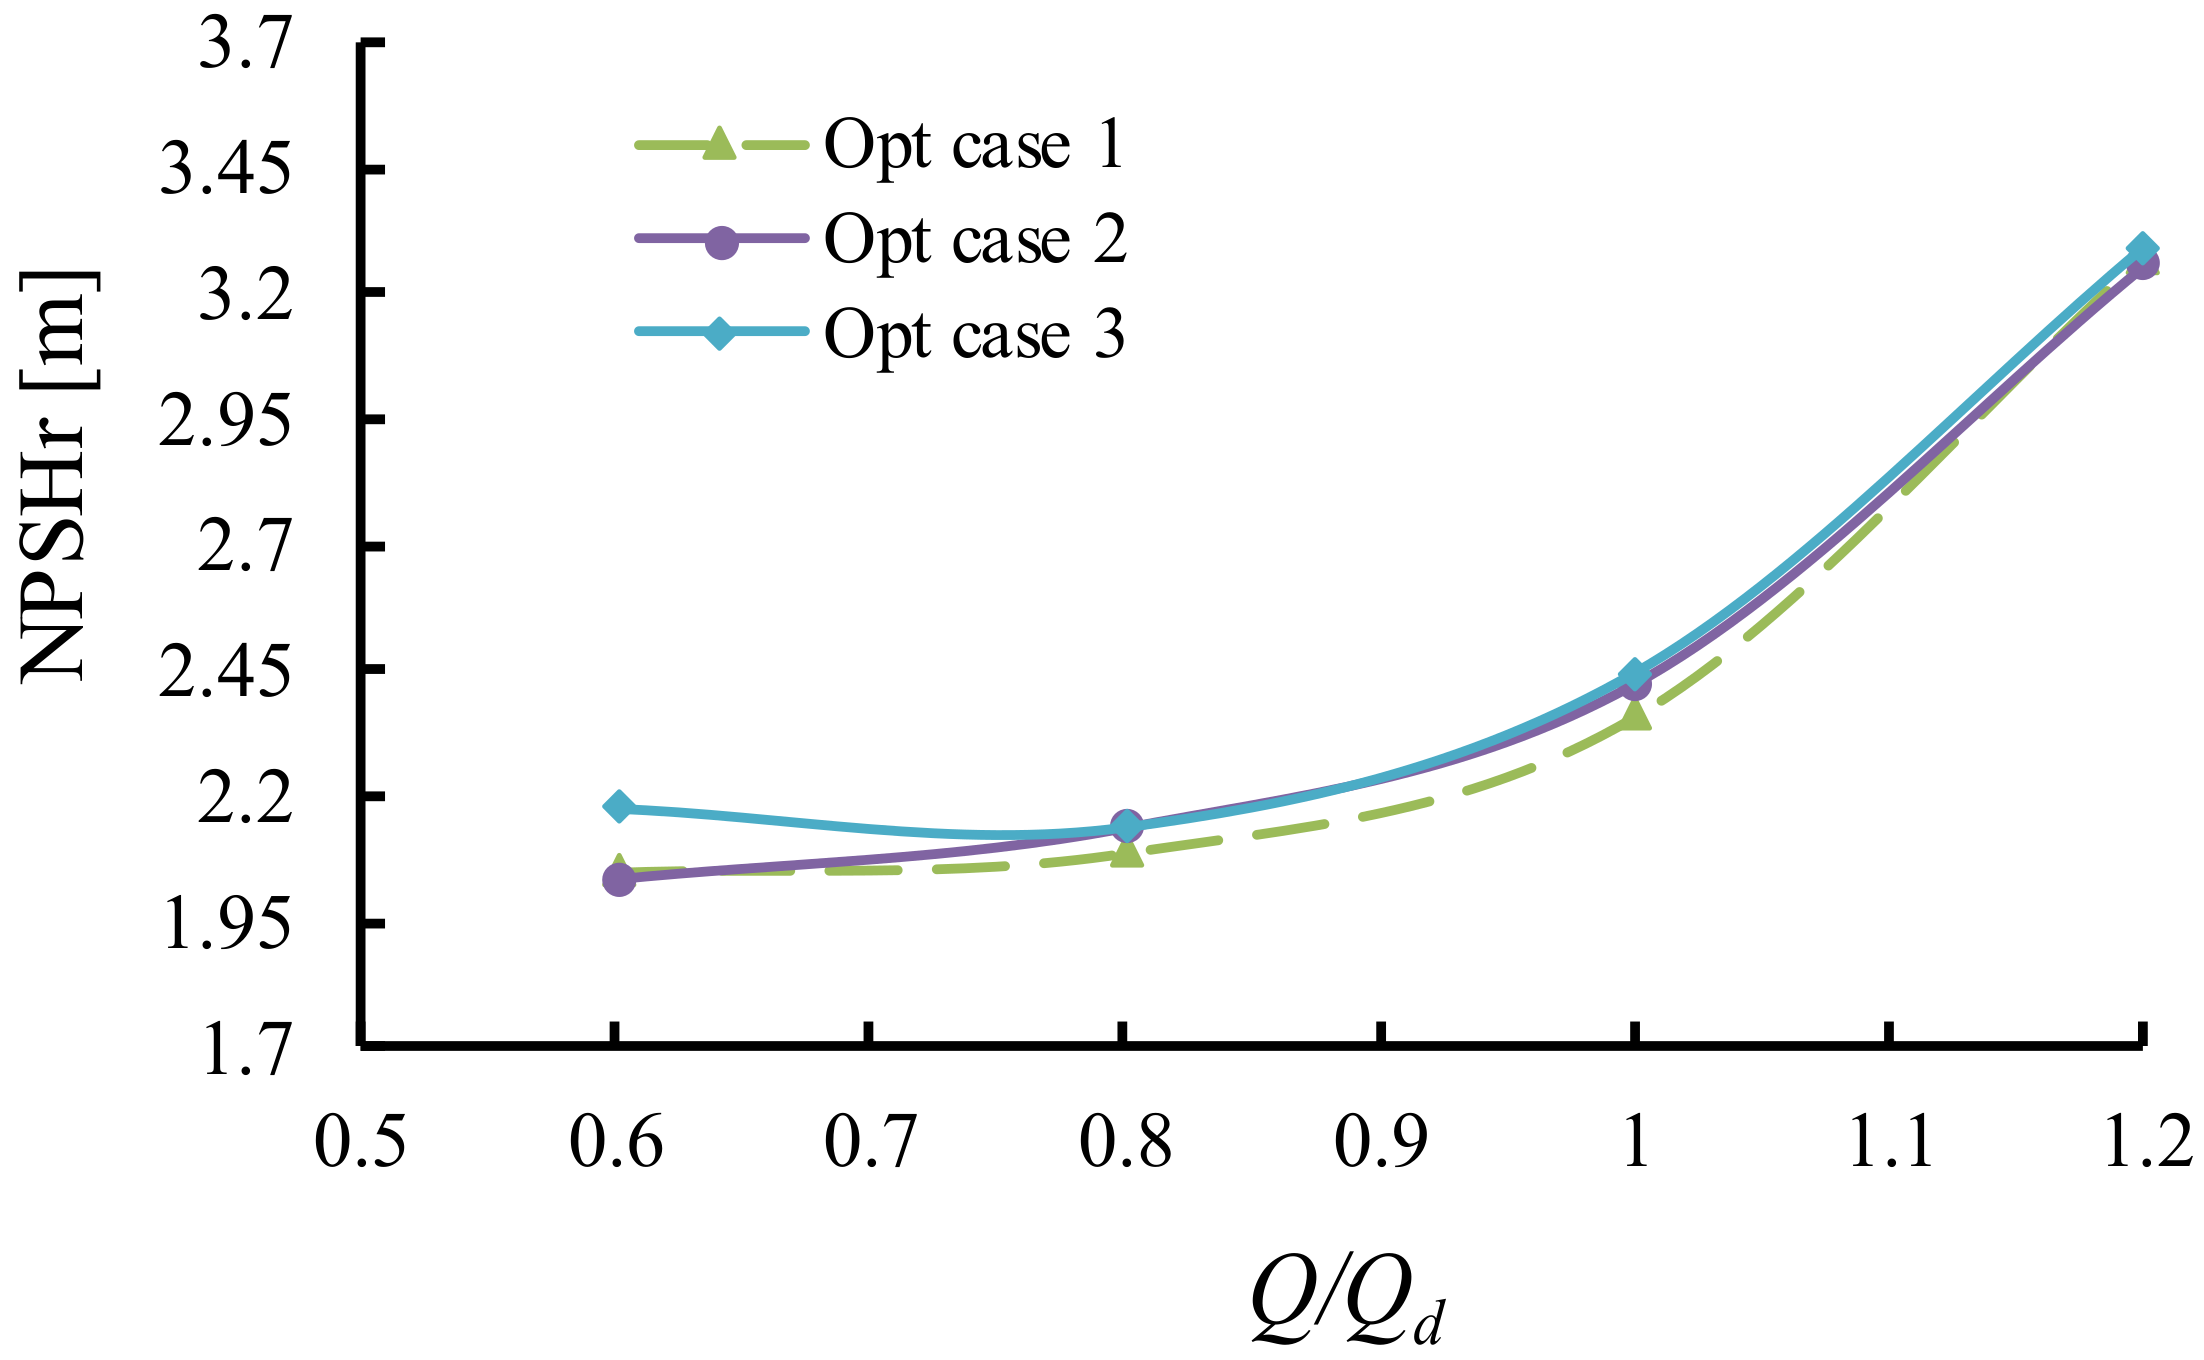
Figure 17.
Suction performance of optimized cases and experiments.
Figure 17.
Suction performance of optimized cases and experiments.
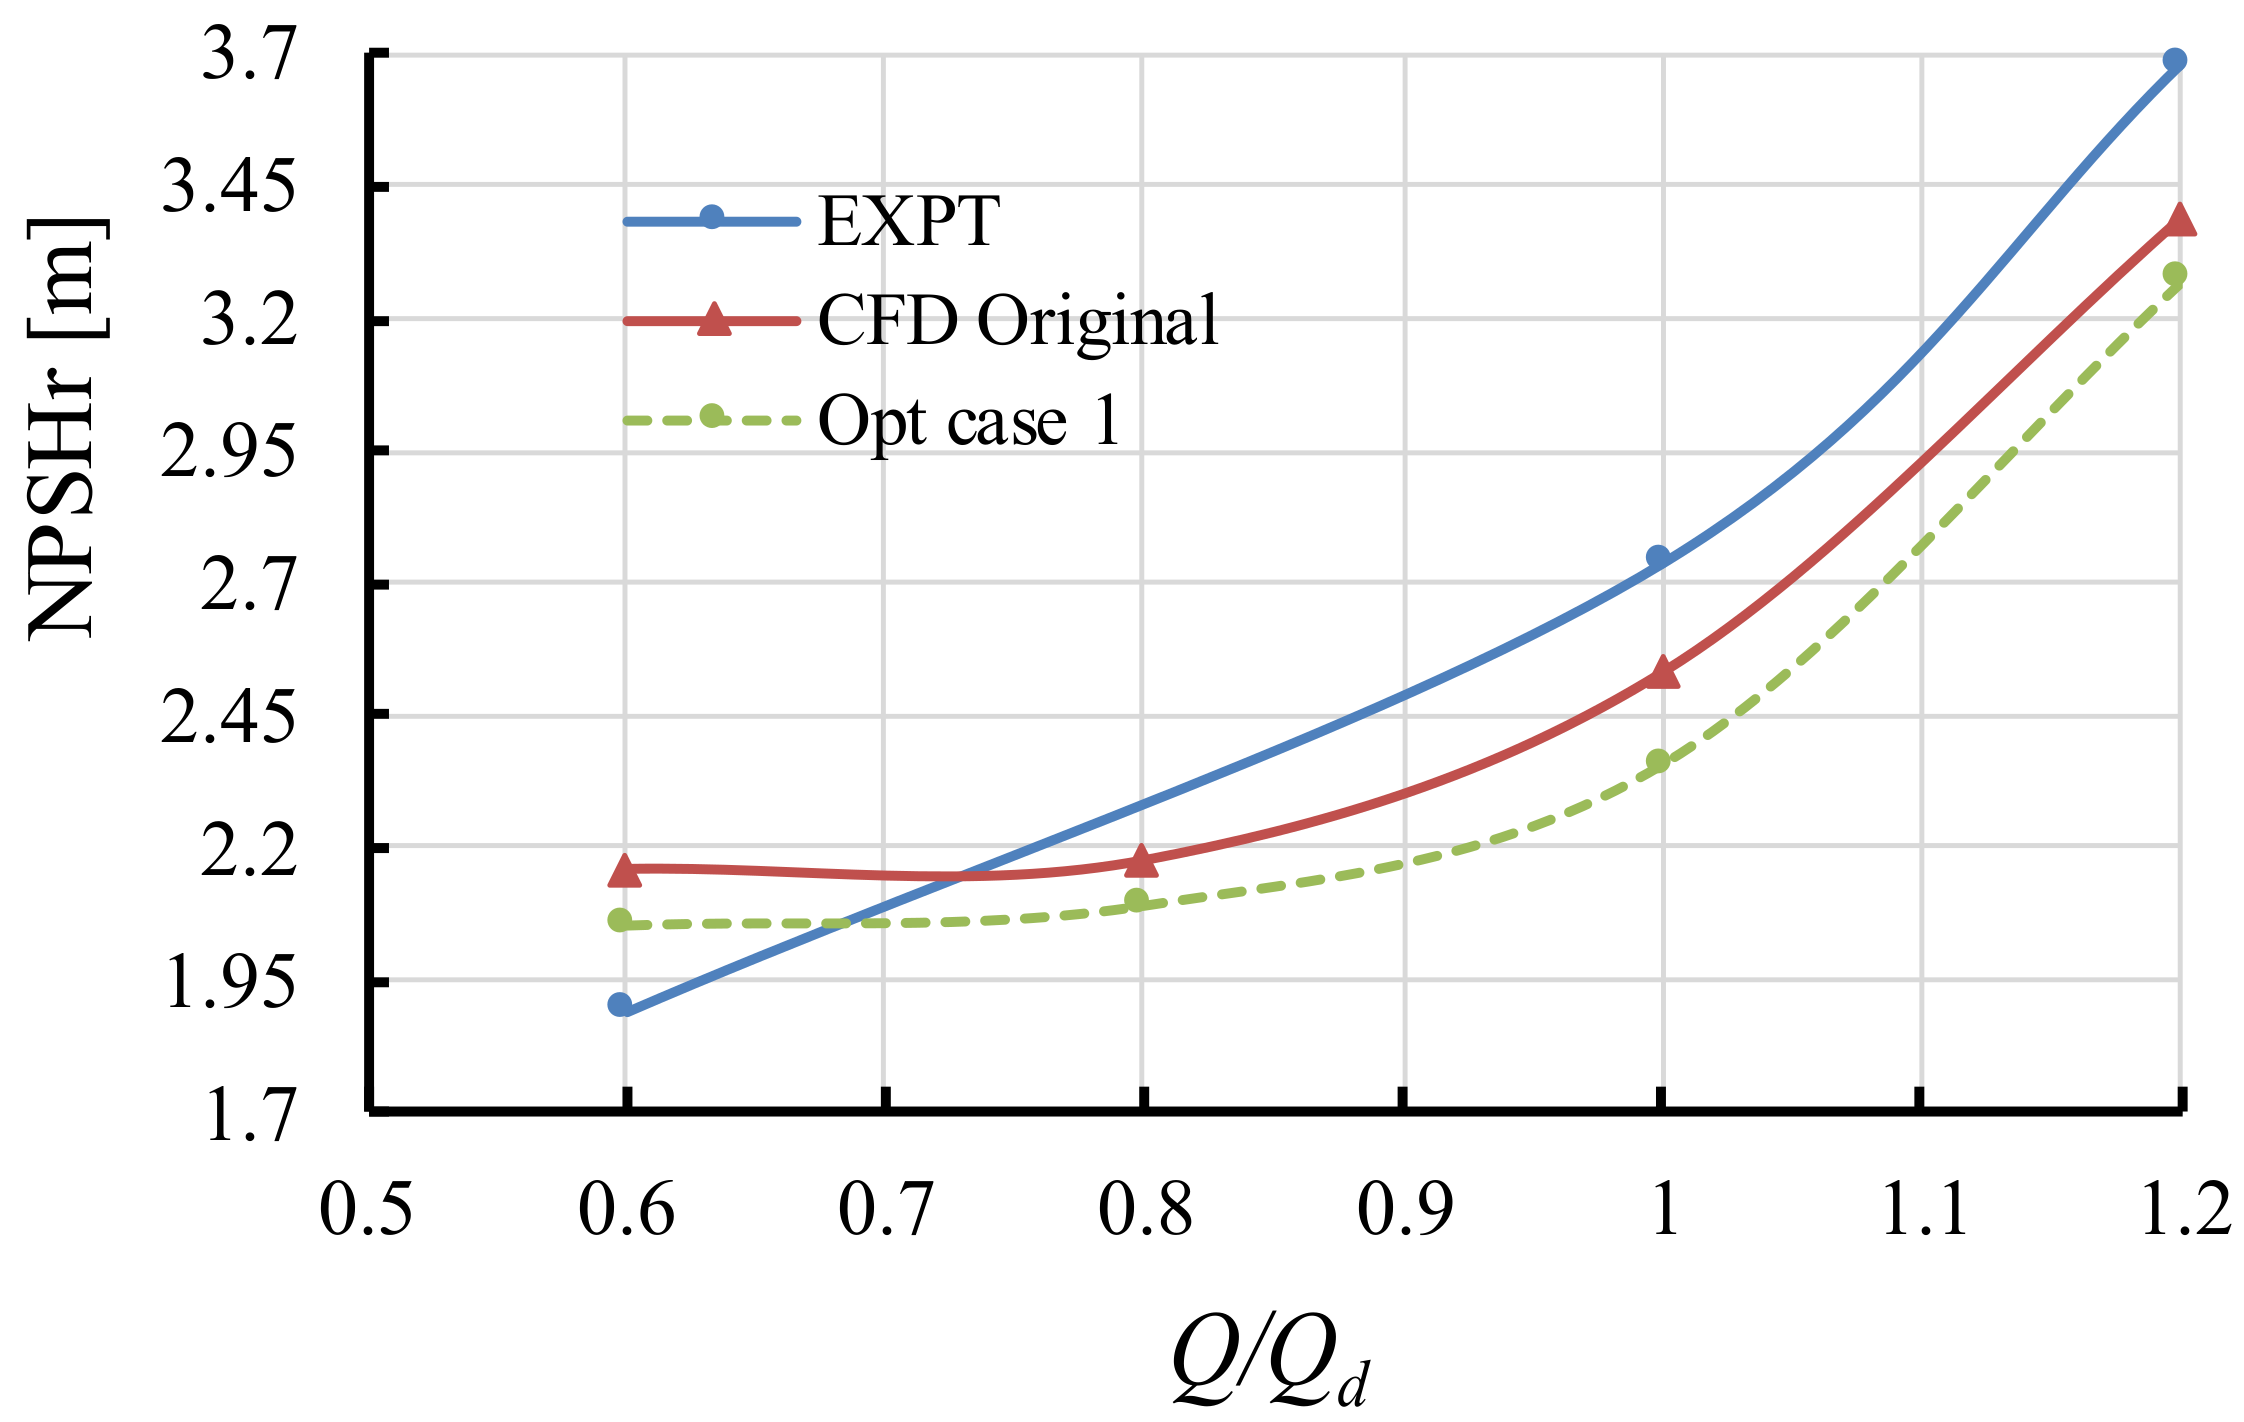
Figure 18.
Verification of optimized case 1 with original model.
Figure 18.
Verification of optimized case 1 with original model.
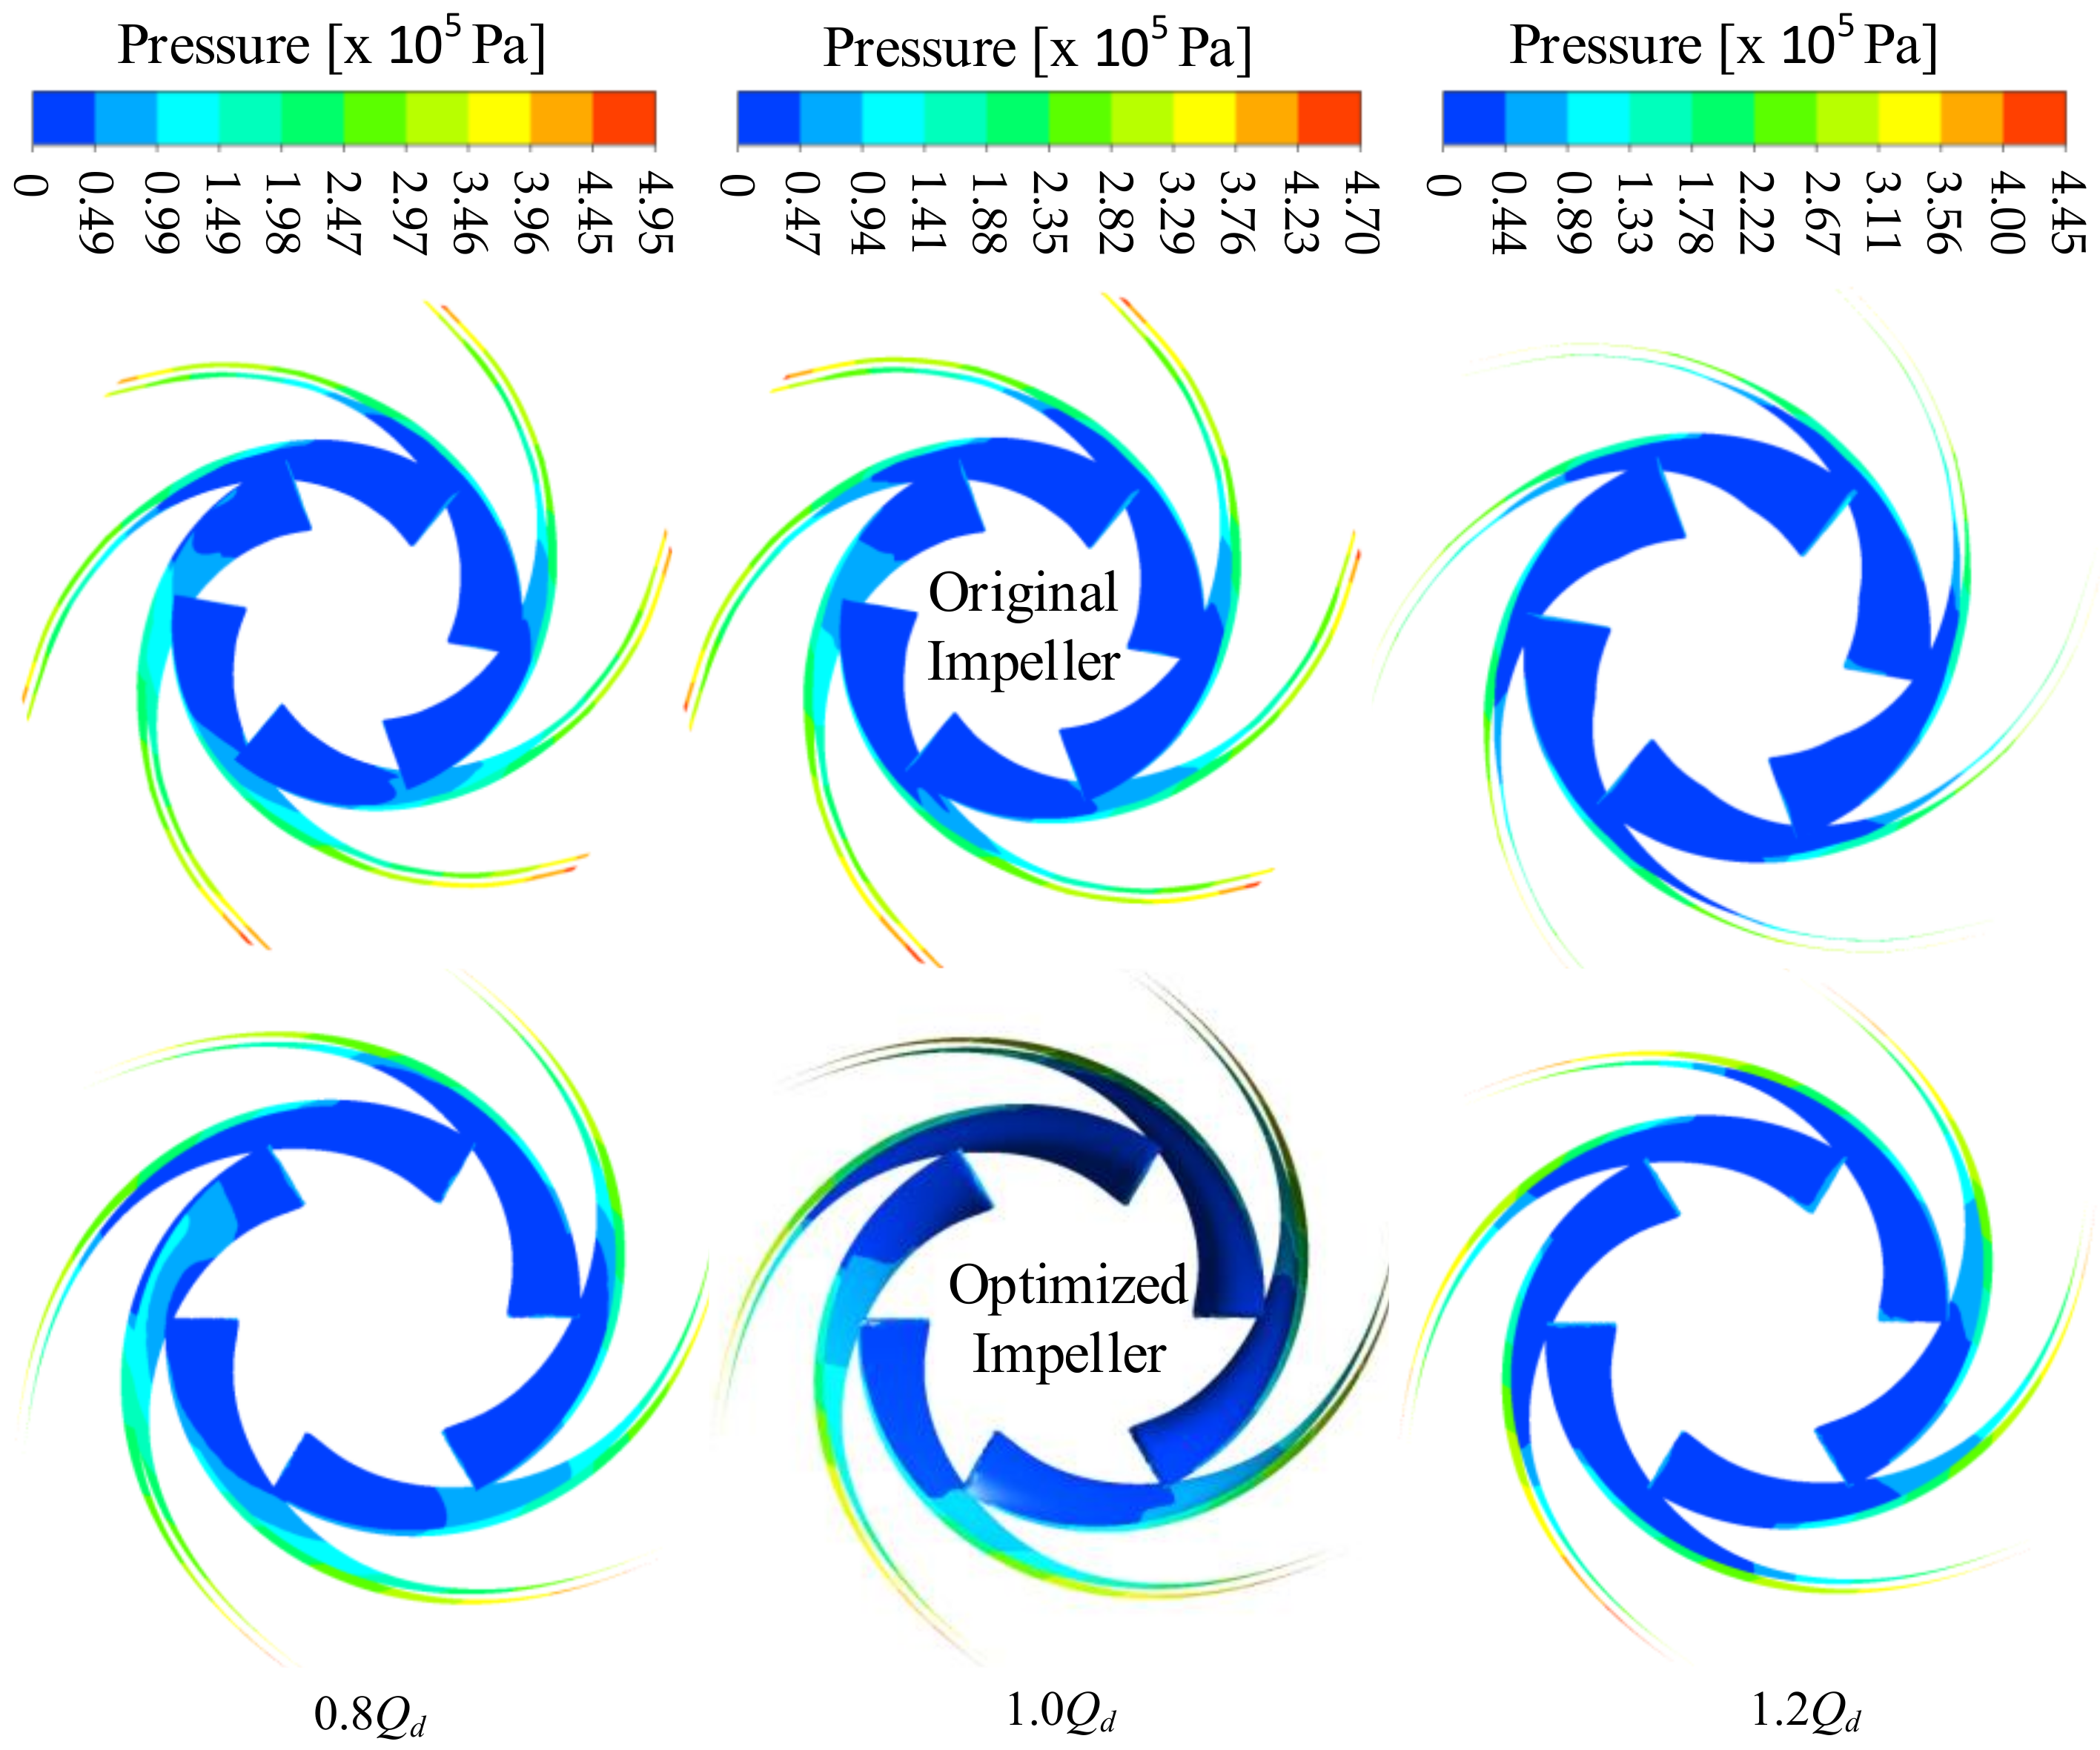
Figure 19.
Pressure distribution on blade surface at 0% head drop.
Figure 19.
Pressure distribution on blade surface at 0% head drop.
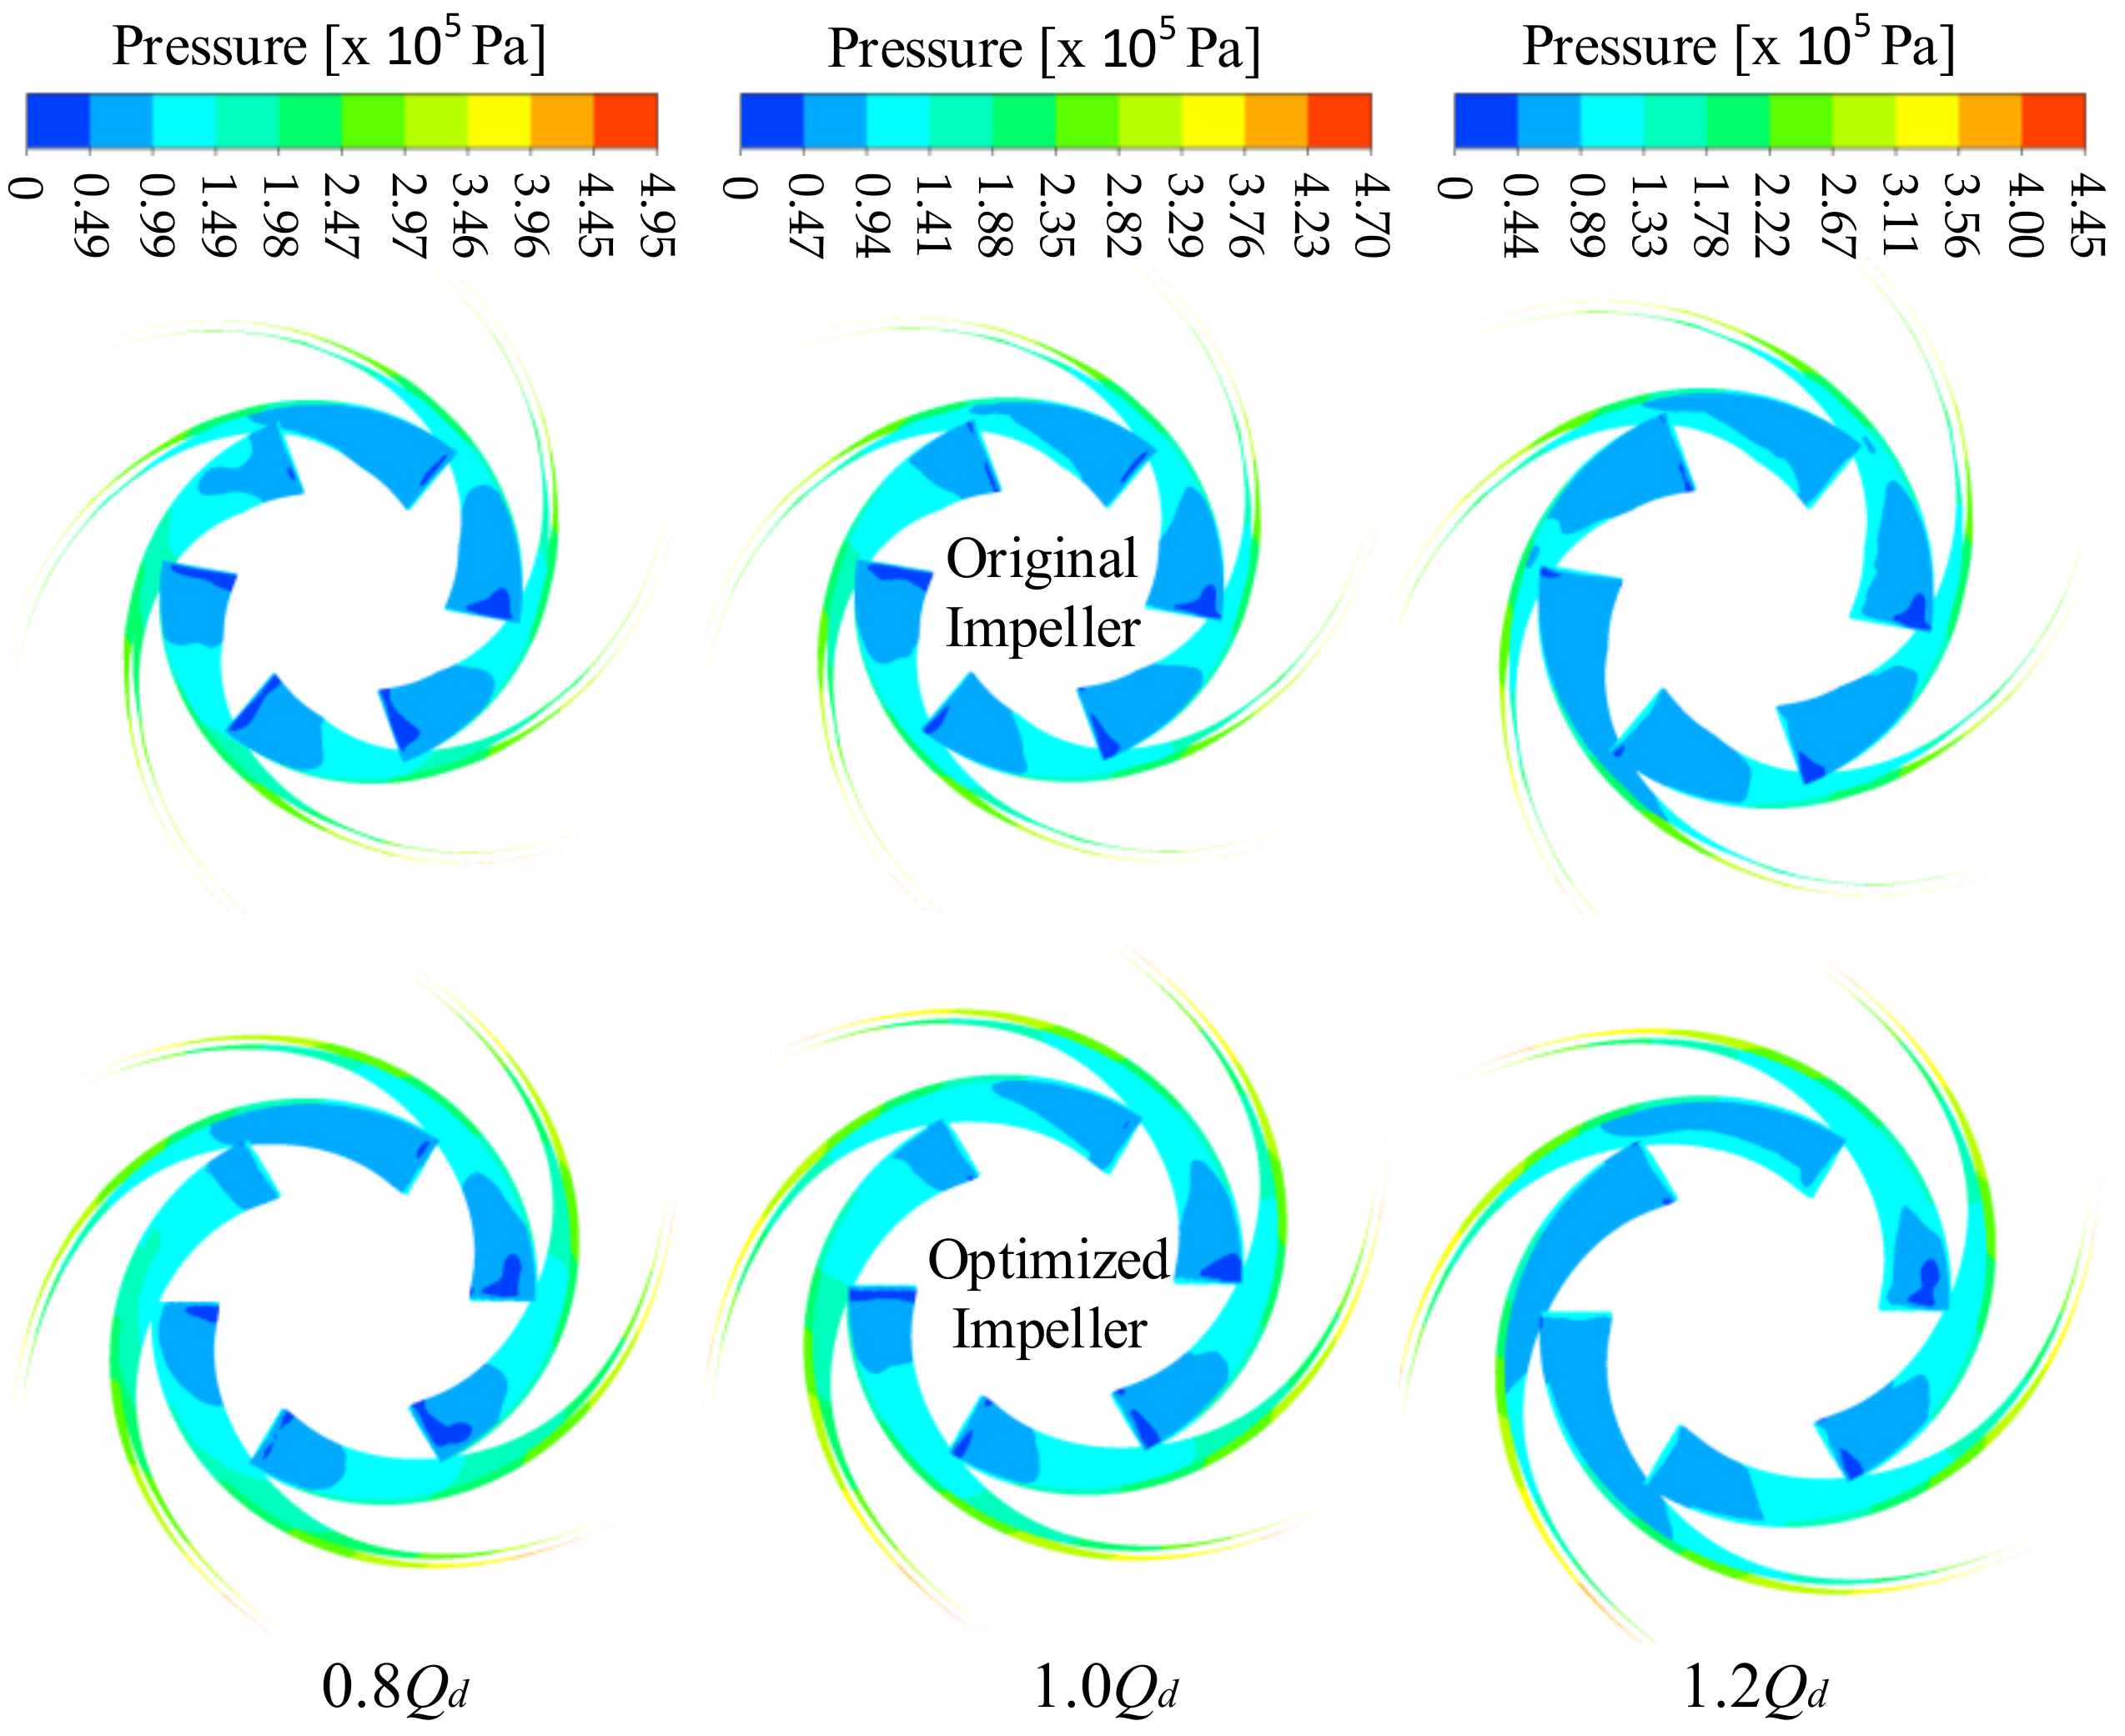
Figure 20.
Pressure distribution on blade surface at 3% head drop.
Figure 20.
Pressure distribution on blade surface at 3% head drop.
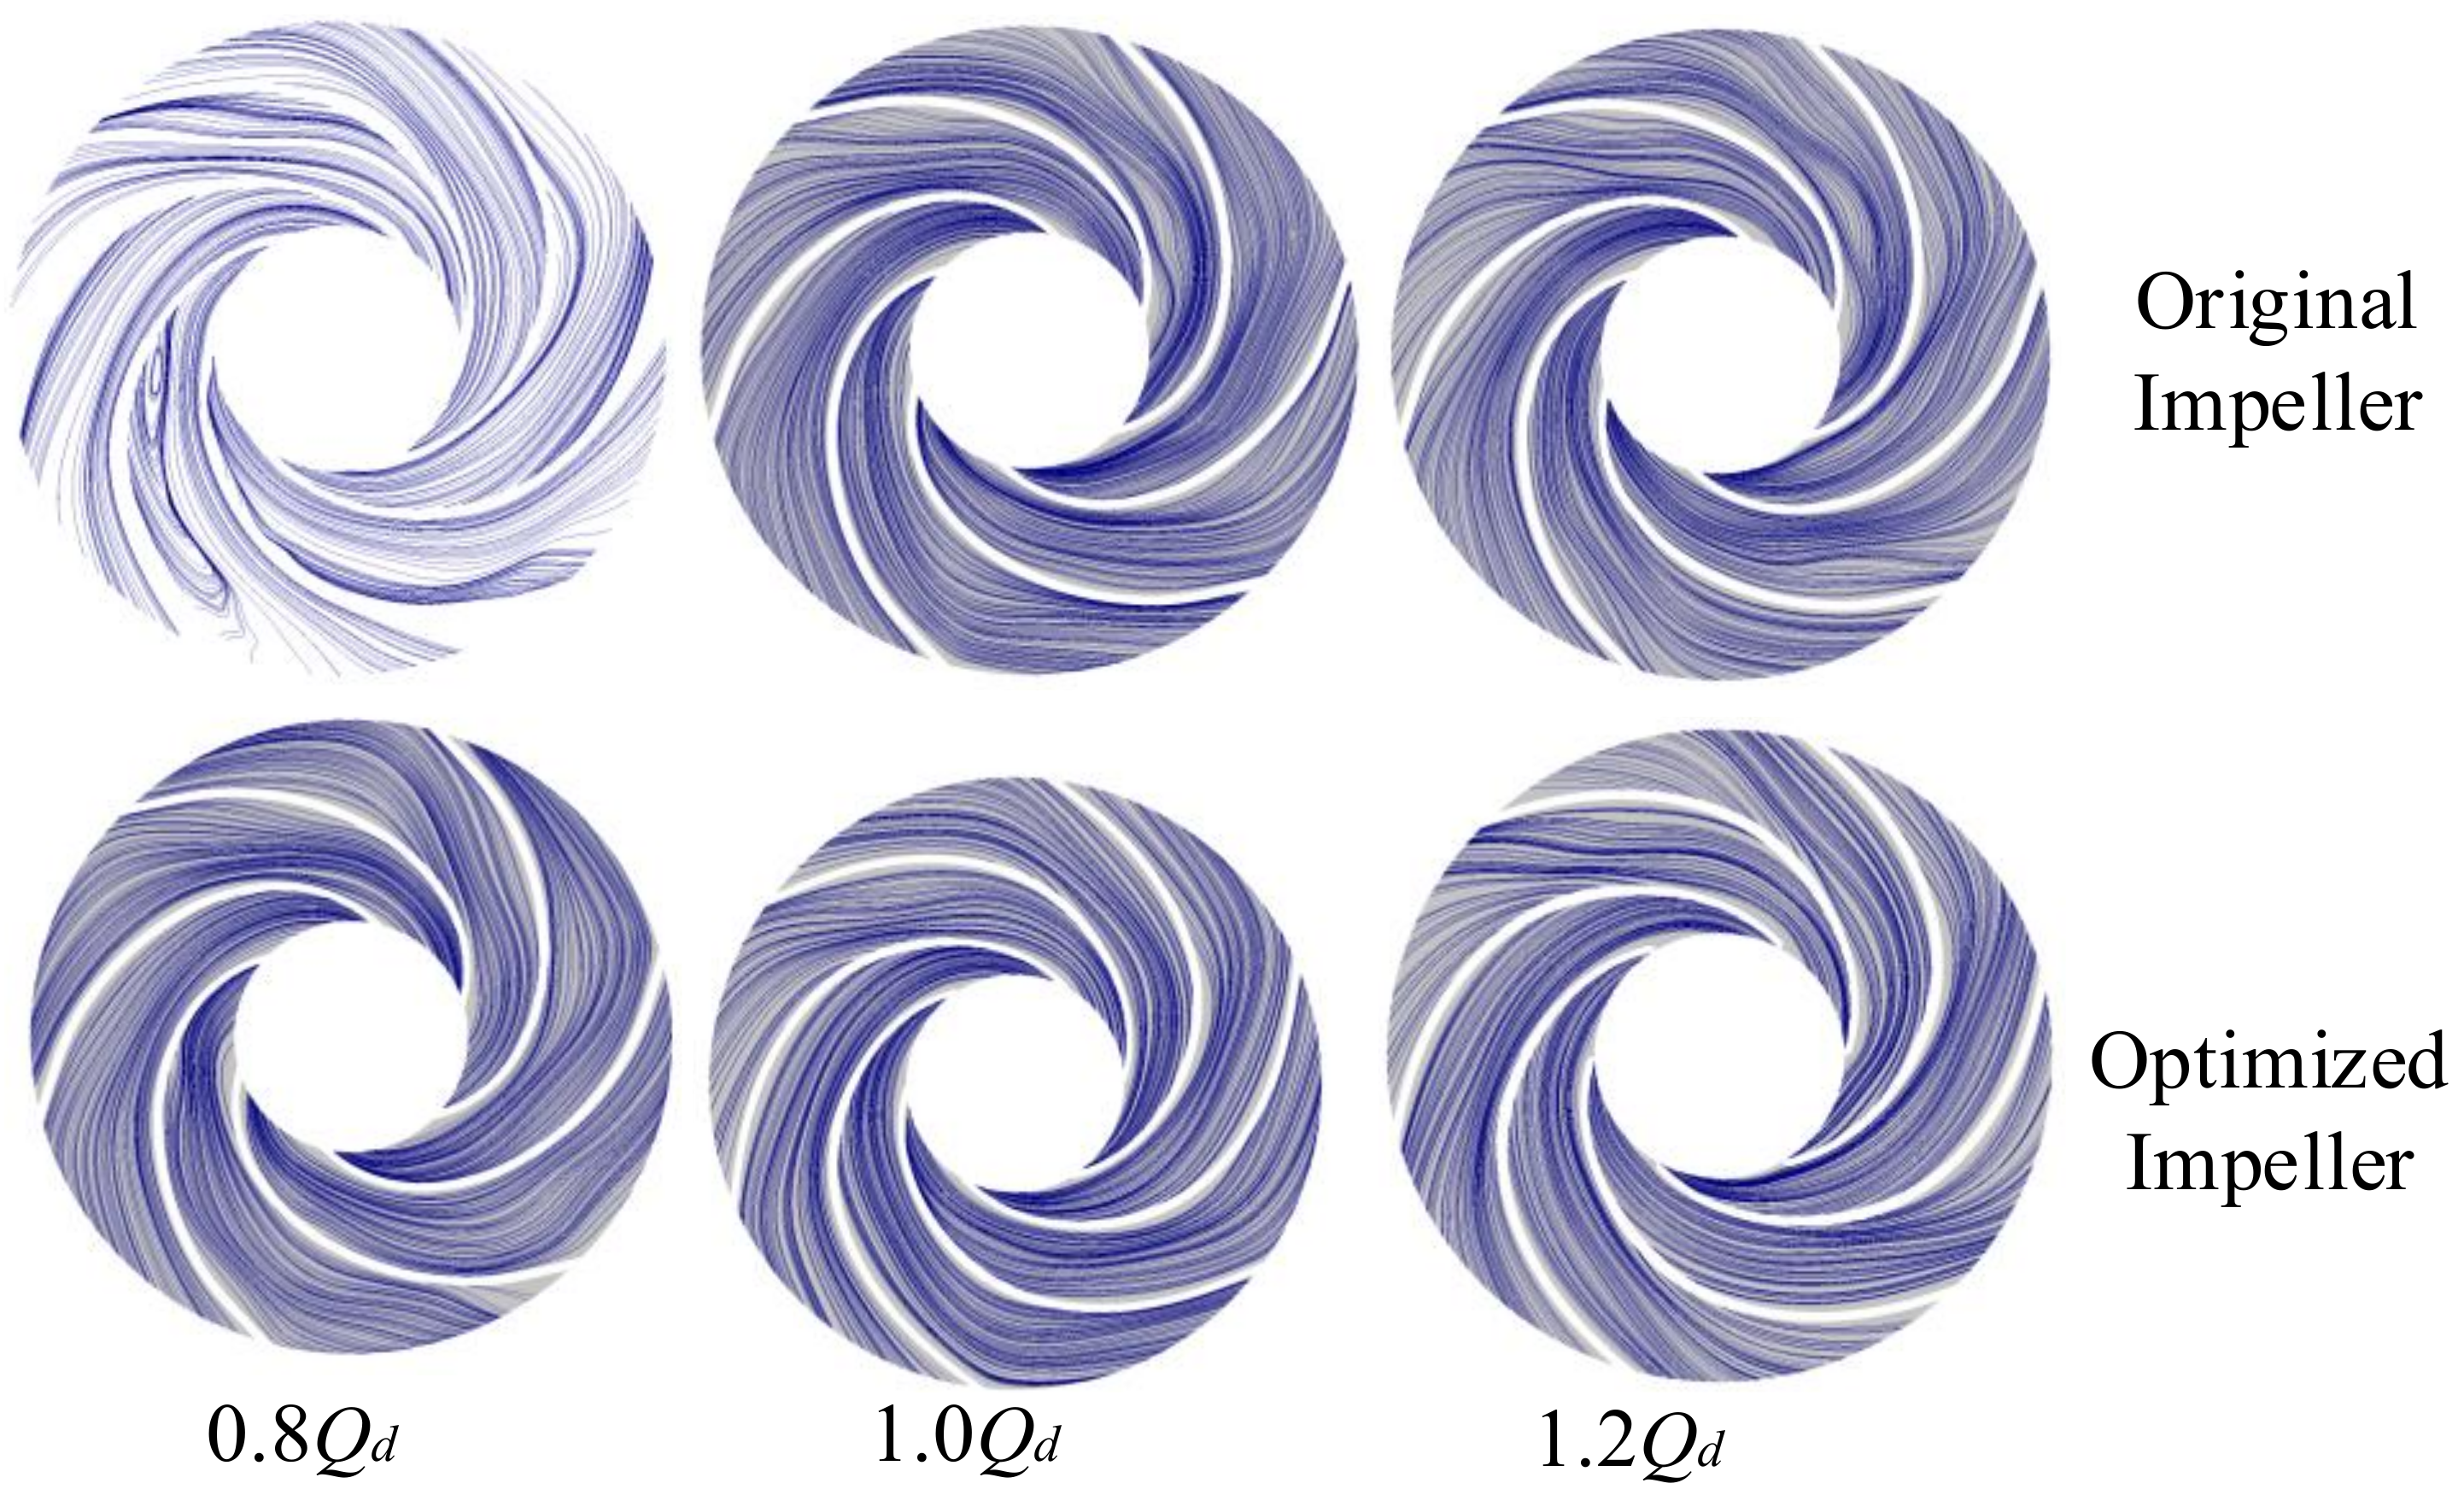
Figure 21.
Streamline pattern in impeller channel.
Figure 21.
Streamline pattern in impeller channel.
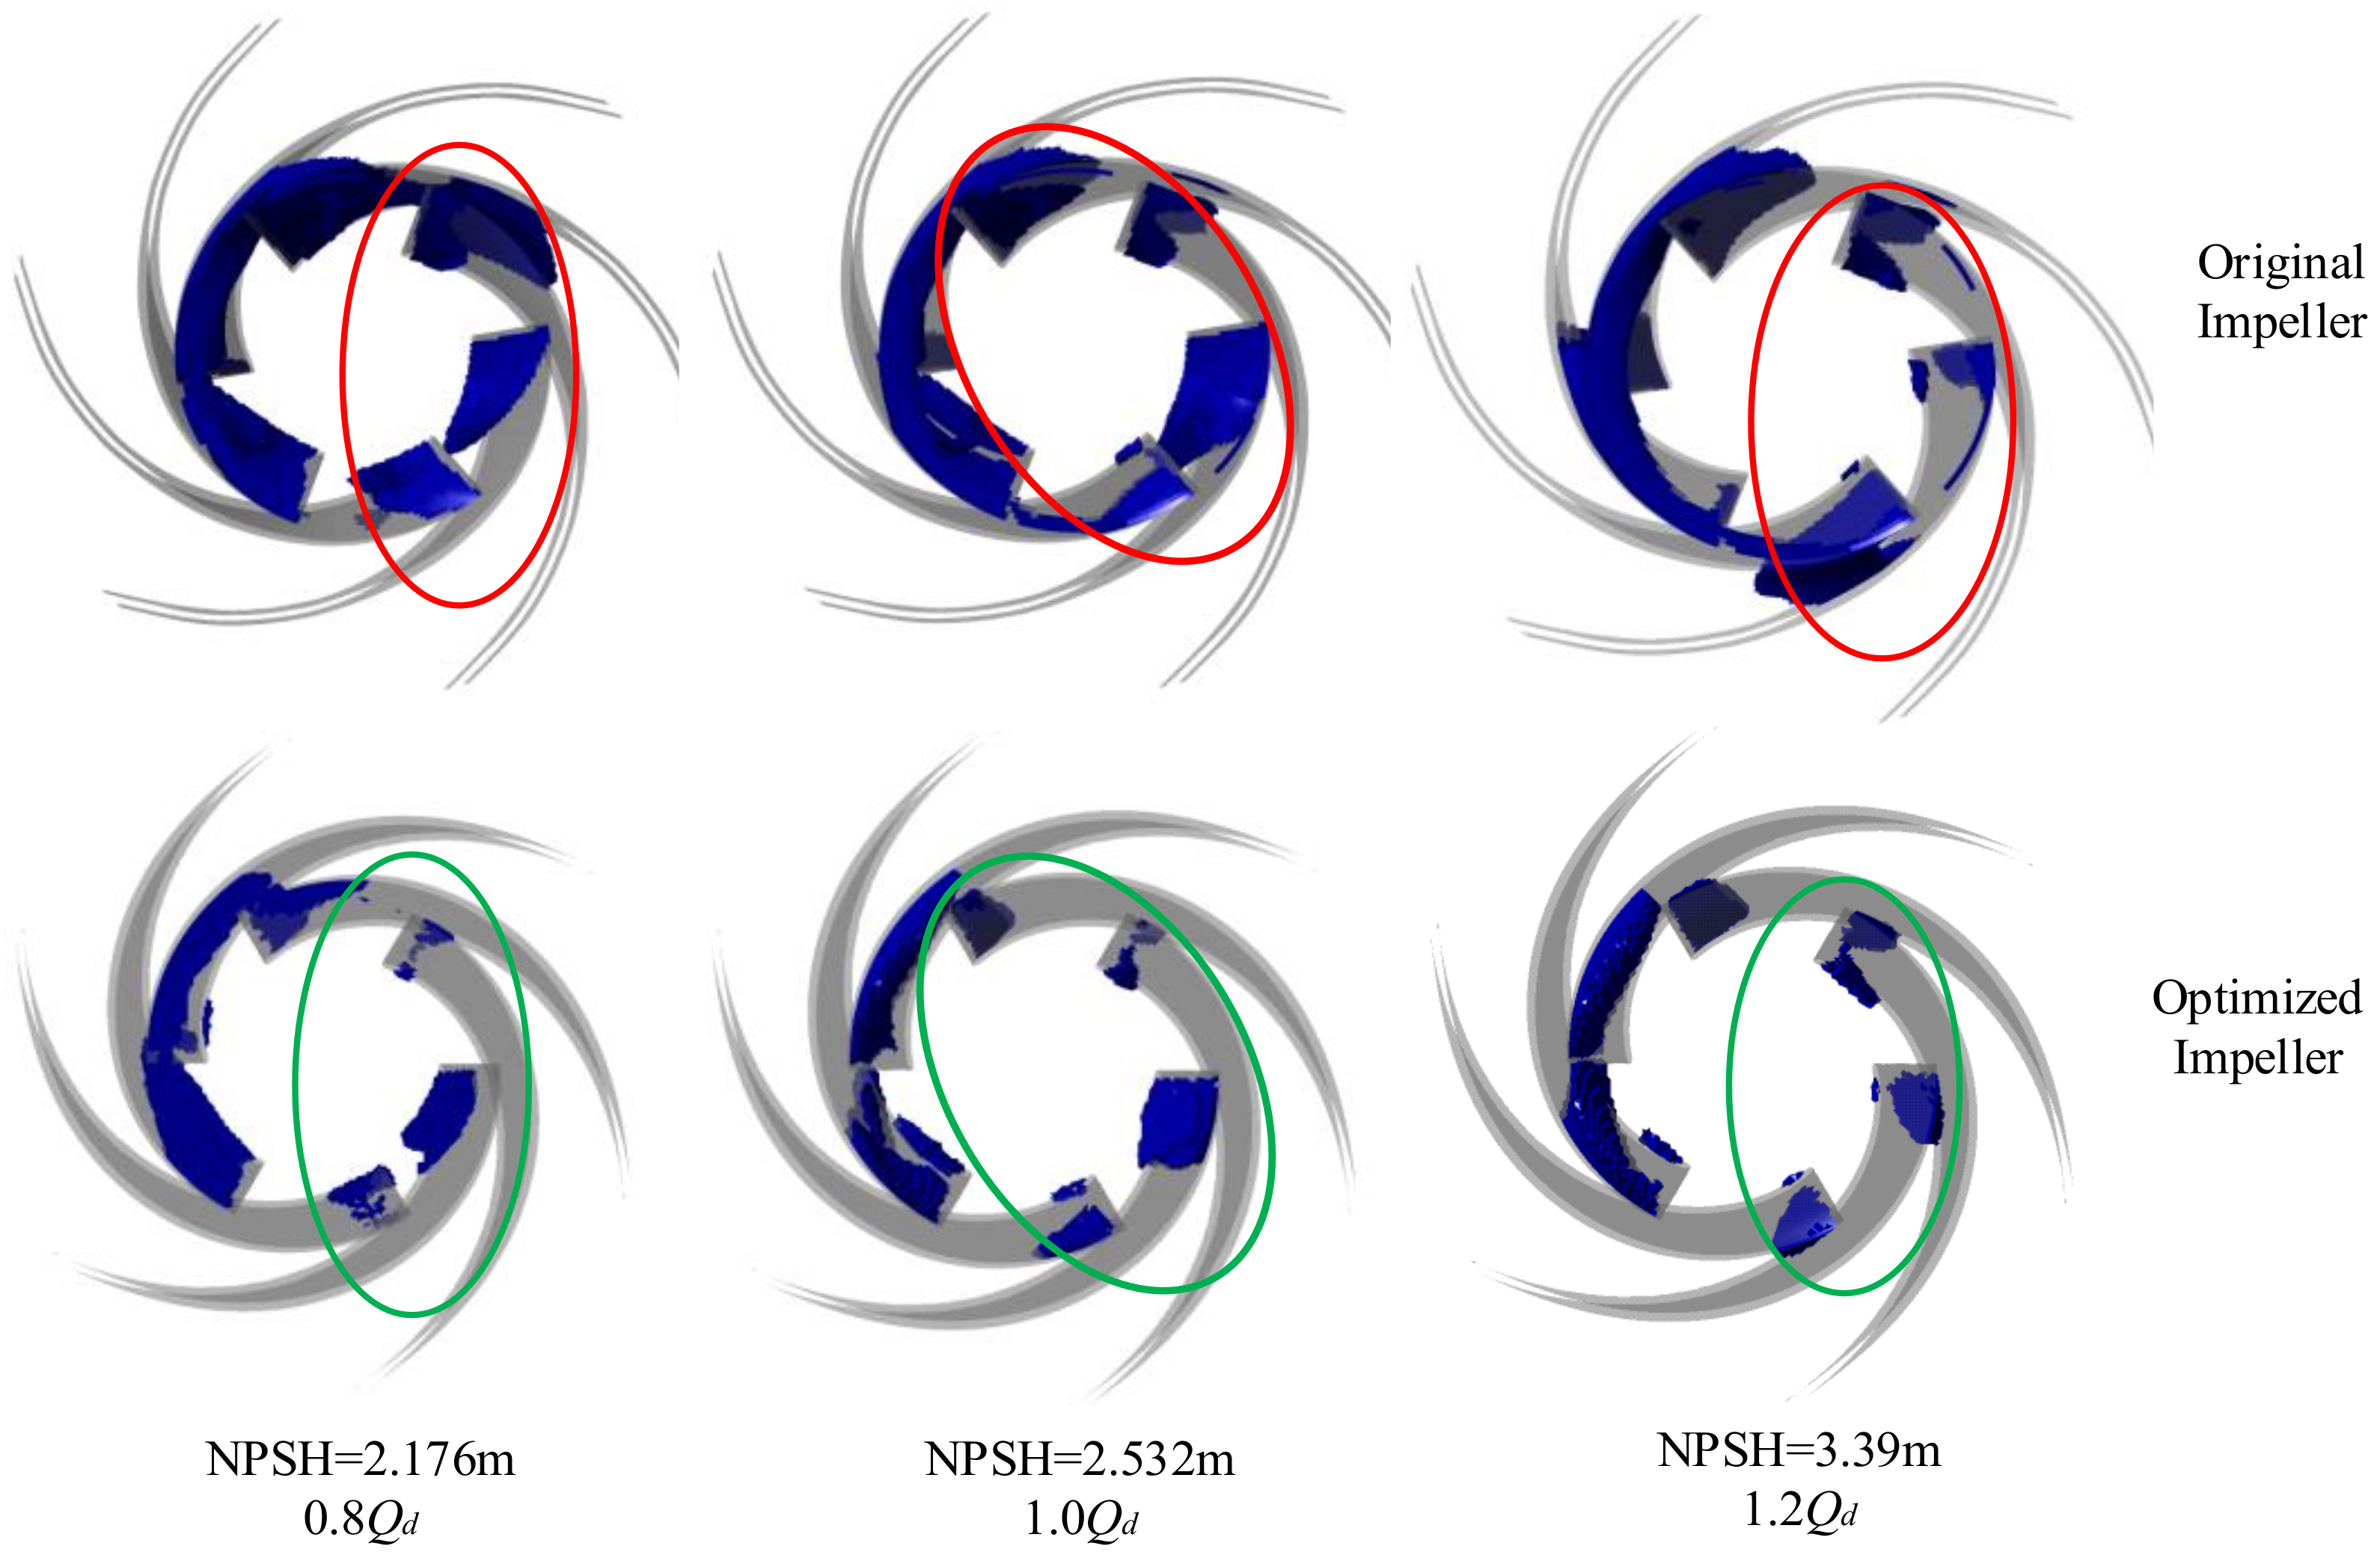
Figure 22.
Bubble distribution in the impeller.
Figure 22.
Bubble distribution in the impeller.
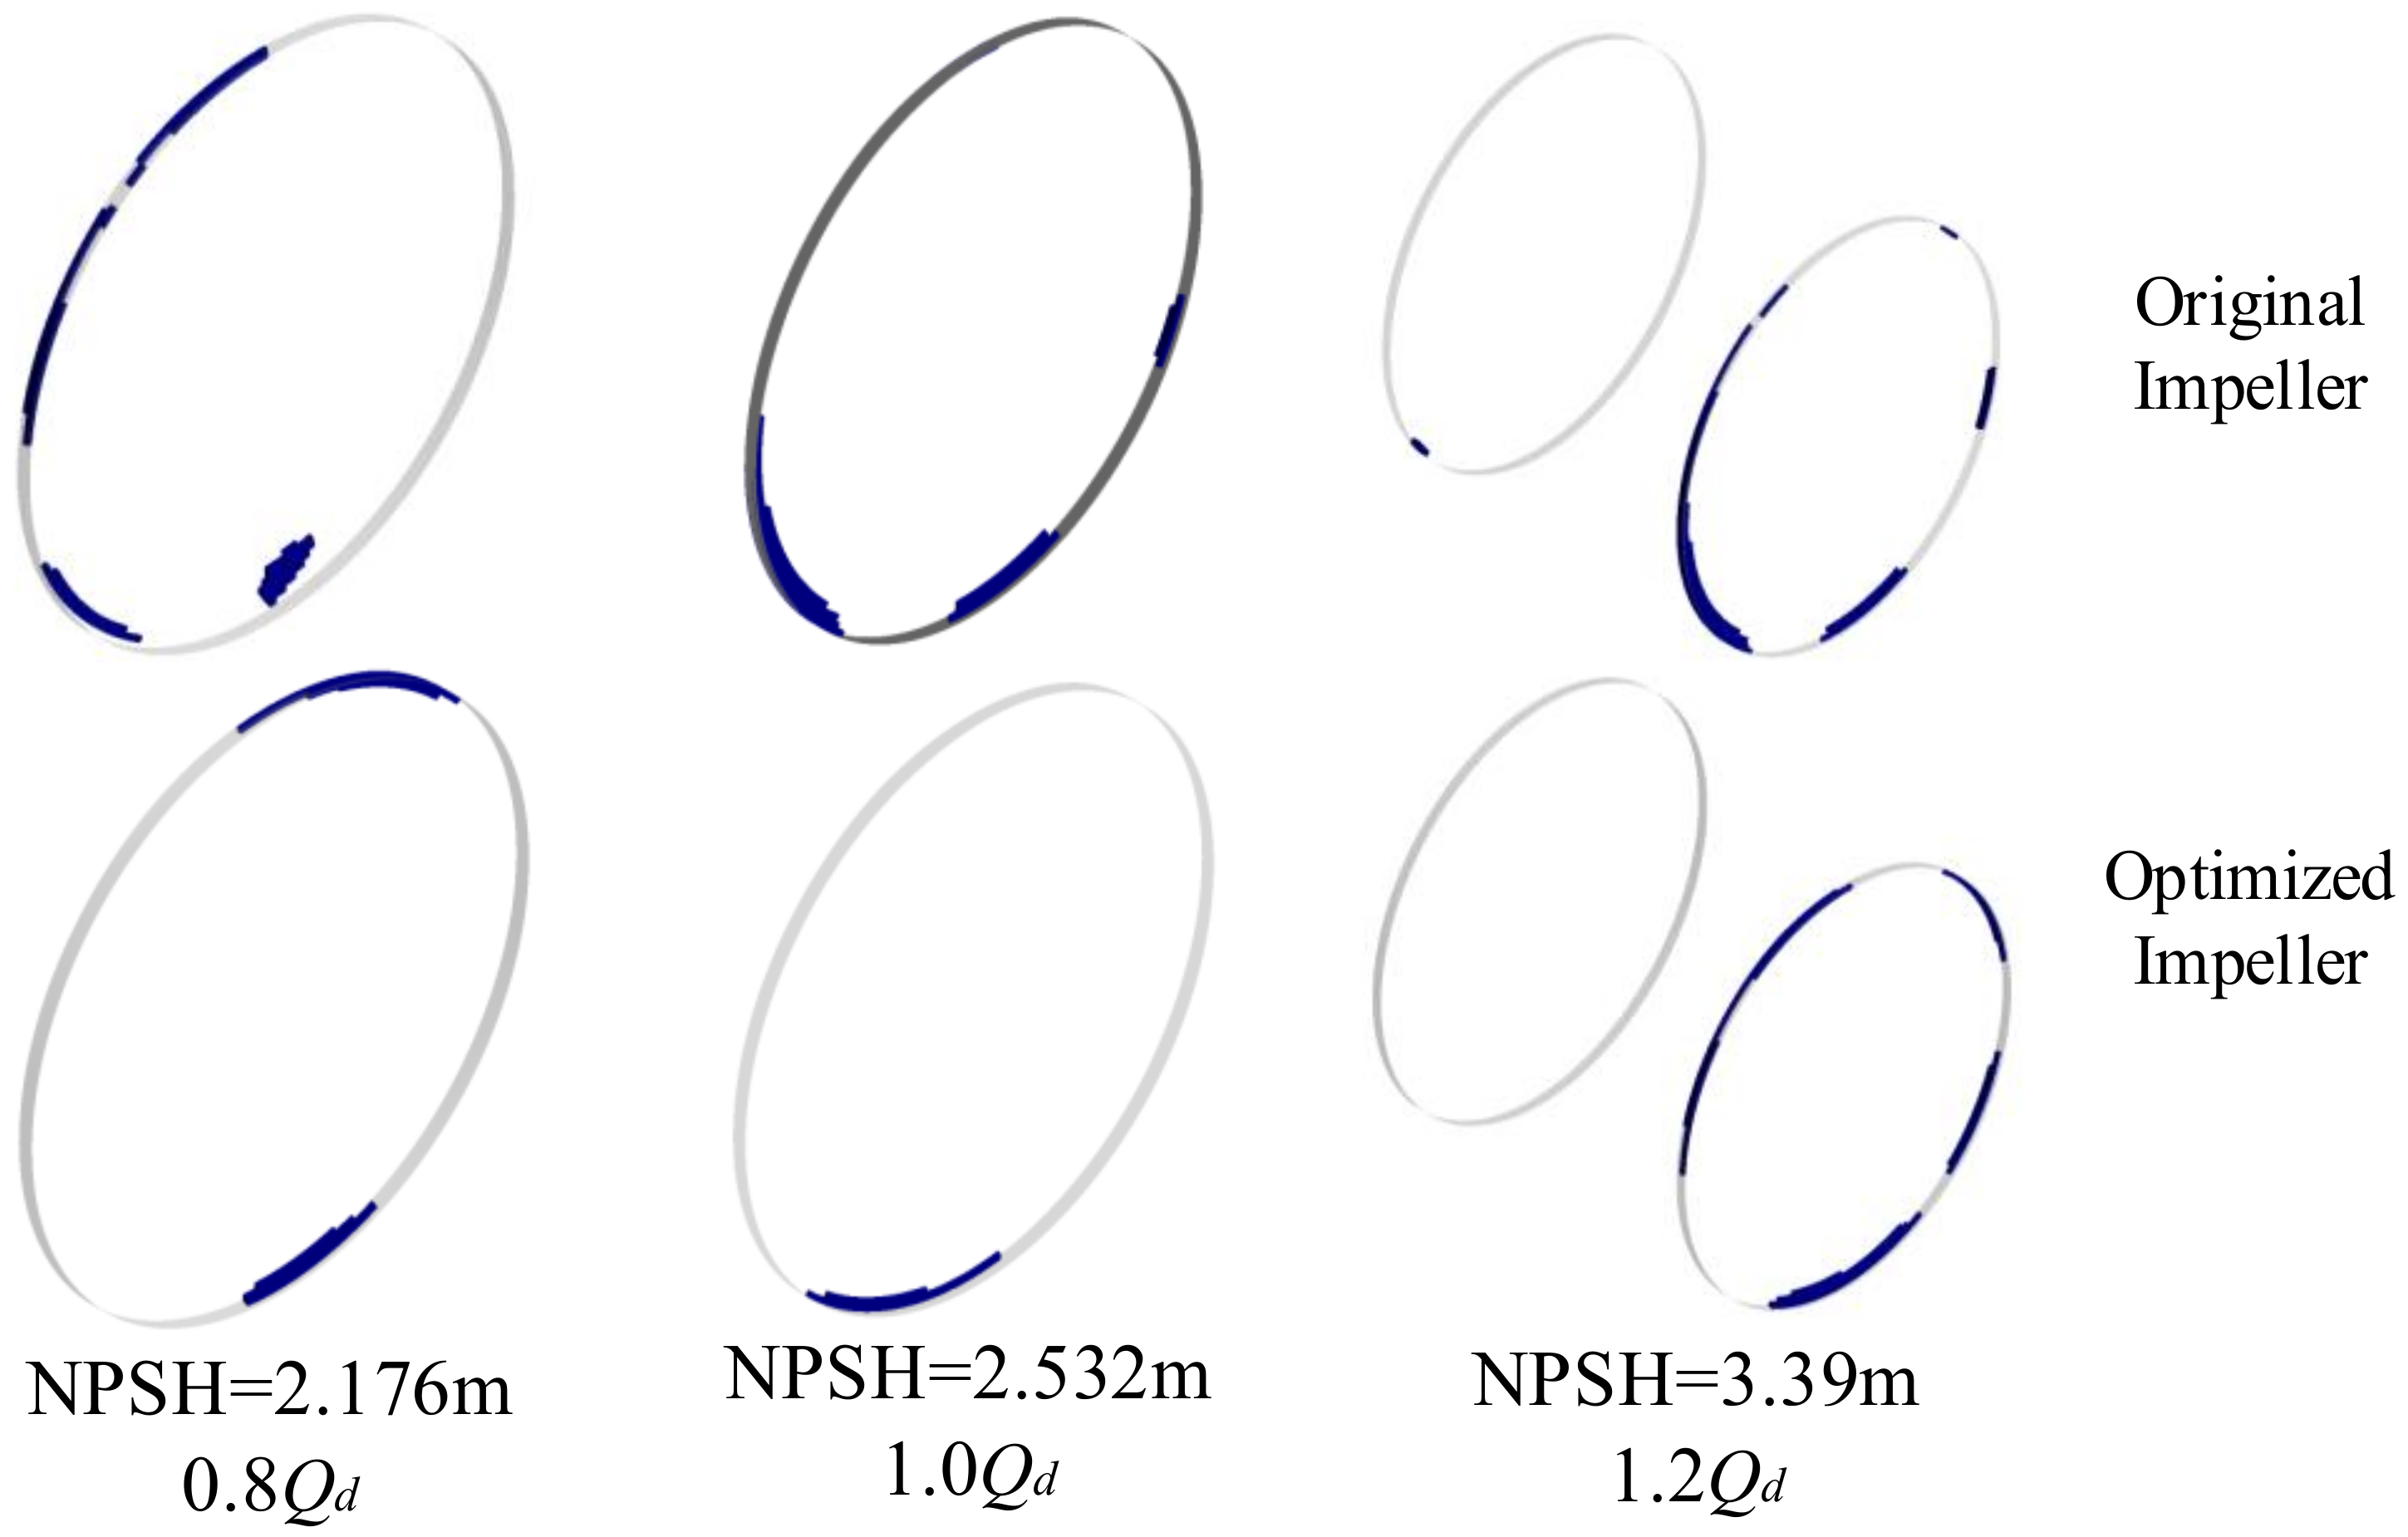
Figure 23.
Attached cavity distribution in the suction.
Figure 23.
Attached cavity distribution in the suction.
Table 1.
Range of design variables.
Table 1.
Range of design variables.
| | A | B | C |
|---|
| No | β1hub/° | β2middle/° | β3shroud/° |
|---|
| 1 | 17 | 13 | 11 |
| 2 | 19 | 16 | 14 |
| 3 | 21 | 18 | 17 |
| 4 | 23 | 21 | 19 |
| 5 | 25 | 23 | 21 |
Table 2.
Orthogonal scheme.
Table 2.
Orthogonal scheme.
| | A | B | C | | A | B | C |
|---|
| No | β1hub/° | β2middle/° | β3shroud/° | No | β1hub/° | β2middle/° | β3shroud/° |
|---|
| 1 | 17 | 18 | 17 | 14 | 25 | 23 | 17 |
| 2 | 17 | 16 | 14 | 15 | 19 | 18 | 21 |
| 3 | 19 | 13 | 17 | 16 | 25 | 16 | 21 |
| 4 | 21 | 16 | 11 | 17 | 17 | 21 | 19 |
| 5 | 23 | 16 | 17 | 18 | 17 | 23 | 21 |
| 6 | 21 | 13 | 21 | 19 | 17 | 13 | 11 |
| 7 | 21 | 21 | 17 | 20 | 23 | 21 | 21 |
| 8 | 23 | 18 | 19 | 21 | 25 | 18 | 11 |
| 9 | 25 | 13 | 19 | 22 | 19 | 23 | 14 |
| 10 | 19 | 16 | 19 | 23 | 21 | 18 | 14 |
| 11 | 21 | 23 | 19 | 24 | 23 | 13 | 14 |
| 12 | 23 | 23 | 11 | 25 | 19 | 21 | 11 |
| 13 | 25 | 21 | 14 | | | | |
Table 3.
Design specifications of model pump.
Table 3.
Design specifications of model pump.
| Design Parameters | Value |
|---|
| Nominal flow rate, Qd (m3/h) | 500 |
| Head, H (m) | 40 |
| Rotating speed, N (rpm) | 1480 |
| Blade number, z | 6 |
| Diameter of suction, Ds (mm) | 250 |
| Diameter at impeller inlet, D1 (mm) | 192 |
| Diameter at impeller outlet, D2 (mm) | 365 |
| Diameter of discharge, Dd (mm) | 200 |
| Efficiency, η (%) | 84 |
| NPSHr (m) | 3.5 |
Table 4.
Grid cells of the selected mesh.
Table 4.
Grid cells of the selected mesh.
| Item | Mesh I | Mesh II | Mesh III | Mesh IV | Mesh V |
|---|
| | Total Mesh | 2,878,243 | 3,679,342 | 4,266,423 | 4,958,168 | 5,847,757 |
| Ratio | H/H1 | 1.0000 | 1.1563 | 1.2211 | 1.2201 | 1.2213 |
| ƞ/ƞ1 | 1.0000 | 1.1324 | 1.3043 | 1.3044 | 1.3043 |
| pv1/pv1,1 | 1.0000 | 1.1520 | 1.3112 | 1.3114 | 1.3111 |
| pv7/pv7,1 | 1.0000 | 1.1562 | 1.2819 | 1.2822 | 1.2820 |
Table 5.
Boundaries and variables for ANN.
Table 5.
Boundaries and variables for ANN.
| Variables | A | B | C |
|---|
| Upper Bounds | 17 | 13 | 11 |
| Lower Bounds | 25 | 23 | 21 |
Table 6.
Orthogonal scheme results.
Table 6.
Orthogonal scheme results.
| Trial No. | β1/° | NPSHr (m) |
|---|
| Hub | Middle | Shroud | 0.8Qd | 1.0Qd | 1.2Qd |
|---|
| 1 | 17 | 18 | 17 | 2.20493 | 2.47272 | 3.34366 |
| 2 | 17 | 16 | 14 | 2.242 | 2.4631 | 3.5327 |
| 3 | 19 | 13 | 17 | 2.239 | 2.60439 | 3.41053 |
| 4 | 21 | 16 | 11 | 2.13633 | 2.5389 | 3.49375 |
| 5 | 23 | 16 | 17 | 2.19513 | 2.49717 | 3.34304 |
| 6 | 21 | 13 | 21 | 2.32698 | 2.55007 | 3.25851 |
| 7 | 21 | 21 | 17 | 2.15205 | 2.37423 | 3.20435 |
| 9 | 25 | 13 | 19 | 2.11472 | 2.44115 | 3.34089 |
| 10 | 19 | 16 | 19 | 2.15242 | 2.48385 | 3.36682 |
| 11 | 21 | 23 | 19 | 2.1968 | 2.34822 | 3.12789 |
| 12 | 23 | 23 | 11 | 2.11707 | 2.46779 | 3.29704 |
| 13 | 25 | 21 | 14 | 2.19055 | 2.40843 | 3.20562 |
| 14 | 25 | 23 | 17 | 2.22882 | 2.49238 | 3.19525 |
| 15 | 19 | 18 | 21 | 2.27685 | 2.37688 | 3.32605 |
| 16 | 25 | 16 | 21 | 2.16954 | 2.46852 | 3.31924 |
| 17 | 17 | 21 | 19 | 2.19175 | 2.41485 | 3.21403 |
| 18 | 17 | 23 | 21 | 2.13016 | 2.49771 | 3.11064 |
| 19 | 17 | 13 | 11 | 2.11841 | 2.55672 | 3.32263 |
| 21 | 25 | 18 | 11 | 2.15538 | 2.52129 | 3.41646 |
| 22 | 19 | 23 | 14 | 2.21103 | 2.41971 | 3.2512 |
| 23 | 21 | 18 | 14 | 2.18358 | 2.47889 | 3.42864 |
| 25 | 19 | 21 | 11 | 2.19366 | 2.50587 | 3.49847 |
Table 7.
Variables for optimum cases.
Table 7.
Variables for optimum cases.
| | A | B | C | Results |
|---|
| No | β1hub/° | β2middle/° | β3shroud/° | 0.8Qd | 1.0Qd | 1.2Qd |
|---|
| 1 | 19.4863 | 21 | 16.767 | 2.108 | 2.353 | 3.215 |
| 2 | 19.3992 | 21 | 17.262 | 2.124 | 2.340 | 3.210 |
| 3 | 19.3079 | 21 | 17.566 | 2.134 | 2.334 | 3.208 |
Table 8.
Comparison of original case and best optimal cases.
Table 8.
Comparison of original case and best optimal cases.
| Name | NPSHr 0.8Q | NPSHr 1.0Q | NPSHr 1.2Q |
|---|
| Original | 2.176 m | 2.532 m | 3.39 m |
| Case 1 | 2.089 m | 2.358 m | 3.271 m |
| Case 2 | 2.132 m | 2.419 m | 3.254 m |
| Case 3 | 2.132 m | 2.44 m | 3.288 m |
Table 9.
Head comparison at 1.0Qd.
Table 9.
Head comparison at 1.0Qd.
| Name | Head (m) |
|---|
| Original | 40.52 |
| Case 1 | 40.05 |
| Case 2 | 39.98 |
| Case 3 | 38.73 |

 ,
, 


