Research on the Application of Partial Similarity for a 1-1/2 Axial Compressor


Abstract
:1. Introduction
2. Scaling Laws
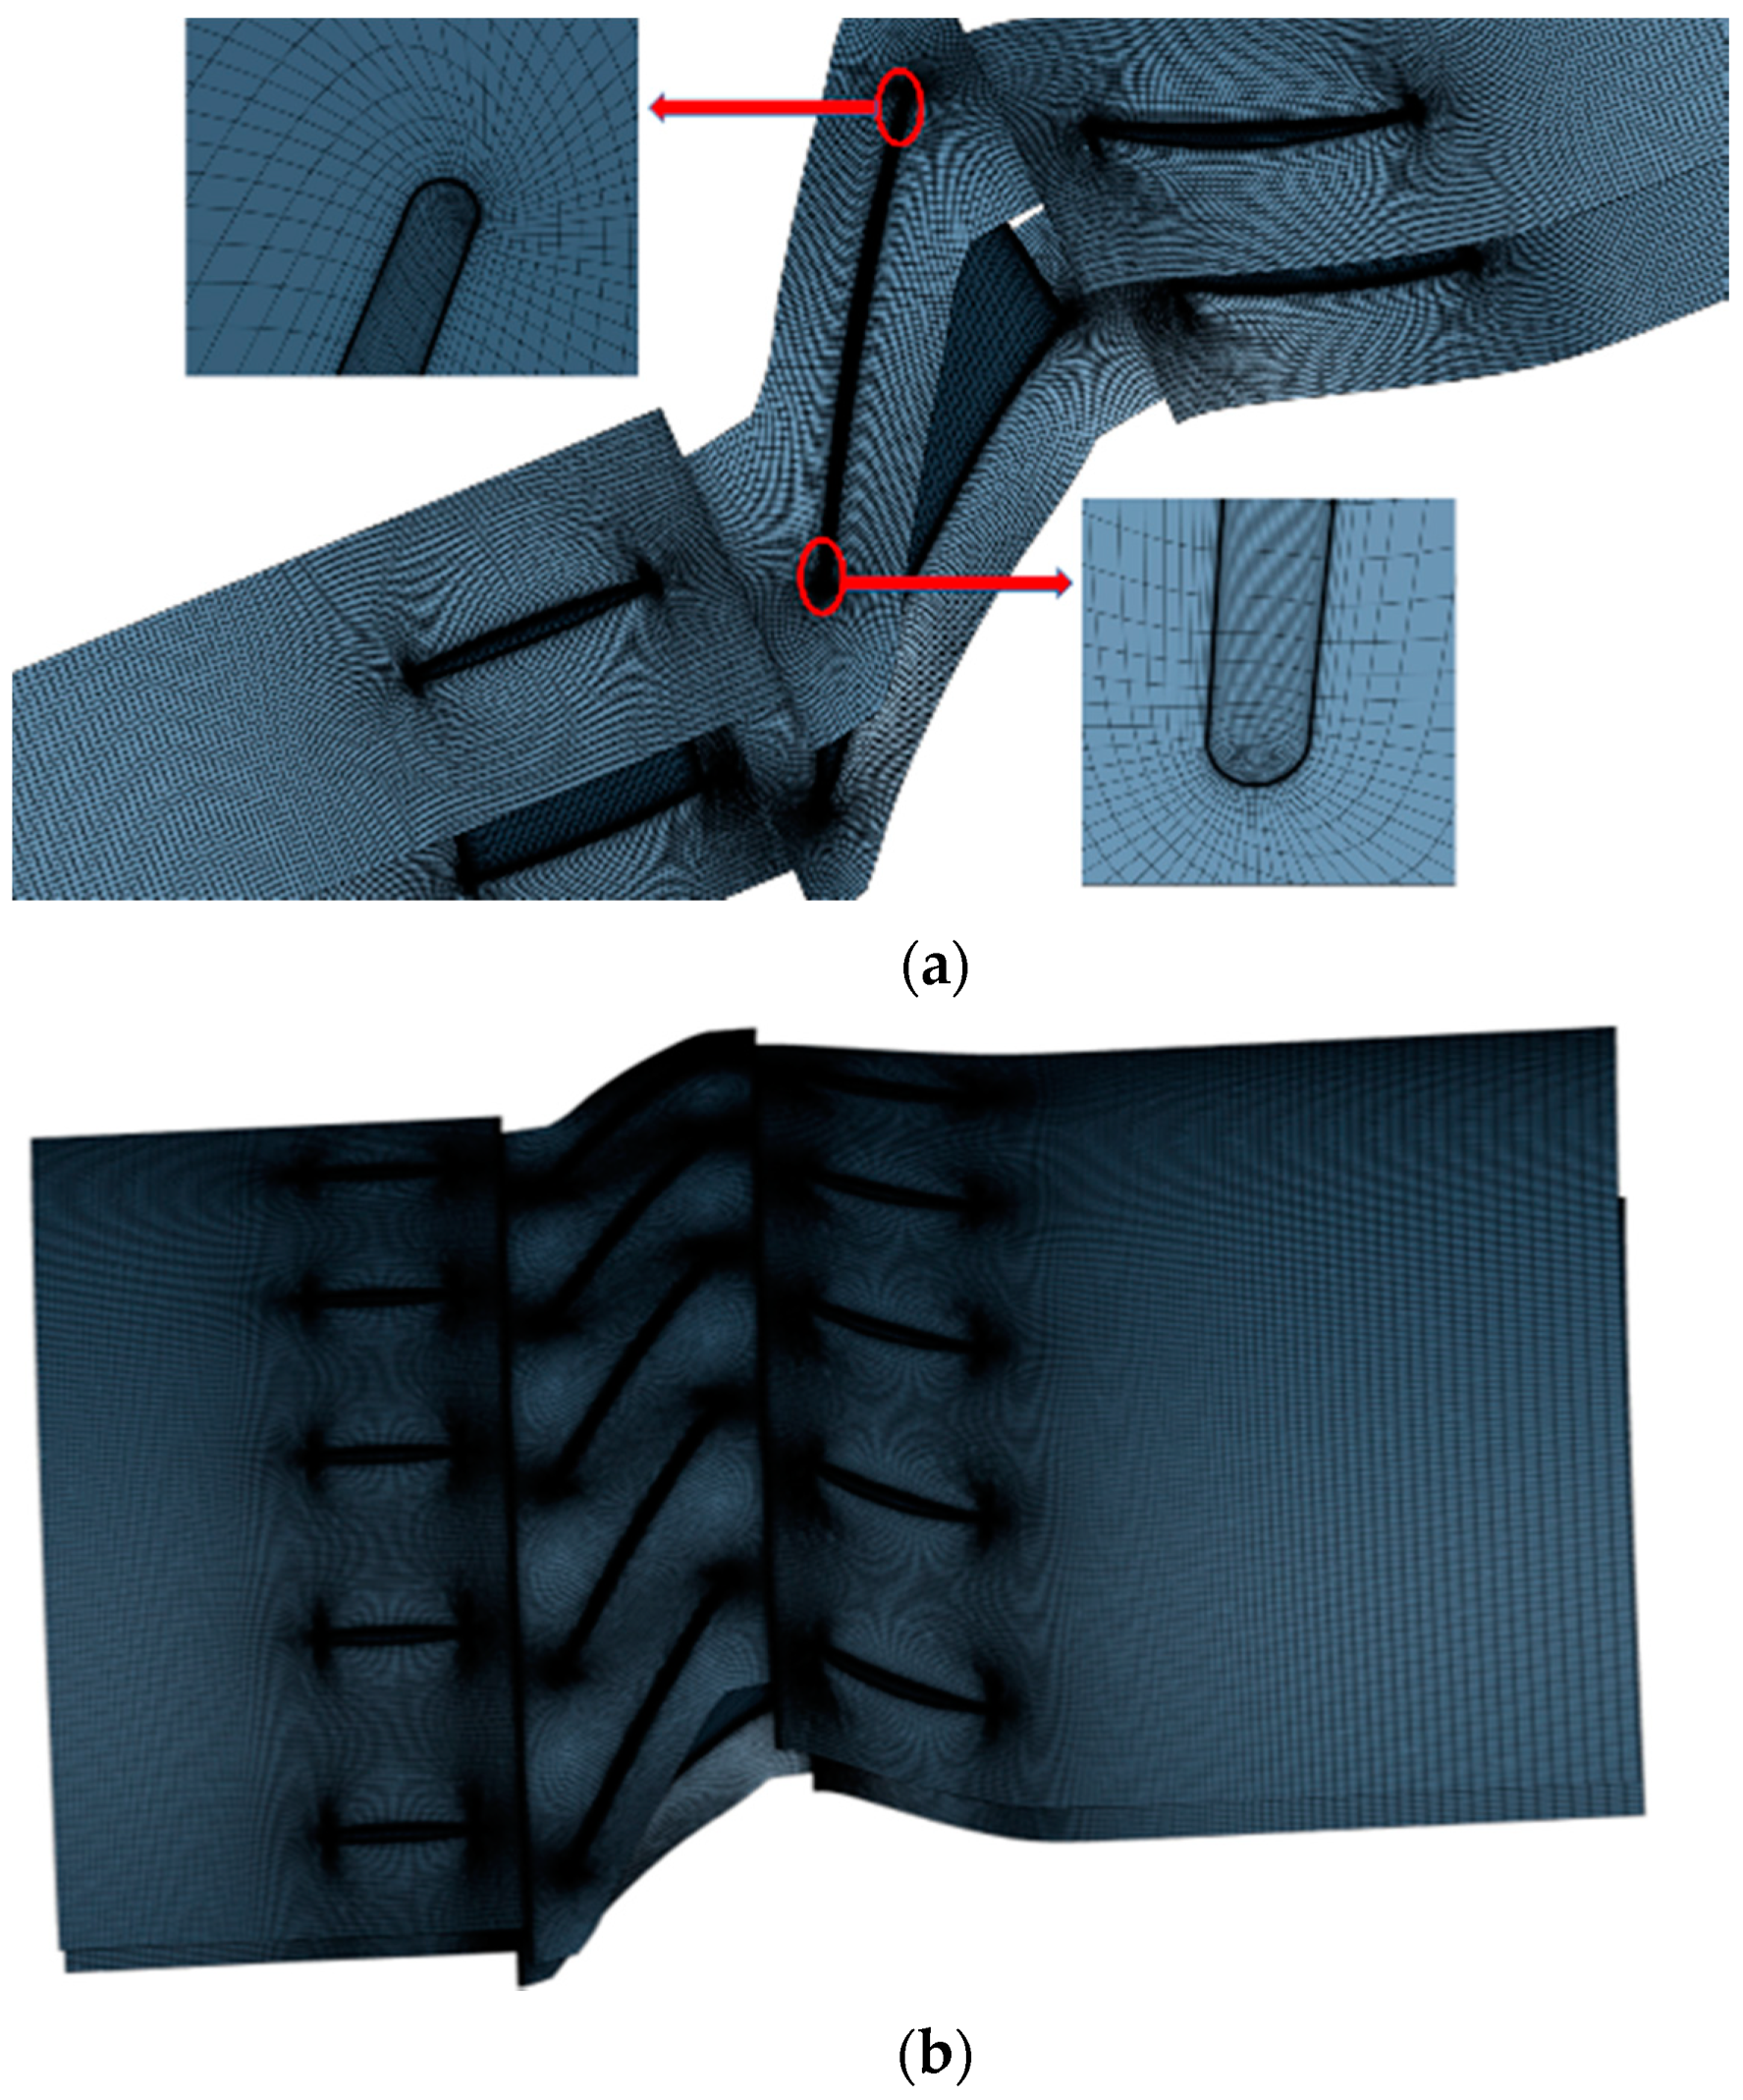
3. Numerical Method
4. Results and Analysis
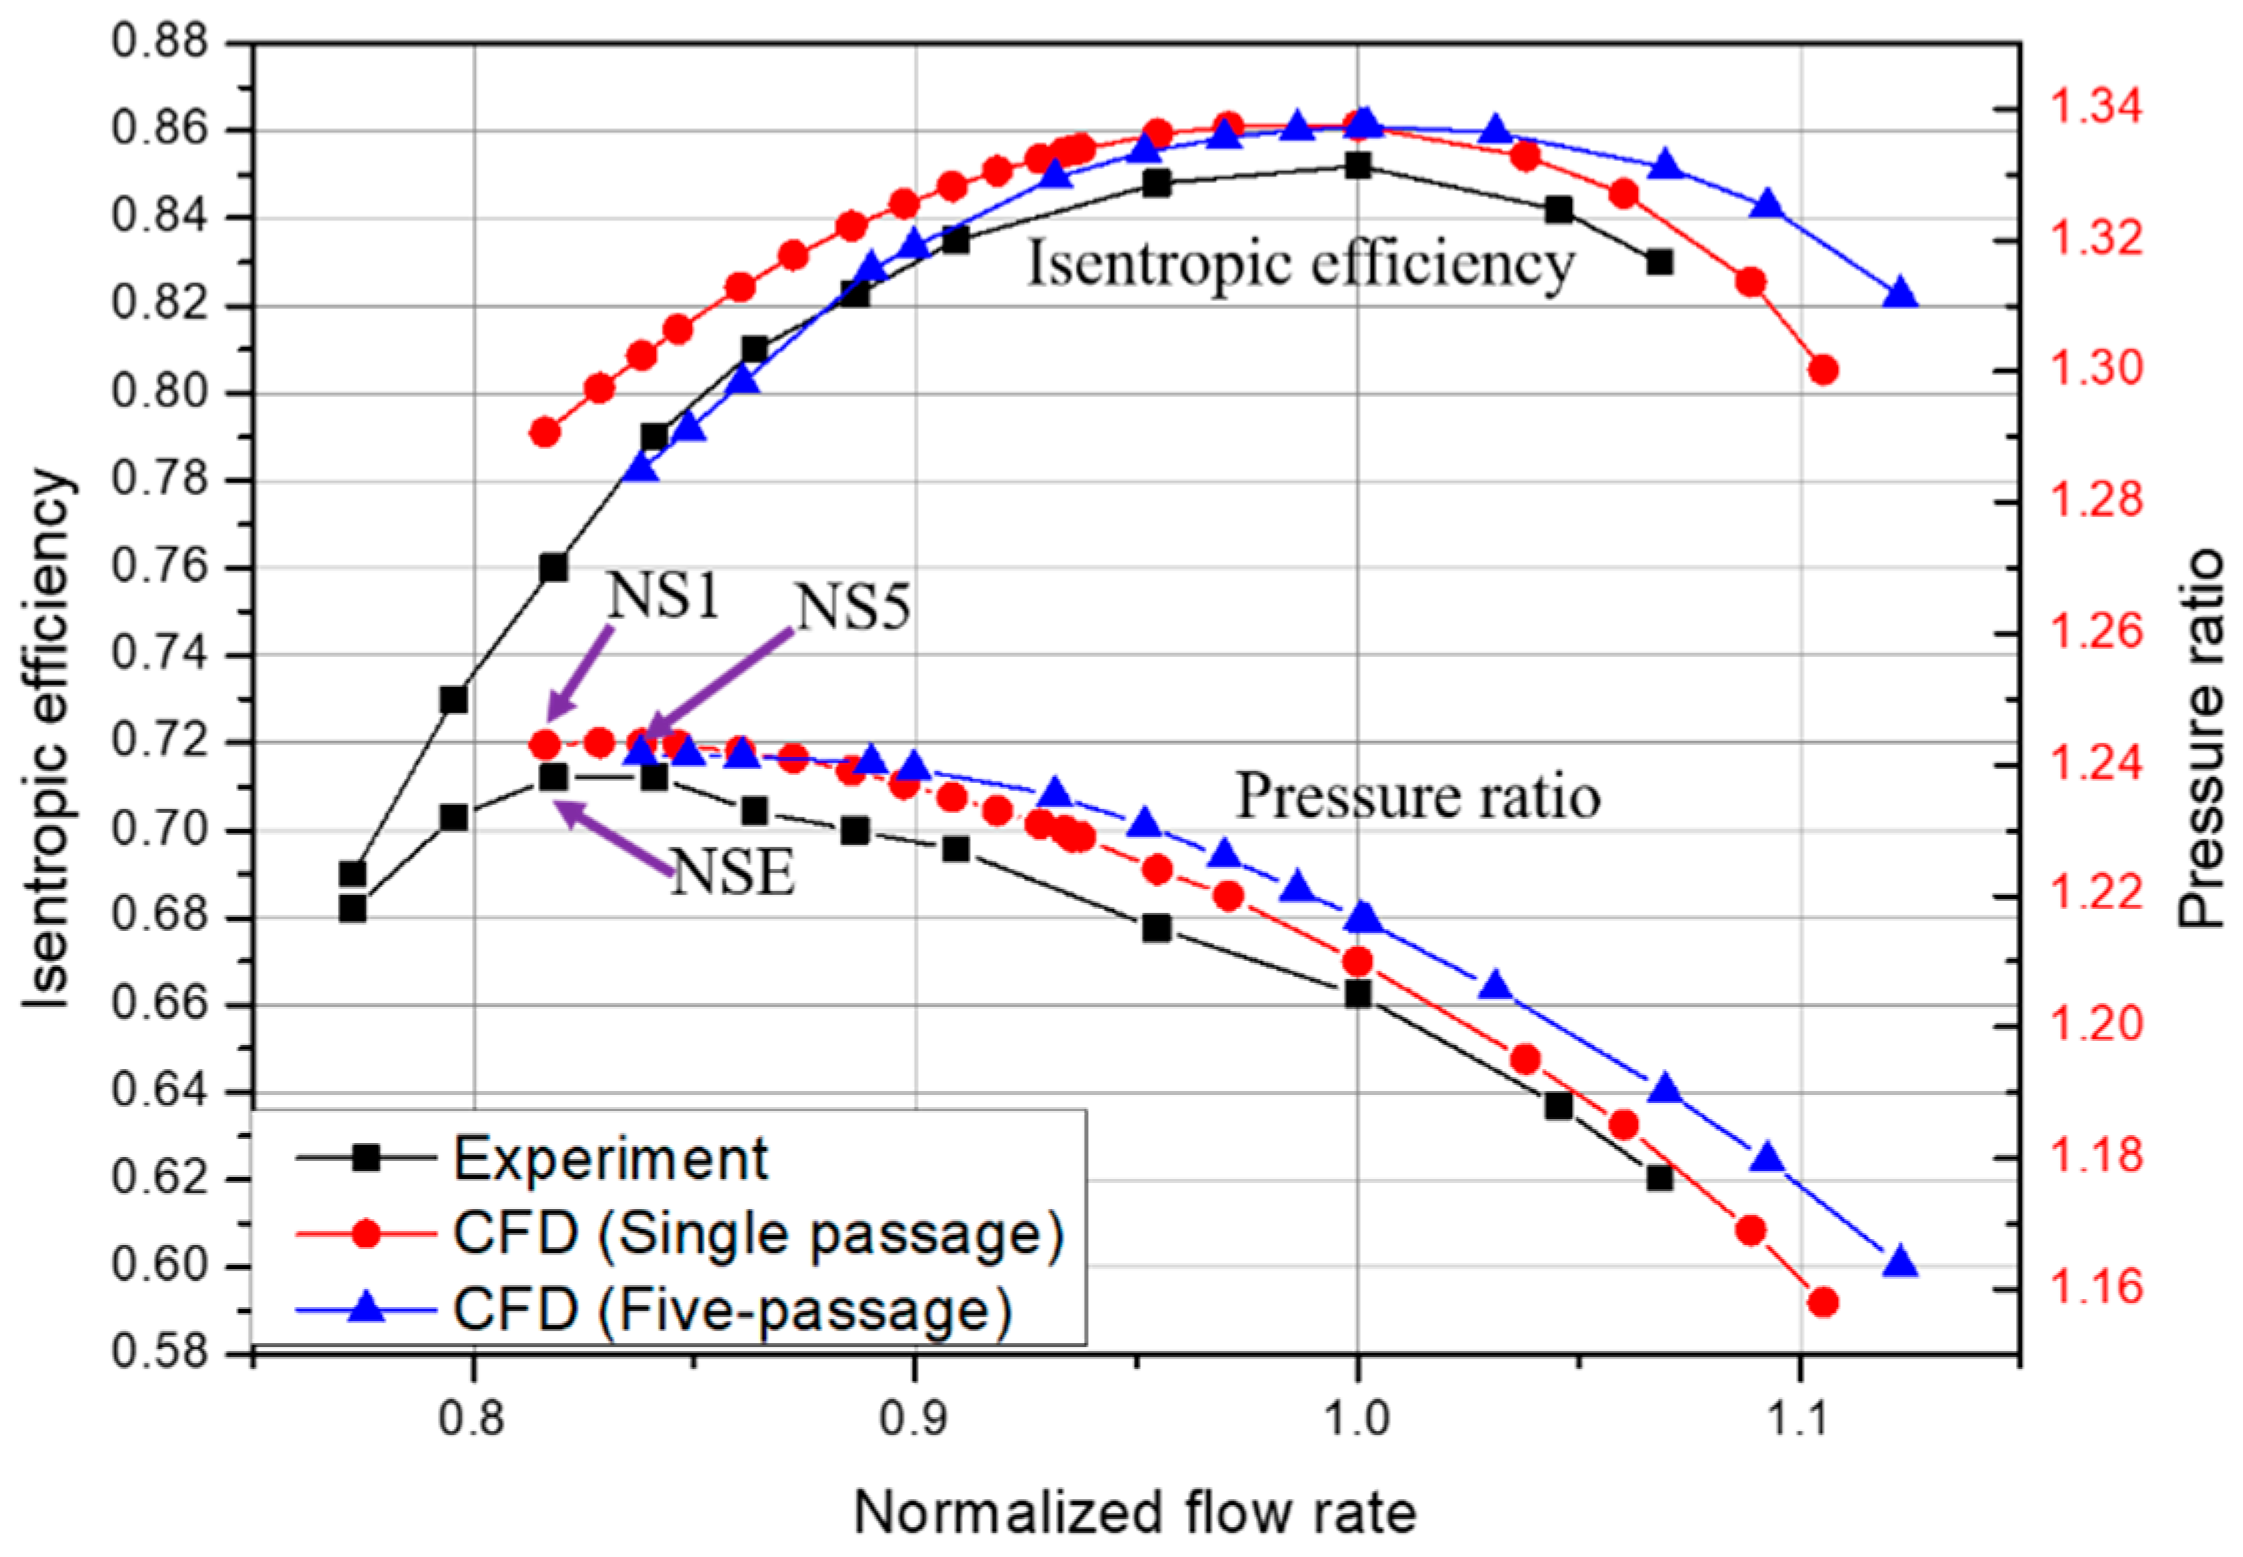
4.1. Evaluation of the Numerical Method
4.2. Performance Analysis of the Scaled-Up Compressors
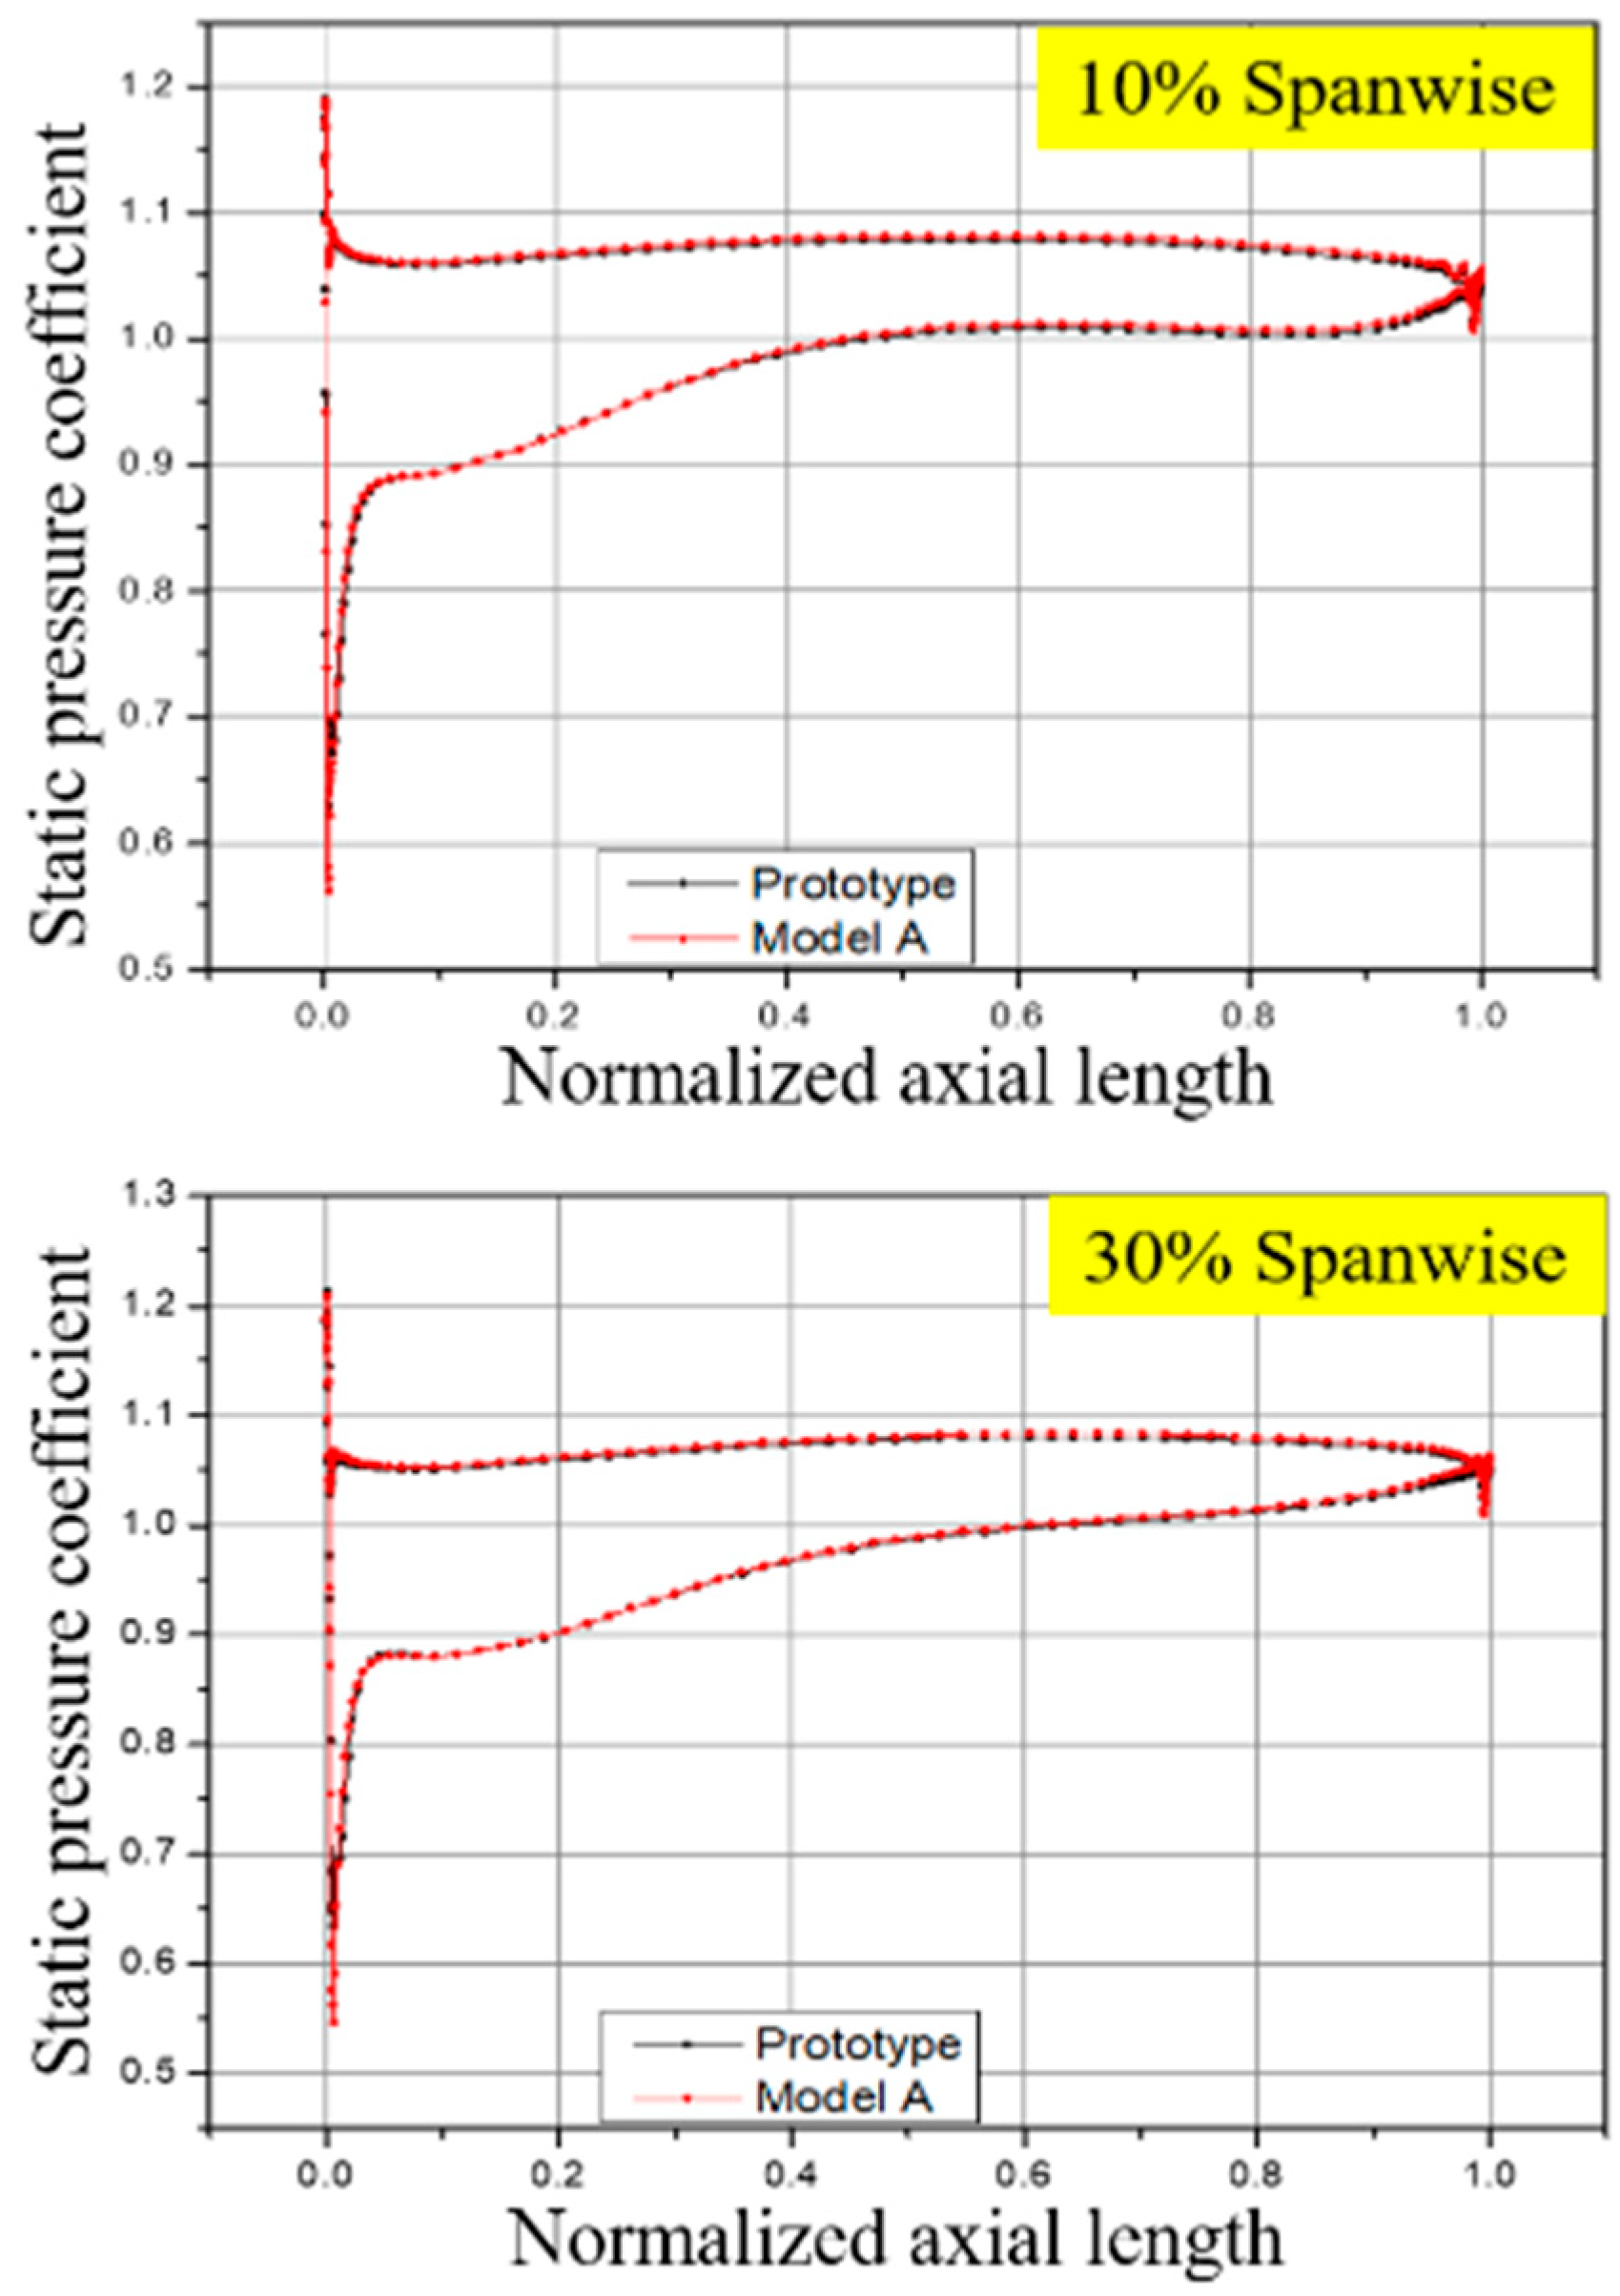
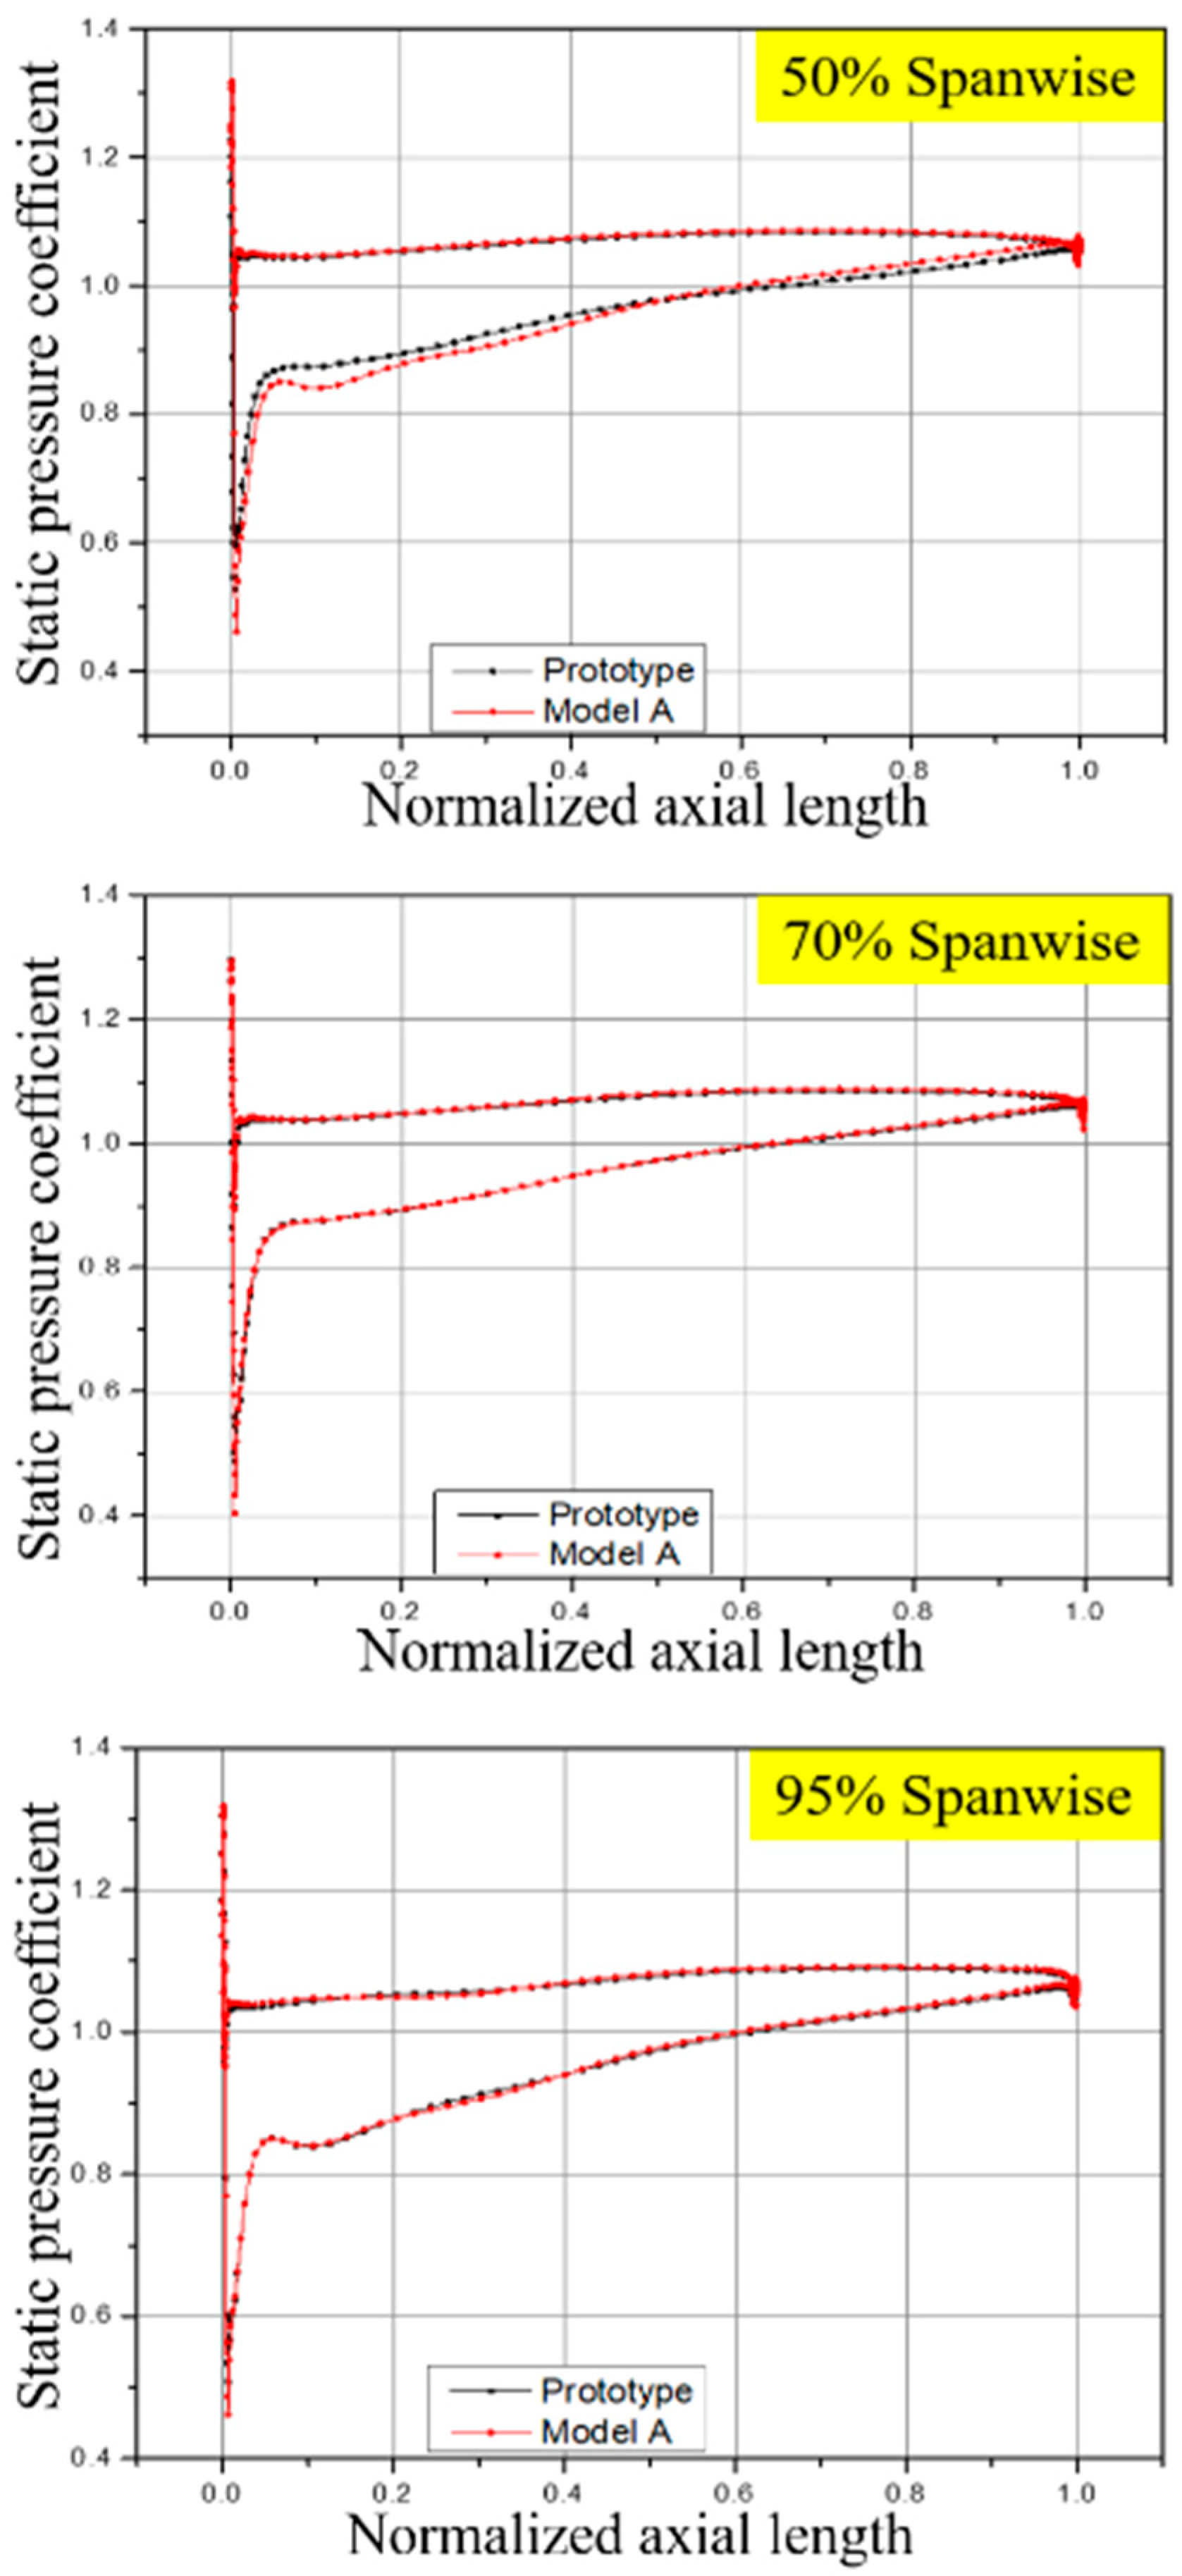
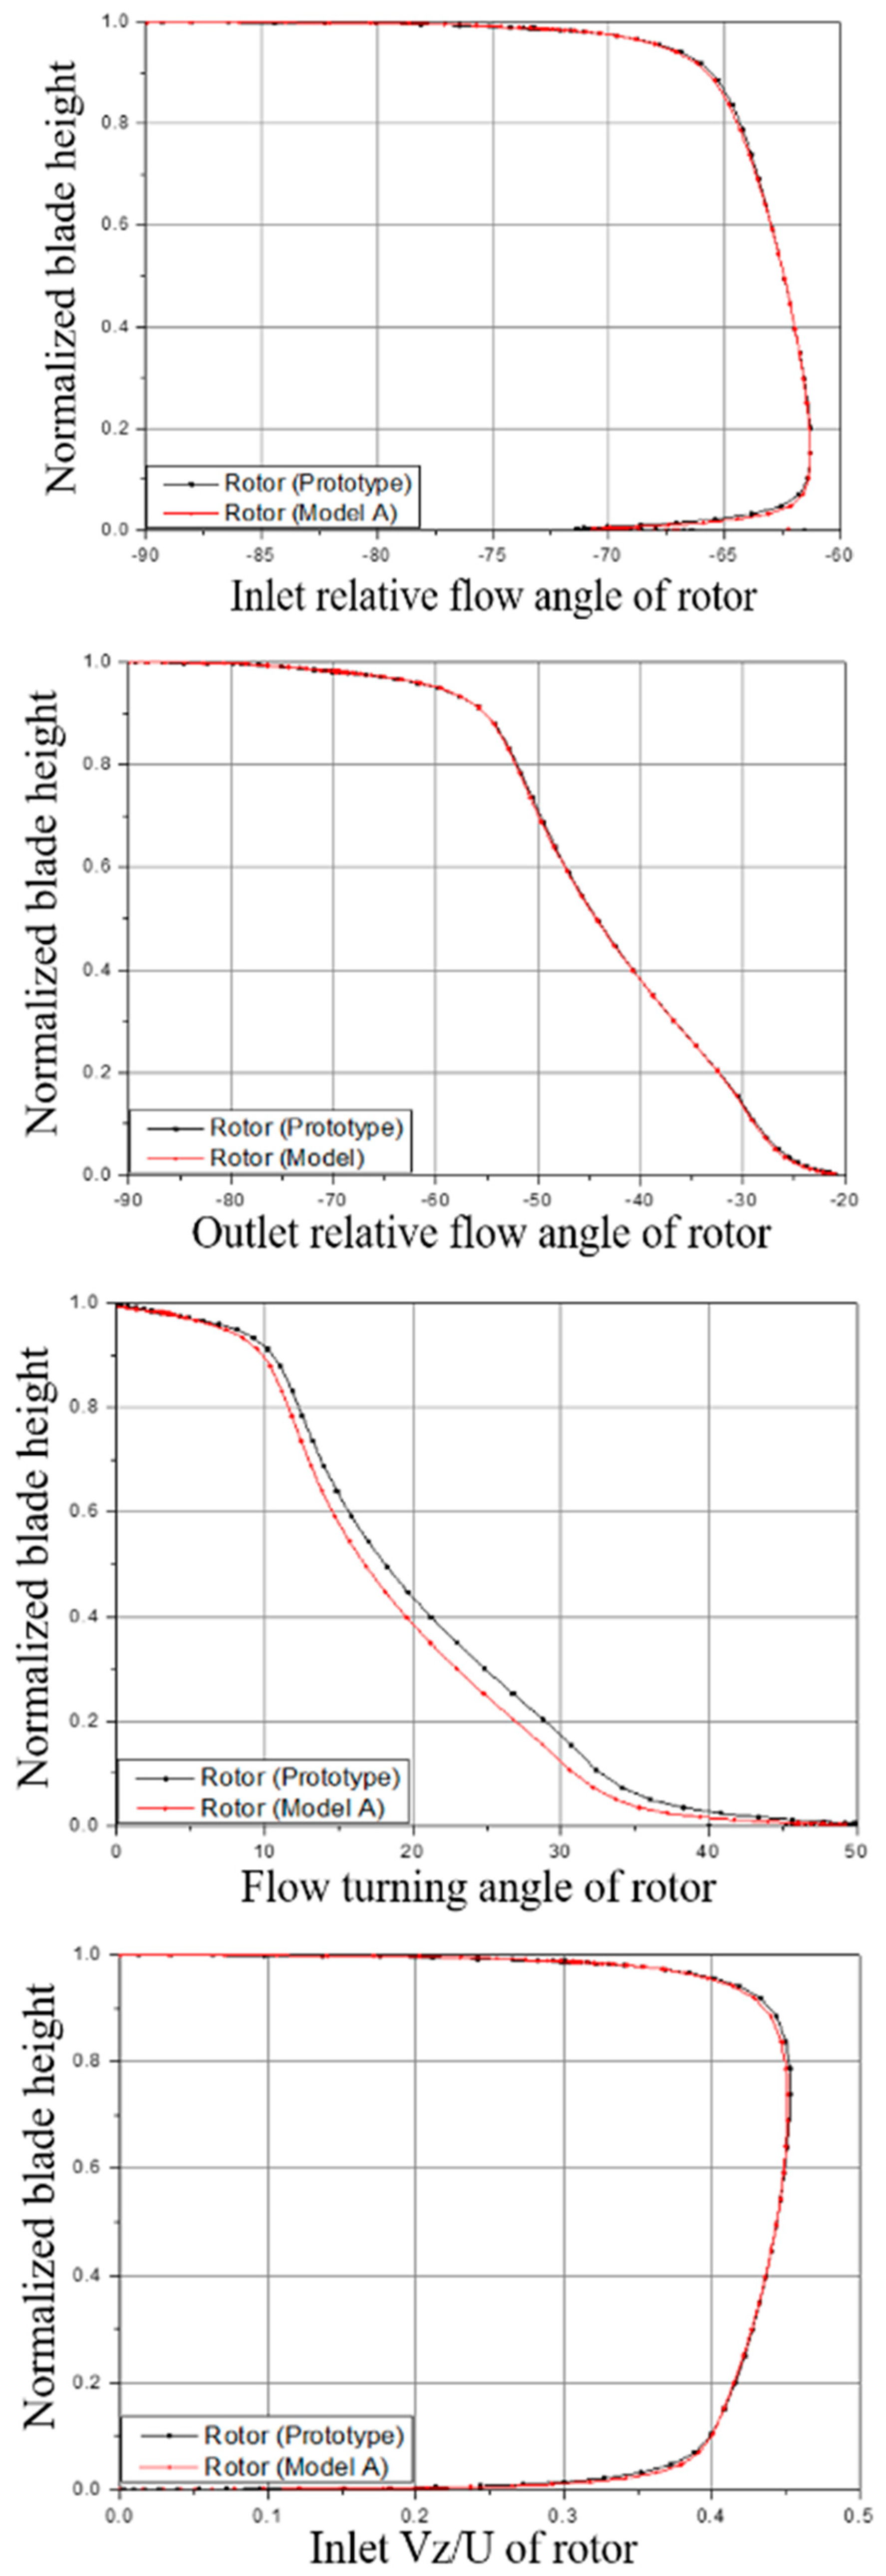
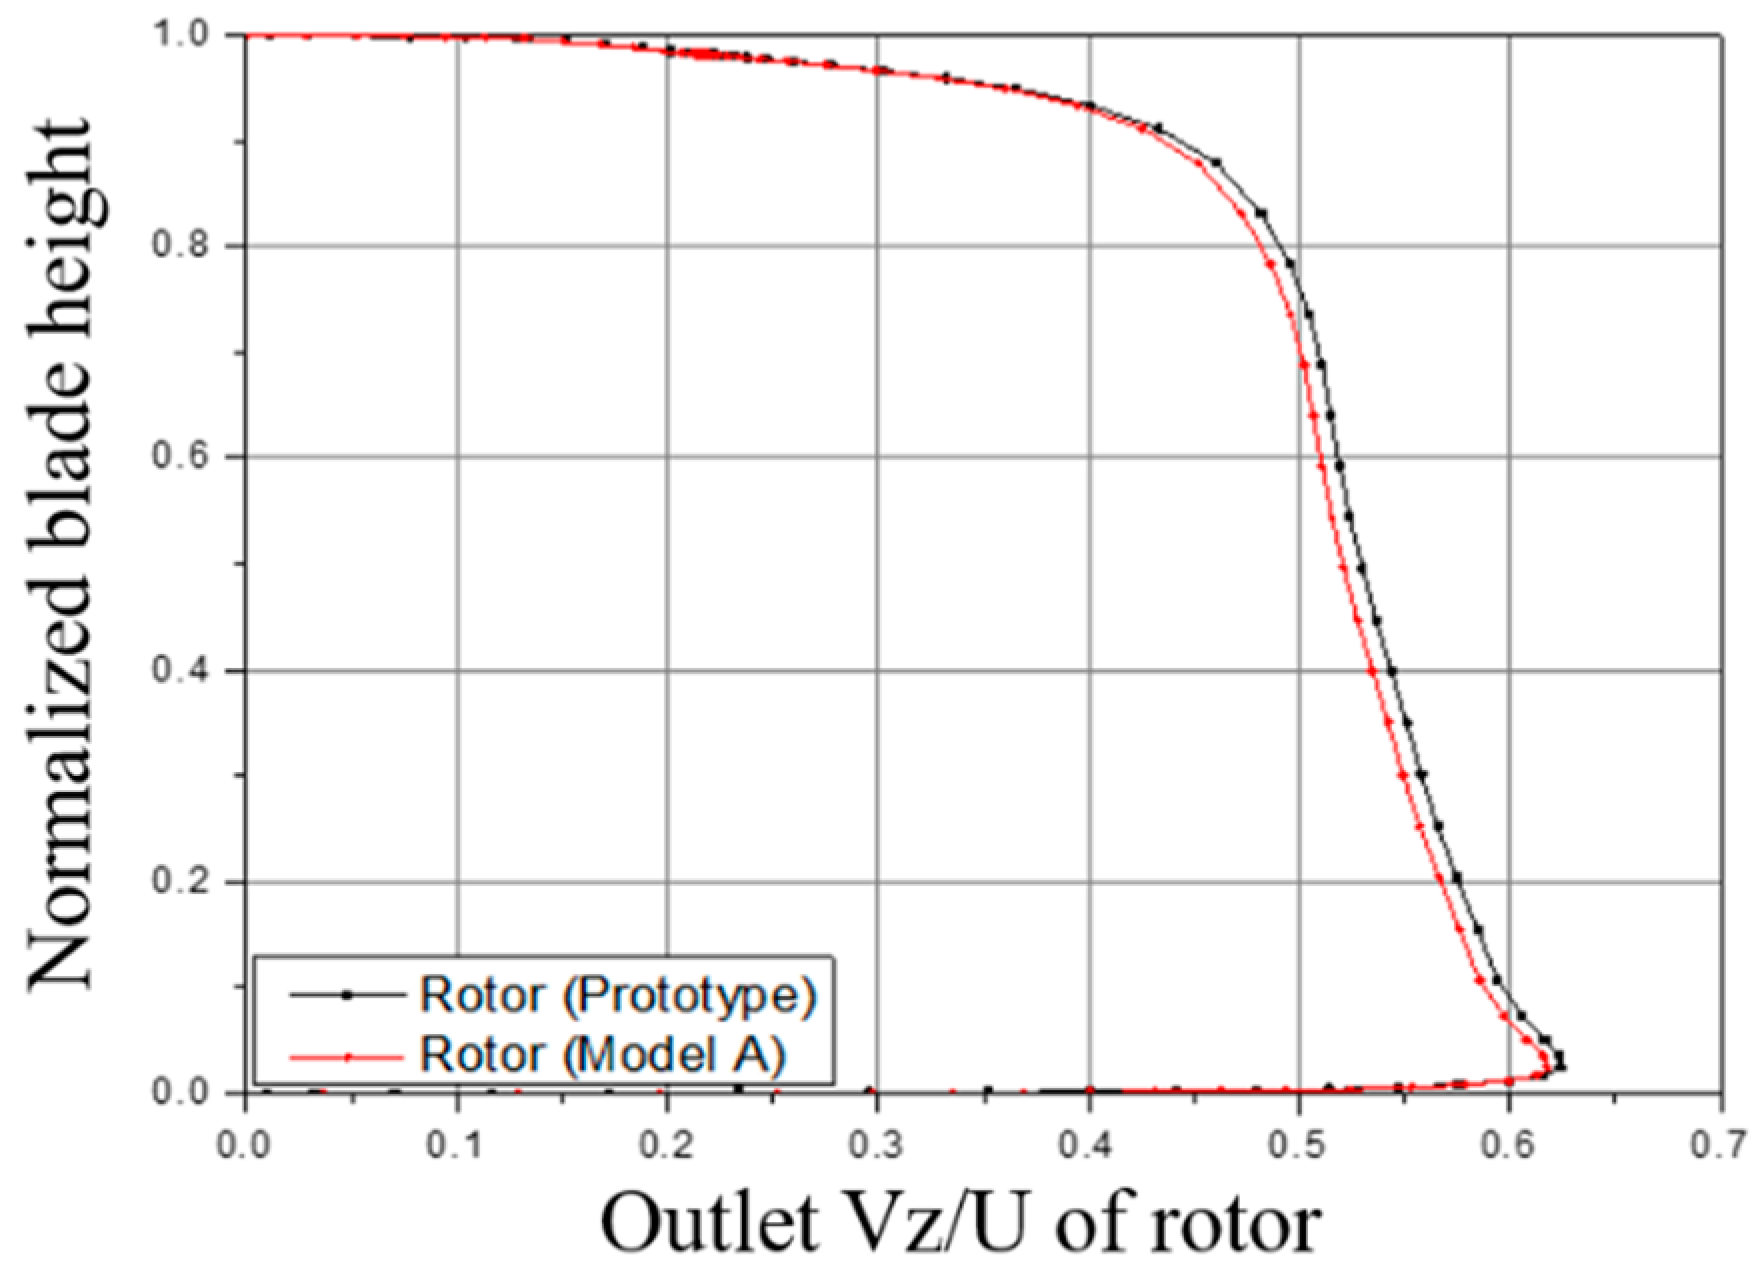
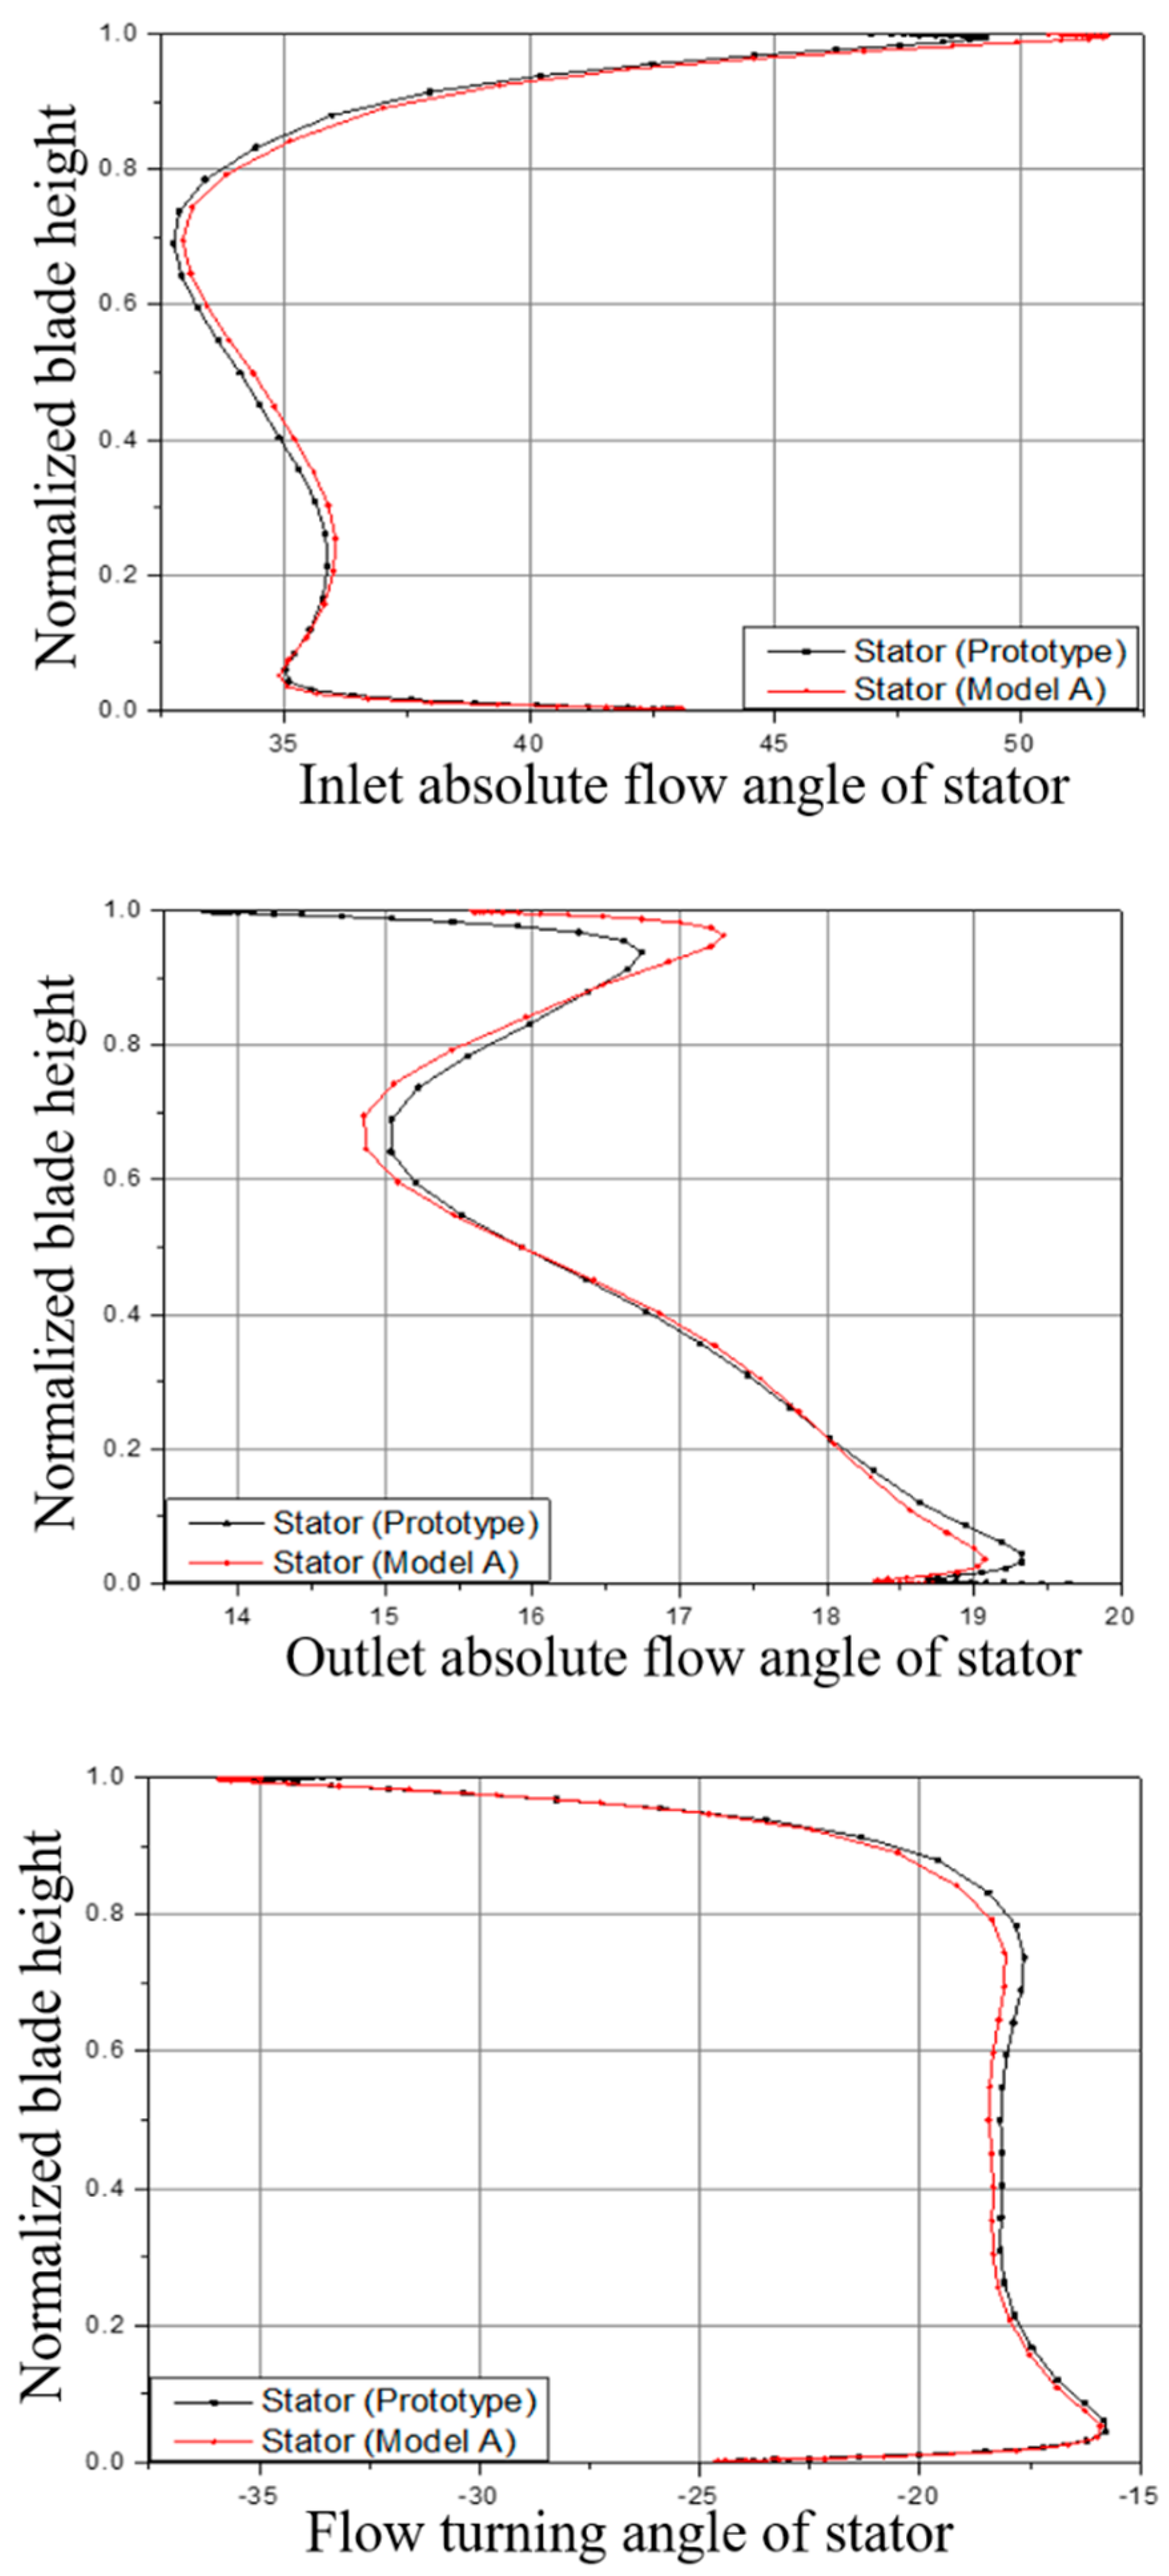
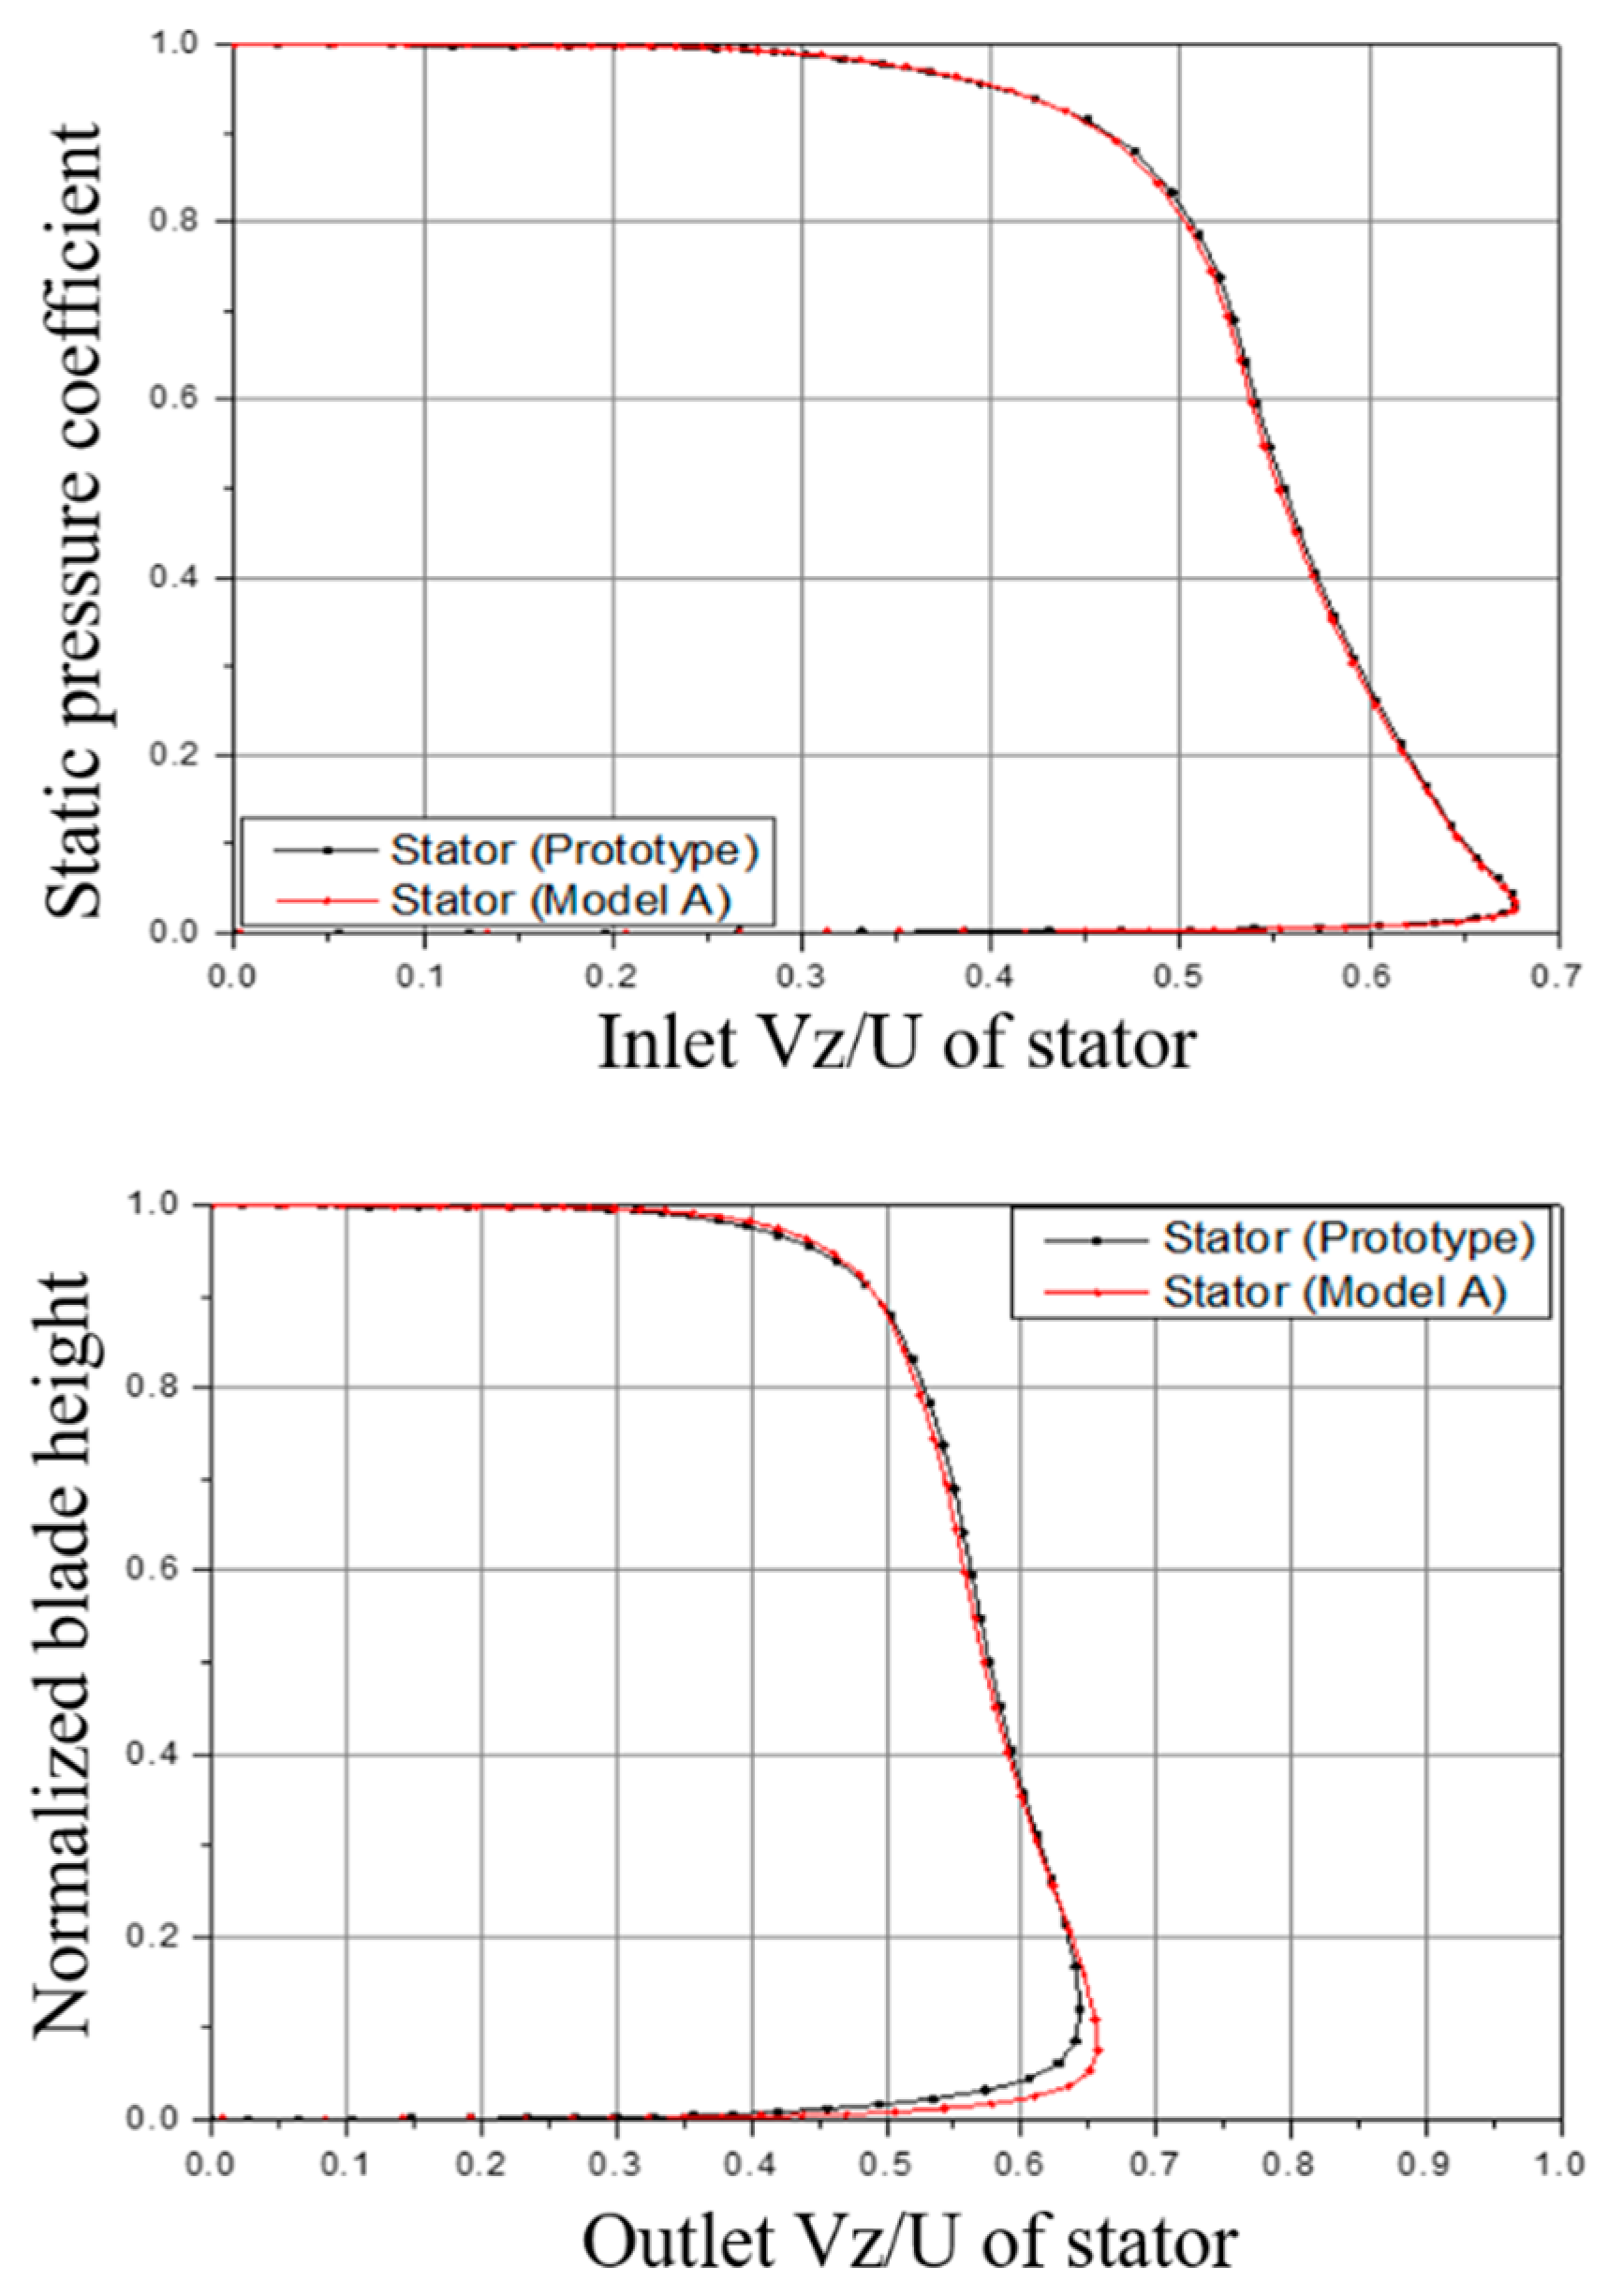
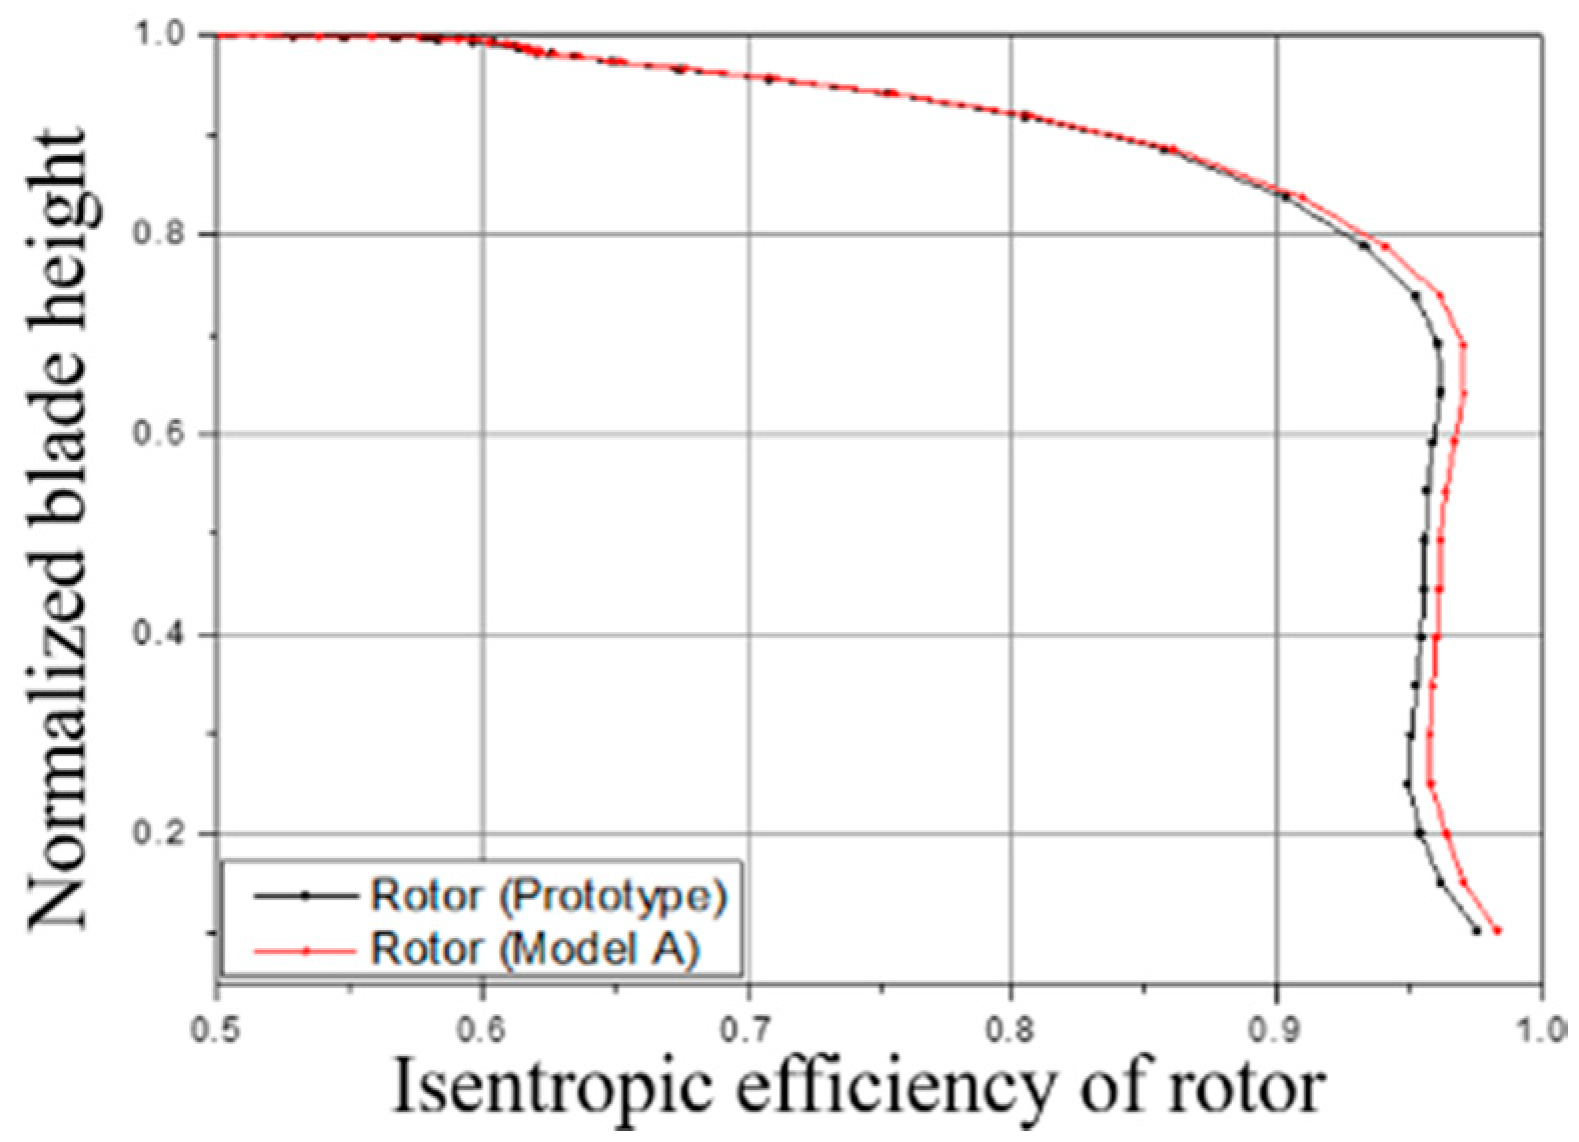
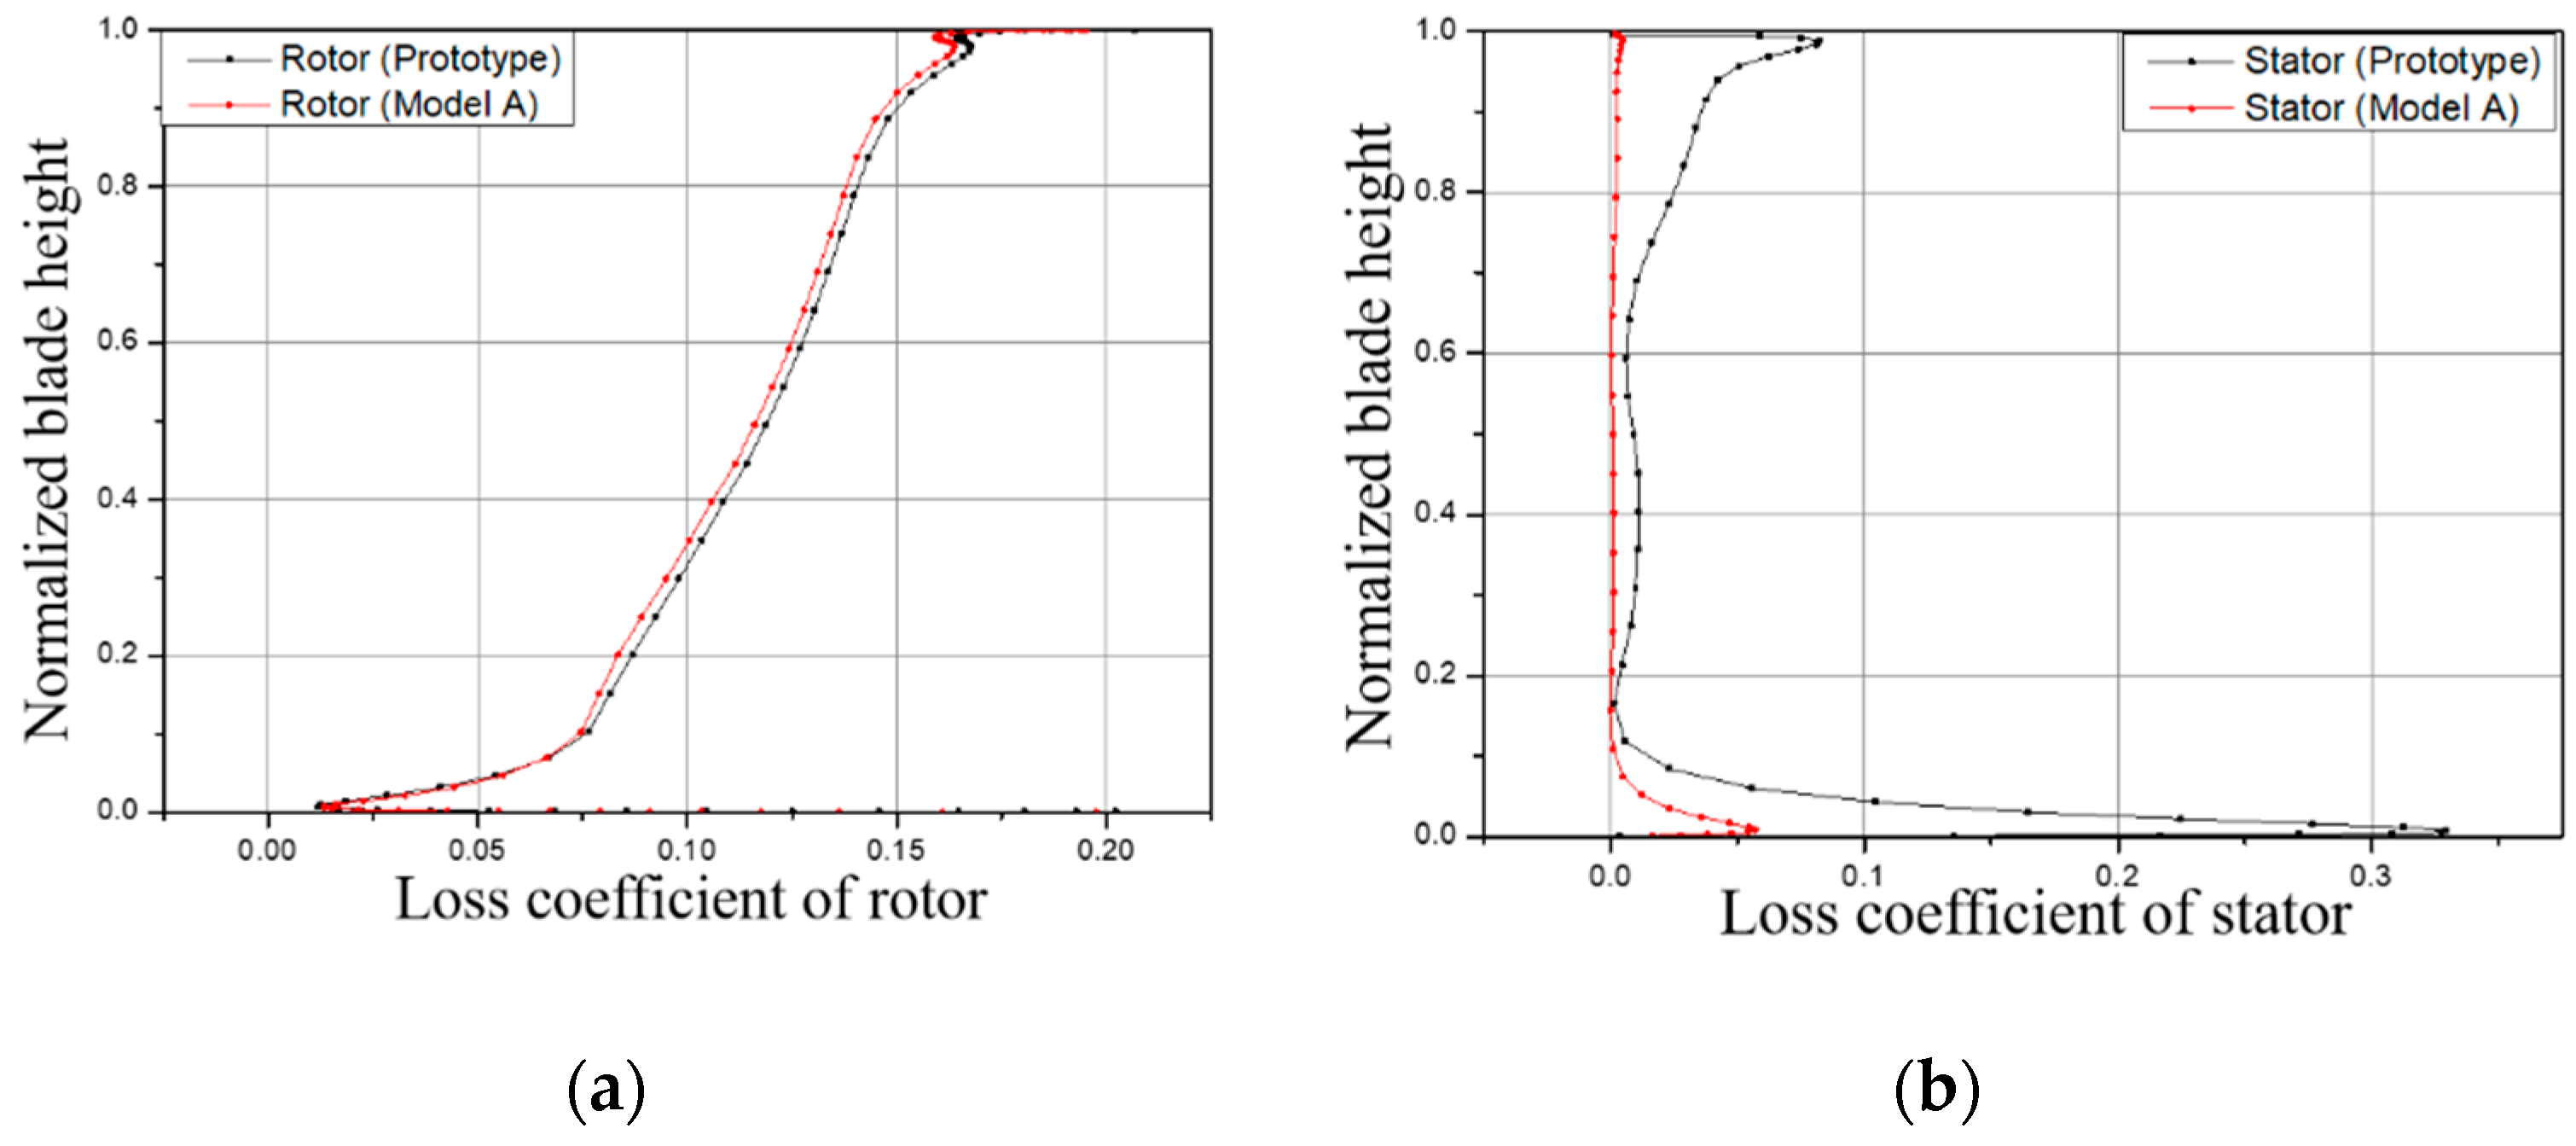
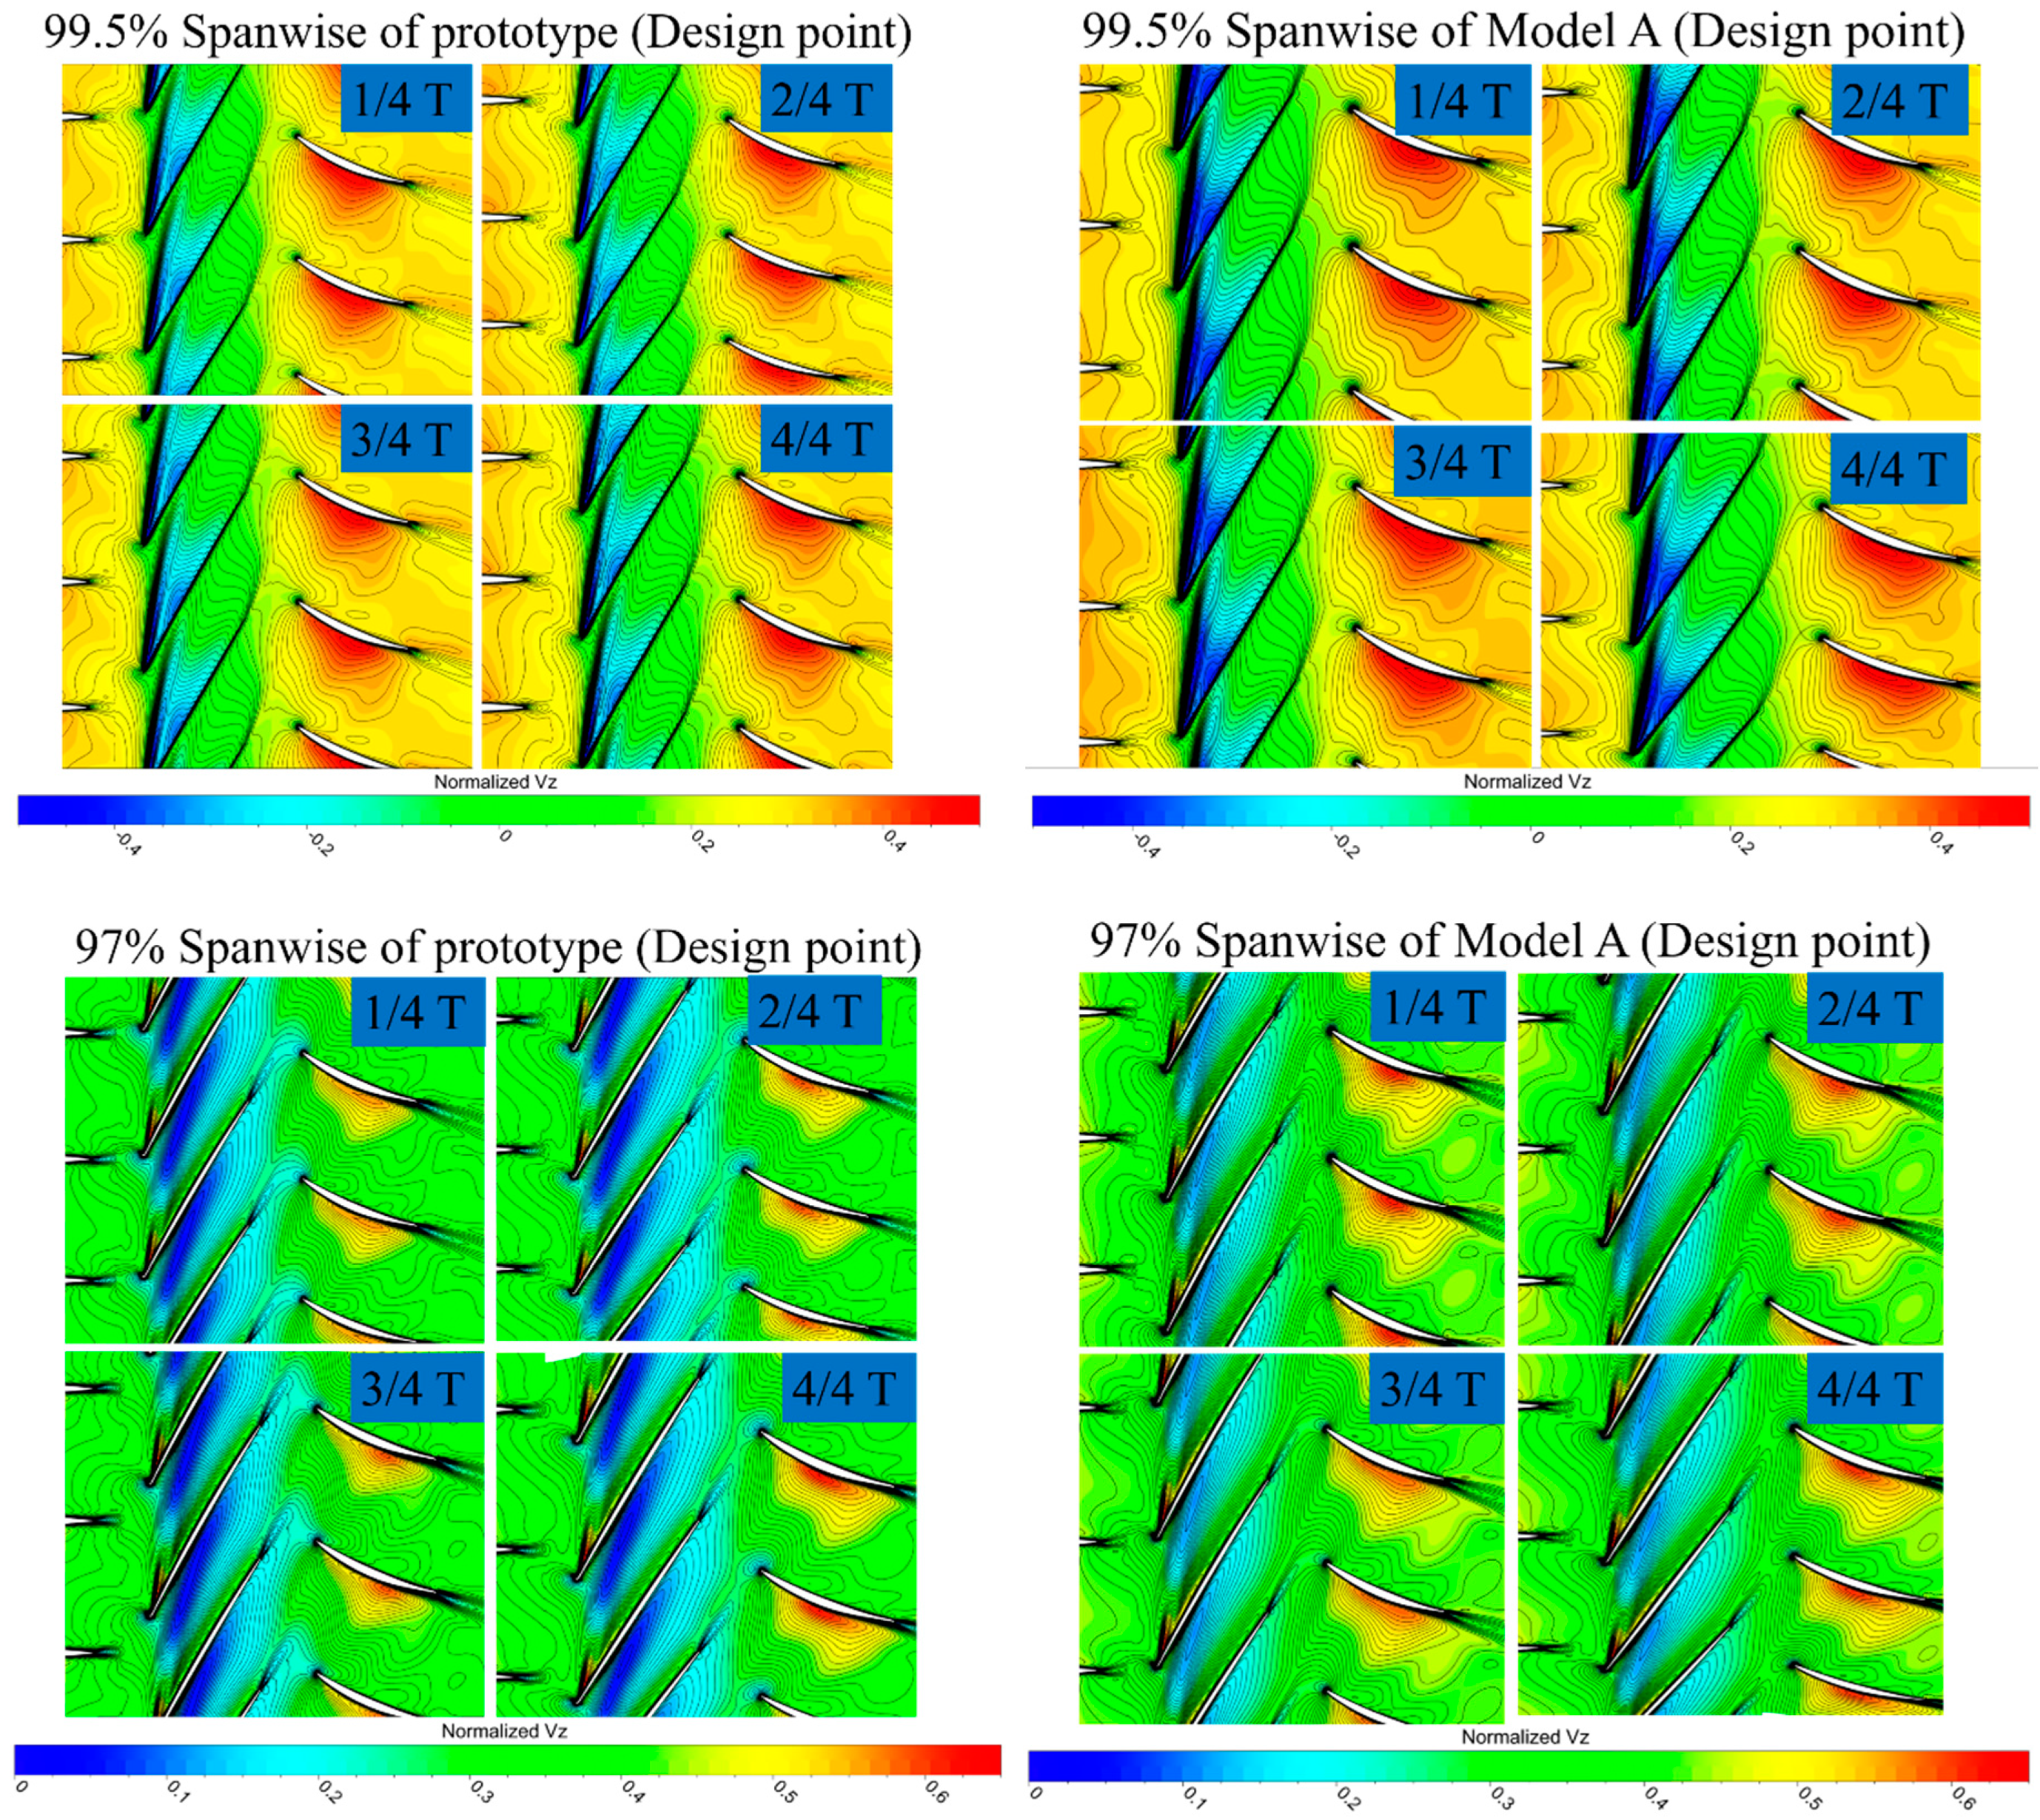
4.2.1. Comparison of the Prototype and Scaled-Up, Low-Speed Model A at Design Point
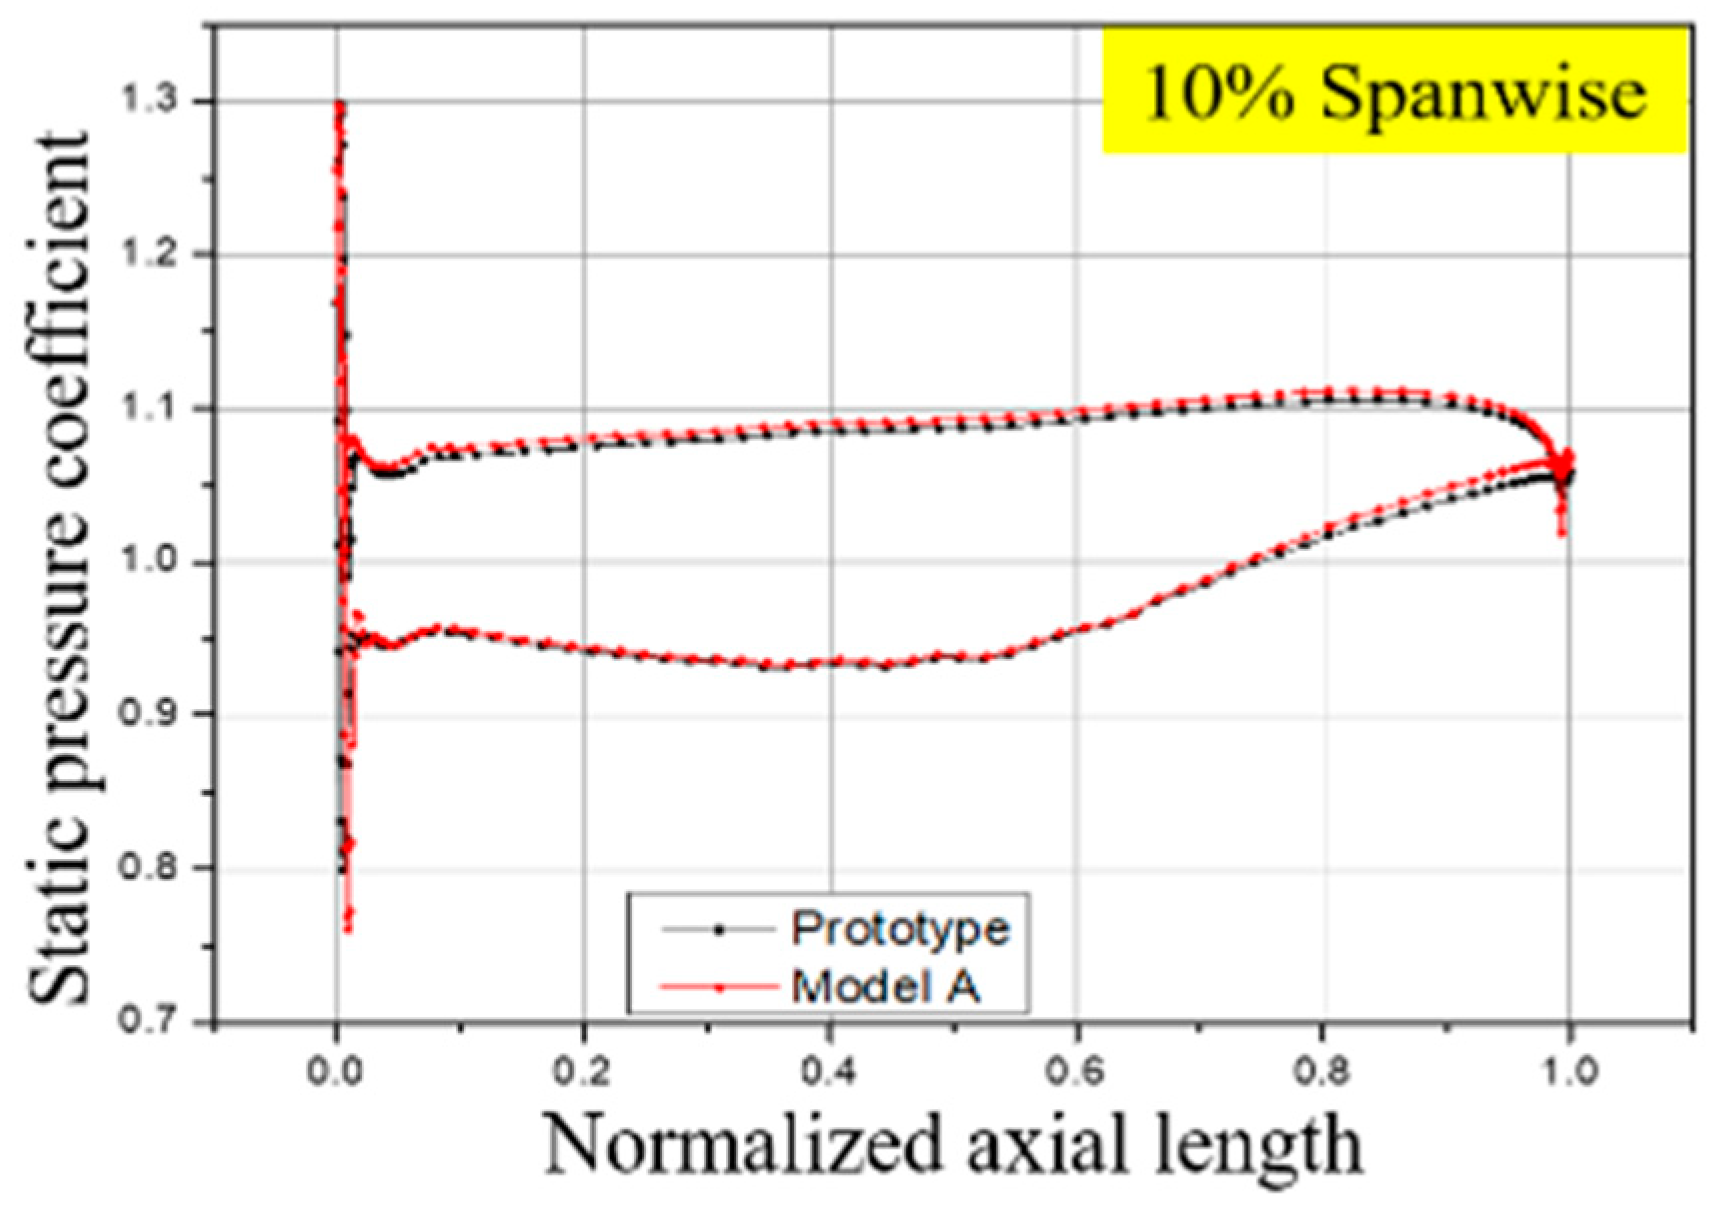
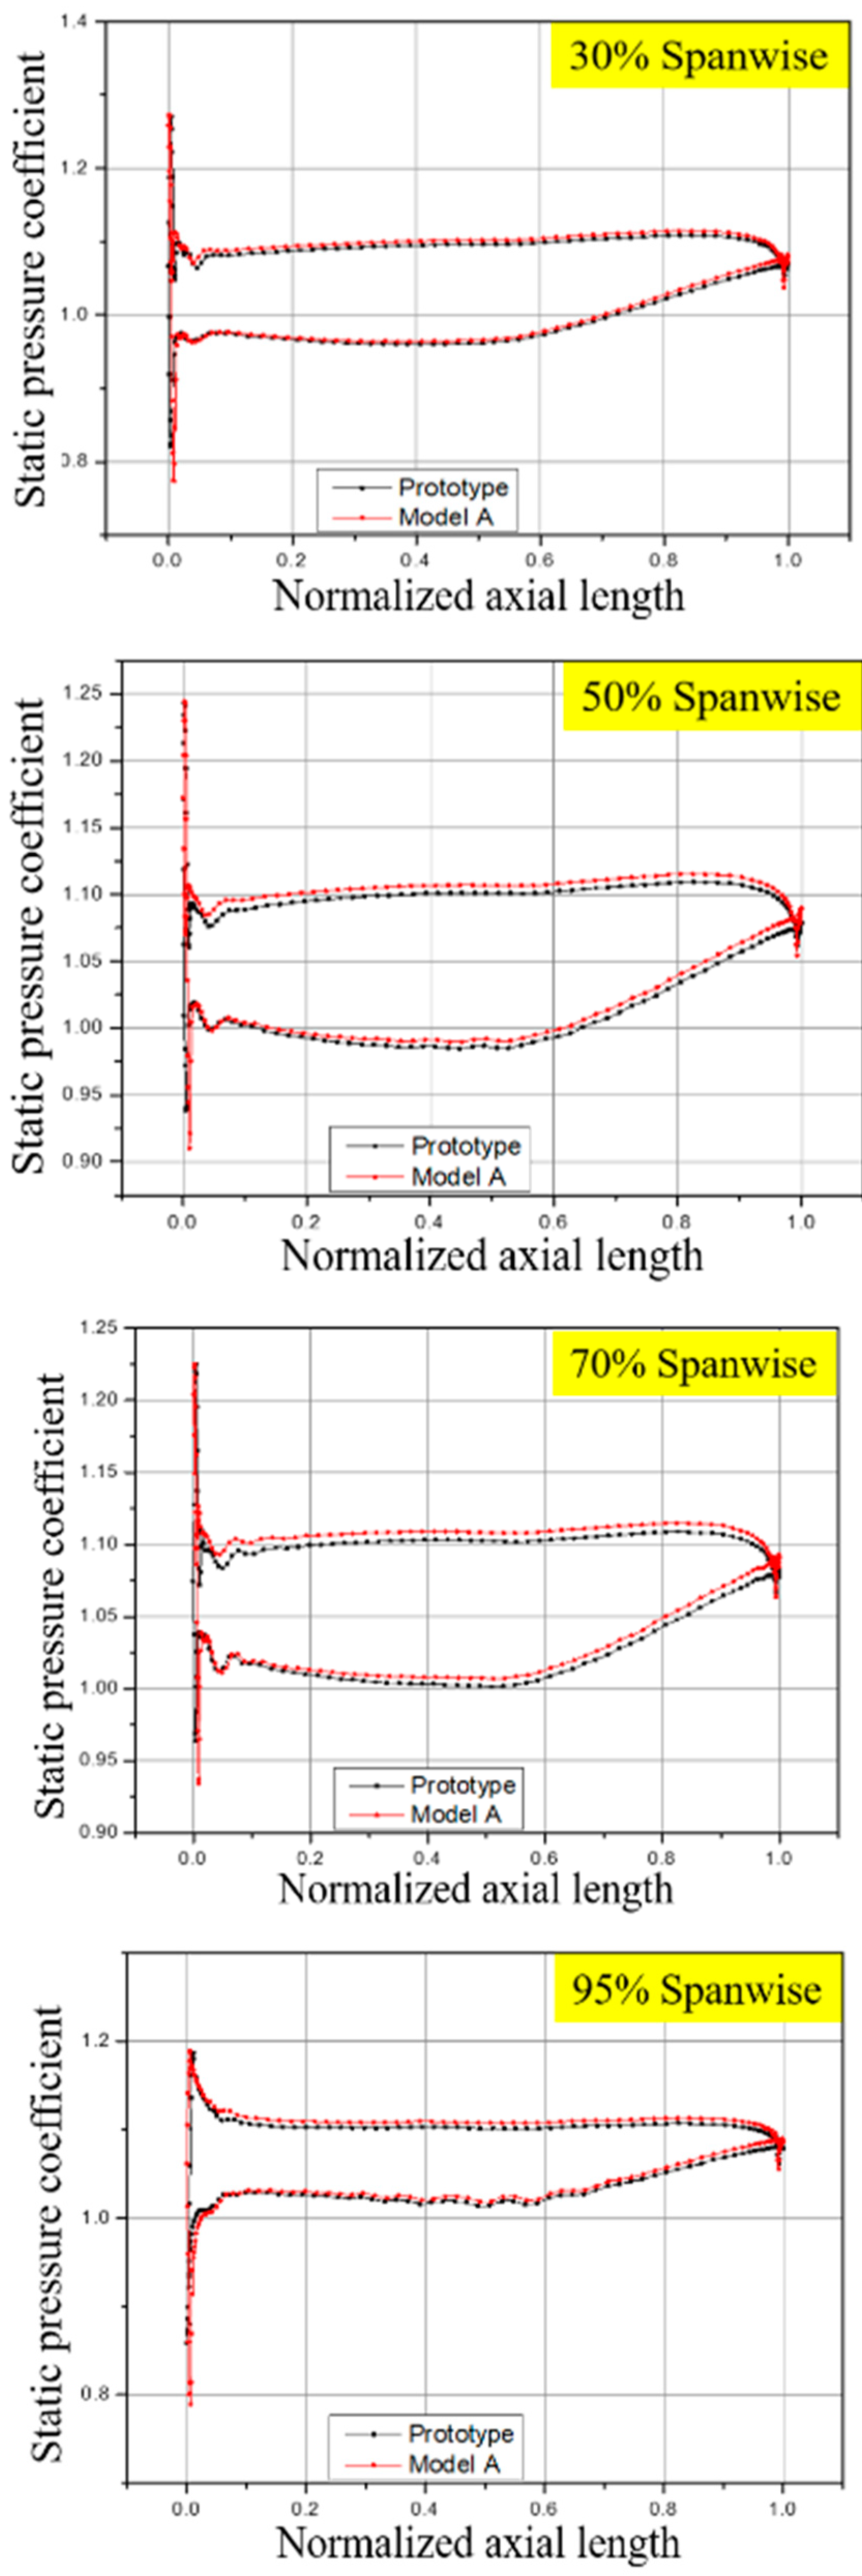
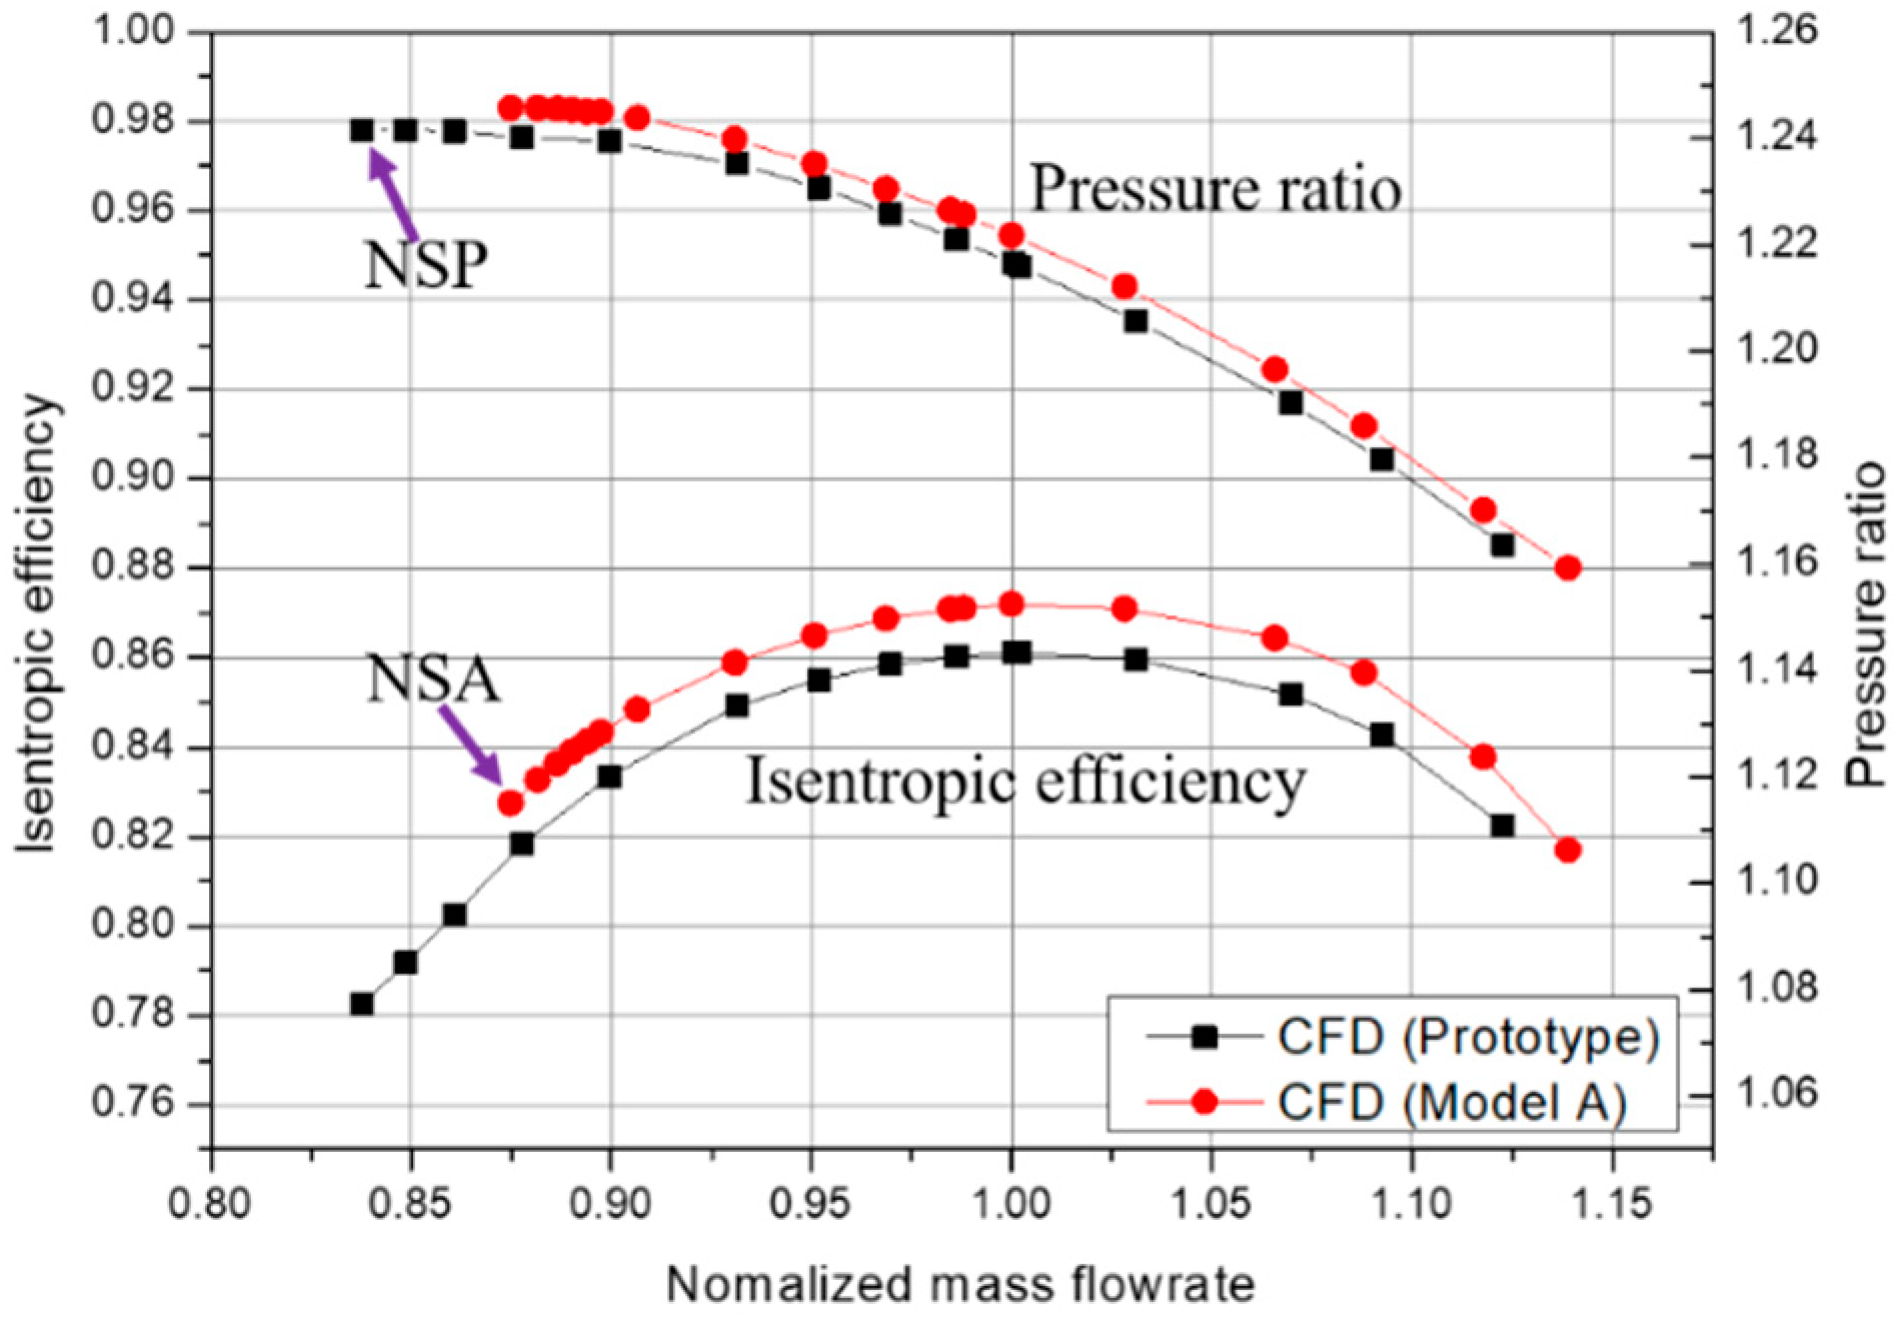
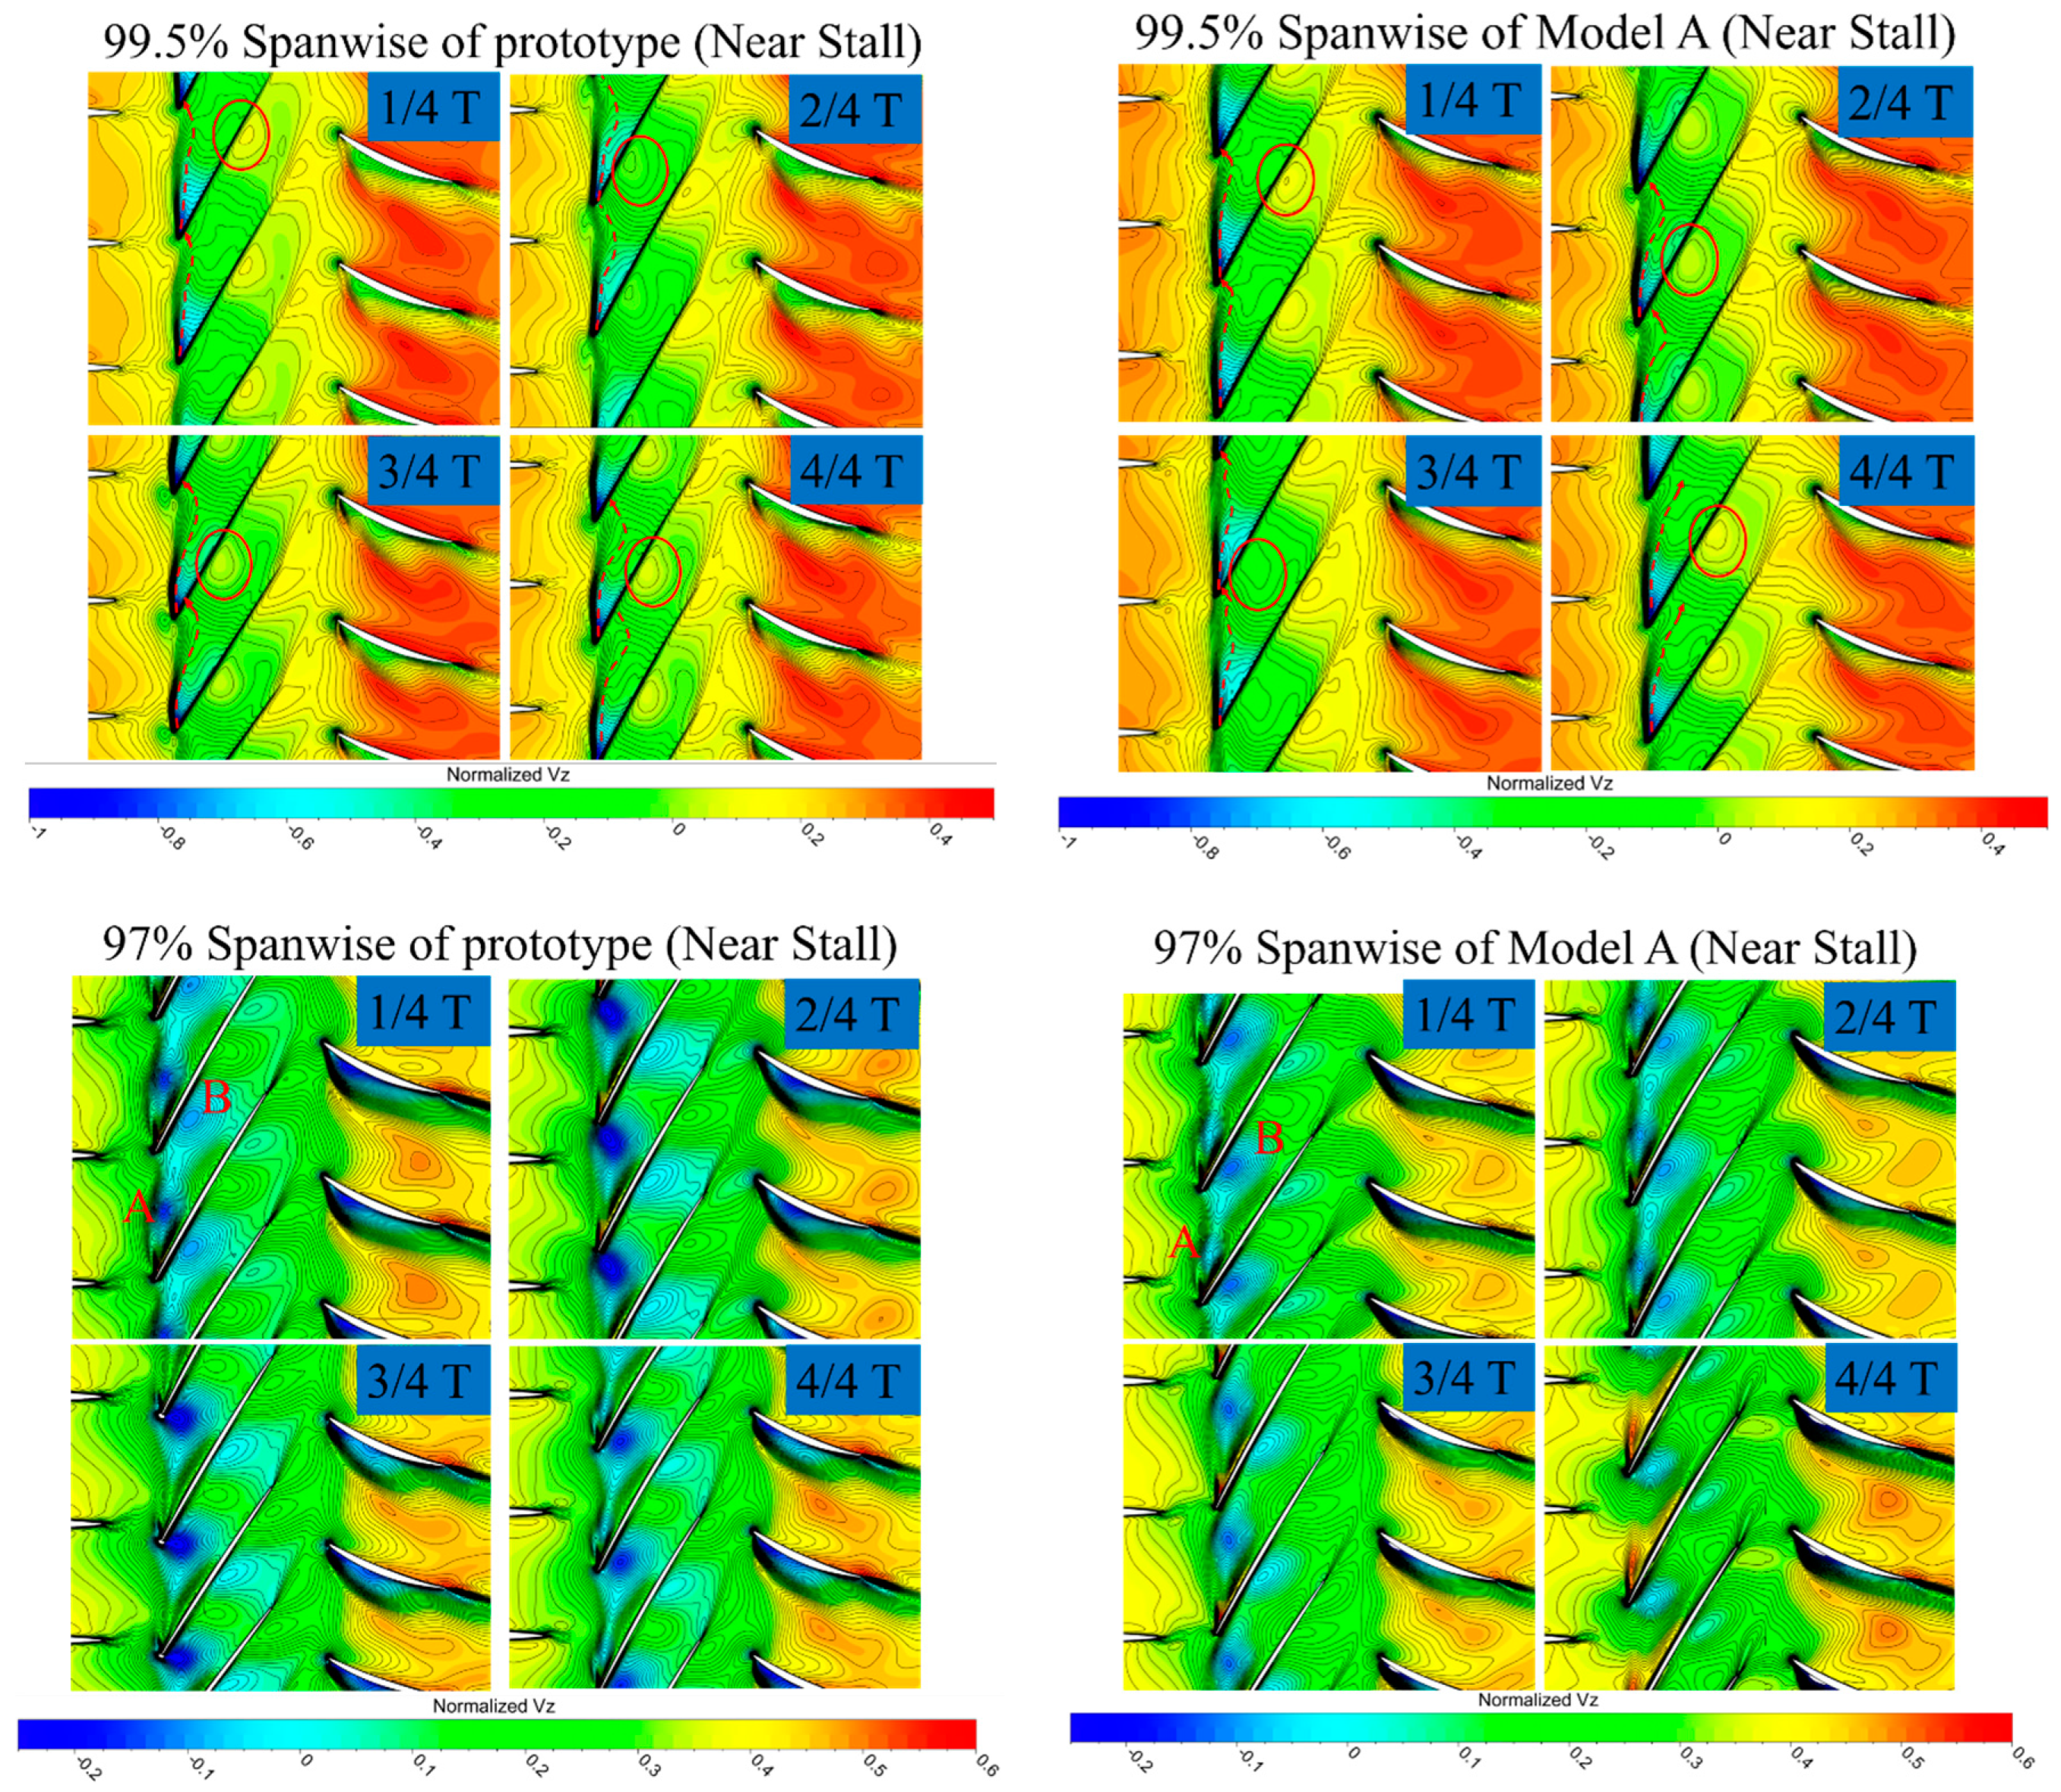
4.2.2. Comparison of the Prototype and Scaled-Up, Low-Speed Model A in Operating Conditions
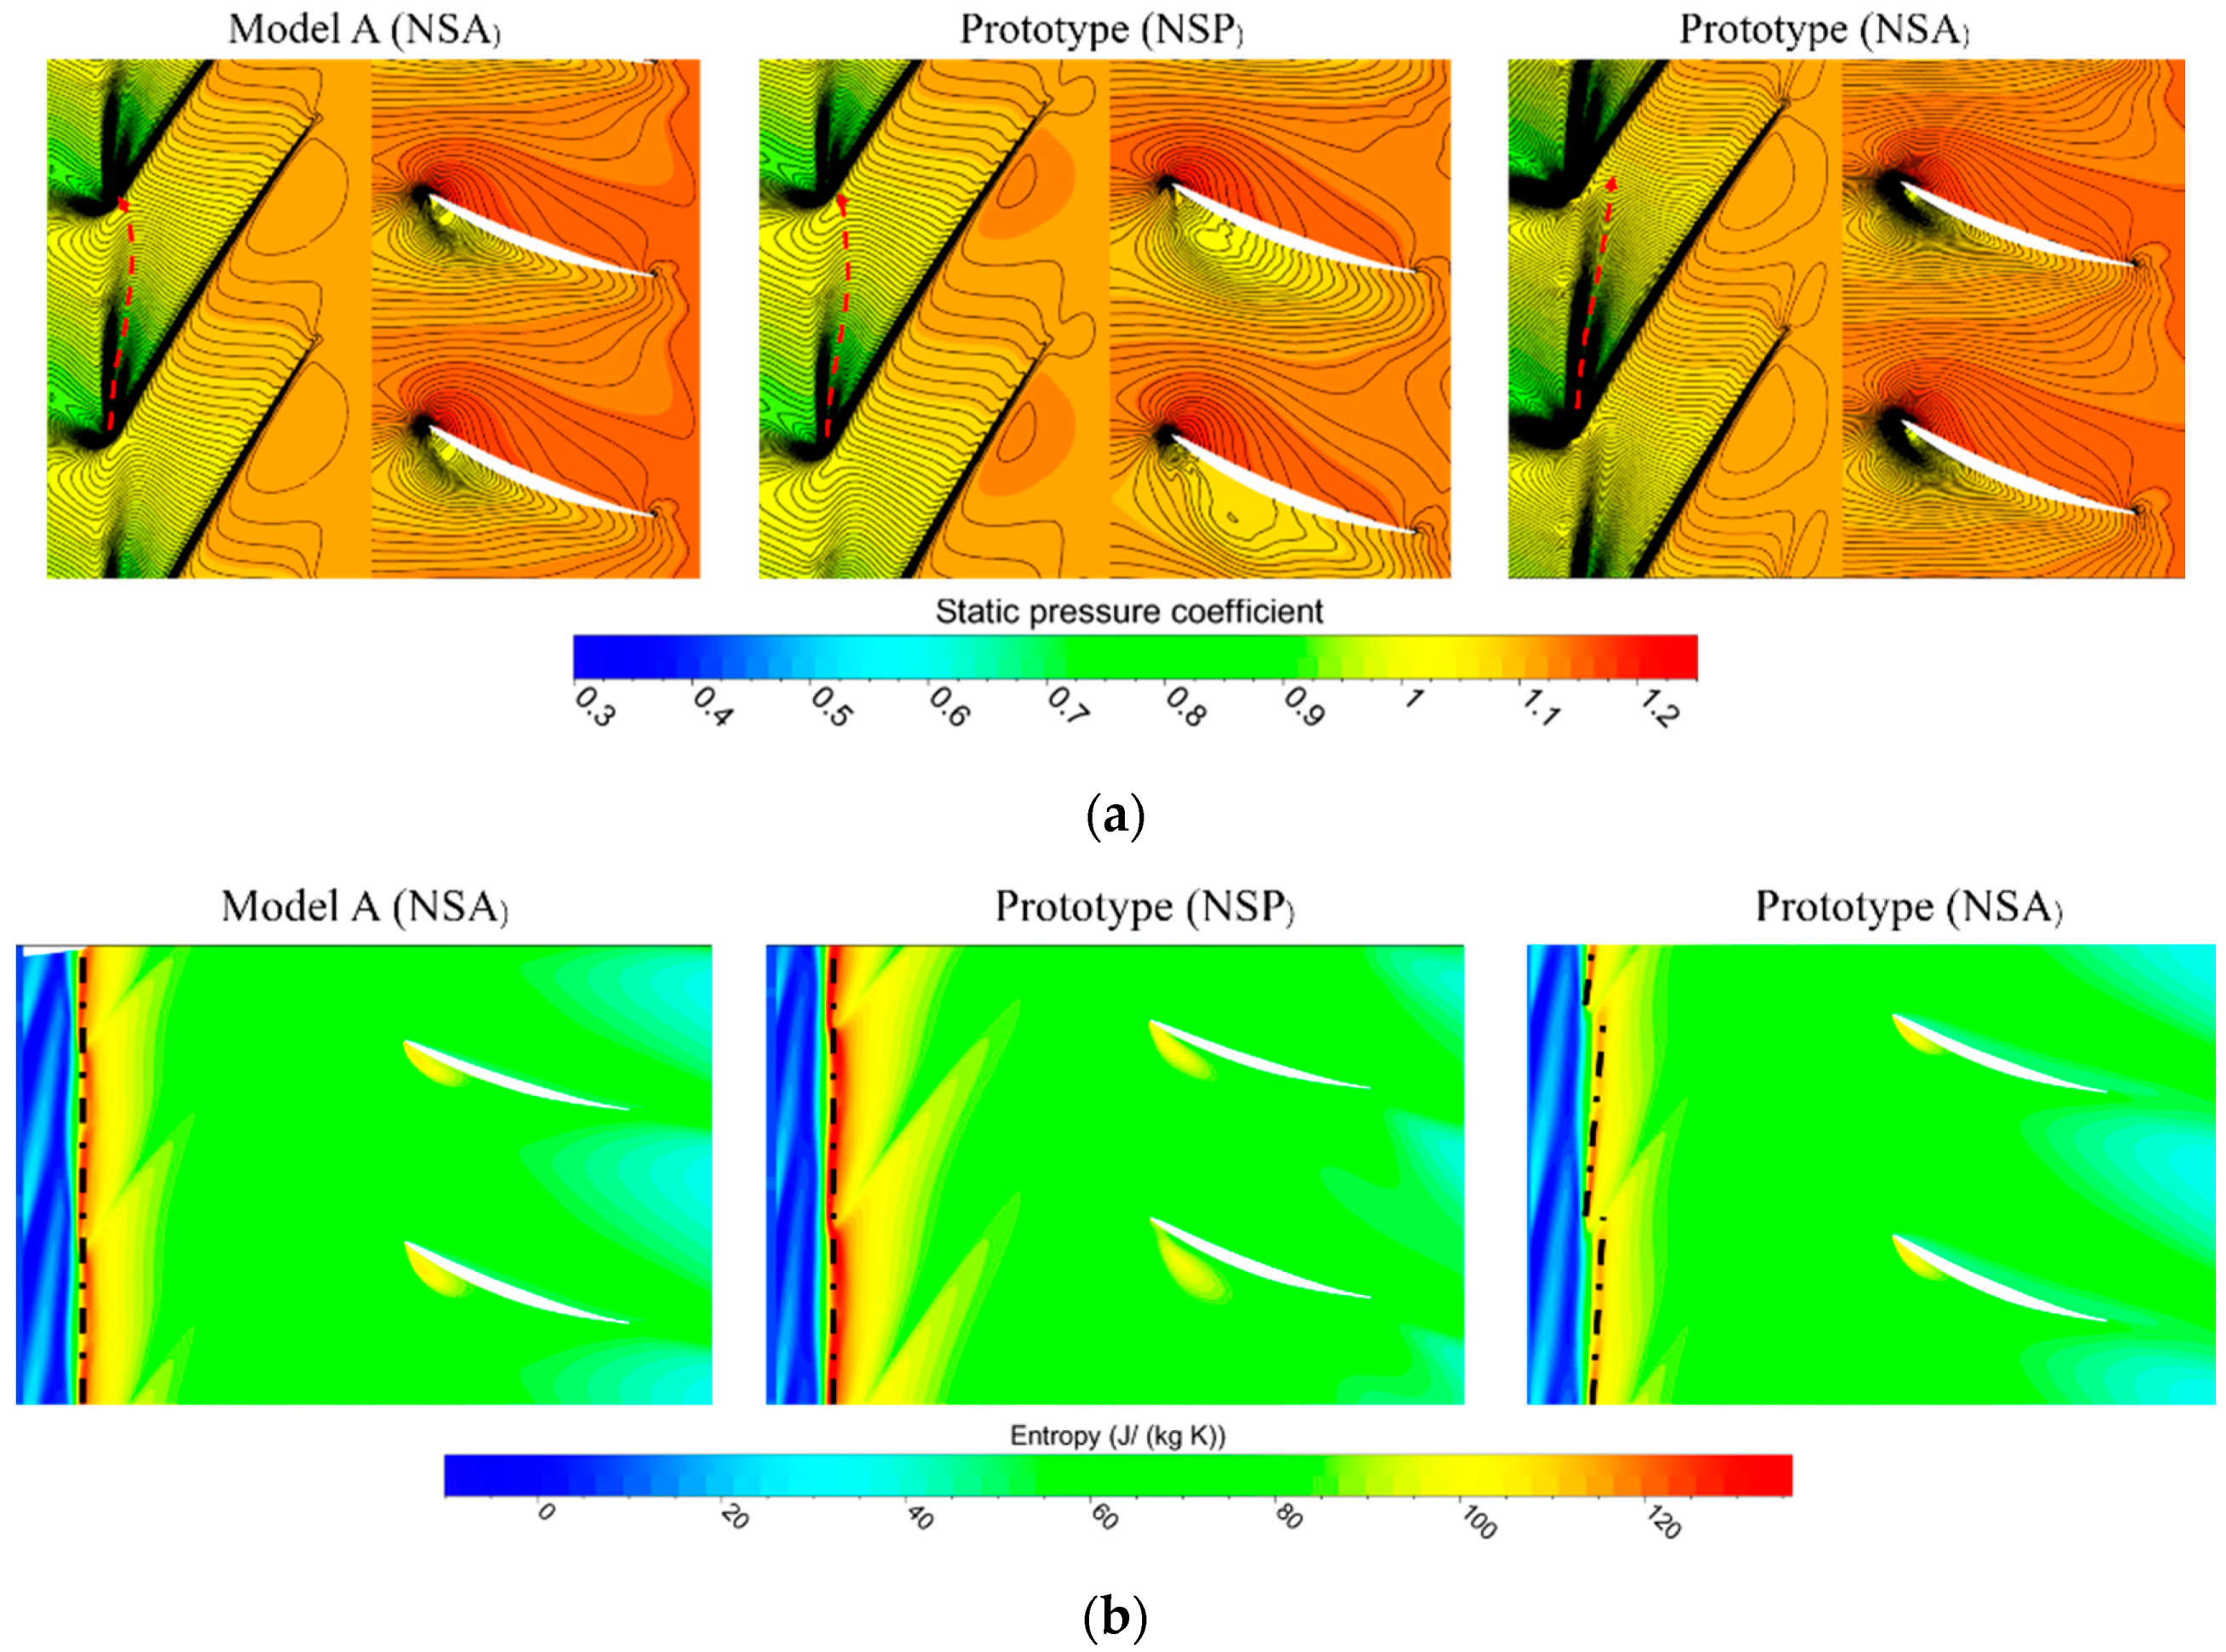
4.2.3. Comparison of the Prototype and Scaled-Up, Low-Speed Model A under Unsteady Condition
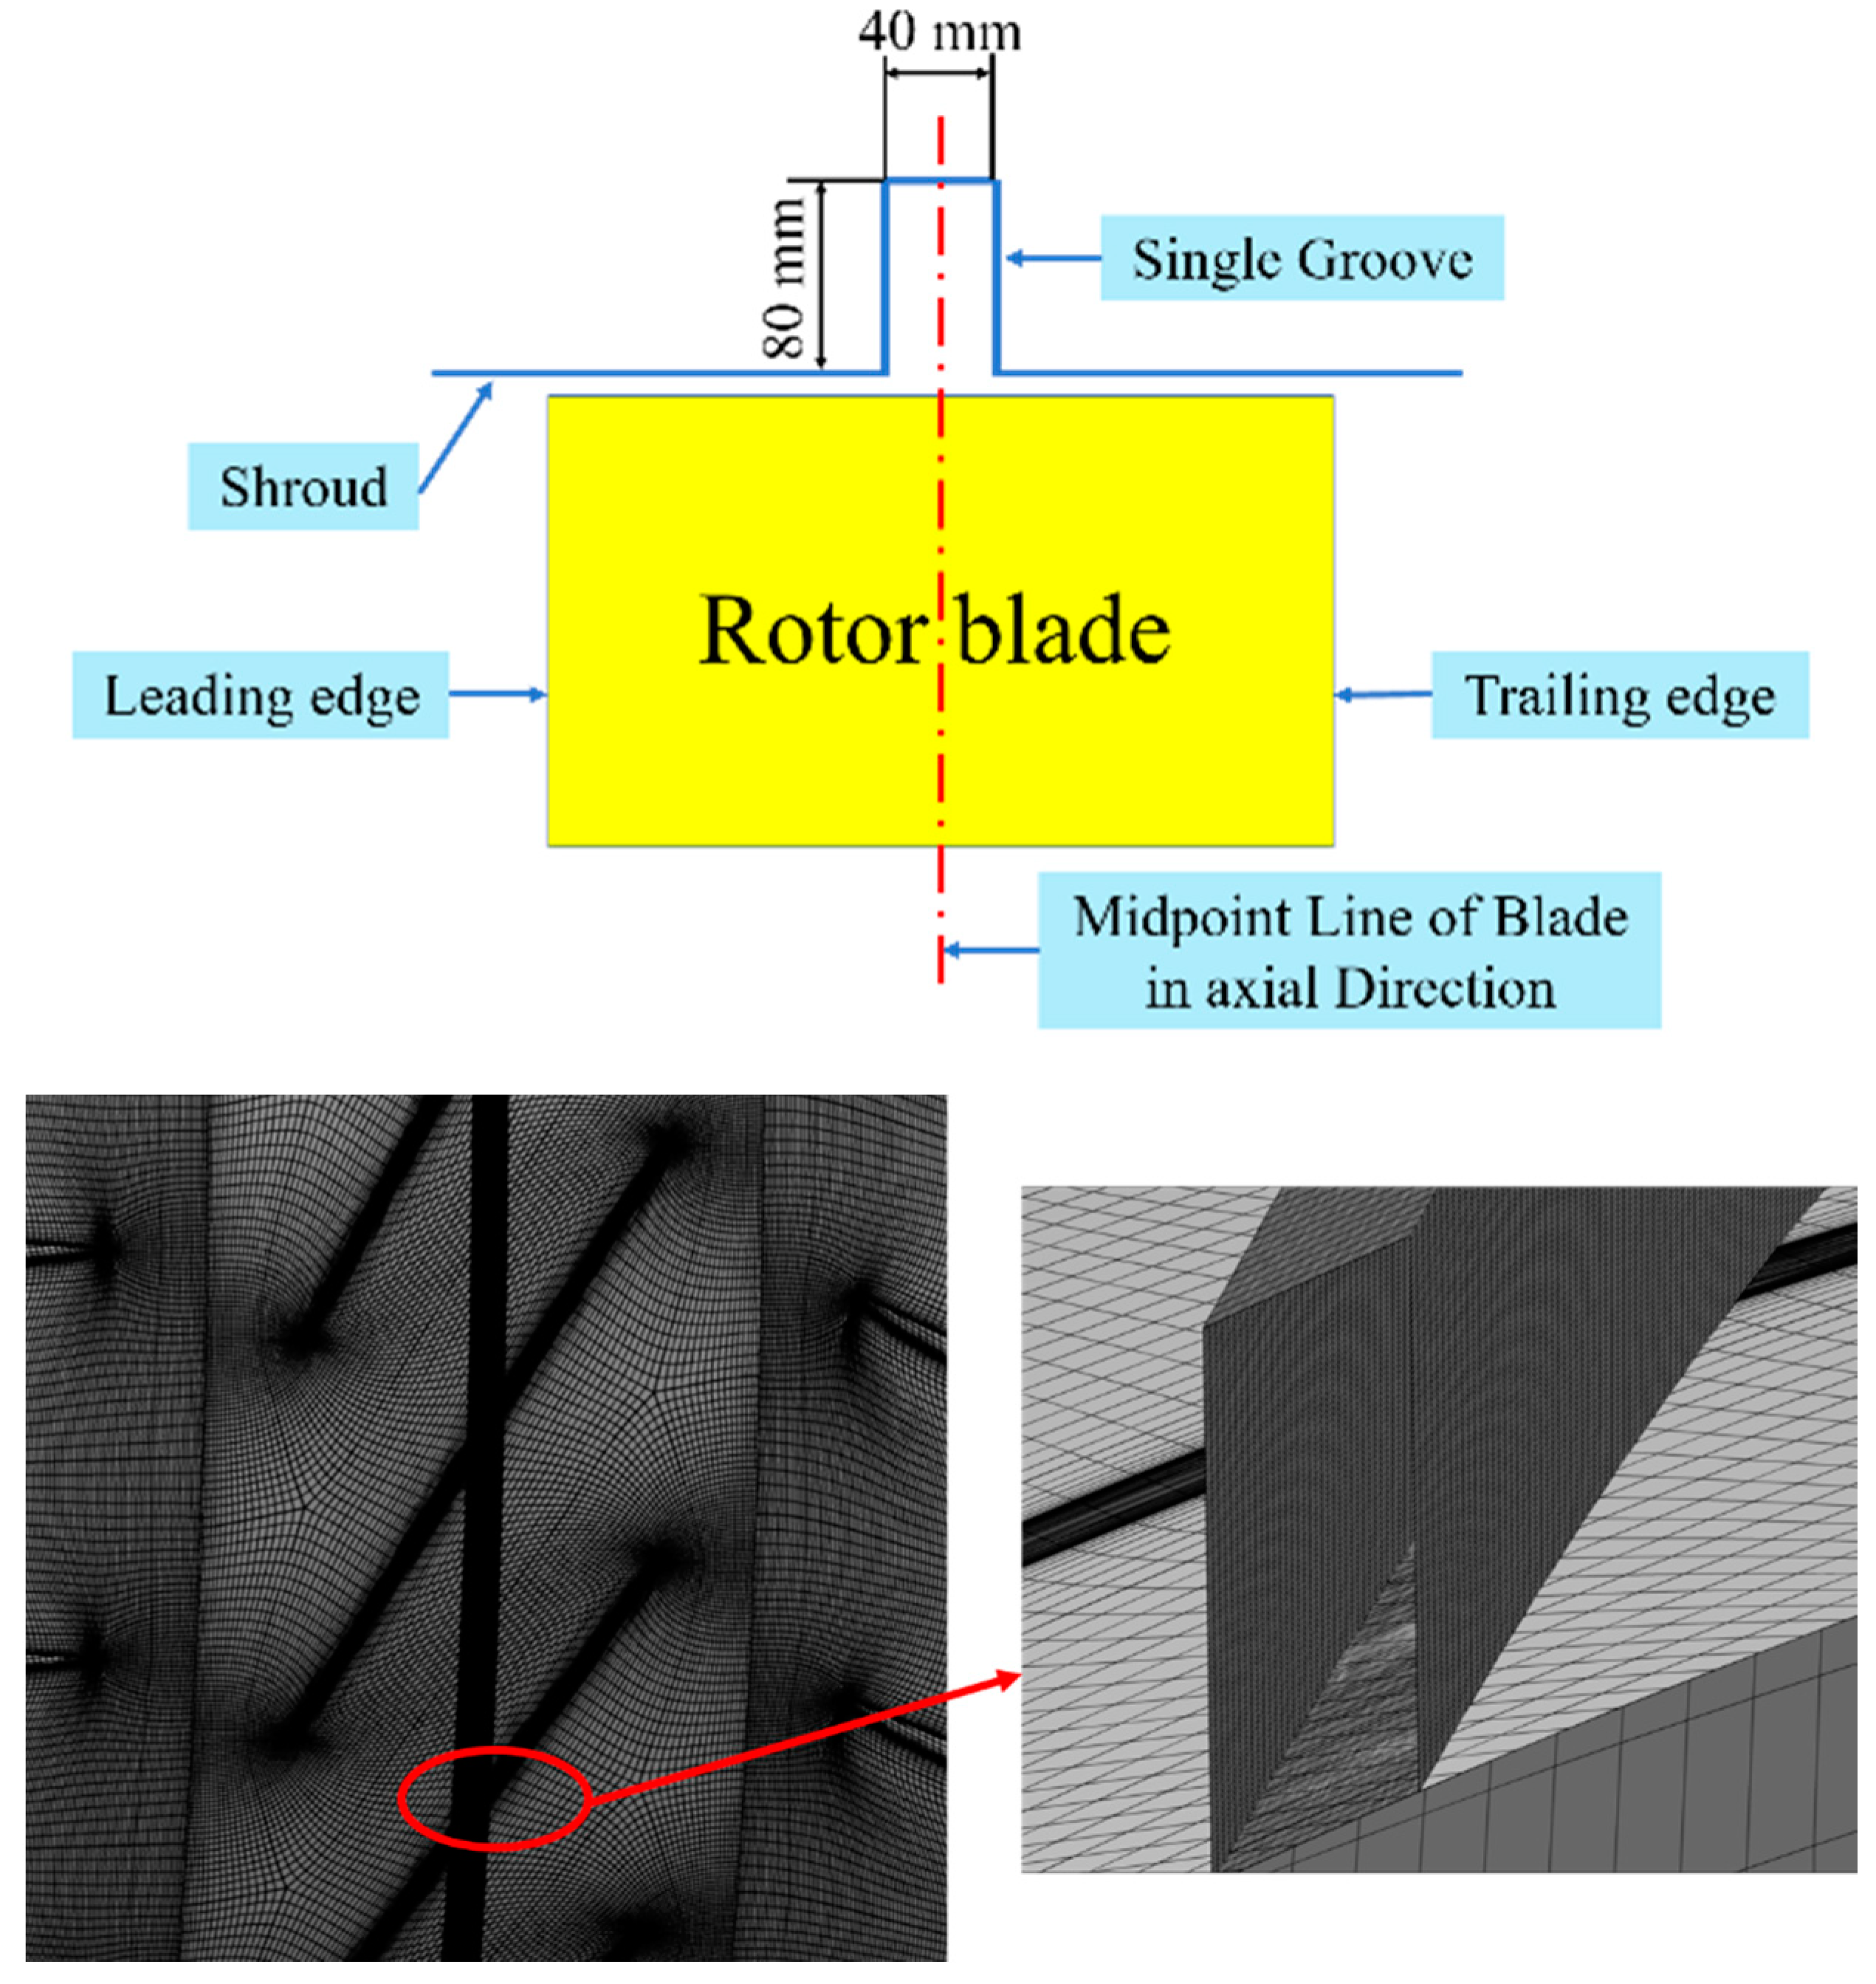
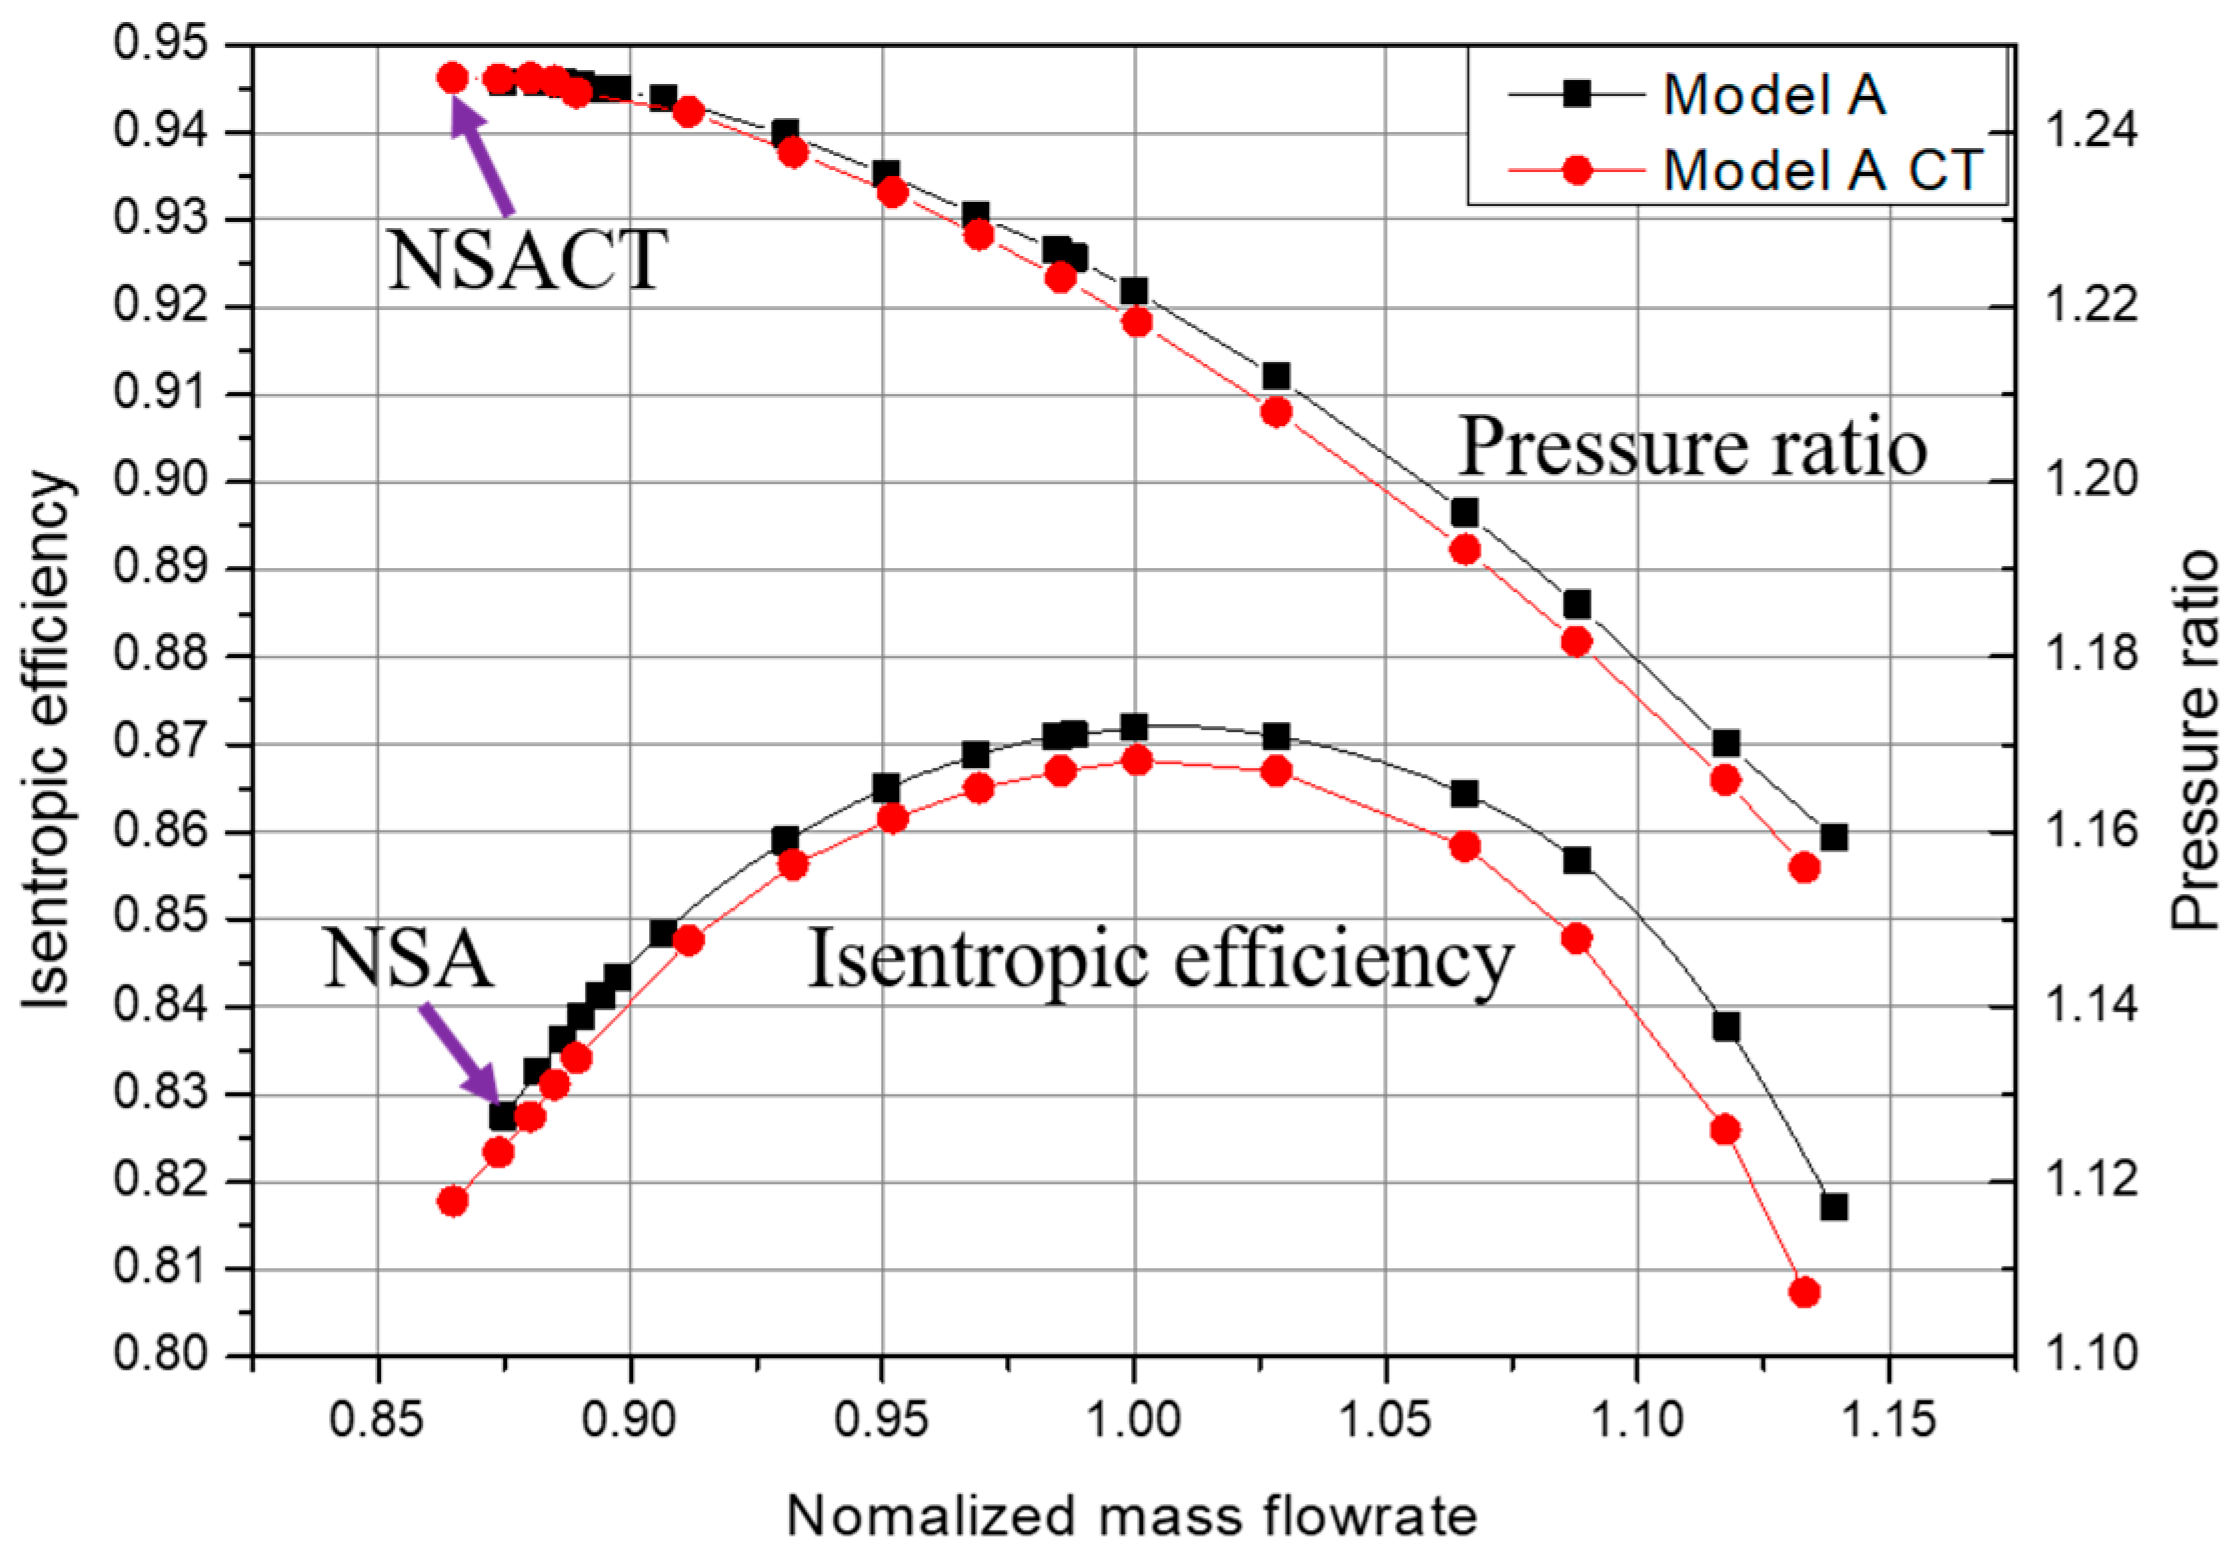
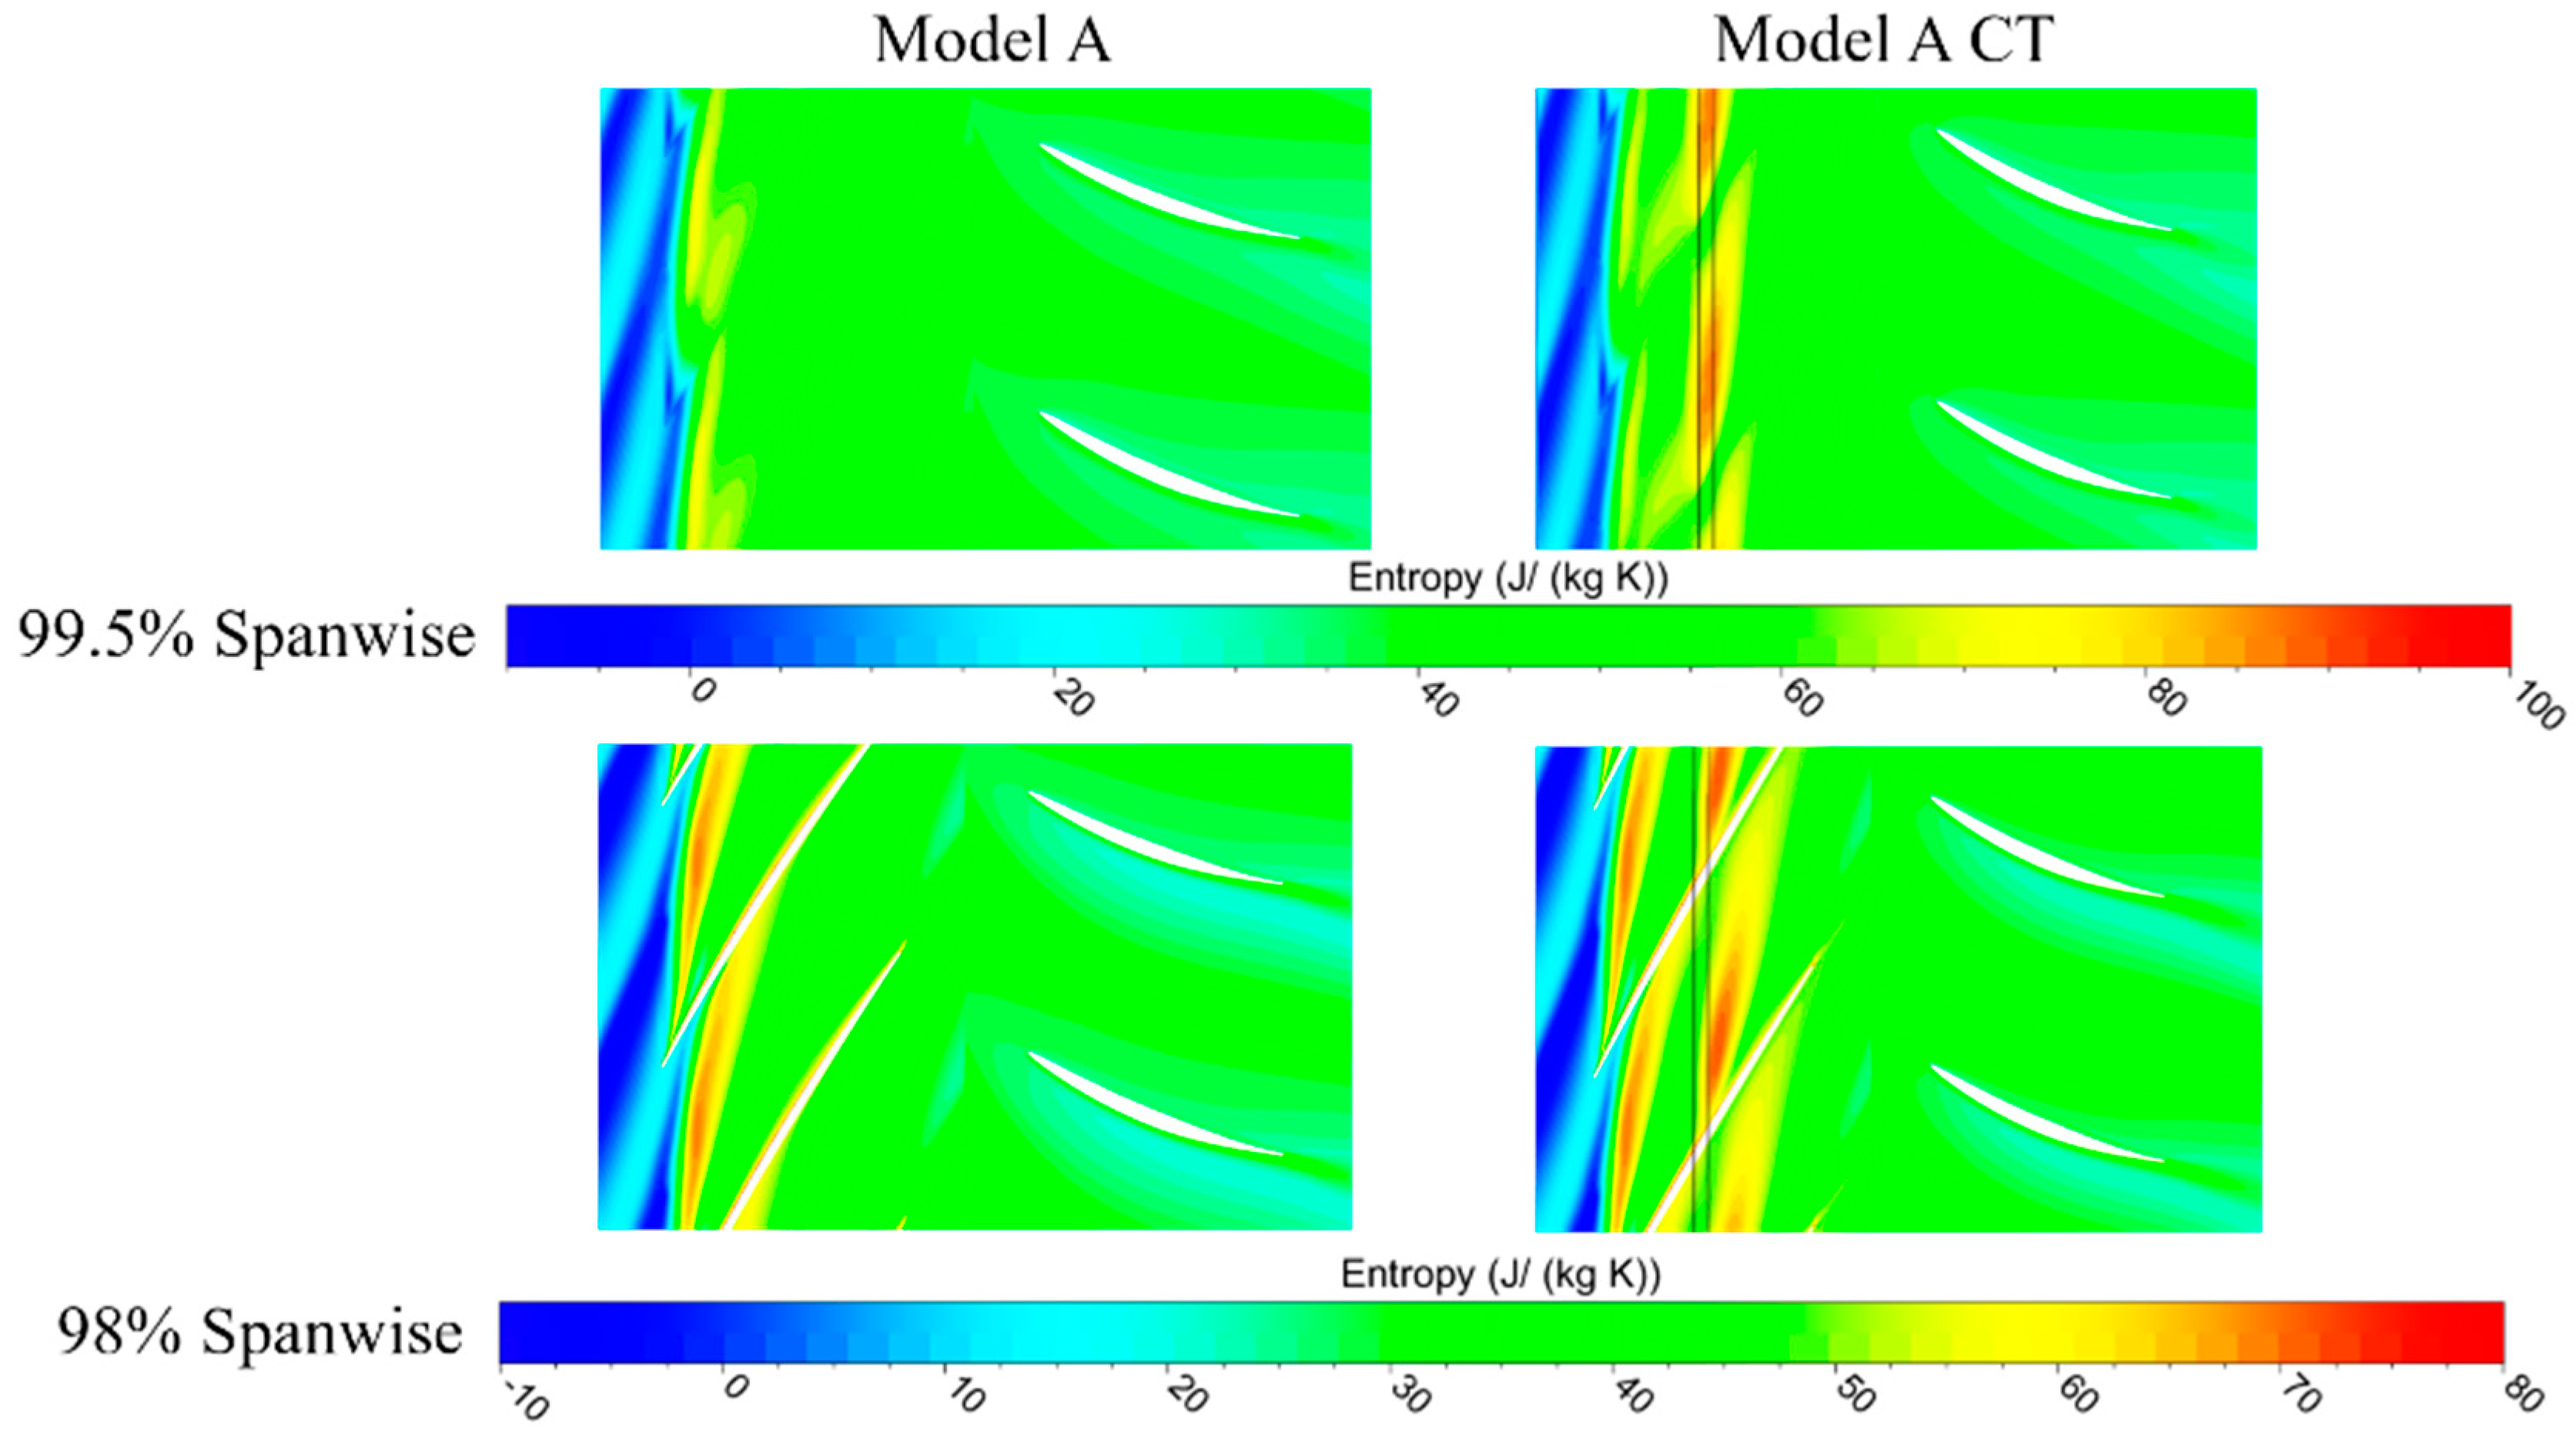
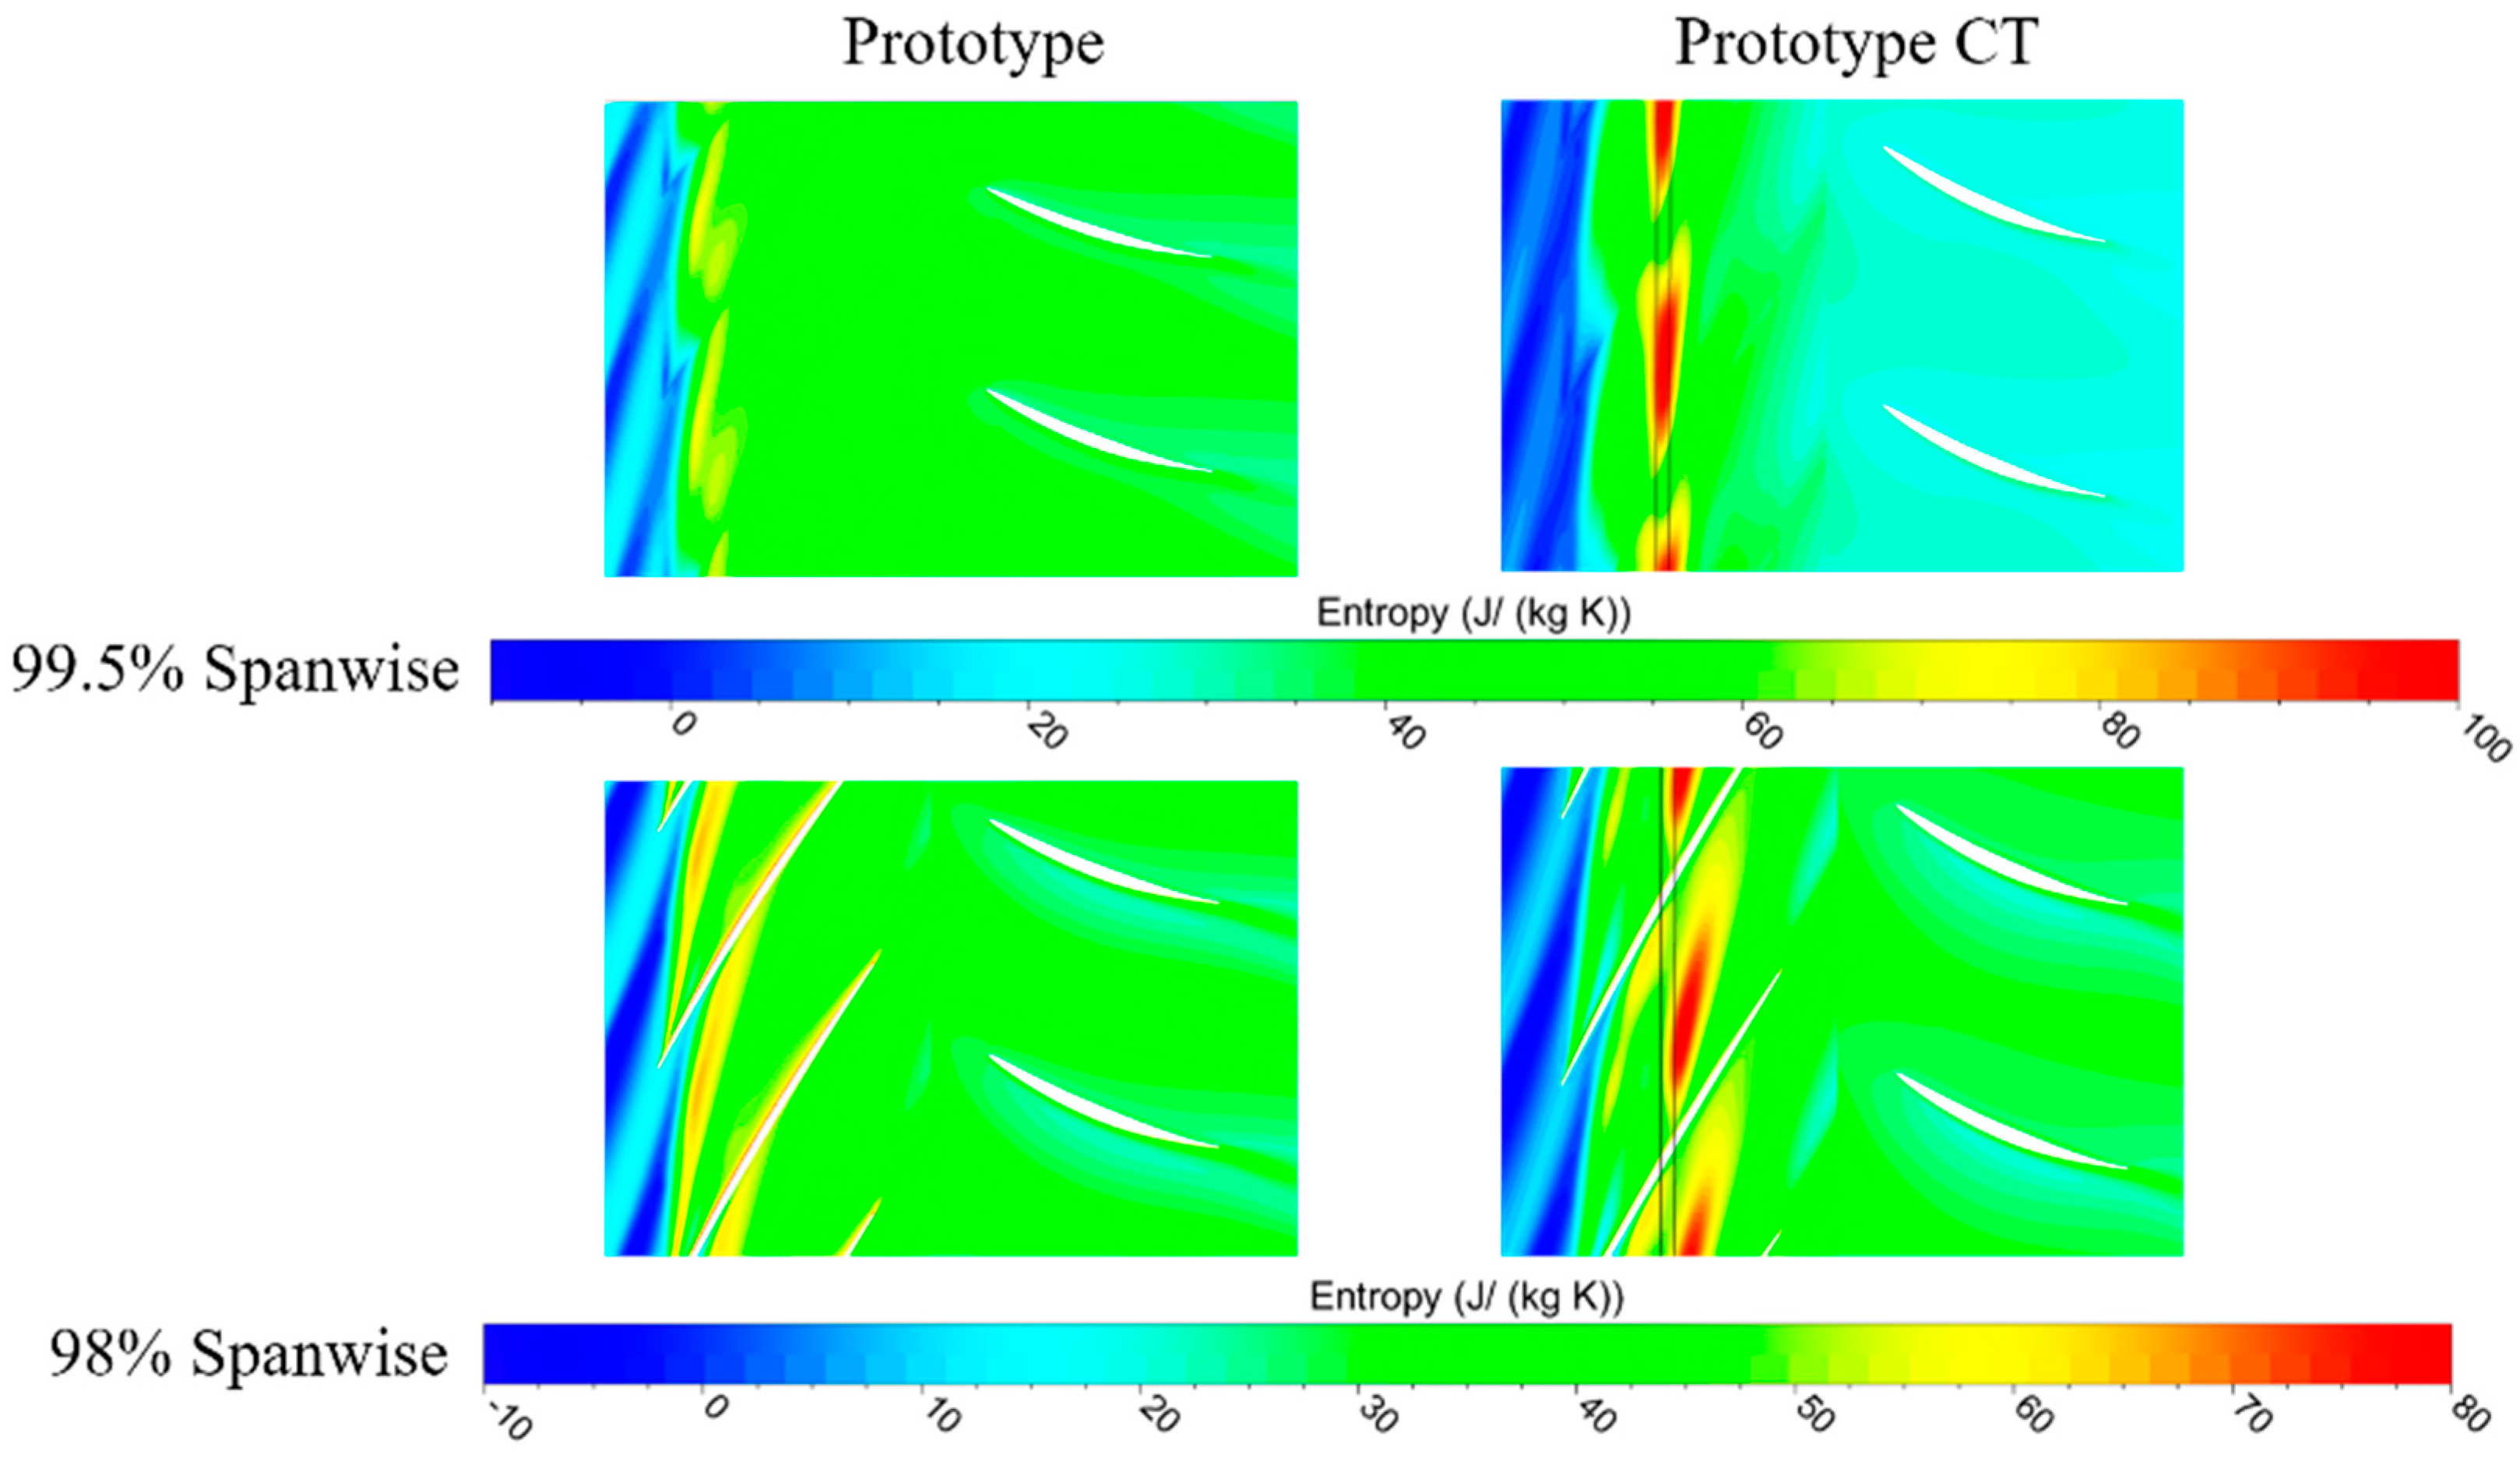
4.3. Stability Improvement through Casing Treatment
5. Discussion
6. Conclusions
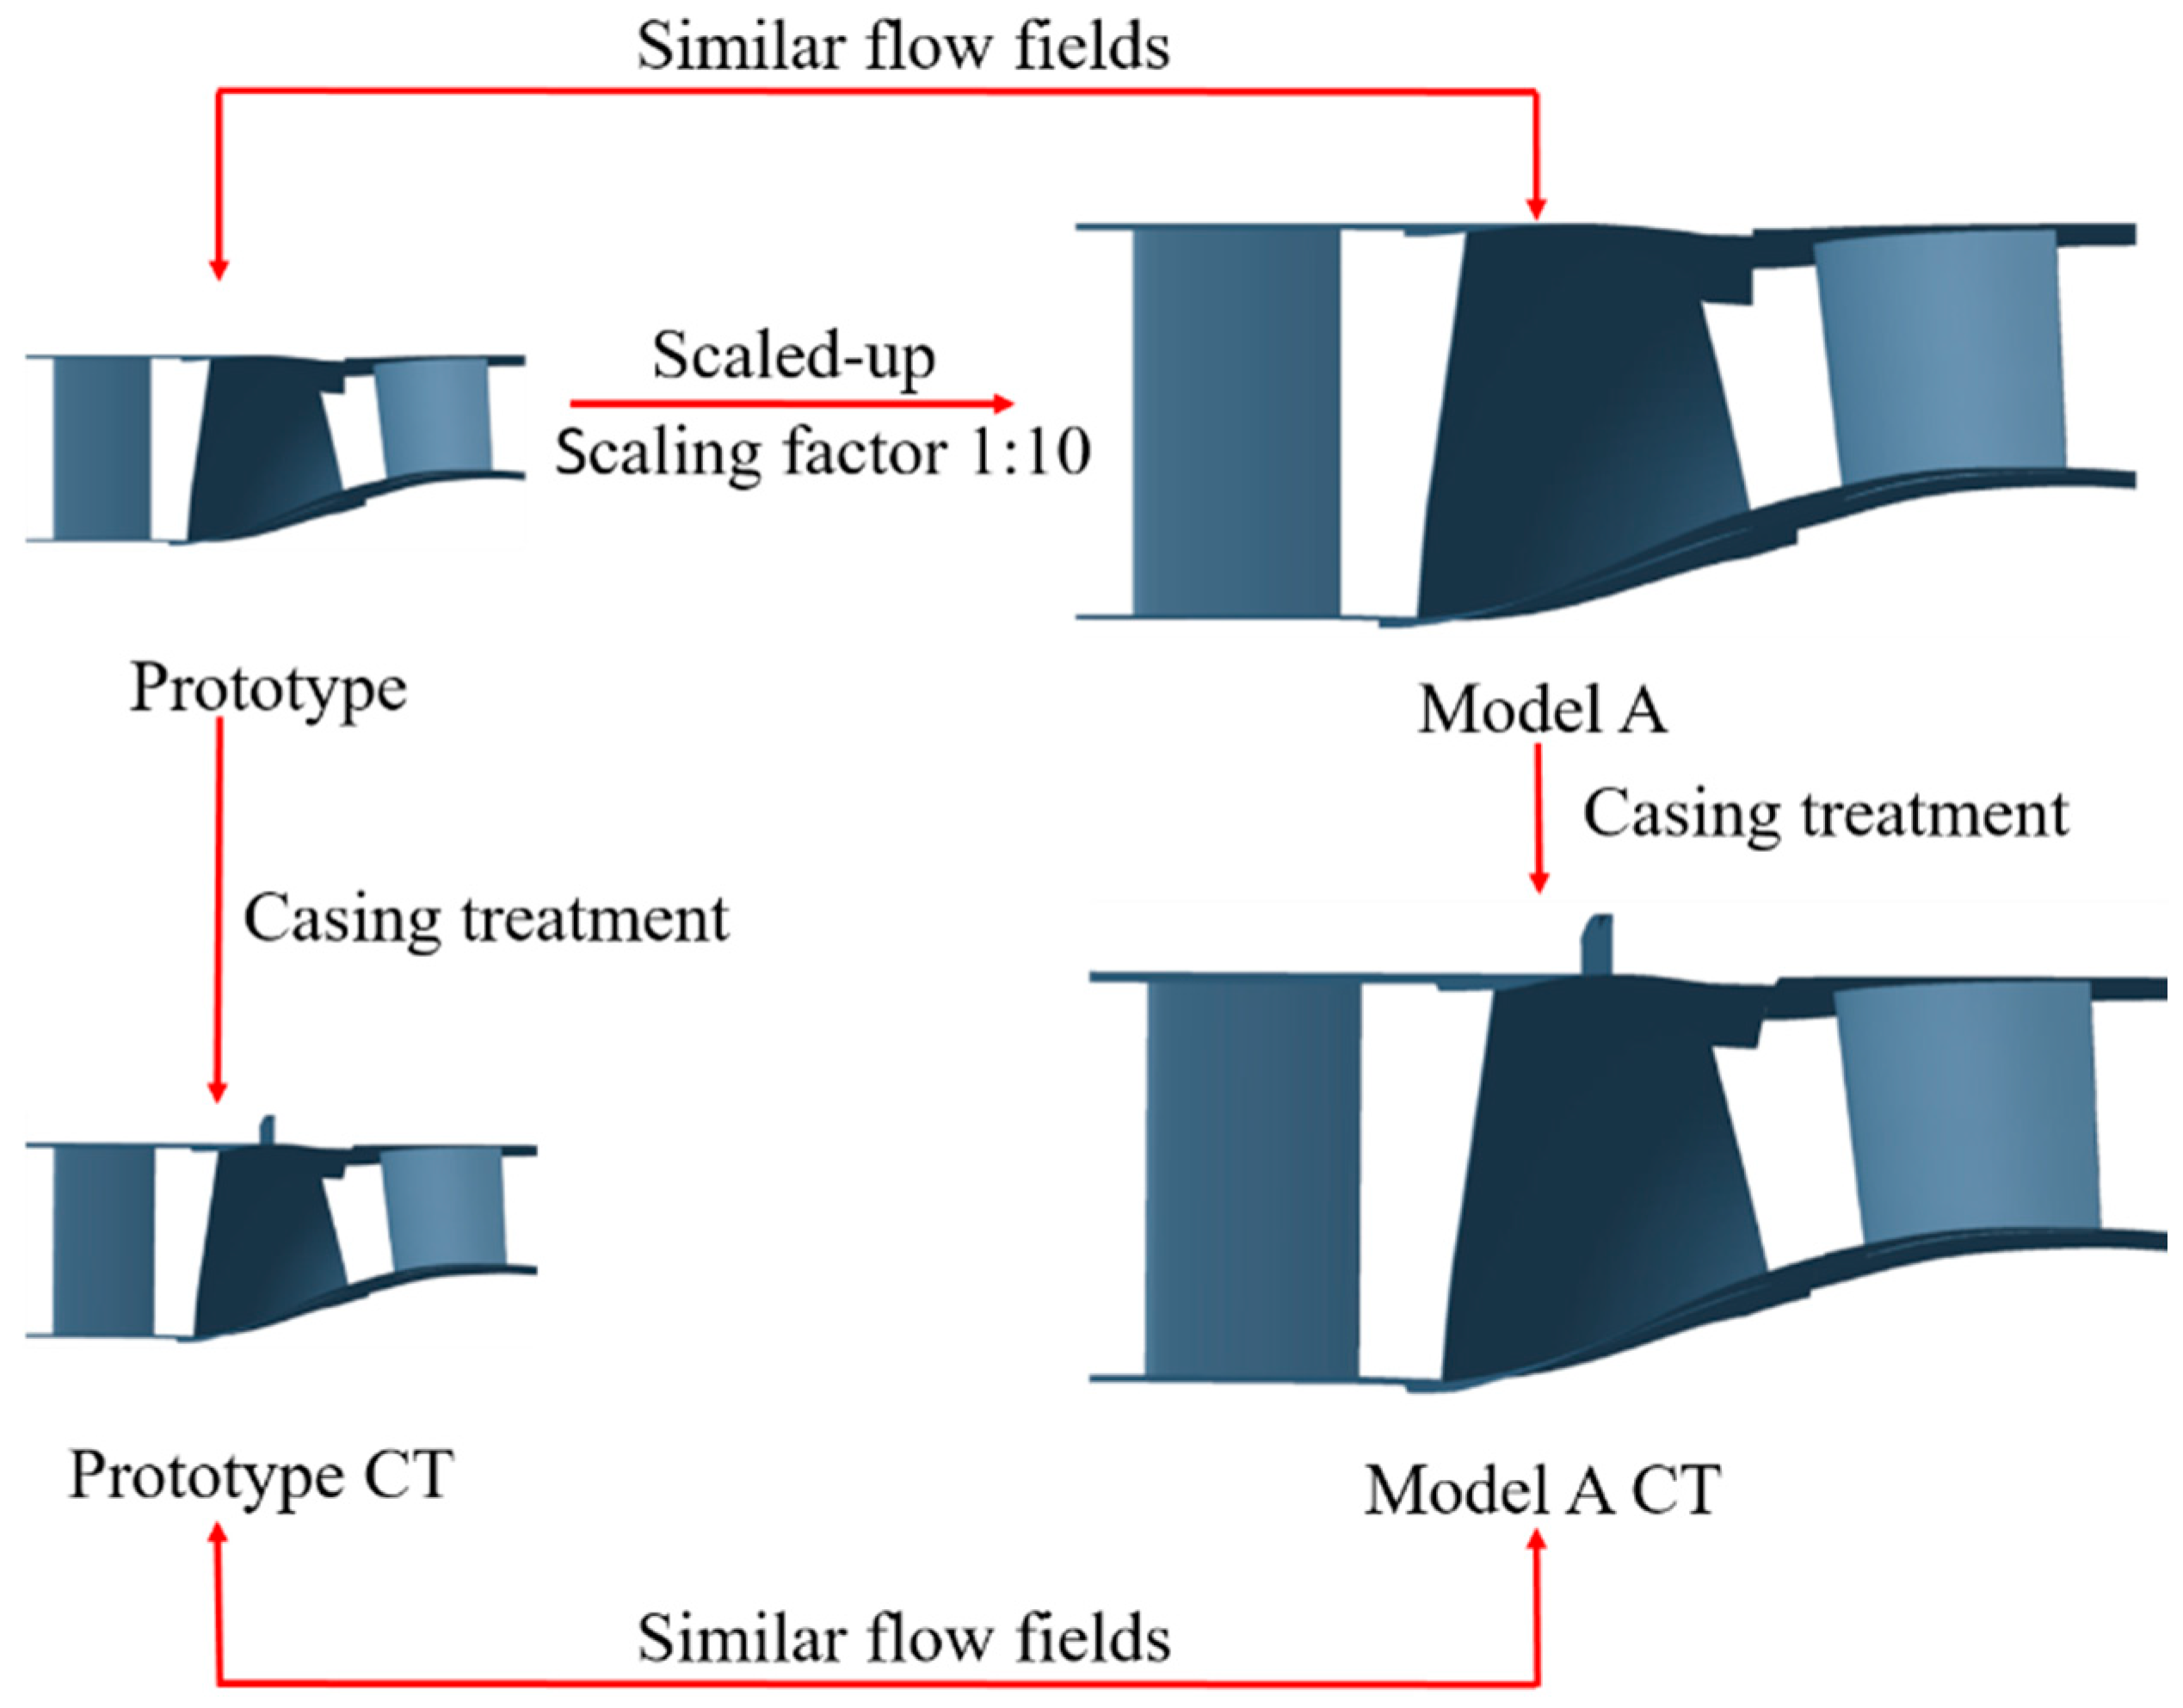
- The high-speed compressor was successfully transformed to be a low-speed, large-scale model based on the partial similarity principle, which keeps the Ma and flowrate coefficient constant and neglects the effects of Re. This principle is simple and convenient compared to the conventional low-speed model methodology based on the inverse method.
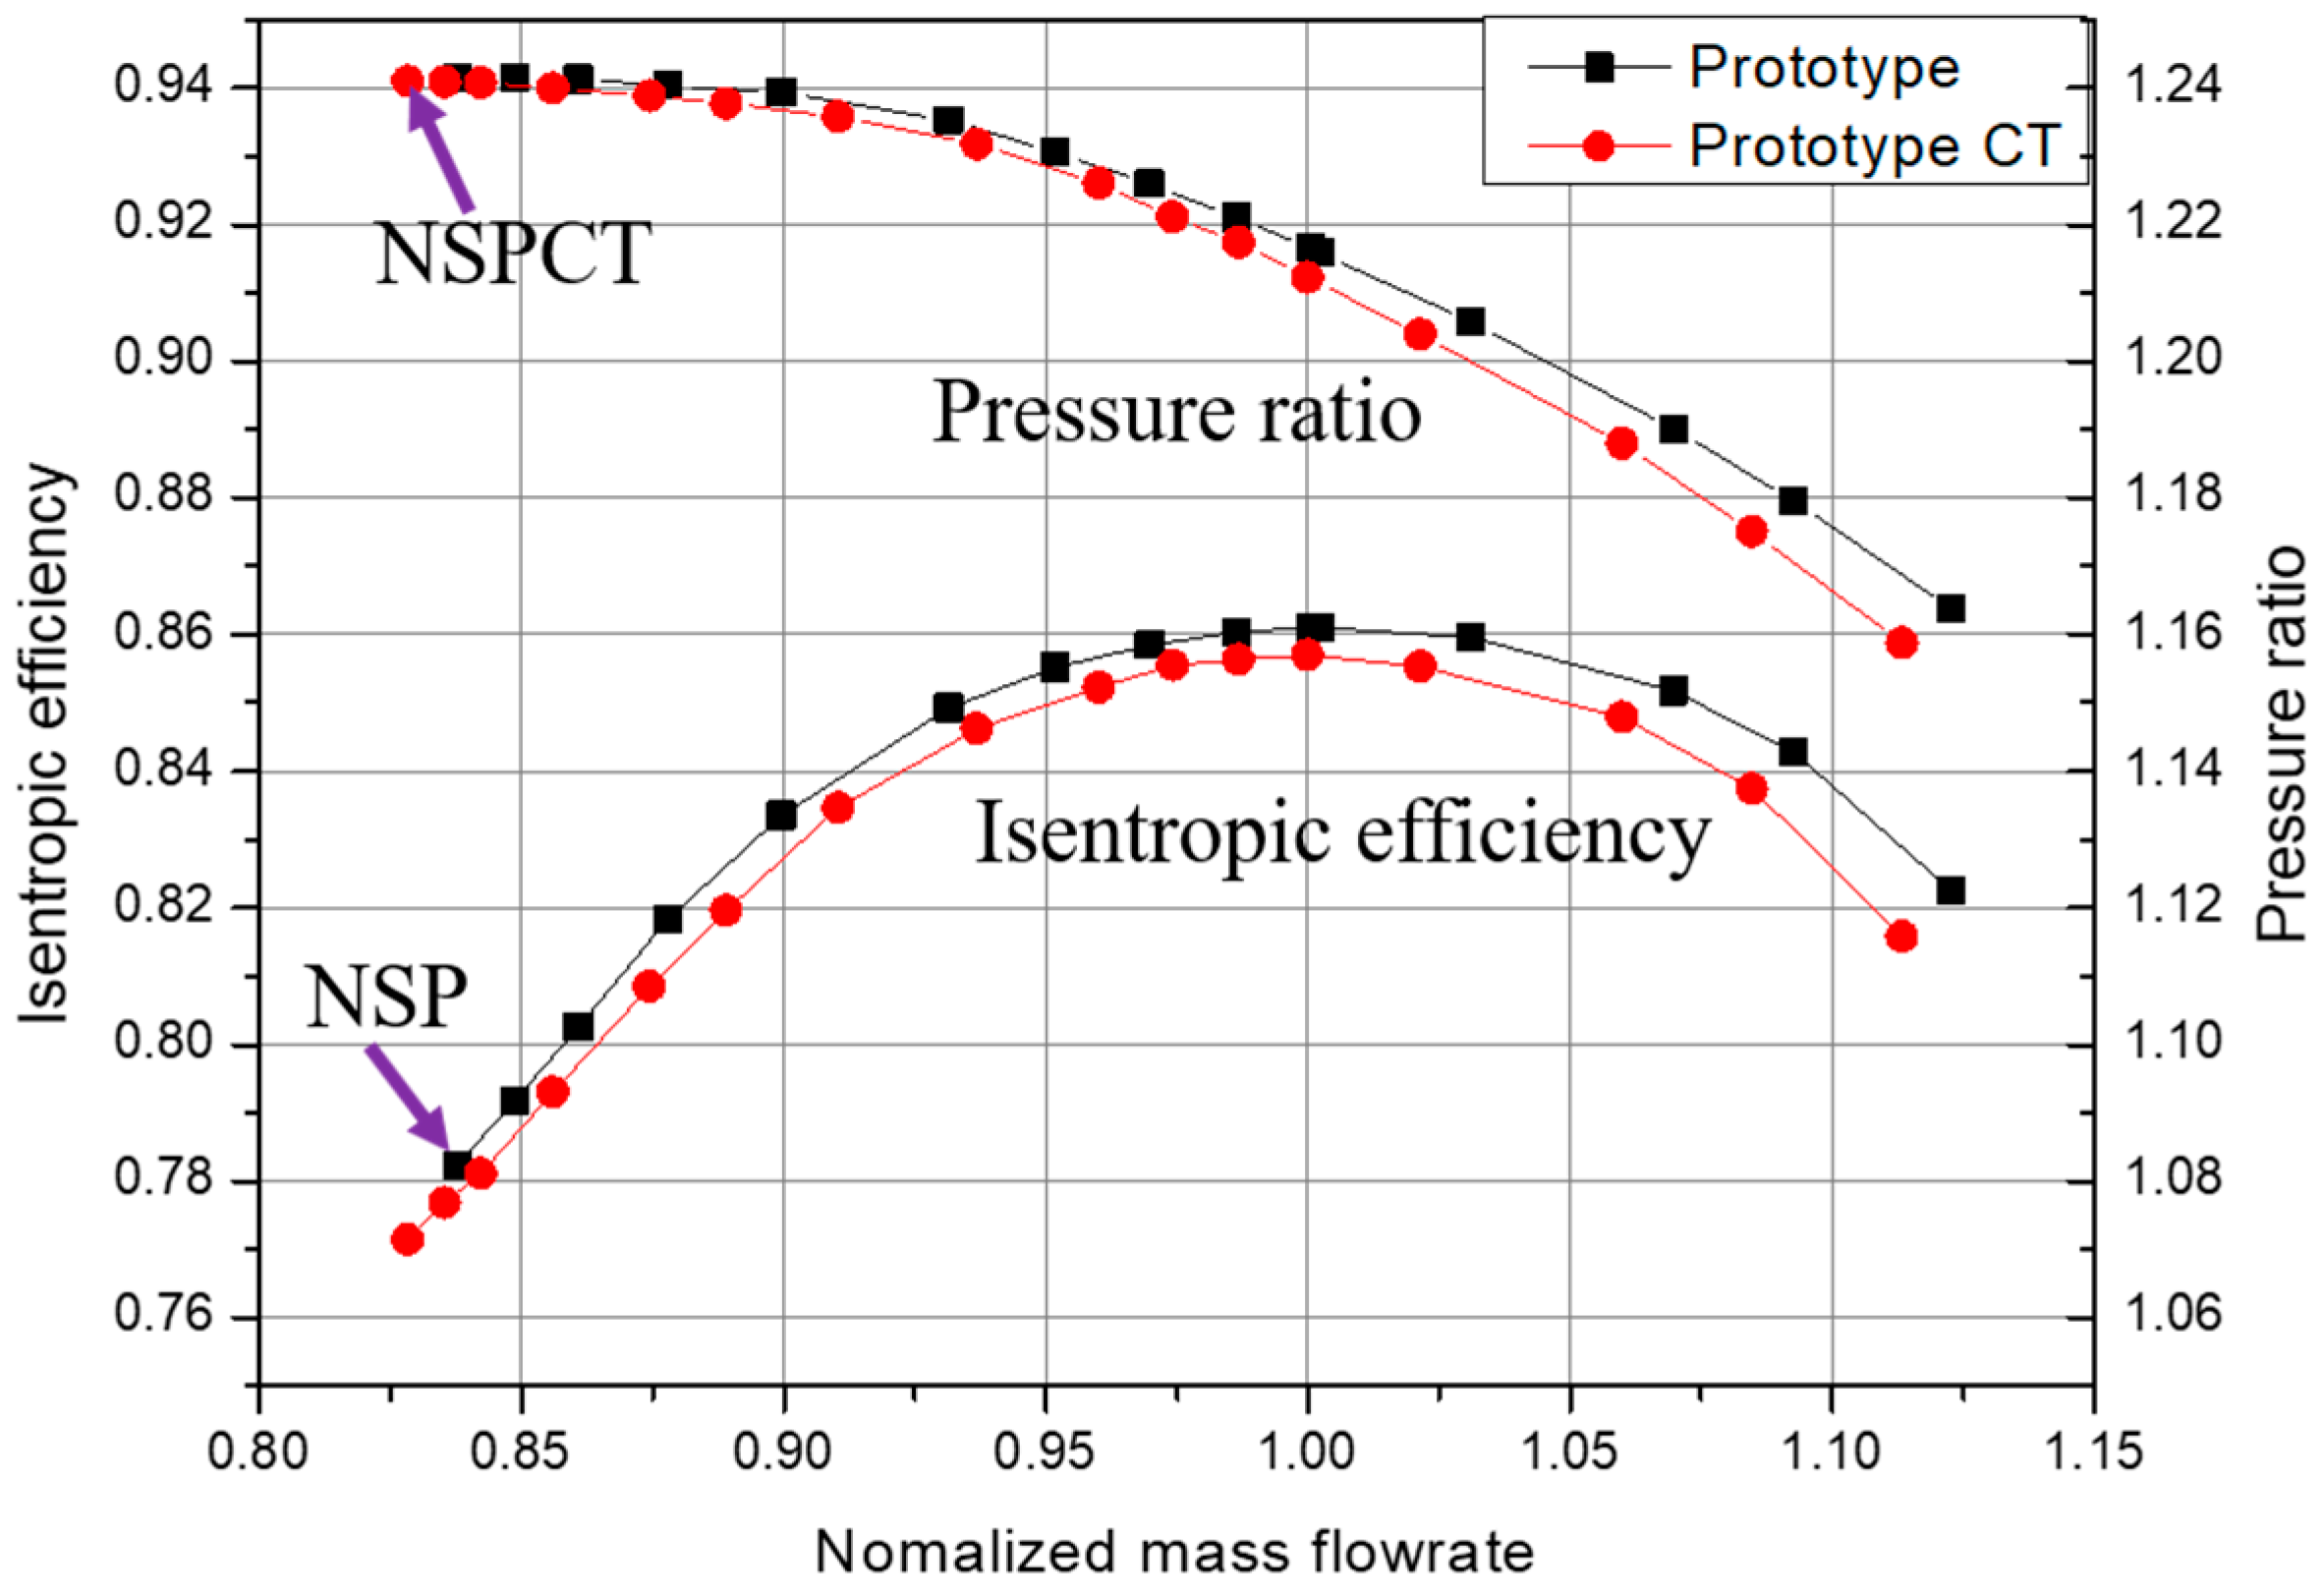
- The surface aerodynamic parameters of the rotor and stator are maintained well. The maximum deviations of isentropic efficiency and pressure between prototype and model A were 1.5% and 0.5%, respectively. The deviations were only 1.25% and 0.4% at design point. The flow fields were similar in the whole operating range. The flow similarity and the type of stall inception were retained at the near-stall point. The error of the solution limit flowrate near the stall was about 4.2%, which may have been caused by the changed Re and absolute value of geometric value. Additionally, further flow similarity, through geometric corrections to compensate for the effects of changed Re and dimensions, will be researched in next study.
- A single circumferential groove was used as the casing treatment technology. The stability was improved with a negligible performance penalty. The reductions of the near-stall flowrate of the prototype and model were 1.1% and 1.2%, respectively. The similar flow fields and performance indicated that the flow similarity was kept when casing treatment was employed. The flow similarity was maintained not only under steady condition but unsteady condition, according to the unsteady simulation results.
Author Contributions
Funding
Conflicts of Interest
References
- Koff, B.L. Gas Turbine Technology Evolution: A Designers Perspective. J. Propuls. Power 2004, 20, 577–595. [Google Scholar] [CrossRef]
- Massardo, A.; Satta, A.; Marini, M. Axial Flow Compressor Design Optimization: Part II—Throughflow Analysis. ASME. J. Turbomach. 1990, 112, 405. [Google Scholar] [CrossRef]
- Wisler, D.C. Loss Reduction in Axial-Flow Compressor Through Low-Speed Model Testing. ASME. J. Eng. Power 1985, 107, 90. [Google Scholar] [CrossRef]
- Wisler, D.C. Core Compressor Exit Stage Study; NASA CR No. 135391; NASA Lewis Research Center: Cleveland, OH, USA, 1977; Volume 1.
- Wisler, D.C. Improving Compressor and Turbine Performance through Cost-Effective Low-Speed Testing. In Proceedings of the ISABE 14th International Symposium on Air-Breathing Engines, Florence, Italy, 5–10 September 1999. ISABE 99-7073. [Google Scholar]
- Robinson, C.J. Endwall Flows and Blading Design for Axial Flow Compressors. Ph.D. Thesis, Cranfield University, Cranfield, UK, 1991. [Google Scholar]
- Lyes, P.A. Low Speed Axial Compressor Design and Evaluation; High Speed Representation and Endwall Flow Control Studies. Ph.D. Thesis, Cranfield University, Cranfield, UK, 1999. [Google Scholar]
- Gallimore, S.J.; Bolger, J.J.; Cumpsty, N.A.; Taylor, M.J.; Wright, P.I.; Place, J.M. The Use of Sweep and Dihedral in Multistage Axial Flow Compressor Blading—Part I: University Research and Methods Development. ASME J. Turbomach. 2002, 124, 521–532. [Google Scholar] [CrossRef]
- Gallimore, S.J.; Bolger, J.J.; Cumpsty, N.A.; Taylor, M.J.; Wright, P.I.; Place, J.M. The Use of Sweep and Dihedral in Multistage Axial Flow Compressor Blading—Part II: Low and high-speed designs and test verification. ASME J. Turbomach. 2002, 124, 533–541. [Google Scholar] [CrossRef]
- Boos, P.; Mockel, H.; Henne, J.M.; Seimeler, R. Flow Measurement in a Multistage Large Scale Low Speed Axial Flow Research Compressor. In Proceedings of the ASME, Turbo Expo: Power for Land, Sea, and Air, Stockholm, Sweden, 2–5 June 1998; ASME Paper No. 98-GT-432. p. V001T01A104. [Google Scholar] [CrossRef] [Green Version]
- Lange, M.; Vogeler, M.K.; Mailach, R.; Elorza-Gomez, S. An experimental Verification of a New Design for Cantilevered Stators with Large Hub Clearance. ASME J. Turbomach. 2013, 135, 041022. [Google Scholar] [CrossRef]
- Zhang, C.K.; Hu, J.; Wang, Z.Q.; Yin, C.; Yan, W. Numerical Study on Three-Dimensional Optimization of a Low-Speed Axial Compressor Rotor. In Proceedings of the ASME, Turbo Expo: Power for Land, Sea, and Air, Dusseldorf, Germany, 16–20 June 2014; ASME Paper No. GT2014-26431. p. V02BT45A016. [Google Scholar] [CrossRef]
- Zhang, C.K.; Hu, J.; Wang, Z.Q.; Li, J. Experimental Investigations on Three-Dimensional Blading Optimization for Low-Speed Model Testing. ASME J. Gas. Turbines Power 2016, 138, GTP–15–1570. [Google Scholar] [CrossRef]
- Zhang, C.K.; Hu, J.; Wang, Z.Q.; Gao, X. Design Work of a Compressor Stage Through High-To-Low Speed Compressor Transformation. ASME J. Gas. Turbines Power 2014, 136, 064501. [Google Scholar] [CrossRef]
- Ma, Y.; Xi, G. Effects of Reynolds Number and Heat Transfer on Scaling of a Centrifugal Compressor Impeller. In Proceedings of the ASME, Turbo Expo: Power for Land, Sea, and Air, Glasgow, UK, 14–18 June 2010; ASME Paper No. GT2010-23372. pp. 565–572. [Google Scholar] [CrossRef]
- Zhu, C.; Qin, G. Performance Prediction of Centrifugal Compressor Based on Performance Test, Similarity Conversion and CFD Simulation. Int. J. Fluid Mach. Syst. 2012, 5, 38–48. [Google Scholar] [CrossRef]
- Florian, F.; Peter, J.; Hoiger, F. On the Scaling of Aeroelastic parameters for High Pressure Applications in Centrifugal Compressors. In Proceedings of the ASME, Turbo Expo: Power for Land, Sea, and Air, Seoul, Korea, 13–17 June 2016; ASME Paper No. GT2016-57409. p. V07BT34A019. [Google Scholar] [CrossRef]
- Asad, M.S.; William, K.; George, W.K., Jr. Reconsideration of the Fan Scaling Laws: Part I—Theory. In Proceedings of the ASME/JSME 2003 4th Joint Fluids Summer Engineering Conference, Honolulu, HI, USA, 6–10 July 2003; ASME Paper No. FEDSM2003-45414. pp. 1307–1315. [Google Scholar] [CrossRef]
- Asad, M.S.; William, K.; George, W.K., Jr. Reconsideration of the Fan Scaling Laws: Part II—Applications. In Proceedings of the ASME/JSME 2003 4th Joint Fluids Summer Engineering Conference, Honolulu, HI, USA, 6–10 July 2003; ASME Paper No. FEDSM2003-45418. pp. 1329–1336. [Google Scholar] [CrossRef]
- Zhu, N.G.; Xu, L.; Chen, M.Z. Similarity transformation for compressor blading. ASME J. Turbomach. 1991, 114, 561–568. [Google Scholar] [CrossRef]
- Xie, H.; Yang, B.; Zhang, S.; Song, M. Performance Analysis and Improvement of a Centrifugal Compressor Based on Partial Similarity Principle. ASME J. Eng. Gas. Turbines Power 2020, 142, 05012. [Google Scholar] [CrossRef]
- Tan, C.S.; Day, I.; Morris, S.; Wadia, A. Spike-Type Compressor Stall Inception, Detection, and Control. Annu. Rev. Fluids Mech. 2010, 42, 275–300. [Google Scholar] [CrossRef]
- Vo, H.D.; Tan, C.S.; Greitzer, E.M. Criteria for Spike Initiated Rotaing Stall. ASME J. Turbomach. 2008, 130, 011023. [Google Scholar] [CrossRef]
- Du, J.; Gao, L.P.; Li, J.C.; Lin, F.; Chen, J.Y. Initial selection of groove location combination for multi-groove casing treatment. J. Mech. Sci. Technol. 2015, 30, 697–704. [Google Scholar] [CrossRef]
- Seitz, P.A. Casing Treatment for Axial Flow Compressors. Ph.D. Thesis, Cambridge University, Cambridge, UK, 1999. [Google Scholar]
- Wilke, I.; Kau, H.-P.A. Numerical Investigation of the Flow Mechanisms in a High Pressure Compressor Front Stage with Axial Slots. ASME J. Turbomach. 2004, 126, 339–349. [Google Scholar] [CrossRef]
- Osborn, W.M.; Lewis, G.W.; Heidelberg, L.J. Effects of Several Porous Casing Treatments on Stall Limit and Overall Performance of an Axial Compressor Rotor; NASA Report TN 6537; National Aeronautics and Space Administration: Washington, DC, USA, 1971.
- Fujita, H.; Takatta, H. A study on configurations of casing treatment for axial flow compressors. JSME Bull. 1983, 27, 1675–1681. [Google Scholar] [CrossRef] [Green Version]
- Zhao, S.F.; Lu, X.G.; Zhu, J.Q.; Zhang, H.W. Investigation for the Effects of Circumferential Grooves on the Unsteadiness of Tip Clearance Flow to Enhance Compressor Flow Instability. In Proceedings of the ASME, Turbo Expo: Power for Land, Sea, and Air, Glasgow, UK, 14–18 June 2010; ASME Paper No. GT2010–22652. pp. 269–277. [Google Scholar] [CrossRef]
- Houghton, T.; Day, I. Enhancing the Stability of Subsonic Compressors Using Grooves. ASME J. Turbomach. 2011, 133, 021007. [Google Scholar] [CrossRef]
- Du, J.; Gao, L.P.; Li, J.C.; Lin, F.; Chen, J.Y. The Impact of Casing Groove Location on Stall Margin and Tip clearance Flow in a Low-Speed Axial Compressor. ASME J. Turbomach. 2016, 138, 121007. [Google Scholar] [CrossRef]
- Bailey, E.E. Effect of Grooved Casing Treatment on the Flow Range Capability of a Single-stage Axial-slow Compressor; NASA Report TM 2459; National Aeronautics and Space Administration: Washington, DC, USA, 1972.
- Dufour, G.; Carbonneau, X.; Cazalbou, J.; Chassaing, P. Practical Use of Similarity and Scaling Laws for Centrifugal Compressor Design. In Proceedings of the ASME, Turbo Expo: Power for Land, Sea, and Air, Barcelona, Spain, 8–11 May 2006; ASME paper No. GT2006-91227. pp. 1131–1140. [Google Scholar] [CrossRef]
- Ning, F.; Xu, L. Numerical investigation of transonic compressor rotor flow using an implicit 3D flow solver with one-equation Spalart-Allmaras turbulence model. In Proceedings of the ASME, Turbo Expo: Power for Land, Sea, and Air, New Orleans, LA, USA, 4–7 June 2001; ASME paper No. 2001-GT-0.59. p. V001T03A054. [Google Scholar] [CrossRef]
- Spalart, P.R.; Allmaras, S.R. A one equation turbulence model for aerodynamic flows. In Proceedings of the 30th Aerospace Sciences Meeting and Exhibit, Reno, NV, USA, 6–9 January 1992. AIAA paper. [Google Scholar] [CrossRef]
- Numeca. Numeca FINETurbo User Guide, Version 11.1; NUMECA: Beijing, China, 2017. [Google Scholar]
- Assam, A.; Narayan Kalkote, N.; Sharma, V.; Eswaran, V. An Automatic Wall Treatment for Spalart–Allmaras Turbulence Model. ASME J. Fluids Eng. 2018, 140, 061403. [Google Scholar] [CrossRef]
- Rai, M.M. Three-Dimensional Navier-Stokes Simulations of Turbine Rotor-Stator Interaction. ASME J. Turbomach. 1987, 112, 377–384. [Google Scholar] [CrossRef]
- Song, M.R.; Yang, B.; Dong, G.M.; Liu, X.L.; Wang, J.Q.; Xie, H.; Lu, Z.H. Research on Accuracy of Flowing Field Based on Numerical Simulation for Tonal NoisePrediction in Axial Compressor. In Proceedings of the ASME, Turbo Expo: Power for Land, Sea, and Air, Oslo, Norway, 11–15 June 2018. ASME Paper No. GT2018-76382. [Google Scholar] [CrossRef]
- Yoon, Y.S.; Song, S.J.; Shin, H.W. Influence of Flow Coefficient, Stagger Angle, and Tip Clearance on Tip Vortex in Axial Compressor. ASME J. Fluids Eng. 2006, 128, 1274–1280. [Google Scholar] [CrossRef]
- Pelz, P.F.; Stonjek, S. Introduction of an universal scale-up method for the efficiency of axial and centrifugal fans. In Proceedings of the ASME Turbo Expo 2014: Turbine Conference and Exposition, Dusseldorf, Germany, 16–20 June 2014; ASME Paper No. GT2014-25403. p. V01AT10A007. [Google Scholar] [CrossRef] [Green Version]
- Koch, C.C.; Smith, L.H. Loss sources and magnitudes in axial-flow compressor. ASME J. Gas. Turbines Power 1976, 98, 411–424. [Google Scholar] [CrossRef]


| Parameters | Unit | Value (Prototype) |
|---|---|---|
| Diameter, D2 | mm | 370 |
| Hub/tip ratio | - | 0.76 |
| Blade height | mm | 56 |
| Tip clearance, | mm | 0.65 |
| Rotor blade chord length, b2 | mm | 65 |
| - | 1% | |
| Rotation speed, N | rpm | 12,000 |
| Parameters | Unit | Value (Prototype) | Value (Model A) |
|---|---|---|---|
| Inlet total pressure, P0 | kPa | 101.025 | 101.025 |
| Inlet total temperature, T0 | K | 284 | 284 |
| Design Mass flow rate, | Kg/s | 6.1 | 610 |
| Diameter, D2 | mm | 370 | 3700 |
| Tip clearance, | Mm | 0.65 | 6.5 |
| Rotor blade chord length, b2 | mm | 65 | 650 |
| - | 1% | 1% | |
| Design rotational speed, N | rpm | 12,000 | 1200 |
| Peripheral velocity of impeller, U | m/s | 232 | 232 |
| Reynolds number, Re | 1.05 × 10⁶ | 1.05 × 10⁶ | |
| Mass flow coefficient | - | 0.2446 | 0.2446 |
| Working fluid | - | Air | Air |
| Adiabatic index, | - | 1.4 | 1.4 |
© 2020 by the authors. Licensee MDPI, Basel, Switzerland. This article is an open access article distributed under the terms and conditions of the Creative Commons Attribution (CC BY) license (http://creativecommons.org/licenses/by/4.0/).
Share and Cite
Xie, H.; Song, M.; Yang, B. Research on the Application of Partial Similarity for a 1-1/2 Axial Compressor. Processes 2020, 8, 1121. https://doi.org/10.3390/pr8091121
Xie H, Song M, Yang B. Research on the Application of Partial Similarity for a 1-1/2 Axial Compressor. Processes. 2020; 8(9):1121. https://doi.org/10.3390/pr8091121
Chicago/Turabian StyleXie, Hong, Moru Song, and Bo Yang. 2020. "Research on the Application of Partial Similarity for a 1-1/2 Axial Compressor" Processes 8, no. 9: 1121. https://doi.org/10.3390/pr8091121