Article

Numerical Study on the Influence of Step Casing on Cavitating Flows and Instabilities in Inducers with Equal and Varying Pitches

1
Department of Energy and Power Engineering, State Key Laboratory of Hydroscience and Engineering Laboratory, Tsinghua University, Beijing 100084, China
2
Science and Technology on Liquid Rocket Engine Laboratory, Xi’an Aerospace Propulsion Institute, Xi’an 710100, China
3
Yantai Research Institute and Graduate School, Harbin Engineering University, Yantai 264010, China
*
Authors to whom correspondence should be addressed.
Processes 2020, 8(9), 1103; https://doi.org/10.3390/pr8091103
Submission received: 17 August 2020 / Revised: 26 August 2020 / Accepted: 1 September 2020 / Published: 4 September 2020

Abstract

:
It is known that cavitating flow characteristics and instabilities in inducers can greatly impact the safety and stability of a liquid rocket. In this paper, step casing optimization design (Model OE and Model AE) was carried out for two three-bladed inducers with an equal (Model O) and a varying pitch (Model A), respectively. The unsteady cavitation flow field and accompanied instabilities were studied via numerical simulations. Reductions of the cavity size and fluctuation were observed in cases with a step casing. A significant difference in cavity structures was seen as well. Referring to the pressure distributions on the blades and details of the flow field, the mechanism of cavitation suppression was revealed. This work provides a feasible and convenient method in engineering practice for optimizing the characteristic of the cavitating flow field and instabilities for the inducer.

1. Introduction

In hydraulic systems of liquid rocket engines, turbopumps are the main hydraulic components that convey fuel and oxidizers. Due to the demand for a maximum power/weight ratio of the main pump, cavitation may develop on the suction sides of the blades at the inlet of the main impeller [1,2], leading to performance degradation (i.e., sharp decrease in head and efficiency) and hydraulic instabilities (i.e., significant pressure fluctuations). Installing an inducer at the upstream of the main pump is a common solution to mitigate the aforementioned effects. Therefore, the inducer often operates under cavitation conditions accompanied by complex cavitation instabilities [3,4,5,6,7]. Among them, rotating cavitation (RC) is widely considered as a major cause for the premature cutoff of engines [8,9].
Great efforts including inducer impeller optimization and casing modifications were made to alleviate the influences of cavitation and its associated instabilities. Considering the manufacturing convenience and the degree of overall structural change, casing modification, especially step casing design, has been widely studied [10,11,12,13,14]. With a local clearance enlargement, it tends to be an effective and realizable way for performance improvement. Kamijo et al. [4] designed five casings with upstream/trailing edge enlargements and proposed a criterion for RC suppression in a LE-7 LOX (Liquid Oxygen) turbopump inducer. Hashimoto et al. [10] experimentally illustrated the influence of step casing with an upstream enlargement. It was observed that the onset and occurrence region of RC were modified effectively. Furthermore, Shimagaki et al. [15] described the mechanism for RC suppression with step casing (i.e., a decrement of incidence angel by a thickened backflow vortex with a wider tip clearance) by combining particle imaging velocimetry (PIV) and high-speed photography. Moreover, Fujii et al. [16] carried out experiments of 8 step casings to study the effects of geometries (depth, location, etc.). Therefore, it can be concluded that step casing with an upstream enlargement may be a possible method for RC suppression. However, concrete analysis is still needed for specific inducers.
In this paper, step casing optimization design was carried out for two three-bladed inducers with equal and varying pitch, respectively. Emphasis was exerted on the unsteady cavitation flow field and the accompanied instabilities by numerical simulations. The characteristic of the cavitation area on the blades and three-dimensional cavity structures was analyzed. The reductions of the cavity size and RC fluctuation were observed in cases with step casing. Referring to the pressure distributions on the blades and the details of the flow field, the mechanism of cavitation suppression was revealed.

2. Numerical Studies

2.1. Numerical Methods

The computational domain is shown in Figure 1, which consisted of an inlet pipe, an annulus inlet casing, an inducer impeller, and an outlet pipe. An annulus casing with deflectors qas placed upstream of the inducer and aimed at forming a uniform inlet flow [17]. The inlet and outlet pipes were extended for a fully developed flow simulation (5 times the diameter of the annulus inlet casing and 7 times the diameter of the inducer blade tip, respectively).
Reynolds averaged Navier–Stokes (RANS) equations were solved in ANSYS CFX 19.2 code. A SST (Shear Stress Transfer) kω turbulence model [18] and Zwart-Gerber-Belamri (ZGB) cavitation model [19] were utilized for turbulence and cavitation modeling with the boundary conditions of mass flow rate and pressure at the inlet and outlet, respectively.
The entire mesh system was developed in a commercial software package ICEM-CFD (Integrated Computer Engineering and Manufacturing code for Computational Fluid Dynamics). Unstructured hybrid grids were utilized for the annulus inlet casing and inducer. As for the inlet and outlet pipes, hexahedral grids were developed. A 10-layer boundary layer grid was utilized with a height of 0.01 mm at the first layer. More than 20 layers of mesh were set on the tip to accurately capture the clearance flow characteristic.
Unsteady simulations were applied to evaluate the characteristics of cavitation instabilities. The grid and time independence studies were carried out to find the best compromise between accuracy and efficiency. The mesh system with 2.1 × 10⁷ elements (Figure 2 shows the mesh of the inducer) and the time step corresponding to 2° of the inducer impeller rotations were chosen for the following simulations. The verification of the above numerical setup can be referred to in our previous research [20].

2.2. The Inducers and Step Casing Design

Two inducers with an equal (Model O) and varying pitch (Model A) were selected to compare the influence of step casing design (Model O and Model OE, Model A and Model AE). Table 1 and Table 2 summarize the geometries of the studied inducers. For the equal pitch inducer, the blade profile was a straight line (shown on the left of Figure 3) leading to an equal inlet and outlet blade angle. As for the varying pitch inducer, the inlet and outlet blade angle was reduced and increased, respectively. Therefore, the blade profile of the varying pitch inducer on the right side of Figure 3 was curved. It should be pointed out that both the inlet and outlet blade angles of the two inducers were different and thus results between the equal and varying pitch were not comparable. The study in this paper mainly focused on the influence of step casing on the equal and varying pitch inducers, respectively, and the cross-comparison was not involved.
Figure 4 shows the schematics of the two casings used in this study. Figure 4a terms a step casing, with enlargement near the leading edge of the inducer. While the other (shown in Figure 4b) is a straight one, owning a constant diameter from the inlet to the outlet.

3. Results

3.1. Characteristics of Cavity Oscillation on the Blades

The oscillation of the cavity on the blades was monitored to understand cavitating instabilities. Figure 5 shows the variation of a nondimensional cavity area Scav over time on three blades of Model O. Tthe ratio of the cavity area on the blade to the area of the inlet, =Scav/Sf; from the perspective of cavitation suppression, was expected to be as small as possible. It can be seen that the cavity variation on each blade was similar. They changed in an approximate sinusoidal pattern with a frequency of 152 Hz (~f0) and a certain phase difference between neighboring blades. It can be inferred that there was rotating cavitation in the studied inducer. Such asymmetric distribution of cavities might influence the operation’s safety and stability.
Taking the result of a certain blade as an example, the impact of the step casing design on the cavity oscillation is discussed below. Figure 6 and Figure 7 show the comparison of cavity oscillation in Model O and OE (cases with the equal pitch inducer), as well as Model A and AE (cases with the varying pitch inducer). The influence of step casing tended to be similar both in equal and varying pitch inducers. Significant reduction of cavities was seen when step casing was applied, showing that the step casing design had a positive effect on cavitation suppression both in equal pitch and varying pitch inducers.

3.2. Characteristics of Three-Dimensional Cavity Structures

3.2.1. The Results of Cases with the Equal Pitch Inducer

Three-dimensional cavity structures were analyzed with the help of the isosurface of the vapor volume fraction αv = 0.3. As shown in Figure 8a,b, the cavity mainly appeared near the leading edge in both Model O and OE. The cavity structures were similar. Cavities in both Model O and OE had two subregions with different characteristics: Type I resembled the attached cavitation region and Type II resembled cloud cavitation. With the step casing, substantial suppression of the cavity in both streamwise and axial directions was figured out. Next, we show details regarding the cavity on three typical sections along the streamwise direction within 1 revolution, thus demonstrating the varying features of cavity structure over time.
As shown in Figure 9a, the first section (S1) was in the middle of Type I. θ 1 = θ 0 + 1 2 Δ θ I , θ 0 indicates the inception position of Type I; Δ θ I indicates the region Type I occupies streamwise, indicating the characteristic of Type I cavitation. Figure 9b,c show the variation of cavities within 1 revolution (T) at S1 for Model O and OE. Here, PS stands for the pressure side, whereas SS denotes the suction side. Furthermore, r’ indicates the ratio of radial position and tip radius (=r/rT), while Z’ indicates the ratio of axial position and the axial length of the blade (=Z/LB). With a weak radial fluctuation and almost no axial fluctuation, the variation pattern of Type I in each case tends to be similar. We found the cavity area as O ≈ OE. θ 1 O E > θ 1 O indicated that the application of step casing may result in downstream cavitation inception.
The section at the end of the sweep was chosen as S2, thus finding that θ 2 O = θ 2 O E = 110 . For Model O and OE, S2 located the region of Type II with significant radial and axial variations (Figure 10a). Obvious morphological differences of cavities were observed. Cavities in Model O (Figure 10b) developed in a much wider range along the radial and axial direction and were limited by the casing. However, in Model OE (Figure 10c), with a local increment of clearance, the cavities were far away from the casing and presented a semi-elliptic shape.
The section of average cavitation oscillation along streamwise was taken as S3 (Figure 11a), which led to the lack of results. In Model O and OE (Figure 11b,c), the radial and axial fluctuations of the cavities were captured, and there was little difference in morphology as the blade was away from the step in Model OE.
Table 3 summarizes the detailed characteristics of the cavity of cases with an equal pitch inducer along the streamwise, radial, and axial directions. It can be seen that the cavities in Model O and OE consisted of two regimes—Type I and II—and there were slight differences in the inception location and occupied range along the streamwise direction. However, there was an increase in the maximum range along the radial direction while the maximum range along the axial direction decreased.

3.2.2. The Results of Cases with the Varying Pitch Inducer

Three-dimensional cavity structures for the varying pitch inducer are shown in Figure 12a,b. Unlike the equal pitch inducer, a significant difference in cavity structures were seen in the varying pitch inducer when the step casing was applied. Cavities in Model A owned two subregions. In Model AE, only clearance cavitation was observed and nearly no leakage cavitation occurred in other cases. Thus, there was only the Type I cavity.
Cavity details varying pitch cases were analyzed. Figure 13b,c shows the characteristics at S1 (Figure 13a). For Model A, the midsection of Type I ( θ 1 = θ 0 + 1 2 Δ θ I ) was taken. As for AE, θ 1 A E = θ 0 A E + 1 2 Δ θ I A . A weak radial fluctuation and almost no axial fluctuation of cavity variation was observed in both cases. In terms of the cavity area, we found that A ≈ AE. θ 1 A E > θ 1 A indicates that the application of step casing could result in downstream cavitation inception.
The results at S2 (Figure 14a, θ 2 A = θ 2 A E = 110 ) are shown in Figure 14b,c. A striking influence of step casing was observed. In Model A, the cavity variations were similar to Model O and OE, indicating a Type II cavitation. While in Model AE, the fluctuation in the axial direction greatly reduced and tended toward Type I.
At S3 (Figure 15a), significant differences of morphology and fluctuation characteristics were observed (Figure 15b,c). Apparent radial and axial fluctuations of the cavities were captured in Model A, indicating a Type II cavitation. In Model AE, the cavities tended to be Type I
Table 4 summarizes the detailed characteristics of the cavity along the streamwise, radial, and axial directions. For varying inducer cases (Model A and AE), close inception location and total occupied range along the streamwise were observed, whereas in Model AE, the maximum range along the radial and axial direction decreased significantly. As mentioned above, cavities in Model AE mainly manifested as Type. Model A, however, owned Type I and II.

3.3. Characteristics of Blade Loading and Flow Field

To further analyze the influence of the step casing on the flow field, Figure 16 and Figure 17 show the blade loading Cp (equals to the difference between the static pressure and the inlet pressure at each position divided by the dynamic pressure) along the streamwise direction at a 95% span on certain blades. The distribution on the other two blades was similar. In both the equal and varying pitch inducers, with a local increment in the clearance in the vicinity of the leading edge (LE), the impact of the step casing was shown near the leading edge (0~0.25). The reduction of the maximum pressure and pressure difference between SS and PS was observed. In the subsequent area (>0.25, till the trailing edge (TE)), the step casing design showed little influence on blade loading.
Table 5 and Table 6 demonstrate the characteristics of the clearance flow at S2. With the reduction of Δp (pressure difference between SS and PS) and the increment of local tip clearance when step casing was applied, the average velocity at the clearance significantly reduced, while the leakage flow rate increased (145% in Model OE and 56% in Model AE).
Furthermore, the distribution of the vapor volume fraction αv and velocity vectors are shown in Figure 18 and Figure 19 (Figure 18a for Model O, Figure 18b for Model OE. And Figure 19a for Model A, Figure 19b for Model AE). Clearance flow in cases without step casing (Model O and Model A) tended to penetrate upstream and interact with the main flow, leading to a more apparent axial extension of cavities. As for Model OE and AE, with lower velocity and higher leakage flow rates, the clearance flow tended to interact with the main flow in a closer region.

4. Conclusions

To evaluate the influences of step casing design on cavitating flows and instabilities in inducers with equal and varying pitches, a numerical simulation was employed in four cases. We analyzed cavitation area characteristics on blades and three-dimensional cavity structures. The step casing design showed a positive effect on cavitation suppression in both equal and varying inducers with a significant reduction of cavity size and fluctuation. Its impact on cavity structures, however, was quite different. In Models O and OE (cases with the equal pitch inducer), there were two regimes: Type I (resembled attached cavitation) and Type II (resembled cloud cavitation). While in cases with the varying pitch inducer, a significant difference was observed. Model A owned two regimes (Type I and II), while in Model AE there was only the Type I cavity. Referring to the pressure distributions on the blades and the details of the flow field, it seemed that with the alteration of clearance flow characteristics, the cavity feature varied. Clearance flow in the straight casing tended to penetrate far more upstream, resulting in a more apparent axial extension of cavities. As for step casing, the clearance flow tended to interact with the main flow in a closer region with lower clearance velocity and higher leakage flow rate.

Author Contributions

Investigation, L.Y.; data curation, L.Y.; methodology, L.Y. and H.Z.; validation, L.Y. and H.Z.; writing—original draft preparation, L.Y.; writing—review and editing, H.C., Z.Z., and S.L.; supervision, H.C., Z.Z., and S.L.; funding acquisition, H.C., Z.Z., and S.L. All authors have read and agreed to the published version of the manuscript.
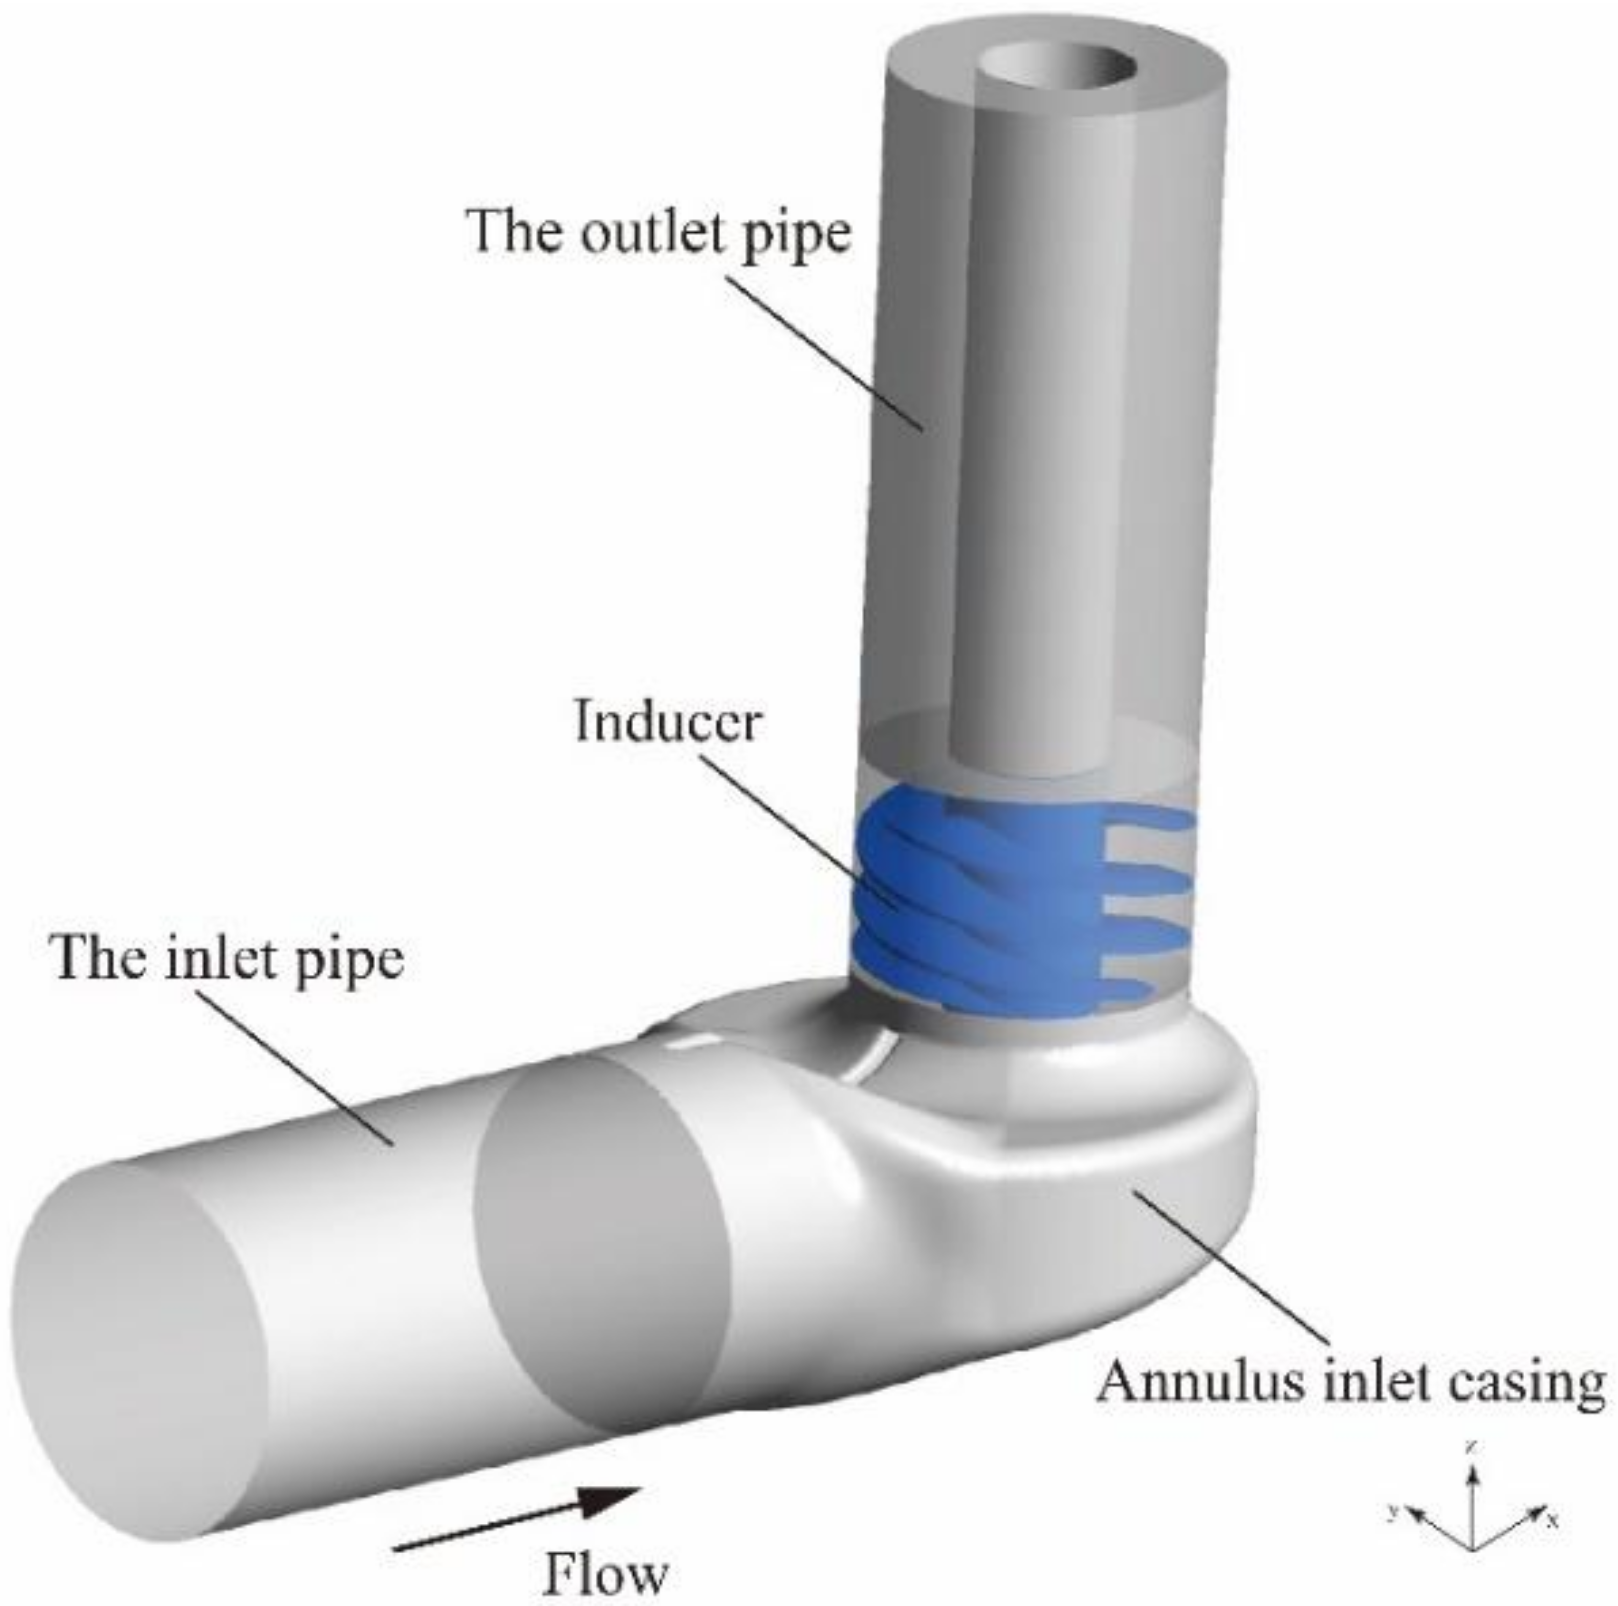
Funding

This research was funded by the National Key RD Program of China, grant No. 2018YFB0606103 and the National Basic Research Program of China (“973” Project), grant No. 613321.

Conflicts of Interest

The authors declare no conflict of interest.

References

  1. d’Agostino, L. Turbomachinery Developments and Cavitation. In Proceedings of the VKI Lecture Series on Fluid Dynamics Associated to Launcher Developments, Rhode-Saint-Genese, Belgium, 15–17 April 2013; von Karman Institute of Fluid Dynamics: Rhode-Saint-Genese, Belgium, 2013. [Google Scholar]
  2. d’Agostino, L.; Cervone, A.; Torre, L.; Pace, G.; Valentini, D.; Pasini, A. An Introduction to Flow-Induced Instabilities in Rocket Engine Inducers and Turbopumps. In Cavitation Instabilities and Rotordynamic Effects in Turbopumps and Hydroturbines: Turbopump and Inducer Cavitation, Experiments and Design; d’Agostino, L., Salvetti, M.V., Eds.; Springer International Publishing: Cham, Switzerland, 2017; pp. 65–86. [Google Scholar]
  3. Sack, L.E.; Nottage, H. System oscillations associated with cavitating inducers. J. Fluids Eng. 1965, 87, 917–924. [Google Scholar] [CrossRef]
  4. Kamijo, K.; Yoshida, M.; Tsujimoto, Y. Hydraulic and mechanical performance of LE-7 LOX pump inducer. J. Propuls. Power 1993, 9, 819–826. [Google Scholar] [CrossRef]
  5. Braisted, D.; Brennen, C. Auto-oscillation of cavitating inducers. In Proceedings of the symposium on Polyphase Flow and Transport Technology, San Francisco, CA, USA, 13–15 August 1980; American Society of Mechanical Engineers (ASME): San Francisco, CA, USA; pp. 157–166. [Google Scholar]
  6. Tsujimoto, Y. Cavitation instabilities in turbopump inducers. In Fluid Dynamics of Cavitation and Cavitating Turbopumps; d’Agostino, L., Maria Vittoria, S., Eds.; Springer: Pisa, Italy, 2007; pp. 169–190. [Google Scholar]
  7. Brennen, C.E. Hydrodynamics of Pumps; Cambridge University Press: New York, NY, USA, 2011. [Google Scholar]
  8. Ryan, R.; Gross, L.; Mills, D.; Mitchell, P. The Space Shuttle Main Engine liquid oxygen pump high-synchronous vibration issue, the problem, the resolution approach, the solution. In Proceedings of the 30th Joint Propulsion Conference and Exhibit, Indianapolis, IN, USA, 27–29 June 1994; American Institute of Aeronautics and Astronautics (AIAA): Indianapolis, IN, USA, 1994. [Google Scholar]
  9. Sekita, R.; Watanabe, A.; Hirata, K.; Imoto, T. Lessons learned from H-2 failure and enhancement of H-2A project. Acta Astronaut. 2001, 48, 431–438. [Google Scholar] [CrossRef]
  10. Hashimoto, T.; Yamada, H.; Funatsu, S.; Ishimoto, J.; Kamijo, K.; Tsujimoto, Y.; Hashimoto, T.; Yamada, H.; Funatsu, S.; Ishimoto, J.; et al. Rotating cavitation in three and four-bladed inducers. In Proceedings of the 33rd Joint Propulsion Conference and Exhibit, Seattle, WA, USA, 6–9 July 1997; American Institute of Aeronautics and Astronautics (AIAA): Reston, VA, USA, 1997. [Google Scholar]
  11. Kang, D.; Arimoto, Y.; Yonezawa, K.; Horiguchi, H.; Kawata, Y.; Hah, C.; Tsujimoto, Y. Suppression of Cavitation Instabilities in an Inducer by Circumferential Groove and Explanation of Higher Frequency Components. Int. J. Fluid Mach. Syst. 2010, 3, 137–149. [Google Scholar] [CrossRef] [Green Version]
  12. Torre, L.; Pasini, A.; Cervone, A.; Pace, G.; Miloro, P.; D’Agostino, L. Effect of Tip Clearance on the Performance of a Three-Bladed Axial Inducer. J. Propuls. Power 2011, 27, 890–898. [Google Scholar] [CrossRef]
  13. Shimiya, N.; Fujii, A.; Horiguchi, H.; Uchiumi, M.; Kurokawa, J.; Tsujimoto, Y. Suppression of Cavitation Instabilities in an Inducer by J Groove. J. Fluids Eng. 2008, 130, 021302. [Google Scholar] [CrossRef]
  14. Xu, B.; Shen, X.; Zhang, D.; Zhang, W. Experimental and Numerical Investigation on the Tip Leakage Vortex Cavitation in an Axial Flow Pump with Different Tip Clearances. Processes 2019, 7, 935. [Google Scholar] [CrossRef] [Green Version]
  15. Shimagaki, M.; Watanabe, M.; Hashimoto, T.; Hasegawa, S.; Yoshida, Y.; Nakamura, N. Effect of the casing configurations on the internal flow in rocket pump inducer. In Proceedings of the 42nd AIAA/ASME/SAE/ASEE Joint Propulsion Conference & Exhibit, Sacramento, CA, USA, 9–12 July 2006; American Institute of Aeronautics and Astronautics (AIAA): Sacramento, CA, USA, 2006. [Google Scholar]
  16. Fujii, A.; Azuma, S.; Yoshida, Y.; Tsujimoto, Y.; Uchiumi, M.; Warashina, S. Effects of Inlet Casing Geometries on Unsteady Cavitation in an Inducer. Trans. Jpn. Soc. Mech. Eng. B 2004, 16, 1450–1458. [Google Scholar]
  17. Tang, F.; Li, J.; Chen, H.; Li, X.; Xuan, T. Study on Cavitation Performance of Inducer with Annulus Inlet Casing. J. Mech. Eng. 2011, 47, 171–176. [Google Scholar] [CrossRef]
  18. Menter, F.R. Two-equation eddy-viscosity turbulence models for engineering applications. AIAA J. 1994, 32, 1598–1605. [Google Scholar] [CrossRef] [Green Version]
  19. Zwart, P.J.; Gerber, A.G.; Belamri, T. A two-phase flow model for predicting cavitation dynamics. In Proceedings of the Fifth international conference on multiphase flow, Yokohama, Japan, 30 May–3 June 2004; International Conference on Multiphase Flow (ICMF): Yokohama, Japan, 2004. [Google Scholar]
  20. Yu, L.; Zhang, H.; Chen, H.; Li, Y.; Zuo, Z.; Liu, S. Geometrical optimization of an inducer with respect to rotating cavitation generated radial forces by using an orthogonal experiment. J. Appl. Fluid Mech. 2018, 11, 1591–1598. [Google Scholar] [CrossRef]
Figure 1. Computational domain.
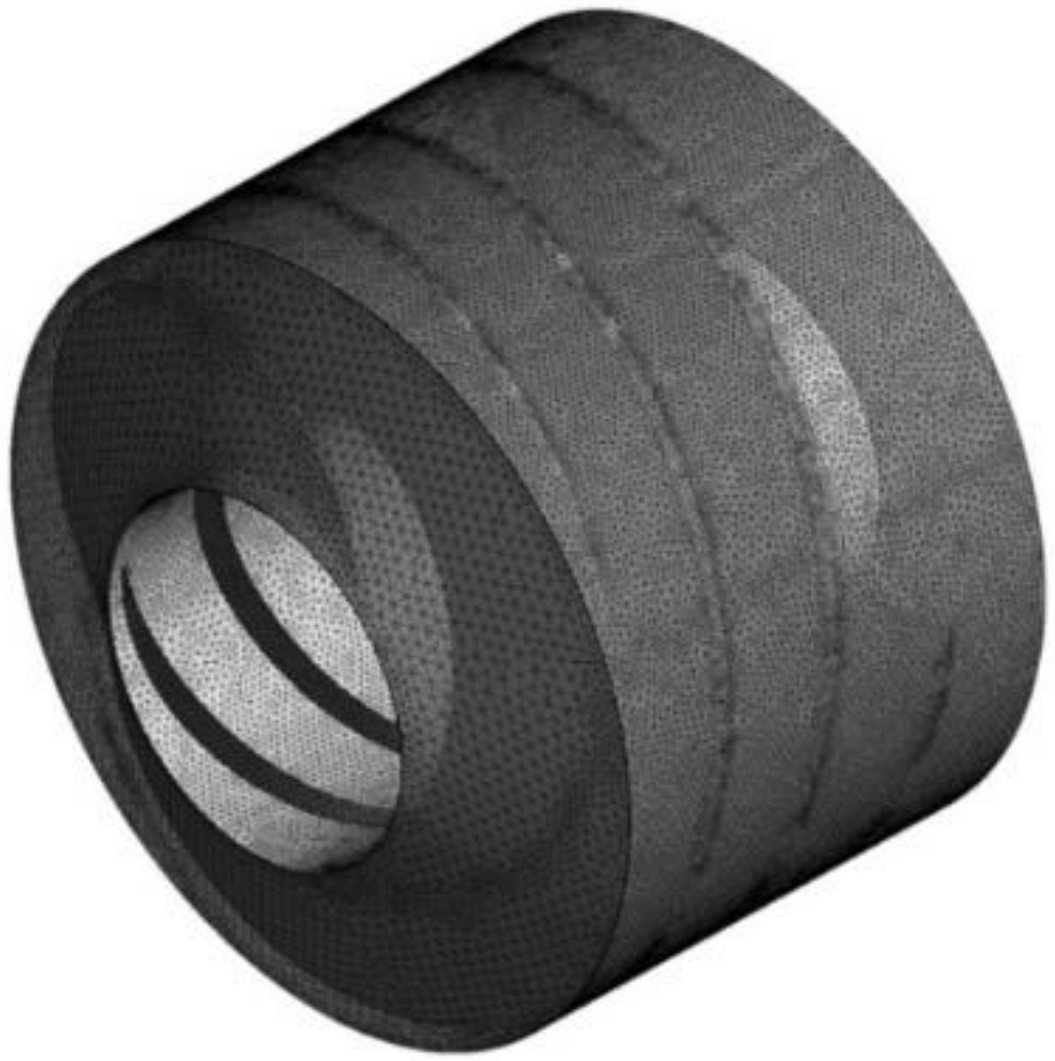
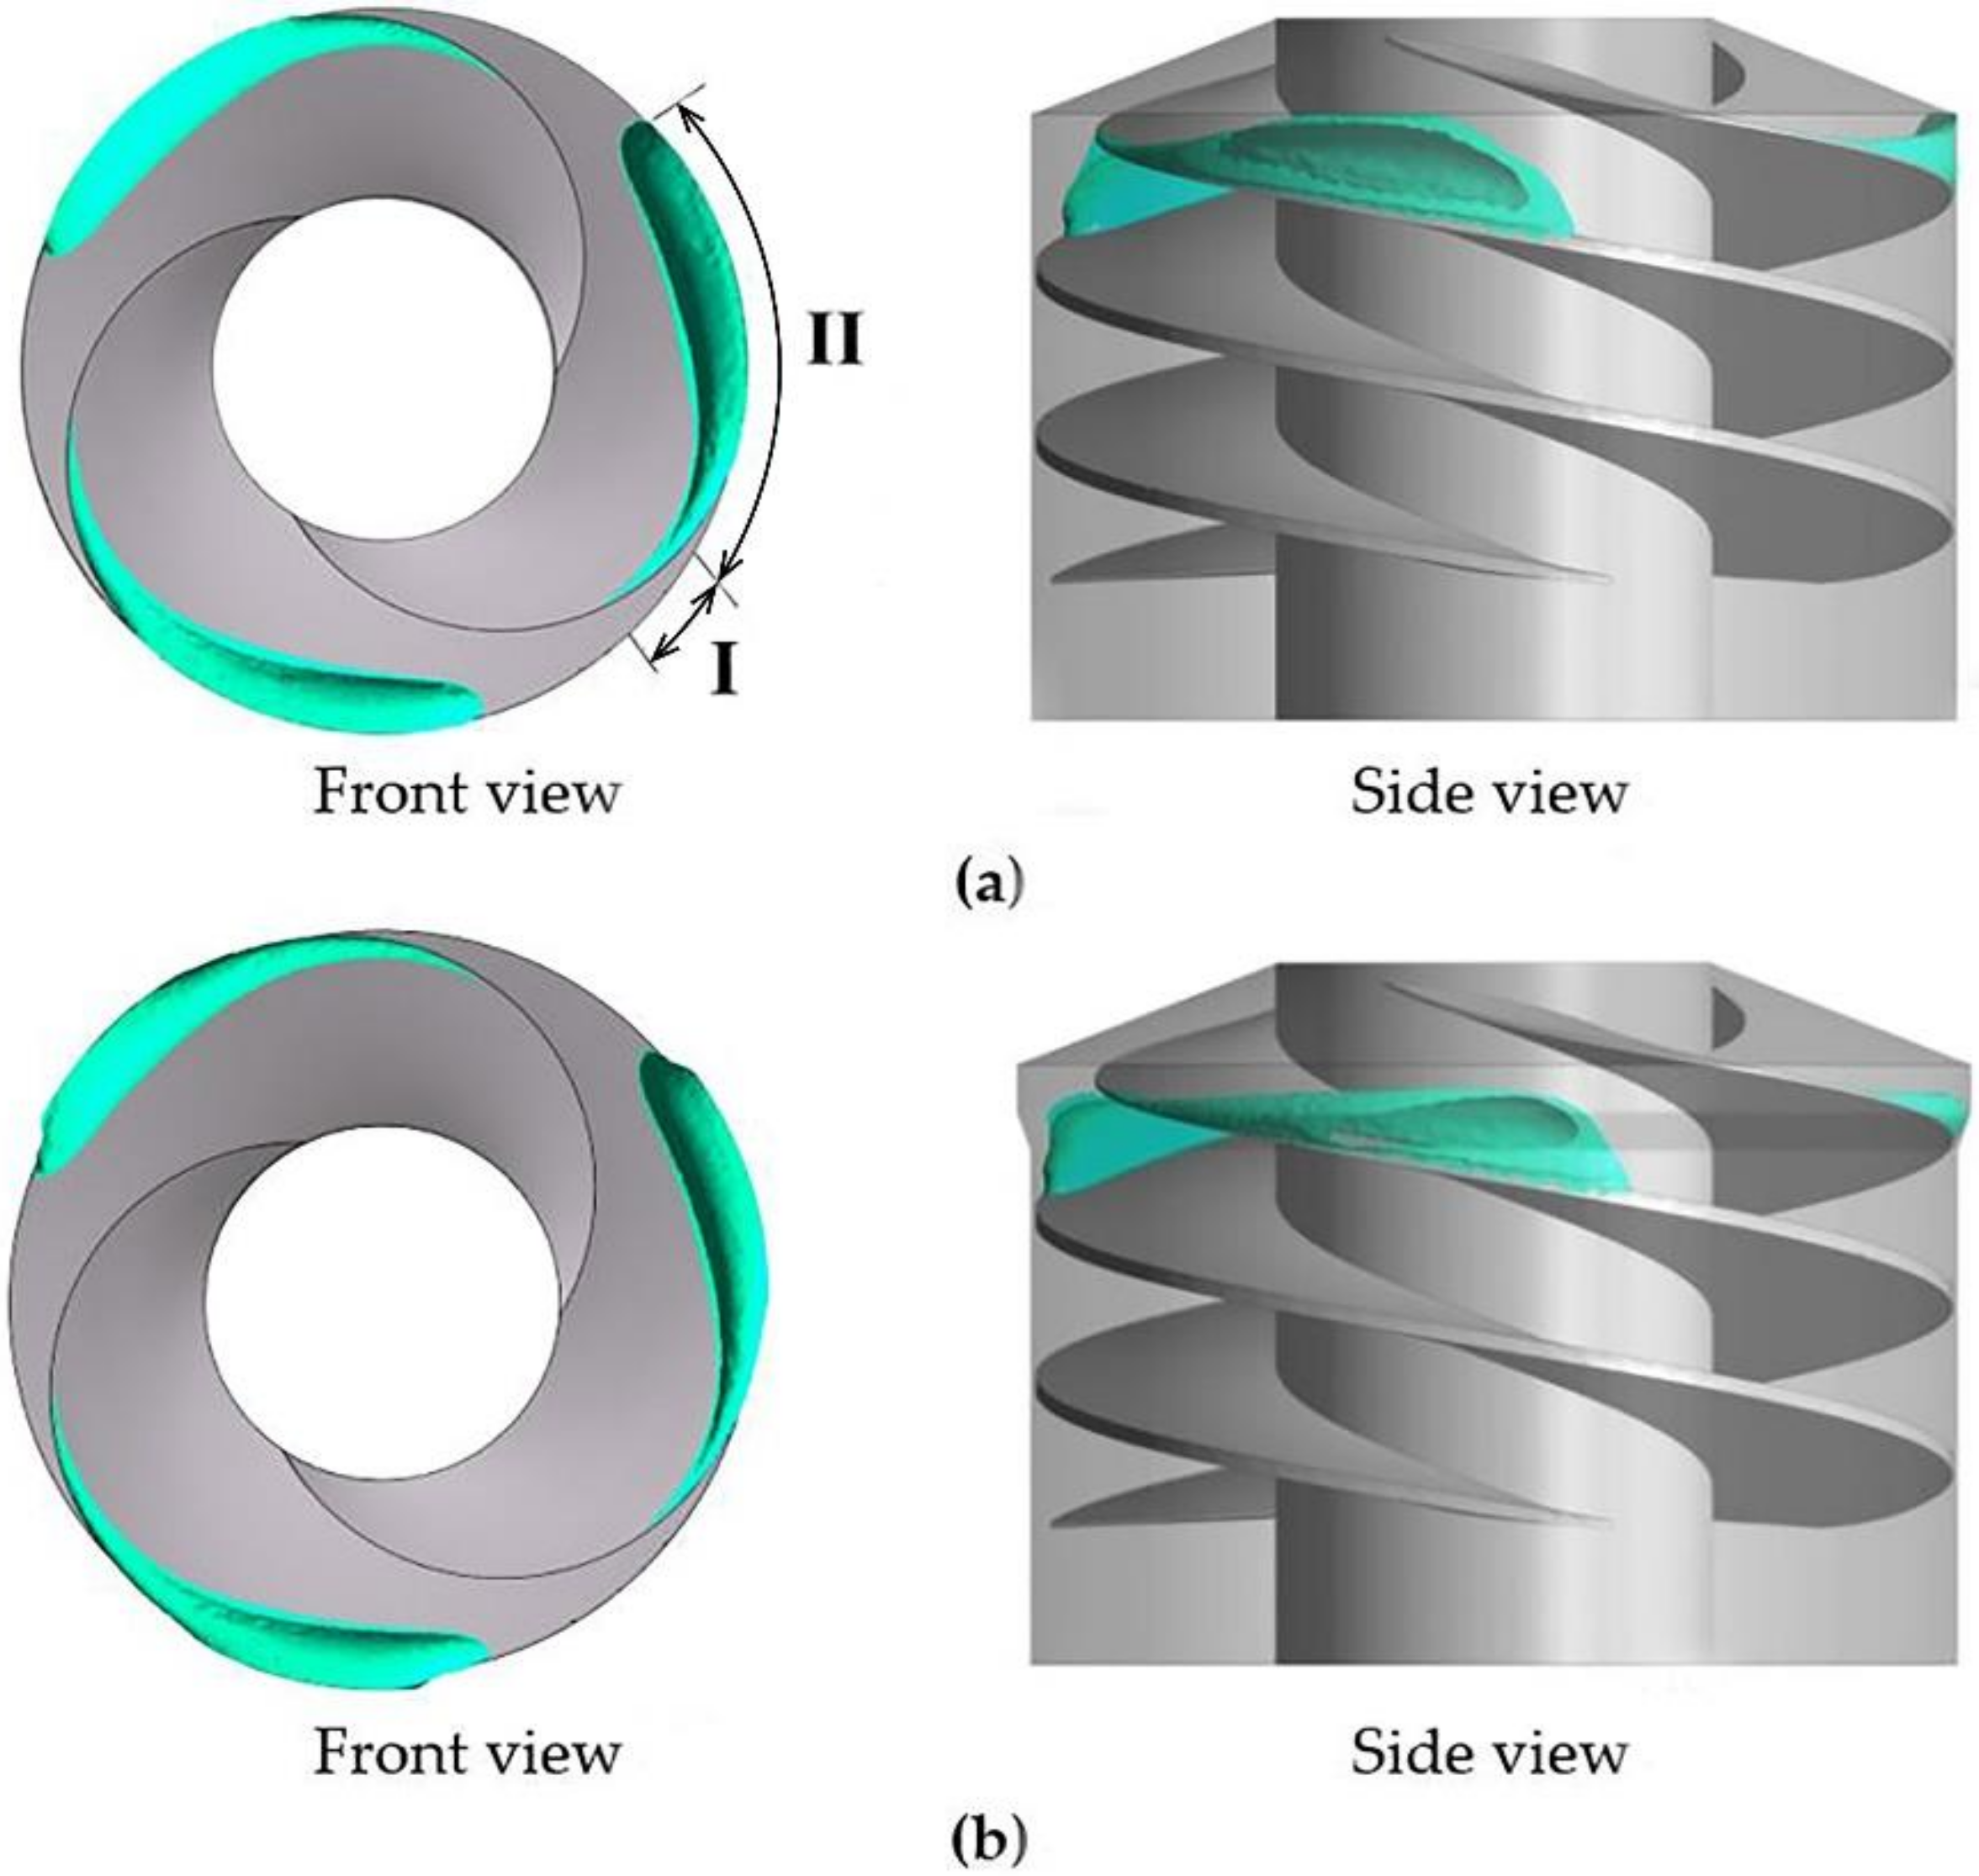
Processes 08 01103 g001
Figure 2. Mesh of the inducer.
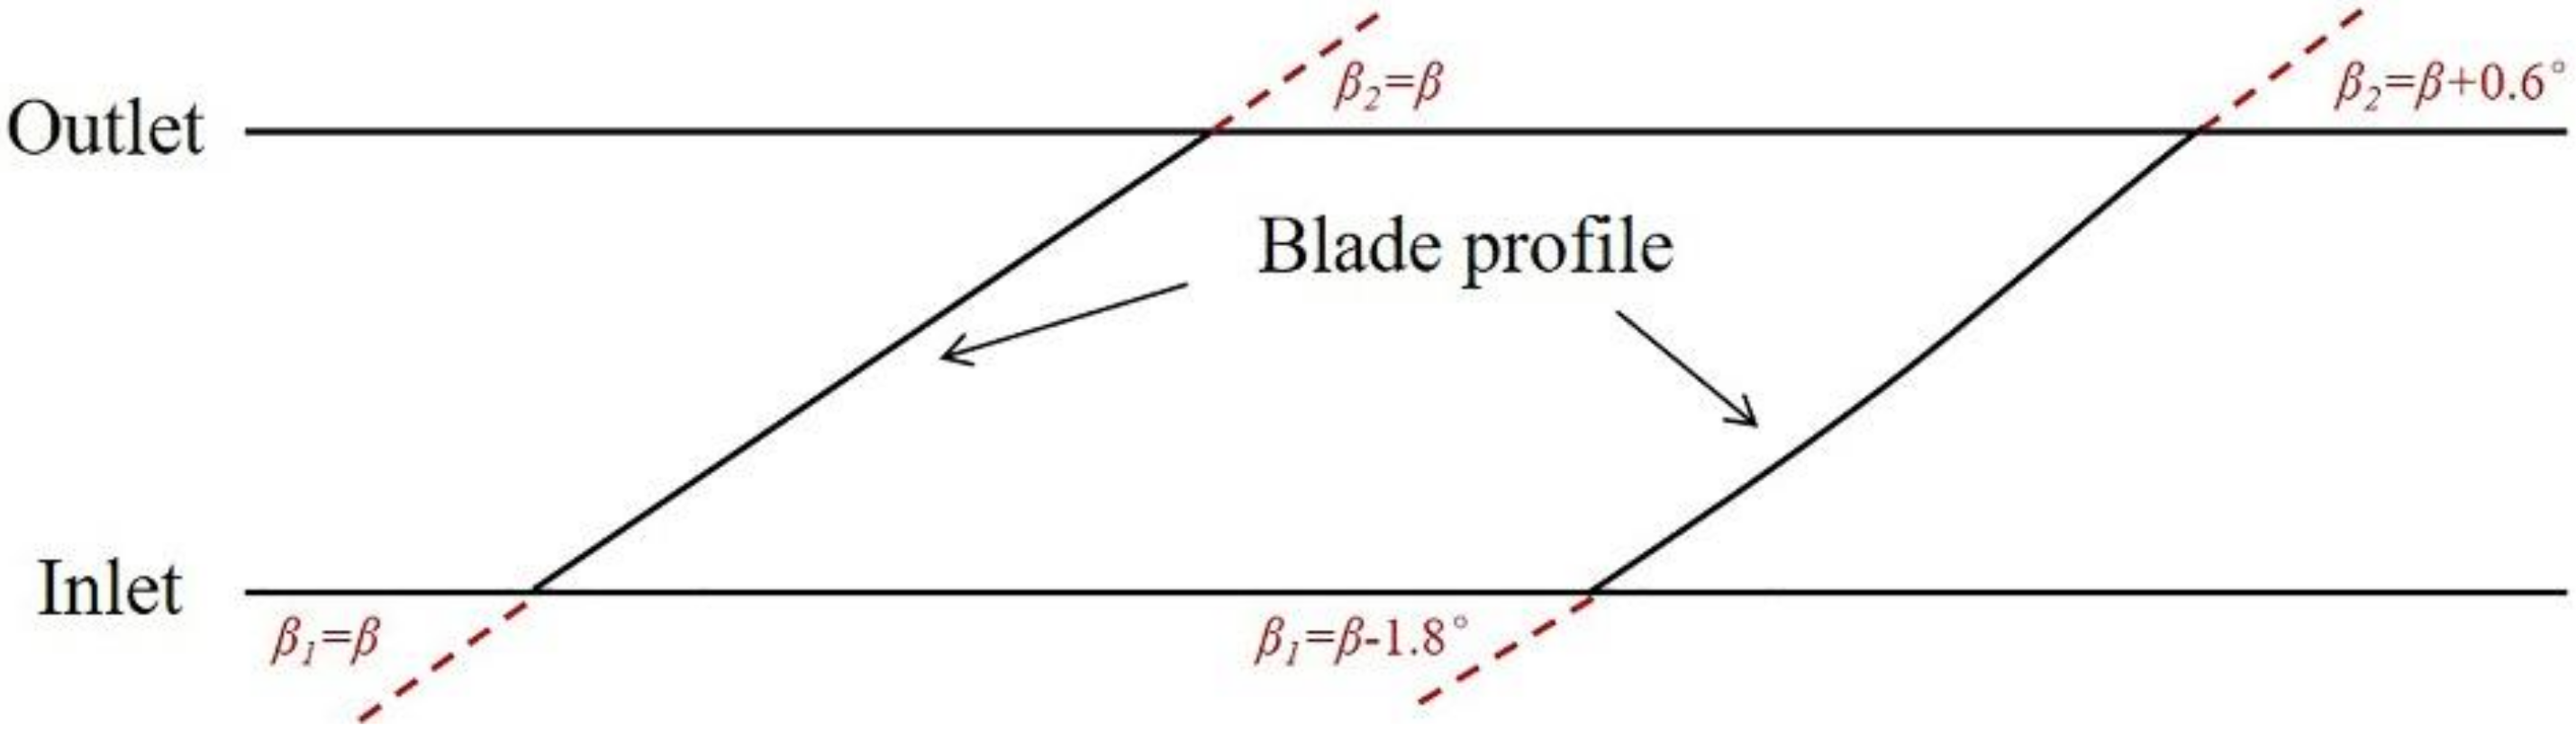
Processes 08 01103 g002
Figure 3. Schematic of the blade profile. (Left one for the equal pitch inducer and the right one for the varying pitch inducer).
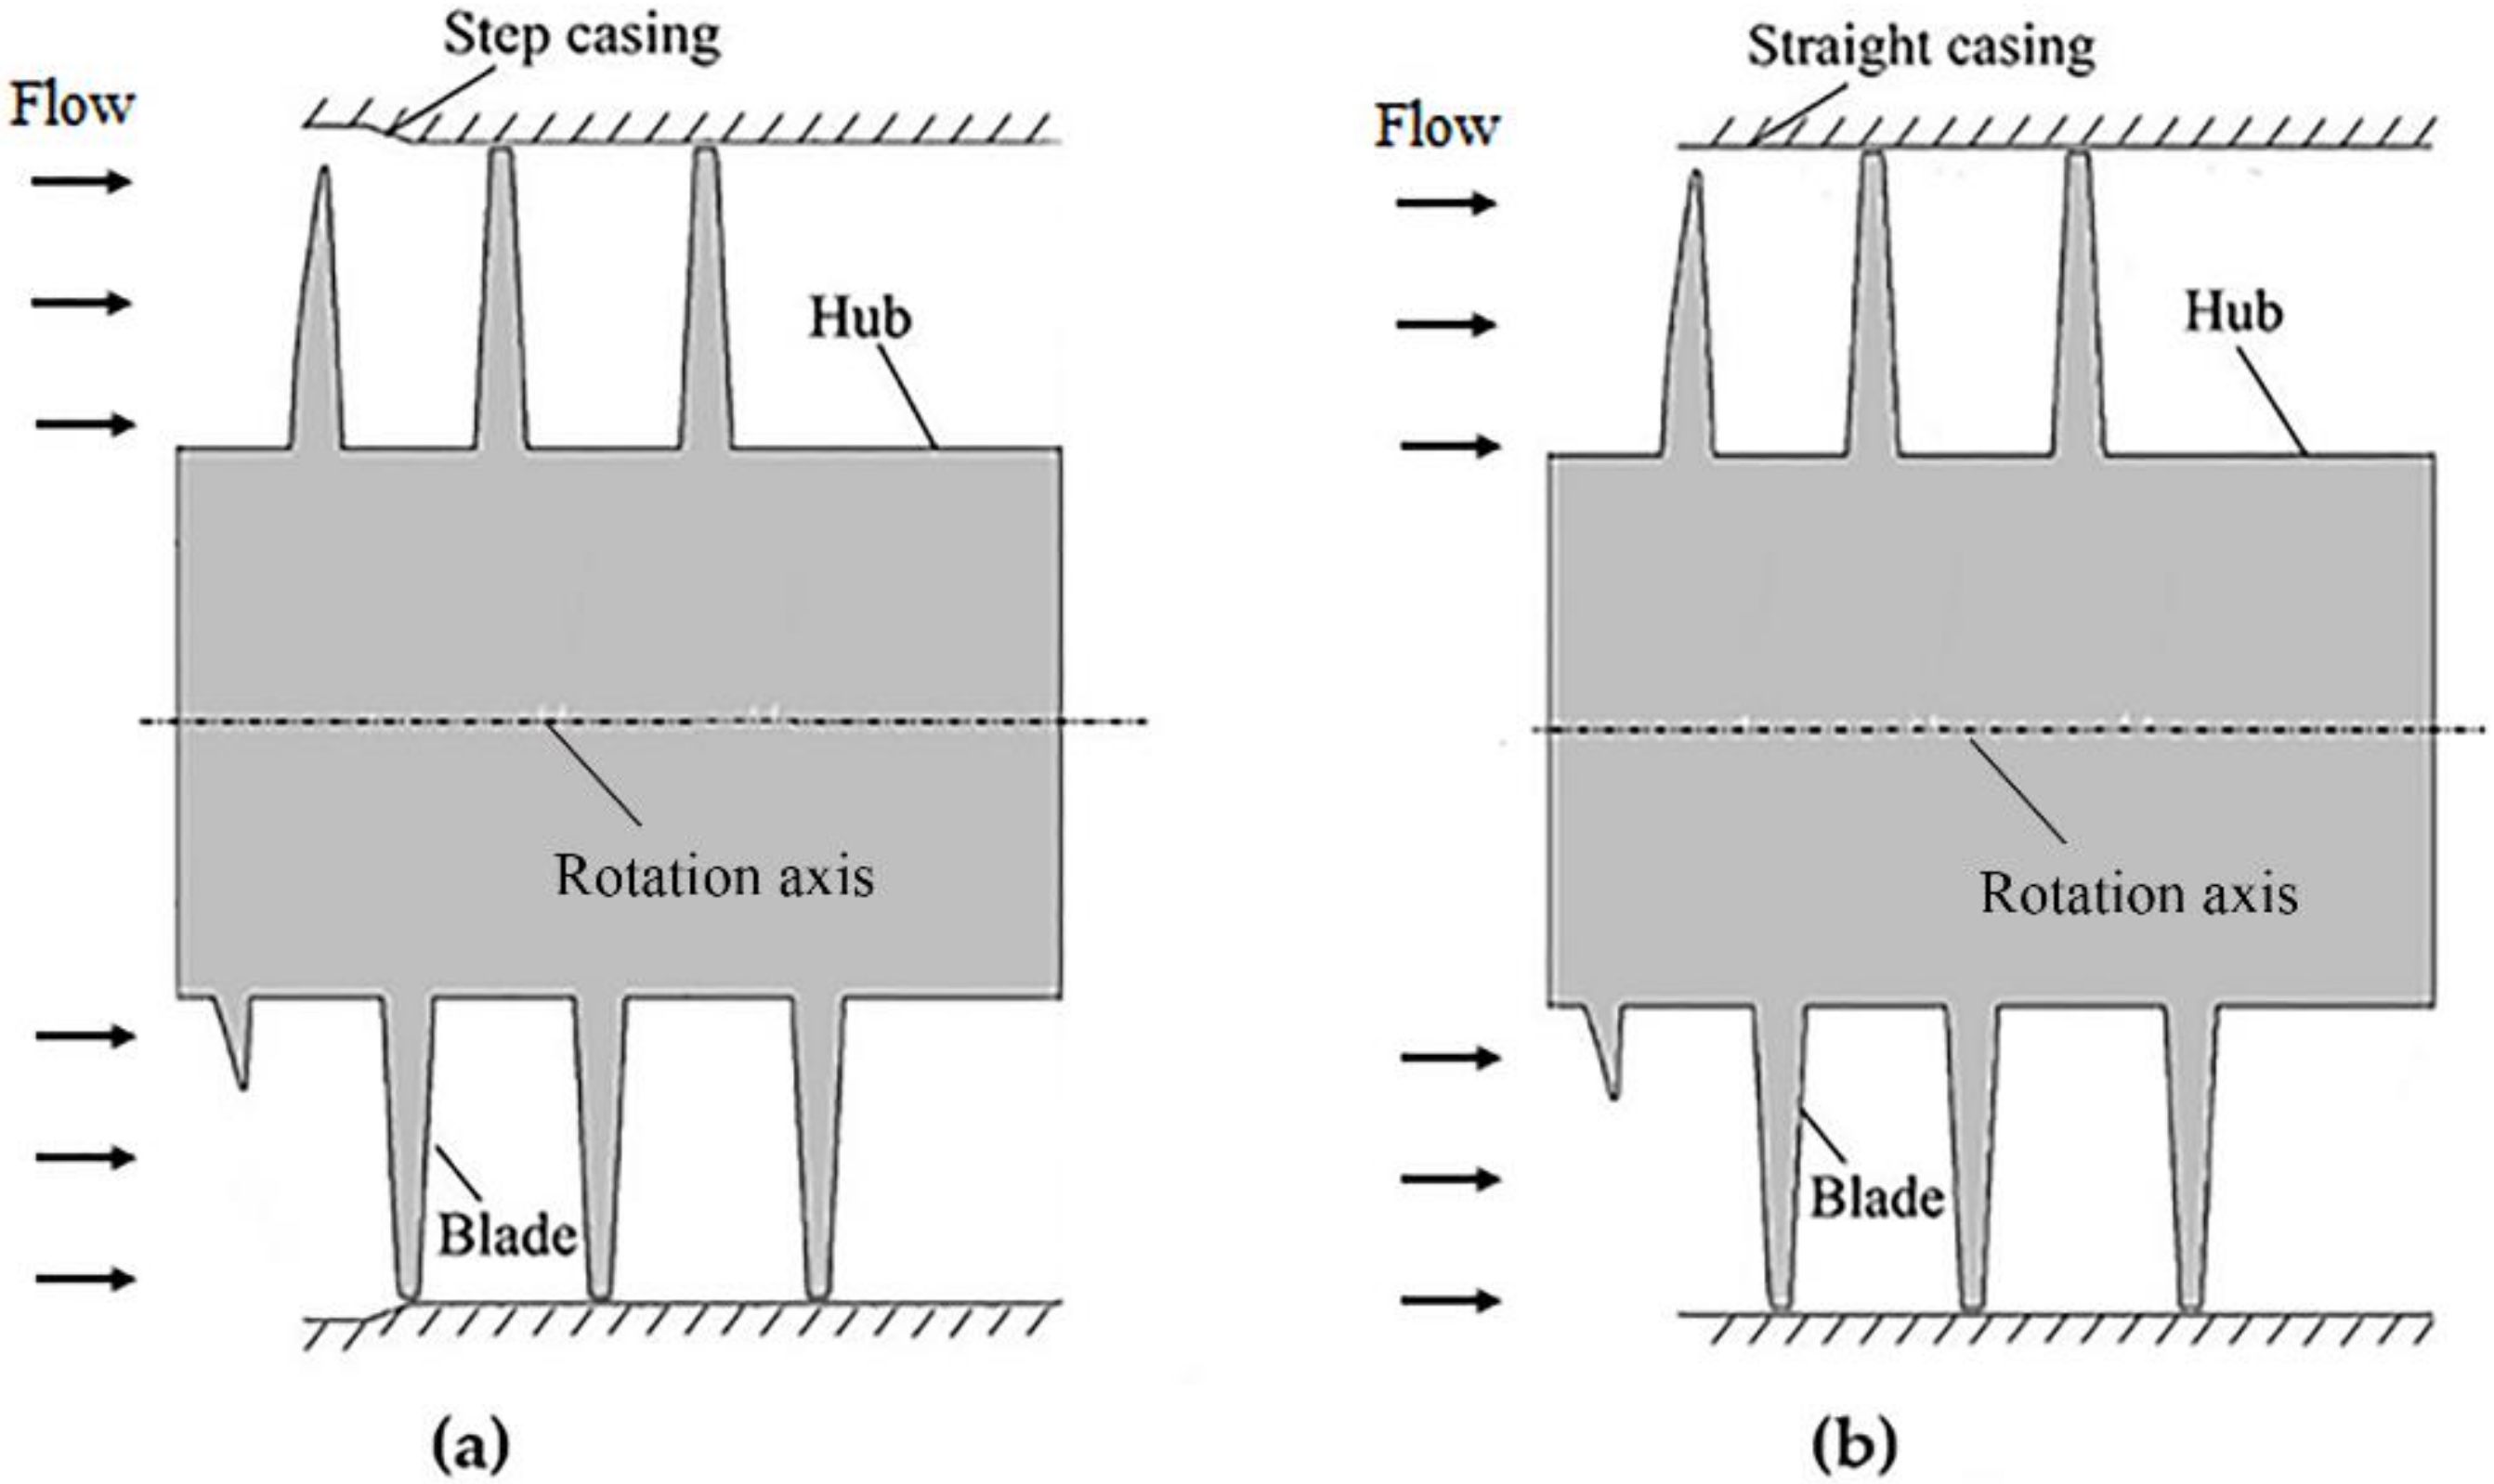
Processes 08 01103 g003
Figure 4. Schematics of the studied casings: (a) Step casing; (b) straight casing.
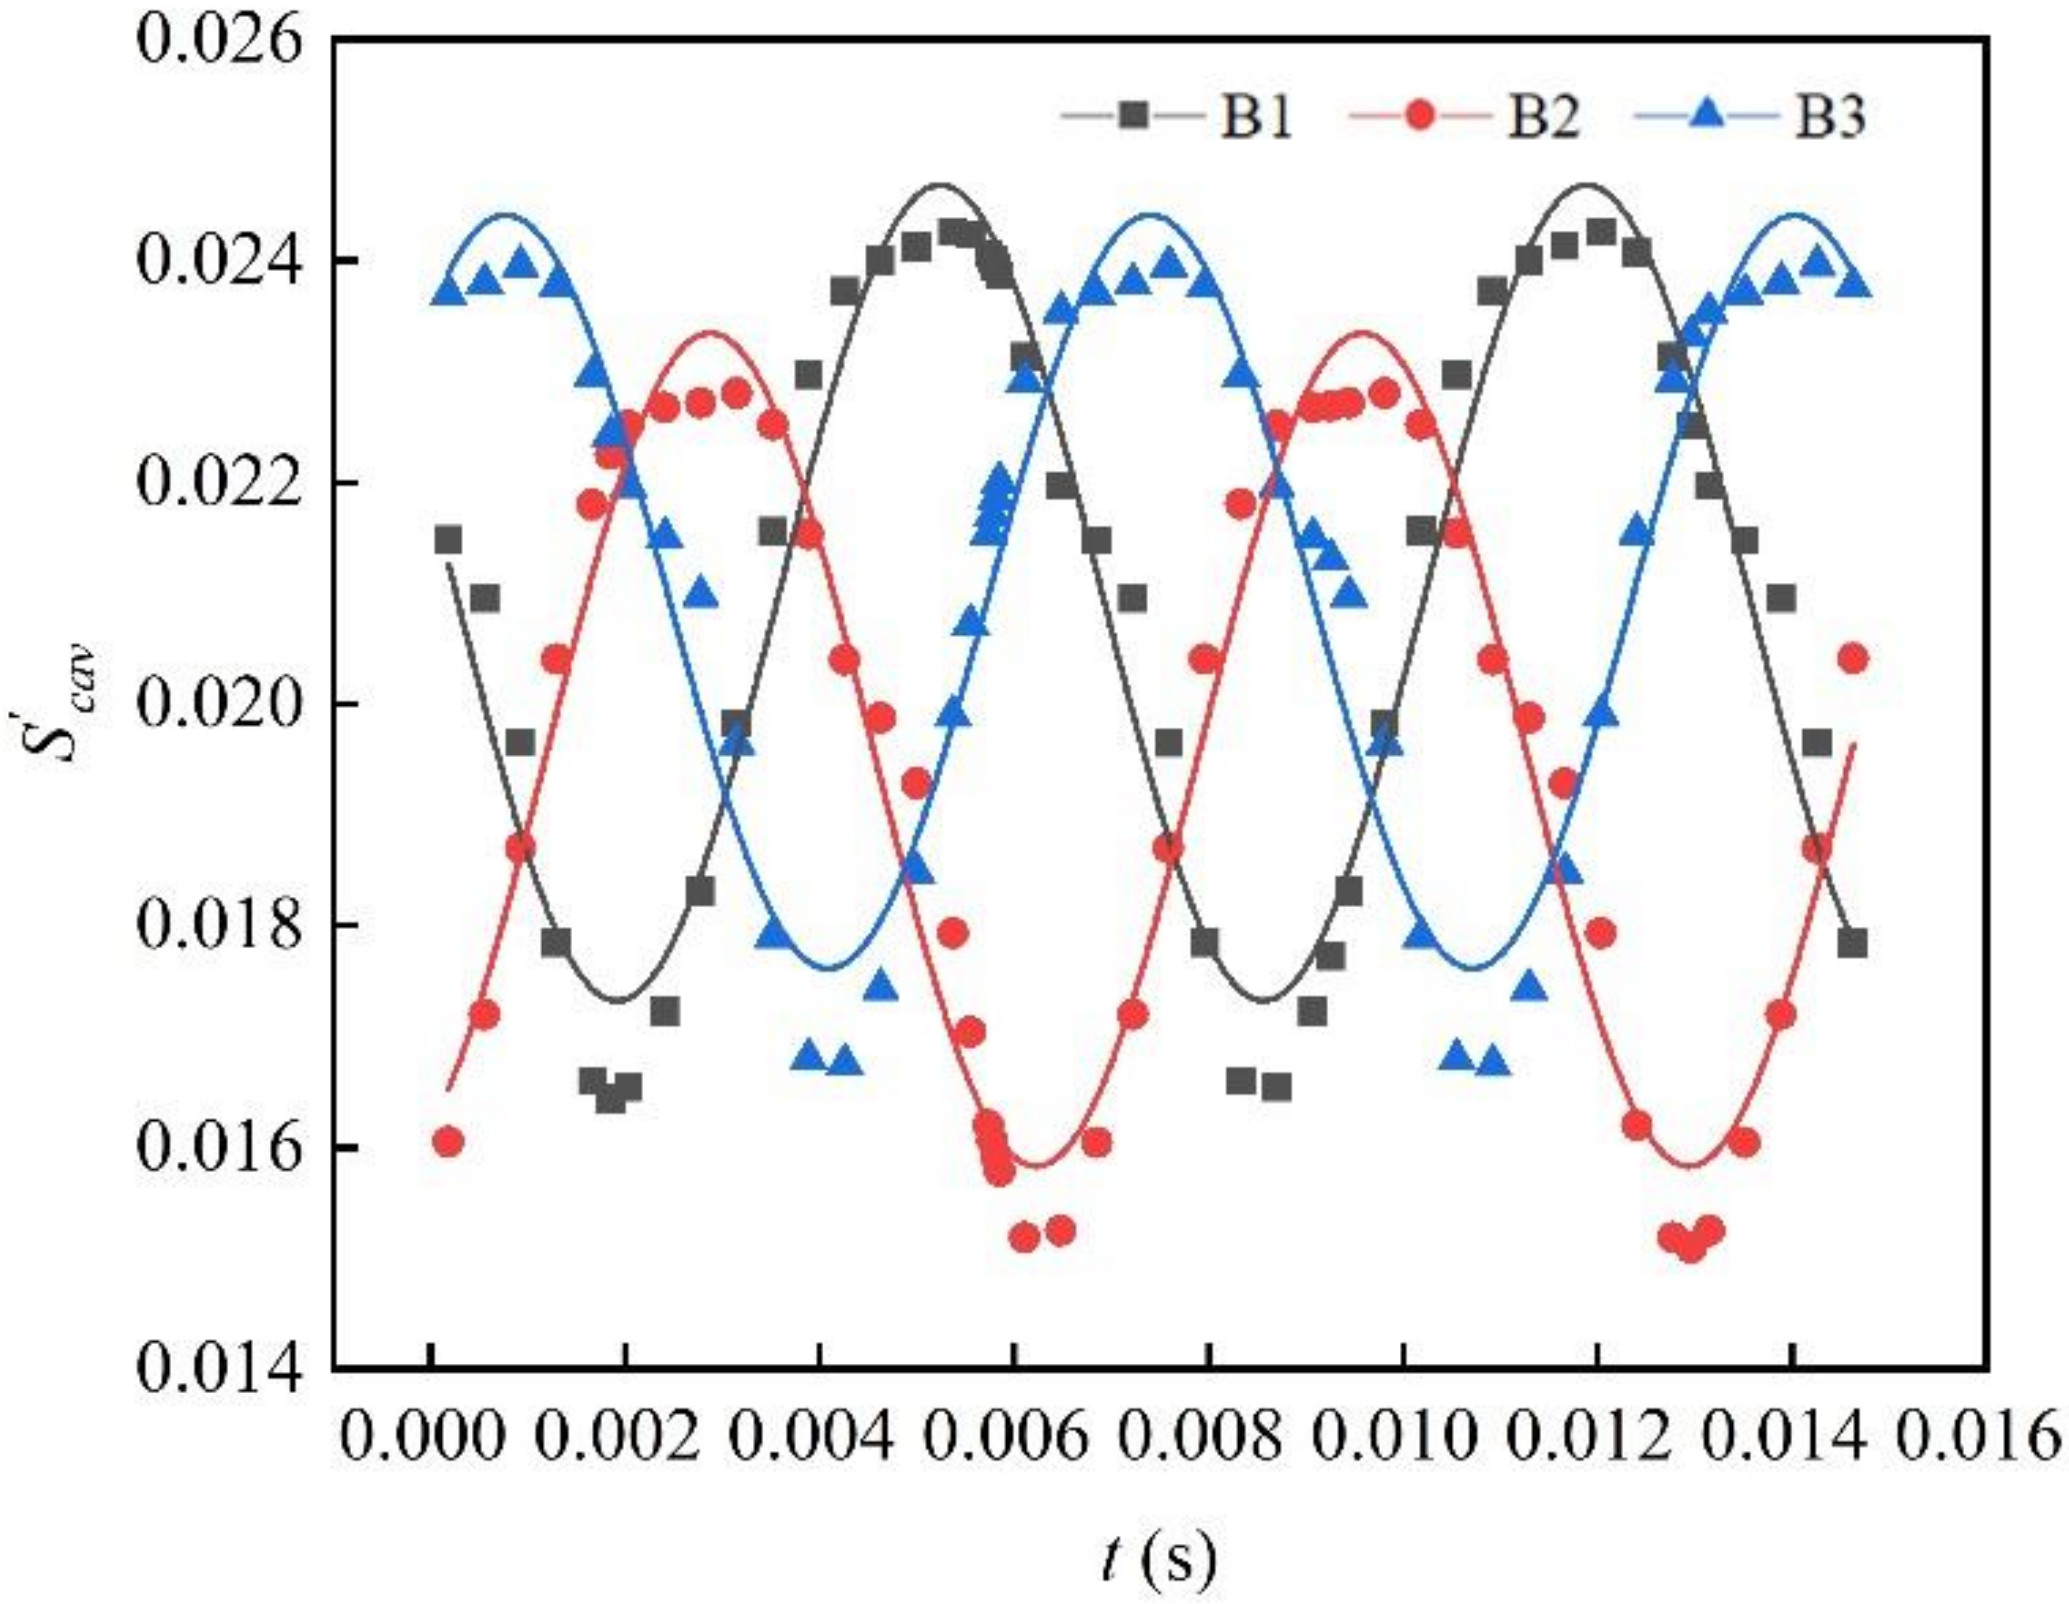
Processes 08 01103 g004
Figure 5. The variation of the nondimensional cavity area over time on three blades of Model O.
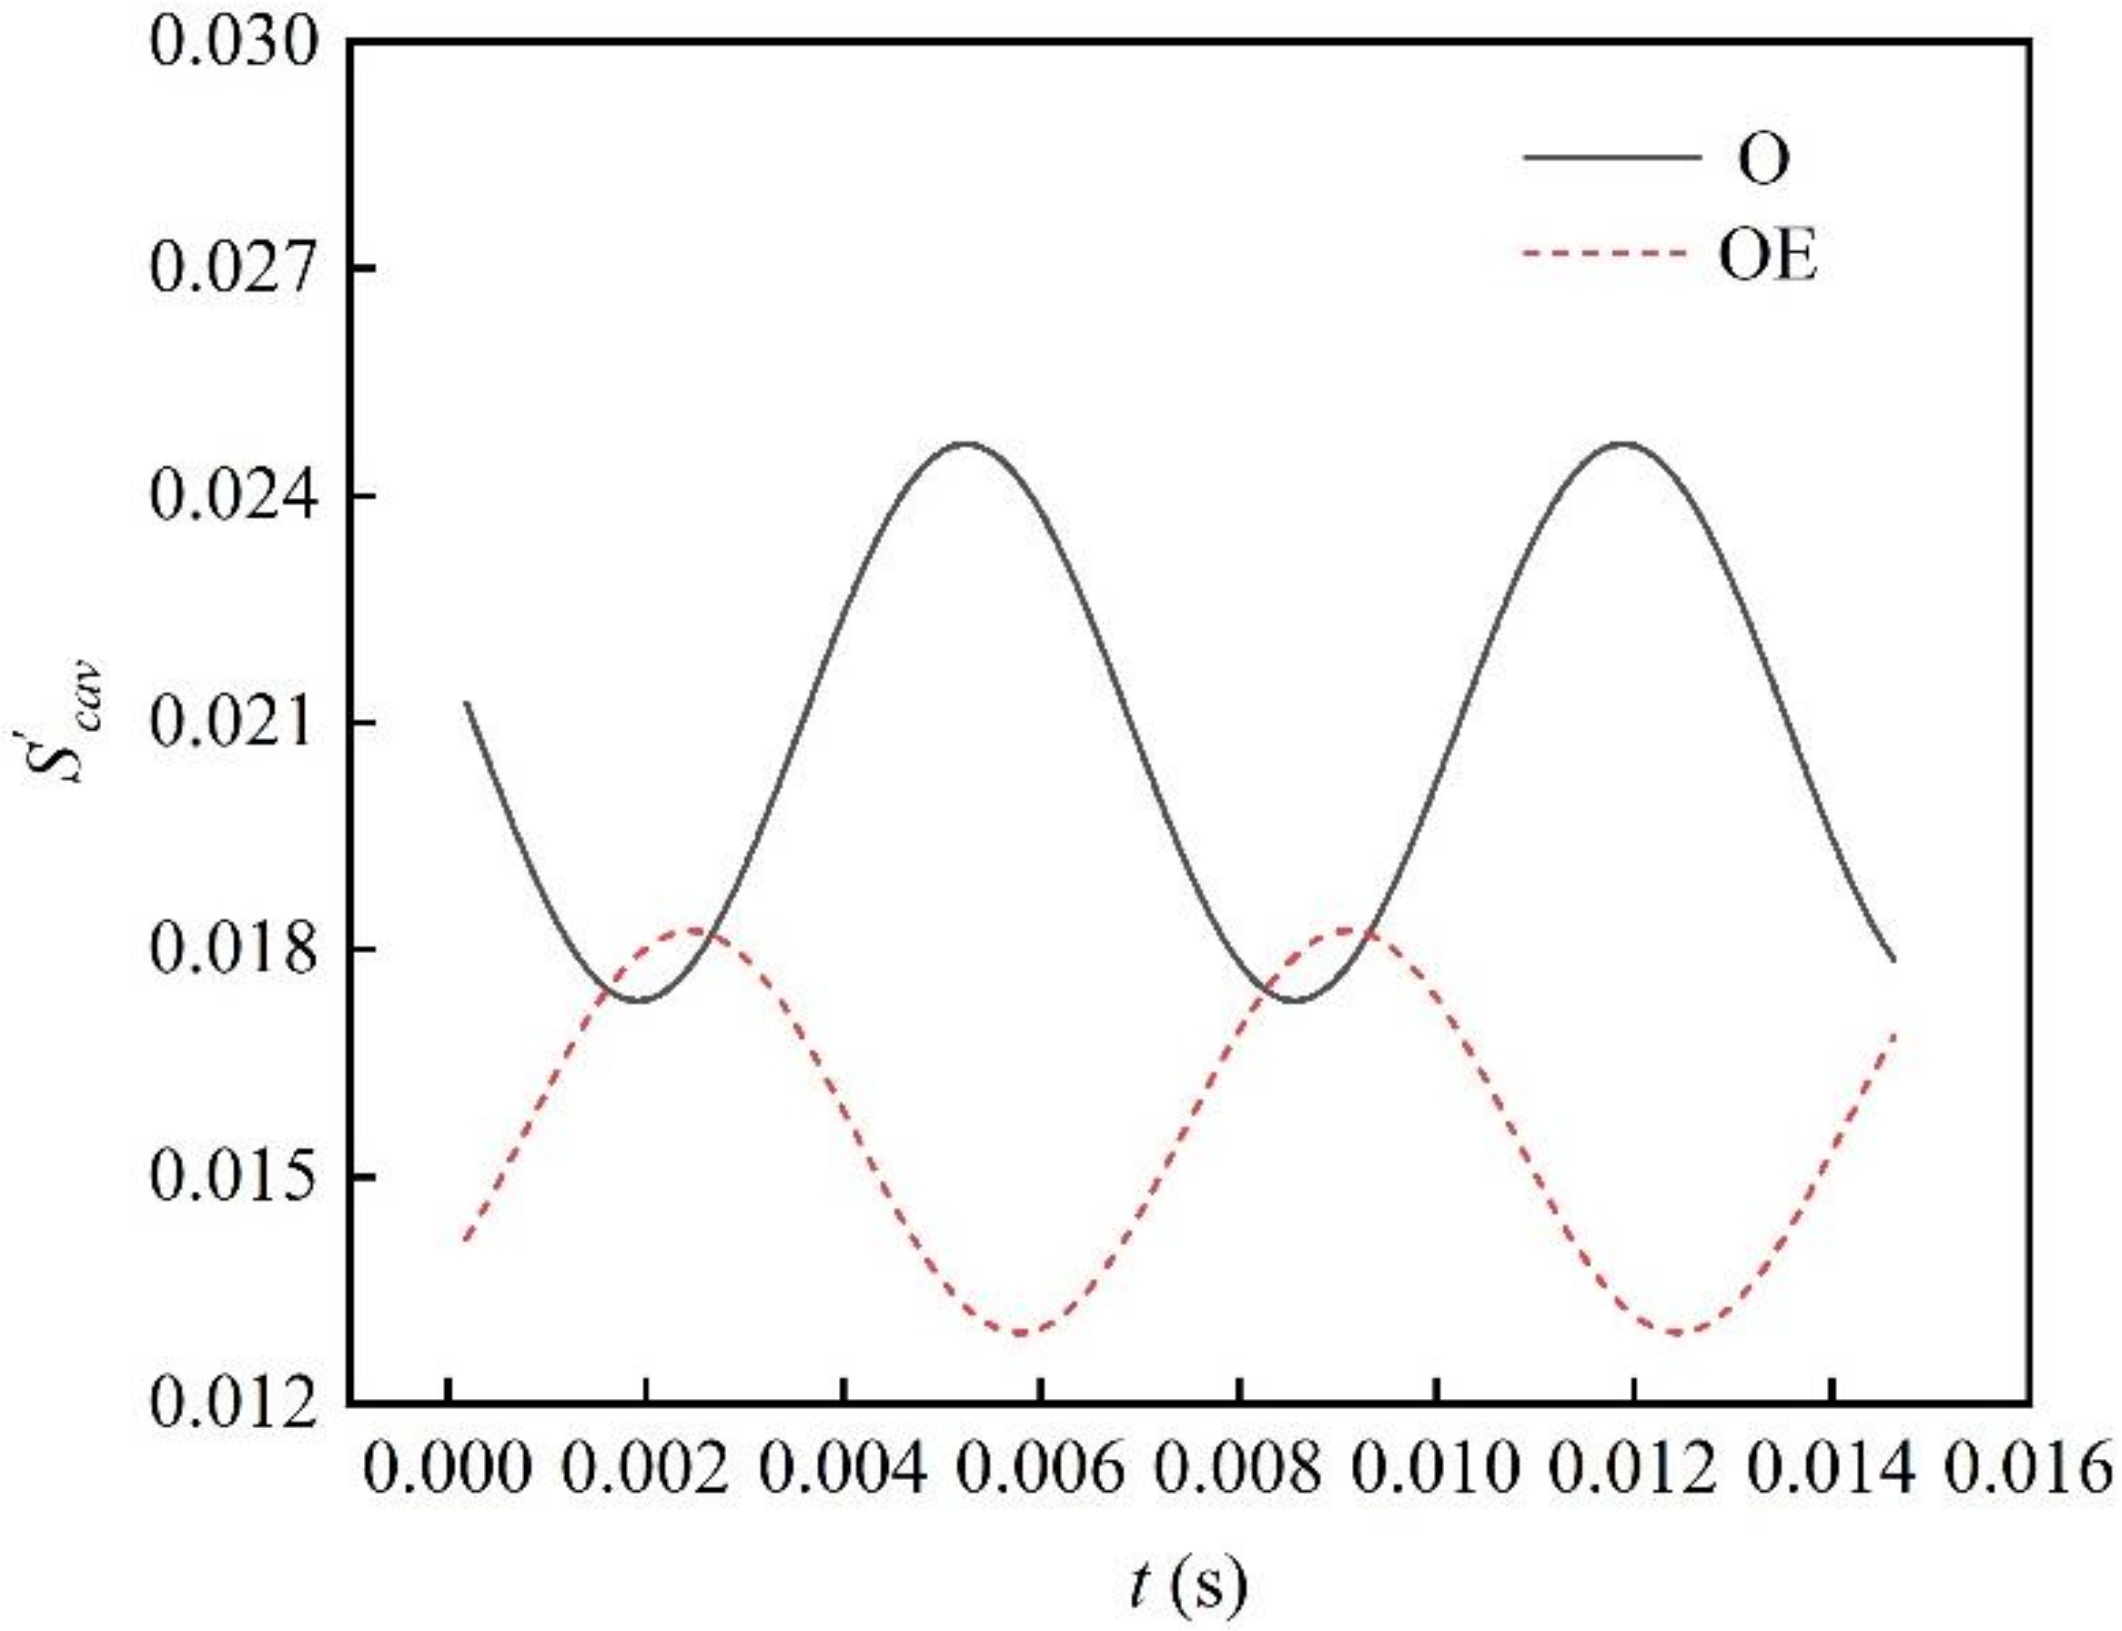
Processes 08 01103 g005
Figure 6. The variation of the nondimensional cavity area over time on Blade 1 of Model O and OE (cases with the equal pitch inducer).
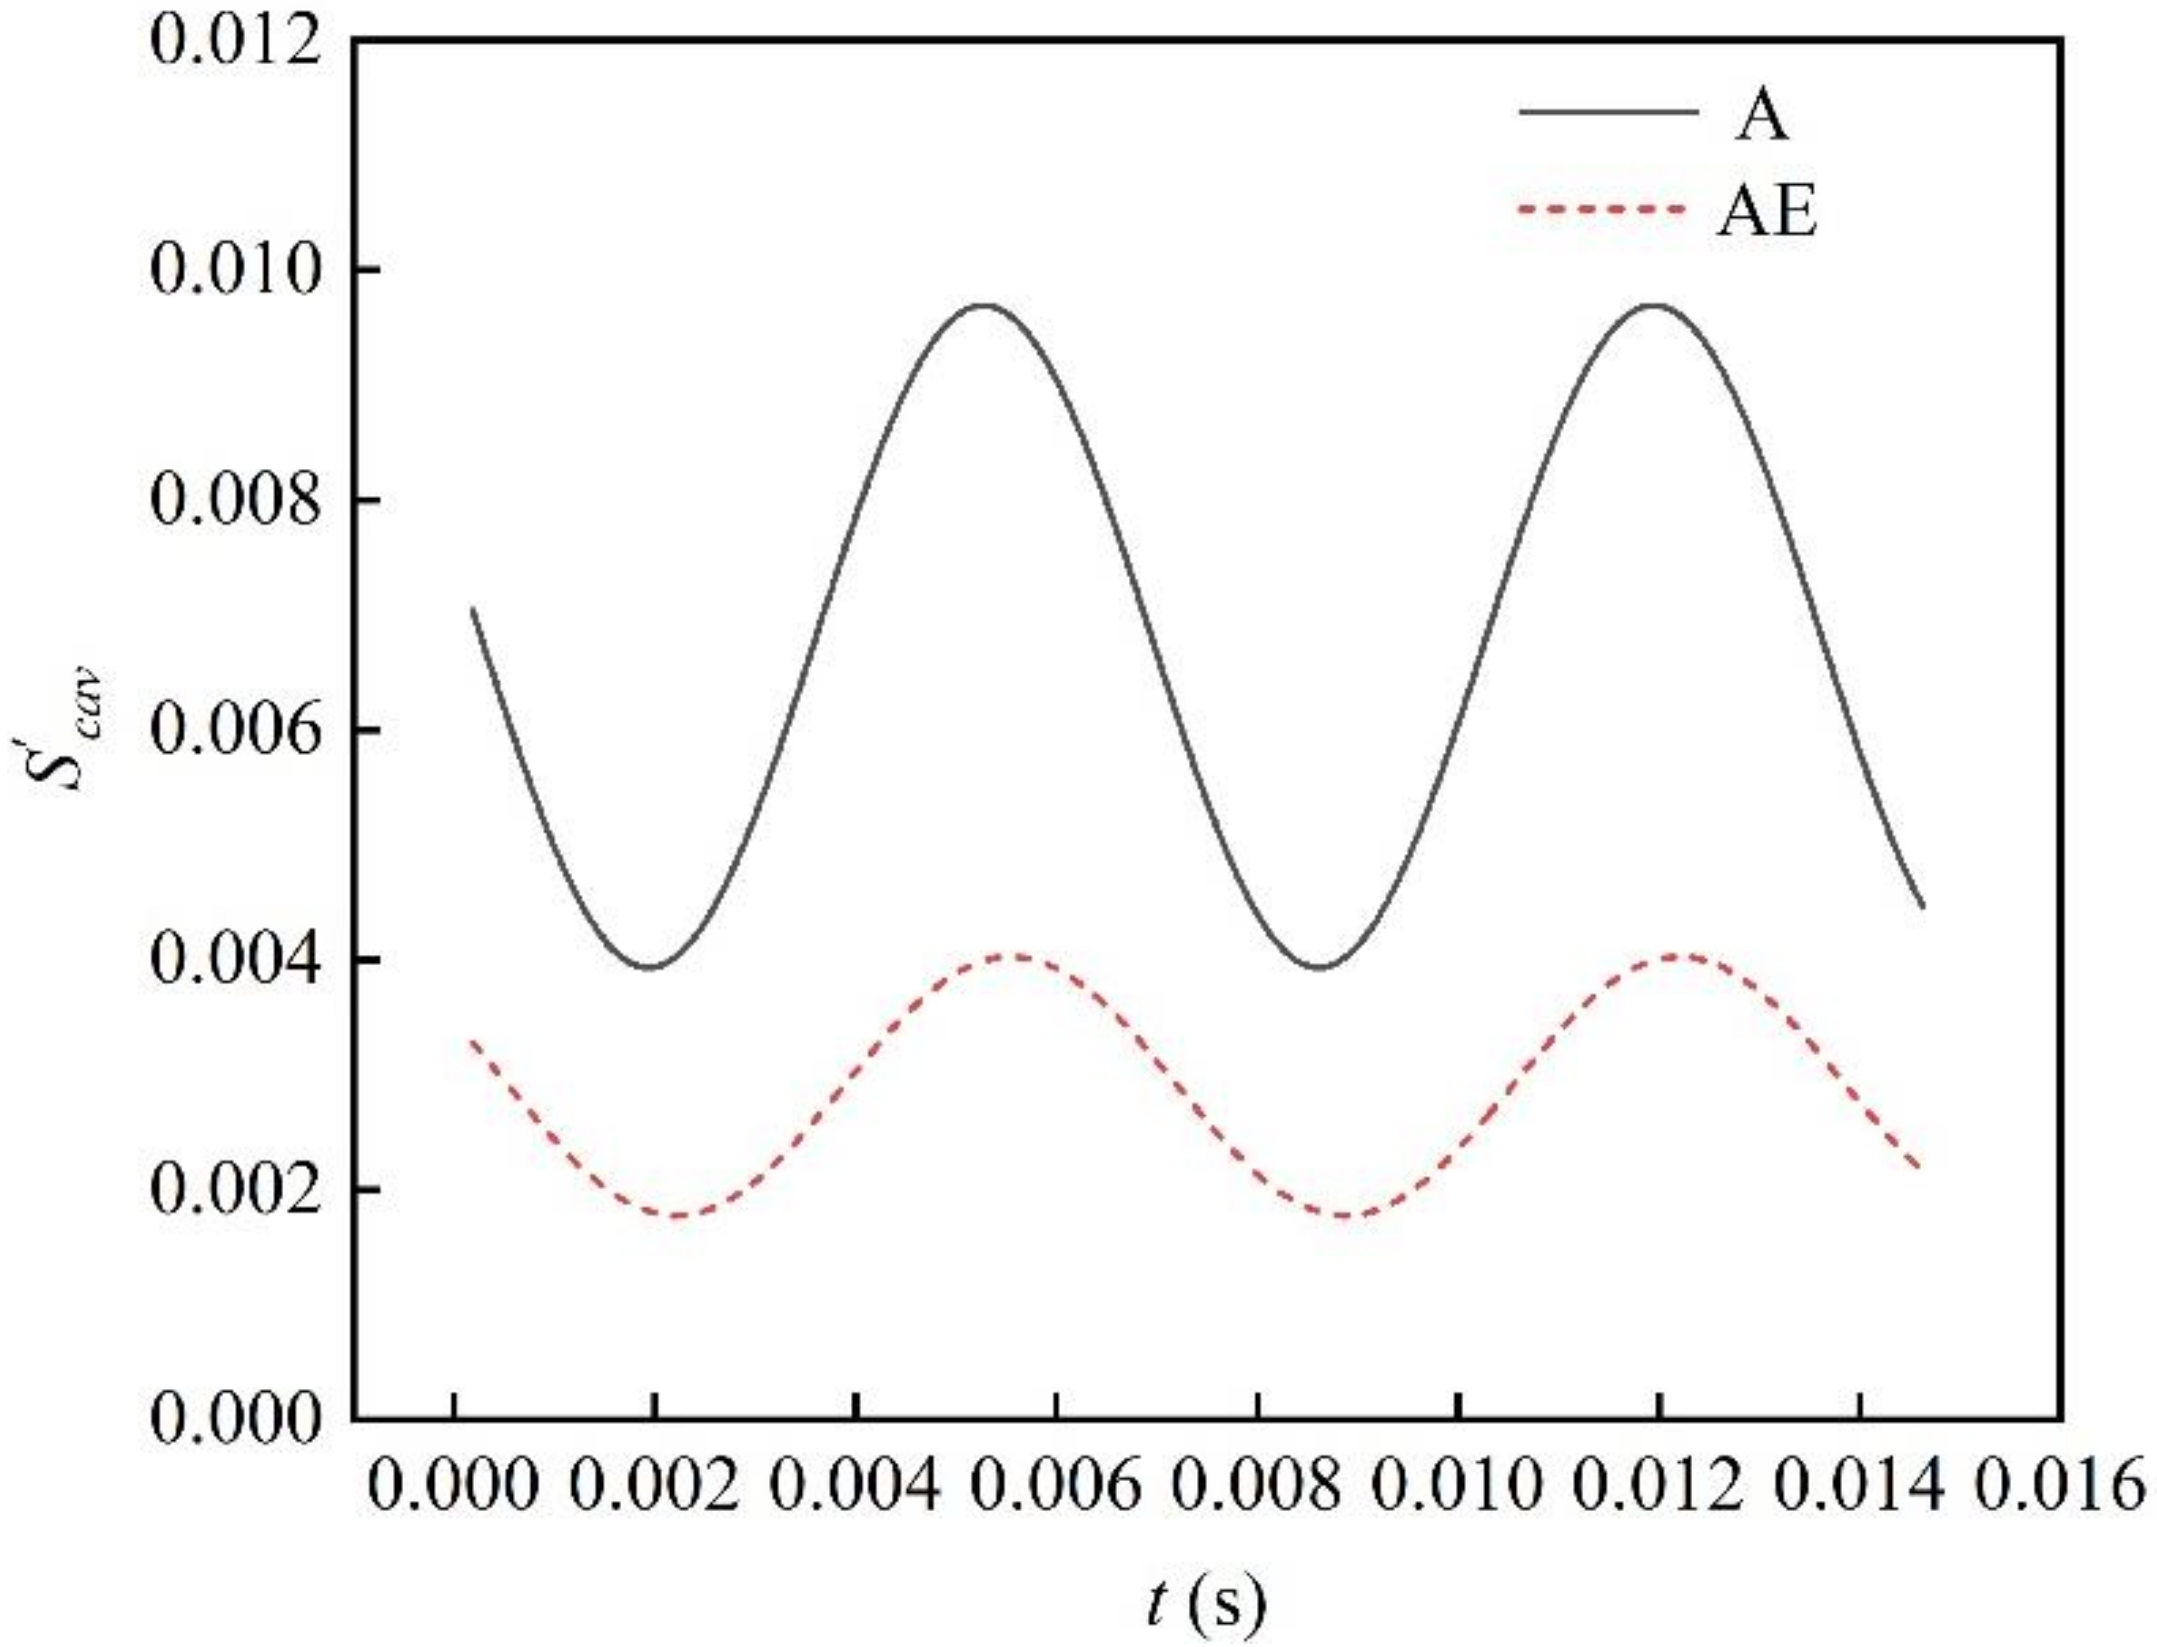
Processes 08 01103 g006
Figure 7. The variation of the nondimensional cavity area over time on Blade 1 of Model A and AE (cases with the varying pitch inducer).
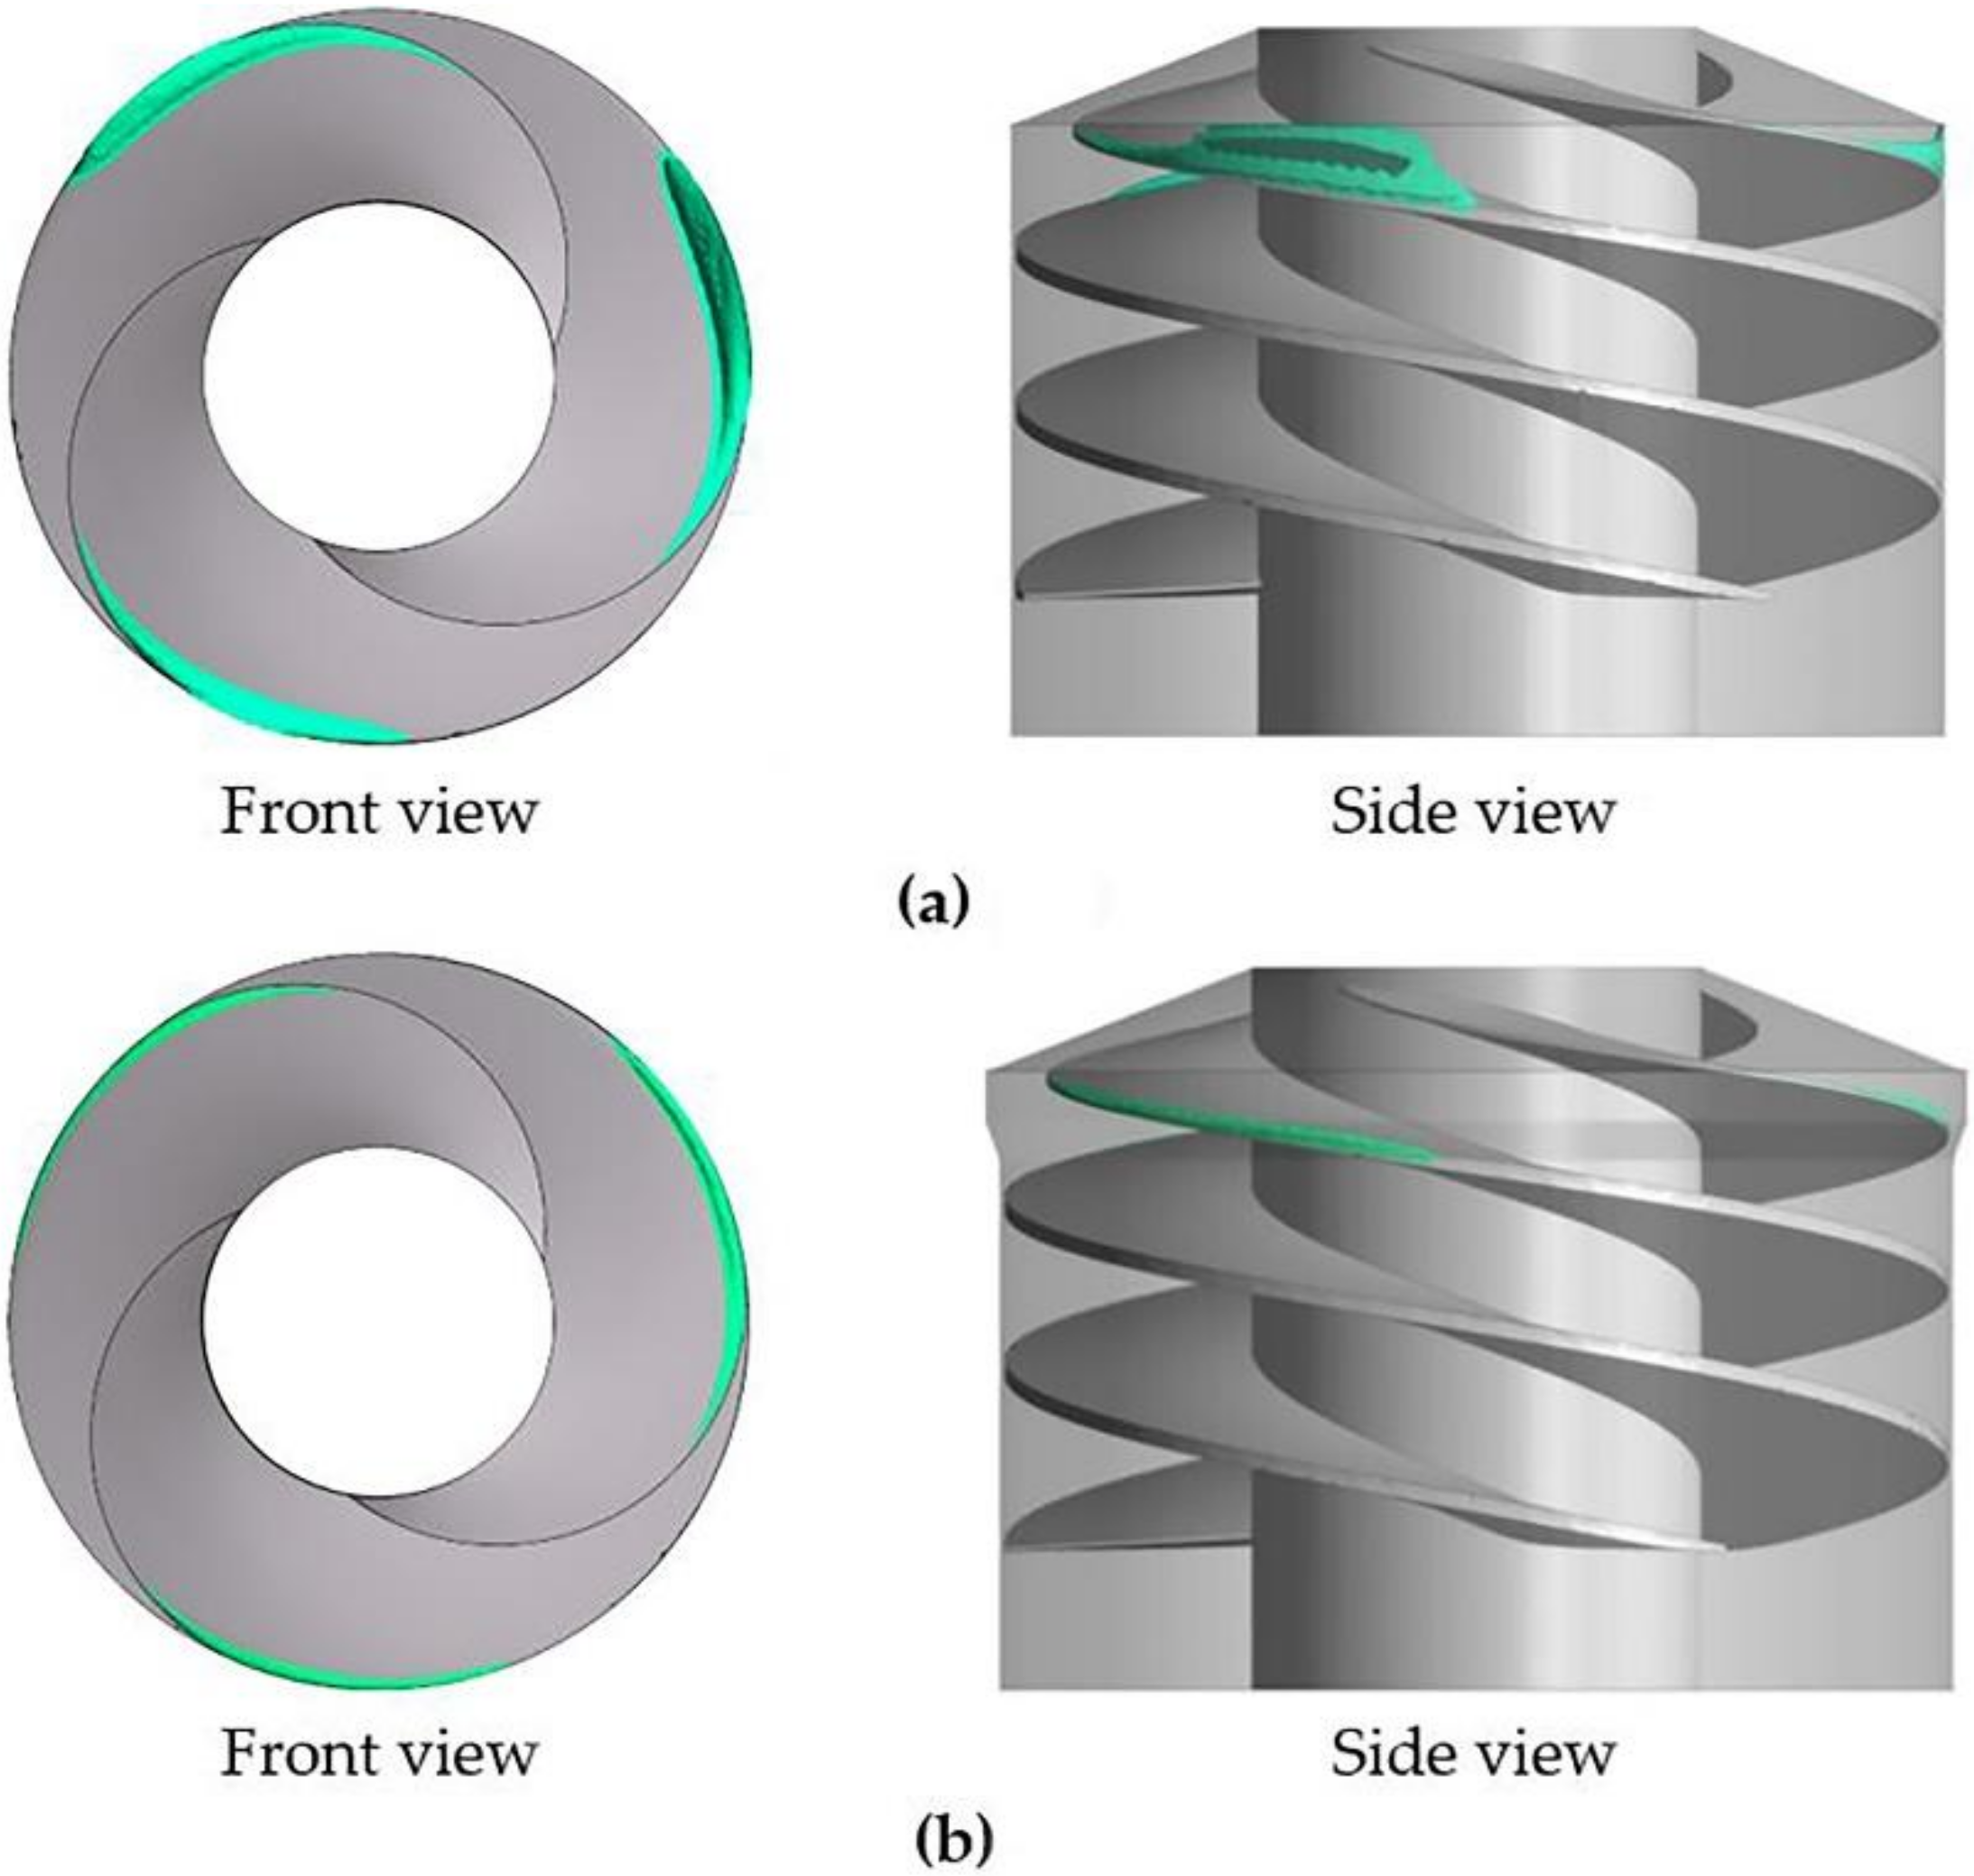
Processes 08 01103 g007
Figure 8. The 3D cavity structures of (a) Model O and(b) Model OE.
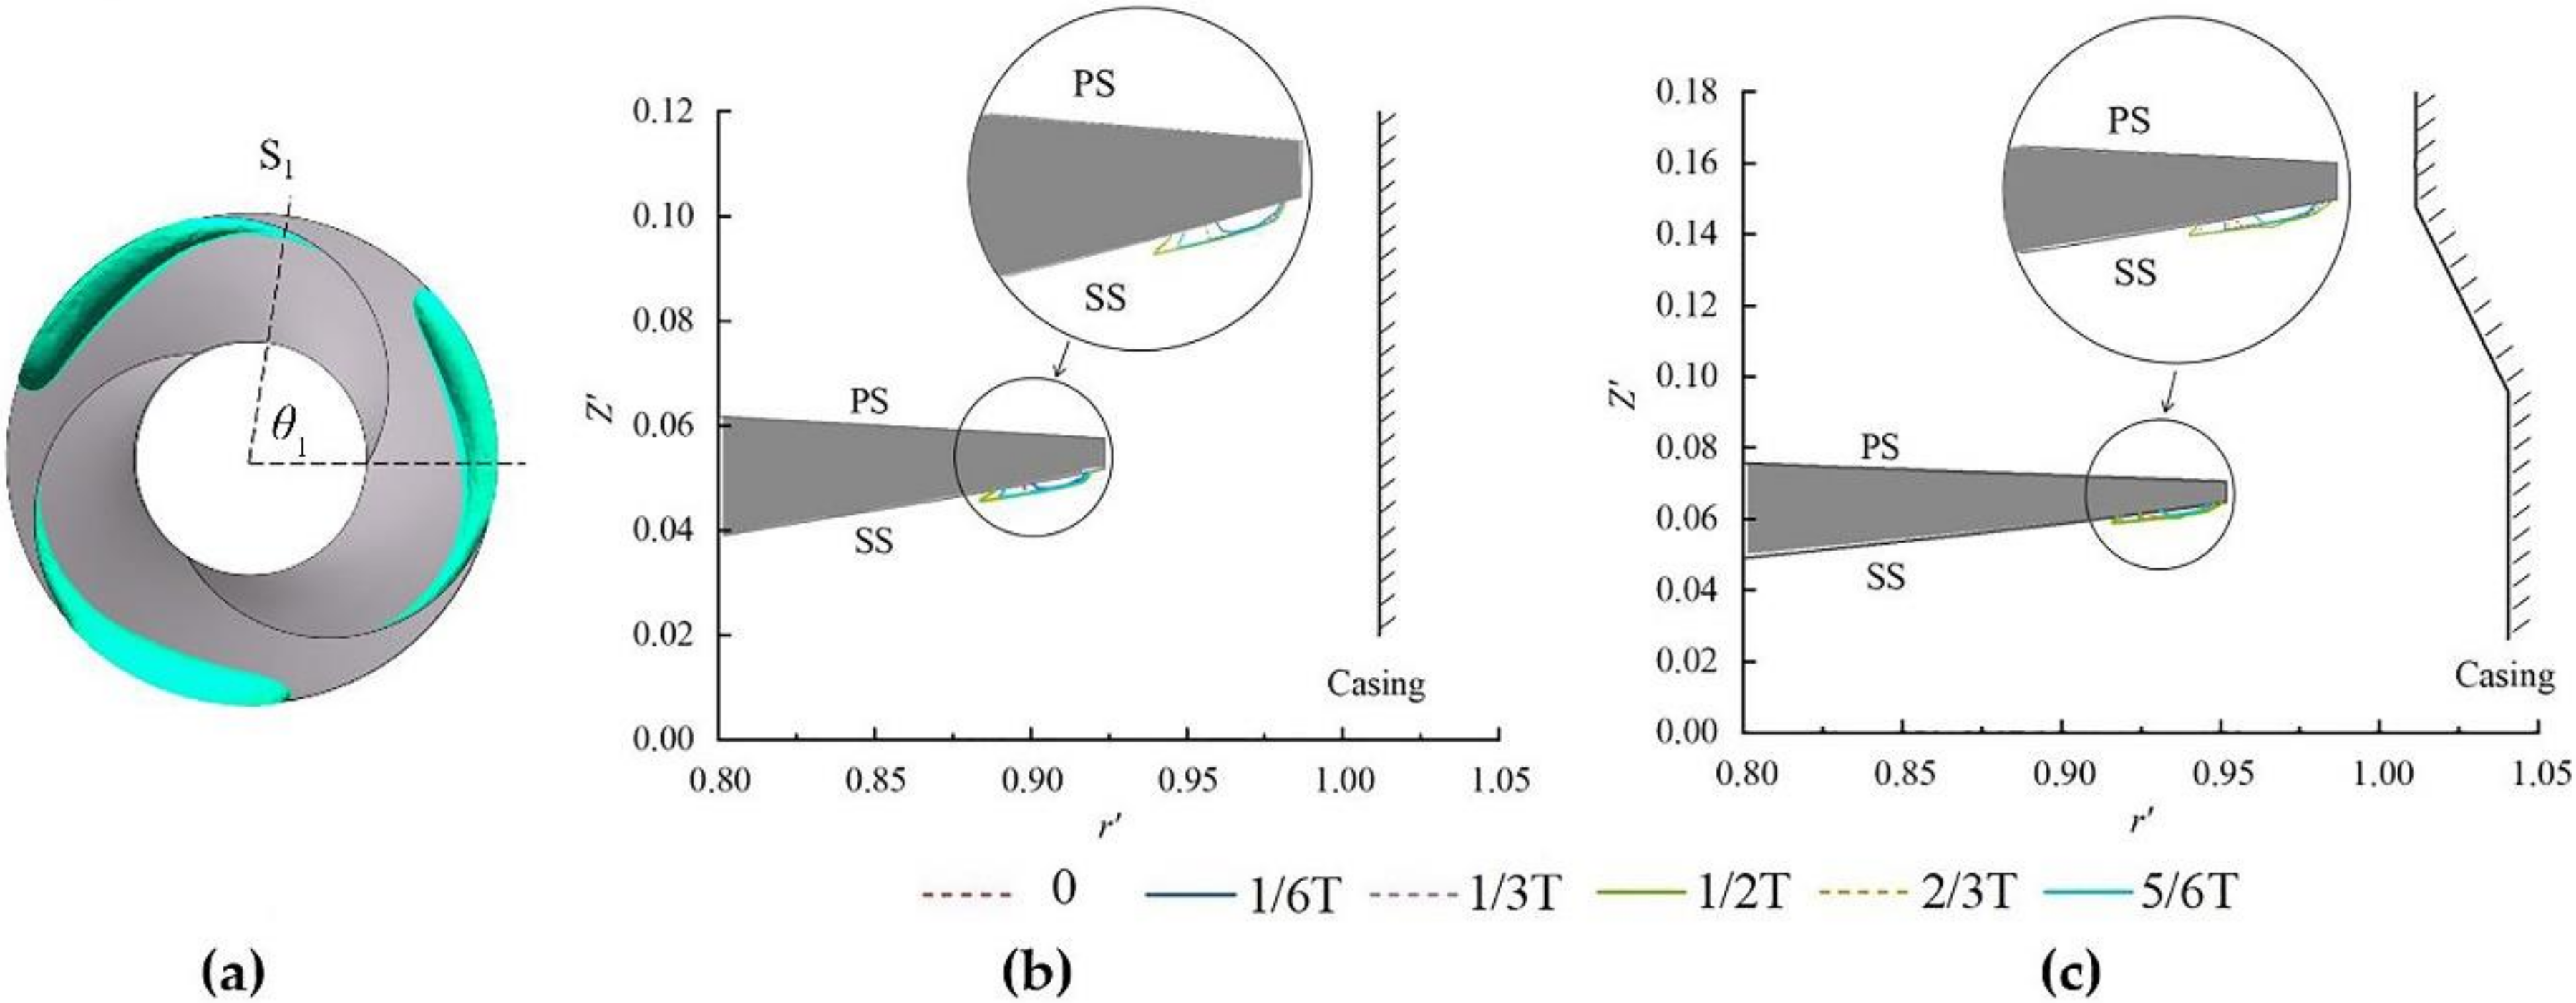
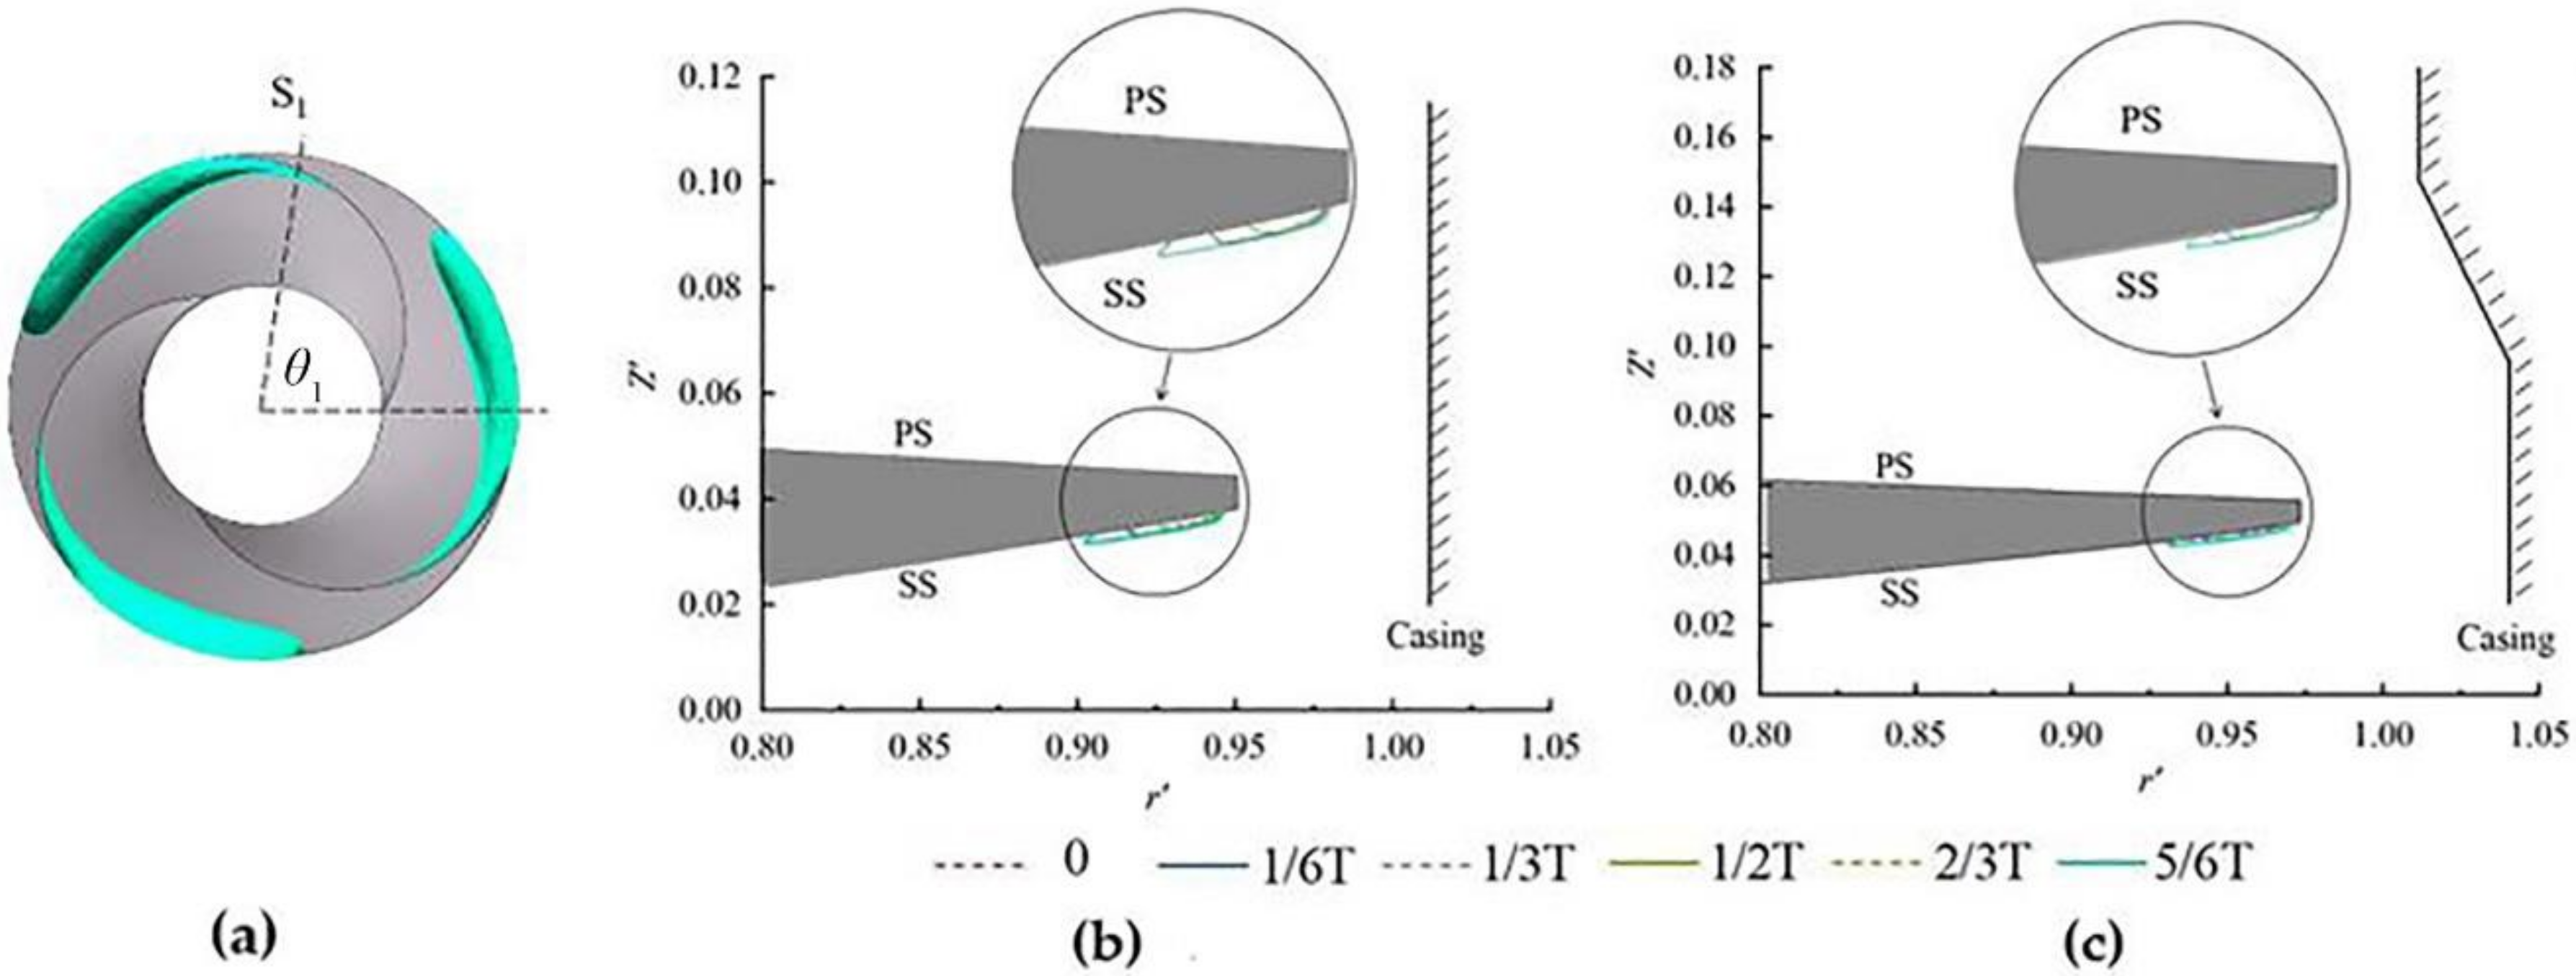
Processes 08 01103 g008
Figure 9. The variation of cavities over time at S1. (a) Schematic of S1, (b) Model O, and (c) Model OE.
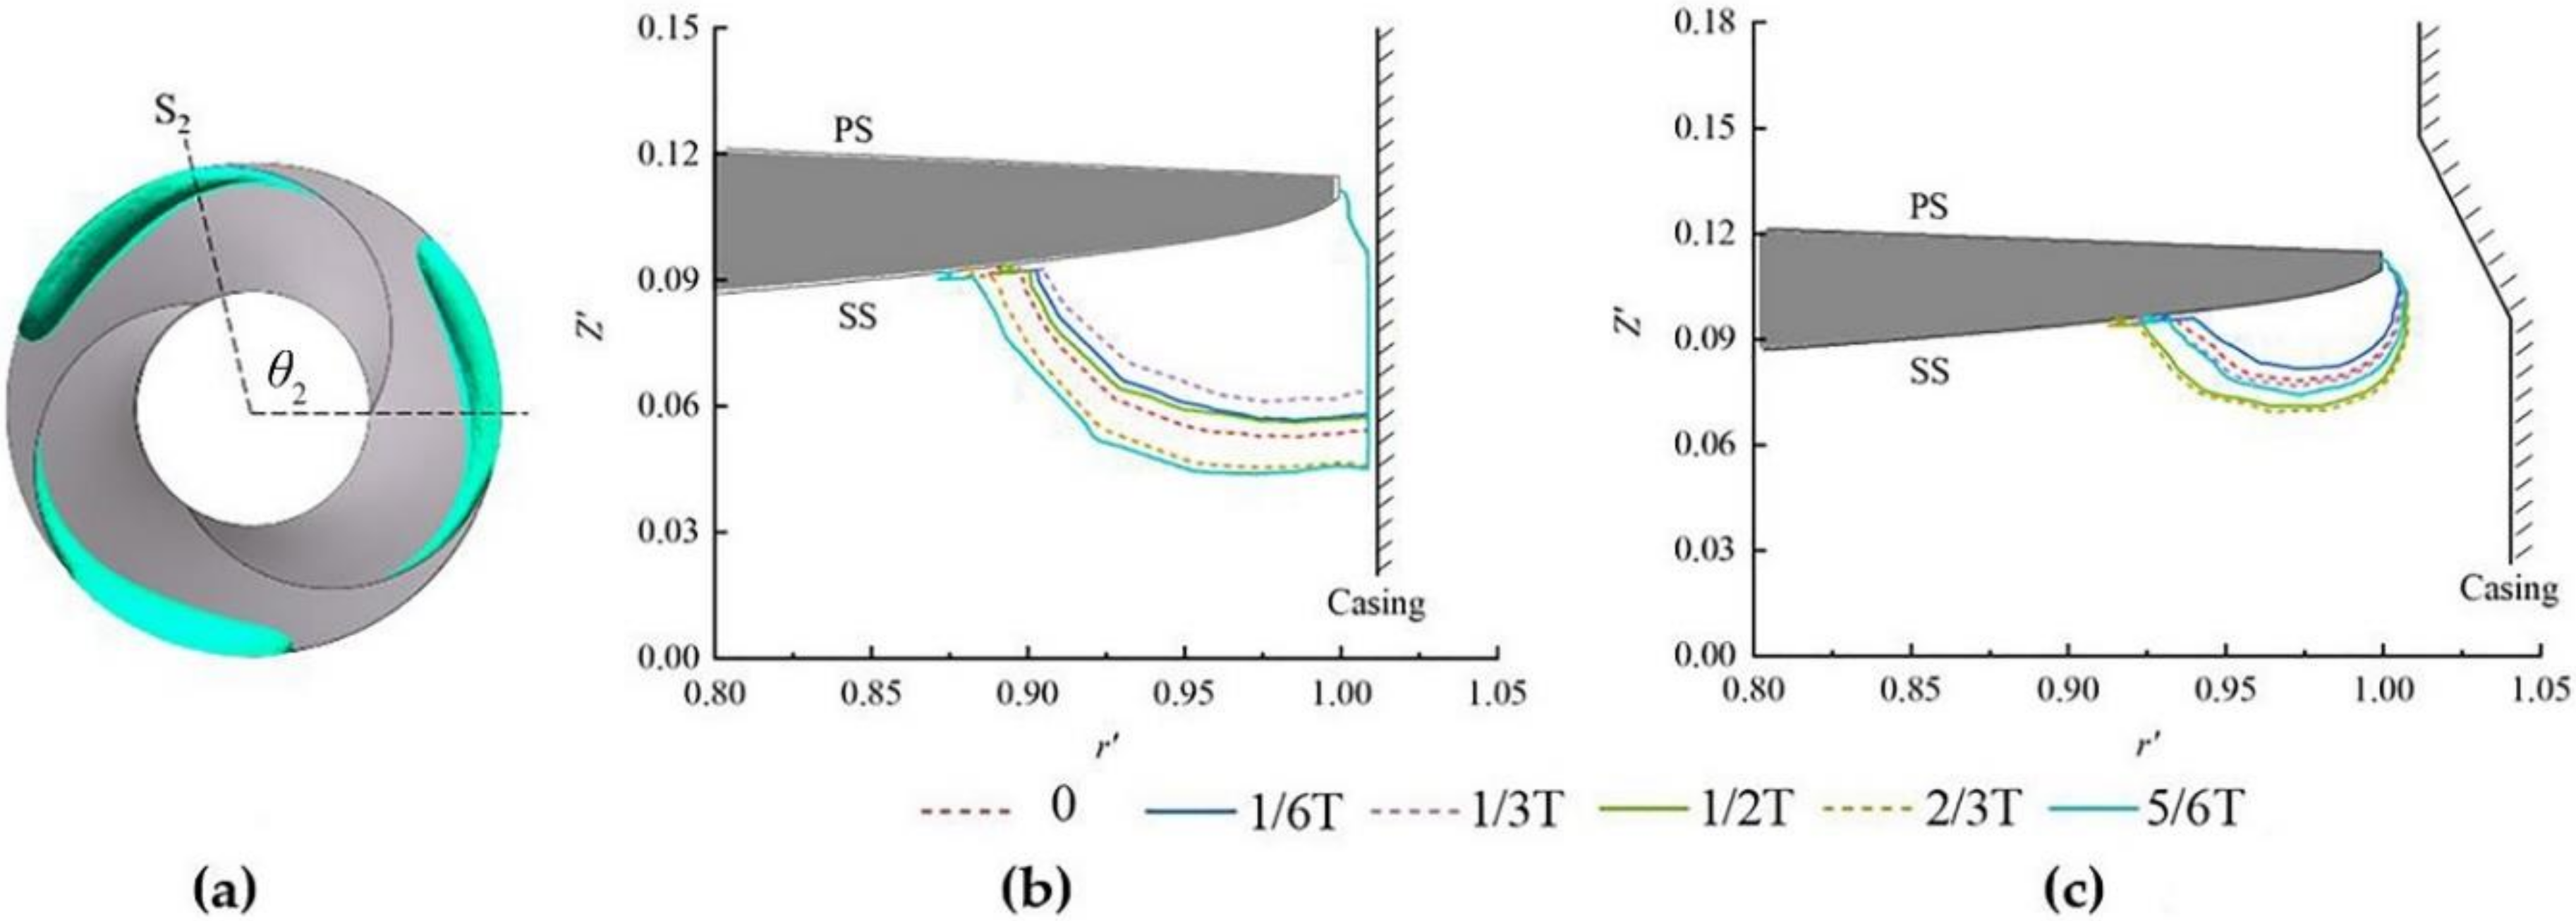
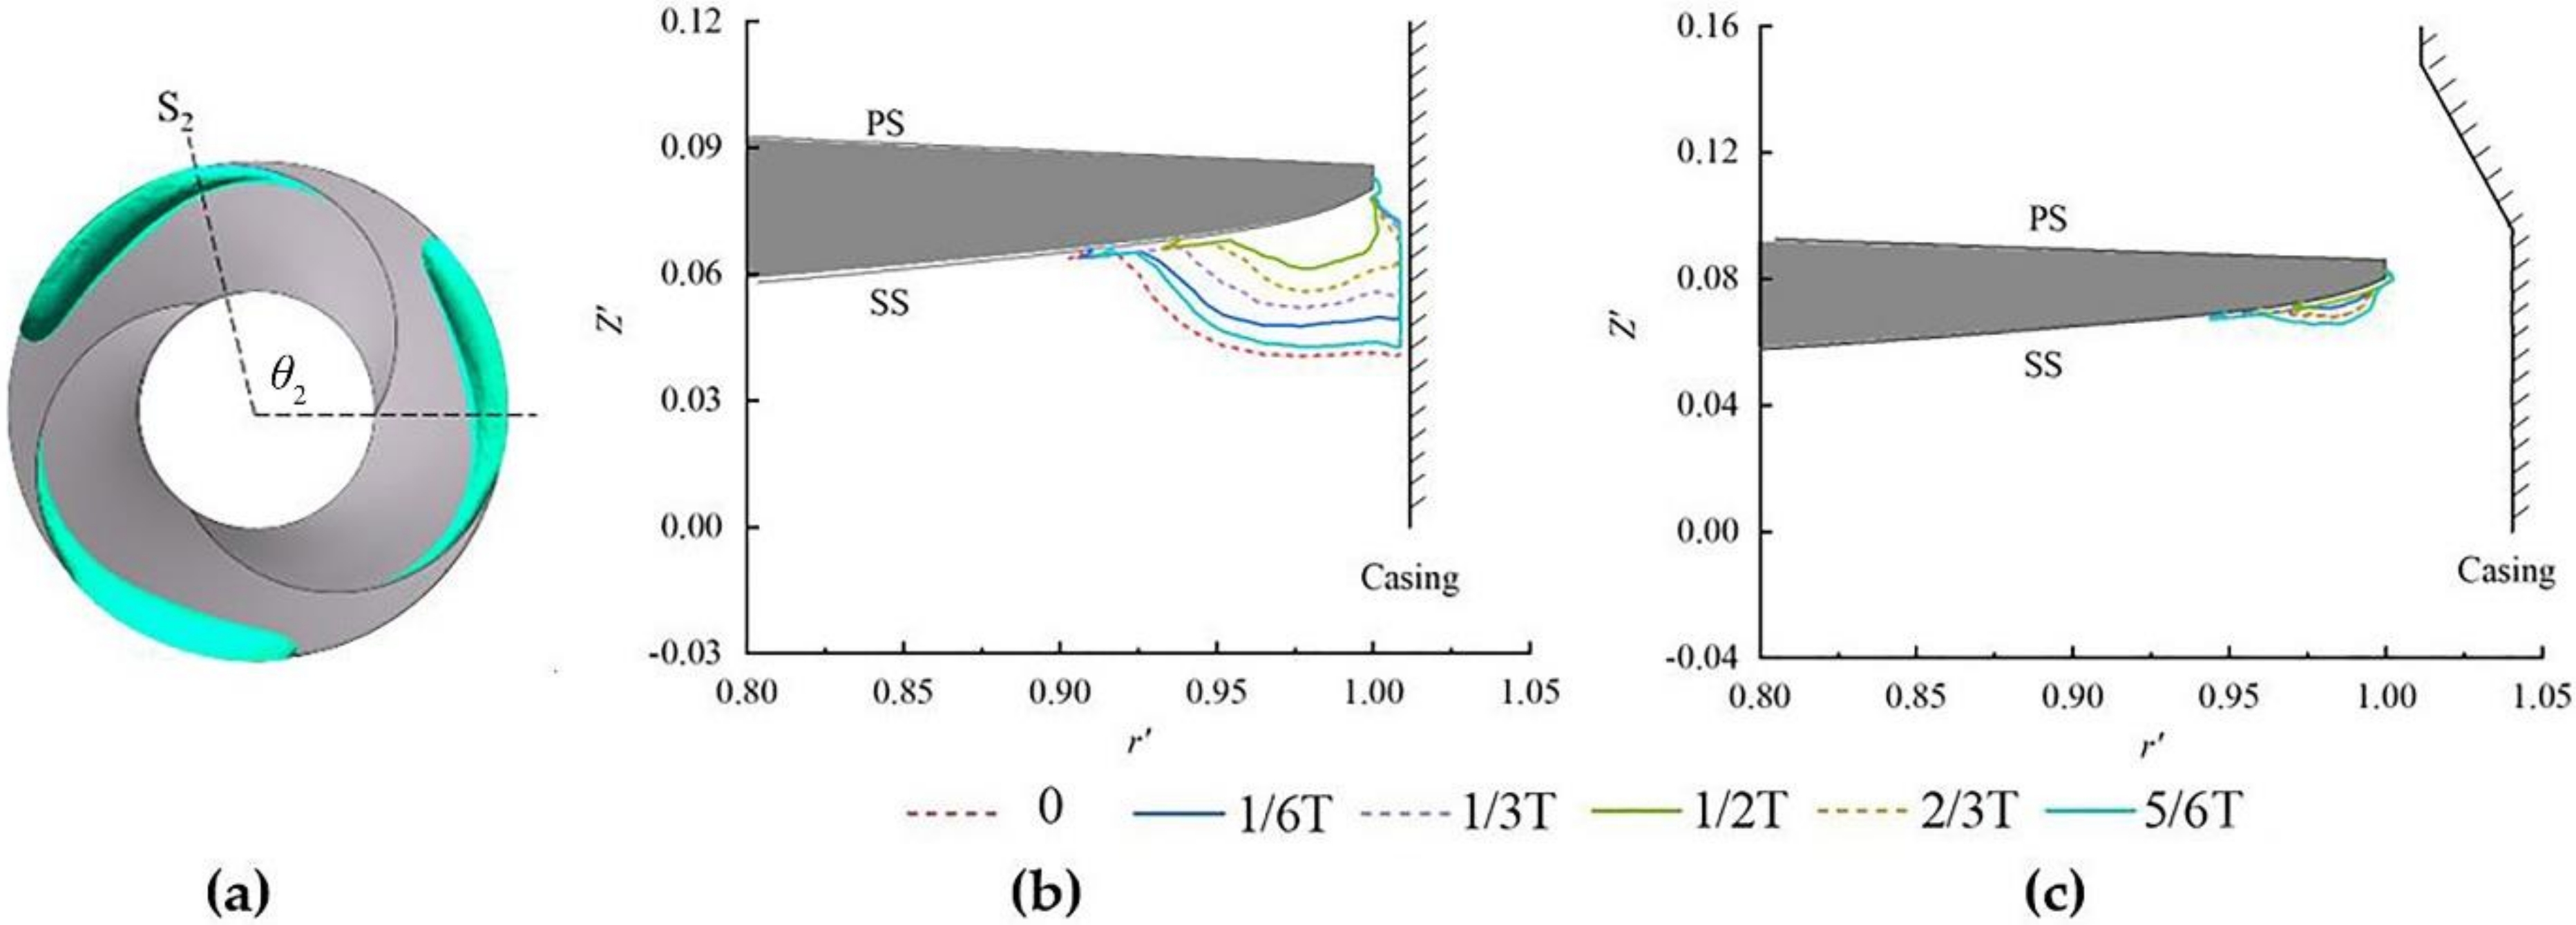
Processes 08 01103 g009
Figure 10. The variation of cavities over time at S2. (a) Schematic of S2, (b) Model O, and (c) Model OE.
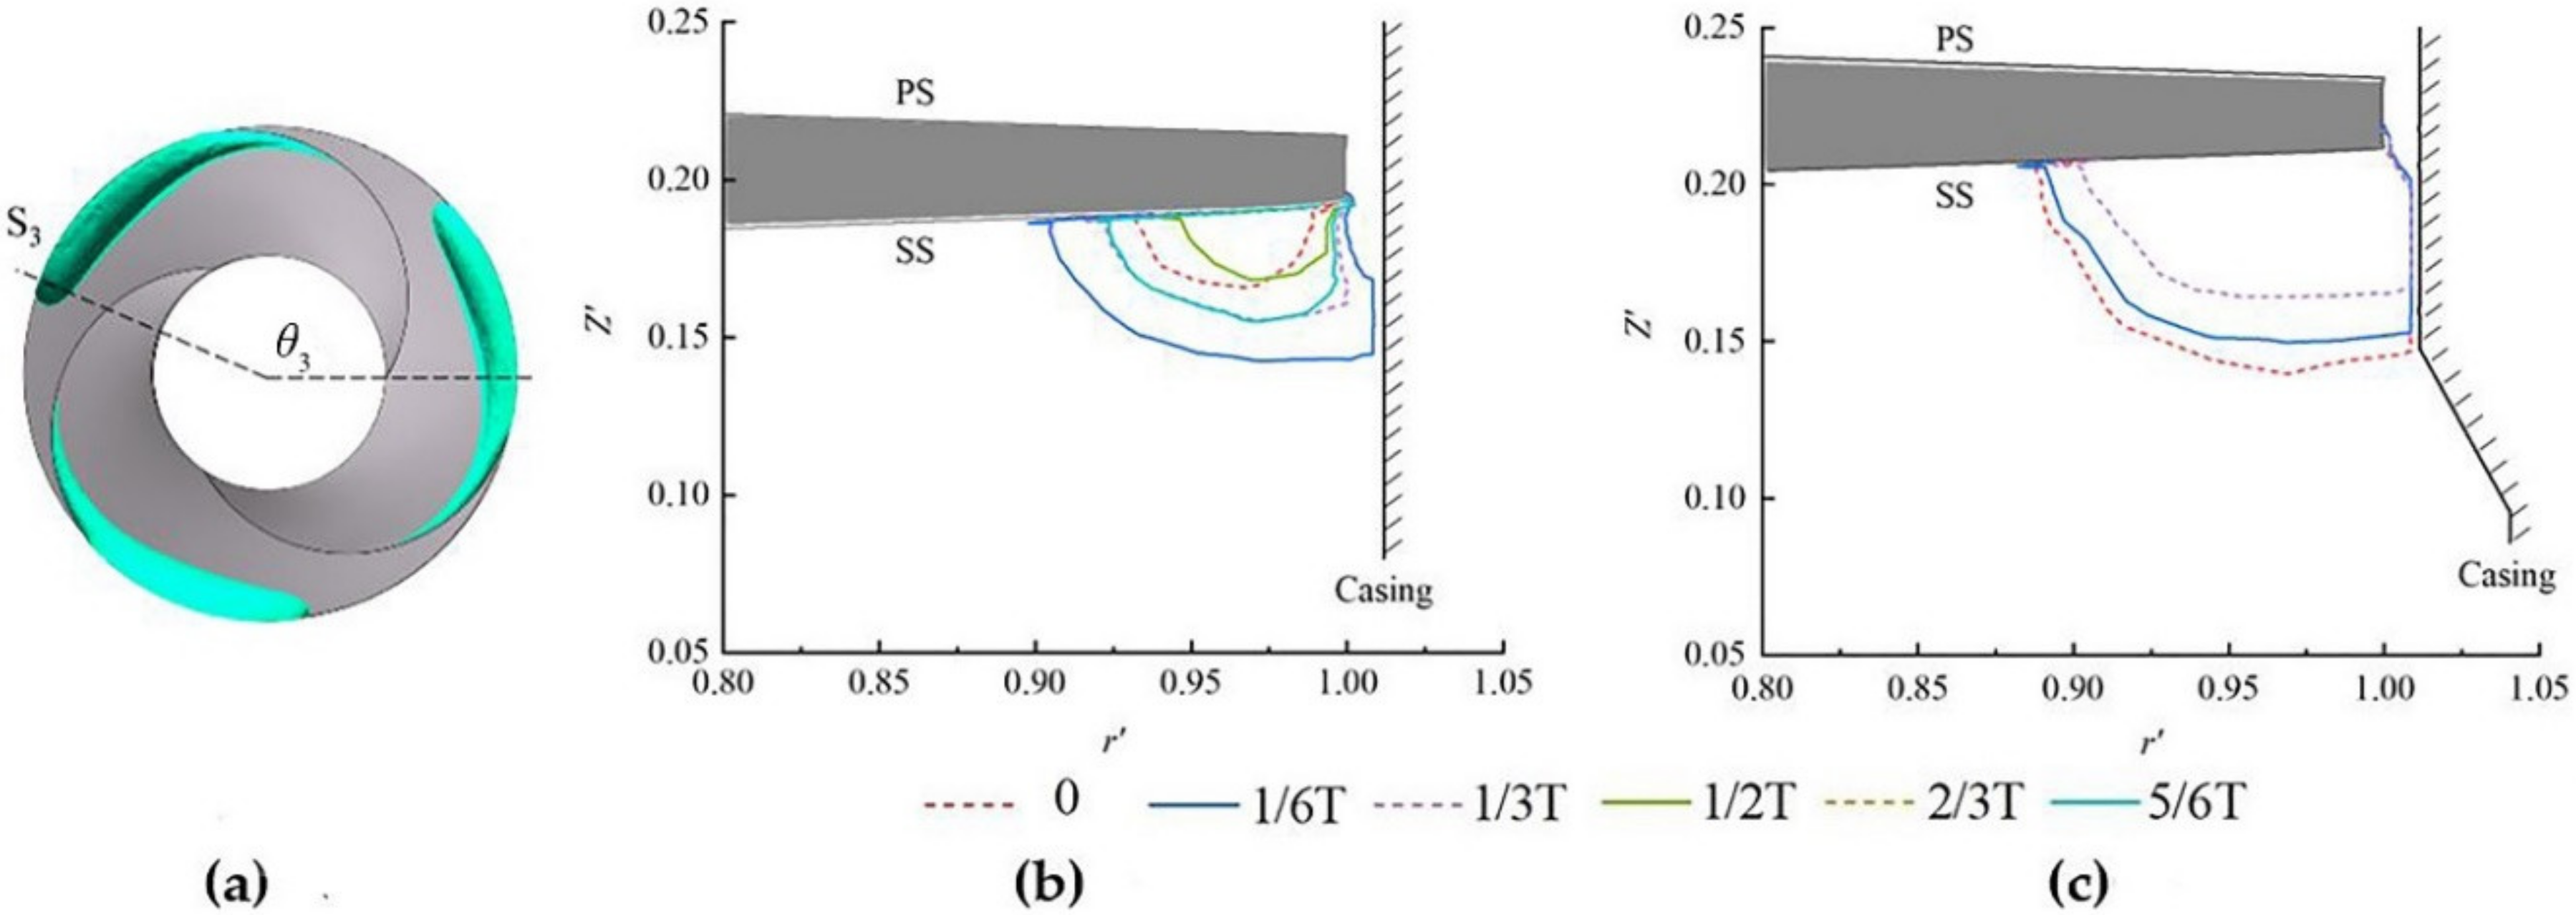
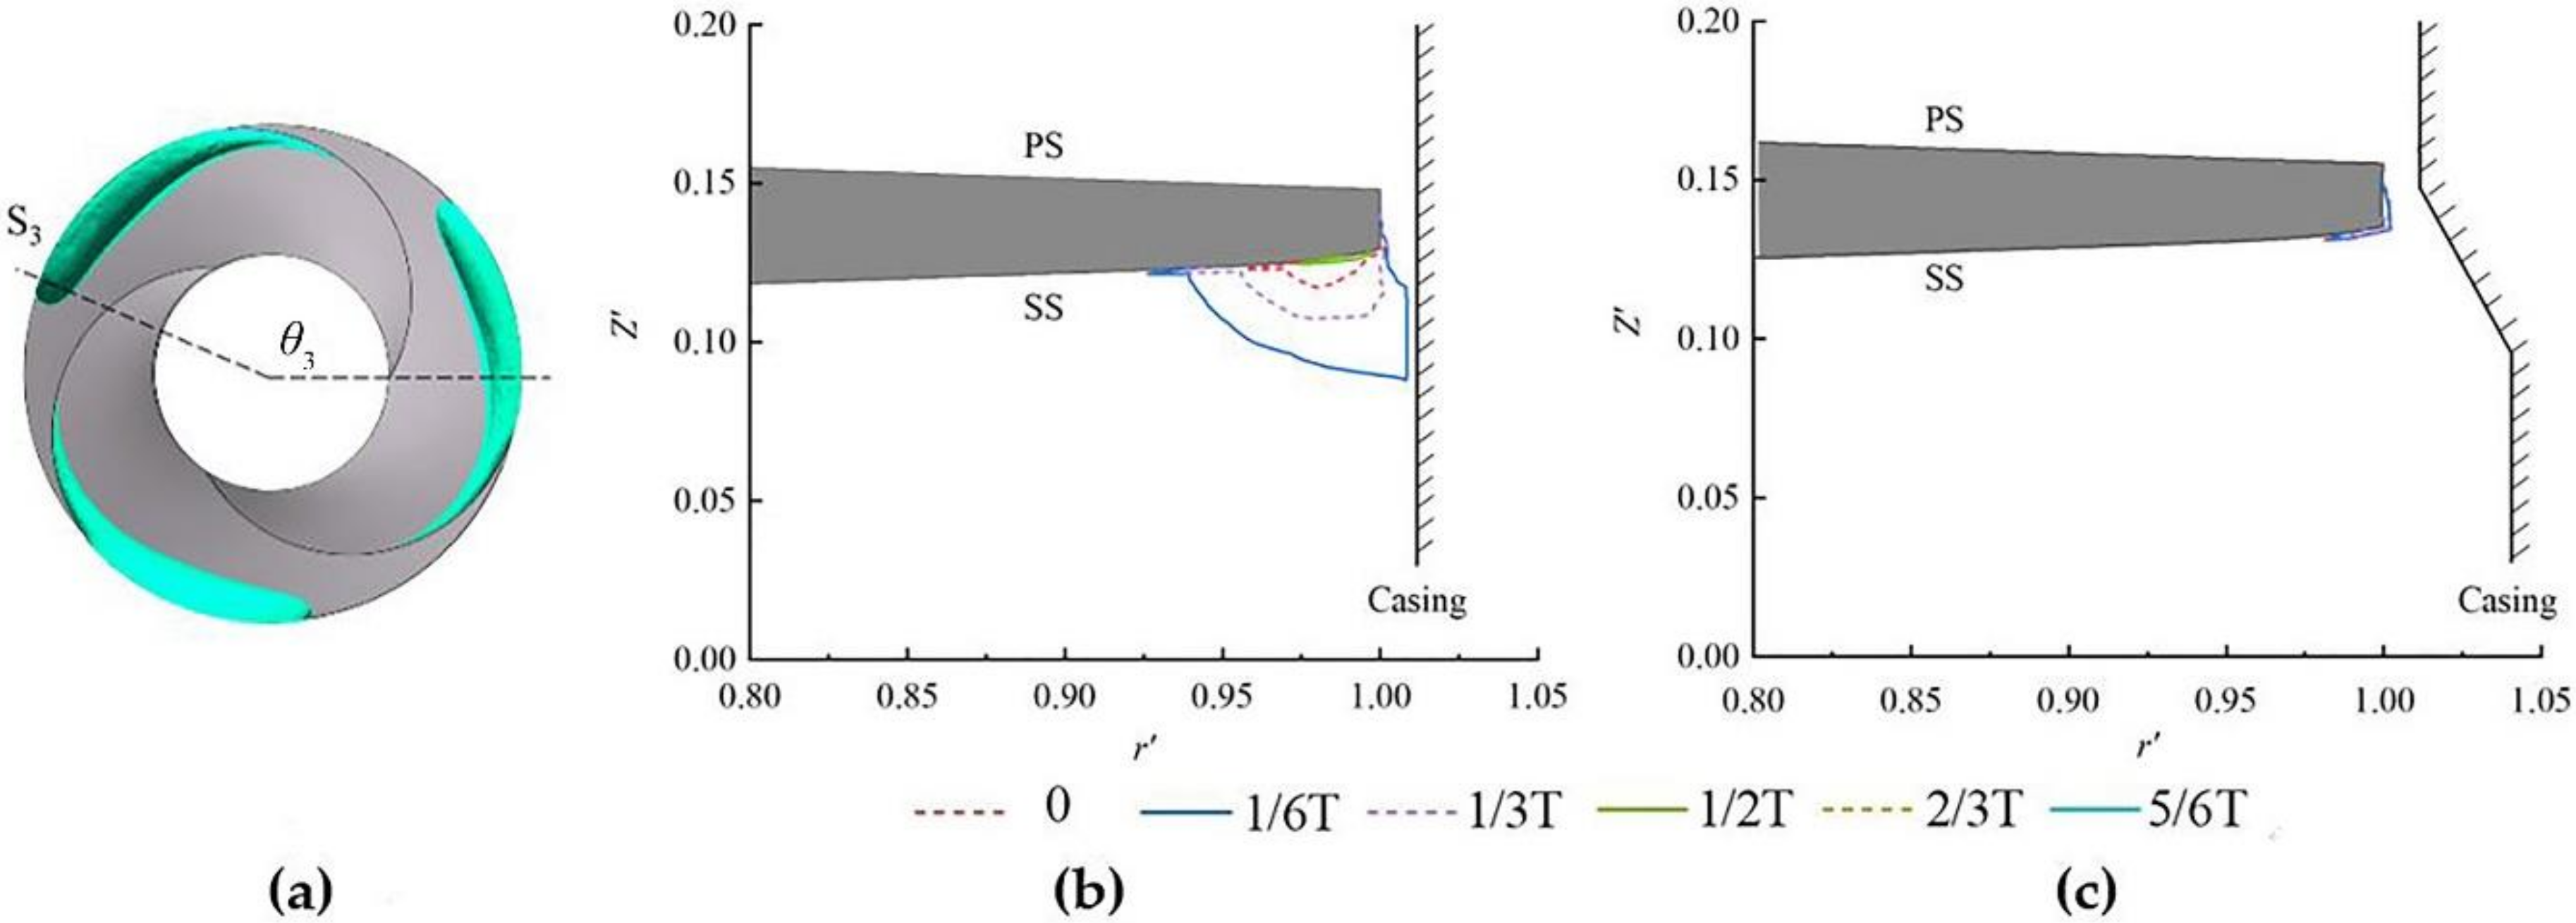
Processes 08 01103 g010
Figure 11. The variation of cavities over time at S3. (a) Schematic of S3, (b) Model O, and (c) Model OE.
Processes 08 01103 g011
Figure 12. The 3D cavity structures of (a) Model A and (b) Model AE.
Processes 08 01103 g012
Figure 13. The variation of cavities over time at S1. (a) Schematic of S1, (b) Model A, and (c) Model AE.
Processes 08 01103 g013
Figure 14. The variation of cavities over time at S2. (a) Schematic of S2, (b) Model A, and (c) Model AE.
Processes 08 01103 g014
Figure 15. The variation of cavities over time at S3. (a) Schematic of S3, (b) Model A, and (c) Model AE.
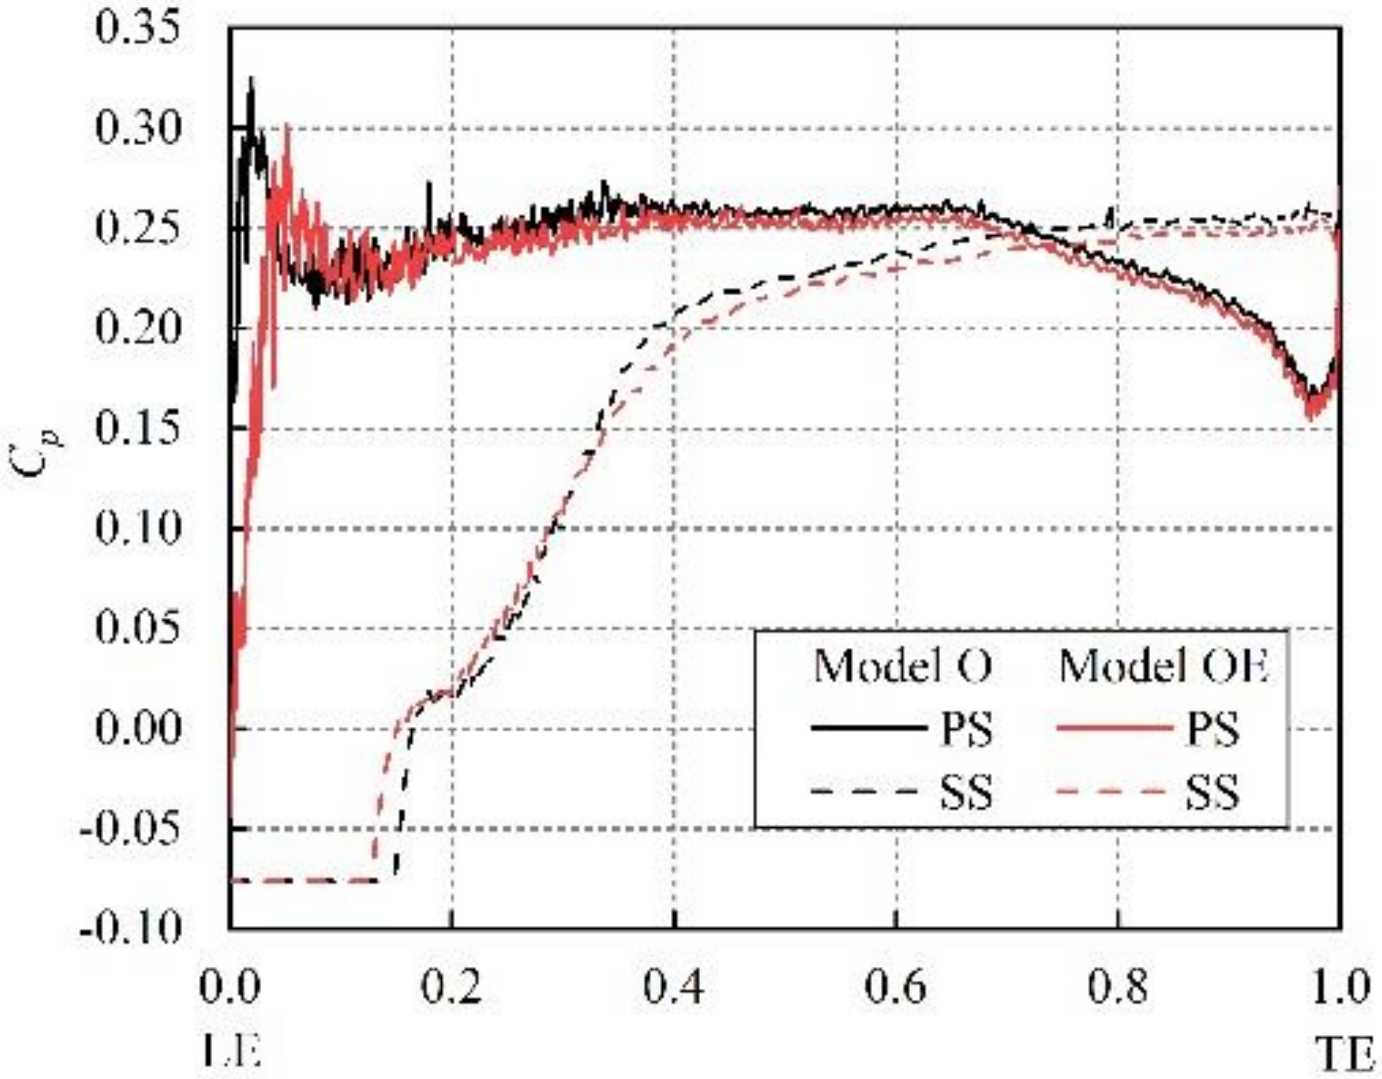
Processes 08 01103 g015
Figure 16. Blade loading along the streamwise direction at a 95% span for a certain blade in Models O and OE.
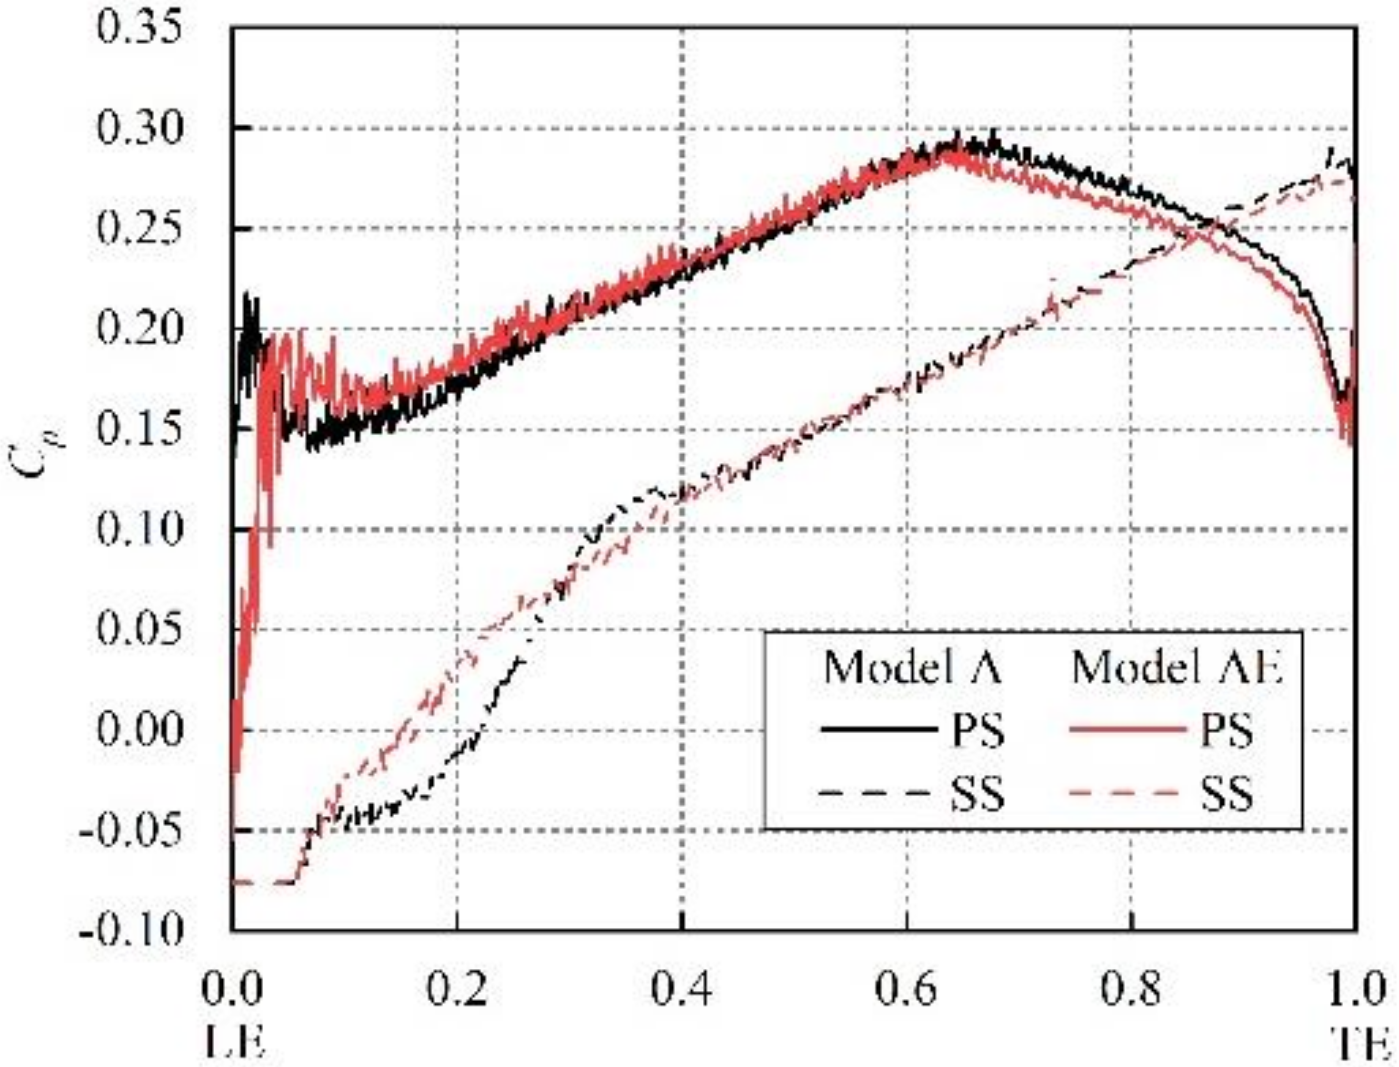
Processes 08 01103 g016
Figure 17. Blade loading along the streamwise direction at a 95% span for a certain blade in Models A and AE.
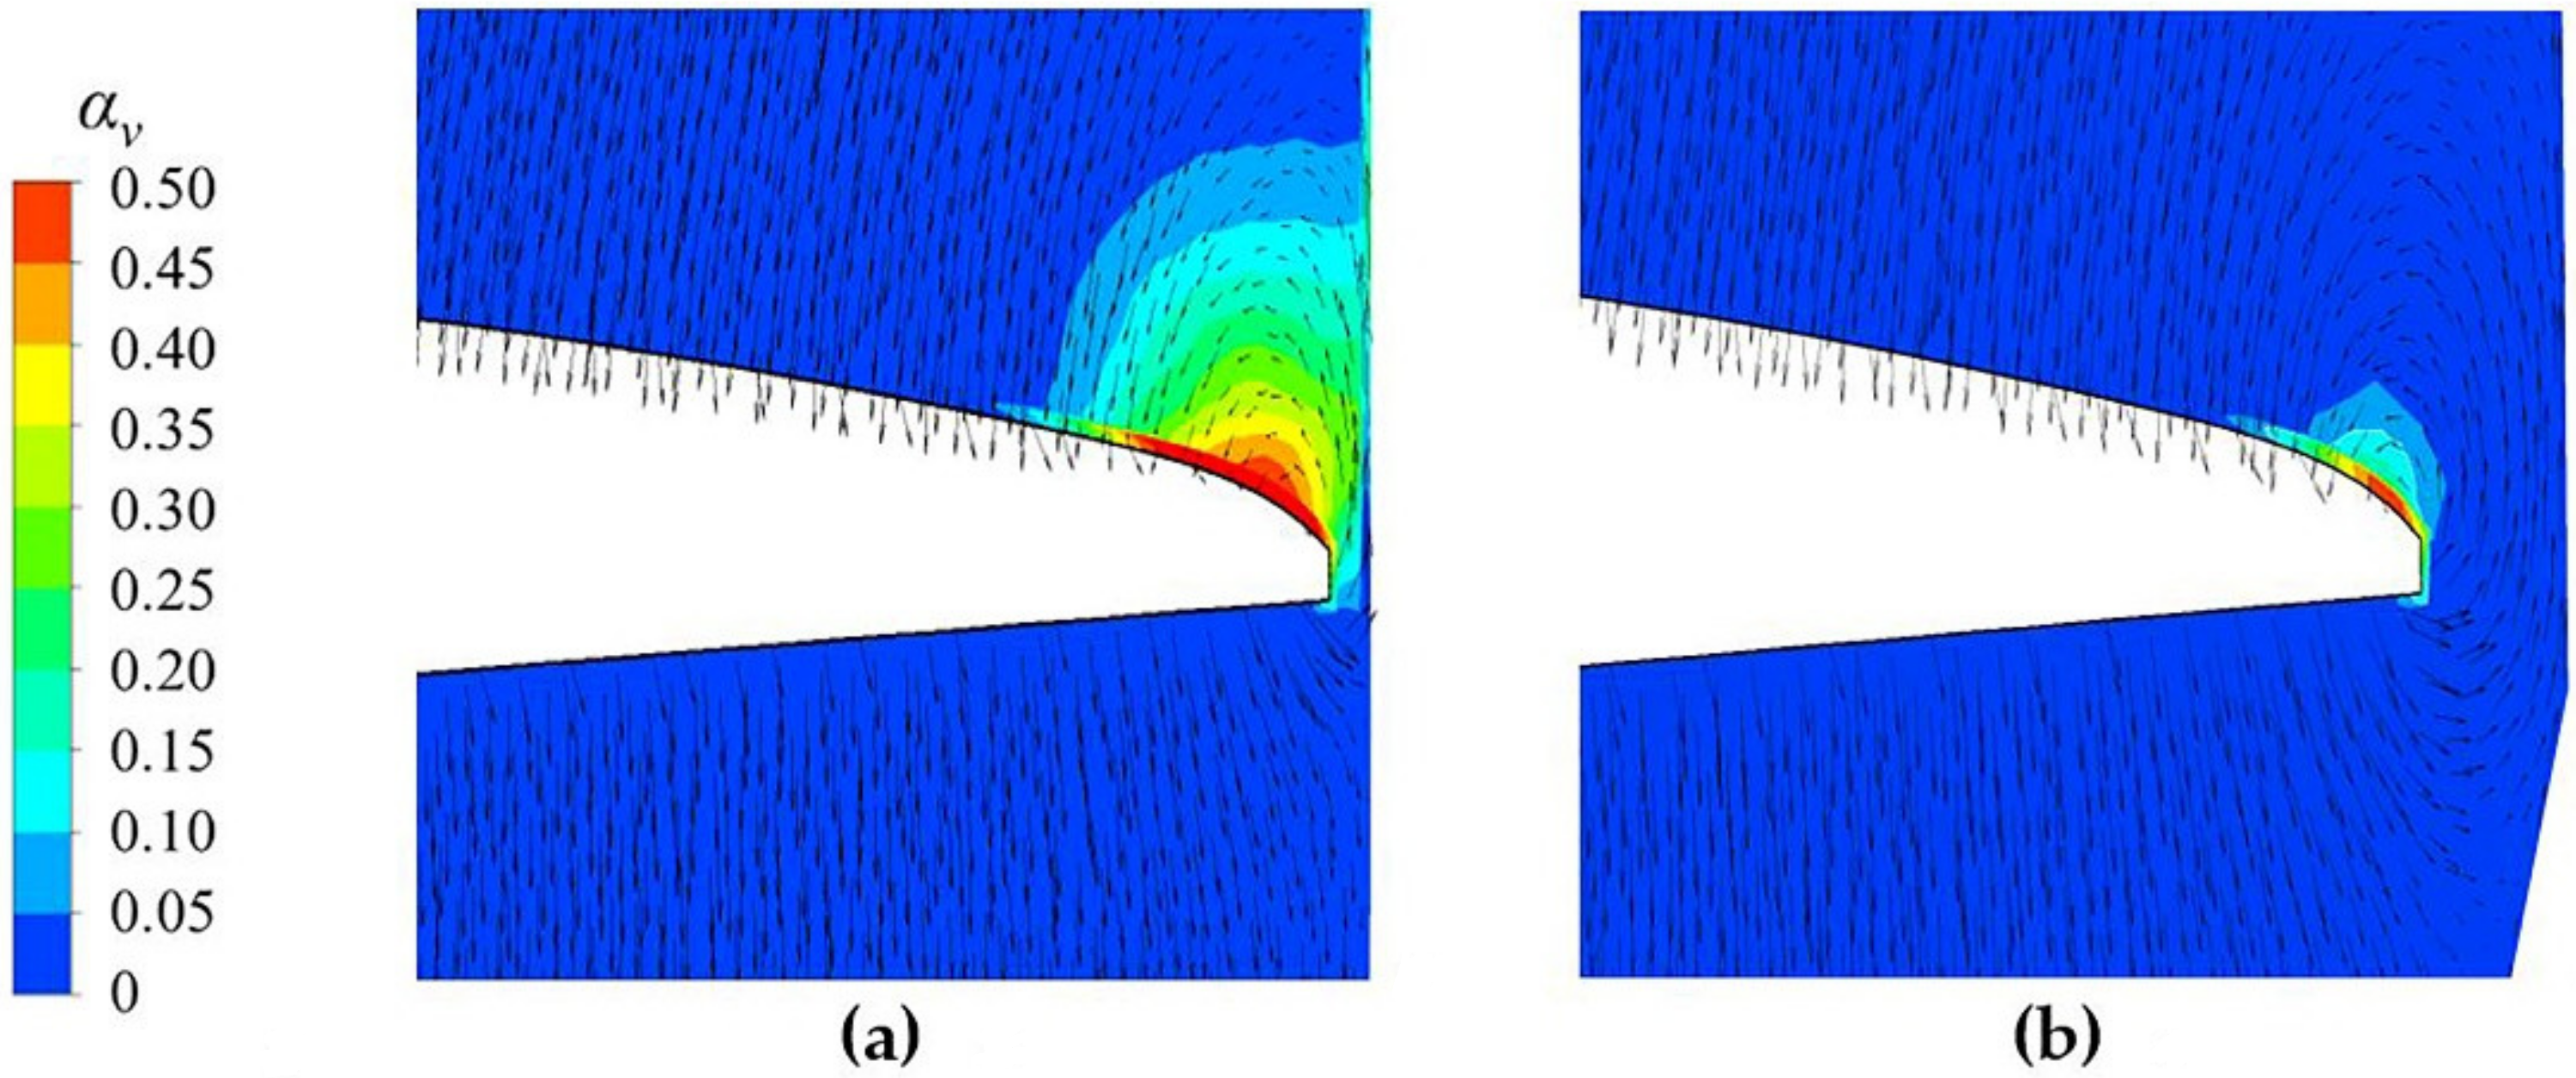
Processes 08 01103 g017
Figure 18. Flow fields at S2. (a) Model O and (b) Model OE.
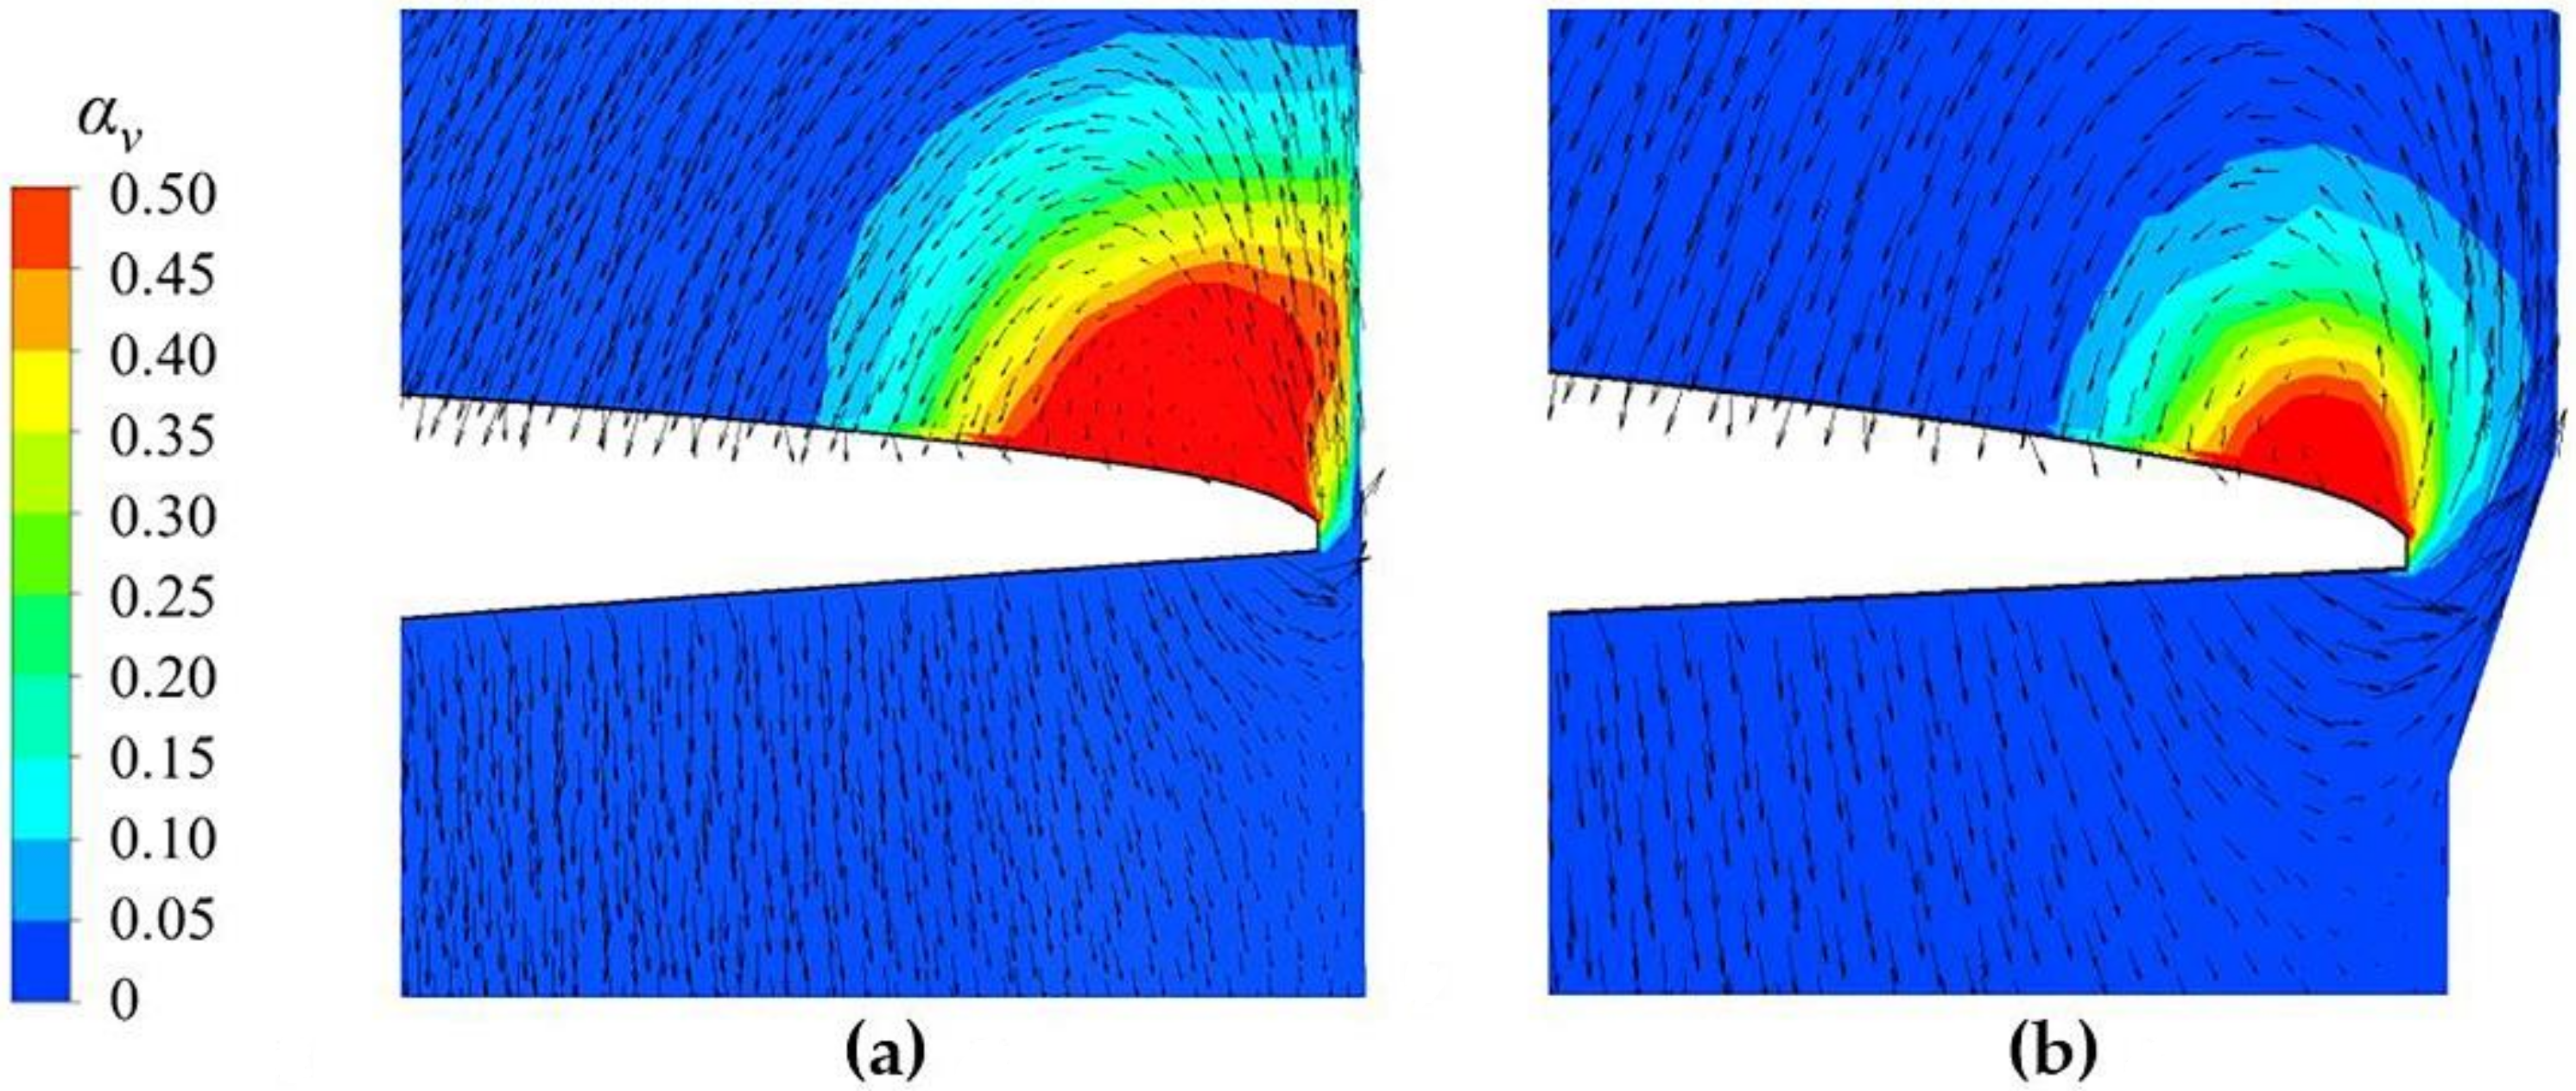
Processes 08 01103 g018
Figure 19. Flow fields at S2. (a) Model A and (b) Model AE.
Processes 08 01103 g019
Table 1. Geometrical parameters of the cases with the equal pitch inducer.
ModelInlet Blade Angle β1Outlet Blade Angle β2Pitch VariationCasing Geometry
OββConstantStraight
OEββConstantStep
Table 2. Geometrical parameters of the cases with the varying pitch inducer.
ModelInlet Blade Angle β1Outlet Blade Angle β2Pitch VariationCasing Geometry
Aβ − 1.8°β + 0.6°LinearStraight
AEβ − 1.8°β + 0.6°LinearStep
Table 3. Geometrical parameters of the studied inducers.
ModelRegionθΔθr)maxz)max
OI75°~85°10°11.9%13.5%
II85°~160°75°
OEI80°~90°10°19.8%11.1%
II90°~170°80°
Table 4. Geometrical parameters of the studied inducers.
ModelRegionθΔθr)maxz)max
AI75°~93°18°11.9%9.0%
II93°~146°53°
AEI80°~150°70°4.1%6.8%
Table 5. Characteristic parameters of clearance flow in the cases with the equal pitch inducer.
ModelΔp (Pa)Average Velocity at the Clearance (m/s)Leakage Flow Rate (kg/s)
O1.11 × 106−16.180.094
OE1.04 × 106−10.690.230
Table 6. Characteristic parameters of clearance flow in the cases with the varying pitch inducer.
ModelΔp (Pa)Average Velocity at the Clearance (m/s)Leakage Flow Rate (kg/s)
A8.40 × 105−7.450.045
AE6.70 × 105−1.330.070

