Article

Technical Route to Achieve Ultra-Low Emission of Nitrogen Oxides with Predictive Model of Nitrogen Oxide Background Concentration

College of Materials Science and Engineering, Xi’an University of Architecture and Technology, Xi’an 710055, China
*
Author to whom correspondence should be addressed.
Processes 2020, 8(9), 1104; https://doi.org/10.3390/pr8091104
Submission received: 30 June 2020 / Revised: 1 September 2020 / Accepted: 3 September 2020 / Published: 4 September 2020
(This article belongs to the Special Issue Progress in Energy Conversion Systems and Emission Control)

Abstract

:
As the most mature denitration technology in the cement clinker burning process, selective non-catalytic reduction (SNCR) has been unable to meet the requirements of ultra-low nitrogen oxide (NOX) emissions under low ammonia escape, thus a hybrid denitration process based on SNCR was established. The process had three steps: reducing the NOX background concentration (NBC), implementing staged combustion, and optimizing the effect of the SNCR. One of the keys to this process was the real-time acquisition of the NBC. In this paper, a multivariate linear regression model for the prediction of NBC was constructed and applied to one 12,000 t/d production line and one 5000 t/d production line. For the 12,000 t/d production line, NBC had a positive correlation with the temperature of the calciner outlet, the pressure, and the temperature of the kiln hood, and it had a negative correlation with the quantity of the kiln coal, the temperature of the smoke chamber, and the main motor current of the kiln. The influence degree of each parameter on the NBC is gradually weakened according to the above order. The determination coefficient (R2) of the model was 0.771, and the mean absolute error and maximum relative error between the predicted and measured NBC were 6.300 mg/m3 and 18.670 mg/m3 respectively.

1. Introduction

Most cement enterprises in China use coal as fuel in the cement clinker burning process, and a large number of pollutants, such as NOX, smoke dust, and sulfur oxide, are released during coal combustion [1], making the cement industry the third largest source of NOX emissions after electric power and motor vehicles in China [2]. Cement enterprises generally rely on end-of-pipe control methods to control NOX pollution, such as the selective non-catalytic reduction (SNCR) process, the selective catalytic reduction (SCR) process, and staged combustion, of which SNCR is the most widely used [3,4]. SNCR uses ammonia or urea as the reductant to remove NOX from the flue gas [4], and the reductant flow is controlled by proportional–integral and derivative control based on the difference between the measured and target values of NOX. Influenced by factors such as large consumption of inertia, long delays, and multiple disturbances during the cement clinker burning process [5,6,7], the denitration effects of SNCR systems are not stable, and the NOX emission index may exceed the standard in a short period of time. The target NOX emission value for SNCR in many enterprises is usually set below the allowable value [7], and the continuous control of NOX emissions is guaranteed by the excessive use of reducing agents. This results in a significant increase in the denitration costs, and the excessive reductant discharged with the flue gas will further cause the “ammonia escape” phenomenon, which triggers new issues, such as the blocking of cloth bags and preheaters, the corrosion of equipment, and the over-standard discharge of fine particles [8].
Provinces of China, such as Henan and Shandong, have proposed the concept of ultra-low emissions, with the emission index of NOX limited to 100 or even 50 mg/m3 [9]. Increasing the amount of reductant in the SNCR process will only aggravate ammonia escape and will not benefit the ultra-low emissions. Some scholars proposed to use biomass for NOX denitrification in cement production, for instance, Shu Yun [10] adopted three biomass samples: rice husk, sawdust and corncob by reburning to reduce NOX under different conditions in a fixed-bed reactor, and the maximum NOX reduction efficiency could reach 57.0 ± 2.1%, Wang Yali [11] used bamboo charcoal and the best initial denitrification rate could reach 98.906 %. However, it should be noted that biomass denitrification is not widely used in cement production, and the actual application effect is still to be verified. Using SCR instead of SNCR to improve the denitration efficiency through catalyst intervention can achieve ultra-low emissions. However, in practical applications, due to the influence of high-dust and low-temperature conditions, the service life and catalytic effect of the catalyst must be further improved [9], and the high cost of SCR is also unappealing to most cement enterprises. Thus, in this paper, a comprehensive measure with optimized working condition parameters is proposed. Staged combustion technology was adopted, and an SNCR control strategy with a “soft sensor” was optimized to realize ultra-low emissions. Furthermore, the modeling of NOX emissions is introduced.

2. Cement Clinker Burning Process and NOX Formation Mechanism

The cement clinker burning process starts from raw material entering the preheater and ends at the grate cooler after the calcined clinker is rapidly cooled. The main equipment includes a preheater, calciner, rotary kiln, and grate cooler, as shown in Figure 1. The raw material after exchanging heat with the hot flue gas discharged from the calciner in the preheater enters the calciner to carry out most of the decomposition of calcium carbonate. The heat needed for the reaction is mainly provided by the tertiary air from the grate cooler, the hot flue gas discharged from smoke chamber of the rotary kiln, and the combustion heat of pulverized coal fed into the calciner. The decomposed material enters the rotary kiln to complete the follow-up solid-phase reaction and form clinker under the heat released by the combustion of pulverized coal in the kiln and the continuous rotation of the rotary kiln. Finally, the clinker enters the subsequent unit after rapid cooling in the grade cooler. The chemical reactions needed for the formation of the cement clinker mainly occur in the calciner and rotary kiln, as does the formation of NOX.
The nitrogen oxide generated in the cement clinker burning process is mainly divided into thermal-NOX and fuel-NOX [12], wherein thermal-NOX refers to the NOX generated by the oxidation of N2 in the air at high temperatures, and fuel-NOX refers to the NOX generated by the oxidation of nitrogen compounds contained in the fuel entering the cement clinker burning system after thermal decomposition in the combustion process [3]. Thermal-NOX is mainly generated in the rotary kiln, and its generation is mainly affected by the calcination temperature, followed by the concentrations of O2 and N2 and their residence time in the kiln, according to the Zeldovich theory. In contrast, fuel-NOX can be generated in both the calciner and rotary kiln. Its generation is mainly affected by the consumption and properties [13,14,15,16,17,18] of the fuel, such as the volatile matter, nitrogen content, calorific value, and fixed carbon. Fuel-NOX generation is closely related to the combustion conditions, such as the temperature and oxygen concentration [3]. It should also be noted that incomplete combustion of the fuel will occur when the air volume into the system is less than the required volume or the properties of the fuel are poor. In this case, reductive CO gas will be generated, and the following chemical reaction will occur to cause the reduction of NOX:
NO + CO = 1 2 N 2 + CO 2

3. Technology Route of NOX Ultra-Low Emission

The NOX emission index is an environmental protection ordinance ( C NO Xp ), and the actual NOX content in flue gas ( C NO Xs ) can be converted as follows:
C NO Xp =   C NO Xs 21 10 / 21 O 2
where O2 represents the actual oxygen content (%) in the exhaust flue gas of the burning system; its value is mostly controlled at about 1% in actual production. According to Equation (2), when only SNCR is adopted and its denitration efficiency reaches 60% (its actual efficiency is 40–60% [9]), the NOX background concentration (NBC) during the burning process should be controlled to within 454.4 mg/m3. At this NBC, the NOX content in the exhaust flue gas of a burning system after denitration can be lower than 181.8 mg/m3, and an ultra-low emission index of 100 mg/Nm3 can be achieved. Unfortunately, field measurements of several domestic production lines show that the mean value of the NBC can reach about 1200 mg/m3. Therefore, measures must be taken to reduce the NOX background concentration.
The realization of ultra-low emissions cannot be achieved at the cost of increasing the ammonia escape. Ammonia escape is caused by an excess amount of reductant, and the reductant flow is theoretically determined by the NBC. Thus, ammonia escape can be reduced by precise control of the reductant based on the real-time acquisition of the NBC.
The following implementation routes of ultra-low emissions based on SNCR are formulated in this paper:

3.1. Reduction of NOX Background Concentration

Coal properties and clinker production capacity are relatively stable in most cement enterprises, and the approaches for reducing the NOX background concentration include reducing the unit coal consumption and optimizing the burning parameters that affect the NBC. Heat consumption can be reduced by means of a technological transformation, such as equipment upgrading and process modifications. Heat consumption can also be slightly improved by the optimization of the burning parameters, which refers to determining and optimizing the key parameters affecting the background concentration of NOX based on the NOX generation mechanism. For specific enterprises, whether to carry out technical modifications and which modification mode to use should be determined by the existing process and the configuration of the main equipment.
The first prerequisite of the optimization of the burning parameters is to find the key parameters, which can be divided into the following four categories according to NOX generation mechanism and the distribution of the distributed control system (DCS) signals in cement enterprises.
1.
Fuel consumption
Fuel consumption refers to the sum of the kiln and calciner coal, which can be obtained from the flow metering equipment (① and ② in Figure 1).
2.
Calcination temperature
The calcination temperature includes the calcination temperature in the rotary kiln and calciner. The temperature of the calciner refers to the outlet temperature of the calciner (③ in Figure 1), and the temperature of the rotary kiln can be calculated [19] based on the volume of the secondary air, the temperature of the secondary air (refers to the temperature of the kiln hood, ⑥ in Figure 1), the temperature of the smoke chamber (④ in Figure 1), the temperature of the raw material fed into the kiln (same value as the outlet temperature of the calciner), in which the volume of the secondary air can be indirectly determined from the pressure of the kiln hood (⑧ in Figure 1), and the pressure of the smoke chamber (⑦ in Figure 1).
An experienced operator in a cement plant also evaluates the temperature of the rotary kiln based on the temperature of the secondary and tertiary air (⑤ in Figure 1), as well as the current of the kiln motor (⑨ in Figure 1): larger values of the current and temperatures of the secondary and tertiary air usually correspond to higher rotary kiln temperatures.
3.
Gas concentration
The gas concentration in the rotary kiln can be calculated based on the volume of secondary air and the consumption of kiln coal. The gas concentration in the calciner can be calculated based on the sum of the consumption of the kiln coal and calciner coal and the volume of the system air, among which the volume of the system air can be determined based on the speed of the high temperature fan (⑪ in Figure 1).
4.
Combustion efficiency of coal
The combustion efficiency of the coal can be obtained by the CO concentration detected by the gas analyzer at the outlet of the preheater (⑩ in Figure 1). The key burning parameters affecting the background concentration of NOX and their corresponding DCS signal are summarized in Table 1.
Being affected by differences in the process, the production scale, and the equipment in the production lines, the parameter values vary. Even for two identical production lines, key parameters affecting the NBC would be different due to the distinct nature of the raw materials and fuel. For a specific production line, the key parameters can be identified by secondary screening based on the Pearson correlation coefficient after obtaining the signals of the parameters in Table 1. Details of the secondary screening are presented in Section 6.3 in this article.

3.2. Implementation of Staged Combustion

Staged combustion is usually implemented at the bottom of the calciner, where the evolution of fuel nitrogen from the coal under oxygen-starved conditions leads to N2 formation without NO as an intermediate thus to reduce the NBC. The denitration efficiency of staged combustion can reach 30–50%. Staged combustion can be realized by the classification of both coal and air, and the specific scheme must be designed based on the specific circumstances of the production line.

3.3. Optimization of Selective Non-Catalytic Reduction (SNCR)

The optimization of the SNCR includes the optimization of the hardware and the software. Hardware optimization refers to the improvement of the structure and the installation location of the reductant spray gun. Optimization is conducted using advanced instruments and theoretical analysis to improve the reaction efficiency between the reductant and NOX. Software optimization in this paper refers to the precise online control strategy based on the real-time acquisition of the NBC. Before the implementation of a precise online control strategy based on the NBC, the actual denitration efficiency of the current SNCR should be accurately determined, which can be obtained by the NOX concentration of the flue gas before and after denitration.

4. Previous Models of NOX Background Concentration (NBC)

As measures to reduce the heat consumption of the clinker burning, staged combustion and the optimization of the SNCR hardware have been widely used in practice. For instance, taking advantage of high solid–gas ratio suspension-preheating decomposition technology [20], the NBC could be reduced to below 600 mg/Nm3. In contrast, limited by severe conditions, such as the high temperatures and high dust content in the calciner, the feasibility of real-time measurements of the NBC with existing instruments is quite low. Accordingly, determining how to obtain the background concentration of NOX in real time becomes the primary problem to be solved.
Drawing support from soft sensor technology [21,22], a prediction model of the NBC can be established to obtain the real-time NBC from the process parameters obtained online. Prior to this study, scholars such as Lv [23], Zheng [24], Zhou [25], Jin [26], and Zhang [27] predicted NOX concentrations with soft sensor models based on support vector machine (SVM) and neural network methods. This also suggests that the prediction effect of the soft sensor is directly related to the selected model. For example, Wang [28] adopted two soft sensor models to predict the NOX concentration in a cement kiln, and the prediction effect of the neural network model was slightly better than that of the linear regression model. The key parameters affecting the NOX concentration obtained by the two models were different. Li [29] drew the conclusion that the performance of a support vector machine was better than that of a back-propagation neural network when predicting the NOX concentration in a power plant boiler.

5. Model Structure and Evaluation Index

5.1. Model Structure

A multiple linear regression model was adopted in this study to establish a predictive model for the NBC due to its simple structure and high calculation speed. A multiple linear regression model expresses the quantitative linear relationship between two or more independent variables x and one dependent variable y. In this paper, the dependent variable y refers to the NBC, which can be detected by an instrument. It was affected by non-random factors x1, x2,..., xm and a random factor ε, as follows:
y = β 0 + β 1 x 1 + β 2 x 2 + L + β m x m + ε
non-random factors refer to the process parameters that affect the NBC, such as the temperature, current, and consumption of coal. N independent measurements were carried out, and n groups of samples were obtained, which can be expressed as follows:
y 1 = β 0 + β 1 x 11 + β 2 x 12 + L + β n x 1 m + ε 1 y 2 = β 0 + β 1 x 21 + β 2 x 22 + L + β n x 2 m + ε 2 y n = β 0 + β 1 x n 1 + β 2 x n 2 + L + β n x nm + ε n
parameters ε1, ε2,..., εn were independent of each other, and β0, β1,..., βm in Equation (3) were unknown parameters, which were estimated by the classical least squares method. The resulting linear model can be expressed in matrix form:
Y = X β + ε ε ~ N 1 , δ 2 I N

5.2. Evaluation Index

  • Pearson correlation coefficient
Multicollinearity between the process parameters must be guaranteed to be weak to avoid the distortion of the model caused by the high correlation between process parameters. The Pearson correlation coefficient r between two process parameters was used to measure the correlation degree between process parameter xa and process parameter xb [30,31] in this study. The formula for r is as follows:
Q x a x b = i = 1 n x ai x ¯ a x bi x ¯ b / i = 1 n x ai x ¯ a 2 i = 1 n x bi x ¯ b 2
where x a ¯ and x b ¯ are the mean values of the parameters xa and xb, respectively. The correlation degree between the process parameters can be divided into five categories based on the absolute value of r (|r|), as shown in Table 2.
2.
Determination coefficient R2
The determination coefficient of the linear regression results (R2) reflects how much of the variation of the dependent variable y can be described by the fluctuations of the independent variable x. The closer R2 is to 1, the better the effect of linear regression is. The determination coefficient R2 can be calculated as follows:
R 2 = i ( y ^ i y ¯ ) 2 i ( y i y ¯ ) 2 ,
y ¯ = 1 n i = 1 n y i ,
in Equation (7), yi is the measured value of dependent variable and y ^ i is the predicted value.
3.
Mean absolute error
The mean absolute error (MAE) was used to measure the prediction effect of the model, and it can be calculated as follows:
MAE = 1 n i = 1 n y i y ^ i ,
a smaller MAE indicates that the predicted NOX value is closer to the measured NOX value and the prediction effect is relatively better.

6. Model Development

A soft sensor model of the NOX was developed based on the actual data of a 12,000 t/d cement clinker production line. The production line is located in Anhui Province. Its actual output is 12,300 t/d, and the annual heat consumption of per clinker is 2959 kJ/kg. The production line only uses SNCR for denitration, and an aqueous ammonia solution is used as the reductant. Its injection position is near the outlet of the calciner. The local NOX index is 400 mg/m3, and the internal index of the enterprise is below 320 mg/m3.

6.1. Collection of Original Data

6.1.1. Collection of NBC

The NBC data was measured by portable flue gas analyzer (model: Testo 350), and the data collection frequency was 0.1 Hz. The measurement point was 2 m from injection position of the reductant. In consideration of the large dust content in the flue gas, a dust filter device (4 in Figure 2) was added in the middle of the gas intake pipe to prevent blocking of the analyzer.

6.1.2. Collection of Process Parameters

The data of the required process parameters was obtained through the DCS server, and its acquisition frequency was 0.1 Hz.

6.2. Data Preprocessing

Measurement of the NBC was carried out when the production line operated properly, and the collection of the process parameters was carried out synchronously. A total of 1000 sets of original data were obtained, and each set contained 11 values of the process parameters and 1 simultaneous value of the NBC. The original data were preprocessed as follows.
  • Elimination of abnormal data
The filter element at the front of the analyzer needed to be cleaned or replaced regularly due to the influence of the dust in the flue gas, which required about 3 min each time. Correspondingly, the NBC and process parameter values collected in this period were eliminated as abnormal data, and 690 sets of effective data were obtained after elimination.
2.
Mean filter
Influenced by the working principles and operating conditions of the equipment, the collected signals fluctuated regularly with certain periods. For instance, the range of current of the kiln motor is 700–850 A, and its fluctuation period was 400 s (Figure 3). The characteristics of the parameters would not be reflected accurately if an instantaneous value at one particular time was used for analysis, and the resulting model would not be representative.
Therefore, a mean filter was adopted. The window length of the mean filter was determined by the maximum fluctuation period of all the parameters, which was 40. Thus, the mean matrix A was obtained. Its first row contained the mean values of the parameters from 0 to 400 s, the second row contained the mean values of the parameters from 10 to 410 s, and so on.

6.3. Selection of Key Process Parameters

The key process parameters were mainly determined based on the Pearson coefficient. The reliability of the parameters was also considered, and main results are shown in Table 3.
(1) The quantity of the calciner coal was strongly related to the temperature of the calciner outlet and, thus, one of the two parameters needed to be eliminated. Considering that the signal reliability of the calciner coal quantity was lower than that for the temperature data, as the coal quantity often exhibited certain deviations due to the low accuracy of the metering instrument and the poor operating environment, the temperature of the calciner outlet x 3 was retained.
(2) The current of the kiln motor had a strong correlation with the temperature of the tertiary air, the speed of the high temperature fan, and the pressure of the smoke chamber. Only the current of the kiln motor was reserved for subsequent analysis, because it is one of the most important parameters in the clinker firing process. Furthermore, its reliability and accuracy were much higher than those of parameters such as the temperature and pressure.
(3) There was a strong correlation between the CO concentration at the preheater outlet and temperature of the smoke chamber. The CO concentration at the outlet of the preheater was obtained by an on-line gas analyzer, which required blowback regularly. The detection value was abnormal during blowback. Furthermore, to reduce the cost, most cement enterprises opt to use gas analyzers with low accuracies or to not use on-line analyzers. Thus, the CO concentration at the preheater outlet was eliminated as a parameter.
Based on the above analysis, the key parameters affecting the NBC of 12,000 t/d production line were finally determined to be the quantity of the head coal x 2 , the temperature of the calciner outlet x 3 , the temperature of the smoke chamber x 4 , the temperature of the kiln hood x 6 , the pressure of the kiln hood x 8 , and the current of the kiln motor x 9 .

6.4. Development of NBC Model

Taking x 2 , x 3 , x 4 , x 6 , x 8 , and x 9 as the independent variables and the NBC as the dependent variable, a matrix B with 695 rows and 4 columns was obtained. B was normalized as follows:
x norm = x x min / x max x min
where x norm is the normalized data, x is the original data, and x min and x max are the minimum and maximum values of the original data, respectively.
Considering the possible fluctuations of the working conditions, the values of x min and x max were adjusted based on the actual maximum ( x rmax ) and actual minimum ( x rmin ) of the collected data, which are shown in Table 4.
The normalized matrix C was obtained, and the first 400 rows of matrix C were selected as training data. A predictive model of the NBC was developed based on the multiple linear regression method; the main parameters are shown in Table 5 and Table 6.
The R2 of the linear regression was 0.771, and the significance F was far less than 0.001. Therefore, conclusions can be drawn that the developed model was statistically significant. According to the regression coefficient in Table 7, the regression equation for NBC in the 12,000 t/d cement clinker burning system was as follows:
y norm =   2.98 x 2 + 1.44 x 3 0.99 x 4 + 0.44 x 6 + 0.77 x 8 0.67 x 9 0.76
y = 80 y norm + 600
The comparison of the predicted NOX values using training data and the actual NOX values is shown in Figure 4.
Based on the theory of cement technology operation, the obtained model is explained as follows:
(1) The NBC was positively related with the temperature of the calciner outlet ( x 3 ), which was highly related to the amount of calciner coal. A high temperature at the calciner outlet indicated that there was a large amount of calciner coal, and thus, the NBC will increase with the increase in the fuel-NOX.
(2) Based on production experience, when the operation parameters of the grate cooler are fixed, the higher the temperature of the kiln hood, the higher the calcination temperature of the rotary kiln. Consequently, the NBC will increase due to the increase in thermal-NOX. The model showed that the NBC was positively correlated with the temperature of the kiln hood ( x 6 ).
(3) A higher pressure kiln hood indicated that a higher volume of air was in the kiln, and more thermal-NOX could be generated in the kiln according to the Zeldovich theory. Therefore, there was also a positive correlation between the pressure of the kiln hood ( x 8 ) and the NBC.
(4) A spot investigation of the production line showed that more kiln coal than the theoretical demand was provided to ensure that the content of free CaO in the clinker could be controlled stably below 0.8%. More than 3000 ppm of CO could be detected in the smoke chamber. A series of problems was introduced by the excess amount of head coal. First, the viscosity of the material in the kiln increased with the increase in the calcination temperature. Thus, the material could rise to a greater height along the inner wall of the kiln, and the rotary torque of the kiln increased, which resulted in an increase in the current of the kiln motor. Second, reductive CO produced by the incomplete combustion of the kiln coal caused the reduction of NOX generated in the kiln. Finally, the remaining CO after the denitration reaction with NOX entered the smoke chamber with hot flue gas, which also contained O2 due to the air leakage from the gap between the smoke chamber and rotary kiln. Thus, the exothermic oxidation reaction between CO and O2 could be carried out to cause the temperature of the smoke chamber to rise. The above phenomena were consistent with the conclusions from the model, i.e., the amount of kiln coal ( x 2 ), the temperature of the smoke chamber ( x 4 ), and the current of the kiln motor ( x 9 ) had negative correlations with the NBC.
The obtained model was highly consistent with the process theory and has strong interpretability. Using the last 290 sets of matrix C as test data, the values of the NBC predicted by the model and the measured values are shown in Figure 5.
The trends of the predicted values were basically consistent with those of the measured values, indicating that the model could cope with the fluctuations of the operating conditions. The MAE between the predicted and measured values of the NBC was 6.300 mg/m3, and the maximum deviation was 18.670 mg/m3 (Figure 6). The error between the maximum deviation value and the NBC was less than 3%; thus, the prediction effect of the model was good.
For different production lines, the production parameters affecting the background concentration of NOX and their influence rules may be slightly different, which means that the conclusions obtained in this paper are not applicable to all production lines. In the popularization and application of the model, the above analysis process must be repeated to ensure the reliability of the results.

7. Modeling in One 5000 t/d Production Line

NBC prediction modeling was also carried out in one 5000 t/d production line in Guangxi Province according to the same method and process as in Section 5. The production line adopts “XDL cement clinker calcination technology”, its actual output is 6351 t/d, and the annual heat consumption of per clinker is 2828 kJ/kg. Denitration measures and emission control indicators of this 5000 t/d production line are the same as those of 12,000 t/d production line.
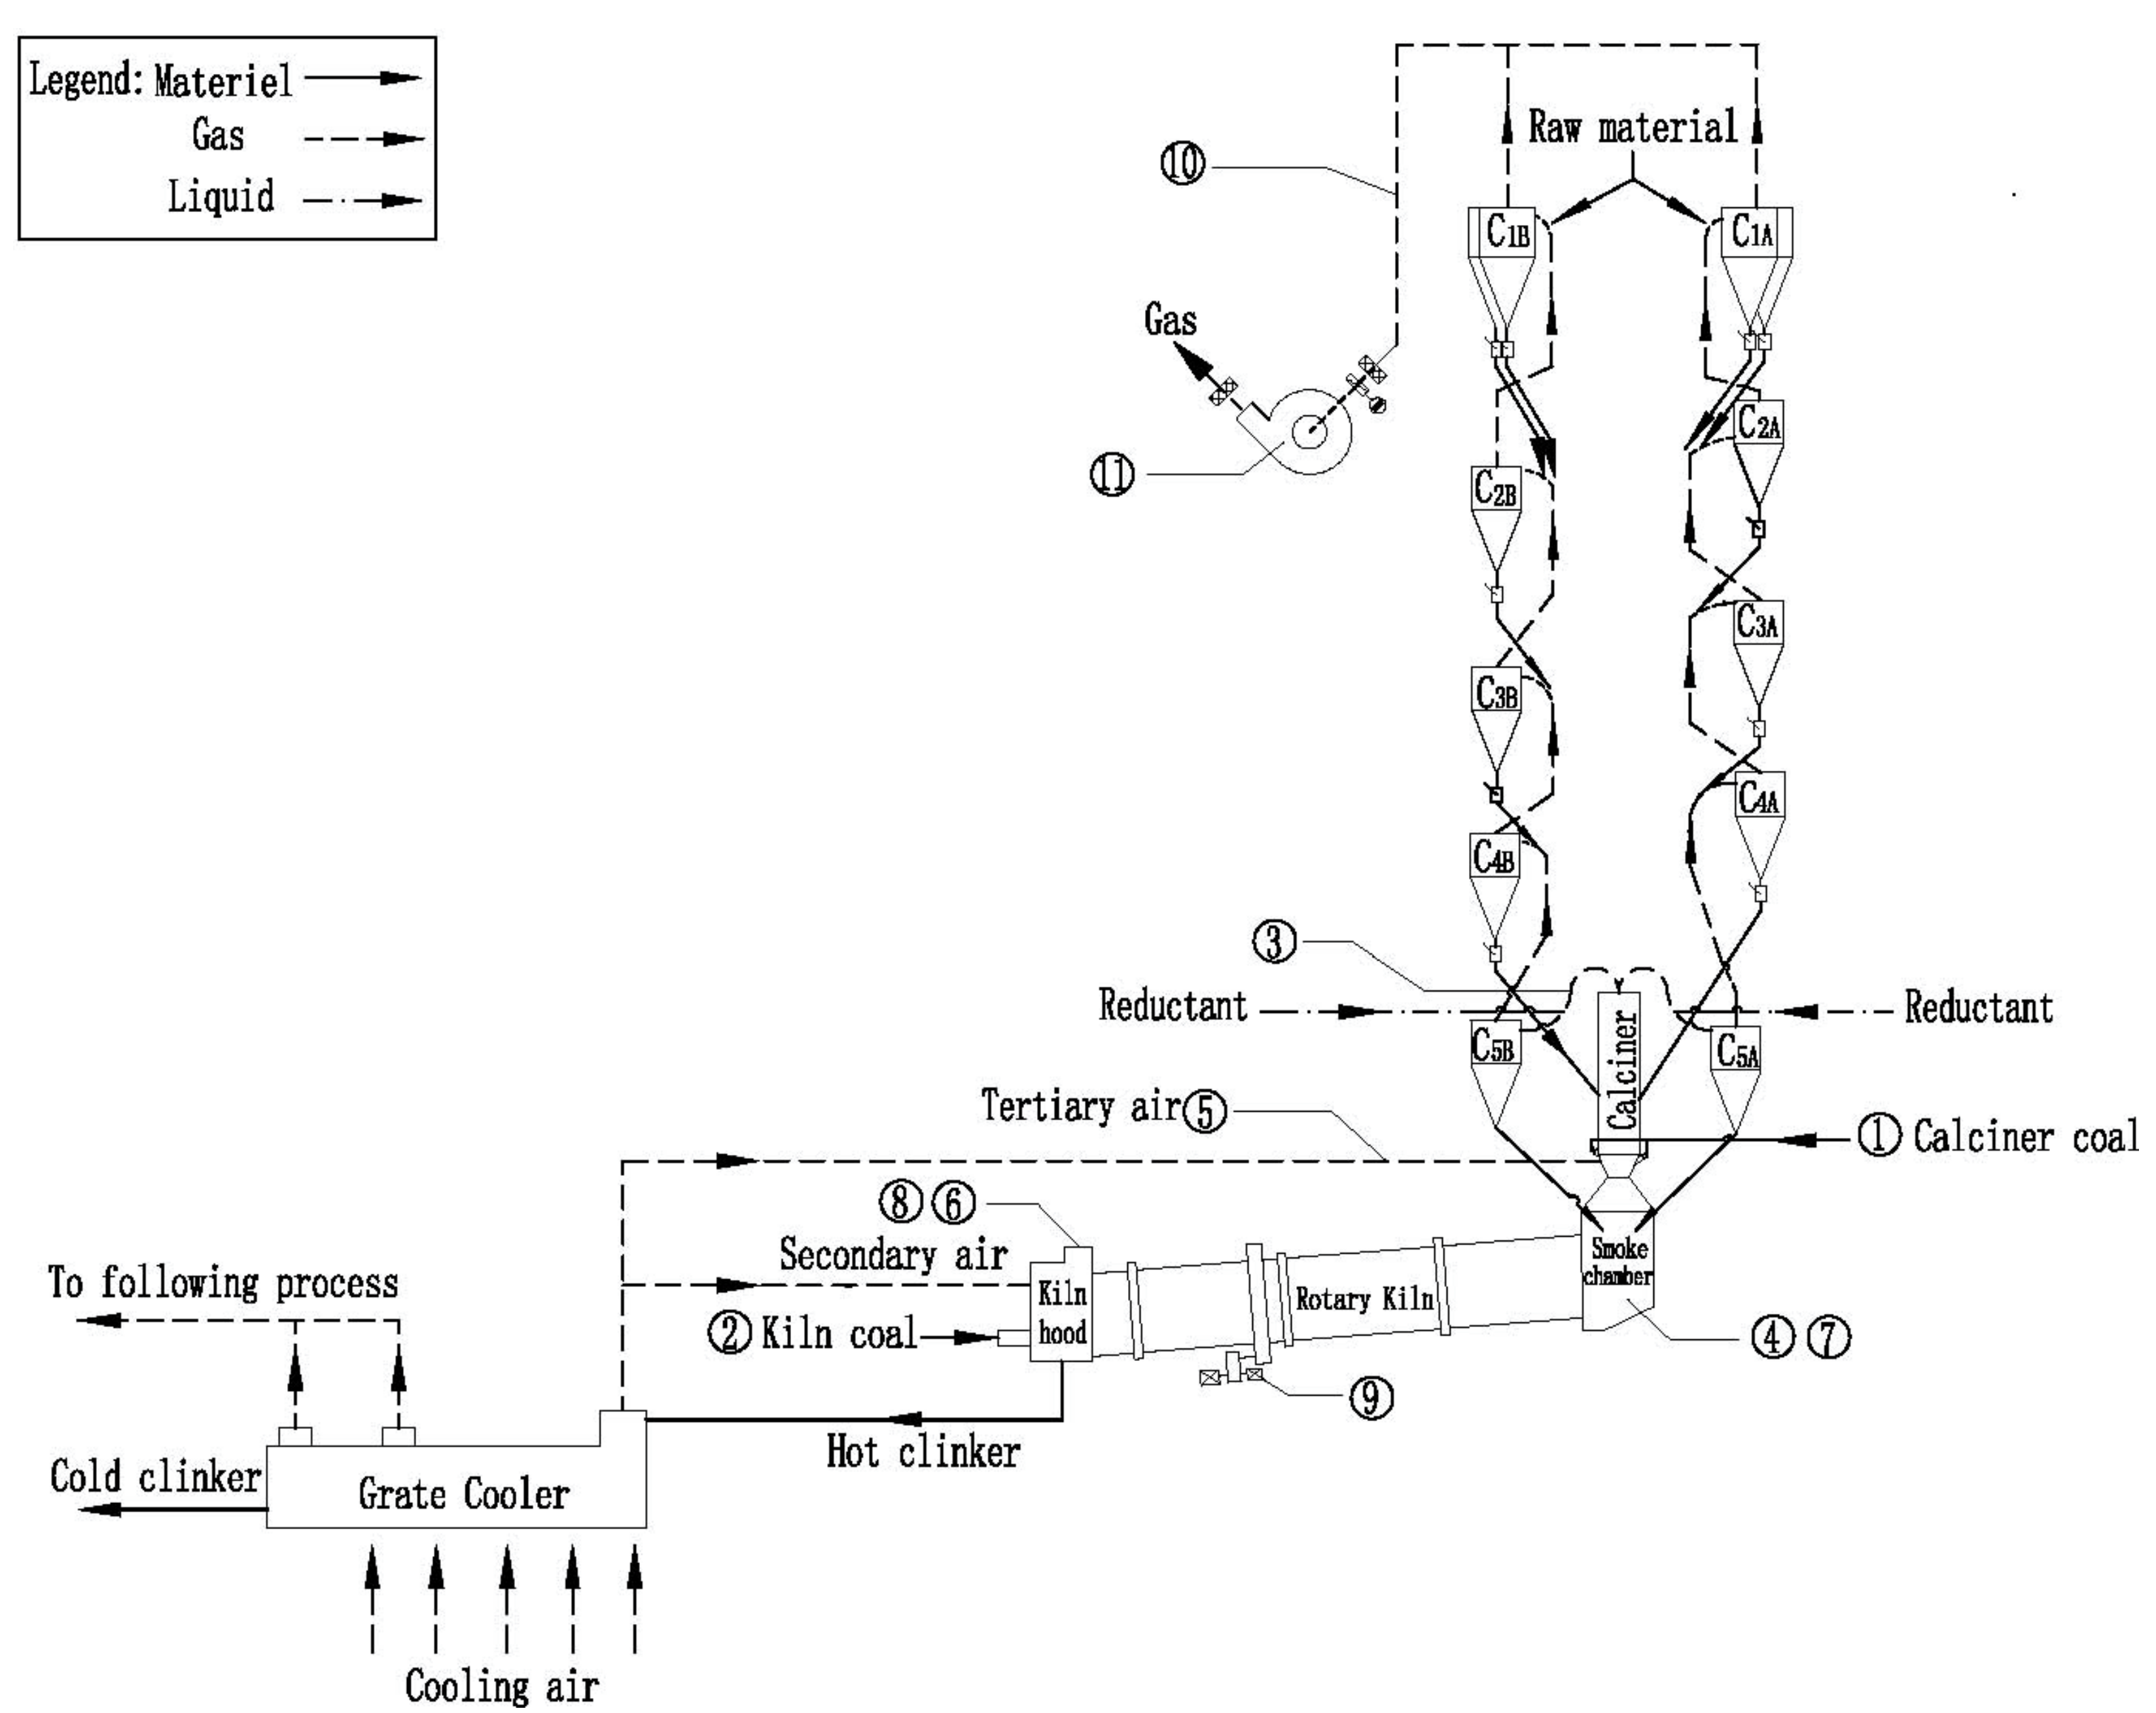
The key nodes in the modeling process of 5000 t/d production line are introduced as follows.

7.1. Determination of Key Process Parameters

The chosen 11 process parameters of 5000t/d production line for subsequent analysis are the same as those of the 12,000t/d production line, which were numbered with Xi in order to distinguish from the process parameters of the 12,000 t/d production line, and the sequence of number i is consistent with that in Table 1.
Pearson coefficients of some key process parameters of 5000 t/d production line are as shown in Table 8.
(1) The quantity of the calciner coal X 1 was strongly related to the current of the kiln motor X 9 , and the current of the kiln motor X 9 was retained because its signal was more reliable.
(2) The pressure of the smoke chamber X 7 had a strong correlation with the quantity of the kiln coal X 2 , the temperature of tertiary air X 5 , the temperature of secondary air X 6 and the pressure of the kiln hood X 8 . Only X 7 was reserved to reduce the number of independent variables and improve the reliability of the model.
Based on the above analysis, the key parameters affecting the NBC of 5000 t/d production line were finally determined to be the temperature of the calciner outlet X 3 , the temperature of the smoke chamber X 4 , the pressure of smoke chamber X 7 , the current of the kiln motor X 9 , the CO at preheater outlet X 10 and the speed of the high-temperature fan X 11 .

7.2. Development of NBC Model of 5000t/d Production Line

A total of 950 groups of data were obtained after data processing, and the first 500 groups were selected as training data. The R2 of the linear regression of the 5000 t/d production line was 0.794, and the P value was far less than 0.001. Therefore, conclusions can be drawn that the developed model was statistically significant. The regression equation for NBC in the 5000 t/d cement clinker burning system was as follows:
Y norm =   0.21 X 3 0.01 X 4 0.19 X 7 + 0.58 X 9 + 0.28 X 10 0.12 X 11 + 0.27
Y = 208 Y norm + 498
The obtained model is explained as follows:
(1) The same conclusion as the 12,000 t/d model can be obtained that NBC of the 5000 t/d production line was positively related with the temperature of outlet of calciner X3 and was negatively related with the temperature of smoke chamber X4.
(2) Gas components measurement showed that the air excess coefficient of smoke chamber is consistently higher than 1.05 and the quantity of kiln coal is basically unchanged during production. Under the above premise, the increase of pressure of smoke chamber means that the air volume in the kiln is increased, thus the calcination temperature in the high-temperature section of the kiln will be relatively reduced, and the formation rate of thermal nitrogen oxides will be reduced; on the other hand, residence time of air in the kiln would be shortened with the increase of air volume in the kiln. Therefore, NBC would decrease with the increase in pressure of the smoke chamber.
(3) In this 5000 t/d production line, NBC increases with the increase of the current of kiln motor X9. Increase of X9 indicates that the raw material in the kiln is fully calcined and the height of the material taken up with the rotation of the rotary kiln could be increased, which will increase the load of the kiln and the kiln current. More thermal NOX will be generated when the calcination is sufficient, resulting in the increase of NBC value.
It should be noted that for the 12,000 t/d production line, current of kiln motor X9 has a negative correlation with NBC, it is inconsistent with 5000 t/d production line. The reason lies in the fact that calorific value of the incoming coal in the 12,000 t/d production line is low and the flammability is poor due to the influence of coal supply. Excessive kiln coal is adopted to force calcination in kiln consciously thus to stabilize the quality of clinker. The insufficient combustion of excessive kiln coal ensures the high temperature required by the sintering zone in the kiln, improves the calcination effect of the clinker and increases the current of the kiln motor. However, the unburned kiln coal will continue to enter the transition section of kiln with flue gas and burns under weak oxygen atmosphere, where the reductive CO gas can be generated, thus the thermal NOX generated in the kiln would be reduced and NBC value would be decreased. The above conclusion is contrary to the conventional knowledge, but it exists objectively in this 12,000 t/d production line.
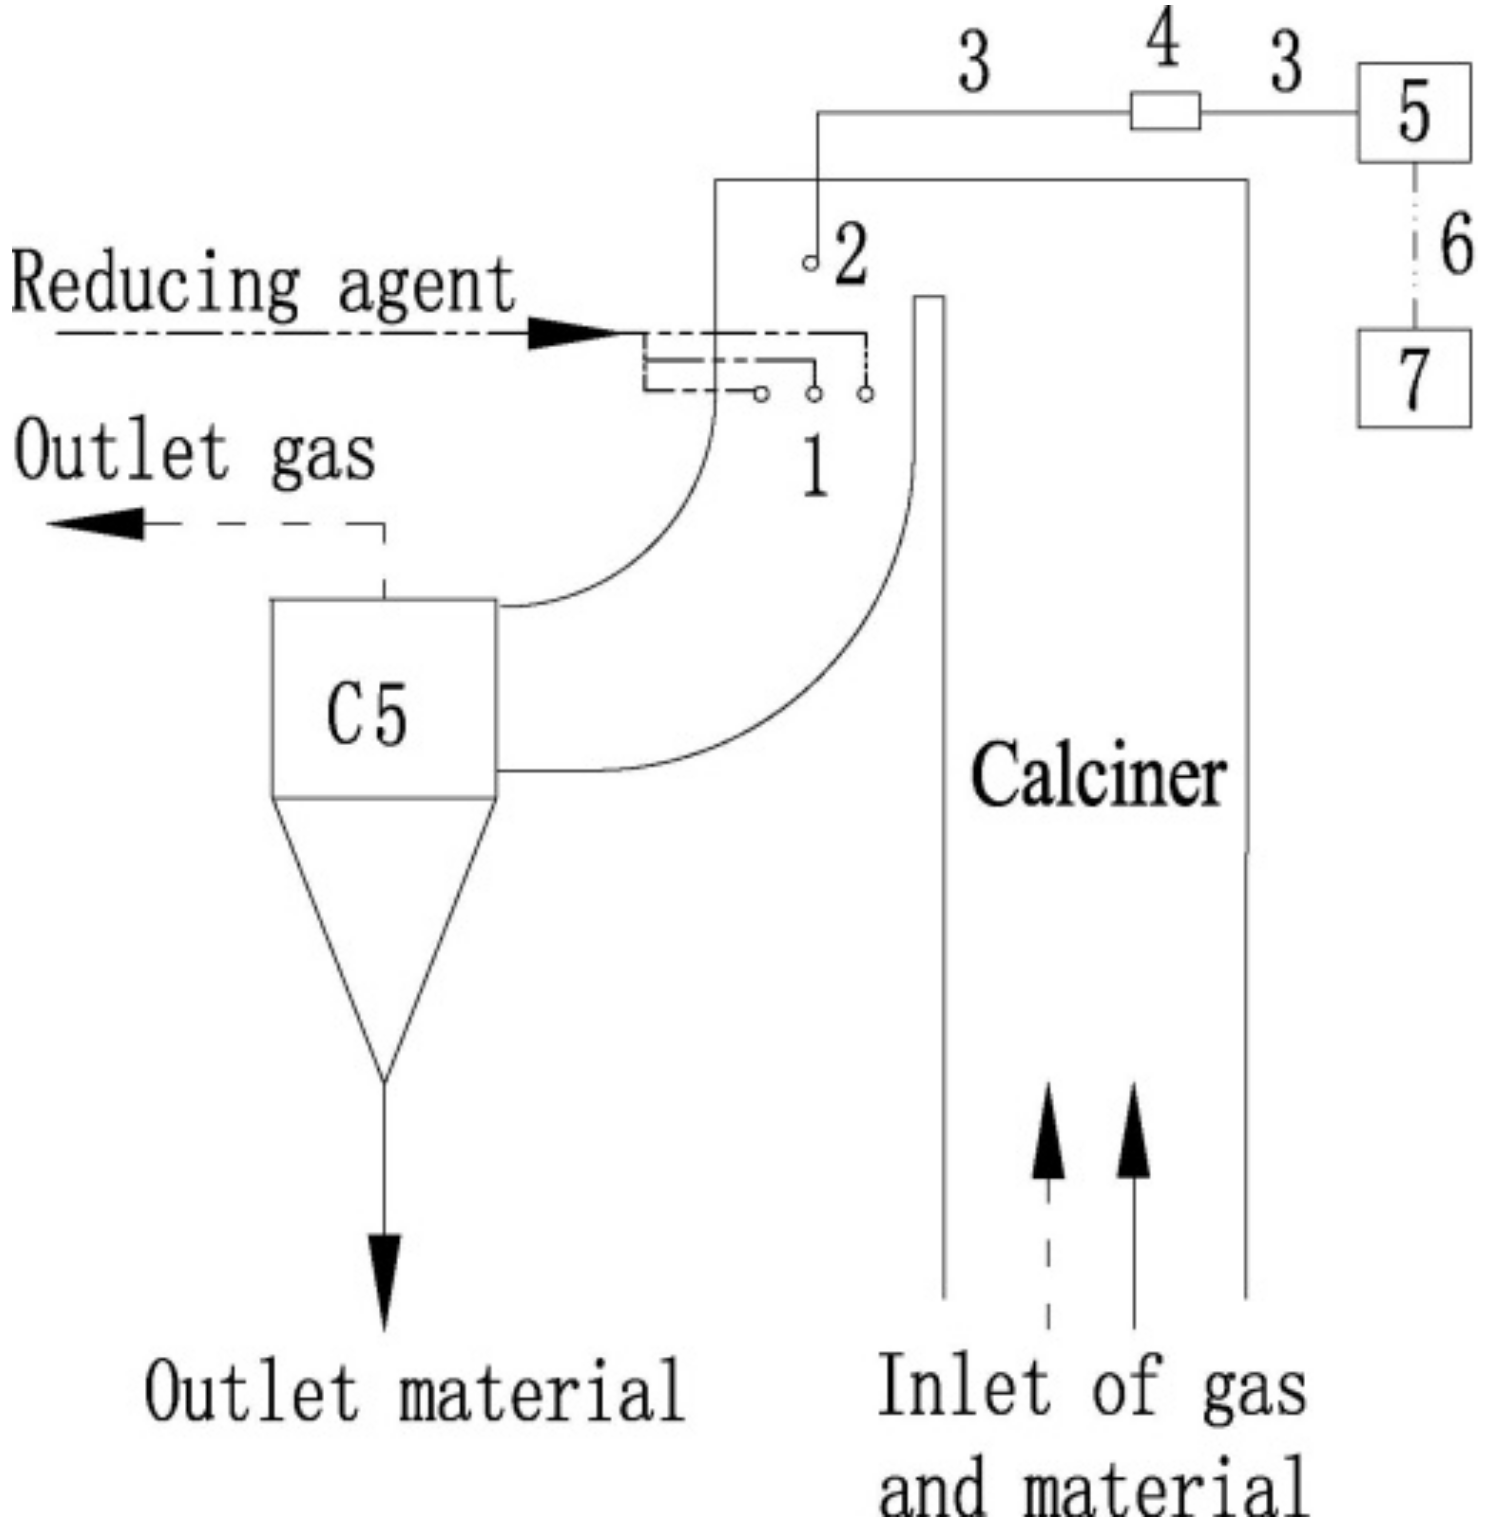
(4) There is a positive correlation between the CO at preheater outlet X 10 and NBC. The reason lies in the fact that the thickness of the castable for the tertiary air duct in the production line is increased, the effective inner diameter of tertiary air duct is reduced and the tertiary air velocity is as high as 32 m/s, and the volume of tertiary air is lower than the design value for a long time due to the large resistance loss of the tertiary air duct. Excess air coefficient at the middle of the calciner is only 0.96 and the combustion of calciner coal is not sufficient due to the insufficient supply of tertiary air; part of the calciner coal enters the C5 cyclone, where the reductive CO can be formed.
NOX is mostly generated at the calciner and kiln, which means that the CO generated in C5 cyclone would not reduce NOX and therefore has no impact on NBC; however, when the CO detected at the outlet of preheating system increases, it indicates that the combustion efficiency of calciner coal becomes worse. In this case, measures such as increasing calciner coal and increasing calciner temperature to stabilize production will be adopted, more fuel-NOX will be generated to increase NBC value. That explains why NBC increases with the increase of CO at preheater outlet in this 5000 t/d production line.
(5) Due to the limitation of the inner diameter of the tertiary air duct, combustion of the calciner coal is not sufficient. Tertiary air volume can be relatively increased and the combustion efficiency of calciner coal is improved with the increase of high-temperature fan speed, thus the fuel-NOX will decrease with the decrease of calciner coal quantity; although the NOX generated in the kiln might be increased at the same time, for this 5000 t/d production line, its NBC decreases with the increase of high-temperature fan speed after the combination of the these two effects.
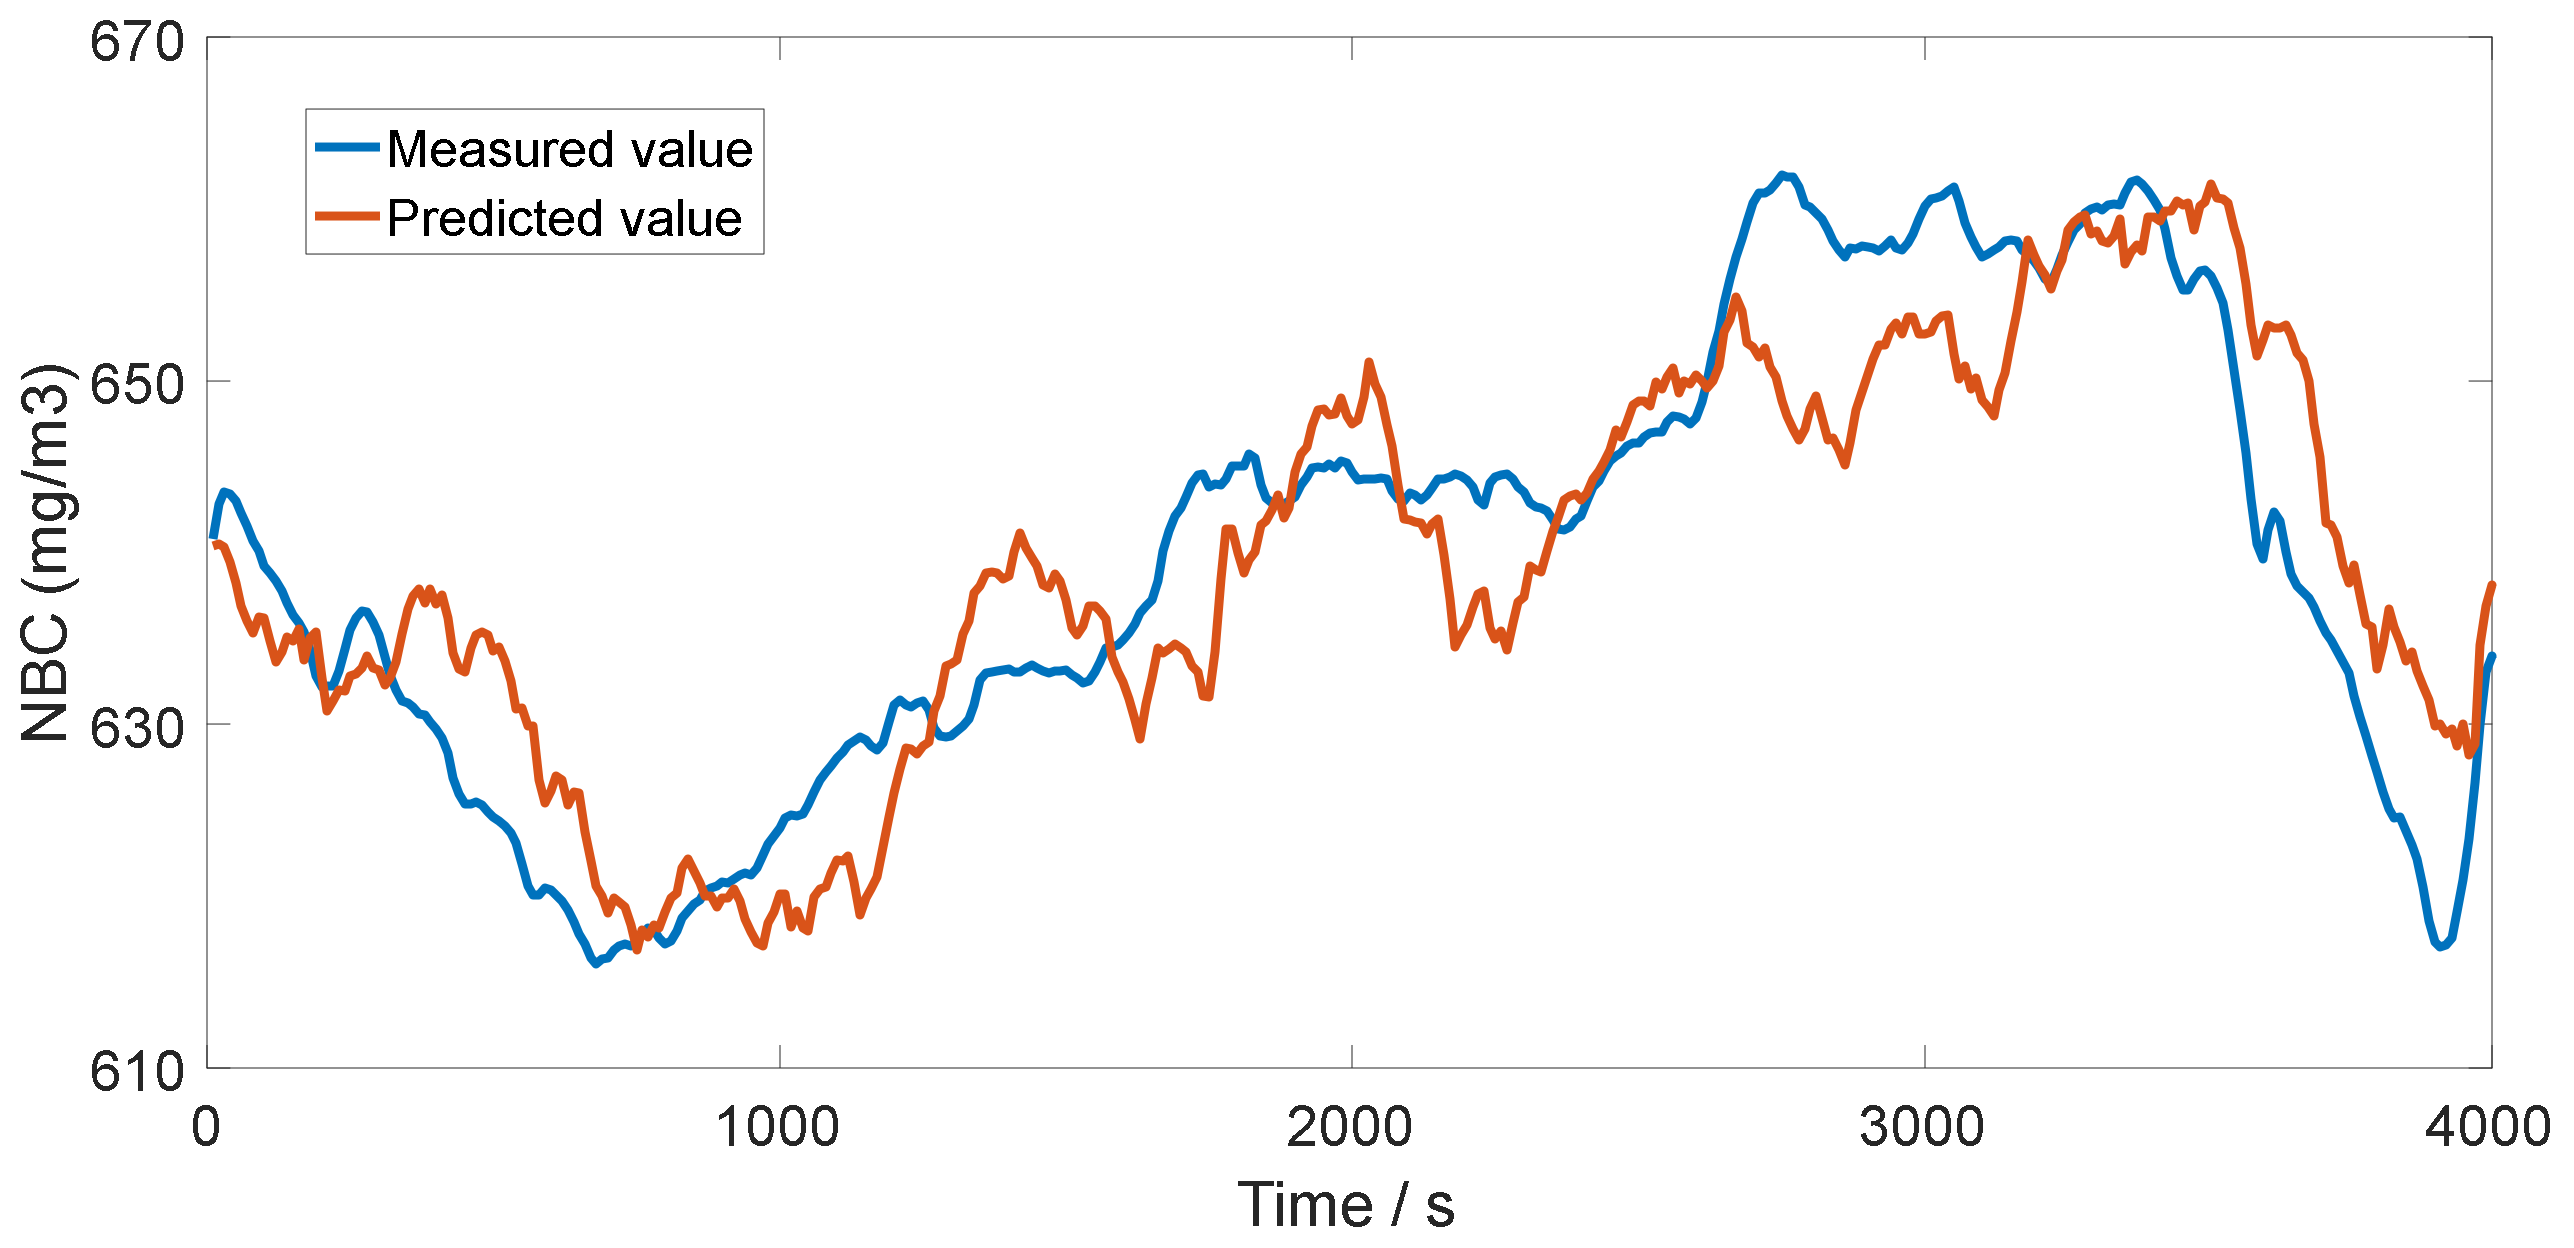
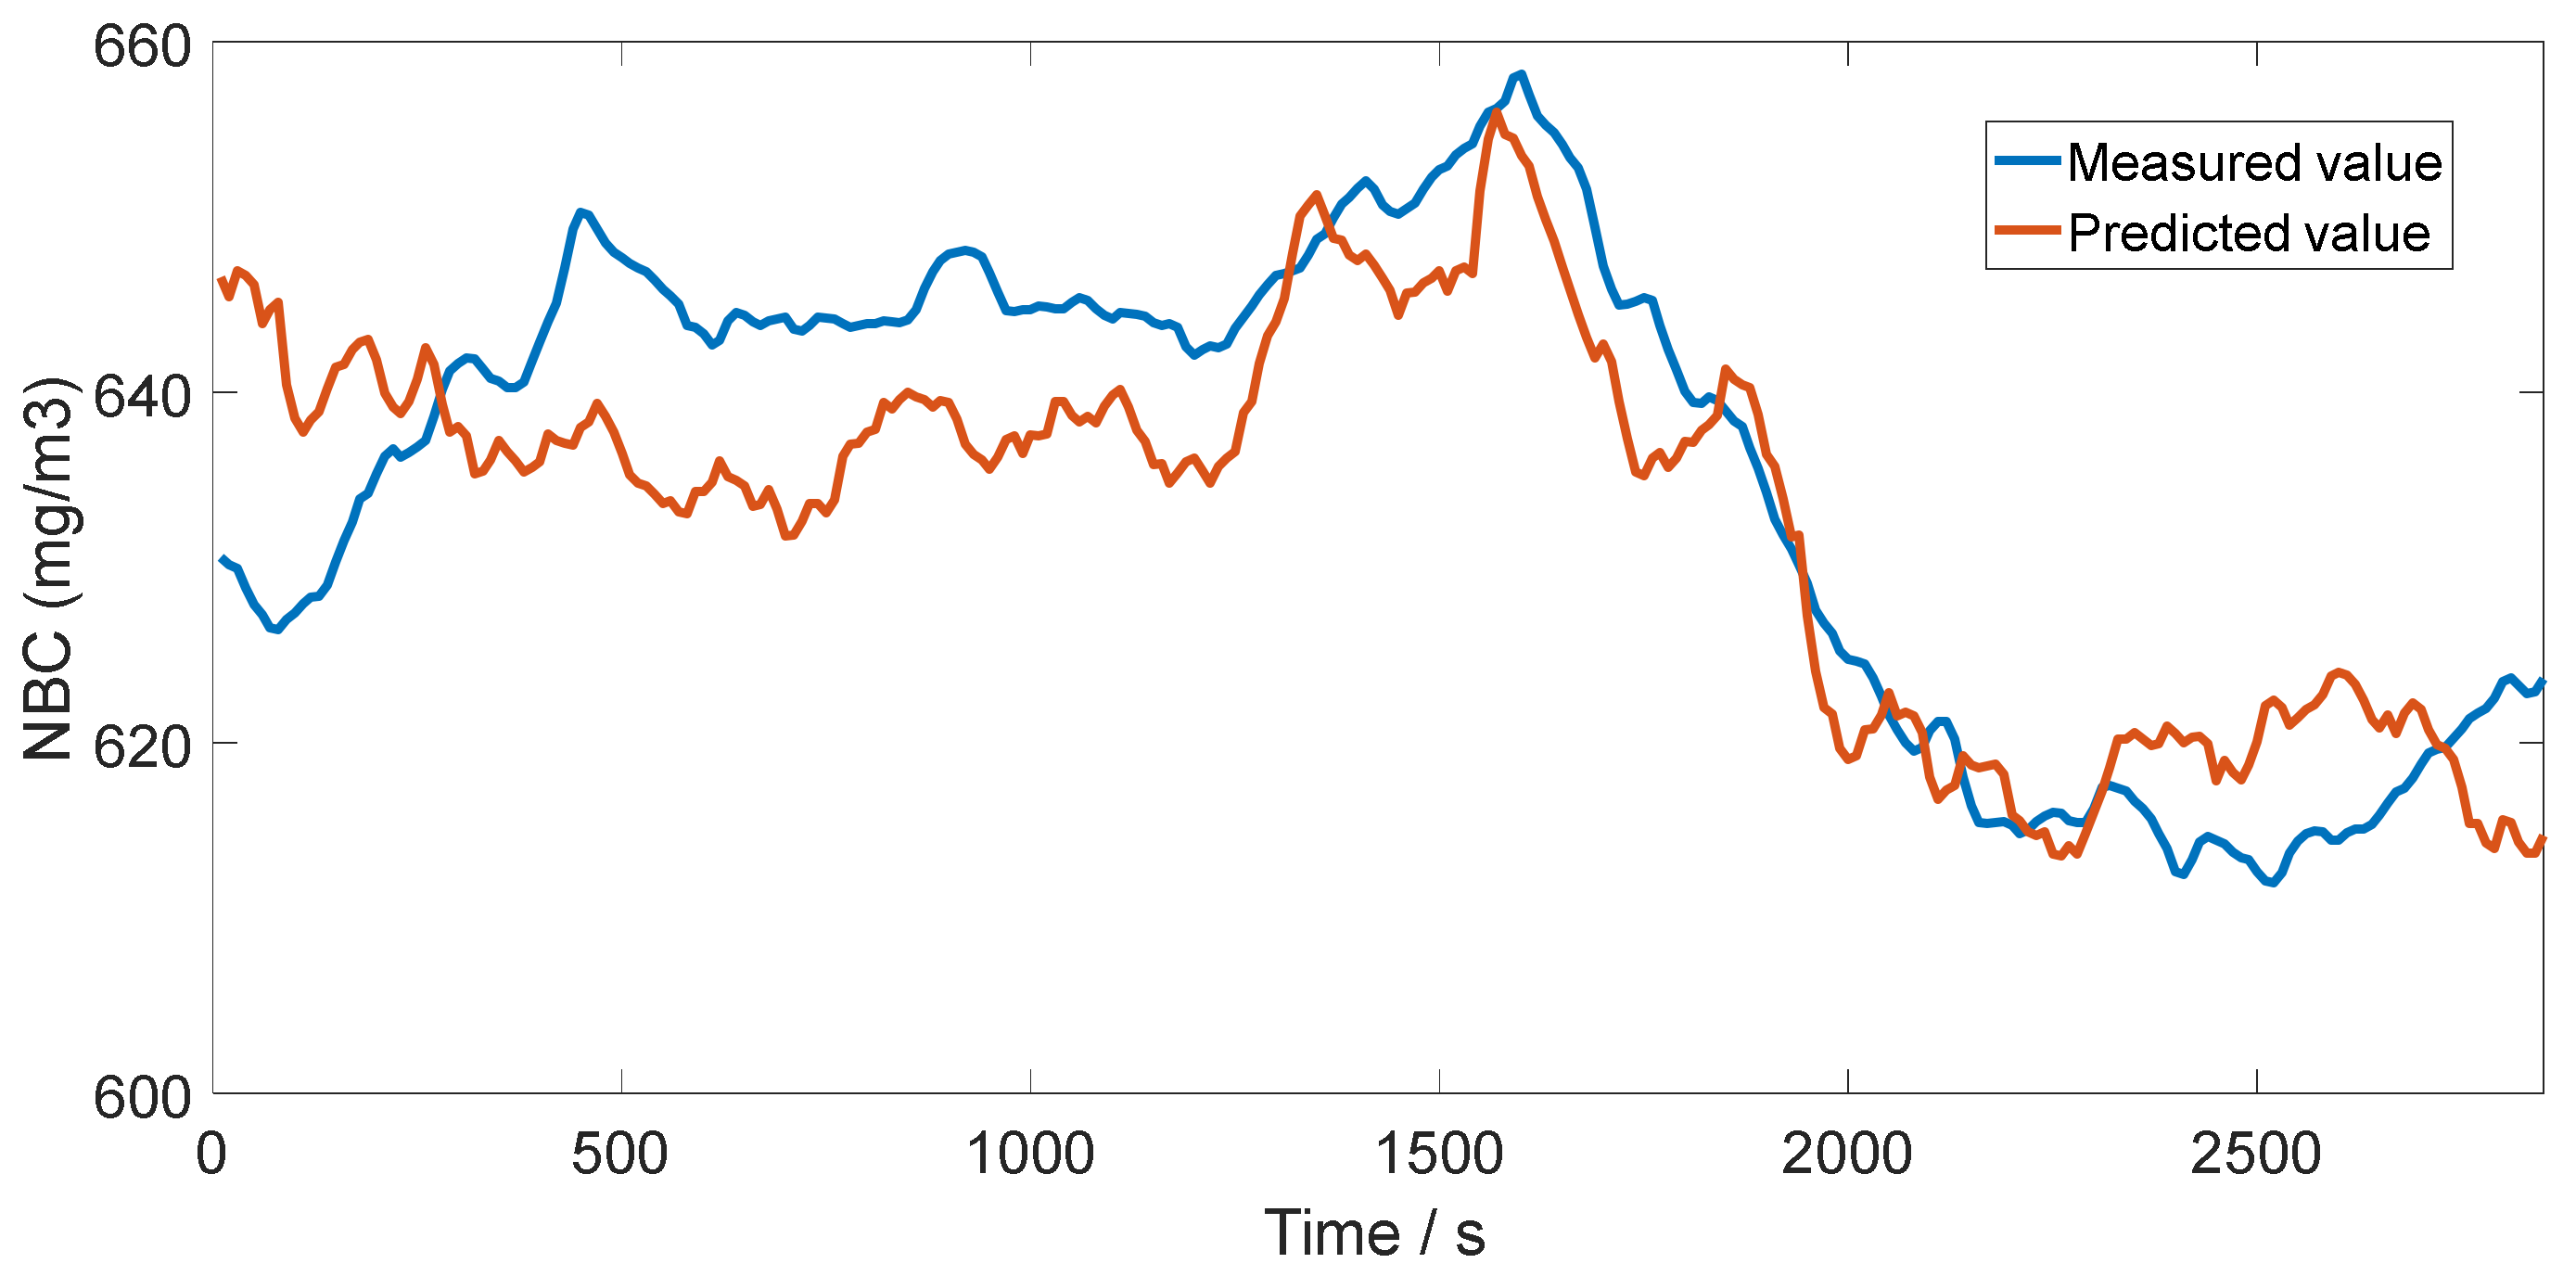
The obtained model was highly consistent with the process theory and has strong interpretability. The comparison of the predicted NOX values using training data and the actual NOX values is shown in 
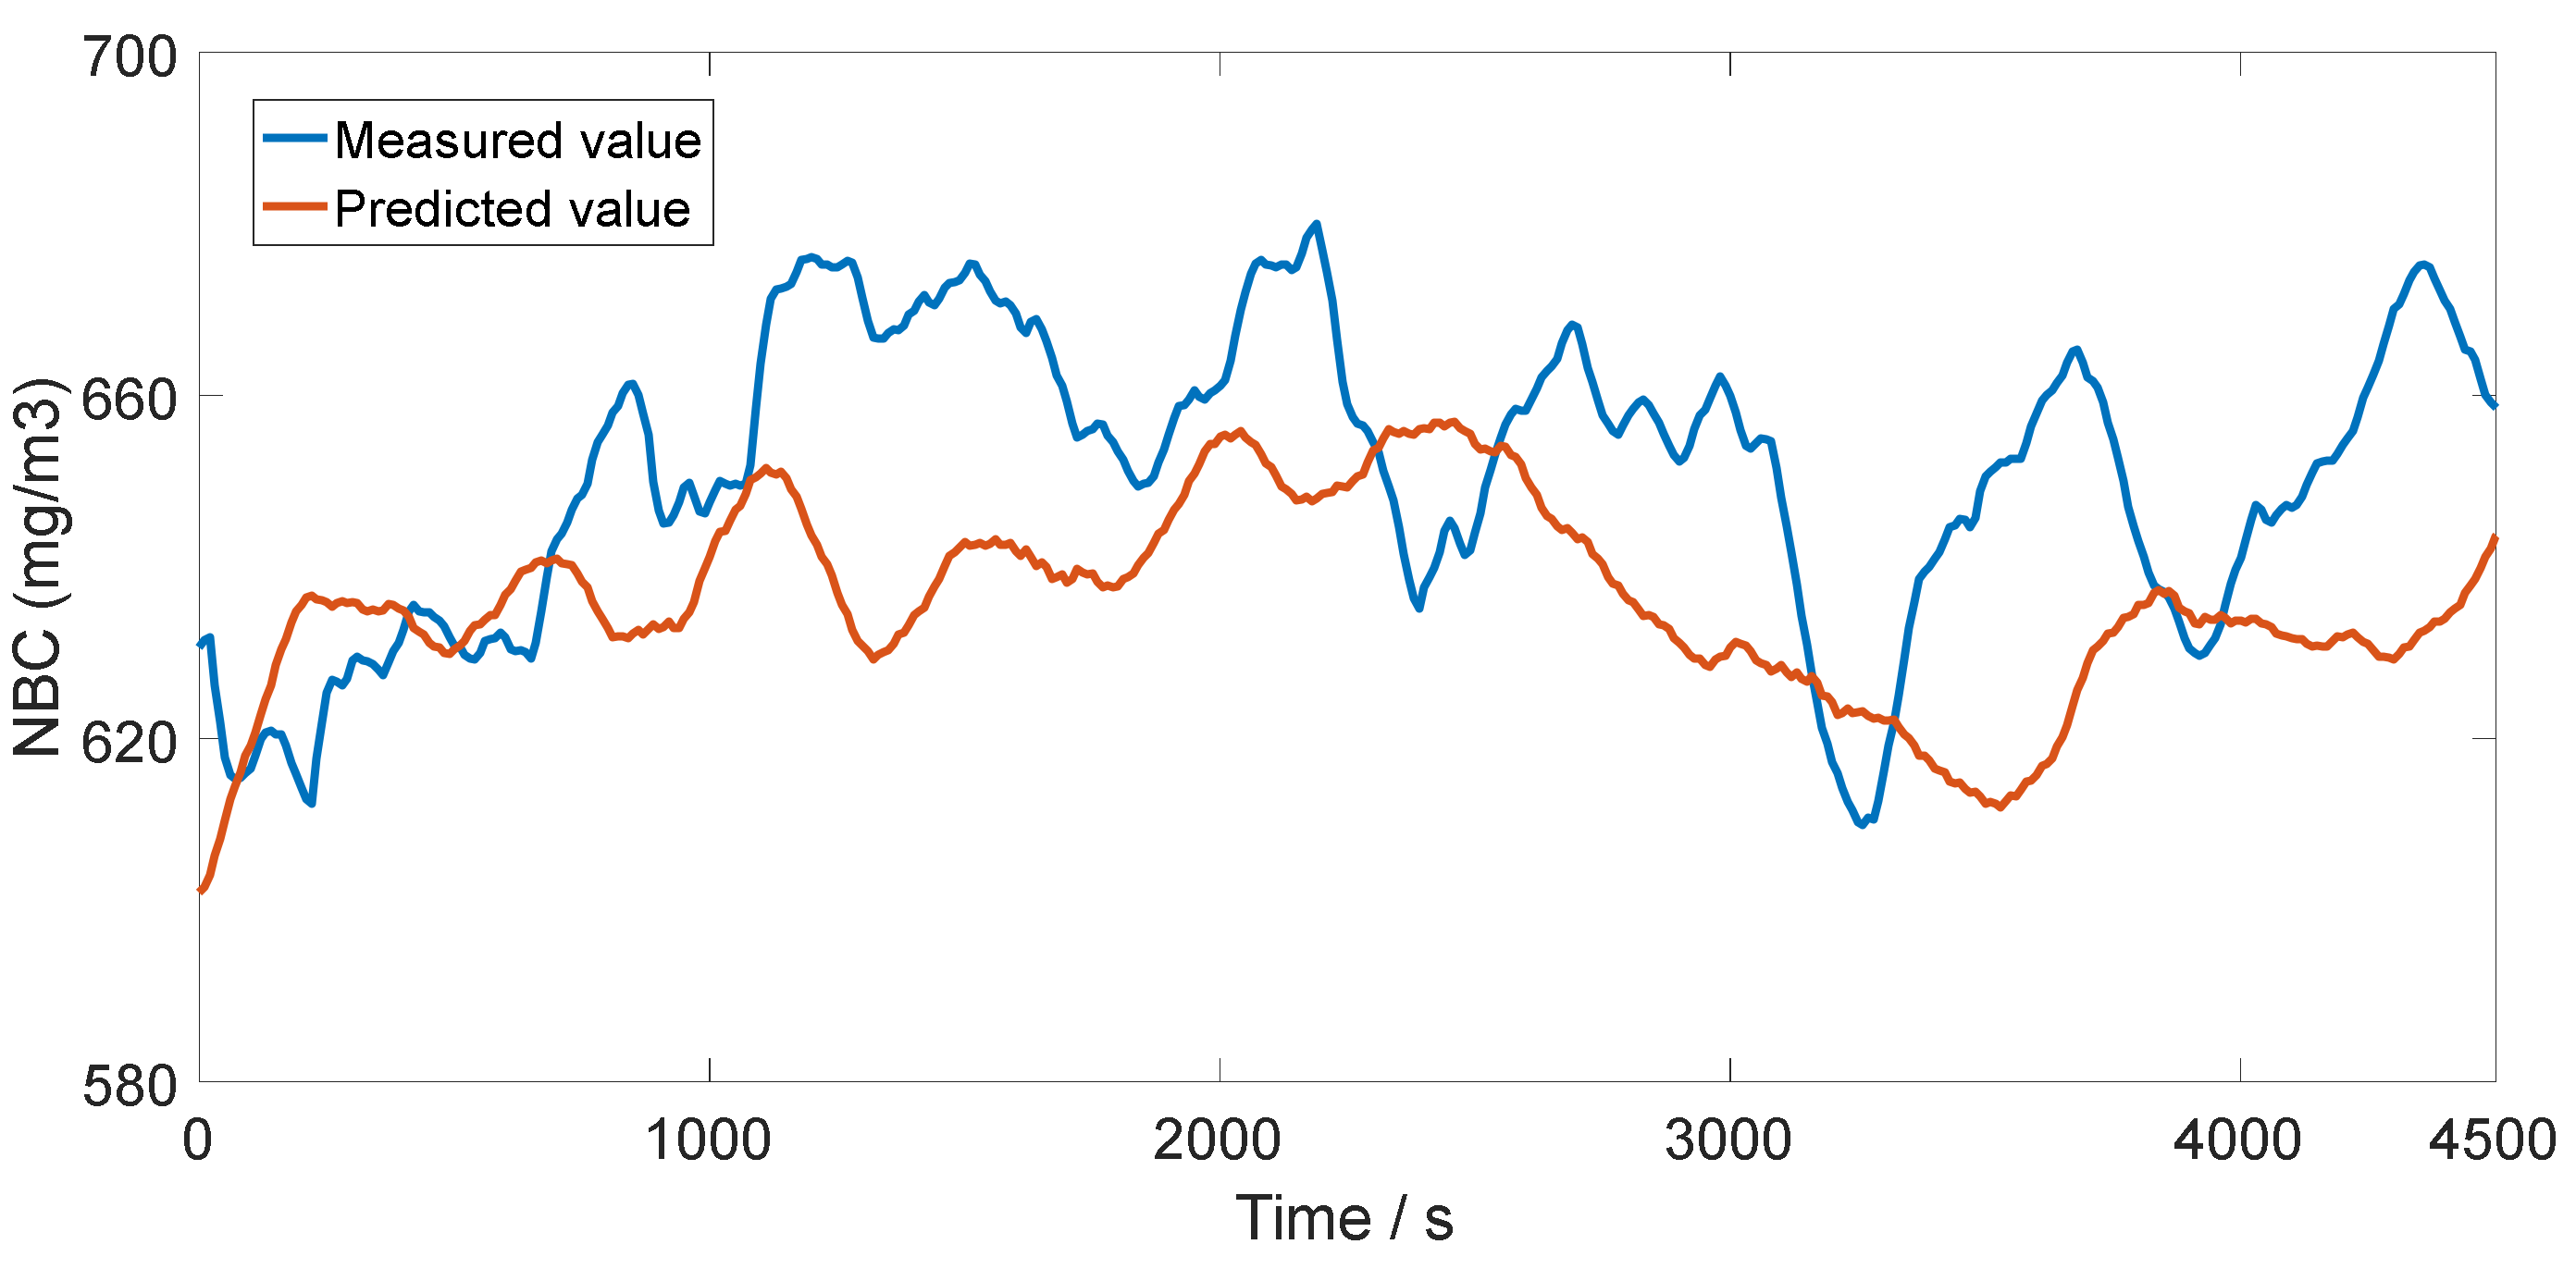
Figure 7, and the values of the NBC predicted by the model and the measured values are shown in Figure 8.
The MAE between the predicted and measured values of the NBC was 14.817 mg/m3, the error between the maximum deviation value and the NBC was less than 5%, and the prediction effect of the model was good.

8. Conclusions

In this paper, the use of SNCR to realize the ultra-low emissions of NOX in the process of cement burning was proposed, and it contains three steps: reduction of NOX background concentration (NBC), implementation of staged combustion, and the optimization of SNCR. The key parameters effects on NBC were studied using soft-sensor technology. The real-time acquisition of NBC in one 12,000 t/d production line and one 5000 t/d production line was realized by building a multiple linear regression model of the key process parameters and NBC. The conclusions were as follows.
(1) According to the mechanism of NOX formation, the parameters affecting the background concentration of NOX were mainly the fuel consumption, calcination temperature, and gas concentration, and specific parameters will be slightly different with the equipment and operation of different production lines.
(2) For the 12,000 t/d production line, its NOX background concentration had positive correlations with the temperature of the calciner outlet, the pressure of the kiln hood, and the temperature of the kiln hood; and negative correlations with the quantity of head coal, the temperature of the smoke chamber, and the current of the kiln motor. The MAE between the predicted and measured values of the NBC was 6.300 mg/m3, and the maximum deviation was 18.670 mg/m3.
(3) For the 5000 t/d production line, its NOX background concentration had positive correlations with the temperature of the calciner outlet, the current of the kiln motor and CO at the preheater outlet and negative correlations with the temperature of the smoke chamber, the pressure of smoke chamber, and the speed of the high-temperature fan. MAE between the predicted and measured values of the NBC was 14.817 mg/m3, and the error between the maximum deviation value and the NBC was less than 5%.

Author Contributions

Conceptualization, Y.Y. and Y.C.; methodology, Y.Y.; software, Y.Y.; validation, Y.Y.; formal analysis, Y.Y.; investigation, Y.Y.; resources, Y.C.; data curation, Y.Y.; writing—Original draft preparation, Y.Y.; writing—Review and editing, Y.C.; visualization, Y.C.; funding acquisition, Y.C. All authors have read and agreed to the published version of the manuscript.

Funding

This research was funded by NATIONAL KEY R&D PROGRAM OF CHINA, grant number 2016YFB0303402. The APC was funded by NATIONAL KEY R&D PROGRAM OF CHINA.

Acknowledgments

Thanks to Bao Yaoyao and Zheng Qinquan of East China University of science and technology for their support on data analysis.

Conflicts of Interest

The authors declare no conflict of interest. The funders had no role in the design of the study; in the collection, analyses, or interpretation of data; in the writing of the manuscript; or in the decision to publish the results.

References

  1. Pan, Y. The Control of NOX Emission of Coal-Fired Boiler. Master’s Thesis, North China Electric Power University, Beijing, China, 2017. [Google Scholar]
  2. Lv, G. Experimental and Modeling Study of NO Formation and Reduction for Precalciner. Ph.D. Thesis, Huazhong University of Science and Technology, Wuhan, China, 2011. [Google Scholar]
  3. Liu, X.W. Analysis of environmental impact of cement denitrification technology. China Resour. Compr. Util. 2018, 6, 108–109. [Google Scholar]
  4. Chen, Y.X.; Zhang, X. Discussion on denitration technology of cement. Guangdong Build. Mater. 2016, 8, 33–35. (In Chinese) [Google Scholar]
  5. Tong, C.H. SNCR denitration automatic control system’s optimization in guojiawan power plant. Shenhua Sci. Technol. 2018, 2, 57–58, 73. [Google Scholar]
  6. Zhu, Z.J.; Bai, J.Y.; Liu, L.X. Research and application of expert fuzzy control in sncr denitrification system. Process Autom. Instrum. 2018, 7, 34–38. [Google Scholar]
  7. Ma, X.Q. Brief talk on treatment of nitrogen oxide and ammonia emission in domestic cement industry. China Cem. 2019, 5, 78–80. [Google Scholar]
  8. Zhao, W.X.; Yang, J.B. Technical renovation of denitration system to solve process accidents caused by excessive ammonia escape. Cem. Guide New Epoch 2017, 1, 52–53. (In Chinese) [Google Scholar]
  9. Li, X.M.; Lin, Y. Ultra low emission and flue gas treatment technology in cement industry. Cem. Eng. 2019, 6, 70–72. [Google Scholar]
  10. Jiang, P.Z. Application of SNCR in CFB boilers for low NOX emission. Electr. Power Standarization Constr. Cost Control Inf. 2010, 6, 6–10. [Google Scholar]
  11. Shu, Y.; Wang, H.Z.; Zhu, J.W.; Zhang, F.; Huang, J. Nitrogen oxide reduction by biomass reburning and its reaction characteristics of homogeneous reduction. Res. Environ. Sci. 2015, 28, 660–666. [Google Scholar]
  12. Wang, Y.L.; Qin, N.N.; Li, N.; Song, Y.H.; Cui, S.P. Study on reaction conditions of bamboo charcoal used in flue gas denitrification of cement kiln. Bull. Chin. Ceram. Soc. 2019, 38, 3552–3558. [Google Scholar]
  13. Wendt, J.O.L.; Pershing, D.W. Physical Mechanisms Governing the Oxidation of Volatile Fuel Nitrogen in Pulverized Coal Flames. Combust. Sci. Technol. 1977, 16, 111–118. [Google Scholar] [CrossRef]
  14. Peter, G.; Miller, J.A.; Kee, R.J. Kinetic Modeling and Sensitivity of Nitrogen Oxides Formation in Well-Stirred Reactor. Combust. Flame 1986, 65, 177–202. [Google Scholar]
  15. Miller, J.A.; Bowman, C.T. Mechanism and Modeling of Nitrogen Chemistry in Combustion. Process Energy Combust. Sci. 1989, 15, 287–338. [Google Scholar] [CrossRef]
  16. Song, Y.H. Nitrogen oxide formation during pulverized. coal combustion. Combust. Sci. Technol. 1982, 28, 31–39. [Google Scholar] [CrossRef]
  17. Zhao, J.S.; Grace, J.R. Influence of operating parameter on NOX emissions from a circulating fluidized bed combustor. Fuel 1994, 6, 1651–1656. [Google Scholar]
  18. Thomas, K.R. The release of nitrogen oxides during char combustion. Fuel 1997, 6, 457–471. [Google Scholar] [CrossRef]
  19. Wang, Y. The Study on Temperature Modeling and Control of Cement Rotary Kiln. Master’s Thesis, Tianjin University of Technology, Tianjin, China, 2017. [Google Scholar]
  20. Huo, L.P.; Yang, K.; Xu, D.L.; Ji, Y. Theoretical Analysis on the Advantage of NOX Remove of the Suspension Preheating and Pred Ecomposition System with High Solid-gas Ratio. Bull. Chin. Ceram. Soc. 2014, 3, 656–661. [Google Scholar]
  21. Cao, P.F.; Luo, X.L. Modeling of soft sensor for chemical process. CIESC J. 2013, 3, 788–800. [Google Scholar]
  22. Haimi, H.; Mulas, M.; Corona, F.; Vahala, R. Data-derived soft-sensors for biological wastewater treatment plants: An overview. Environ. Modell. Softw. 2013, 47, 88–107. [Google Scholar] [CrossRef]
  23. Lv, Y.; Liu, J.Z.; Yang, T.T.; Zeng, D. A Novel Least Squares Support Vector Machine Ensemble Model for NOX Emission Prediction of a Coal-fired Boiler. Energy 2013, 55, 319–329. [Google Scholar] [CrossRef]
  24. Zheng, L.G.; Zhou, H.; Cen, K.F.; Wang, C.L. A comparative study of optimization algorithms for low NOX emission modification at a coal-fired utility boiler. Expert Syst. Appl. 2009, 36, 2780–2793. [Google Scholar] [CrossRef]
  25. Zhou, H.; Mao, J.B.; Chi, Z.H.; Jiang, X.; Wang, Z.; Cen, K. Predicting Low NOX Combustion Property of a Coal-fired Boiler. Environ. Sci. 2002, 2, 18–22. [Google Scholar]
  26. Jin, X.Z.; Zhang, S.K. Prediction of denitrification system inlet nitrogen oxide based on neural network online learning. J. Hebei Univ. (Nat. Sci. Ed.) 2018, 4, 423–431. [Google Scholar]
  27. Zhang, H.; Zhou, C.C.; Ren, P. Prediction Model of Boiler NOX Emission Based on Least Squares Support Vector Machine. Jilin Electr. Power 2019, 3, 18–20. [Google Scholar]
  28. Wang, W.Q. Simulation and Optimization of Oxynitride Emissions During the Process of Cement Precalcining Kiln. Master’s Thesis, Dalian University of Technology, Dalian, China, 2017. [Google Scholar]
  29. Li, K. Research on Boiler Nitrogen Oxide Prediction and Reduction Based on Data Mining. Master’s Thesis, Huazhong University of Science and Technology, Wuhan, China, 2019. [Google Scholar]
  30. Rodgers, J.L.; Nicewander, W.A. Thirteen ways to look at the correlation coefficient. Am. Stat. 1988, 1, 59–66. [Google Scholar] [CrossRef]
  31. Wei, Y.C. A novel d-s combination method of conflicting evidences based on pearson correlation coefficient. Telecommun. Eng. 2012, 4, 466–471. [Google Scholar]
Figure 1. Flow chart of cement clinker burning system.
Processes 08 01104 g001
Figure 2. Schematic diagram of NOX background concentration (NBC) acquisition device. 1: reducing agent spray gun; 2: measuring point; 3: gas pipeline; 4: dust filter; 5: portable flue gas analyzer; 6: data transmission line; 7: computer.
Processes 08 01104 g002
Figure 3. Current trend of kiln main motor.
Processes 08 01104 g003
Figure 4. Trend of actual and predicted NOX value of 12,000 t/d production line.
Processes 08 01104 g004
Figure 5. Trend of actual and predicted NOX value of 12,000 t/d production line.
Processes 08 01104 g005
Figure 6. Deviation between predicted value and measured value of NOX of 12,000 t/d production line.
Processes 08 01104 g006
Figure 7. Trend of actual and predicted NOX value of 5000 t/d production line.
Processes 08 01104 g007
Figure 8. Trend of actual and predicted NOX value of 5000 t/d production line.
Processes 08 01104 g008
Table 1. Summary of key burning parameters.
ParametersQuantity of CoalTemperaturePressureCurrent of Kiln MotorCO at Preheater OutletSpeed of High Temperature Fan
Calciner CoalKiln CoalOutlet of CalcinerSmoke ChamberTertiary AirSecondary AirSmoke ChamberKiln Hood
Unitt/ht/h°C°C°C°CPaPaA%rpm
Symbolx1x2x3x4x5x6x7x8x9x10x11
Table 2. Correlation degree between process parameters.
|r|0~0.20.2~0.40.4~0.60.6~0.80.8~1
Correlation degreeIrrelevant weakWeakModerateStrongExtremely strong
Table 3. Part of Pearson correlation coefficient between process parameters.
Parameters|r|Retained Parameters
Parameter 1Parameter 2
x 1 x 3 0.787 x 3
x 5 x 9 0.776 x 9
x 11 x 9 0.923 x 9
x 7 x 9 0.869 x 9
x 10 x 4 0.862 x 4
Table 4. Extreme values of parameters.
Parameters x 2 x 3 x 4 x 6 x 8 x 9 y
x rmax 22.8875.61197.6799.3−61.81301.5662.0
x rmin 22.7872.51188.8764.3−75.91266.9616.0
x min 23.0880.01210.0810.0−50.01310.0680.0
x max 22.0865.01170.0750.0−85.01250.0600.0
Table 5. Regression statistics.
ItemMultiple RR2Adjusted R SquareStandard ErrorObservation Value
Value0.8780.7710.7680.080400
Table 6. Analysis of variance (ANOVA) table.
dfSSMSFSignificance F
Regression analysis68.4961.416220.9261.4 × 10−122
Residual3932.5190.006
Total39911.015
Table 7. Regression coefficient.
CoefficientsStandard Errort Statp-Value
Intercept2.2320.3356.6639.073 × 10−11
x2−2.9820.416−7.1703.75 × 10−12
x31.4410.1688.5622.55 × 10−16
x4−0.9950.186−5.3341.62 × 10−7
x60.4390.0795.5754.62 × 10−8
x80.7720.04816.1272.88 × 10−45
x9−0.6660.044−15.2661.21 × 10−41
Table 8. Pearson coefficients of process parameters of 5000 t/d production line.
Parameters|r|Retained Parameters
Parameter 1Parameter 2
X 1 X 9 0.624 X 9
X 7 X 2 0.572 X 7
X 7 X 5 0.752 X 7
X 7 X 6 0.835 X 7
X 7 X 8 0.840 X 7

