Article

Dynamic Characteristics and Wall Effects of Bubble Bursting in Gas-Liquid-Solid Three-Phase Particle Flow

1
College of Mechanical Engineering, Zhejiang University of Technology, Hangzhou 310014, China
2
Key Laboratory of Special Purpose Equipment and Advanced Processing Technology, Ministry of Education & Zhejiang Province, Zhejiang University of Technology, Hangzhou 310014, Zhejiang, China
3
Zhejiang Chendiao Machinery Company Limited, Lishui 321404, China
*
Authors to whom correspondence should be addressed.
Processes 2020, 8(7), 760; https://doi.org/10.3390/pr8070760
Submission received: 6 June 2020 / Revised: 26 June 2020 / Accepted: 26 June 2020 / Published: 29 June 2020
(This article belongs to the Section Chemical Processes and Systems)

Abstract

:
The bubble bursting process existing in the particle flow is a complex gas-liquid-solid three-phase coupling dynamic problem. The bubble bursting mechanism, including dynamic characteristics and wall effects, is not clear. To address the above matters, we present a modeling method for the piecewise linear interface calculation-volume of fluid (PLIC-VOF) based bubble burst. The bubble bursting process near or on the wall is analyzed to reveal the dynamic characteristics of bubble bursting and obtain the effect of a bubble bursting on the surrounding flow field. Then a particle image velocimetry (PIV) based self-developed experimental observation platform is established, and the effectiveness of the proposed method is verified. Research results indicate that, in the high-speed turbulent environment, a large pressure difference existed in the bubble tail, which induces the bubble burst to occur; the distance between the wall and the bubble decreases; the higher the flow velocity is, the less time is acquired for bubble bursting, but when the flow velocity exceeds the critical velocity 50 m/s, more time is needed; the coalescence-burst process of double bubbles increases the bubble bursting time, which causes the acceleration of particle motion to reduce.

1. Introduction

With the development of modern industries such as energy, petrochemical, pharmaceutical, aerospace, nuclear, and environmental engineering, three-phase flow-related theory research and technology development have been paid much attention to, and have become a complete basic application discipline [1,2,3]. As a kind of three-phase flow, gas-liquid-solid three-phase particle flow widely exists in chemical reactions, energy transportation, iron and steel smelting, precision processing and food separation, and other engineering fields [4,5,6]. The micro-jet generated by the bubble burst causes serious damage to an engineering facility, such as cavitation erosion. However, when the bubble bursting process can be effectively controlled, the surface processing efficiency can be increased. Therefore, it is of great scientific research value and engineering practical significance to research the dynamic characteristics and evolution mechanism of a bubble bursting in gas-liquid-solid three-phase particle flow and to reveal the law of particle motion and wall impact effect.
Bubble dynamics studies are generally based on the approximate spherical hypothesis. Rayleigh [7] took the single bubble bursting process as the research object, ignored the influence of liquid viscosity, compressibility, and other factors, and obtained the bubble motion equation in an ideal state. Plesse [8] considered the surface tension and fluid viscosity of the bubble, and it is concluded that the deformation movement of the bubble goes through three stages: primary generation, collapse, and springback. Especially in the final stage of bubble collapse, a micro-jet at almost the velocity of sound or supersonic speed will be produced. Chahine [9] proposed a multi-bubble surface average pressure method to simulate the development and evolution of bubbles and obtained a 3D simulation of a bubble bursting. The continuous improvement of these models laid a foundation for the study of the bubble bursting, but there are many limitations in theoretical analysis.
Relevant studies [10,11,12] have indicated that the micro-jet generated by the bubble burst is a typical high-speed jet and could produce high temperature and pressure, compression wave, etc., which has a great impact on the nearby solid surface. Brujan [13] used high-speed photography technology to measure the micro-jet on the wall. The results indicated that the ultrasonic wave with the frequency of 3.24 Mhz can make the bubble with a maximum radius of 150 μm produce 80–130 m/s micro-jet. Vignoli [14] showed that a high-speed micro-jet will appear only when the bubble collapse speed is higher than the propagation sound velocity in liquid. Li J [15] conducted the VOF to simulate the cavitation collapsing near the wall and to calculate the influence of the distance between the cavitation collapse and the wall on the jet strength. The above research has provided valuable references for the in-depth study and application of multiphase flow, but they mainly focus on the effects of bubbles on particles and the wall in a stationary flow field, and rarely on the dynamic characteristics of bubbles in a high-speed turbulent environment.
Bubble bursting is a common physical phenomenon. However, the process of bubble formation, growth, movement, and burst is a polyphase, transient, microscopic, and random complex physical phenomenon [16], and the bubble burst can form the high-speed micro-jet. Ge [17,18] utilized the microjet generated by the bubble burst to accelerate the kinetic energy of the particles, increasing the polishing efficiency and effectiveness, as shown in Figure 1. Nevertheless, they did not explain the dynamics characteristics and wall effects of bubble bursting. It is difficult to describe precisely the flow problem of three-phase flow involving the interaction of mass, momentum, and energy [19]. There are few studies on the interaction between bubbles and particles or walls during bubble movement, and the specific mechanism is not clear. Therefore, it is necessary to research the dynamic characteristics of the bubble bursting and wall effects.
From the above literature, it is found that the research works on the bubble dynamics characteristics of three-phase flow are challenging, and the bubble bursting mechanism, including the dynamic characteristics and wall effects, is still unclear. To address the above issues, we propose a modeling method for bubble burst based on the PLIC-VOF interface-reconstruction method. The bubble deformation information in high turbulence flow is tracked. The evolution mechanism of the bubble bursting, the micro-jet formed by the bubble burst, the interaction forces acting on the particles, and particle velocity distribution, were analyzed on a micro-scale [20,21,22]. A self-developed experimental observation platform based on PIV [23,24,25] is established to observe the bubble motion in the three-phase flow. The velocity vector diagrams and vorticity diagrams of the bubble bursting are obtained to reveal the dynamic characteristics of the bubble bursting impact wall, and then to verify the adopted numerical model and results.
In summary, the main scientific contribution of this paper is to provide a modeling method for bubble burst based on the PLIC-VOF interface-reconstruction method and reveal the evolution mechanism of the bubble bursting and wall effects under the turbulent condition. The above features can not only provide theoretical reference for bubble dynamics in a turbulent environment but can offer technical support for bubble controllability in the fields of machinery, chemical industry, and metallurgy [26,27]. This paper is organized as follows. In Section 2, a PLIC-VOF based interface reconstruction model is set up and a Pressure Implicit with Splitting of Operators (PISO) algorithm based on the VOF model is introduced to research dynamic characteristics and wall effects in the bubble bursting process. Then the numerical model and boundary conditions are acquired. In Section 3, the numerical results and discussions are presented. In Section 4, a self-developed PIV experimental platform is established to investigate the motion states of bubbles, and then verify the correctness of the proposed method. In Section 5, the conclusions are obtained.

2. Developing the Numerical Model

As mentioned above, the bubble burst in three-phase flow is a complicated gas-liquid-solid three-phase coupling problem with a high degree of nonlinearity, in which the process of bubble growth, movement, and burst is the research focus that needs to be paid attention to [28]. The numerical model involves three theoretical equations: flow field governing equations, particle motion equations, and bubble radial differential equations.

2.1. Flow Field Governing Equations

For many transient bubble motions, the gas and liquid phases are considered as incompressible fluids. In the computational fluid dynamics (CFD) method, the continuous fluid domain is discretized into the grid cells. The VOF model is a surface tracking method based on the Euler mesh [29], which is suitable for capturing and tracking the interface between heterogeneous fluids, and mainly involves the following governing equations. The continuity equation and Navier-Stokes (N-S) equations are expressed as follows:
ρ t + ( ρ u ) = 0
( ρ u ) t + ( ρ uu ) = P + μ ( u ) + ρ g
where ρ is the averaged fluid density, t is time, u is the fluid velocity, P is the fluid pressure, μ is the viscosity, and g is the gravitational acceleration. The volume fraction α q is the proportion of the space occupied by the fluid in the grid, which is defined by α q = V q / V c , where V q is the volume of the q phase and V c is the total volume in a grid cell. The averaged fluid density ρ = α w ρ w + α g ρ g , where α w and α g denote the volume fraction of the water-phase and gas-phase, ρ w and ρ g are the density of water-phase and gas-phase. In a grid cell, the sum of the volume fraction of all phases is 1. For any of the phases, if α q = 0 , the cell does not contain the q phase fluid; if 0 < α q < 1 , the cell contains both the q phase and other multiphase fluids, which indicated that this cell at the interface between the q phase and the other phase; if α q = 1 , it means the q phase fluid fills the whole cell. Each phase occupies a different proportion in each grid cell, making the variables and their attributes shared by each phase.
Due to the surface deformation of the bubble being key for studying bubble bursting dynamics, the fitness of interface reconstruction is quite an important factor. The surface shape of the tracking bubble is simplified to a circle. The PLIC [30,31,32] method has a good degree of fineness on a circular surface. In addition, the convergence of free interfaces in advection and shear velocity fields are good and the structured interface has high precision. Thus, the PLIC method is conducted to solve the free interface shape in the bubble bursting progress. According to the law of fluid motion similarity, the bubble bursting model is simplified into the two-dimensional model (in Section 2.5). In the 2D flow field, as shown in Figure 1, there is a two-phase fluid interface at the boundary in the grid cell (i,j), where the imaginary line A1C1 represents the actual shape of the free interface in the cell and the real line AC represents the corresponding reconstructed free interface shape. Assuming that the normal vector n is defined as the center of the grid, the center normal vector n can be obtained by averaging the normal vectors at the four corners of a grid.
n i , j = 1 n ( n i + 1 / 2 , j 1 / 2 + n i 1 / 2 , j 1 / 2 + n i + 1 / 2 , j + 1 / 2 + n i 1 / 2 , j 1 / 2 )
In Figure 2, the component of n = ( n x , n y ) is the positive direction. The line equation of the interphase interface is given by:
n x x + n y y = b
where b is the distance from B to the interface AC. The area of the fluid region E i j is the area of the shaded region S A B C , that is:
E i j = S A B C
According to the obtained E i j and b , the unique line segment of the interface in the grid can be found, and then the interphase interface can be determined. At the moment, the PLIC free interface reconstruction technology, possessing second-order precision of Youngs, is introduced to improve the calculation convergence [33]. The PLIC-VOF modeling method has the advantages of high precision and small calculation in the interface between gas-phase and liquid-phase [31]. Therefore, the bubble bursting model based on PLIC-VOF is used to track the bubble movement to simulate the bubble deformation and bursting progress.
The bubble bursting process is a complicated physical and chemical process, which is accompanied by a local high temperature and pressure [34,35]. The law of conservation of energy is expressed as:
δ ( ρ T ) δ t + ( ρ T u ) = ( μ P r T )
where T is the temperature and P r is the number of Prandtl.
When the bubble bursts, a mass of energy is released to generate a micro-jet, which increases the particles velocity in the fluid. The details of the calculation of the energy equation in Equation (6) are shown in Table 1.
In the bubble bursting process, this transient pressure is quite high. When R 0 / R = 25 , P m a x = 2461 P 0 . After the cavitating jet is introduced into the waterjet, the impact pressure relationship between the cavitating water-jet and the ordinary continuous high-pressure water-jet is obtained. When a = 1 / 6 ~ 1 / 10 , P i = ( 8.6 12.4 ) P s . This phenomenon indicated that the cavitating water jet is more beneficial for increasing the kinetic energy of particles.
The bubble bursting process is a complex turbulence matter. To simulate the bubble bursting process accurately, the turbulence model should be adopted. In view of the advantages of the realizable k - ε turbulence model in dealing with swirling, shearing, and jet flows, this paper adopts a realizable k - ε turbulence model to simulate the dynamic characteristics and wall effects of bubble bursting [36,37]. In addition, the realizable k - ε turbulence model can accurately predict the position and shape of bubbles. The realizable k - ε turbulence model is expressed by:
( ρ k ) t + ( ρ k u i ) x i = x j [ ( μ + μ t σ k ) k x j ] + G k ρ ε
( ρ ε ) t + ( ρ ε u i ) x i = x j [ ( μ + μ t σ t ) ε x j ] + ρ C 1 E ε ρ C 2 ε 2 k + v ε
where k and ε are the turbulent kinetic energy and its dissipation rate, σ k and σ ε are the Prandtl number of k and ε , μ t is velocity, μ t is the eddy viscosity, which can be solved by μ t = ρ C μ k 2 / ε , G k is the turbulent kinetic energy caused by the average velocity gradient, C μ is turbulent viscosity and E is the modulus of the time-averaged strain tensor. These other empirical parameters are as follows: C 2 = 1.9 , σ k = 1 , and σ ε = 1.2 . The equations for some key parameters of the realizable k - ε turbulence model are listed in Table 2.
In the three-phase turbulent flow field, the bubbles and particles have parallel movement and rotation during the movement [38], and at the same time, the instantaneous vortex generated by the bubble burst causes the particles to rotate [39,40,41]. Using the above models, the flow field profiles can be obtained. In view of the advantage of the realizable k - ε turbulence model, it can be conducted to accurately predict the trajectory and deformation of the bubble in the high-speed turbulent flow, avoiding distortion in the process of simulation analysis.

2.2. Particle Motion Equations

In the three-phase flow, the particles are assumed to be spherical. Due to the quality score of particles being small, the interaction forces between particles are ignored. The fluid-particle interaction forces consist of six parts [42,43]: gravity, buoyancy, Stokesley of flow field, drag force, pressure gradient force, and Saffman lift. The motion of particles is described by Newton’s laws of motion on an individual scale [25]. Therefore, the particle motion equation in three-phase flow is expressed as:
F = m d v d t = G + F b + F S t o k e s + F d + F p + F s
where F is the net force on the particle, m is the particle mass, v is the particle velocity, G is gravity, F b is buoyancy, F S t o k e s is Stokesley of flow field, F d is the drag force, F p is the pressure gradient force, and F s is the Saffman lift. The calculational details of the forces and torques in Equation (9) are shown in Table 3. In combination with the bubble bursting characteristics, the impact force of the micro-jet on the particles is acquired to reveal the particle motion laws and dynamic characteristics.

2.3. Bubble Radial Differential Equations

A bubble in liquid is assumed to be spherical. The bubble may deform if an external force is applied. In a high-speed turbulent environment, the rapid flow of liquid around the bubble can cause asymmetric contraction and expansion [44,45,46]. Because the Rayleigh-Plesset (RP) equation is a hydrodynamic equation, it could describe the bubble dynamics from a macro perspective, which has been verified by numerous experiments [47]. The variation mechanism of the bubble surface is the most important part for studying the dynamic characteristic of the bubble in a three-phase flow, so the solving method of the bubble radial will be quite important. To track the time evolution of the bubble radius, the bubble radial differential equation, considering the influence of the bubble surface tension, saturated vapor pressure, constant bubble mass and liquid viscosity [48], can be obtained (Equation (10)) based on the RP equation [10,14].
R R ¨ + 3 2 R ˙ 2 + 4 μ ρ g R ˙ R + 2 σ R 1 ρ g ( P 0 P w + 2 σ R o ) ( R o R ) 3 γ = 1 4 ( u f i 2 u g i 2 ) 2 1 ρ g ( P o + P v )
where R is the bubble radius, σ is the surface tension, R ˙ and R ¨ are the first and second-order derivatives of versus time, P v is the saturated vapor pressure, P w is the hydrostatic pressure, u g i is the bubble velocity. In the bubble bursting process, the bubble is subject to deformity due to the velocity difference between the bubble and fluid, of which the difference must be considered. Since the bubble surface is prone to deform during the movement, the deformation of the bubble can be calculated from the bubble radial differential equation, which reveals the edge characteristics and motion laws of bubble bursting in three-phase flow.

2.4. Numerical Simulation Algorithm

For the phase interface changing process of bubble movement, burst, and hitting the wall, the modeling method for the bubble burst is conducted to track the dynamic boundary of the bubble. Pressure and velocity are the most important physical parameters in the bubble bursting model. The coupling calculation of these parameters is one of the key factors for the correctness of this model [49,50]. For the numerical solution of Equations (1) and (2), the PISO algorithm is adopted, which is the extension of the SIMPLE algorithm. The PISO algorithm is a procedure for calculating the pressure-velocity couple for the N-S equations. The major process of the VOF model solved by the PISO solution is shown in Figure 3. Considering the bubble bursts in the high-speed turbulence environment, momentum, turbulent kinetic energy, and dissipation rate are discretized by a second-order upwind scheme to acquire a better convergence.

2.5. Numerical Model and Boundary Condition

To optimize the precision machining process [51,52,53], the physical model of three-phase particle flow is set up. In the precision machining of gas-liquid-solid three-phase abrasive flow, the three-phase flow in the state of high-speed turbulence is conducted as the medium to remove materials from the workpiece surface through complex coupling effects, such as bubble burst and particle collision [54]. This paper majors in the bubble burst near or on the wall. The huge energy generated by the bubble burst can generate micro-jets, which accelerates the surrounding particles to process the workpiece surface. Its working principle is shown in Figure 4. The processing disc is fixed by the machinery, which makes the existence of a micro-gap between the bottom of the processing disc and the workpiece surface. In the inner cavity of the processing tool, the mixture of abrasive particles and bubbles forms a swirling flow. The mixture is restrained in a face-constrained channel, which is composed of the bottom of the processing disc and the upper surface of the workpiece.
In the above case, the micro-nano bubble pump is conducted to produce micro-nano bubbles without interruption and adjust the size and concentration of bubbles. The bubbles are fed into three micro-nano bubble inlets arranged at 120° on the processing plate. The bubbles mix with the processing medium formed by abrasive particles and water, which quickly enters the vortex of abrasive flow. In the closed region, the strong centrifugal oscillation makes the micro-nano bubbles burst, and the energy of the bubble bursting is released, which causes a plurality of micro-jets to accelerate the abrasive particles. So, the kinetic energy of the abrasives hitting the surface is increased, and the shock wave disturbs the order of the abrasives, which can make the abrasives move in all directions and increase the processing efficiency of the workpiece surface.
According to the law of fluid motion similarity, the precision machining structure of gas-liquid-solid three-phase abrasive flow can be simplified into the two-dimensional model shown in Figure 5a. The 2D model has the advantages of greater grid quality, simple structure, and time-saving cost, etc., which makes it easier to observe the bubble-surface edge changes and the situation where a single bubble bursts into multiple bubbles [55]. The boundary conditions of the model are listed in Table 4. In the three-phase abrasive flow processing process, bubbles and abrasive particles move together with the fluid medium. The related physical parameters are listed in Table 5. In the simulation, it is necessary to observe that the deformation and movement trajectory of the bubble, so the grid size should be set to be an order of magnitude lower than the bubble and the abrasive size as much as possible. It is guaranteed that the shapes of bubbles and particles are nearly round in their initial state under the condition that the computer is running. As for the whole model using nanoscale grid simulation, the running efficiency of the computer is quite low. Based on the above considerations, the local grid is conducted to encrypt the restricted channel and structural quadrilateral meshes are used in the rest of the model. To ensure the accuracy of the calculation results, the mesh quality is adjusted to the highest within the range allowed by the computing conditions. A partial mesh-enlarged drawing is shown in Figure 5b.
Considering the unsteady process in the simulation and complex interphase changes, the PISO algorithm is adopted to ensure the convergence efficiency. In this case, the primary phase is liquid water and the second phase is gas with a bubble diameter of 50 μm. The solid phase is microparticles (silicon carbide or alumina) with a diameter of 10 μm. The size of microparticles is quite small, and the abrasive particles move with the fluid medium in the abrasive flow, so the third phase is the particle in the simulation. The results of the deformation during the bubble bursting process, the jet velocity, and the resulting high pressure on the wall are obtained in the calculation process.

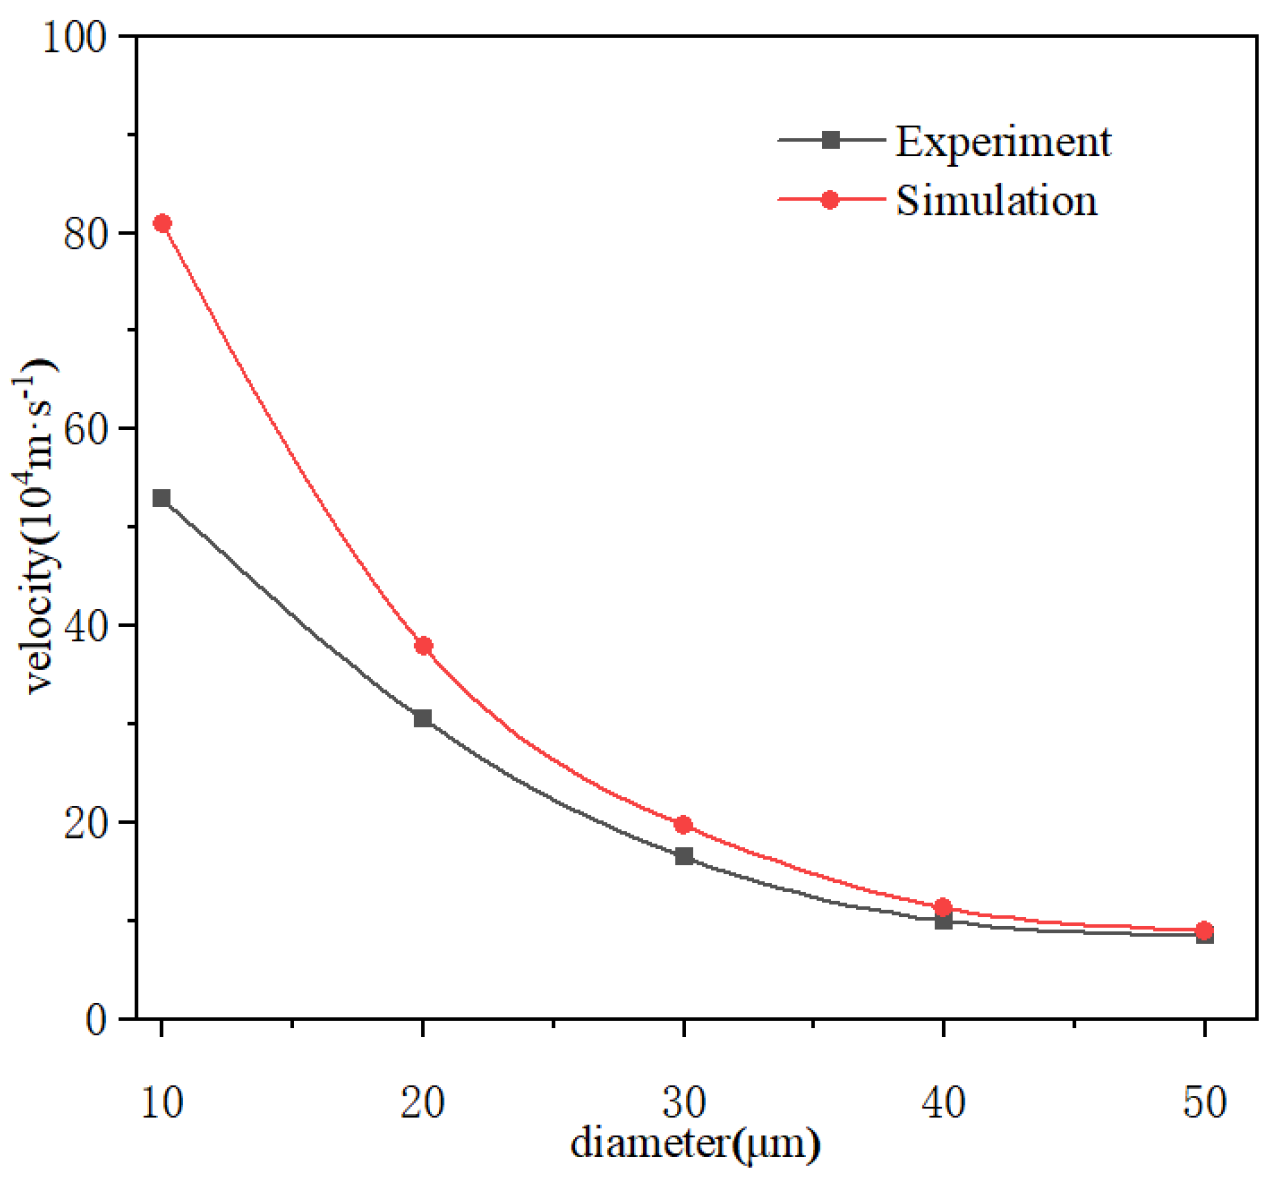
2.6. Model Validation

To validate the effectiveness and accuracy of the numerical model, the experiment data through the PIV experimental observation platform compares (in Section 4) with simulation data. In fact, the experimental apparatus cannot reach the ideal state described by the numerical model. The dynamic characteristics of the bubble bursting in three-phase flow are only validated qualitatively [19]. Taking the bubble bursts of different diameters as a case, the maximum velocity when bubbles burst comparison curves between the experiment and simulation are shown in Figure 6. When the bubble diameter is 10 μm, due to the particle size and the bubble is hardly the same, the disturbance of the particles has an interference on the bubble bursting process, resulting in a large difference between the experimental and simulation results. When the bubble diameter is greater than 20 μm, the difference between particles and bubble size decreases, and the interference of particles in the bubble burst is reduced, the simulated results and the experimental values have a good consistency. With the increase of bubble diameter, the error between experiment and simulation results becomes smaller and smaller (in Table 6). When the bubble diameter is 50 μm, the error is within 6%. To reduce the interference of particles and be prone to analyzing the dynamic characteristics and wall effects of the bubble bursting, this paper chooses the bubble diameter of 50 μm. The validation of the dynamic characteristics and wall effects will be qualitatively carried out in the discussion of the main findings in the following sections.

3. Numerical Results and Discussions

Gas-liquid-solid three-phase particle flow is a complex turbulent mechanic matter, in which the bubble burst processing has high nonlinear features. Due to the different position of bubbles, the trajectory and evolution mechanism of bubbles in the flow field is also different. To facilitate the analysis, the area near the lower surface is divided into two parts, which are near the wall and on the wall. The area near the wall refers to the area where the distance between the wall and the bubble center is 50–200 μm and the area on the wall refers to the bubble that can be attached to the wall. To acquire the dynamic characteristics and wall effects of the bubble bursting, this paper conducted numerical research from three aspects: (1) the bubble bursting regularities on and near the wall are obtained to reveal the dynamic characteristics and the wall effects of the bubble bursting; (2) the mechanism of coalescence and burst of double bubbles is studied to acquire the effect of the bubble fusion on jet intensity; (3) the bubble trajectory is investigated to obtain the impact of initial velocity on the bubble burst.

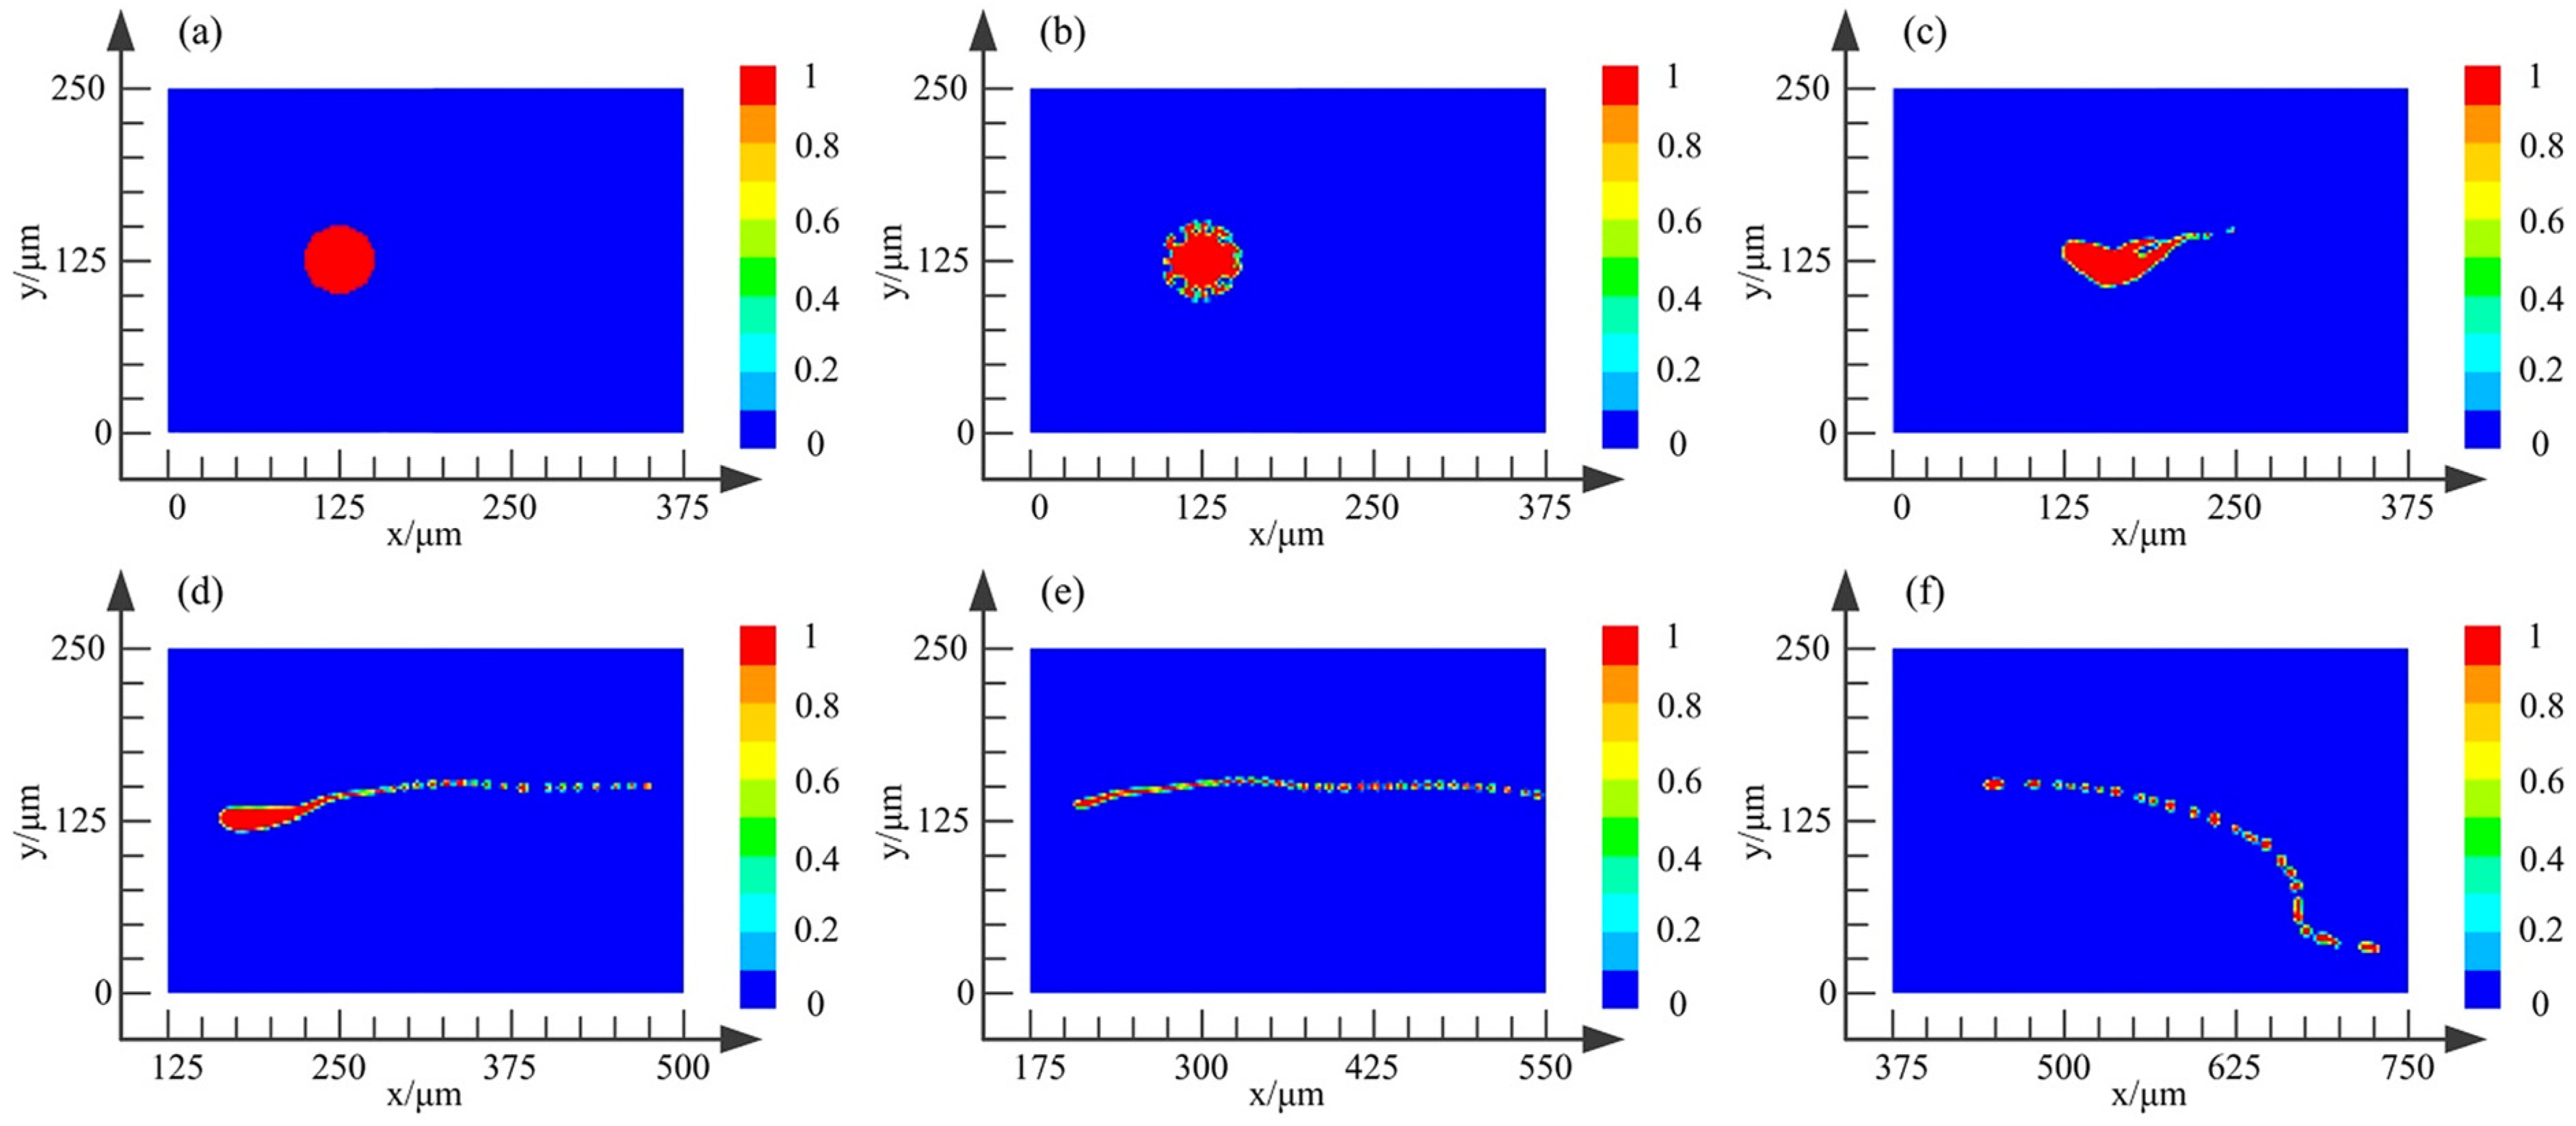
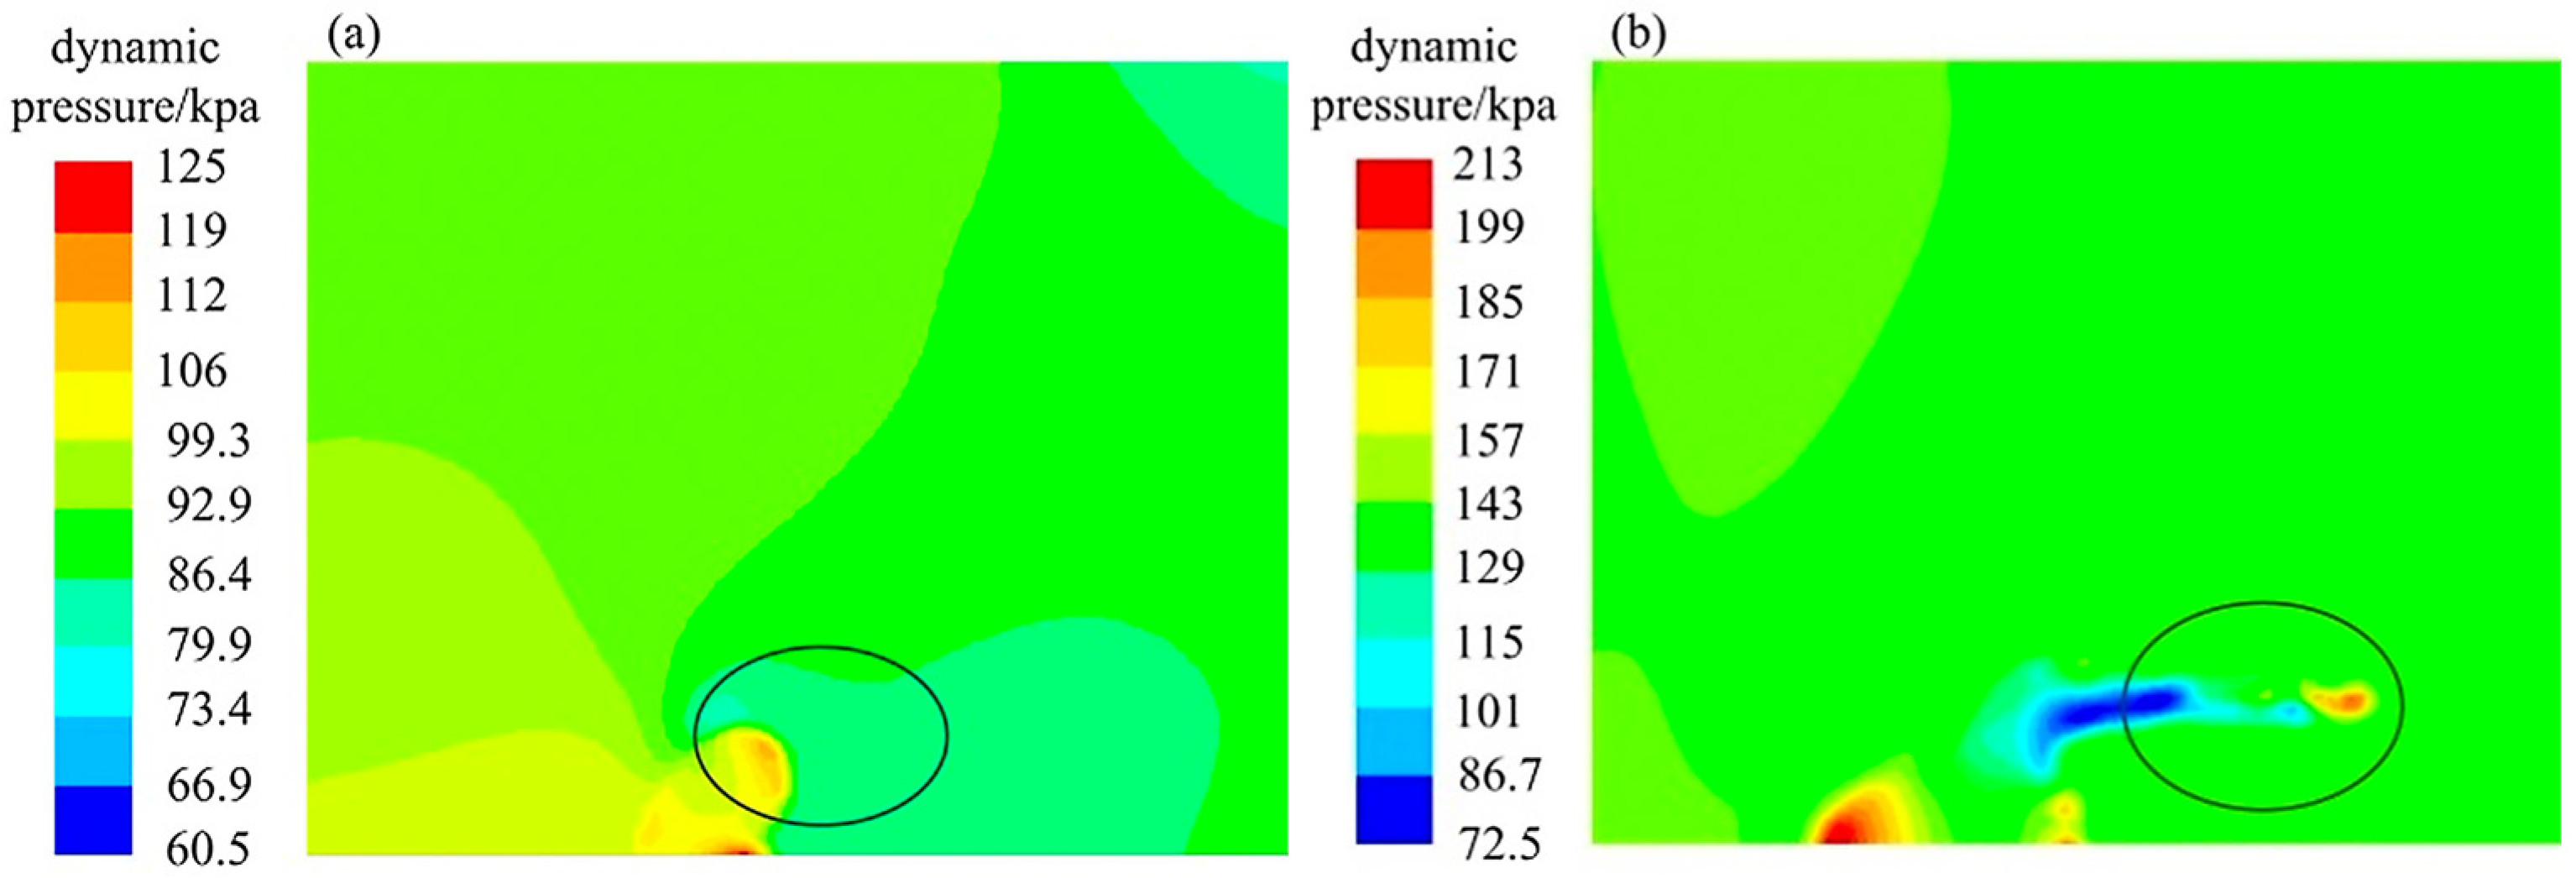
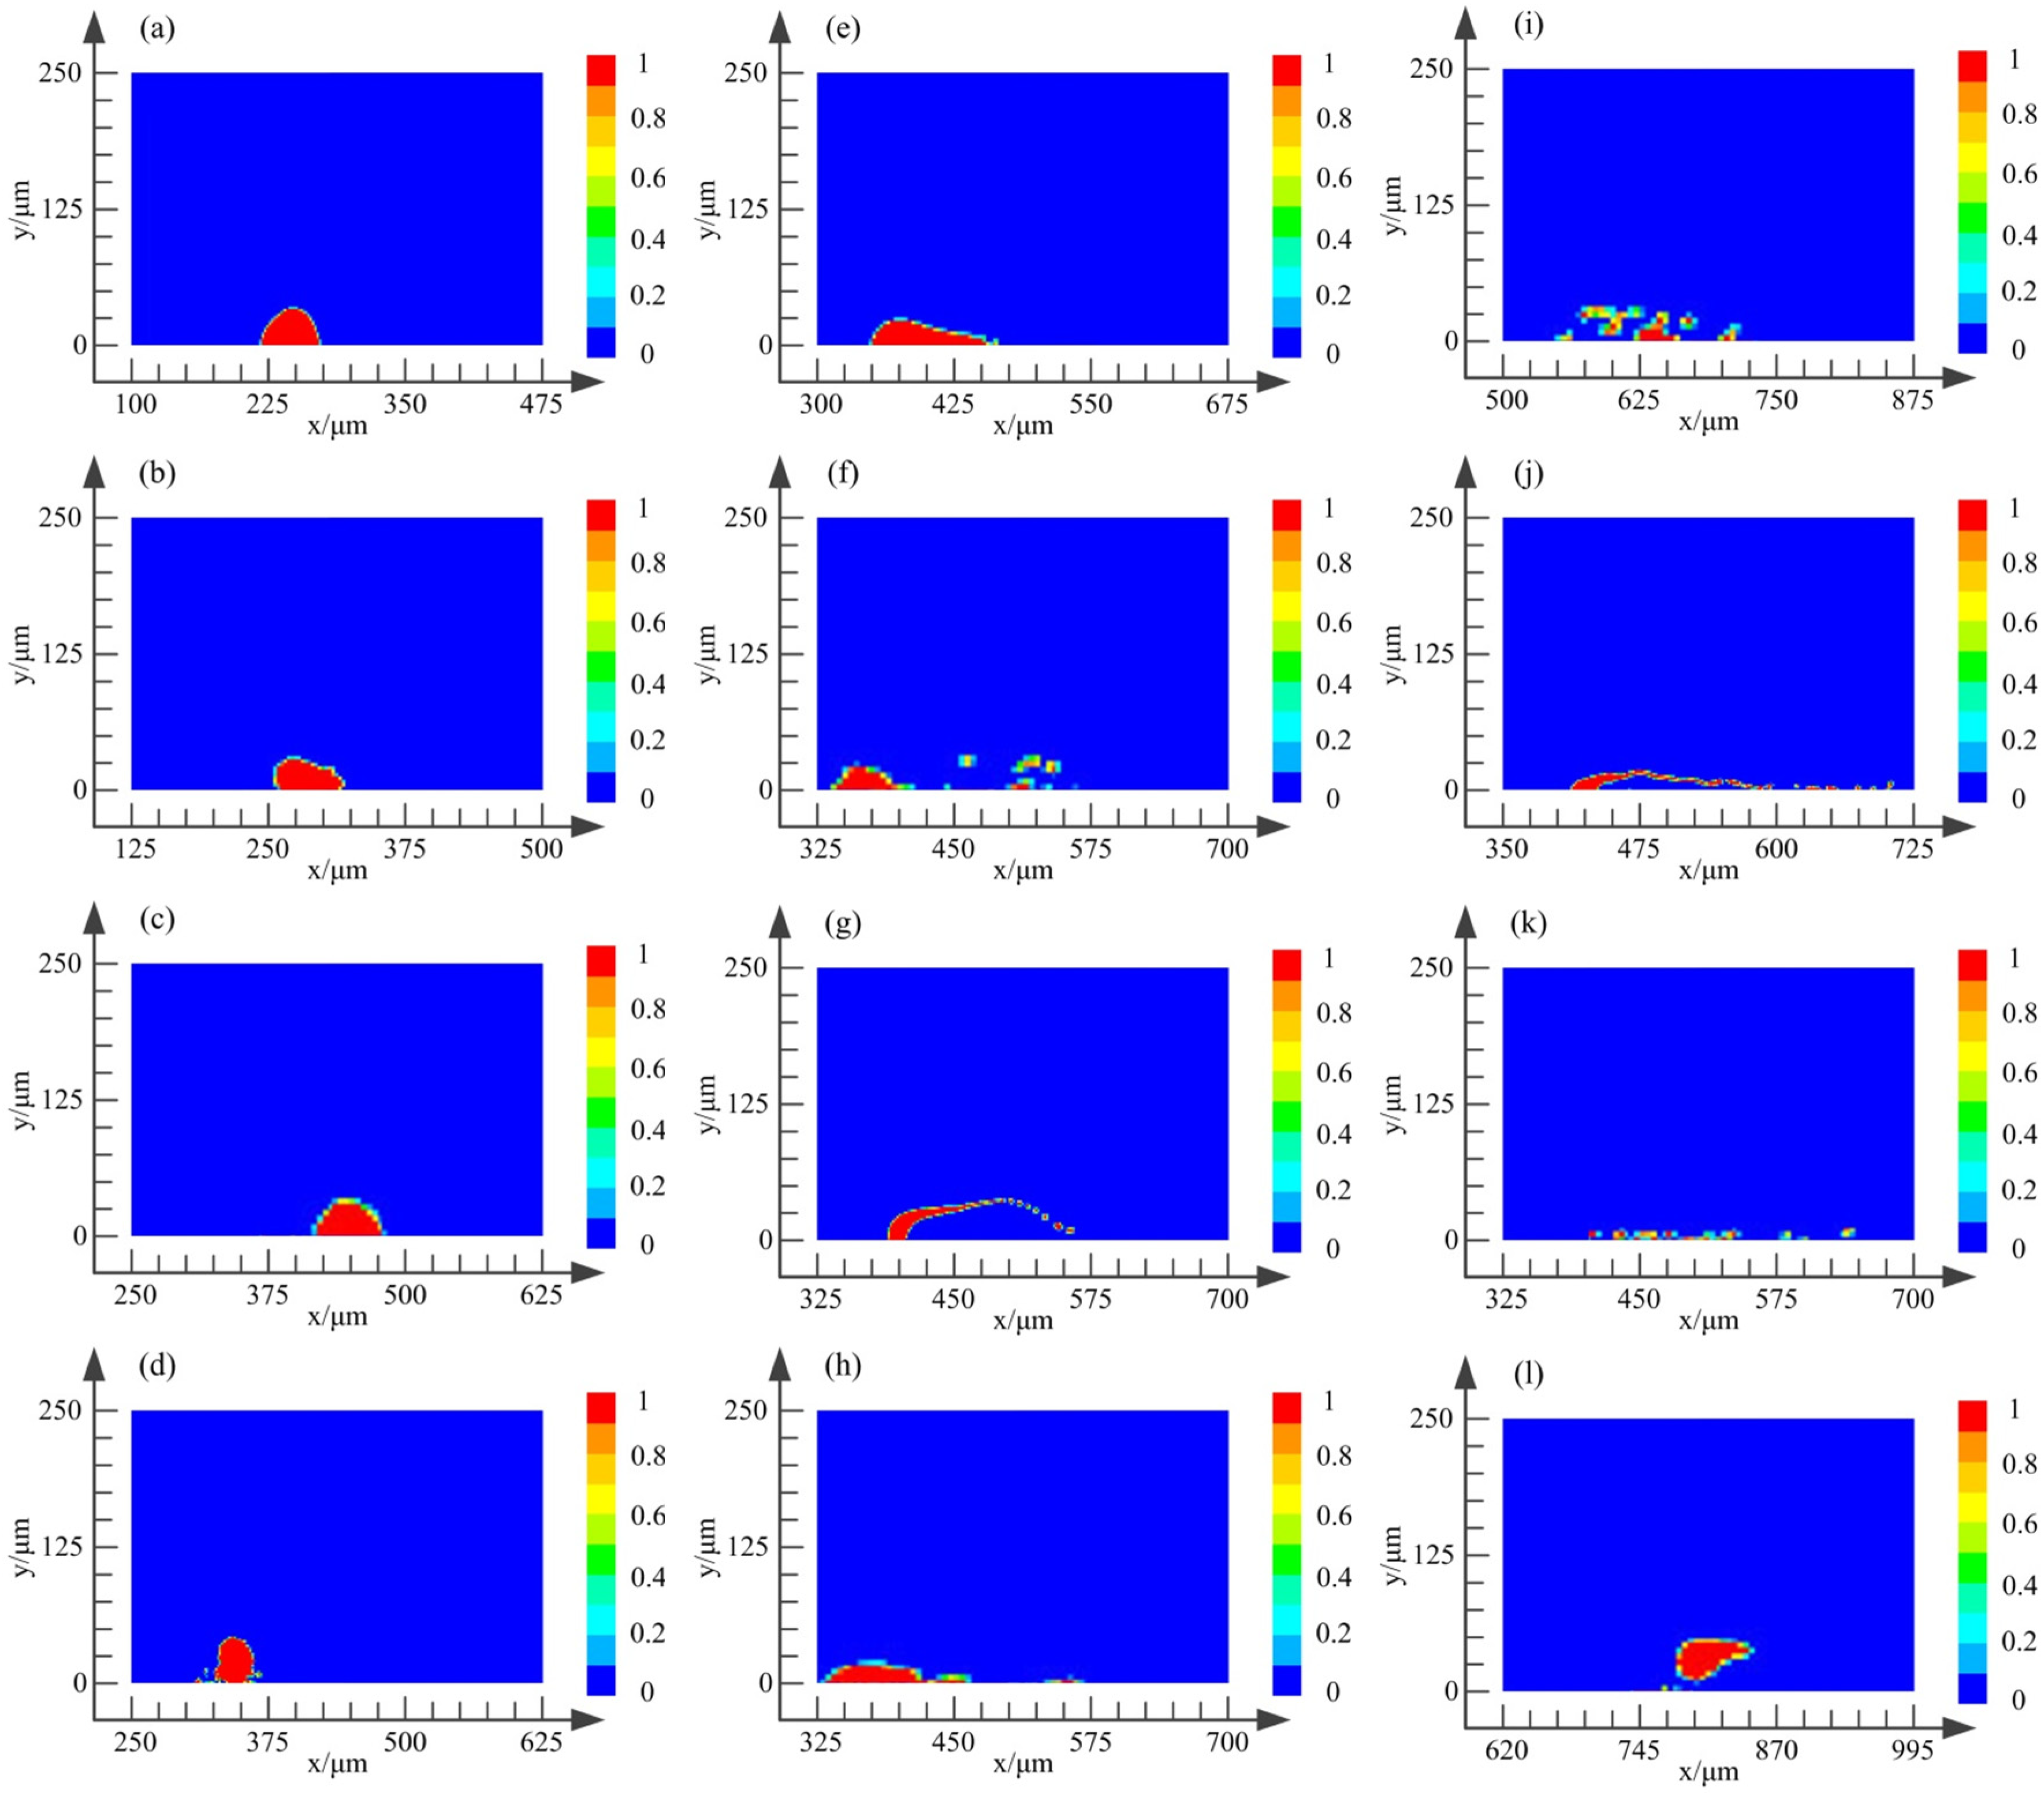
3.1. Bubble Burst Near the Wall

The flow field near the wall is the key region observed in this study [56,57]. Volume fraction profiles of the bubble bursting near the wall at different times are shown in Figure 7. The initial state of the bubble is spherical with a diameter of 50 μm, and the bubble center is 125 μm away from the wall. The red area is the air area, and the blue area is the water area. Figure 7 indicates that the velocity of the bubble-wall motion away from the entrance is faster, and the velocity near the entrance is slower. The bubble-wall away from the entrance moves along the flow direction to make the bubble become a sunken shape in the bubble bursting process.
The deformations of the bubble-wall in the bubble bursting process are shown in Figure 7a–f. It can be seen that the bubble shrinks and deforms into a spiral line, and then sinks from the tail under the action of high-speed flow. The bubble burst deviating from the center is asymmetrical, in which the bubble bursts into a relatively large bubble and a tiny bubble. The jet passes through the bubble burst place and points to the wall in the direction of 45°, resulting in a pair of reverse vortices formed on the sides of the jet and the center of the vortex contains residual bubbles. The vortex strength gradually weakens and spreads to both sides, and the jet velocity correspondingly decreases. After the bursting of the main bubble near the wall, the residual bubble moves spirally along with the fluid flow and the residual bubbles can continue to burst into a main bubble and a tiny bubble adopting the above way. The resistance of the small bubbles is smaller than that of the main bubbles, resulting in the tiny bubbles moving faster. Therefore, it is observed in the simulation that the main bubble bursts into many tiny bubbles, and due to the first bubble burst being closer to the exit the spacing between bubbles increases, and the shape of the single bubble changes from a circle to a long strip.
To analyze the effect of the jet generated by the bubble burst near the wall, the jet velocity vector diagrams under the condition of 50 μm from the center of the bubble to the wall are obtained. The high bubble-wall velocity and high-speed waterjet are shown in Figure 8. The arrow direction represents the direction of the jet velocity, and the length of the arrow and the depth of the color represent the velocity magnitude. As shown in the marked part of Figure 8, it can be found that the jet generated in the high-speed velocity is not perpendicular to the wall, and the jet is at an angle of about 45° when the bubble bursts. The jet direction is opposite to the velocity of the fluid flow and it is called a reverse oblique jet. The maximum jet velocity at different distances between the bubble and the wall is much the same, but the velocity of reaching the wall is different. With the distance decreasing, the jet velocity increases exponentially [15]. It is also seen from Figure 8 that the diameter of the high-speed jet is quite small, less than 10% of the bubble diameter. Therefore, it is considered that only when the bubble bursts close enough to the wall, a high-speed jet is formed on the wall, so that the particle velocity reaches the maximum.
To obtain the influence of the micro-jet on particle acceleration, this paper selects five particles around the bubble as the object, which observes the change of the particle’s velocity during the bubble bursting process. The instantaneous particle velocity under the inlet velocity of 30 m/s is shown in Figure 9. It is indicated that the overall change trend of the five particles is the same. The trend of the five particles is that the instantaneous velocity is slow in the first 30 μs, that the instantaneous velocity increased gradually during 30–60 μs, but that the instantaneous velocity decreased rapidly at 70 μs, and that the instantaneous velocity decreased to the initial velocity at 80 μs. The above analysis concluded that the bubble deformation has little effect on particles. With the increase of bubble-wall velocity, the strength of the micro-jet gradually increases until the bubble completely bursts, and at that moment, the maximum of both micro-jet strength and instantaneous speed are reached [58,59,60]. Due to the effect of viscosity and the drag force, the particle velocity drops sharply until it reaches the initial velocity. It illustrates that the jet intensity is a positive correlation with particle acceleration [61].
The multiple bubbles coalescence and burst is a typical physical process in three-phase flow [62,63]. This paper takes two parallel bubble coalescence-burst processes as a case, as shown in Figure 10. It is found that the coalescence process of smaller spherical bubbles is rapid, and the formation and expansion of the pneumatic bridge are brief. In the simulation, the horizontal distance of the double bubbles (d = 50 μm) is 100 μm, and the initial state is shown in Figure 10a. The bubble edge begins to deform under the action of fluid, and the positions of the double bubbles change constantly due to the bubbles moving in an s-shape in the flow field, as shown in Figure 10b–d. The horizontal spacing between the double bubbles decreases continuously, and they get closer and closer. A pneumatic bridge is formed between the double bubbles, and then the pneumatic bridge gradually expands. As shown in Figure 10e, when horizontal spacing is less than the critical value, due to the influence of the flow rate in the horizontal direction, they get close to each other in the vertical direction and merge into one. Meanwhile, the fused bubble tail begins to burst. As time goes on, the fused bubble completely bursts and these tiny bubbles turn into a long strip. The coalescence of the double bubbles can be divided into three stages: (1) due to collision and attraction in the horizontal direction, the double bubbles get closer; (2) a pneumatic bridge is formed between the double bubbles, and the double bubbles are connected with each other; (3) the pneumatic bridge expands rapidly horizontally, and the double bubbles merge into a whole. The fused bubble is irregular in shape, and it is unstable and prone to burst under the action of the flow field.
Compared with the volume fraction profiles of a single bubble bursting, the double bubbles bursting process is with the following regularities: (1) the double bubbles coalescence-burst process needs more time, which can decrease the micro-jet velocity and the effect of micro-jet on particles; (2) the multiple bubbles coalescence can expand the size of the fused bubbles, which also decrease the micro-jet velocity (in Figure 6).

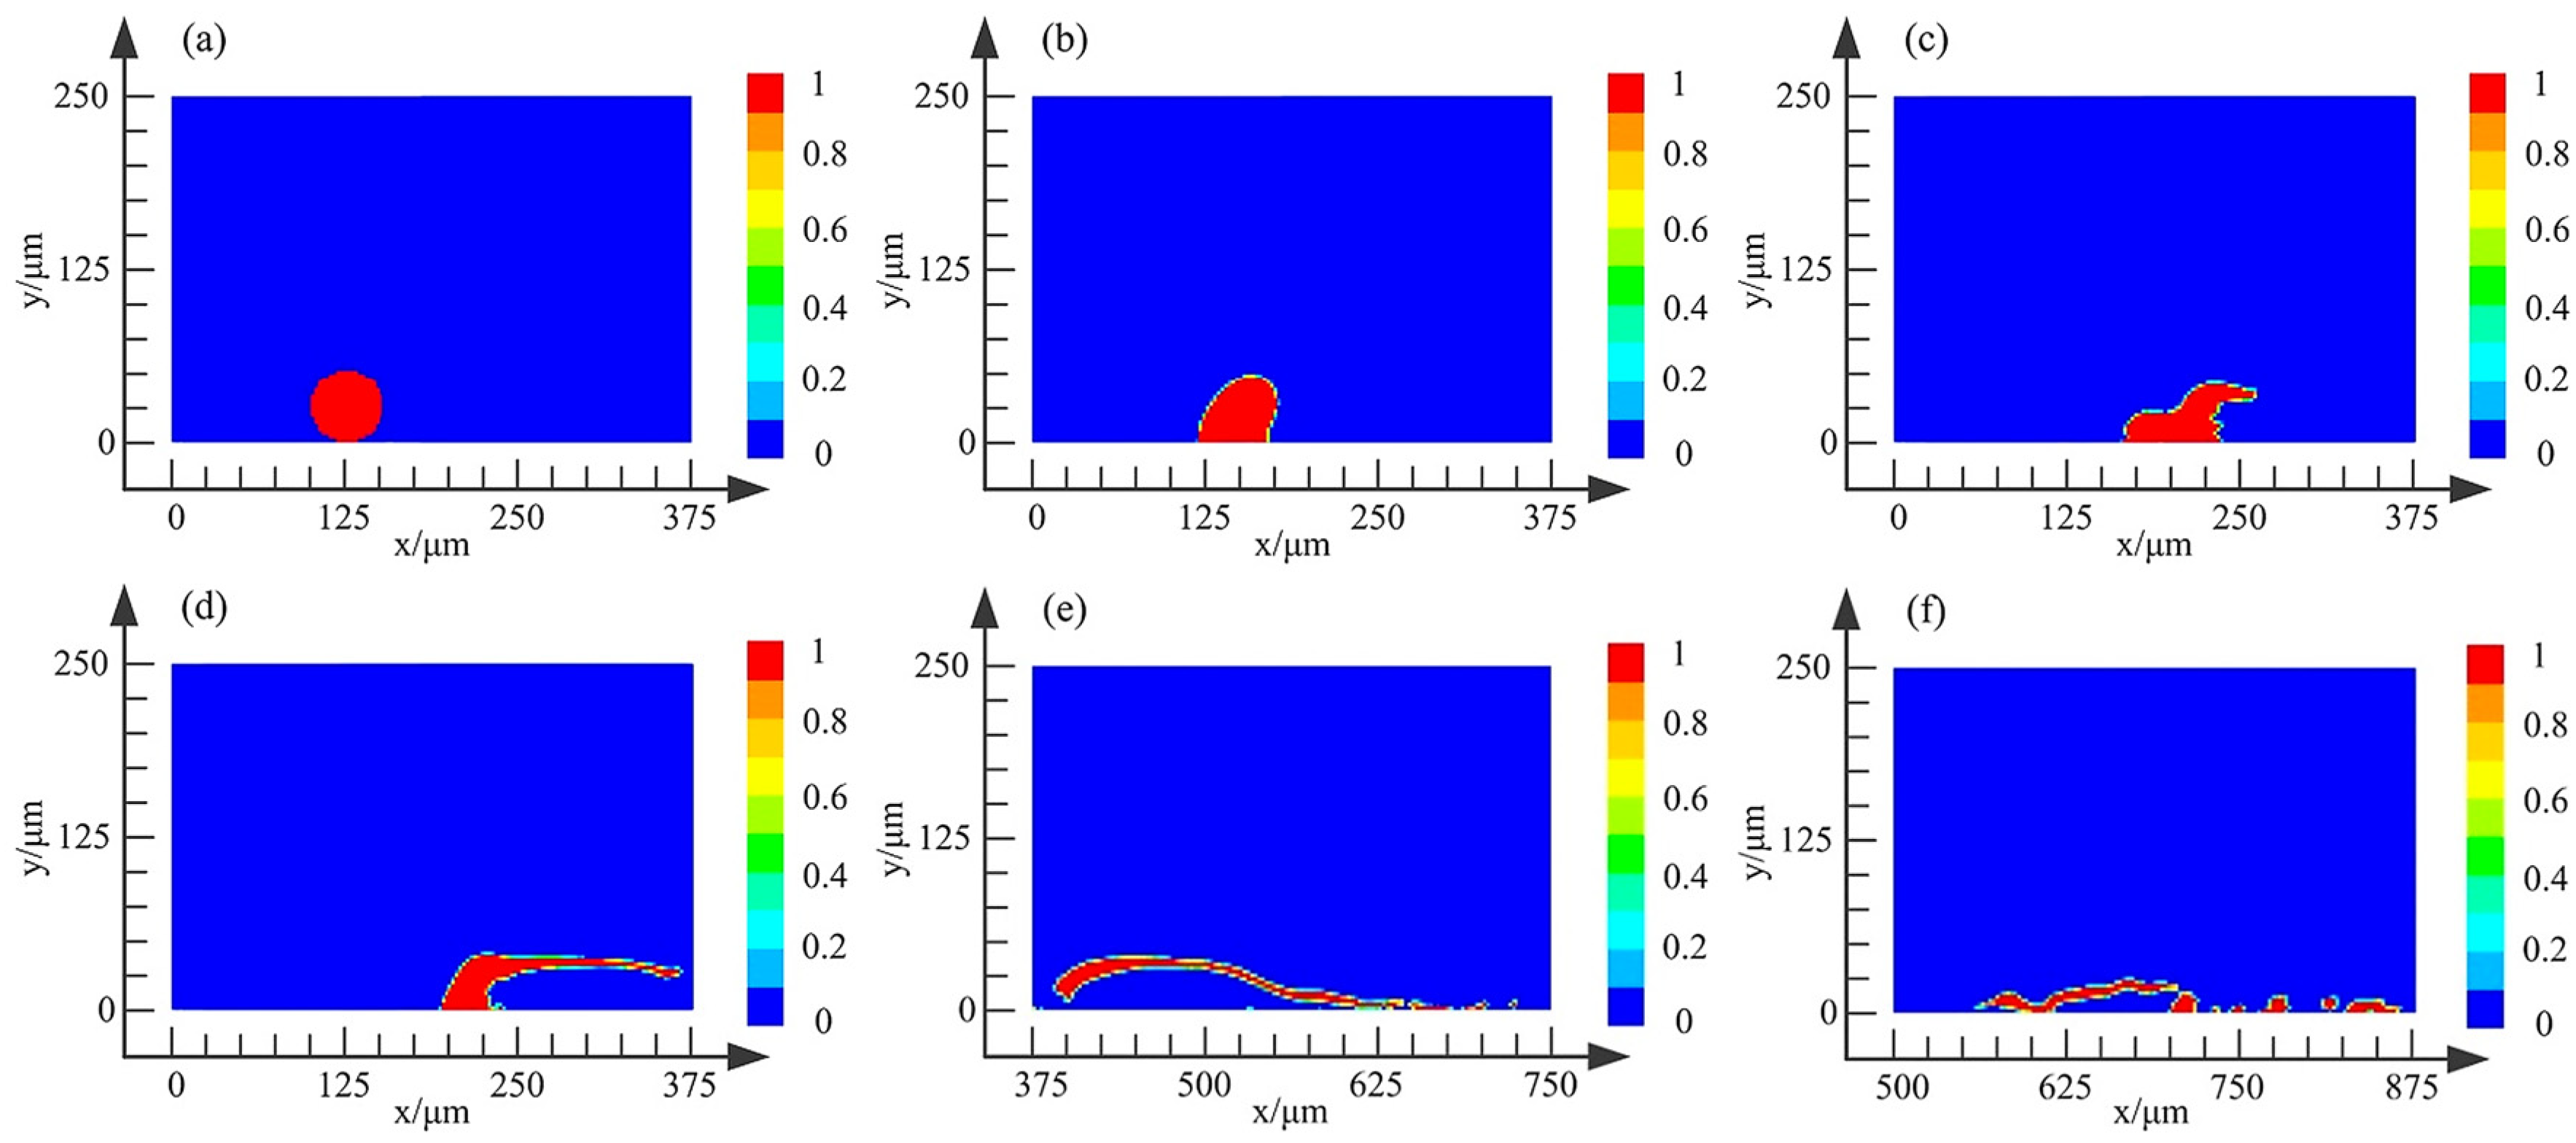
3.2. Bubble Burst on the Wall

During the bubble movement in the flow field, due to the disordered movement of the fluid in the three-phase flow, some bubbles will be attached to the wall of the flow channel and then begin to burst. The volume fraction profiles of the bubble (d = 50 μm) bursting on the wall at different moments are shown in Figure 11. The bubble rolls along the direction of the fluid motion in the initial state. After rolling for a while, the bubble begins to divide into a main bubble and a tiny bubble. Due to small fluid resistance and the lightweight of the tiny bubble, the tiny bubbles are quickly taken away from the wall to move toward the exit. Meanwhile, the main bubble is still attached to the wall, continues to roll, and burst into more tiny bubbles, and the circulation follows [64]. Compared with the single bubble burst near the wall, the micro-jet on the wall is closer to the wall and the jet intensity approaching the wall is closer to the maximum, so the bubble burst on the wall is more conducive to increase the kinetic energy of particles hitting the wall. In this case, the jet is conducted to accelerate the particle velocity, which increases the disorder of particle movement [65]. Therefore, the bubble burst on the wall is conducive to the particles cutting the materials of the workpiece surface, which can improve the machining efficiency.
The pressure distribution in the bubble bursting process is shown in Figure 12. Figure 12a shows the pressure profile of a bubble about to burst, which is the local pressure distribution of Figure 11c. Under the condition of high-speed turbulence, the tail of the bubble begins to burst firstly. The marked part in Figure 12a shows that, compared with other parts of the bubble, the pressure difference between the inside and outside of the bubble tail is the largest, so the bubble burst starts at the bubble tail. After the tail of the bubble bursts, the pressure inside the bubble decreases significantly, as shown in Figure 12b. After the bubble tail bursts into many tiny bubbles, the edge of the main bubble tail is extremely unstable, so many tiny bubbles continue to burst along the direction of fluid flow. Bubble burst produces a micro-jet and strong impact force. Along with the direction of fluid flow, the pressure inside the tiny bubbles gradually decreases, and the pressure inside the main bubble will decrease when a small bubble is produced each time [66].
The volume fraction profiles of the bubble on the wall after a certain period of time at different inlet velocities are shown in Figure 13 for the initial state distribution of the bubble pf 3/4 circle, 1/2 circle, and 1/4 circle, respectively [67,68,69,70]. The motion of the 3/4 circle bubble after a period of time is shown in Figure 13a–d for the inlet velocities of 30, 40, 50, and 60 m/s, respectively. When the inlet velocity is 30 m/s, the bubble essentially remains three quarters spherical without bursting. When the inlet velocity is 40 m/s, the main bubble basically does not burst, but many tiny bubbles are produced at the edge of the bubble. When the inlet velocity is 50 m/s, the bubble rolls forward along with the fluid flow, many tiny bubbles burst out from the tail and the shape of the main bubble changes from spherical to elongated. When the inlet velocity is 60 m/s, the bubble completely bursts along with the fluid flow. Many tiny bubbles are taken to the exit, but the main bubble is still adsorbed on the wall. After flowing for some distance, the tiny bubbles continue to move along the wall until they reach the exit.
As shown in Figure 13a–d, it is easily concluded that the bubble burst on the wall becomes more sufficient with the increase in flow rate. Due to the flow rate range being 30–60 m/s, when the flow rate is 60 m/s, the bubble burst is the most sufficient, and the acceleration effect on particles is the most obvious in the shortest time. After the same time, the profiles at the initial state of the 1/2 circle bubble are shown in Figure 13e–h for the inlet velocity of 30, 40, 50, and 60 m/s, respectively. When the inlet velocity is 30–40 m/s, the shape of the bubble changes obviously, but it hardly bursts. When the inlet velocity is 50–60 m/s, the bubble bursts into many tiny bubbles, which are closed to the wall and the particle acceleration is most obvious. The profiles at the initial state of the 1/4 circle bubble are shown in Figure 13i–l for the inlet velocity of 30, 40, 50, and 60 m/s, respectively. The shape of the bubble does not change significantly, and the bubble does not burst when the inlet velocity is 30 m/s. The bubble bursts sufficiently and occurs on the wall when the inlet velocity is 40 and 50 m/s. However, when the inlet velocity is 60 m/s, the bubble begins to move away from the wall and does not burst after the same time. The above analysis explains that when the inlet velocity range in three-phase flow is 30–50 m/s, the higher the inlet velocity is, the more sufficient the bubble bursting will be; however, when the inlet velocity increases to 60 m/s, the bubble will escape from the wall without bursting due to the excessive velocity in the flow channel.
The volume fractions profiles of double bubbles (d = 50 μm) bursting on the wall are shown in Figure 14. The horizontal spacing between the double bubbles is 75 μm and the initial state is shown in Figure 14a. The double bubbles edges begin to change with the movement of the fluid medium, some tiny bubbles are generated by the bubble bursts, but the size of the main bubble is hardly changed. The shape of double bubbles changes from spherical to elongated along the fluid flow, the spacing between the double bubbles gradually decreases, and a slender pneumatic bridge begins to form between the double bubbles. As the relative contact velocity is relatively high, the interaction time of the bubbles is too small, which is not conducive to the drain of the liquid film when approaching, so that the two bubbles are not completely fused into one. After the bubbles fuse for a period of time, the tail of the right bubble begins to burst, which is consistent with the bursting characteristics of a single bubble. After the bubble on the right completely bursts, the fused bubble begins to burst along the direction of fluid flow 45° away from the wall [71]. Compared with the single bubble on the wall, the double bubble on the wall can increase the bursting time and the bubble radius, resulting in jet acceleration decreasing and processing efficiency reducing. Thus, the dynamic characteristics of the double bubbles on the wall are almost the same as the double bubbles near the wall.
By analyzing the above four states, the bubble burst on the wall maximizes the micro-jet intensity generated on the wall and the cutting force of particles hitting the wall. As the initial flow velocity increases, the turbulent kinetic energy has a great enhancement, reducing the time of bubble burst and increasing the jet strength. Summarily, to improve the processing efficiency, the surface processing of the workpiece requires that the bubbles burst on the wall as far as possible and minimizes the coalescence of bubbles on the wall.

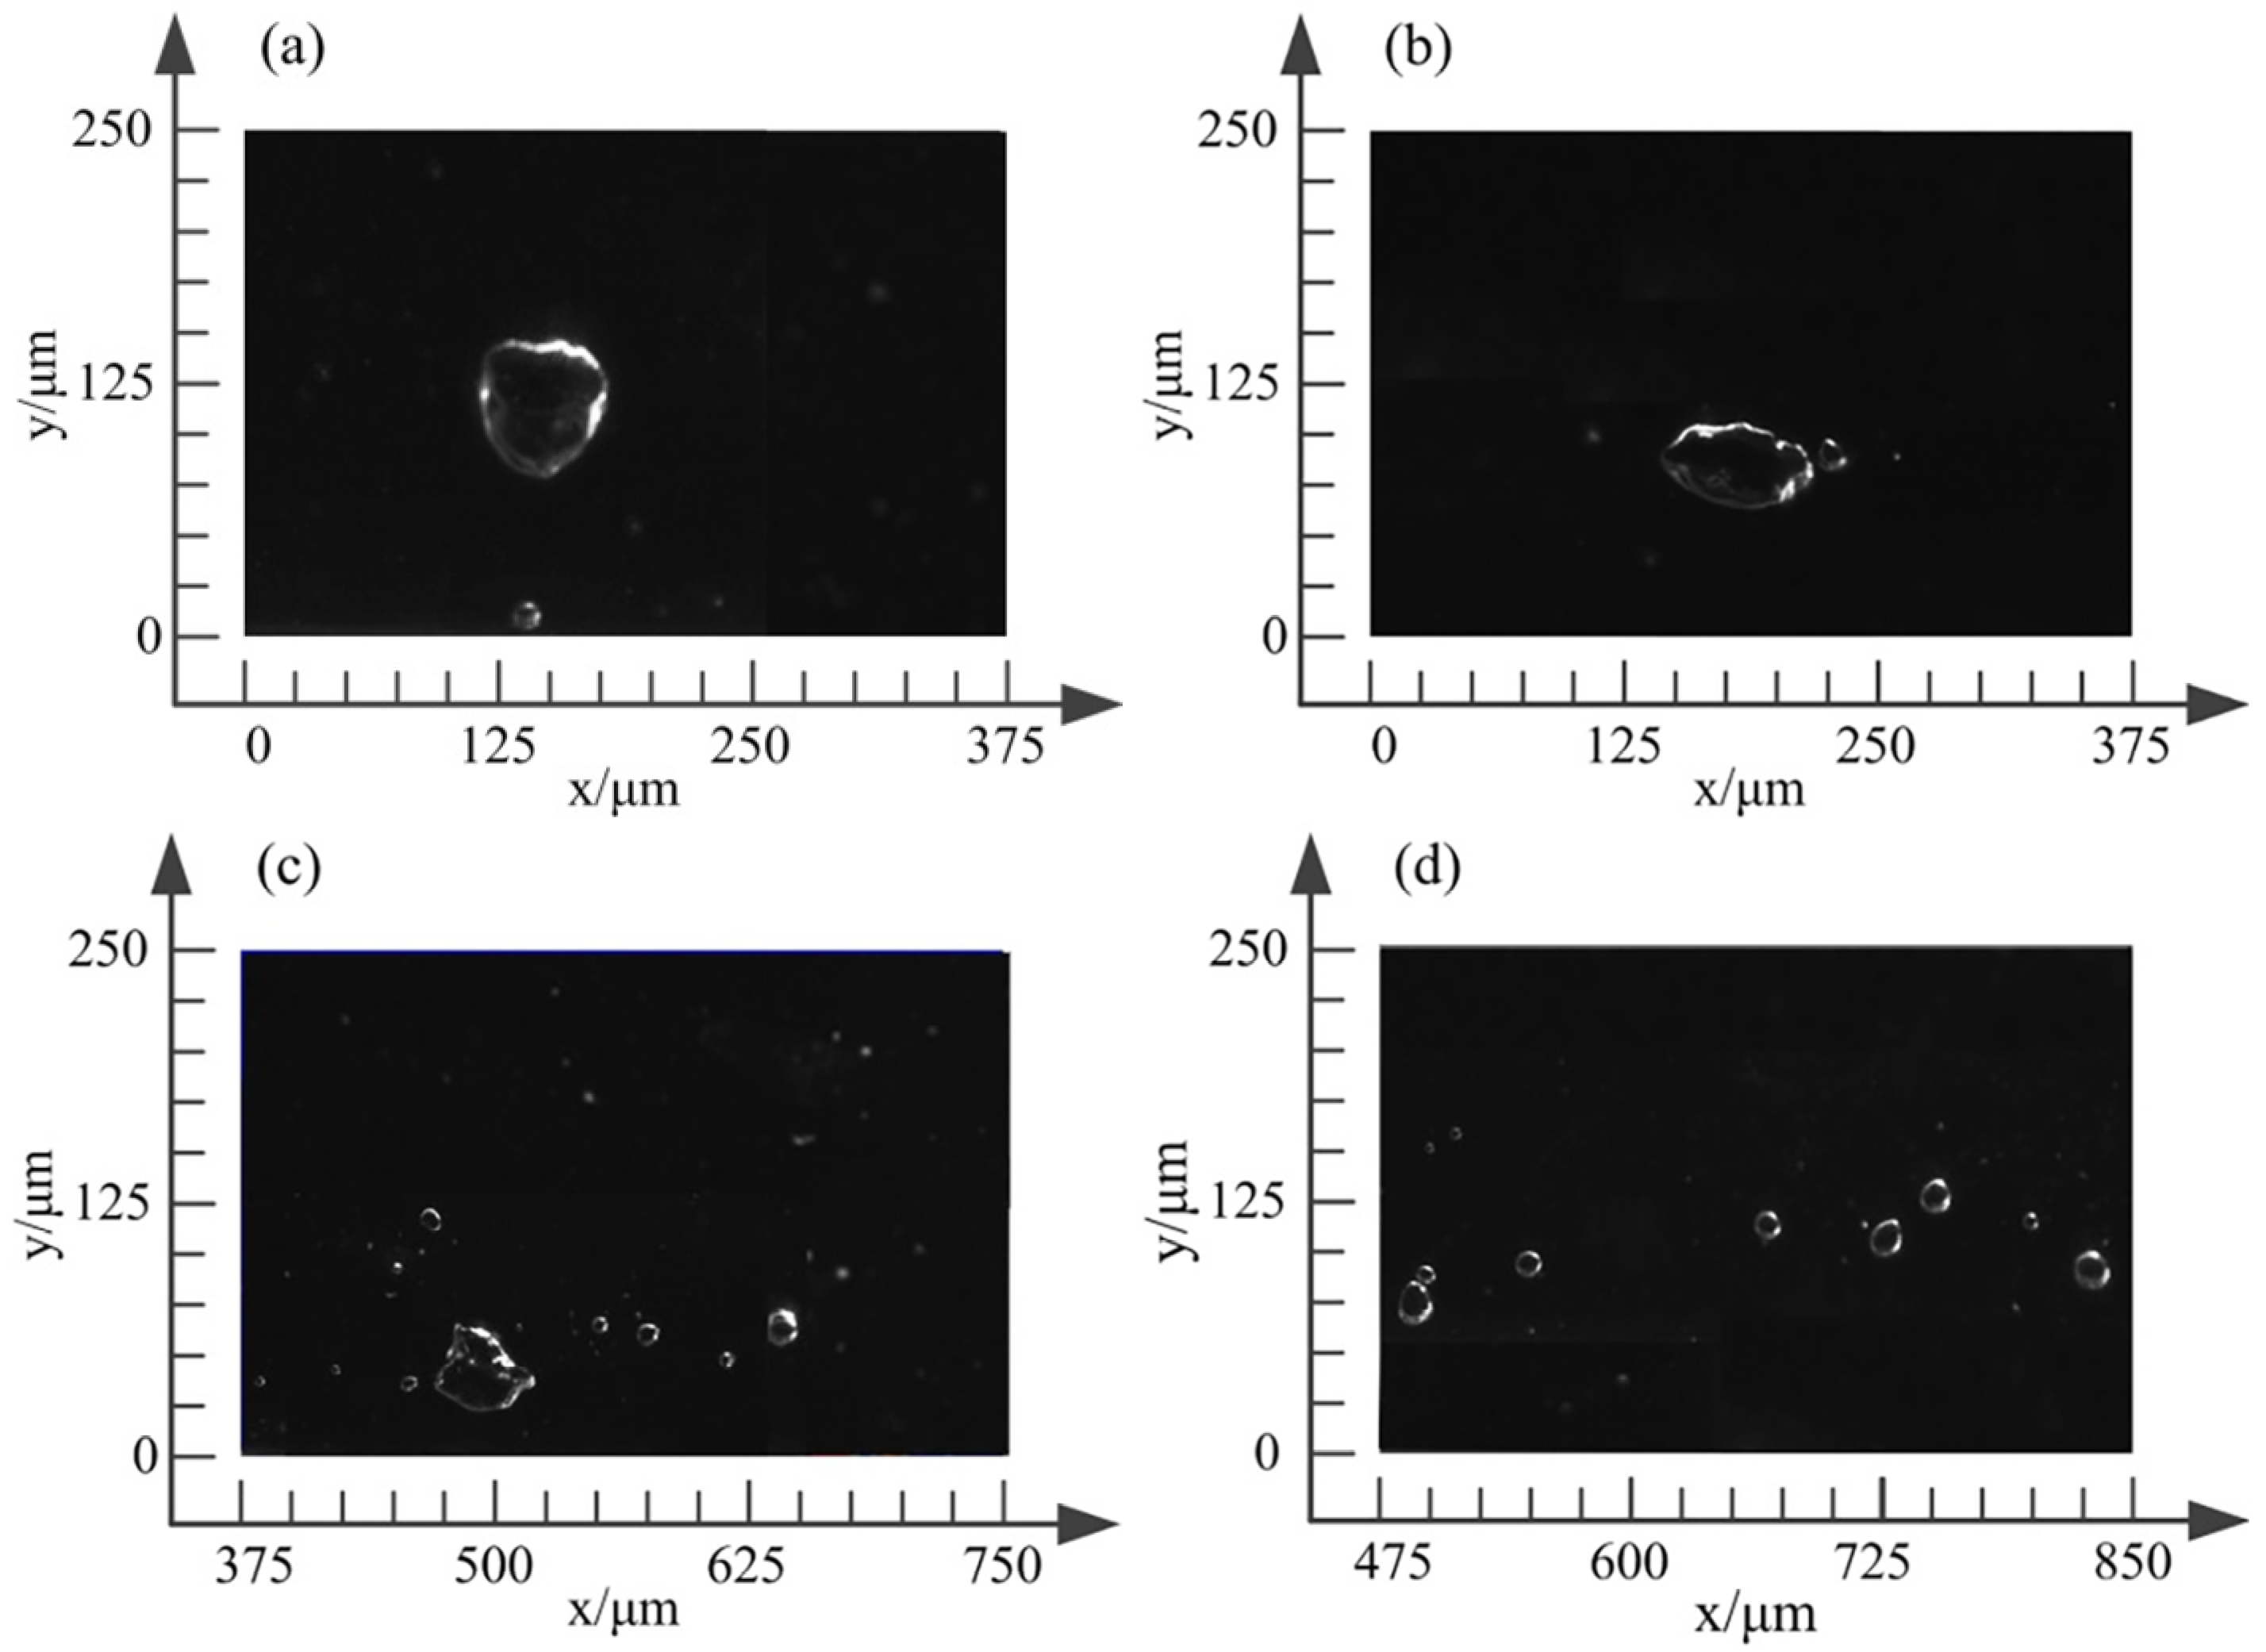
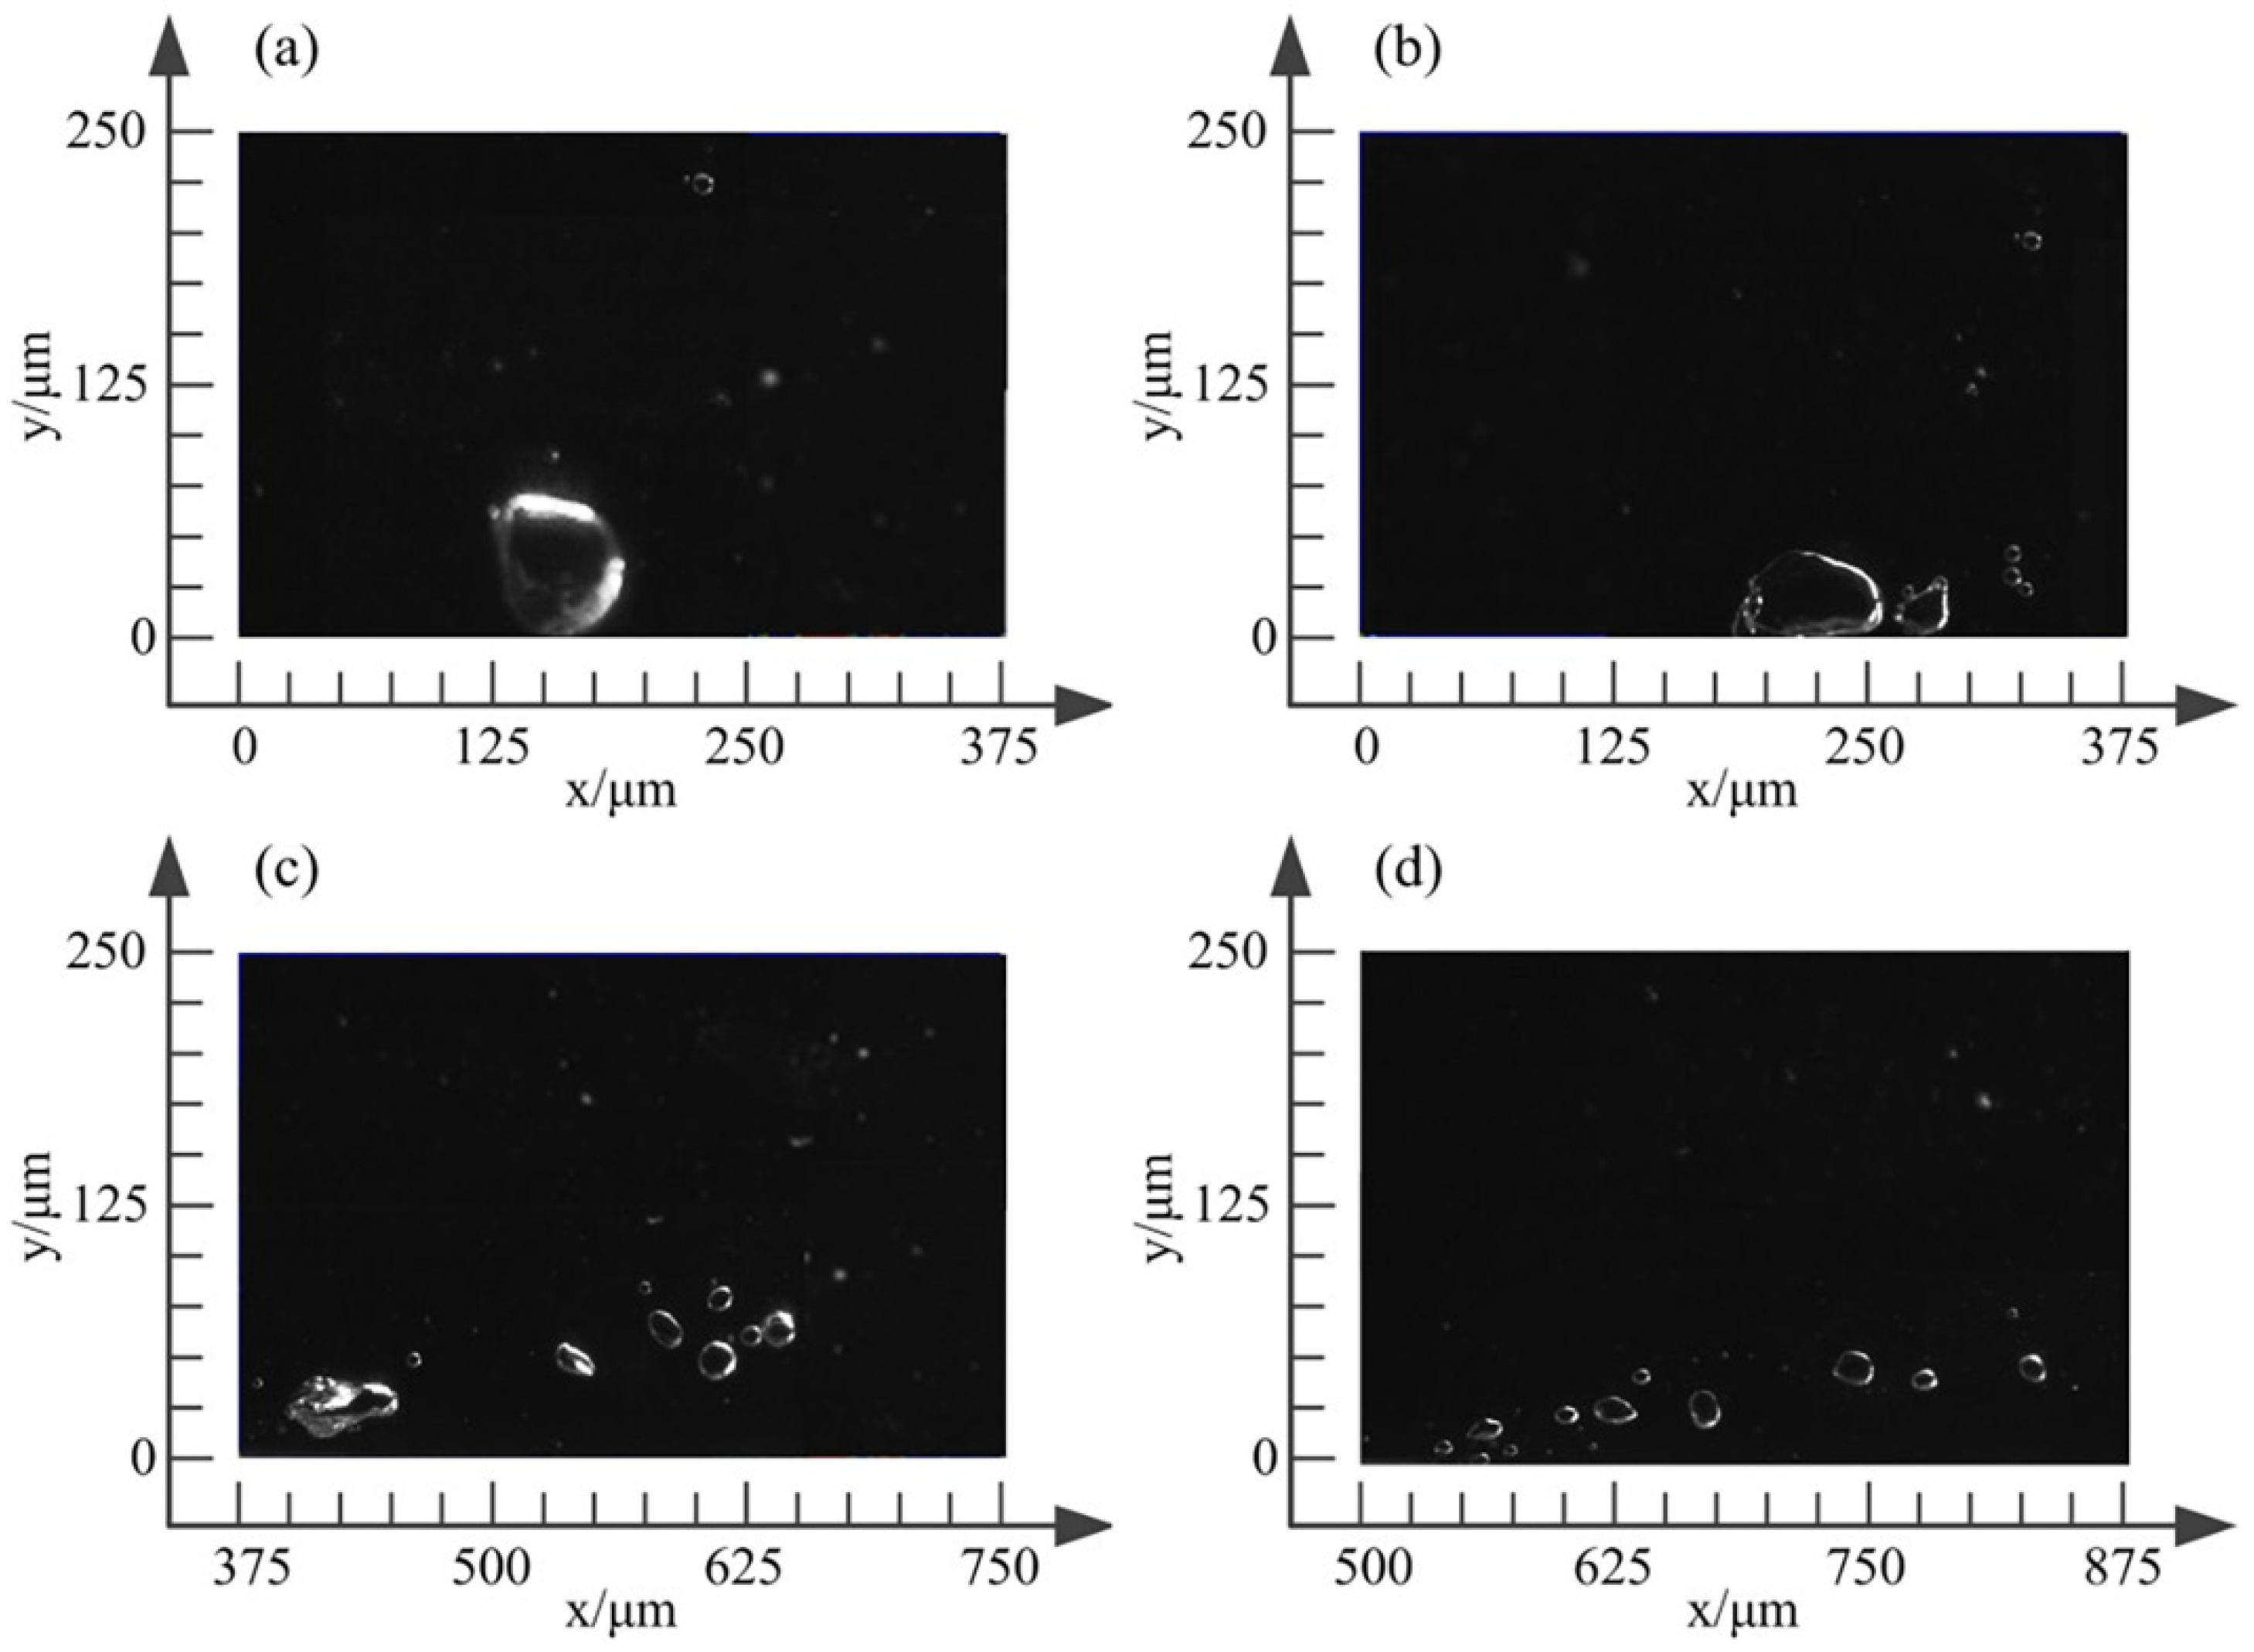
4. Observation Experiment and Results Discussion

4.1. Experimental Setup

PIV is a technique for measuring the flow of a flow field, which measures the instantaneous velocity and vorticity of a plane with high measurement accuracy. To observe the real-time motion state of bubbles and particles in three-phase flow and verify the numerical results, a PIV-based self-developed experimental observation platform is established. The schematic diagram of the PIV experimental observation platform [72,73] is shown in Figure 15. The PIV experimental observation platform is composed of an experimental device subsystem, laser generation subsystem, image capture subsystem, and post-processing subsystem. The experimental equipment subsystem mainly includes the observation channel, fixing frame, water tank, submersible pump, micro-nano bubble pump, tracer particle, and other equipment.
The laser generation subsystem, composed of a laser power source and a laser generator, produces ultrafast laser pulses. During the experiment, in order for the tracer particles to be clearly photographed and recorded by the image capture system, the intensity of the laser light sheet is strong enough and the thickness is less than 3 mm. The appropriate optical elements (spherical mirror and cylindrical mirror) are conducted to segment the laser beam. The function of the spherical mirror is to adjust the thickness of the laser sheet and the function of the cylindrical mirror is to control the direction of the beam divergence. The light source illuminates the particles in the flow field and the scattered light is collected by the image capture system. The image capture subsystem is composed of a CCD camera and a synchronizer, which controls the CCD to shorten the two shutter times as much as possible so that the two particle images maintain the affine transformation. The two images are transmitted and recorded to the computer in the form of digital images through the synchronizer, and then calculated by the post-processing system. The post processing subsystem consists of a computer, digital image collector, analysis software, array processor and other devices, which are conducted to analyze the digital image signal and measure the particle velocity field.
Based on the similarity theory of fluid flow, to ensure the observation device can photograph the movement of bubbles and particles in the internal channel, the profiles of the tool and the workpiece are made into a transparent observation channel. The whole observation channel is made of plexiglass material with a thickness of 70 mm. To avoid refraction caused by laser irradiation on the workpiece surface, the observation channel is designed for a transparent rectangle, as shown in Figure 16. The sheet beam shot from a laser emitter penetrates a section of the flow field, and then the CCD camera is conducted to capture the real-time state of the flow field and extract the image.

4.2. Developing the Numerical Model

The tracer particles are used instead of the SiC particles and are uniformly modulated with water at a mass fraction of 5%. The submersible pump charges the mixture through the particle inlet into the flow channel, and microbubbles (d = 50 μm) are generated by a micro-nano bubble pump into the micro-nano-bubble inlet of the observation channel. The bottom surface of the channel replaces the machining plane. In the post-processing subsystem, the observation time is set as 67,612 μs, and the shot frequency is 7.4 Hz, with a total of 500 pictures [74,75].
In the bubble bursting process, the degree of bubble contraction toward the center is relatively small. Affected by the viscosity of water, the closer the fluid is to the wall, the more the smaller flow rate increases, so the bubble compression is uneven and tends to move towards the wall [76]. Due to the random disturbance of the fluid, the deformation of bubbles is not symmetrical. In the high-speed flow, the bubble deforms and goes over the initial profile to the right. The bottom of the bubble moves slowly under the influence of tension and viscous resistance, resulting in the whole bubble changes in a spiral shape. As the speed of bubble shrinking towards the center increases under the high pressure and exceeds the flow rate, the bubble is recompressed into the initial profile. The partial enlarged drawing of the bubble movement on the wall is captured by the particle image velocimeter, as shown in Figure 17. In this experiment, it can be clearly seen that the shape of a single bubble changes from spherical to irregular with the movement of the fluid, and finally bursts into many tiny bubbles. The experimental phenomena are basically consistent with the simulation, which can confirm the correctness and accuracy of the simulation.
Figure 18 shows that the double bubbles (d = 50 μm) coalescence-burst process with the horizontal distance of 100 μm near the wall photographed by PIV. Affected by the geometry and inlet conditions, the double bubbles are located in the high turbulence region, where the Reynolds number is at a high level. The density of double bubbles is small and the high flow velocity makes the Froude number become high, resulting in the inertial force dominance [77,78,79]. When the distance between the double bubbles is in the critical state of coalescence, the right bubble is subjected to greater resistance, and the left bubble follows the trail of the right bubble, making the resistance lower. Therefore, the distance between the double bubbles further reduces and the double bubbles start to merge. The coalescence-burst process of double bubbles can be divided into three stages: (1) a liquid film is formed between the double bubbles; (2) the bubbles remain in contact with each other until the liquid film is drained; (3) the double bubbles converge into one bubble, and the bubble begins to burst into a series of tiny bubbles. This is the same as the conclusion of the above simulation analysis, which fully proves the correctness of the simulation and lays the foundation for future analysis.
The bubble (d = 50 μm) bursting process on the wall at different times is shown in Figure 19. Firstly, the bubble rolls along the direction of flow. After rolling for a while, the bubble begins to divide into a main bubble and a tiny bubble. Due to the smaller fluid resistance and lighter weight of the tiny bubble, they are quickly taken away from the wall to move toward the exit. The main bubble is still attached to the wall and continues to roll and burst to form more tiny bubbles. In the experiment, the bubble burst on the wall photographed by PIV is consistent with the bubble motion characteristics in the numerical simulation.
The velocity vector diagram of the bubble bursting and the corresponding vorticity diagram are shown in Figure 20. In the initial state, the velocity vector diagram of the channel is disordered, which indicates the turbulent effect required for machining the workpiece by the three-phase flow has been achieved. At the same time, the vorticity distribution on the flow channel is uniform. At 55 μs, the single bubble begins to burst into two bubbles. In the velocity vector diagram, the included angle between the micro-jet and the wall is 45°, pointing to the wall, as shown in the marked part of Figure 20c. In the corresponding vorticity diagram, the local vorticity near the wall increases rapidly and diffuses around. The red part in the vorticity diagram represents the high vorticity. At 60 μs, the bubble bursts completely into two bubbles. The intensity of the micro-jet increases and the direction of the micro-jet directly points to the wall, as shown in the marked part of Figure 20d. In the corresponding vorticity diagram, the regions with large vorticity continue to diffuse around, and the local vorticity near the wall is still large. The experimental results about the characteristics of micro-jets are consistent with the simulation, which fully demonstrates the correctness of the simulation analysis. Local micro-jets can increase the kinetic energy of particles, which increases the efficiency of material removal from the target workpiece surface.
The coalescence-burst process of double bubbles (d = 50 μm) with a horizontal distance of 100 μm on the wall photographed by PIV is shown in Figure 21. This process is essentially consistent with the case of double bubbles near the wall. When the bubbles on the wall merge into a fused bubble, due to the wall effect, it will roll along the wall for a period of time and then burst. Compared with the fused bubble near the wall, the bubble on the wall is more prone to burst and the bubble completely bursts in a shorter time.

5. Conclusions

The bubble bursting process involved in gas-liquid-solid three-phase particle flow is of great scientific and engineering value. In this research, to make clear the bubble bursting mechanism in particle flow, a modeling method for bubble burst based on the PLIC-VOF method is used. The PISO algorithm is adopted for coupling pressure and velocity to improve the bubble deformation convergence efficiency. A PIV-based self-developed experimental observation platform is established to verify the numerical model and results. The coalescence of double bubbles can prolong the bursting time and reduce the wall impact; the bubble bursting time on the wall is smaller than that near the wall, and the bubble on the wall is closer to the wall, which makes the jet flow intensity higher and is more conducive to removing the surface materials. By comparing the simulative and experimental results, they are principally consistent with each other, therefore, confirming the practicability of the adopted model and algorithm. From the bubble bursting progress in the three-phase flow, the main conclusions are as follows.
  • Since the pressure difference between the inside and outside of the bubble tail is the largest, the bubble mainly begins to burst from the bubble tail.
  • The dynamic characteristics of the bubble bursting on the wall are mainly consistent with that near the wall. But due to the action range of the high-speed jet being less than 10% of the bubble diameter, as the distance between the bubble and wall increases, the jet intensity decreases exponentially. In addition, compared with the bubble burst near the wall, the time of bubble burst on the wall is shorter, making the wall impact effect more obvious. Since the sphere of influence of micro-jet is very small, the bubble bursts as much as possible on the wall.
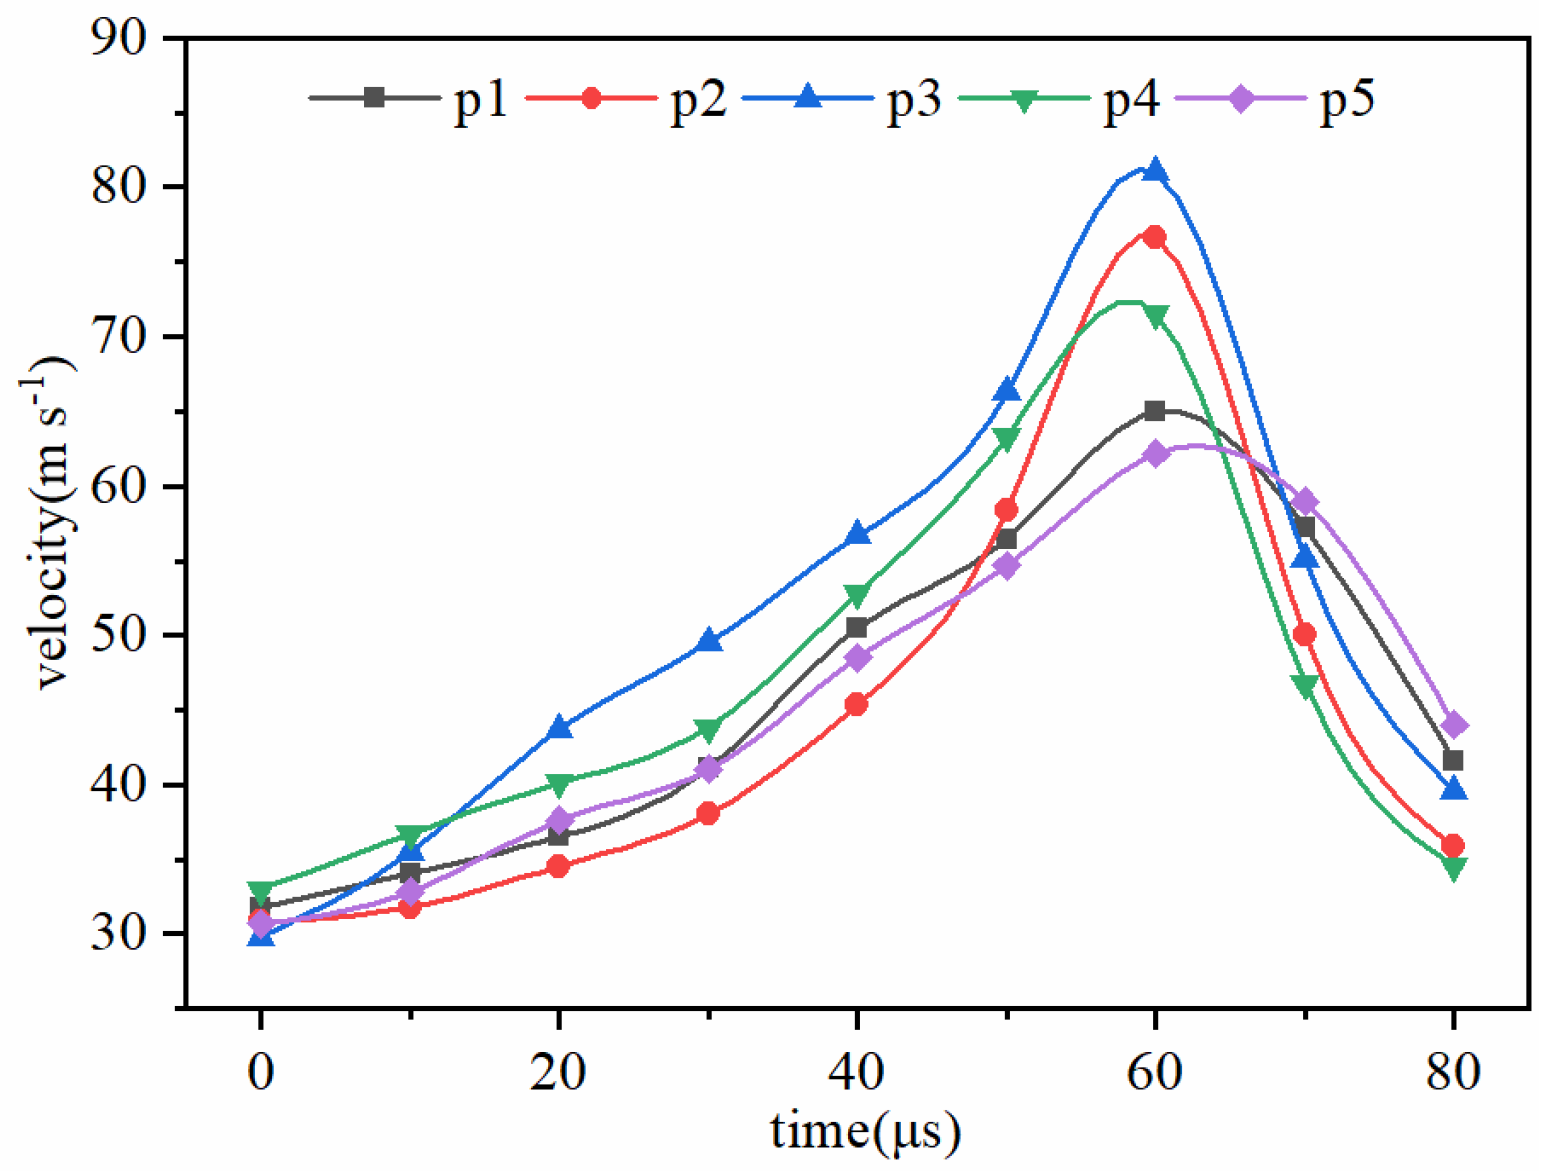
  • Through the analysis of bubble bursting on the wall with different flow rates, it is found that the bubble burst is the fastest and most sufficient when the flow rate is 50 m/s, and the impact effect on the wall is the most obvious. When the flow rate is 60 m/s, due to the fluid rate being too fast, the micro-nano bubbles on the wall will escape from the wall and move along the velocity direction without bursting.
The double bubbles can merge into a whole, prolong the time of bubble burst, which can weaken the acceleration effect of particle and wall impact effect.
Summarily, to improve wall impact effects and increase the material removal rate of the workpiece surface, it is necessary that the bubble burst is controlled on the wall as much as possible, the inlet velocity is maintained at 50 m/s, and the coalescence of bubbles on the wall is minimized. The bubble bursting process involved in gas-liquid-solid three-phase particle flow is a fluid dynamics problem. This paper makes a beneficial attempt in this respect. The research results can provide theoretical references on bubble dynamics in a high-speed turbulent environment, and also offer new ideas for the study of precision machining, bubble controllability in the fields of machinery, chemical industry, and metallurgy. The following research could focus on the bubble bursting temperature field and three phase-particle flow-wall coupling noise.

Author Contributions

The individual contributions of authors are specified as follows. Conceptualization, D.T. and T.W.; methodology, D.T. and J.L.; software, T.W.; validation, L.L., Z.Y. and J.L.; formal analysis, T.W.; investigation, R.W.; resources, J.L.; data curation, X.F.; writing—original draft preparation, T.W.; writing—review and editing, L.L. and D.T.; visualization, X.F.; supervision, D.T.; project administration, D.T.; funding acquisition, D.T. All authors have read and agreed to the published version of the manuscript.

Funding

This research was funded by the “Natural Science Foundation of China, grant number 51775501” and “Natural Science Foundation of China-Zhejiang Joint Fund for the Integration of Industrialization and Informatization, grant number U1509212.”

Conflicts of Interest

The authors declare no conflict of interest.

Nomenclature

u Velocity (m s1)
P Fluid pressure (Pa)
g Gravitational acceleration (m s2)
t Time (s)
V q Total volume of the q phase
V c Total volume of a grid cell
n Normal direction of real line
n x Positive direction of x-axis
n y Positive direction of y-axis
b Intercept
E i j Area of fluid region
S A B C Area of shaded region
T Temperature (K)
P r The number of Prandtl
P m a x The highest pressure (Pa)
P i Pressure of cavitating water jet (Pa)
P 0 Initial pressure of bubble
a Gas content
R Bubble radius (m)
R 0 Initial radius of bubble (m)
P s Continuous jet impact pressure (Pa)
T 0 Initial gas temperature (K)
k Turbulent kinetic energy (J)
u i Fluid velocity (m s1)
G k Turbulent kinetic energy caused by average velocity gradient (J)
E Modulus of the time-averaged strain tensor
C 1 Coefficient
C 2 Coefficient
E i j Time-averaged strain tensor
F Net force on the particle (N)
m Particle mass (kg)
v Particle velocity (m s1)
G Gravity (N)
F b Buoyancy force (N)
F S t o k e s Stokesley of flow field (N)
F d Drag force on particle (N)
F p Pressure gradient force on particle (N)
F s Saffman lift force on a particle (N)
d m Particle diameter (m)
C d Drag force coefficient
U Relative velocity between bubble and particle (m s1)
u f i Fluid velocity (m s1)
u p i Particle velocity (m s1)
R Bubble radius (m)
R ˙ The first order derivatives of versus time
R ¨ The second order derivatives of versus time
P v Saturated vapor pressure (Pa)
P w Hydrostatic pressure (Pa)
u g i Bubble velocity (m s1)
Greek symbols
ρAveraged fluid density (kg m3)
μ Hydrodynamic viscosity (N s m2)
α q Proportion of the space occupied by the fluid in the grid
α w Volume fraction of water-phase
α g Volume fraction of gas-phase
ρ w Fluid density (kg m3)
ρ g Gas density (kg m3)
γ Adiabatic index
ε Dissipation rate
σ k The Prandtl number of k
σ ε The Prandtl number of ε
μ t Eddy viscosity
C μ Turbulent viscosity
η Intermediate variable
ρ m Particle density (kg m3)
χ Empirical coefficient
σ Surface tension (N)

References

  1. Qian, W.W.; Li, W.F.; Shi, Z.H. Characteristics of surface waves on the granular sheet of dense granular jet impingement. Acta Phys. Sin. 2016, 65, 225–231. [Google Scholar] [CrossRef]
  2. Ramirez-Argaez, M.A.; Dutta, A.; Amaro-Villeda, A.; Gonzalez-Rivera, C.; Conejo, A.N. A novel multiphase methodology simulating three phase flows in a steel ladle. Processes 2019, 7, 175. [Google Scholar] [CrossRef] [Green Version]
  3. Zeng, X.; Ji, S.M.; Tan, D.P.; Jin, M.S.; Wen, D.H.; Zhang, L. Softness consolidation abrasives material removal characteristic oriented to laser hardening surface. Int. J. Adv. Manuf. Technol. 2013, 69, 2323–2332. [Google Scholar] [CrossRef]
  4. Nakhaei, M.; Lu, B.N.; Tian, Y.J.; Wang, W.; Dam-Johansen, K.; Wu, H. CFD modeling of gas-solid cyclone separators at ambient and elevated temperatures. Processes 2020, 8, 228. [Google Scholar] [CrossRef] [Green Version]
  5. Li, C.; Ji, S.M.; Tan, D.P. Softness abrasive flow method oriented to tiny scale mold structural surface. Int. J. Adv. Manuf. Technol. 2012, 61, 975–987. [Google Scholar] [CrossRef]
  6. Tan, D.P.; Ji, S.M.; Fu, Y.Z. An improved soft abrasive flow finishing method based on fluid collision theory. Int. J. Adv. Manuf. Technol. 2016, 85, 1261–1274. [Google Scholar] [CrossRef]
  7. Mottyll, S.; Skoda, R. Numerical 3D flow simulation of ultrasonic horns with attached cavitation structures and assessment of flow aggressiveness and cavitation erosion sensitive wall zones. Ultrason. Sonochem. 2016, 31, 570–589. [Google Scholar] [CrossRef]
  8. Bremond, N.; Arora, M.; Dammer, S.; Lohse, D. Interaction of cavitation bubbles on a wall. Phys. Fluids 2006, 18, 1–10. [Google Scholar] [CrossRef]
  9. Chahine, G.L.; Kapahi, A.; Choi, J.K.; Hsiao, C.T. Modeling of surface cleaning by cavitation bubble dynamics and collapse. Ultrason. Sonochem. 2016, 29, 528–549. [Google Scholar] [CrossRef]
  10. Alex, N.; Darsh, W. Air bubble bursting phenomenon at the air-water interface monitored by the piezoelectric-acoustic method. Adv. Colloid Interface Sci. 2019, 272, 101998. [Google Scholar] [CrossRef]
  11. Tan, D.P.; Chen, S.T.; Bao, G.J.; Zhang, L.B. An embedded lightweight GUI component library and the ergonomics optimization method for industry process monitoring. Front. Inform. Technol. Elect. Eng. 2018, 19, 604–625. [Google Scholar] [CrossRef]
  12. Li, Y.B.; Tan, D.P.; Wen, D.H.; Ji, S.M.; Cai, D.H. Parameters optimization of a novel 5-DOF gasbag polishing machine tool. Chin. J. Mech. Eng. 2013, 26, 680–688. [Google Scholar] [CrossRef]
  13. Brujan, E.A.; Ikeda, T.; Matsumoto, Y. Shock wave emission from a cloud of bubbles. Soft Matter. 2012, 8, 5777–5783. [Google Scholar] [CrossRef]
  14. Vignoli, L.L.; de Barros, A.L.F. Modeling the dynamics of single-bubble sonoluminescence. Eur. J. Phys. 2013, 34, 679–688. [Google Scholar] [CrossRef]
  15. Li, J.; Chen, H.S. Numerical simulation of micro bubble collapse near solid wall in fluent environment. Tribology 2008, 28, 311–315. [Google Scholar]
  16. Aniszewski, W.; Menard, T.; Marek, M. Volume of Fluid (VOF) type advection methods in two-phase flow: A comparative study. Comput. Fluids 2014, 97, 52–73. [Google Scholar] [CrossRef] [Green Version]
  17. Ge, J.Q.; Tan, D.P.; Ji, S.M. A gas-liquid-solid three-phase abrasive flow processing method based on bubble collapsing. Int. J. Adv. Manuf. Technol. 2018, 95, 1069–1085. [Google Scholar] [CrossRef]
  18. Li, X.; Wang, W.W.; Zhang, P.; Li, J.L.; Chen, G.H. Interaction between gas-liquid mass transfer and bubble behaviours. R. Soc. Open Sci. 2019, 6, 190136. [Google Scholar] [CrossRef] [Green Version]
  19. Li, L.; Qi, H.; Yin, Z.C. Investigation on the multiphase sink vortex Ekman pumping effects by a CFD-DEM coupling method. Powder Technol. 2020, 360, 462–480. [Google Scholar] [CrossRef]
  20. Li, L.; Lu, J.; Fang, H.; Yin, Z.; Wang, T.; Wang, R.; Fan, X.; Zhao, L.; Tan, D.; Wan, Y. Lattice Boltzmann method for fluid-thermal systems: Status, hotspots, trends and outlook. IEEE Access 2020, 8, 27649–27675. [Google Scholar] [CrossRef]
  21. Tan, D.P.; Li, L.; Zhu, Y.L.; Zheng, S.; Yin, Z.C.; Li, D.F. Critical penetration condition and Ekman suction-extraction mechanism of a sink vortex. J. Zhejiang Univ. Sci. A 2019, 20, 61–72. [Google Scholar] [CrossRef]
  22. Lindken, R.; Merzkirch, W. A novel PIV technique for measurements in multiphase flows and its application to two-phase bubbly flows. Exp. Fluids 2002, 33, 814–825. [Google Scholar] [CrossRef]
  23. Tan, D.P.; Li, L.; Zhu, Y.L.; Zheng, S.; Ruan, H.J.; Jiang, X.Y. An embedded cloud database service method for distributed industry monitoring. IEEE Trans. Ind. Inform. 2018, 14, 2881–2893. [Google Scholar] [CrossRef]
  24. Zhang, L.B.; Lv, H.P.; Tan, D.P.; Xu, F.; Chen, J.L.; Bao, G.J.; Cai, S.B. An adaptive quantum genetic algorithm for task sequence planning of complex assembly systems. Electron. Lett. 2018, 54, 870–871. [Google Scholar] [CrossRef]
  25. Goharzadeh, A.; Molki, A. Measurement of fluid velocity development behind a circular cylinder using particle image velocimetry (PIV). Eur. J. Phys. 2015, 36, 015001. [Google Scholar] [CrossRef]
  26. Jiang, Q.S.; Tan, D.P.; Li, Y.B.; Ji, S.M.; Cai, C.P.; Zheng, Q.M. Object detection and classification of metal polishing shaft surface defects based on convolutional neural network deep learning. Appl. Sci. 2020, 10, 87. [Google Scholar] [CrossRef] [Green Version]
  27. Qiu, L.; Zeng, X.; Ji, S.M.; Tan, D.P.; Ge, M.; Qiu, W.B. Research on abrasive belt based machining technology for milling shaped aero-engine blades. Teh. Vjesn. 2019, 26, 1353–1362. [Google Scholar] [CrossRef]
  28. Wu, R.Z.; Shu, D.; Sun, B.D.; Wang, J.; Lu, Y.L. Observation and theoretic analysis of gas-bubble formation and growth in water-model. Trans. Nonferr. Met. Soc. 2005, 15, 1130–1137. [Google Scholar]
  29. Kulkarni, A.A.; Joshi, J.B. Bubble formation and bubble rise velocity in gas-liquid systems:  A review. Ind. Eng. Chem. Res. 2005, 44, 5873–5931. [Google Scholar] [CrossRef]
  30. Tan, D.P.; Zhang, L.B. A WP-based nonlinear vibration sensing method for invisible liquid steel slag detection. Sens. Actuat. B-Chem. 2014, 202, 1257–1269. [Google Scholar] [CrossRef]
  31. Lopez, J.; Hernandez, J.; Gomez, P.; Faura, F. An improved PLIC-VOF method for tracking thin fluid structures in incompressible two-phase flows. J. Comput. Phys. 2005, 208, 51–74. [Google Scholar] [CrossRef]
  32. Qi, H.; Qin, S.K.; Cheng, Z.C.; Zou, Y.L.; Wen, D.H.; Cai, D.H. Performance evaluation on the ultrasonic vibration-assisted abrasive finishing of the cutting edge using Discrete Element Method. Powder Technol. in Press.
  33. Cifani, P.; Michalek, W.R.; Priems, G.J.M.; Kuerten, J.G.M.; van der Geld, C.W.M.; Geurts, B.J. A comparison between the surface compression method and an interface reconstruction method for the VOF approach. Comput. Fluids 2016, 136, 421–435. [Google Scholar] [CrossRef] [Green Version]
  34. Dai, D.Z.; Tong, A.Y. An analytical interface reconstruction algorithm in the PLIC-VOF method for 2D polygonal unstructured meshes. Int. J. Numer. Methods Fluids 2018, 88, 265–276. [Google Scholar] [CrossRef]
  35. Hoque, M.M.; Mitra, S.; Evans, G.M.; Pareek, V.; Joshi, J.B. Effect of bubble on the pressure spectra of oscillating grid turbulent flow at low Taylor-Reynolds number. Chem. Eng. Sci. 2018, 190, 28–39. [Google Scholar] [CrossRef]
  36. Tan, D.P.; Ni, Y.S.; Zhang, L.B. Two-phase sink vortex suction mechanism and penetration dynamic characteristics in ladle teeming process. J. Iron Steel Res. Int. 2017, 24, 669–677. [Google Scholar] [CrossRef]
  37. Ye, L.Z.; Zhu, X.J. Analysis of the effect of impact of near-wall acoustic bubble collapse micro-jet on Al 1060. Ultrason Sonochem. 2016, 36, 507–516. [Google Scholar] [CrossRef]
  38. Li, J.; Ji, S.M.; Tan, D.P. Improved soft abrasive flow finishing method based on turbulent kinetic energy enhancing. Chin. J. Mech. Eng. 2017, 30, 301–309. [Google Scholar] [CrossRef]
  39. Li, X.N.; Liu, M.Y.; Ma, Y.L.; Dong, T.T.; Yao, D. Experiments and meso-scale modeling of phase holdups and bubble behavior in gas-liquid-solid mini-fluidized beds. Chem. Eng. Sci. 2018, 192, 725–738. [Google Scholar] [CrossRef]
  40. Chen, J.L.; Xu, F.; Tan, D.P.; Shen, Z.; Zhang, L.B.; Ai, Q.L. A control method for agricultural greenhouses heating based on computational fluid dynamics and energy prediction model. Appl. Energy 2015, 141, 106–118. [Google Scholar] [CrossRef]
  41. Tan, D.P.; Yang, T.; Zhao, J.; Ji, S.M. Free sink vortex Ekman suction-extraction evolution mechanism. ACTA Phys. Sin. 2016, 65, 054701. [Google Scholar] [CrossRef]
  42. Gruber, M.C.; Radl, S.; Khinast, J.G. Effect of bubble-particle interaction models on flow predictions in three-phase bubble columns. Chem. Eng. Sci. 2016, 146, 226–243. [Google Scholar] [CrossRef]
  43. Ji, S.M.; Xiao, F.Q.; Tan, D.P. Analytical method for softness abrasive flow field based on discrete phase model. Sci. China-Technol. Sci. 2010, 53, 2867–2877. [Google Scholar] [CrossRef]
  44. Man, V.H.; Li, M.S.; Derreumaux, P.; Nguyen, P.H. Rayleigh-Plesset equation of the bubble stable cavitation in water: A nonequilibrium all-atom molecular dynamics simulation study. J. Chem. Phys. 2018, 148, 194505. [Google Scholar] [CrossRef]
  45. Pan, Y.; Ji, S.; Tan, D.; Cao, H. Cavitation based soft abrasive flow processing method. Int. J. Adv. Manuf. Technol. 2019. in Press. [Google Scholar] [CrossRef]
  46. Shi, H.T.; Bai, X.T. Model-based uneven loading condition monitoring of full ceramic ball bearings in starved lubrication. Mech. Syst. Signal Process. 2020, 139, 106583. [Google Scholar] [CrossRef]
  47. Lu, J.; Huang, J.T.; Xu, X.Q. Bubble collapse in solid-liquid two-phase fluid. Acta Mech. Sin. 1995, 8, 4–22. [Google Scholar]
  48. Yamada, K.; Emori, H.; Nakazawa, K. Time-evolution of bubble formation in a viscous liquid. Earth Planets Space 2008, 60, 661–679. [Google Scholar] [CrossRef] [Green Version]
  49. Hu, X.X.; Xu, F.; Tan, D.P. Synchronous sampling-based direct current estimation method for self-sensing active magnetic bearings. Sensors 2020, 20, 3497. [Google Scholar] [CrossRef]
  50. Chen, Z.Z.; Wen, D.H.; Lu, J.F.; Yang, J.; Hong, T.; Qi, H. Surface quality improvement by using a novel driving system design in single-side planetary abrasive lapping. J. Manuf. Process. in Press.
  51. Tan, D.P.; Li, L.; Yin, Z.C.; Li, D.F.; Zhu, Y.L.; Zheng, S. Ekman boundary layer mass transfer mechanism of free sink vortex. Int. J. Heat Mass Transfer. 2019, 150, 119250. [Google Scholar] [CrossRef]
  52. Shi, H.T.; Guo, L.; Tan, S.; Bai, X.T. Rolling bearing initial fault detection using long short-term memory recurrent network. IEEE Access 2019, 7, 171559–171569. [Google Scholar] [CrossRef]
  53. Zhang, L.; Yuan, Z.M.; Tan, D.P.; Huang, Y. An Improved abrasive flow processing method for complex geometric surfaces of titanium alloy artificial joints. Appl. Sci. 2018, 28, 1037. [Google Scholar] [CrossRef] [Green Version]
  54. Hokmabad, B.V.; Ghaemi, S. Effect of flow and particle-plastron collision on the longevity of superhydrophobicity. Sci. Rep. 2017, 7, 41448. [Google Scholar] [CrossRef] [PubMed]
  55. Paulsen, O.; Rorvik, S.; Muggerud, A.M.F.; Juel, M. Bubble distribution in fused quartz crucibles studied by micro X-Ray computational tomography. Comparing 2D and 3D analysis. J. Cryst. Growth 2019, 520, 96–104. [Google Scholar] [CrossRef]
  56. Tan, D.P.; Li, P.Y.; Ji, Y.X.; Wen, D.H.; Li, C. SA-ANN-based slag carry-over detection method and the embedded WME platform. IEEE Trans. Ind. Electron. 2013, 60, 4702–4713. [Google Scholar] [CrossRef]
  57. Ji, S.M.; Ge, J.Q.; Tan, D.P. Wall contact effects of particle-wall collision process in two-phase particle fluid. J. Zhejiang Univ.-Sci. A 2017, 18, 958–973. [Google Scholar] [CrossRef]
  58. Tan, K.L.; Yeo, S.H. Velocity estimation of micro-particles driven by cavitation bubble collapses through controlled erosion experiments. Int. J. Multiph. Flow 2020, 127, UNSP 103271. [Google Scholar] [CrossRef]
  59. Wang, J.; Tan, D.; Cao, B.; Fan, J.; Deep, S. An independent path-based process recommendation algorithm for improving biomedical process modeling. Electron. Lett. 2020, 56, 531–533. [Google Scholar] [CrossRef]
  60. He, J.; Chu, J.; Wu, S.F.; Peng, J. Mitigation of soil liquefaction using microbially induced desaturation. J. Zhejiang Univ.-Sci. A 2016, 17, 577–588. [Google Scholar] [CrossRef] [Green Version]
  61. Lv, L.; Zhang, Y.X.; Zhang, Y.N. Experimental investigations of the particle motions induced by a laser-generated cavitation bubble. Ultrason. Sonochem. 2019, 56, 63–76. [Google Scholar] [CrossRef] [PubMed]
  62. Liu, J.R.; Zhu, C.Y.; Fu, T.T.; Ma, Y.G. Systematic study on the coalescence and breakup behaviors of multiple parallel bubbles rising in power-law fluid. Ind. Eng. Chem. Res. 2014, 53, 4850–4860. [Google Scholar] [CrossRef]
  63. Wang, J.X.; Cao, B.; Zheng, X.; Tan, D.P.; Fan, J. Detecting difference between process models using edge network. IEEE Access 2019, 360, 142916–142925. [Google Scholar] [CrossRef]
  64. Bourne, N.K.; Field, J.E. Shock-induced collapse and luminescence by cavities. Philos. Trans. R. Soc. A 1999, 3357, 295–311. [Google Scholar] [CrossRef] [Green Version]
  65. Hattori, S.; Hirose, T.; Sugiyama, K. Prediction method for cavitation erosion based on measurement of bubble collapse impact loads. Wear 2010, 269, 507–514. [Google Scholar] [CrossRef]
  66. Ni, B.Y.; Li, S. Jet splitting after bubble breakup at the free surface. Acta Phys. Sin. 2013, 62, 124704. [Google Scholar] [CrossRef]
  67. Wu, M.G.; Lu, C.D.; Tan, D.P.; Hong, T.; Chen, G.H.; Wen, D.H. Effects of metal buffer layer for amorphous carbon film of 304 stainless steel bipolar plate. Thin Solid Films 2016, 616, 507–514. [Google Scholar] [CrossRef]
  68. Tan, D.P.; Zhang, L.B.; Ai, Q.L. An embedded self-adapting network service framework for networked manufacturing system. J. Intell. Manuf. 2019, 30, 539–556. [Google Scholar] [CrossRef]
  69. Jin, T.; Xu, B.; Tang, K.; Hong, J.P. Bubble counter based on photoelectric technique for leakage detection of cryogenic valves. J. Zhejiang Univ.-Sci. A 2008, 9, 88–92. [Google Scholar] [CrossRef]
  70. Oguchi, K.; Enoki, M.; Hirata, N. Numerical Simulation for Cavitation Bubble Near Free Surface and Rigid Boundary. Mater. Trans. 2015, 56, 534–538. [Google Scholar] [CrossRef] [Green Version]
  71. Chakraborty, I.; Biswas, G.; Ghoshdastidar, P.S. A coupled level-set and volume-of-fluid method for the buoyant rise of gas bubbles in liquids. Int. J. Heat Mass Transf. 2013, 58, 240–259. [Google Scholar] [CrossRef]
  72. Cerqueira, R.F.L.; Paladino, E.E.; Ynumaru, B.K.; Maliska, C.R. Image processing techniques for the measurement of two-phase bubbly pipe flows using particle image and tracking velocimetry (PIV/PTV). Chem. Eng. Sci. 2018, 189, 1–23. [Google Scholar] [CrossRef]
  73. Wang, Y.X.; Ni, P.C.; Wen, D.H.; Tan, D.P. Dynamic performance optimization of circular sawing machine gearbox. Appl. Sci. 2019, 9, 4458. [Google Scholar] [CrossRef] [Green Version]
  74. Ji, S.M.; Ge, J.Q.; Tan, D.P.; Zeng, X. Three-phase abrasive flow polishing and distribution characteristics of bubble collapse. Opt. Precis. Sci. 2018, 26, 388–398. [Google Scholar] [CrossRef]
  75. Zeng, X.; Ji, S.M.; Jin, M.S.; Tan, D.P.; Ge, J.Q. Research on dynamic characteristic of softness consolidation abrasives in machining process. Int. J. Adv. Manuf. Technol. 2016, 82, 1115–1125. [Google Scholar] [CrossRef]
  76. Zhang, L.; Wang, J.S.; Tan, D.P.; Yuan, Z.M. Gas compensation-based abrasive flow processing method for complex titanium alloy surfaces. Int. J. Adv. Manuf. Technol. 2017, 92, 3385–3397. [Google Scholar] [CrossRef]
  77. Gualtieri, C.; Chanson, H. Effect of Froude number on bubble clustering in a hydraulic jump. J. Hydraul. Res. 2010, 48, 504–508. [Google Scholar] [CrossRef] [Green Version]
  78. Li, H.N.; Wang, J.P.; Wu, C.J.; Zhao, Y.J. Damage behaviors of unidirectional CFRP in orthogonal cutting: A comparison between single- and multiple-pass strategies. Compos. Part B-Eng. 2020, 185, 107774. [Google Scholar] [CrossRef]
  79. Bahmanpouri, F. Experimental Study of Air Entrainment in Hydraulic Jump on Pebbled Rough Bed. Ph.D. Thesis, Department of Civil, Architectural and Environmental Engineering, The University of Napoli Federico II, Napoli, Italy, 2019. [Google Scholar]
Figure 1. The accelerating effect of bubble bursting on particles.
Processes 08 00760 g001
Figure 2. PLIC interface reconfiguration principle.
Processes 08 00760 g002
Figure 3. The flowchart of the PISO algorithm.
Processes 08 00760 g003
Figure 4. Schematic diagram of precision machining of three-phase abrasive flow: 1. lower fixture, 2. upper fixture, 3. micro-gap, 4. abrasive flow inlet, 5. processing disc, 6. workpiece.
Processes 08 00760 g004
Figure 5. Two-dimensional mesh generation: 1. inlet, 2. wall, 3. outlet (a) global mesh and (b) local mesh.
Processes 08 00760 g005
Figure 6. The maximum velocity comparison curves between the experiment and simulation.
Processes 08 00760 g006
Figure 7. Volume fraction profiles of the bubble bursting near the wall: (a) t = 0 μs, (b) t = 6 μs, (c) t = 20 μs, (d) t = 38 μs, (e) t = 52 μs, (f) t = 80 μs.
Processes 08 00760 g007
Figure 8. Velocity vector diagram at the moment of the bubble bursting.
Processes 08 00760 g008
Figure 9. Instantaneous velocity curves of five particles.
Processes 08 00760 g009
Figure 10. Volume fraction profiles of the double parallel bubbles bursting process: (a) t = 0 μs, (b) t = 10 μs, (c) t = 130 μs, (d) t = 160 μs, (e) t = 250 μs, (f) t = 300 μs.
Processes 08 00760 g010
Figure 11. Volume fraction profiles of the bubble bursting on the wall: (a) t = 0 μs, (b) t = 13 μs, (c) t = 48 μs, (d) t = 64 μs, (e) t = 74 μs, (f) t = 91 μs.
Processes 08 00760 g011
Figure 12. Pressure profiles of the bubble bursting at different times: (a) t = 22 μs, (b) t = 53 μs.
Processes 08 00760 g012
Figure 13. Volume fraction profiles of the bubble bursting on the wall at different flow velocities: (a) y = 37.5 μm, v = 30 m/s; (b) y = 37.5 μm, v = 40 m/s; (c) y = 37.5 μm, v = 50 m/s; (d) y = 37.5 μm, v = 60 m/s; (e) y = 25 μm, v = 30 m/s; (f) y = 25 μm, v = 40 m/s; (g) y = 25 μm, v = 50 m/s; (h) y = 25 μm, v = 60 m/s; (i) y = 12.5 μm, v = 30 m/s; (j) y = 12.5 μm, v = 40 m/s; (k) y = 12.5 μm, v = 50 m/s; (l) y = 12.5 μm, v = 60 m/s.
Processes 08 00760 g013
Figure 14. Volume fractions profiles of double parallel bubbles bursting on the wall: (a) t = 0 μs, (b) t = 15 μs, (c) t = 65 μs, (d) t = 270 μs, (e) t = 300 μs, (f) t = 330 μs.
Processes 08 00760 g014
Figure 15. The schematic diagram of the PIV experimental observation platform: 1. control system, 2. particle image velocimetry system, 3. CCD camera, 4. laser generator, 5. abrasive flow inlet, 6. bubble inlet, 7. transparent channel, 8. hosepipe, 9. water pump, 10. throttle valve, 11. pressure gage, 12. abrasive flow, 13. holder, 14. air pump, 15. magnetic valve, 16. water pipe, 17. tank, 18. desk.
Processes 08 00760 g015
Figure 16. PIV observation flow channel: 1. particle flow inlet, 2. micro-nano-bubble inlet, 3. outlet.
Processes 08 00760 g016
Figure 17. Experimental results of the bubble bursting near the wall at different times: (a) t = 15 μs, (b) t = 81 μs, (c) t = 98 μs, (d) t = 120 μs.
Processes 08 00760 g017
Figure 18. Experimental results of double bubble bursting near the wall at different times: (a) t = 16 μs, (b) t = 130 μs, (c) t = 150 μs, (d) t = 260 μs.
Processes 08 00760 g018
Figure 19. Experimental results of the bubble bursting on the wall at different times: (a) t = 5 μs, (b) t = 32 μs, (c) t = 81 μs, (d) t = 98 μs.
Processes 08 00760 g019
Figure 20. Vector-vorticity diagrams of the bubble bursting on the wall: (a) t = 1 μs, (b) t = 32 μs, (c) t = 55 μs, (d) t = 60 μs.
Processes 08 00760 g020
Figure 21. Experimental results of double bubbles bursting on the wall at different times (a) t = 3 μs, (b) t = 60 μs, (c) t = 120 μs, (d) t = 200 μs.
Processes 08 00760 g021
Table 1. Some key energy equations of the bubble bursting.
NameSymbolEquation
The highest pressure P m a x P m a x = { 1 + [ ( R 0 / R ) 3 4 ] 4 3 4 3 4 [ ( R 0 / R ) 3 1 ] 1 3 } P 0
Pressure of cavitating water jet P i P i = P s 6.35 exp ( 2 3 a )
Gas temperature T T = ( R 0 R ) 3 ( γ 1 ) T 0
where P 0 is the initial pressure, a is the gas content in fluid, R and R 0 are the radius and the initial radius of the bubble P s is the continuous jet impact pressure, T 0 is the gas temperature at the beginning of the compression process, and γ is adiabatic index. Generally, γ = 4 / 3 .
Table 2. Some key parameters of the realizable k - ε turbulence model.
NameSymbolEquation
Turbulent kinetic energy G k G k = μ t ( μ i x j + μ j x i ) μ i x j
Coefficient C 1 C 1 = max ( 0.43 , η η + 5 )
Intermediate variable η η = ( 2 E i j E i j ) 1 / 2 k ε
Time-averaged strain tensor E i j E i j = 1 2 ( μ i x j + μ j x i )
Table 3. Forces and Torques on a particle.
Forces and TorquesSymbolEquation
Gravity G G = 1 6 π d m 3 ρ m g
Buoyancy F b F b = 1 6 π d m 3 ρ w g
Stokesley F S t o k e s F S t o k e s = 6 π μ d m U
Drag force F d F d = 0.125 π d m 2 ρ m C d | u f i u p i | ( u f i u p i ) α ( χ + 1 )
Pressure gradient force F p F p = 1 6 π d m 3 d P d x i
Saffman force F s F s = 1.615 d m 2 ρ ( u f i u p i ) | μ ρ u f i x i | 0.5
where d m is the particle diameter, ρ m is particle density, C d is the drag force coefficient, U is the relative velocity between bubble and particle, u f i is the averaged velocity of a fluid grid cell, u p i is the particle velocity, and χ is the empirical coefficient.
Table 4. The boundary conditions of the model.
ItemAttribute
InletVelocity inlet
OutletFree inlet
ZoneAir, water, silicon carbide
WallNo-slip wall
Inlet diameter (mm)2.3
Outlet diameter (mm)1
Inlet velocity (m·s−1)30–60
Reference pressure (Pa)101,000
Table 5. Physical parameters for numerical computation.
ParameterValue
Water density (kg·m−3)998.2
Water viscosity (Pa·s)0.001003
Air density (kg·m−3)1.225
Bubble diameter (μm)50
Particle density (kg·m−3)3170
Particle diameter (μm)10
Particle mass fraction (%)5
Hydraulic diameter (mm)2
Surface tension coefficient0.023
Gravity acceleration (kg·m−3)−9.81
Turbulent intensity (%)5
Temperature (°C)40
Reynolds number14,000
Table 6. Physical parameters for numerical computation.
Bubble Diameter (μm)1020304050
Simulation velocity (104 m·s−2)8138.119.811.49
Experiment velocity (104 m·s−2)5330.516.5108.5
Error0.3460.1990.1670.1230.056

