Article

Effects of Different Drying Methods and Temperature on the Drying Behavior and Quality Attributes of Cherry Laurel Fruit

Department of Food Engineering, Faculty of Chemical and Metallurgical Engineering, Yildiz Technical University, Istanbul 34210, Turkey
*
Author to whom correspondence should be addressed.
Processes 2020, 8(7), 761; https://doi.org/10.3390/pr8070761
Submission received: 7 June 2020 / Revised: 20 June 2020 / Accepted: 24 June 2020 / Published: 29 June 2020
(This article belongs to the Special Issue Drying Kinetics and Quality Control in Food Processing)

Abstract

:
This study aimed to investigate the effect of different drying methods and drying temperature on the drying kinetics, total bioactive compounds, phenolic profile, microstructural properties, rehydration kinetics, and color change of cherry laurel fruit. For this aim, hot air drying (HAD), ultrasound-assisted vacuum drying (USV), and freeze-drying (FD) were conducted on drying of cherry laurel. HAD and USV were conducted at 50, 60, and 70 °C. Drying times of the samples were 1980, 1220, and 770 min for HAD at 50, 60 and 70 °C, and 950, 615, and 445 min at 50, 60, and 70 °C, respectively, for USV. The total bioactive compound was significantly affected by both drying methods and temperature (p < 0.05). FD exhibited the highest total phenolic (TPC), total flavonoid (TFC), total anthocyanin (TAC), and antioxidant capacity value USV showed a higher amount of bioactive compounds than those of HAD at the same drying temperature. The content of total bioactive compounds significantly increased as the temperature increased for both HAD and USV (p < 0.05). The chlorogenic acid was identified as a major phenolic, and its amount significantly depended on drying methods (p < 0.05). SEM images described the surface characteristic of dried samples. HAD dried products showed higher shrinkage compared to FD and USV. All drying methods significantly affected the total color difference (ΔE) values (p < 0.05). This study proposed that USV could be as an alternative method to HAD due to higher bioactive compounds retention and rehydration ratio, shorter drying time, less color change, and shrinkage formation.

1. Introduction

Cherry laurel (Prunus laurocerasus L.) belonging to the Rosaceae family is a well-known fruit grown in various countries of the world. It can be consumed as fresh or dried and pickled form and processed into various products such as pekmez, jam, marmalade, and fruit juice [1]. Cherry laurel is a bioactive compounds-rich fruit including phenolics, anthocyanins, and vitamins. Cherry laurel is abundant in procyanidins which have a decisive role in preventing cardiovascular disease [1]. Procyanidin content of cherry laurel was found higher than that of the other cherry fruits [2]. For this reason, cherry laurel fruits have attracted attention in recent years. Fresh cherry laurel is perishable, and the shelf life of fruits is low due to its high water content. Therefore, a preservation method should be applied to increase the shelf life and supply consumption throughout the year.
Drying is one of the widely used preservation methods to increase the shelf life of many fruits and vegetables. The drying process has several advantages such as lowering storage volume, and extending shelf life and ensuring the microbial safety of biological products [3]. Besides, commercial interest on dried fruits, mainly containing bioactive compounds, has been increased. The drying techniques include various methods such as hot air drying (HAD), vacuum drying (VD), freeze-drying (FD), osmotic dehydration, microwave drying, infrared drying, etc. [4]. HAD is still a widely used method in dehydration of various fruits and vegetables because it has many advantages compared to sun drying, including reduced microbial contamination, tunable process parameters, shorter processing time, and fewer labor costs [5]. Besides these advantages, due to the application of high air temperature and longer time, HAD can result in a substantial level of degradation on bioactive compounds, lower antioxidant capacity, and development of off-flavors compared with the other novel drying methods [6]. Freeze-drying (FD) has been generally considered the best drying method, as it generates dried foods with enhanced sensory and nutritional quality and results in less shrinkage and higher water absorption capacity. However, FD has some disadvantages such as prolonged drying time, high-cost, and not being easy use [7]. Therefore, alternative drying methods should be investigated to eliminate the disadvantages of FD and HAD.
Ultrasound-assisted vacuum drying (USV) is an innovative drying method that benefits ultrasound to speed up heat and mass transfer of vacuum drying. Vacuum drying engages the evaporation of surface water by reducing the boiling temperature of water under low pressure. However, when the drying progress, the water transfer decreases from the interior to the surface of the food. By the application of ultrasound power, microscopic cavities on the tissues of fruits and vegetables are created and the water attached to the interior tissues would be more easily transferred to the surface through those microscopic channels, evaporated and, therefore increases mass transfer and reduces drying time. USV has been used in a few studies for the drying of beef, chicken [8], fish [9], green beans [10], and red peppers [11], and persimmons [12]. However, there has been no attempt for cherry laurel fruit drying with USV.
There have been studies carried out on for the determination of drying kinetics [13,14] and investigation of the effect of drying techniques on the total of bioactive compounds of cherry laurel [1]. However, the effect of different drying methods on color change, the rehydration capacity, microstructural properties, and phenolic profile of cherry laurel has not been studied. This study aimed to investigate the effect of different drying methods, particularly HAD, FD, and USV on the drying kinetic, total bioactive compounds, phenolic profile, microstructural properties, rehydration capacity, and color change of cherry laurel fruits.

2. Materials and Methods

2.1. Materials

Fresh cherry laurel fruits (Prunus laurocerasus L.) were supplied from the Ministry of Agriculture and Forestry Black Sea Agricultural Research Institute (Samsun, Turkey) when fully ripe in August 2019. The genotype of 61K06 was obtained because of its high phenolic content (Halilova and Ercisli, 2010). Cherry laurel fruits with uniform shape, color, and size, free from visible damage and blot were selected for analyses. The fruits were detached, washed with water, and blotted gently. The average length, width, and height of fruit were 1.30 cm, 1.15 cm, 1.14 cm, respectively. The average core weight was determined as 0.53 g. The fruits were stored at +4 °C before the drying process. The dried fruits were stored in a desiccator after cooling at a temperature of 25 °C until the extraction process and other analyses.

2.2. Methods

2.2.1. Determination of Dry Matter Content and Drying Time

Cherry laurels samples were dehydrated with three different methods namely, freeze-drying (FD) and hot-air drying (HAD) and ultrasound-assisted vacuum drying (USV). Cherry laurels samples dried as a whole. The drying process for HAD and USV was carried out at 50, 60, and 70 °C temperatures. The air velocity was constant at 1.3 m/s for HAD and measured by a Testo 440 probe anemometer (Lutron, AM-4201, Taiwan). FD was performed according to the standard program of freeze-dryer (Martin Christ, Beta 1-8 LSCplus, Osterode am Harz, Germany) at −55 °C and 1 hPa for 72 days. USV was performed according to the method of TekinandBaslar [11]. In the USV system, an ultrasonic water bath (Daihan, WUC-D10H, Gangwondo, South Korea) was used to control drying temperature, and a vacuum pump (EVP 2XZ-2C, Zhejiang, China) was used to reduce pressure. The properties of ultrasonic water bath (10 L) were with an amplitude of 100%, and power intensity of 1 W/cm2, and a vacuum pump provides 15 mbar pressure. The samples were placed into the conical flask connected to the vacuum pump and sonication was applied at 40 kHz by the ultrasonic water bath. A thermocouple (k-type, Omega Engineering Inc., Norwalk, Connecticut, USA) was used to measure the temperature of the water bath adjusted by the manual circulation of the bathwater. The drying time was 950, 615, and 445 min at 50, 60, and 70 °C, for USV. Water loss of the cherry laurel samples was measured at 30 min intervals for HAD and USV. The samples were weighted by a digital balance (Mettler-Toledo AG, Grefensee, Switzerland, model BB3000 with ±0.1 g). The drying process was completed when the final moisture content of the samples achieved to ~0.2 kg water/kg dry matter (DM.). The experiments were performed in triplicate, and the average moisture content values were used to plot the drying curves for HAD and USV. To determine dry matter content, cherry laurels were dehydrated in the oven at 105 °C until it reached a constant weight. The dry matter content of cherry laurels was determined by weighing the constant mass (19.64 %DM).

2.2.2. Extraction Procedure

The methanol-water (50:50) solution was used for the extraction solvent of fresh and dried samples, and solid:solvent ratio was 1:10 (w/v). The mixture was homogenized by an ULTRA-TURRAX (Daihan, HG-15D, Gangwondo, Korea) at 10,000 rpm for 3 min, followed by 2 h of shaking at a temperature of 25 °C. At the end of the extraction, the mixture was centrifuged at 3920× g (Hettich 320R, Tuttlingen, Germany) and the supernatant was filtered by a 0.45 µm filter. The final extracts were stored at −20 °C until further analysis.

2.2.3. Determination of Total Phenolic Content (TPC)

For the determination of TPC value, the modified method reported by Singleton [15] was followed. Folin–Ciocalteu’s phenol reagent solution (0.2 N) was prepared. Sample extracts were diluted with distilled water as a ratio of 1:60 (v/v). 2.5 mL reagent solution and 2.0 mL Na2CO3 (7.5%) were added into a tube containing 0.5 mL the diluted extracts. The tubes were stored for 60 min in dark at room temperature (25 °C). The absorbance values of the samples were recorded at 760 nm using a UV/VIS Spectrophotometer (UV-1800; Shimadzu, Japan). The result of the TPC was presented as mg gallic acid equivalents (GAE) per 100 g samples (DM).

2.2.4. Determination of Total Flavonoid Content (TFC)

For the determination of TFC, the method described by Zhishen, et al. [16] was followed. 1 mL of diluted extract (1:30, v/v) was mixed with 4 mL distilled water. Afterwards, 0.3 mL NaNO2 (5%), 0.3 mL AlCI3 (10%) and 2 mL 1 M NaOH were added to the mixture. The total volume was completed to 10 mL with distilled water and mixed with a vortex for about 1 min. The absorbance value of the samples was recorded at 510 nm by the UV-VIS Spectrophotometer, and the results were expressed as mg catechin/100 g samples (DM).

2.2.5. Total Anthocyanin Content (TAC)

TAC value was determined by the pH-differential method explained by GiustiandWrolstad [17]. and 3.2 mL of buffer solutions (pH 1.0 and pH 4.5) was mixed with 0.8 mL diluted extracts (1:4, v/v). The mixture was stored in dark for 30 min at room temperature. The absorbance values of the samples were measured at 510 and 700 nm using the UV-VIS Spectrophotometer A molar extinction coefficient and molecular weight of cyanidin-3-glucoside (29,600 and 445.2 g/mol, respectively) were used of for the determination of TAC. The results were given as mg cyanidin-3-glucoside per 100 g samples (DM).

2.2.6. Antioxidant Capacity by DPPH Method

Antioxidant capacities (AA) of the samples were analyzed by the DPPH method described by Singh, et al. [18]. 0.1 mM ethanolic DPPH solution was prepared, and 0.1 mL of each diluted extract was mixed with 4.9 mL DPPH solution, and samples stored at a temperature of 25 °C for 30 min in dark conditions The values of absorbance was measured at 517 nm using the UV-VIS Spectrophotometer (The result of AA was given as mg Trolox equivalent (TE) per 100 g samples (DM)

2.2.7. Determination of Phenolic Profile

The individual phenolic compounds of the cherry laurel sample were determined by the HPLC system coupled to a diode array (HPLC-DAD, Shimadzu Corp., Kyoto, Japan). HPLC system consisted of an LC-20AD pump, an SPDM20A DAD detector, a SIL-20A HT autosampler, a CTO-10ASVP column oven, a DGU-20A5R degasser, and a CMB-20A communications bus module (Shimadzu Corp., Kyoto, Japan). A reversed-phase column (Intersil® ODS C-18, GL Sciences, Tokyo, Japan) with a 250 mm × 4.6 mm length, 5 μm particle size was used to perform separation of phenolic compounds at 40 °C. The mobile phases consisted of solvent A (distilled water with 0.1% (v/v) acetic acid) and solvent B (acetonitrile with 0.1% (v/v) acetic acid). Gradient elution was applied at a flow rate of 1 mL/min and it was: 10% B (0 to 2 min), 10% to 30% B (2 to 27 min), 30% to 90% B (27 to 50 min) and 90% to 100% B (51 to 60 min). Chromatograms were obtained at 254–356 nm. Identification and quantification analysis were conducted based on standard curves and retention times and. The detection of phenolic compounds was performed at 260 nm (epicatechin), 280 nm (gallic, syringic, protocatechuic, caffeic, cinnamic, p-hydroxybenzoic acid and catechin), 320 nm (chlorogenic, vanillic, p-coumaric, ferulic acid) and 360 nm (rutin, quercetin). The concentration of each phenolic compound was expressed as mg per 100 g of sample (DM) [12].

2.2.8. SEM Analysis

The surface structures of samples were evaluated with Scanning Electron Microscopy (SEM). The microstructure of the dried samples was characterized by a field emission scanning electron microscope (FESEM, FEI QUANTA FEG 250). Dried cherry laurel samples were cut and fixed on the SEM stub and covered with a golden coat to supply a reflective surface for the electron beam [19].

2.2.9. Color Measurement

The color values of fresh and dried samples were measured using a colorimeter (CR-400 Konica, Minolta, Tokyo, Japan). L*, a* ve b* parameters of the samples were measured after calibrating at standard illuminant (D65). The total color difference index (ΔE) calculated by the following equation was used to define the change in the color values:
Δ E   =   ( Δ L ) 2 +   ( Δ a ) 2   +   ( Δ b ) 2  

2.2.10. Determination of Rehydration Ratio

To determine the rehydration ratio (RR), 2 g of the dried samples was immersed in 20 mL distilled water at 25 °C for 360 min and drained (Deng, 2017). The RR value was calculated by the equation:
R R = M M 0
here, M is the sample weight after rehydration; M0 is the sample weight before rehydration.
The rehydration kinetic of the dried samples was modeled by Peleg model:
M ( t ) = M 0 ± t k 1 + t × k 2
where M is moisture content at time t in (% DM.); M0 is the initial moisture content in (% DM); k1 is the Peleg rate constant in (min % DM−1); k2 is the Peleg capacity constant in (% DM−1). Peleg model parameters were calculated by nonlinear regression analysis using the Statistica software program (StatSoft, Inc., Tulsa, OK, USA).

2.2.11. Statistical Analysis

The statistical analysis was carried out using the Statistica software program (StatSoft, Inc., Tulsa, OK, USA). All the analyses were conducted in triplicate. The standard error and mean value were calculated. ANOVA was used to determine the statistical difference between samples. Duncan, multiple comparison tests at a 95% significance level was performed to evaluate the effect of different drying temperatures and methods on the evaluated properties.

3. Result and Discussion

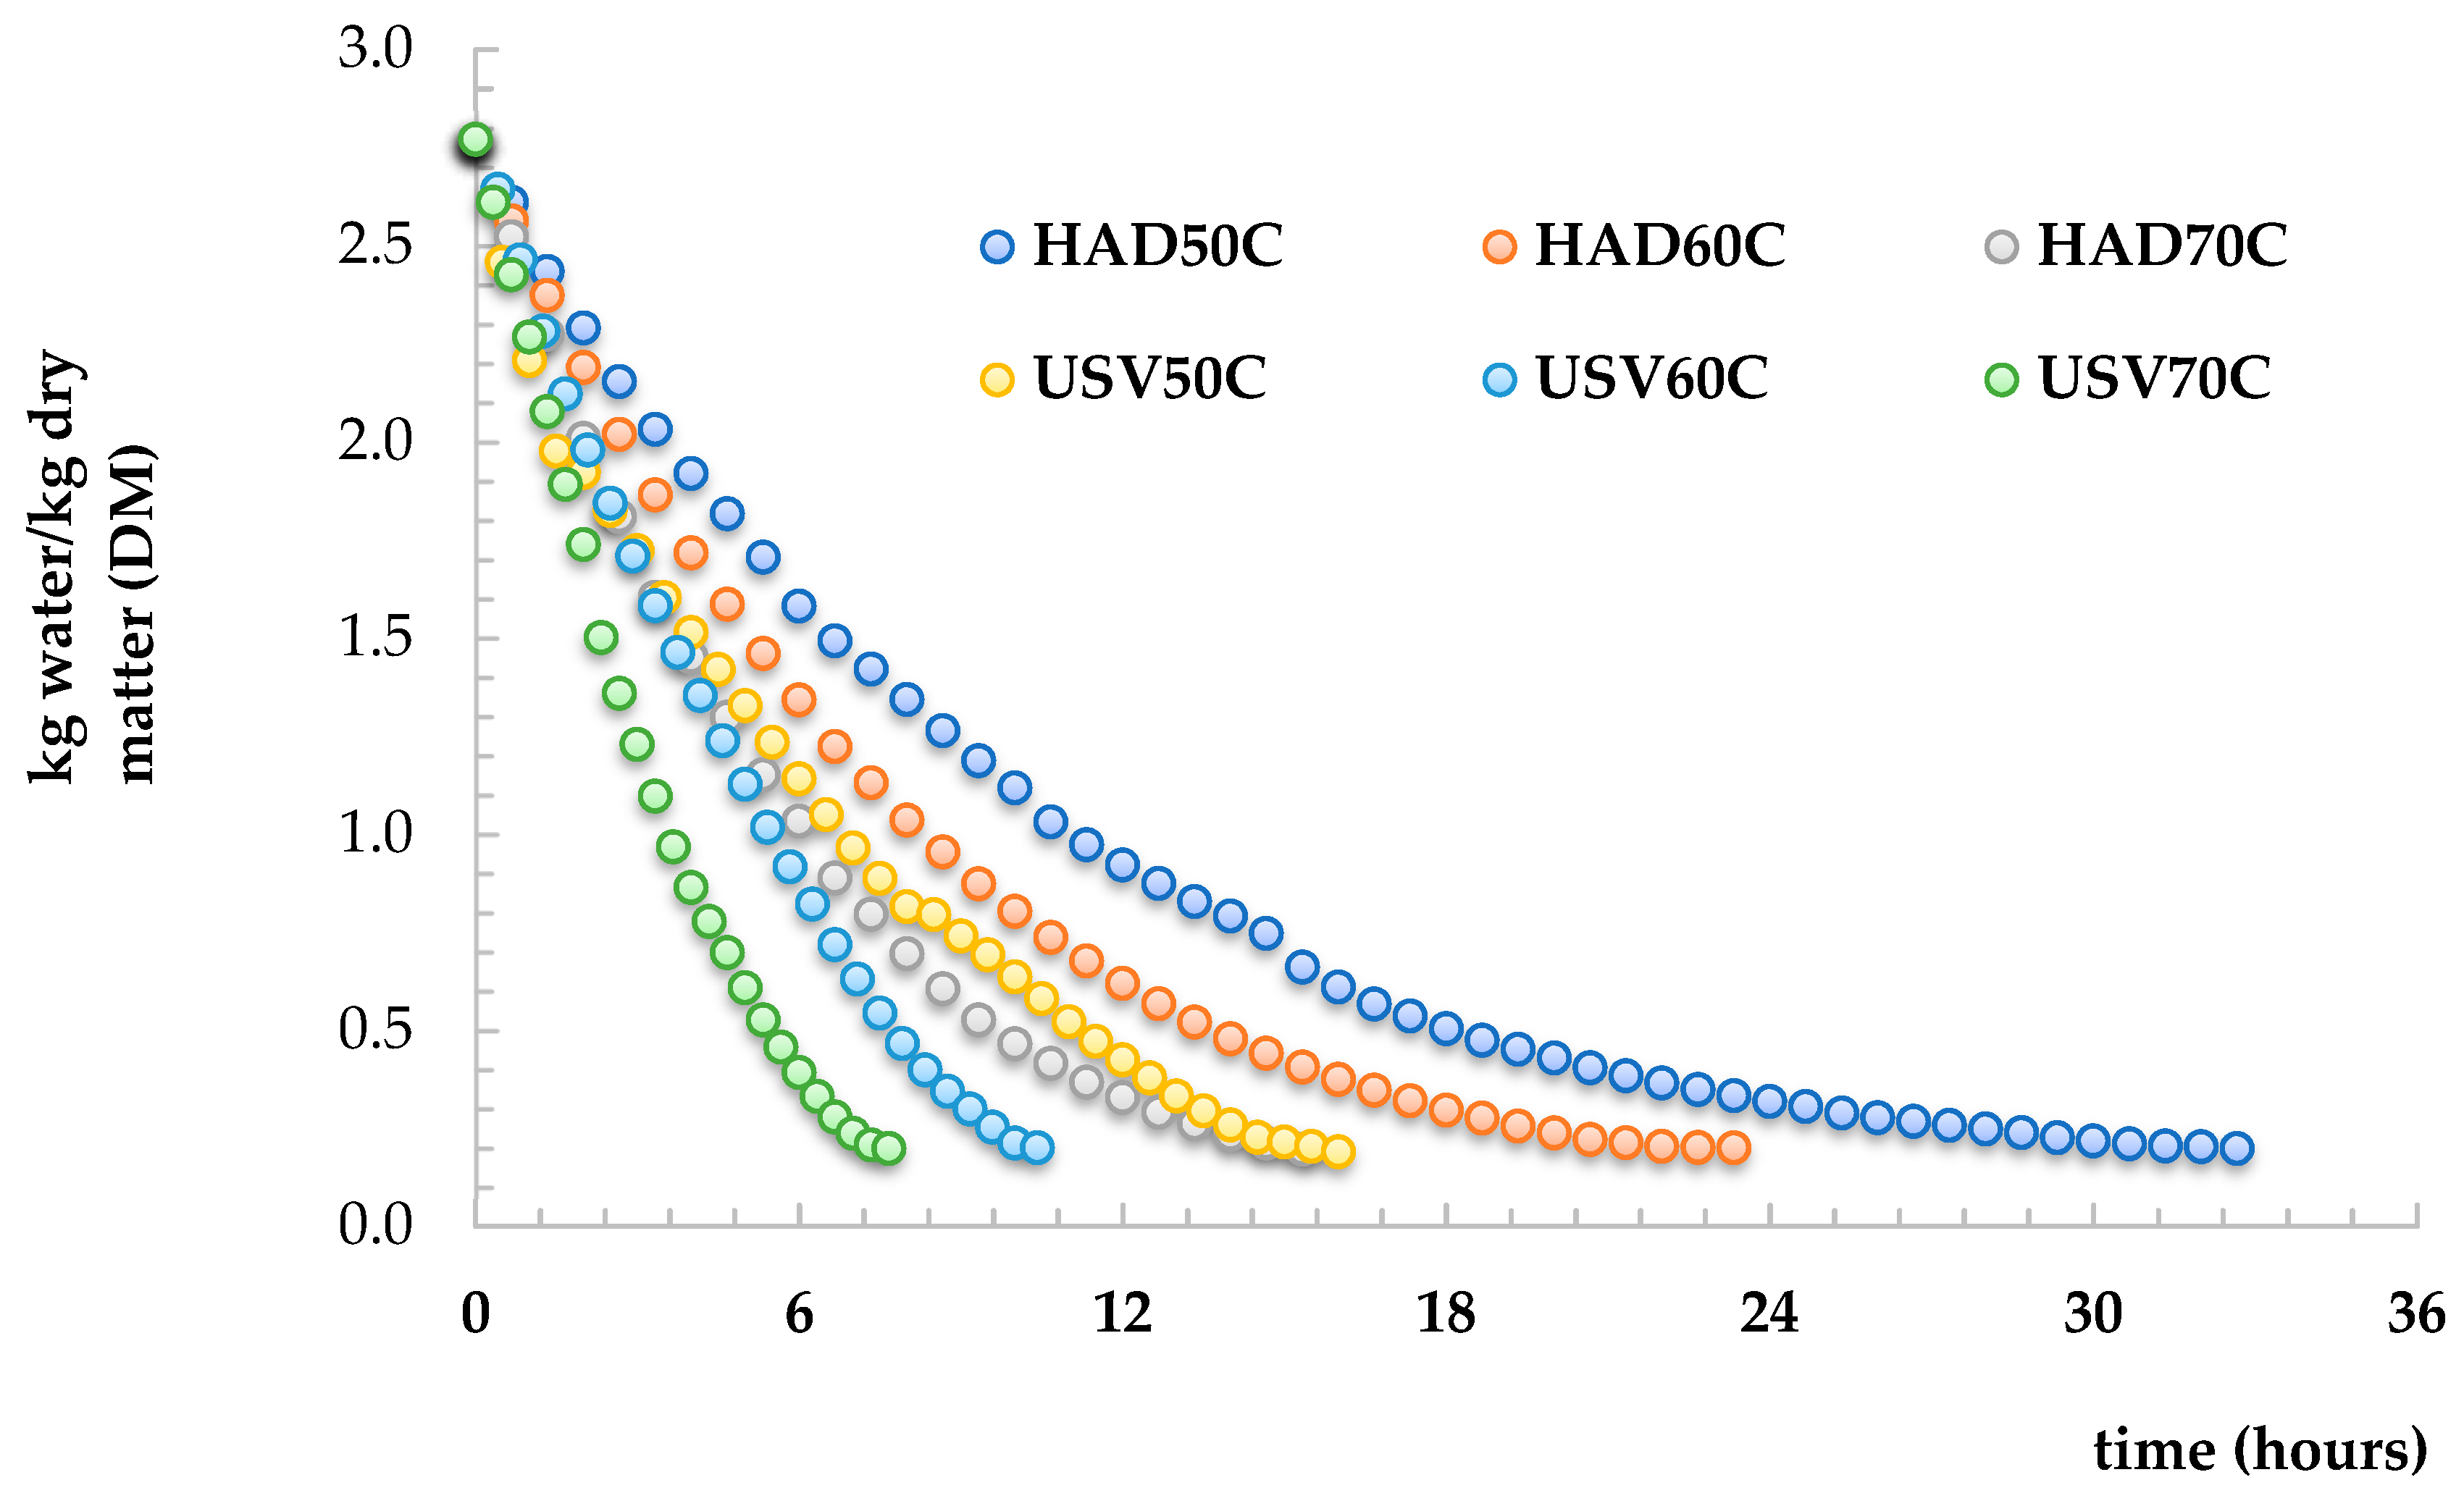
3.1. Drying Kinetic of Cherry Laurel for HAD and USV

Figure 1 shows the drying kinetics of the samples at different temperatures with HAD and USV. Drying time of the samples was 1980, 1220, and 770 min for HAD at 50, 60, and 70 °C and 950, 615, and 445 min at 50, 60, and 70 °C, respectively, for USV. In both drying methods, upon the Increase in temperature, the moisture ratio (kg water/kg DM) was increased, and consequently, the drying time was decreased. Along with the rise in temperature, the decrease in drying time has also been reported in previous studies [20,21]. When we compare HAD and USV at the same temperature, much higher moisture loss and shorter drying time were observed by USV. In both drying methods, a constant drying behavior was observed initially, while a falling rate period was observed towards the end of the drying time (Figure 1). At 60 and 70 °C, the falling rate period was shorter for USV than HAD Besides, at the highest temperature applied (70 °C) HAD exhibited similar drying kinetics to USV at 50 °C, at the lowest temperature applied (Figure 1), indicating that USV showed a much faster drying rate compare to HAD. This result can be explained by the fact that the cavitation effect associated with the ultrasound process disrupts the food matrix and creates pores therefore the water can easily move away [11]. For USV, the vacuum process could have also affected the drying behavior of samples by decreasing the boiling point and increasing the evaporation rate. The decrease in the drying time of the USV process compared to HAD has also been reported in previous studies [11,12,22].

3.2. Effect of Drying Methods on Bioactive Properties of Cherry Laurel

Table 1 shows the effect of different drying methods (HAD, USV, and FD) and drying temperatures on the TPC, TFC, TAC, and DPPH value of the samples. The drying temperature and drying method (HAD and USV) significantly affected the amount of total bioactive compounds (p < 0.05). The TPC, TFC, and TAC content of fresh samples were 839.66 (mg GAE/100 g DM), 1868.963 (mg catechin/100 g DM) and 130.41 (cyanidin 3-glucoside/100 g DM) respectively. As seen in Table 1, except for FD, a significantly important reduction in the amount of all bioactive compounds was observed in all drying conditions (p < 0.05). FD exhibited the highest retention in bioactive compounds. This result was the agreement with other studies [3,12,23]. The higher bioactive compounds in FD can be explained by the low temperatures and under vacuum conditions. In these conditions, the samples are dried without being exposed to thermal degradation and oxidation. The decrease in bioactive compounds in HAD and USV was significantly affected by the temperature (p < 0.05). Compared to the fresh samples, the decrease in the level of bioactive components in dried fruits can be explained by oxidation, thermal degradation, and an increase in polyphenol oxidase activity [24]. For the same drying method either by USV or HAD, the level of bioactive components increased as the temperature elevated. It can be explained that higher temperatures reduced the drying time e.g., in HAD, it was 1980 min while the temperature was 50 °C, and 770 min while it was 70 °C, meaning that the samples were subjected to less heat treatment during the whole drying process. Moreover, the rise in the temperature could damage the food structure, and bioactive compounds bound to the matrix could be better released into the extraction medium [25]. It was also known that higher temperatures could denature the polyphenol oxidase enzyme that is responsible for the degradation of phenolic compounds, therefore would increase their retention [26].
At the same temperature, USV showed a higher amount of bioactive compounds than those of HAD, and this difference was significant (p < 0.05). It can be explained that the drying times observed in USV are shorter than the HAD (e.g., at 50 °C, the drying time for USV was 445 min. and for HAD it was 770 min) and the samples are exposed to less thermal process [12]. Besides, the cavitation effect and formation of microchannels may have led to the release of more phenolics bound to the matrix and an improvement in the extraction of phenolic compounds. The higher retention of phenolic compounds by ultrasound-assisted drying was also reported in the previously published studies [10,11,12,27]. The DPPH radical scavenging ability of the samples depending on the drying method showed a similar trend with the total amount of bioactive compounds. Compared to fresh and FD samples, HAD and USV drying led to a reduction in antioxidant capacity. FD showed the highest antioxidant capacity while HAD showed the lowest value. For the same drying method, the rise in temperature also significantly increased the antioxidant capacity (p < 0.05) as a result of higher retention of phenolic compounds.
In this study, the effect of the drying method on the phenolic profile was also investigated. Chlorogenic acid was the major phenolic compounds determined in cherry laurel, followed by epicatechin, vanillic acid, and syringic acid (Table 2). These findings were similar to previous studies [1]. Compared to fresh samples, there was a significant decrease in individual phenolics in fruits dried by both HAD and USV methods. For HAD, at 50 °C, 60 °C and 70 °C, the chlorogenic acid content was reduced by 88, 82, and 79%. A similar trend was observed for USV dried samples at 50 and 60 °C, whereas at 70 °C the reduction was 14%. The reason for the higher concentration of chlorogenic acid in the extracts could be both related to the higher liberation of phenolics from the disrupted fruit matrix due to the ultrasound cavitation effect, and shorter drying time. In terms of epicatechin content, the second most abundant phenolics detected, the less reduction by the higher drying temperature was also observed in both HAD and USV methods. Compared to fresh samples, the higher level of phenolics was determined in FD fruits, which can be explained by ice crystal formation which could rupture the cell structure and led to the higher extraction rate [3].

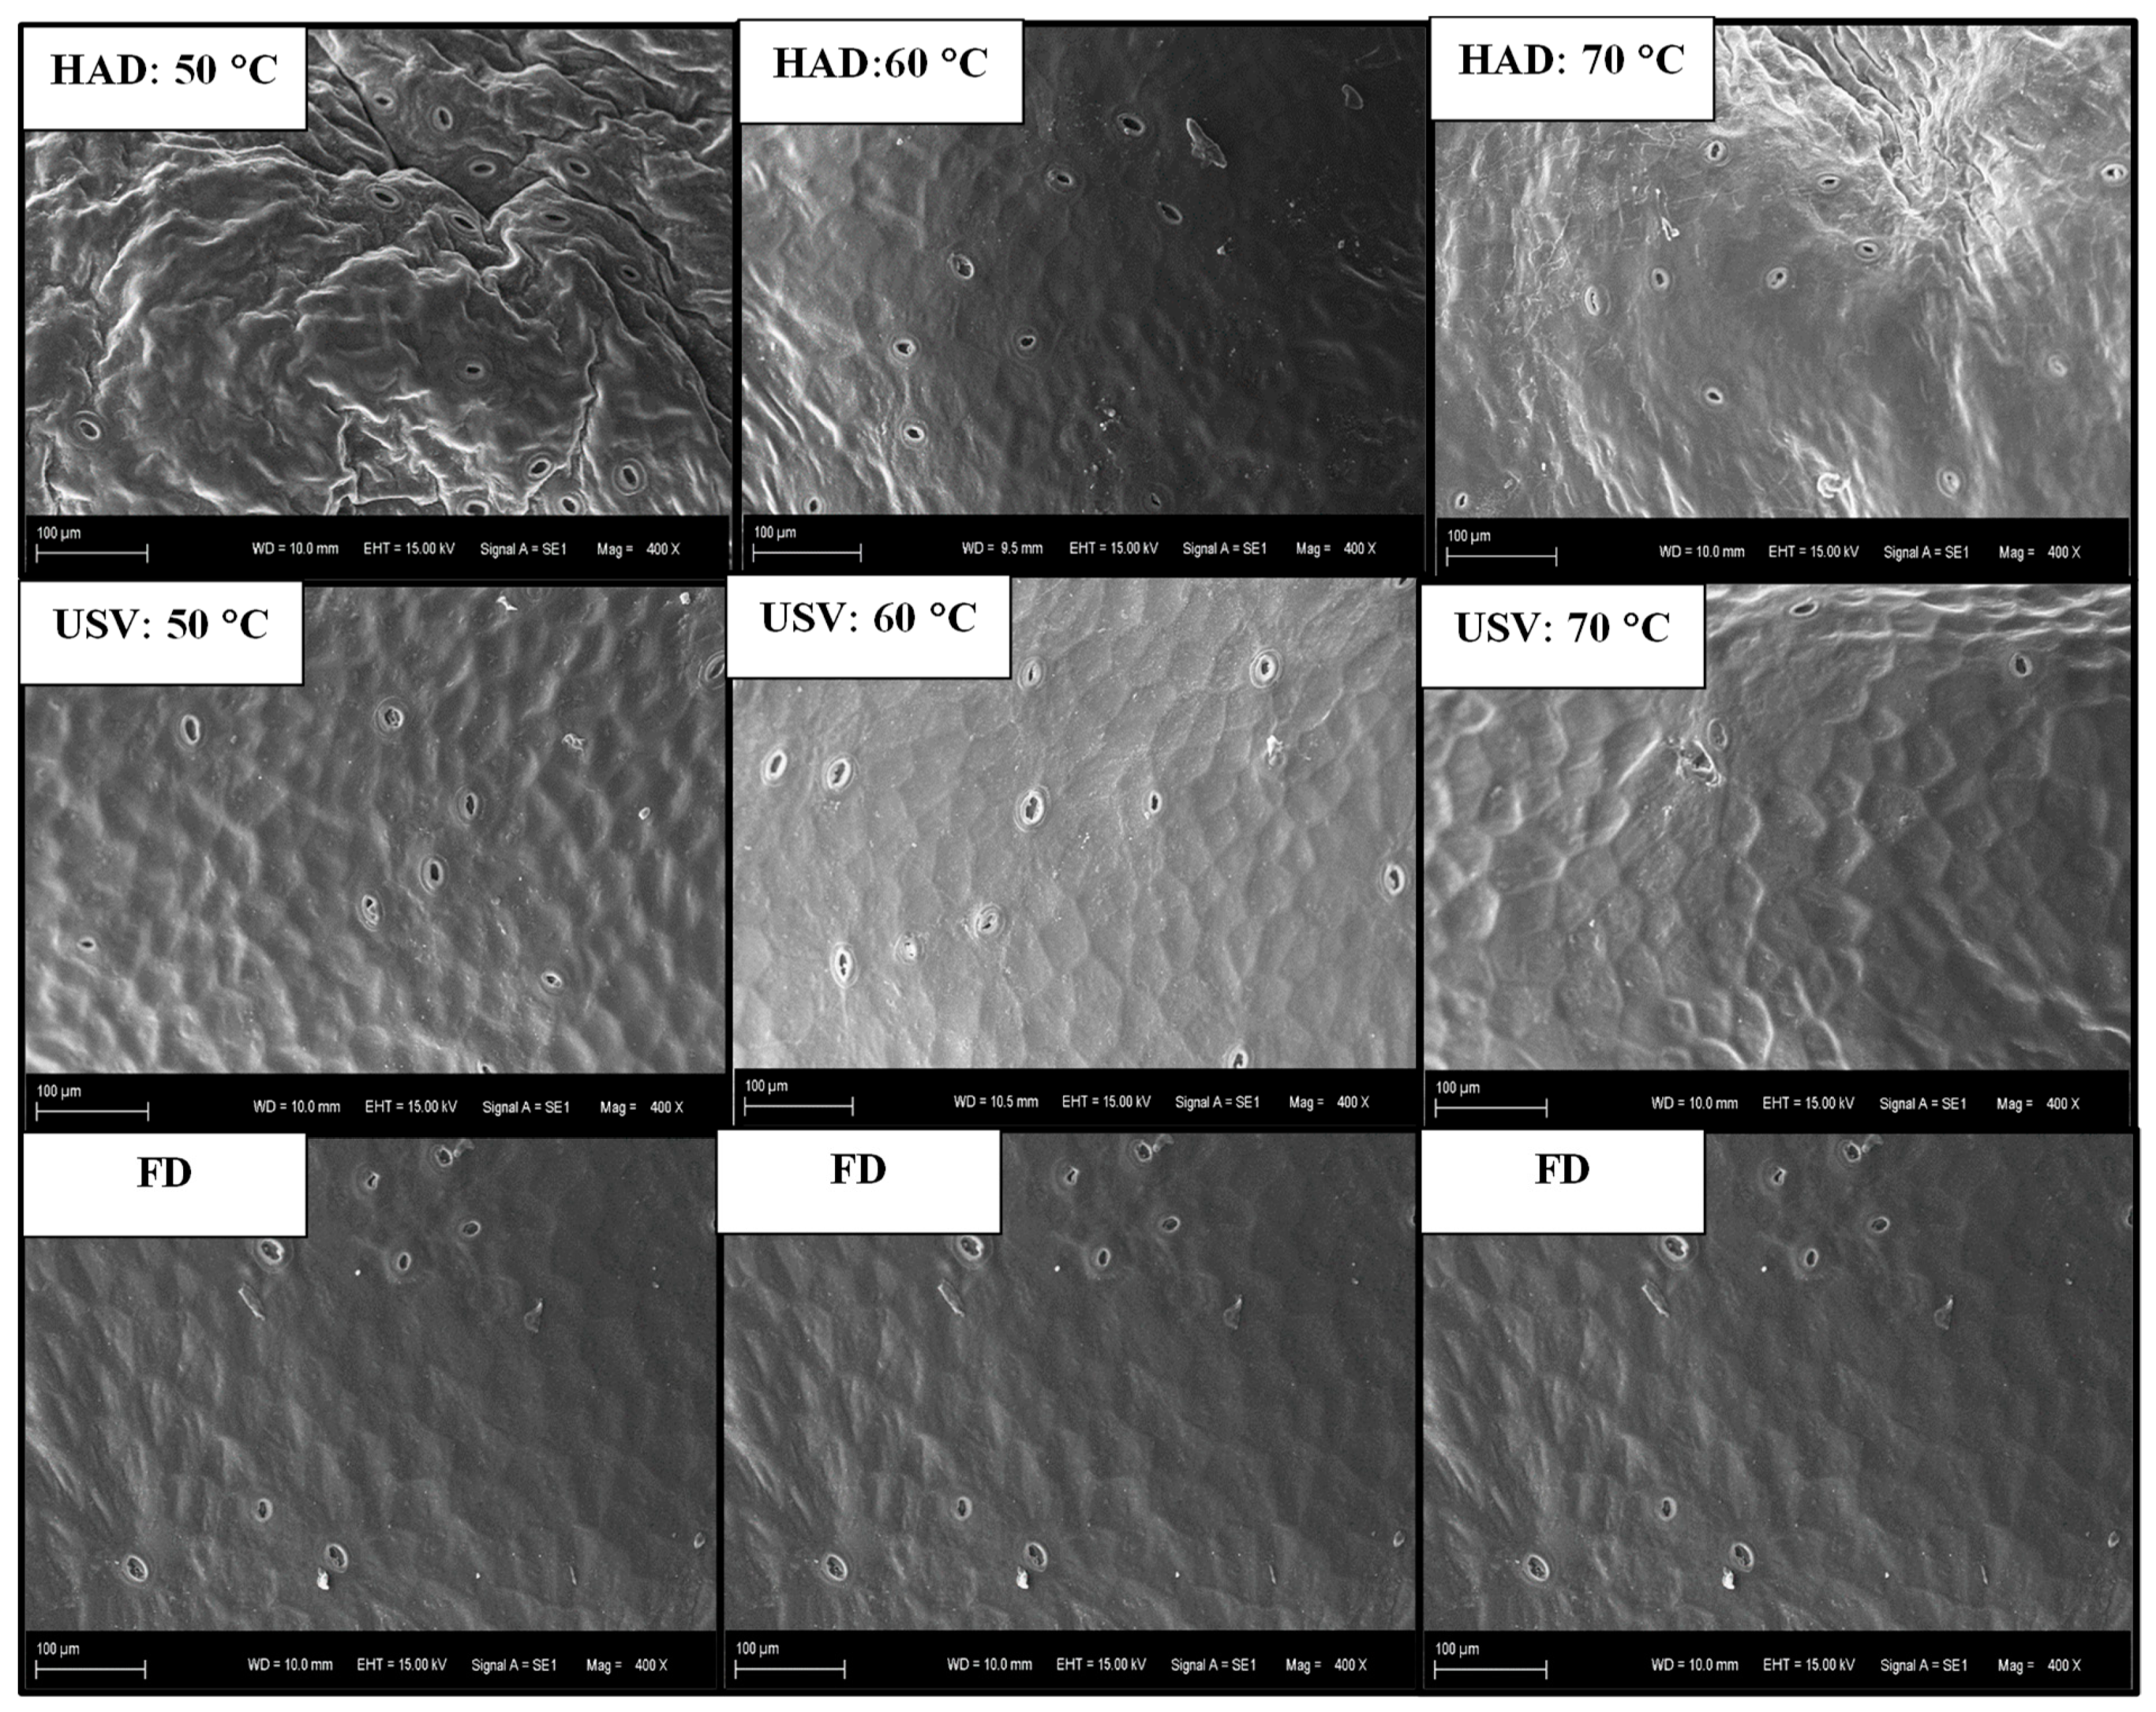
3.3. The Effect on Microstructural Properties of Cherry Laurel

The SEM images showed the effect of different drying methods and temperature on the surface characteristics of dried fruits (Figure 2). Shrinkage is one of the primary physical defects that occur as a result of deterioration of the capillary structure during drying of food, and undesirable effects may occur in the texture, rehydration ability, and surface properties of the food [28].
Both the drying temperature and drying methods affected the shrinkage level of the samples. As can be seen from the figure, the highest shrinkage was observed in fruits dried by HAD compared to other methods. The higher shrinkage values during HAD was also reported from the previously published study [29]. The higher shrinkage could be due to a higher moisture gradient that occurred in HAD drying. The higher moisture gradient caused microstructure stress, collapsing of capillary, and irreversible structural change [30]. For HAD, application of drying temperature at 50 °C caused more shrinkage than those of 60 °C and 70 °C The longer drying time at 50 °C might have disrupted the cell wall and increased shrinkage level. HAD at 60 °C resulted in a lower shrinkage level than that of 70 °C. The optimum conditions related to both time and temperature might have resulted in lower shrinkage at 60 °C. The increase in temperature from 60 °C to 70 °C might have caused collapsing of the capillary structure and forming of shrinkage.
For USV, the drying temperature of 70 °C caused a lower shrinkage than that of 50 °C and 60 °C. For USV, drying temperature was a significant factor for the formation of shrinkage. For this reason, 50 °C and 60 °C drying temperatures should be selected to reduce shrinkage levels during USV drying. The lower shrinkage level for USV than HAD could be due to the shorter drying time and less damage to the surface structure [31]. FD showed the lowest shrinkage compared to other drying conditions as reported in the previous studies [19,32,33]. USV 50 °C and 60 °C showed a similar surface characteristic to FD. The low shrinkage levels for FD could be due to drying temperature, which was lower than the glass transition temperature. As occurred in HAD, if the drying temperature is higher than the glass transition temperature of the sample, substantial shrinkage occurs in dried samples [34]. The order of shrinkage value was FD < USV50 < USV60 < USV70 < HAD60 < HAD70 < HAD50. The pictures of dried and fresh samples in Figure 3 also confirmed the results obtained from SEM images. As can be seen in Figure 3, the volume of the samples dried by HAD was lower than that of the others. The FD dried sample was similar to the fresh fruit in terms of total volume and surface characteristics.

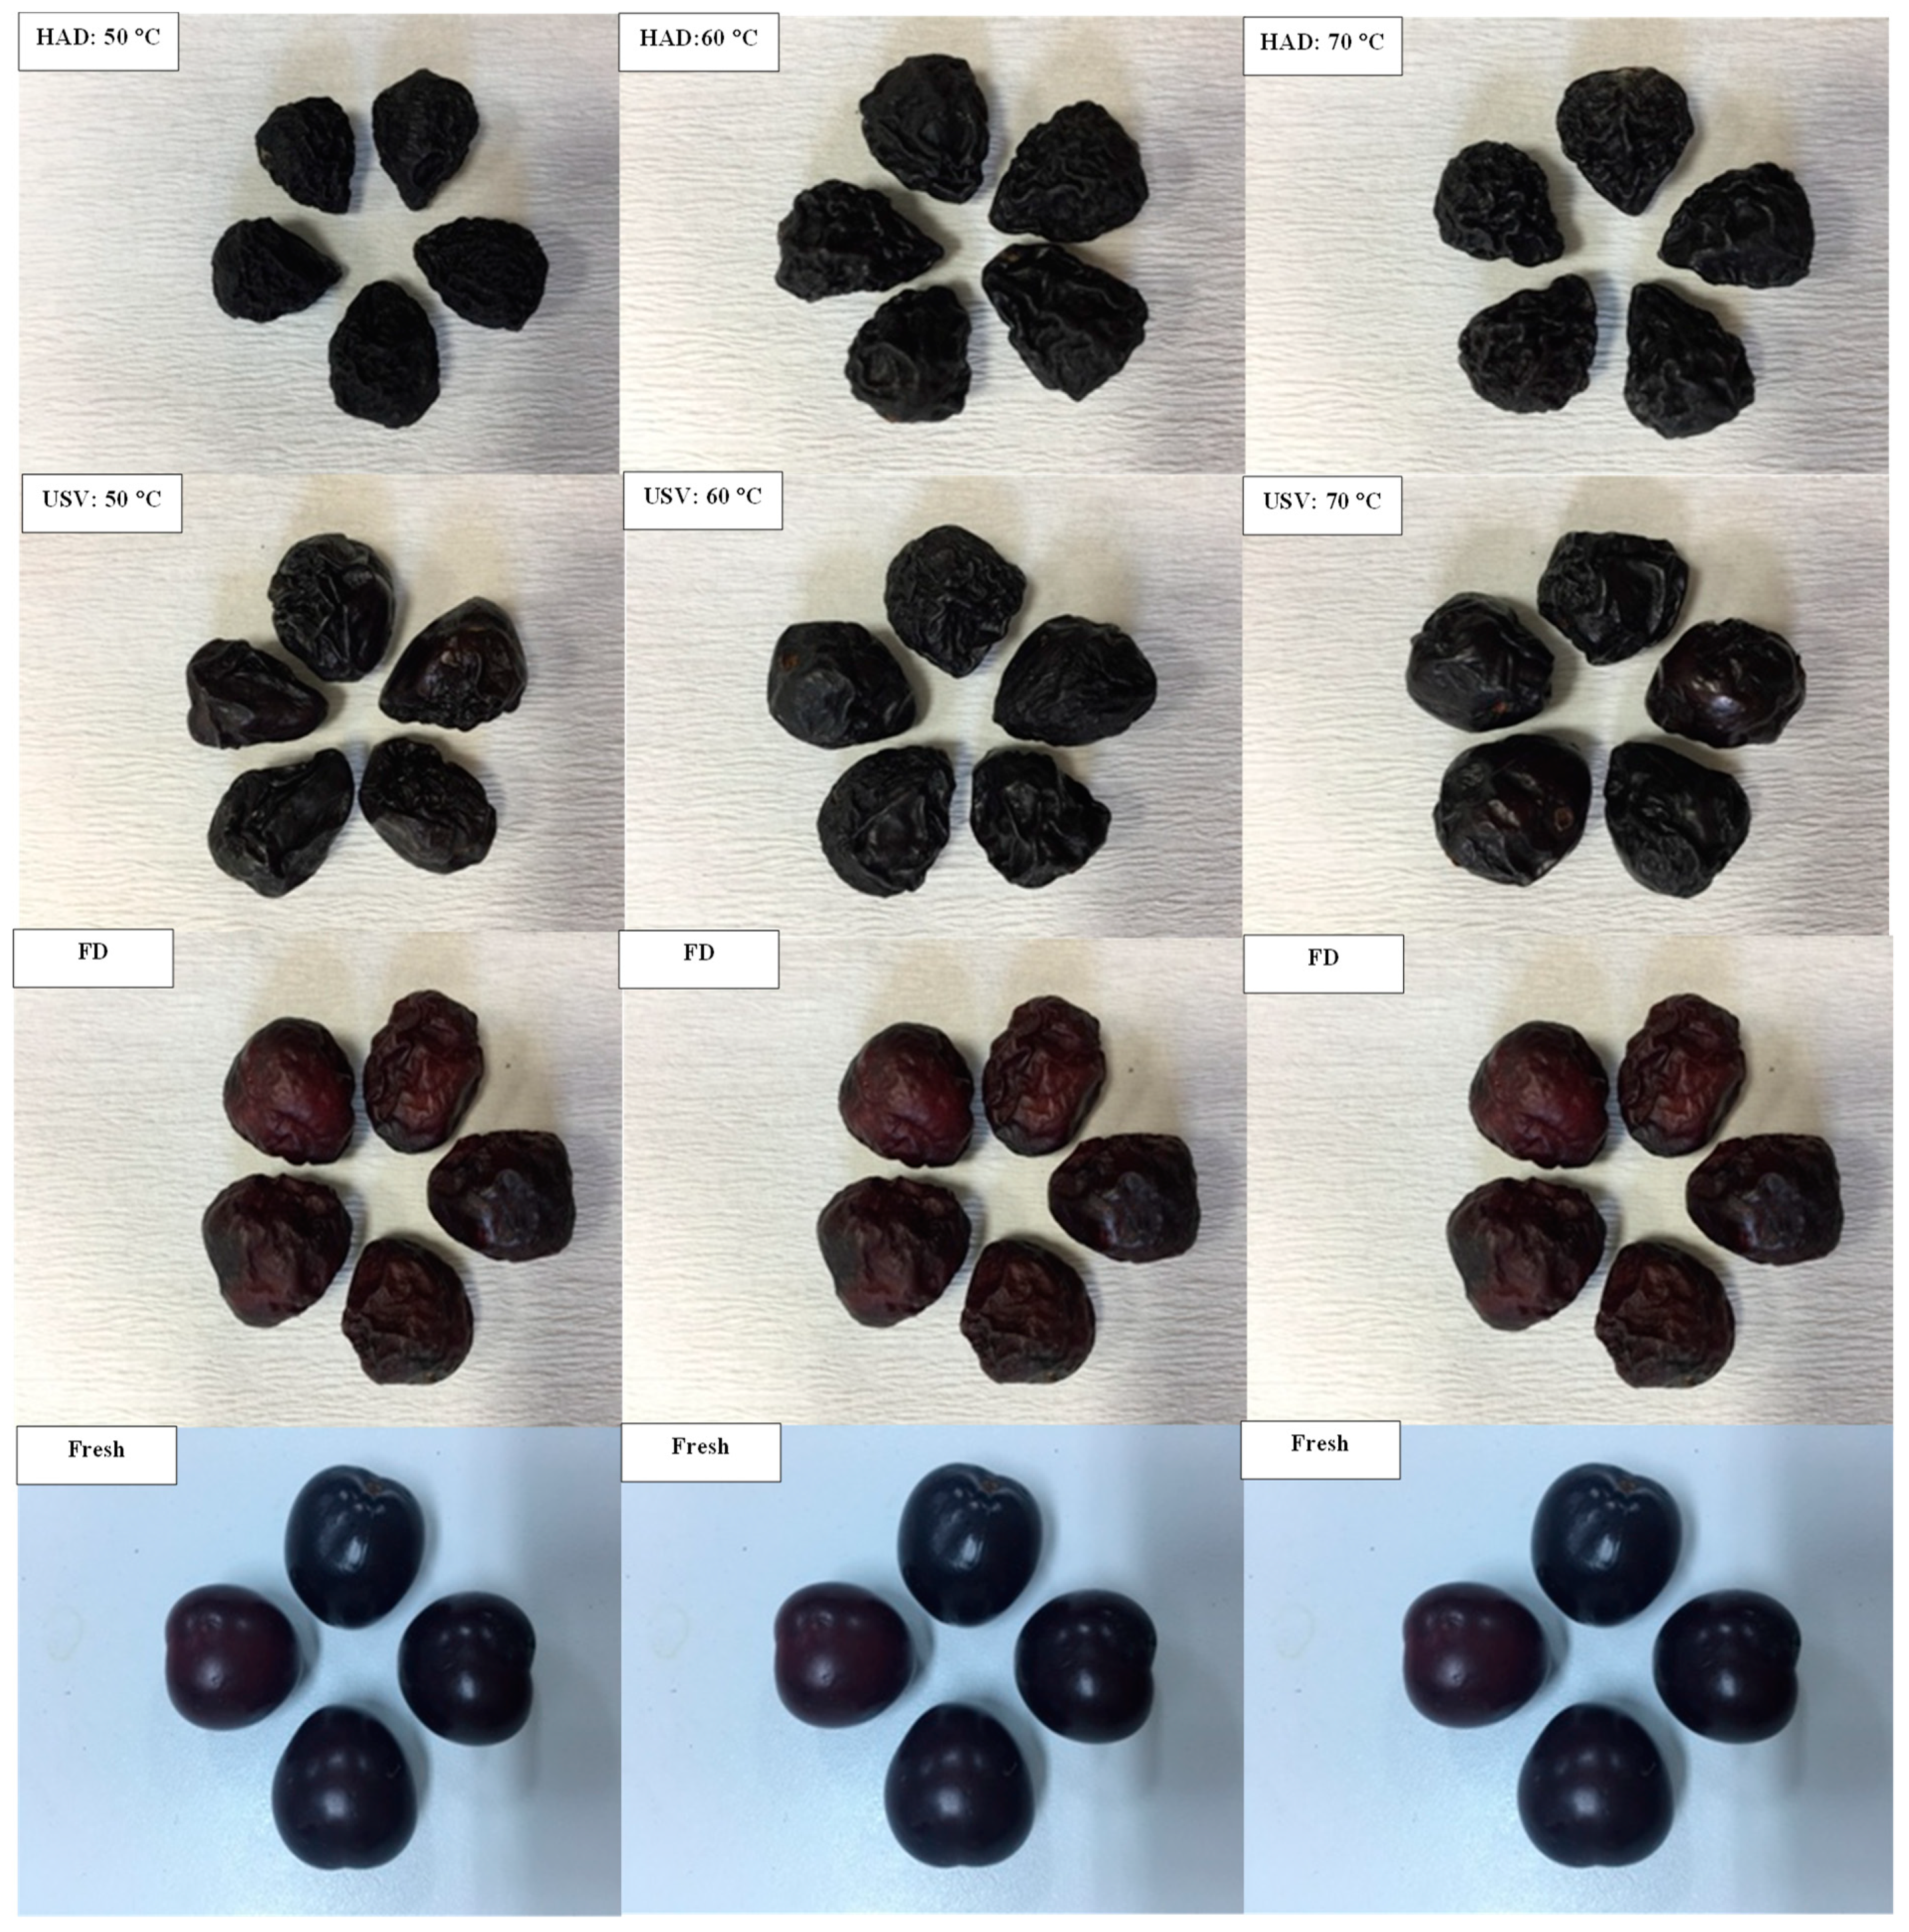
3.4. The Effect on Cherry Laurel Color

Table 3 showed the effect of the drying method and temperature on the color parameters of the cherry laurel. Drying methods and drying temperature significantly affected L*, a*, and b* value of the samples (p < 0.05). L*, a*, and b* of the fresh samples were found as 29.23, 9.15, and −4.15, respectively. L* and a* value increased for the samples dried FD while these values decreased for USV and HAD dried samples. Kayacan, Karasu, Akman, Goktas, Doymaz, and Sagdic [12] reported similar results. The higher L* and a* value for FD dried samples can be explained by the fact that thermal degradation and browning reaction do not occur in the freeze-drying process at the low temperature [3]. The increase in anthocyanin concentrations after removing water could result in the higher a value obtained by FD. The effect of temperature on color parameters for HAD was also significant (p < 0.05). The longer drying time in the HAD might have led to higher pigment degradation and non-enzymatic browning [35]. The drying temperature of 50 °C showed the lowest L and a value. In terms of color properties, the drying temperature of 60 °C was the best condition for HAD. The combined effect of time and temperature could be an effect on the retention of color parameters. The drying temperature did not significantly affect the color parameters for USV. The ΔE value was calculated to examine total color differences. USV drying conditions and FD showed similar ΔE. However, the ΔE value for FD could be considered positive because color parameters showed an increasing trend. ΔE for HAD and USV showed a decreasing trend and could be regarded as a negative quality index. Color results were in agreement with microstructural properties.

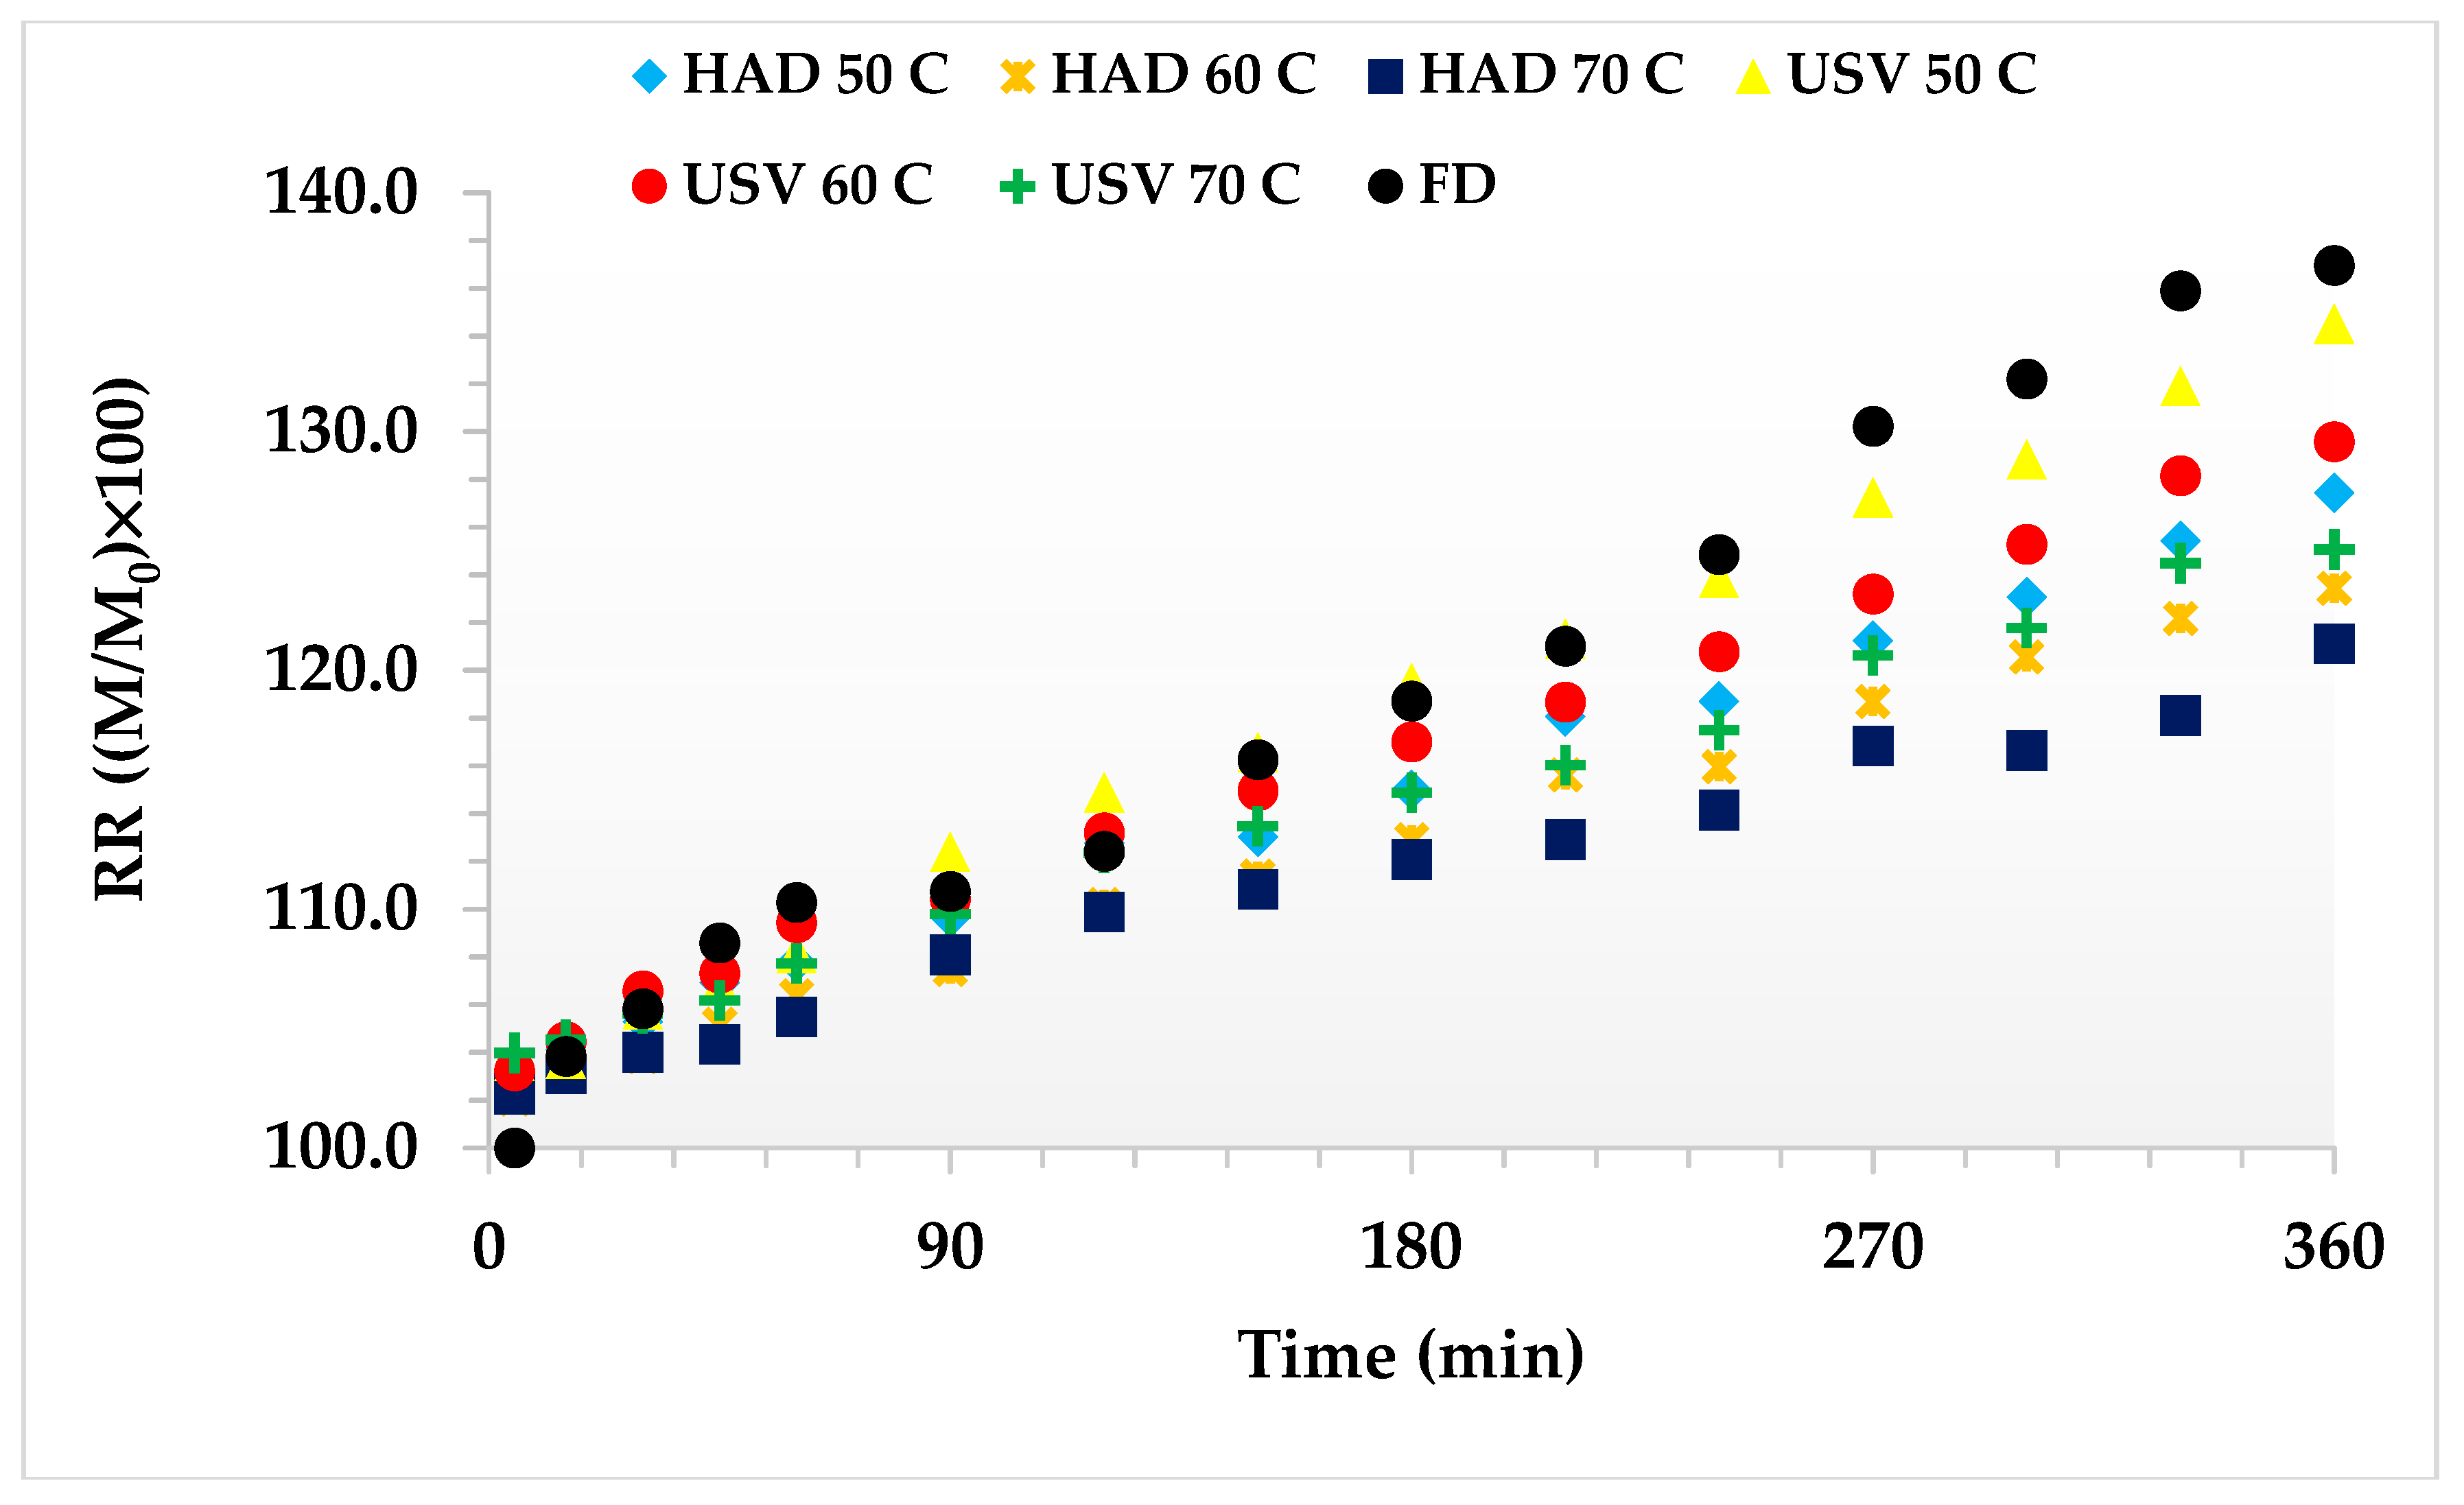
3.5. Effect on Rehydration Characteristic of Dried Cherry Laurel

Figure 4 depicted the rehydration kinetics of dried samples at 25 °C. As it was seen, drying methods and drying temperatures showed a different rehydration ratio. In considering the drying method, FD dried samples showed higher water absorption values than that of the others. USV dried samples had more rehydration capacity than HAD dried samples at the same temperature value. The rehydration capacity of the samples was decreased with increased drying temperature at both USV and HAD methods. The significant effect of drying temperature on rehydration capacity was also reported [19,36,37]. The decrease in water absorption capacity with a higher drying temperature of 50–70 °C was reported by Vega–Gálvez, Zura–Bravo, Lemus–Mondaca, Martinez–Monzó, Quispe–Fuentes, Puente, and DiScala [37]. A similar rehydration trend was observed between the samples dried with USV at 70 °C and HAD 50 °C. The higher rehydration capacity obtained from FD for different dried foods was also reported from other studies [19,38]. The higher rehydration capacity for FD could be attributed to lower drying temperature and less damage to the cell-matrix. The spongy texture formed during FD could lead to higher water absorption capacity. During the USV, the application of vacuum and ultrasounds process could lead to a more porous structure compared to HAD and resulted in higher water absorption capacity [33]. The higher rehydration capacity during the USV process can be explained by the higher internal stresses and pore formation. The longer falling rate period and drying time observed in HAD might have resulted in cell disruption and local dry matter accumulation. The increase in rehydration capacity by application of ultrasound for different food types was also reported in other studies [19,39].
The Peleg model was applied to describe the effect of drying methods and temperature on the rehydration parameters. Table 4 showed Peleg model parameters, namely M0, K1, and K2. The R2 values higher than 0.99 indicated that the Peleg model successfully described rehydration kinetics of the samples. K1 and K2 were significantly affected by drying temperature and drying methods. The lowest K1 (8.04), and K2 (0.1) values were obtained from FD dried samples, indicating that sampled dried by FD showed higher rehydration than other samples. The K1 and K2 values were increased by higher drying temperatures. At the same drying temperature, USV showed lower K1 and K2 values than those of HAD, indicating that fruits dried by USV showed higher rehydration capacity than those of HAD.

4. Conclusions

In this study, the effects of different drying methods and temperature on different quality parameters of cherry laurel fruit were investigated. The drying method and the applied temperature significantly affected all investigated properties of cherry laurel fruit (p < 0.05). The FD method exhibited better results in terms of all characteristics than other methods. USV, on the other hand, provided lower drying time, color change, and shrinkage and higher phenolic retention compared to the HAD method. Besides, it was concluded that the most suitable temperature was 60 °C for HAD. The results of this study indicated that USV could be performed as an alternative method to HAD due to the lower drying time, higher bioactive component retention, and lower shrinkage value. The use of USV could have potential as an alternative to FD due to lower drying time, and highly acceptable quality parameters of the dried foods.

Author Contributions

Conceptualization, S.K.; methodology, S.K.; software, S.K. validation, A.K.; investigation, F.T.; data curation, F.T.; writing—original draft preparation, S.K. and F.T.; writing—review and editing, S.K. and A.K.; supervision, S.K. All authors have read and agreed to the published version of the manuscript.

Funding

This research supported by the Yildiz Technical University Coordinator Ship of Scientific Research Projects.

Conflicts of Interest

The authors declare no conflict of interest.

References

  1. Celik, O.F.; Demirkol, M.; Durmus, Y.; Tarakci, Z. Effects of drying method on the phenolics content and antioxidant activities of cherry laurel (Prunus laurocerasus L.). J. Food Meas. Charact. 2020, 14, 48–54. [Google Scholar] [CrossRef]
  2. Capanoglu, E.; Boyacioglu, D.; de Vos, R.C.H.; Hall, R.D.; Beekwilder, J. Procyanidins in fruit from Sour cherry (Prunus cerasus) differ strongly in chainlength from those in Laurel cherry (Prunus lauracerasus) and Cornelian cherry (Cornus mas). J. Berry Res. 2011, 1, 137–146. [Google Scholar] [CrossRef] [Green Version]
  3. Gao, Q.H.; Wu, C.S.; Wang, M.; Xu, B.N.; Du, L.J. Effect of drying of jujubes (Ziziphus jujuba Mill.) on the contents of sugars, organic acids, α-tocopherol, β-carotene, and phenolic compounds. J. Agric. Food Chem. 2012, 60, 9642–9648. [Google Scholar] [CrossRef] [PubMed]
  4. Rodriguez, M.M.; Rodriguez, A.; Mascheroni, R.H. Color, texture, rehydration ability and phenolic compounds of plums partially osmodehydrated and finish-dried by hot air. J. Food Process. Preserv. 2015, 39, 2647–2662. [Google Scholar] [CrossRef]
  5. Calín-Sánchez, Á.; Figiel, A.; Hernández, F.; Melgarejo, P.; Lech, K.; Carbonell-Barrachina, Á.A. Chemical Composition, Antioxidant Capacity, and Sensory Quality of Pomegranate (Punica granatum L.) Arils and Rind as Affected by Drying Method. Food Bioprocess. Technol. 2013, 6, 1644–1654. [Google Scholar] [CrossRef]
  6. Singh, D.B.; Ambrose, K. Effect of convective drying on quality of anardana. Indian J. Hortic. 2008, 65, 413–416. [Google Scholar]
  7. Wojdyło, A.; Figiel, A.; Legua, P.; Lech, K.; Carbonell-Barrachina, Á.A.; Hernández, F. Chemical composition, antioxidant capacity, and sensory quality of dried jujube fruits as affected by cultivar and drying method. Food Chem. 2016, 207, 170–179. [Google Scholar] [CrossRef]
  8. Başlar, M.; Kılıçlı, M.; Toker, O.S.; Sağdıç, O.; Arici, M. Ultrasonic vacuum drying technique as a novel process for shortening the drying period for beef and chicken meats. Innov. Food Sci. Emerg. Technol. 2014, 26, 182–190. [Google Scholar] [CrossRef]
  9. Başlar, M.; Kılıçlı, M.; Yalınkılıç, B. Dehydration kinetics of salmon and trout fillets using ultrasonic vacuum drying as a novel technique. Ultrason. Sonochem. 2015, 27, 495–502. [Google Scholar] [CrossRef]
  10. Tekin, Z.H.; Başlar, M.; Karasu, S.; Kilicli, M. Dehydration of green beans using ultrasound-assisted vacuum drying as a novel technique: Drying kinetics and quality parameters. J. Food Process. Preserv. 2017, 41, e13227. [Google Scholar] [CrossRef]
  11. Tekin, Z.H.; Baslar, M. The effect of ultrasound-assisted vacuum drying on the drying rate and quality of red peppers. J. Therm. Anal. Calorim. 2018, 132, 1131–1143. [Google Scholar] [CrossRef]
  12. Kayacan, S.; Karasu, S.; Akman, P.K.; Goktas, H.; Doymaz, I.; Sagdic, O. Effect of different drying methods on total bioactive compounds, phenolic profile, in vitro bioaccessibility of phenolic and HMF formation of persimmon. LWT 2020, 118. [Google Scholar] [CrossRef]
  13. Kaya, A.; Aydin, O. Experimental investigation of drying kinetics of cherry laurel. J. Food Process. Eng. 2008, 31, 398–412. [Google Scholar] [CrossRef]
  14. Talih, M.; Dirim, S.N. Determination of the drying characteristics of cherry laurel (Laurocerasus officinalis Roem.) puree in a freeze-dryer. Bulg. Chem. Commun. 2018, 50, 467–477. [Google Scholar]
  15. Singleton, V.L. Citation Classic—Colorimetry of total phenolics with phosphomolybdic-Phosphotungstıc acid reagents. Curr. Contents Agric. Biol. Environ. Sci. 1985, 48, 18. [Google Scholar]
  16. Zhishen, J.; Mengcheng, T.; Jianming, W. The determination of flavonoid contents in mulberry and their scavenging effects on superoxide radicals. Food Chem. 1999, 64, 555–559. [Google Scholar] [CrossRef]
  17. Giusti, M.; Wrolstad, R. Characterization and Measurement of Anthocyanins by UV-Visible Spectroscopy. Curr. Protoc. Food Anal. Chem. 2001. [Google Scholar] [CrossRef]
  18. Singh, R.P.; Chidambara Murthy, K.N.; Jayaprakasha, G.K. Studies on the Antioxidant Activity of Pomegranate (Punica granatum) Peel and Seed Extracts Using in Vitro Models. J. Agric. Food Chem. 2002, 50, 81–86. [Google Scholar] [CrossRef]
  19. Aksoy, A.; Karasu, S.; Akcicek, A.; Kayacan, S. Effects of different drying methods on drying kinetics, microstructure, color, and the rehydration ratio of minced meat. Foods 2019, 8. [Google Scholar] [CrossRef] [Green Version]
  20. Isik, A.; Ozdemir, M.; Doymaz, I. Effect of hot air drying on quality characteristics and physicochemical properties of bee pollen. Food Sci. Technol. 2019, 39, 224–231. [Google Scholar] [CrossRef] [Green Version]
  21. Doymaz, I.; Karasu, S. Effect of air temperature on drying kinetics, colour changes and total phenolic content of sage leaves (Salvia officinalis). Qual. Assur. Saf. Crops Foods 2018, 10, 269–276. [Google Scholar] [CrossRef]
  22. Chen, Y.; Li, M.; Dharmasiri, T.S.K.; Song, X.; Liu, F.; Wang, X. Novel ultrasonic-assisted vacuum drying technique for dehydrating garlic slices and predicting the quality properties by low field nuclear magnetic resonance. Food Chem. 2020, 306, 125625. [Google Scholar] [CrossRef]
  23. Madrau, M.A.; Piscopo, A.; Sanguinetti, A.M.; Del Caro, A.; Poiana, M.; Romeo, F.V.; Piga, A. Effect of drying temperature on polyphenolic content and antioxidant activity of apricots. Eur. Food Res. Technol. 2008, 228, 441. [Google Scholar] [CrossRef] [Green Version]
  24. Orphanides, A.; Goulas, V.; Gekas, V. Effect of Drying Method on the Phenolic Content and Antioxidant Capacity of Spearmint. Czech. J. Food Sci. 2013, 31, 509–513. [Google Scholar] [CrossRef] [Green Version]
  25. Li, W.; Li, Y.; Bi, J.; Ji, Q.; Zhao, X.; Zheng, Q.; Tan, S.; Gao, X. Effect of hot air drying on the polyphenol profile of Hongjv (Citrus reticulata Blanco, CV. Hongjv) peel: A multivariate analysis. J. Food Biochem. 2020, 44. [Google Scholar] [CrossRef]
  26. Teles, A.S.C.; Chávez, D.W.H.; Gomes, F.d.S.; Cabral, L.M.C.; Tonon, R.V. Effect of temperature on the degradation of bioactive compounds of Pinot Noir grape pomace during drying. Braz. J. Food Technol. 2018, 21. [Google Scholar] [CrossRef] [Green Version]
  27. Kroehnke, J.; Szadzińska, J.; Stasiak, M.; Radziejewska-Kubzdela, E.; Biegańska-Marecik, R.; Musielak, G. Ultrasound- and microwave-assisted convective drying of carrots—Process kinetics and product’s quality analysis. Ultrason. Sonochem. 2018, 48, 249–258. [Google Scholar] [CrossRef]
  28. Witrowa-Rajchert, D.; Rza, M. Effect of Drying Method on the Microstructure and Physical Properties of Dried Apples. Drying Technol. 2009, 27, 903–909. [Google Scholar] [CrossRef]
  29. Yao, L.; Fan, L.; Duan, Z. Effect of different pretreatments followed by hot-air and far-infrared drying on the bioactive compounds, physicochemical property and microstructure of mango slices. Food Chem. 2020, 305, 125477. [Google Scholar] [CrossRef]
  30. Zotarelli, M.F.; Porciuncula, B.D.A.; Laurindo, J.B. A convective multi-flash drying process for producing dehydrated crispy fruits. J. Food Eng. 2012, 108, 523–531. [Google Scholar] [CrossRef] [Green Version]
  31. Puig, A.; Perez-Munuera, I.; Carcel, J.A.; Hernando, I.; Garcia-Perez, J.V. Moisture loss kinetics and microstructural changes in eggplant (Solanum melongena L.) during conventional and ultrasonically assisted convective drying. Food Bioprod. Process. 2012, 90, 624–632. [Google Scholar] [CrossRef]
  32. Chen, D.; Xing, B.; Yi, H.; Li, Y.; Zheng, B.; Wang, Y.; Shao, Q. Effects of different drying methods on appearance, microstructure, bioactive compounds and aroma compounds of saffron (Crocus sativus L.). LWT 2020, 120, 108913. [Google Scholar] [CrossRef]
  33. Xu, Y.; Xiao, Y.; Lagnika, C.; Li, D.; Liu, C.; Jiang, N.; Song, J.; Zhang, M. A comparative evaluation of nutritional properties, antioxidant capacity and physical characteristics of cabbage (Brassica oleracea var. Capitate var L.) subjected to different drying methods. Food Chem. 2020, 309, 124935. [Google Scholar] [CrossRef] [PubMed]
  34. Bhandari, B.R.; Adhikari, B. Drying Technologies in Food Processing; Blackwell Publishing Ltd.: Hoboken, NJ, USA, 2008; pp. 55–89. [Google Scholar]
  35. Guiné, R.P.F.; Barroca, M.J. Effect of drying treatments on texture and color of vegetables (pumpkin and green pepper). Food Bioprod. Process. 2012, 90, 58–63. [Google Scholar] [CrossRef]
  36. Miranda, M.; Vega-Gálvez, A.; García, P.; Di Scala, K.; Shi, J.; Xue, S.; Uribe, E. Effect of temperature on structural properties of Aloe vera (Aloe barbadensis Miller) gel and Weibull distribution for modelling drying process. Food Bioprod. Process. 2010, 88, 138–144. [Google Scholar] [CrossRef]
  37. Vega-Gálvez, A.; Zura-Bravo, L.; Lemus-Mondaca, R.; Martinez-Monzó, J.; Quispe-Fuentes, I.; Puente, L.; Di Scala, K. Influence of drying temperature on dietary fibre, rehydration properties, texture and microstructure of Cape gooseberry (Physalis peruviana L.). J. Food Sci. Technol. 2015, 52, 2304–2311. [Google Scholar] [CrossRef] [Green Version]
  38. Wang, H.; Zhao, Q.S.; Zhao, B. Comparison of drying methods on drying efficiency and physicochemical quality of okra (Abelmoschus esculentus) cultivated in China. J. Food Process. Eng. 2019, 42, 10. [Google Scholar] [CrossRef]
  39. Ricce, C.; Rojas, M.L.; Miano, A.C.; Siche, R.; Augusto, P.E.D. Ultrasound pre-treatment enhances the carrot drying and rehydration. Food Res. Int. 2016, 89, 701–708. [Google Scholar] [CrossRef]
Figure 1. Drying kinetics of cherry laurel (HAD: hot air drying, USV: ultrasound-assisted vacuum drying).
Processes 08 00761 g001
Figure 2. SEM images of the cherry laurel samples dried at different temperatures (50, 60, and 70 °C) and methods (HAD, hot air drying; USV, ultrasound-assisted vacuum drying; FD, freeze-drying).
Processes 08 00761 g002
Figure 3. The pictures of the dried and fresh samples of cherry laurel (HAD, hot air drying; USV, ultrasound-assisted vacuum drying; FD, freeze-drying).
Processes 08 00761 g003
Figure 4. Rehydration kinetic of cherry laurel fruit.
Processes 08 00761 g004
Table 1. Effect of total bioactive compounds of cherry laurel.
MethodTemperature (°C)TPC mg GAE/100 g Sample (DM)TFC mg Catechin/100 g Sample (DM)TA Cyanidin 3-Glucoside/100 g Sample (DM)DPPH mg Trolox Equivalent (TE)/100 g Samples (DM)
Fresh 839.66 ± 8.01 Aa1568.93 ± 21.96 Bb110.41 ± 5.94 Bb17.31 ± 0.70 Aa
HAD50311.88 ± 9.27 Dc209.03 ± 14.82 Ed39.93 ± 2.17 Ed5.71 ± 0.35 Dc
60487.56 ± 5.26 Cc335.23 ± 6.91 Dd54.22 ± 4.79 Dd7.41 ± 0.29 Cc
70580.81 ± 10.03 Bc768.43 ± 11.71 Cd76.22 ± 2.67 Cd8.52 ± 0.34 Bc
USV50465.64 ± 10.15 Db396.63 ± 5.91 Eb61.64 ± 2.37 Dc7.53 ± 0.68 Db
60614.05 ± 4.20 Cb556.94 ± 16.30 Db82.13 ± 5.56 Cc9.24 ± 0.17 Cb
70674.4 ± 13.85 Bb811.52 ± 10.97 Cb102.49 ± 1.76 Bc11.79 ± 0.56 Bb
FD 851.47 ± 6.73 Aa1853.13 ± 11.92 Aa135.52 ± 4.83 Aa17.13 ± 0.27 Aa
HAD, hot air drying; USV, ultrasound-assisted vacuum drying; FD, freeze-drying; TPC: Total phenolic content, TFC: Total flavonoid content, TA: Total anthocyanin content. Different lowercase letter in the same column indicates differences between samples subjected to different drying methods at the same temperature, FD, and fresh sample (p < 0.05). Different uppercase letter in the same column indicates differences between samples subjected to different drying temperature for the same methods, FD and fresh sample (p < 0.05).
Table 2. Effect of the phenolic profile of cherry laurel.
SamplesPhenolic Compounds mg/100 g Sample(DM)
Gallic AcidProtocatechuic AcidCatechinp-Hydroxybenzoic AcidSyringic AcidCaffeic AcidVanillic AcidChlorogenic AcidFerulic AcidCinnamic AcidEpicatechinRutinQuercetin
Fresh0.327 ± 0.0090.349 ± 0.0055.502 ± 0.0087 bB0.515 ± 0.02110.222 ± 0.105 bB0.221 ± 0.00714.857 ± 0.120 bB70.31 ± 1.000 bB0.065 ± 0.0070.059 ± 0.00163.679 ± 0.240 bB1.581 ± 0.0260.304 ± 0.011
HAD
50 °C0.223 ± 0.0010.058 ± 0.0000.537 ± 0.021 dE0.147 ± 0.0115.244 ± 0.085 dE0.188 ± 0.0131.010 ± 0.050 dE9.136 ± 0.050 dE0.036 ± 0.0010.070 ± 0.0509.150 ± 0.50 dE2.141 ± 0.0301.915 ± 0.055
60 °C0.025 ± 0.0050.092 ± 0.0021.275 ± 0.017 dD0.176 ± 0.0077.082 ± 0.150 dD0.355 ± 0.0192.130 ± 0.100 dD12.181 ± 0.063 dD0.007 ± 0.0000.215 ± 0.00511.671 ± 0.110 dD0.444 ± 0.1581.224 ± 0.006
70 °C0.013 ± 0.0010.055 ± 0.0001.537 ± 0.020 dC0.377 ± 0.0088.888 ± 0.130 dC0.588 ± 0.0204.400 ± 0.140 dC15.075 ± 0.026 dC0.017 ± 0.0010.048 ± 0.00147.693 ± 0.815 dC0.248 ± 0.0021.389 ± 0.102
USV
50 °C0.038 ± 0.0000.122 ± 0.0031.904 ± 0.016 cE0.105 ± 0.0075.523 ± 0.200 cE0.110 ± 0.0035.000 ± 0.176 cE7.518 ± 0.183 cE0.041 ± 0.0030.037 ± 0.0013.171 ± 0.060 cE0.229 ± 0.0100.994 ± 0.090
60 °C0.029 ± 0.0000.159 ± 0.0102.703 ± 0.181 cD0.138 ± 0.0027.169 ± 0.100 cD0.276 ± 0.0907.640 ± 0.226 cD11.563 ± 0.552 cD0.022 ± 0.0300.050 ± 0.00115.714 ± 0.252 cD1.162 ± 0.05720.304 ± 0.007
70 °C0.075 ± 0.0060.158 ± 0.0222.988 ± 0.016 cC0.229 ± 0.0079.186 ± 0.065 cC0.566 ± 0.0059.400 ± 0.141 cC60.095 ± 0.650 cC0.110 ± 0.1200.126 ± 0.00854.738 ± 0.610 cC0.834 ± 0.0120.391 ± 0.015
FD0.323 ± 0.0020.483 ± 0.0106.664 ± 0.100 aA0.124 ± 0.00415.478± 0.200 aA0.285 ± 0.01016.617 ± 0.200 aA103.653 ± 1.291 aA0.141 ± 0.0950.667 ± 0.01186.177 ± 0.644 aA2.647 ± 0.5201.455 ± 0.075
HAD, hot air drying; USV, ultrasound-assisted vacuum drying; FD, freeze-drying. Different lowercase letter in the same column indicates differences between samples subjected to different drying methods at the same temperature, FD, and fresh sample (p < 0.05). Different uppercase letter in the same column indicates differences between samples subjected to different drying temperature for the same methods, FD and fresh sample (p < 0.05).
Table 3. Effect of color parameters of cherry laurel fruits.
MethodsTemperature (°C)L*a*b*ΔLΔaΔbΔE
Fresh 29.23 ± 0.08 Bb9.15 ± 1.75 Bb−4.15 ± 0.27 Dd
FD 35.45 ± 0.51 Aa16.91 ± 2.38 Aa2.25 ± 0.35 Aa6.22 ± 1.33 Aa7.76 ± 0.03 Aa1.19 ± 0.11 Bc10.12 ± 0.11 Bc
HAD5023.18 ± 0.16 De0.95 ± 0.50 Cd−2.5 ± 0.55 Cc6.05 ± 0.07 Aa8.21 ± 0.15 Aa6.65 ± 0.09 Aa12.34 ± 0.19 Aa
6027.53 ± 0.20 Cc2.57 ± 0.09 Cc−1.27 ± 0.02 Bb1.17 ± 0.05 Bc6.58 ± 0.05 b5.42 ± 0.05 Ab9.26 ± 0.26 Bc
7025.94 ± 0.33 Cd1.25 ± 0.33 Dd−2.37 ± 0.13 Bc3.29 ± 0.95 Bb7.91 ± 0.50 Aa6.74 ± 0.05 Aa11.13 ± 0.05 Ab
USV5027.92 ± 0.32 Cc1.16 ± 0.07 Cd−1.99 ± 0.03 Bb1.31 ± 0.05 Bc8.09 ± 0.03 Aa6.14 ± 0.37 Ab10.16 ± 0.03 Ba
6027.71 ± 0.15 Cc1.19 ± 0.16 Dd−2.27 ± 0.15 Cb1.53 ± 0.09 Bcb7.96 ± 0.01 Aab6.02 ± 0.15 Ab10.74 ± 0.01 Aa
7027.31 ± 0.90 Cc2.10 ± 0.08 Cc−3.00 ± 0.09 Cc1.93 ± 1.15 Cb7.05 ± 0.07 Ab7.15 ± 0.09 Aa10.89 ± 0.15 Aa
FD 35.45 ± 0.51 Aa16.91 ± 2.38 Aa2.25 ± 0.35 Aa6.22 ± 1.33 Aa7.76 ± 0.03 Aa1.19 ± 0.11 Bc10.12 ± 0.11 a
HAD, hot air drying; USV, ultrasound-assisted vacuum drying; FD, freeze-drying; Different uppercase letter in the same column indicates differences between samples subjected to different drying methods at the same temperature, FD and fresh sample (p < 0.05). Different lowercase letter in the same column indicates differences between samples subjected to different drying temperature for the same methods FD and fresh sample (p < 0.05).
Table 4. Rehydration kinetic parameters for the Peleg model.
Methods MK1K2R2
HAD50 °C102.04 ± 0.0112.38 ± 0.90 cA0.91 ± 0.05 cA0.9946
60 °C102.30 ± 0.4514.92 ± 0.05 bA1.26 ± 0.01 bA0.9979
70 °C102.13 ± 0.0416.06 ± 0.07 aA1.51 ± 0.01 aA0.9945
USV50 °C102.68 ± 0.1110.09 ± 0.01 cB0.38 ± 0.02 cB0.9989
60 °C104.22 ± 0.2511.04 ± 0.03 bB0.41 ± 0.02 bB0.9984
70 °C103.72 ± 0.2515.38 ± 0.01 aB0.49 ± 0.01 aB0.9968
FD 102.161 ± 0.098.04 ± 0.05 dC0.10 ± 0.01 dC0.9955
HAD, hot air drying; USV, ultrasound-assisted vacuum drying; FD, freeze-drying; Different lowercase letter in the same column indicates differences between samples subjected to different drying methods at same temperature and FD treated sample (p < 0.05). Different uppercase letter in the same column indicates differences between samples subjected to different drying temperature for the same methods and FD (p < 0.05).

