Article

Experimental and Comparative RANS/URANS Investigations on the Effect of Radius of Volute Tongue on the Aerodynamics and Aeroacoustics of a Sirocco Fan

1
National-Provincial Joint Engineering Laboratory for Fluid Transmission System Technology, Zhejiang Sci-Tech University, Hangzhou 310018, Zhejiang, China
2
Zhejiang Yilida Ventilator Co., Ltd., Taizhou 318056, Zhejiang, China
3
Beijing Aerospace Control Center, Beijing 100076, China
*
Author to whom correspondence should be addressed.
Processes 2020, 8(11), 1442; https://doi.org/10.3390/pr8111442
Submission received: 19 October 2020 / Revised: 7 November 2020 / Accepted: 9 November 2020 / Published: 11 November 2020

Abstract

:
The geometry of volute tongue is crucial in the design of Sirocco fans. The size of the volute tongue determines its relative position and distance from the impeller which affects the local flow characteristics and thus the aerodynamic and aeroacoustic performances of the fan. In this work, we performed experimental and numerical investigations on the effect of volute tongue radius on the aerodynamic and aeroacoustic characteristics of a Sirocco fan. The internal flow characteristics are analyzed and discussed in terms of the spatial distribution and temporal variation of pressure and streamlines, the pulsating behaviors of pressure both in the impeller and on the volute surface with emphasis in the volute tongue region, the variation of passage flow with the rotation of impeller and the aeroacoustic features of the fan. We conducted numerical simulations using both steady Reynolds-Averaged Navier-Stokes (RANS) and unsteady Reynolds-Averaged Navier-Stokes (URANS) approaches with realizable k-ε turbulence model with rotation effect correction and the results are compared against the experimental data to assess the prediction capability and accuracy in qualitative and quantitative manners. Experimental and numerical results show that as the volute tongue radius increases, the static pressure rises as well as the far-field noise of the fan and pronounced fluctuation of flow is observed within the whole impeller and volute; the reversed flow in the passage of the impeller is reduced and the high-pressure region is found to be moving towards the outlet of the volute. The decreasing radius also enlarges the size of the adverse pressure gradient (APG) region on the volute tongue which contributes to the formation of recirculating flow. The comparative RANS and URANS simulations reveal that both approaches produce generally consistent results regarding the time-averaged flow although the URANS data are much closer to those of the experimental ones. However, the fluctuating flow which is not capable to be modeled by RANS still dominates for the present configuration and thus URANS is necessary for the accurate prediction of the flow details.

1. Introduction

Sirocco fans, also named as multi-blade centrifugal fans, are widely used in industrial and civil applications due to its small size, large flow coefficient and high pressure coefficient, while the disadvantages of low static pressure and low efficiency have always restricted the development of the Sirocco fans. The analysis and research of the internal flow of the Sirocco fans by means of reasonable and applicable approaches play a meaningful guiding role in further improving and optimizing the performance of the fans.
The volute is one of the main components of the Sirocco fans which plays an important role in guiding the flow outside of the impeller and converting kinetic energy into pressure energy and has received wide extensive attention from many researchers. Rafael et al. applied a numerical model to compute the pressure fluctuation on the volute wall of the fan and obtained an important peak of pressure fluctuation near the volute tongue [1]. By controlling the volute tongue which determines the recirculation flow, Dilin et al. obtained the velocity and pressure distribution under a wide range of azimuth angles [2]. Because the design of the recirculation channel and the volute tongue have a greater impact on the performance and flow stability of the centrifugal fans, Okauchi et al. used four alternative volute designs and accurately measured the flow near the volute outlet and volute tongue and studied the effect of the volute structure on the performance of the fan. The results show that the optimized volute improves the performance of the fan but the flow is unstable when the flow rate increases [3]. Whitfield and Johnson took the compressor as the research object and studied the influence of the volute design on its performance. It was found that while improving the performance of the whole machine, the design method of reducing the flow area under the condition of large flow rate does not have a better effect [4]. Xiao et al. used the energy gradient theory to study the flow instability of the centrifugal fan and finally showed that the impeller outlet and the volute tongue area are prone to produce flow instability and the flow near the hub was more stable than that near the shroud [5]. Pan et al. extended the initial conceptual design of the centrifugal fan and compressor volute and the detailed internal flow data under design and off-design conditions obtained by numerical simulations showed that without changing the ratio of the volute outlet area, the flow area of the volute adjacent to the volute region is increased and the flow distribution is improved [6]. Lun et al. studied the effect of inclined volute on the internal flow and performance of centrifugal fans and found an optimal incline angle to obtain better performance improvement [7]. Sandra et al. conducted an experimental study on the two radial outlet positions of a certain forward curved blade centrifugal fan by hot wire techniques and found a strong flow asymmetry, especially in the circumferential position near the volute tongue and other ones and there is a big difference between the locations [8]. Sina and Javad studied the effect of the volute spread angle on the efficiency and internal flow pattern of Sirocco fans by experimental and numerical methods. The results showed that in a finite space, a fan with a spread angle of 5° has the highest head and efficiency [9]. Zhou and Li studied the characteristics of the centrifugal fan volute based on the method of dynamic torque correction to design a better volute profile. It was found that the radial velocity component at the outlet of the volute increases sharply while the noise is reduced without affecting the performance of the fan [10]. Sunil et al. focused on the effect of volute tongue gap on the performance of backward curved blade centrifugal blowers. The comparison of the four sets of data showed that the volute tongue gap has a significant impact on its performance and the total pressure and efficiency of the blower increased with the decrease of the clearance [11].
The impeller is the main component of the Sirocco fans and its geometry, size, number of blades and so forth have a crucial influence on the performance of the fan. Taking a widely used centrifugal fan as the research object, Zhang et al. analyzed the influence of the optimized combination of impeller geometrical parameters, such as the number of blades and the impeller outlet width, on the performance and noise of the fan. Under the design conditions, the combination of parameters after optimization makes the total pressure significantly increasing by 6.91% [12]. Lee et al. proposed a method of redesigning the centrifugal impeller and its intake passage. The resulting effect not only satisfies the pressure requirements but also reduces the power of the fan by 8.8% compared with the baseline model [13]. Wang et al. proposed an inverse design method for calculating the meridional surface of the centrifugal impeller. The final computation results show that the performance of the fan inlet is improved and the velocity distribution is more uniform [14]. Kim et al. conducted a parameter optimization study on the impeller geometry of the forward curved blade centrifugal fan. The height of the annular plate separating the impeller and the angle between the upper and lower impellers were chosen as geometric parameters. The influence of these parameters on the efficiency of the fan was analyzed. The results show that reasonable parameters are conducive to improving the aerodynamic performance of the fan [15]. Ni et al. changed the straight blades of the baseline Sirocco fan impeller into inclined blades with a certain angle, obtained an optimal value of the inclination angle and improved the aerodynamic performance of the fan [16]. Kim and Seo successfully applied the response surface optimization method of three-dimensional N-S analysis to the aerodynamic design of forward curved blade centrifugal fans and obtained the maximum static pressure efficiency [17].
The influential factors, such as the interaction or positional relationship between the impeller and the volute or other components, have a significant effect on the internal flow of the fans. Tarek and Seung conducted a numerical simulation analysis of the interactions among the impeller, diffuser and volute. It was found that the vortex flow area in the volute is gradually attenuated from the part near the volute tongue to the fan outlet [18]. Koen and Rene proposed a numerical method for predicting the interaction between impeller and volute in a single-stage centrifugal compressor and analyzed the influence of the interaction between impeller and volute on the circumferential distortion of static pressure [19]. Karanth and Sharma considered the complex flow between the impeller outlet and the diffuser, studied and predicted the flow characteristics caused by the radial clearance by numerical simulation analysis and the results showed that there is an optimal radial clearance which made better energy conversion of the impeller [20]. Lee conducted a study and analysis of the gap effect between the inlet duct and the rotating impeller of the centrifugal fan. The results showed that improper gap determination would reduce the overall performance of the fan by 2–5% [21]. Jose et al. studied the interaction between the impeller and the volute and numerically analyzed the secondary flow in the volute through the helicity magnitude. The results showed that there is a strong secondary flow in the radial position near the outlet of the impeller [22]. Daniel et al. considered the influence of the relative position of the impeller and the volute on the performance of the centrifugal pump. Through the research, it was found that the efficiency of circular volute and spiral volute increases by 5% and 3.5%, respectively, as the impeller is in the optimal position compared with the central position [23]. Younsi et al. studied the interaction and unsteady characteristics of the rotating blades relative to the movement of the volute. Analysis of the pressure fluctuations on the volute surface showed that the main source of flow disturbance and instability in the centrifugal fan is the volute region [24].
Bechara et al. devised a stochastic noise generation and radiation (SNGR) model for noise generation and radiation from the turbulent flow field [25]. Billson et al. used a SNGR method to capture the sound field of a high Reynolds number, high Mach number subsonic jet. The directivity of the far-field sound is well predicted but the amplitude and spectral information differ from the measurements [26]. Ewert studied the application of a low-cost computational aeroacoustics (CAA) approach to a slat noise problem. Slat noise simulations are carried out for a high-lift airfoil and the Mach number scaling law of the broadband slat noise component is evaluated based on three different free-stream velocities (M = 0.088, 0.118, 0.165) [27]. In the following work, the simulated 1/3-octave spectrum exhibits the main features of an empirical slat-noise mode [28]. Bailly et al. introduced an application of direct calculation of aerodynamic noise in subsonic and supersonic jet noise, cavity noise and self-excited internal flows [29]. Sandberg conducted direct numerical simulations (DNS) to airfoil self-noise. It is found that the contribution of trailing edge noise dominates at low frequencies while for the high frequencies the radiated noise is mainly due to flow events in the reattachment region on the suction side [30]. Dawi and Akkermans studied spurious noise generated in direct noise computation using finite volume methods. Different sources of spurious noise are examined as well as the mechanism of their generation [31]. In another work, they used direct noise computation and Fflowcs Williams-Hawkings equation to calculate far-field spectral. The peaks of vortex shedding frequency were well predicted, however, the amplitude of the spectra at these frequencies is smaller than the ones in the wind tunnel [32]. Deuse and Sandberg studied the self-noise of an isolated controlled-diffusion aerofoil using direct noise computation. Two main noise sources were observed, one at the trailing edge and one in the transition/reattachment region. For the cases investigated, the latter is even more important than the trailing edge noise component [33]. Dawi and Akkermans demonstrated the applicability of a finite volume method for the direct noise computation of road vehicles, the results of the DNC showed good agreement with wind tunnel measurements within a certain frequency range. However, at higher frequencies, simulated acceleration spectra showed lower spectral levels than the measured ones [34]. Dierke et al. investigated the effect of installation on propeller sound. It is found that the installation effect due to the presence of the high-lift wing increases the sound pressure levels by 5–10 dB in most directions [35]. The research by Dobrzynski et al. on airframe noise prediction and reduction methods pointed out that the noise level of gears installed under the wings is reduced by about 4 decibels relative to gears installed on the fuselage. The aerodynamic optimum design of current slotted slats causes maximum gap-flow velocities and thus high slat noise levels [36]. Ewert et al. analyzed the changes of acoustic level due to a change of slat position and found that by changing the slat gap, the acoustic level of some frequency segments also changed correspondingly [37].
It can be concluded from the above literature review that the geometry of the volute, especially the volute tongue radius, the distance to the impeller outlet and the axial change of the volute surface determine the flow in the vicinity of the impeller outlet and volute tongue and affect the interaction between the fluid within the impeller and the volute, with a vital influence on the performance of the Sirocco fan. Considering that the radius of the volute tongue determines the distance between the local volute wall and the impeller, in this work we performed experimental and numerical investigation on the internal flow of a Sirocco fan with various volute tongue radii to identify its effect on the aerodynamic and aeroacoustic characteristics of the fan. Only the radius of the volute tongue is varied but the distance to the outlet of the impeller keeps unchanged and the internal flow is analyzed in terms of the spatial distribution and temporal variation of pressure and streamlines, the pulsating behaviors of pressure both in the impeller and on the volute surface with emphasis in the volute tongue region, the variation of passage flow with the rotation of impeller and the aeroacoustic features of the fan. Another objective of the present work is to explore the capability, reliability and accuracy of RANS and URANS approaches in modeling flow in similar fan configurations both in qualitative and quantitative manners and provide meaning conclusions in further simulations.
The paper is organized as follows—Section 2 is a general description of the fan configuration, the employed numerical methods, the experiment details and the validation. Section 3 presents and discusses the numerical and experimental results for the effect of radius of volute tongue. Some conclusions are drawn in Section 4.

2. Numerical Methods

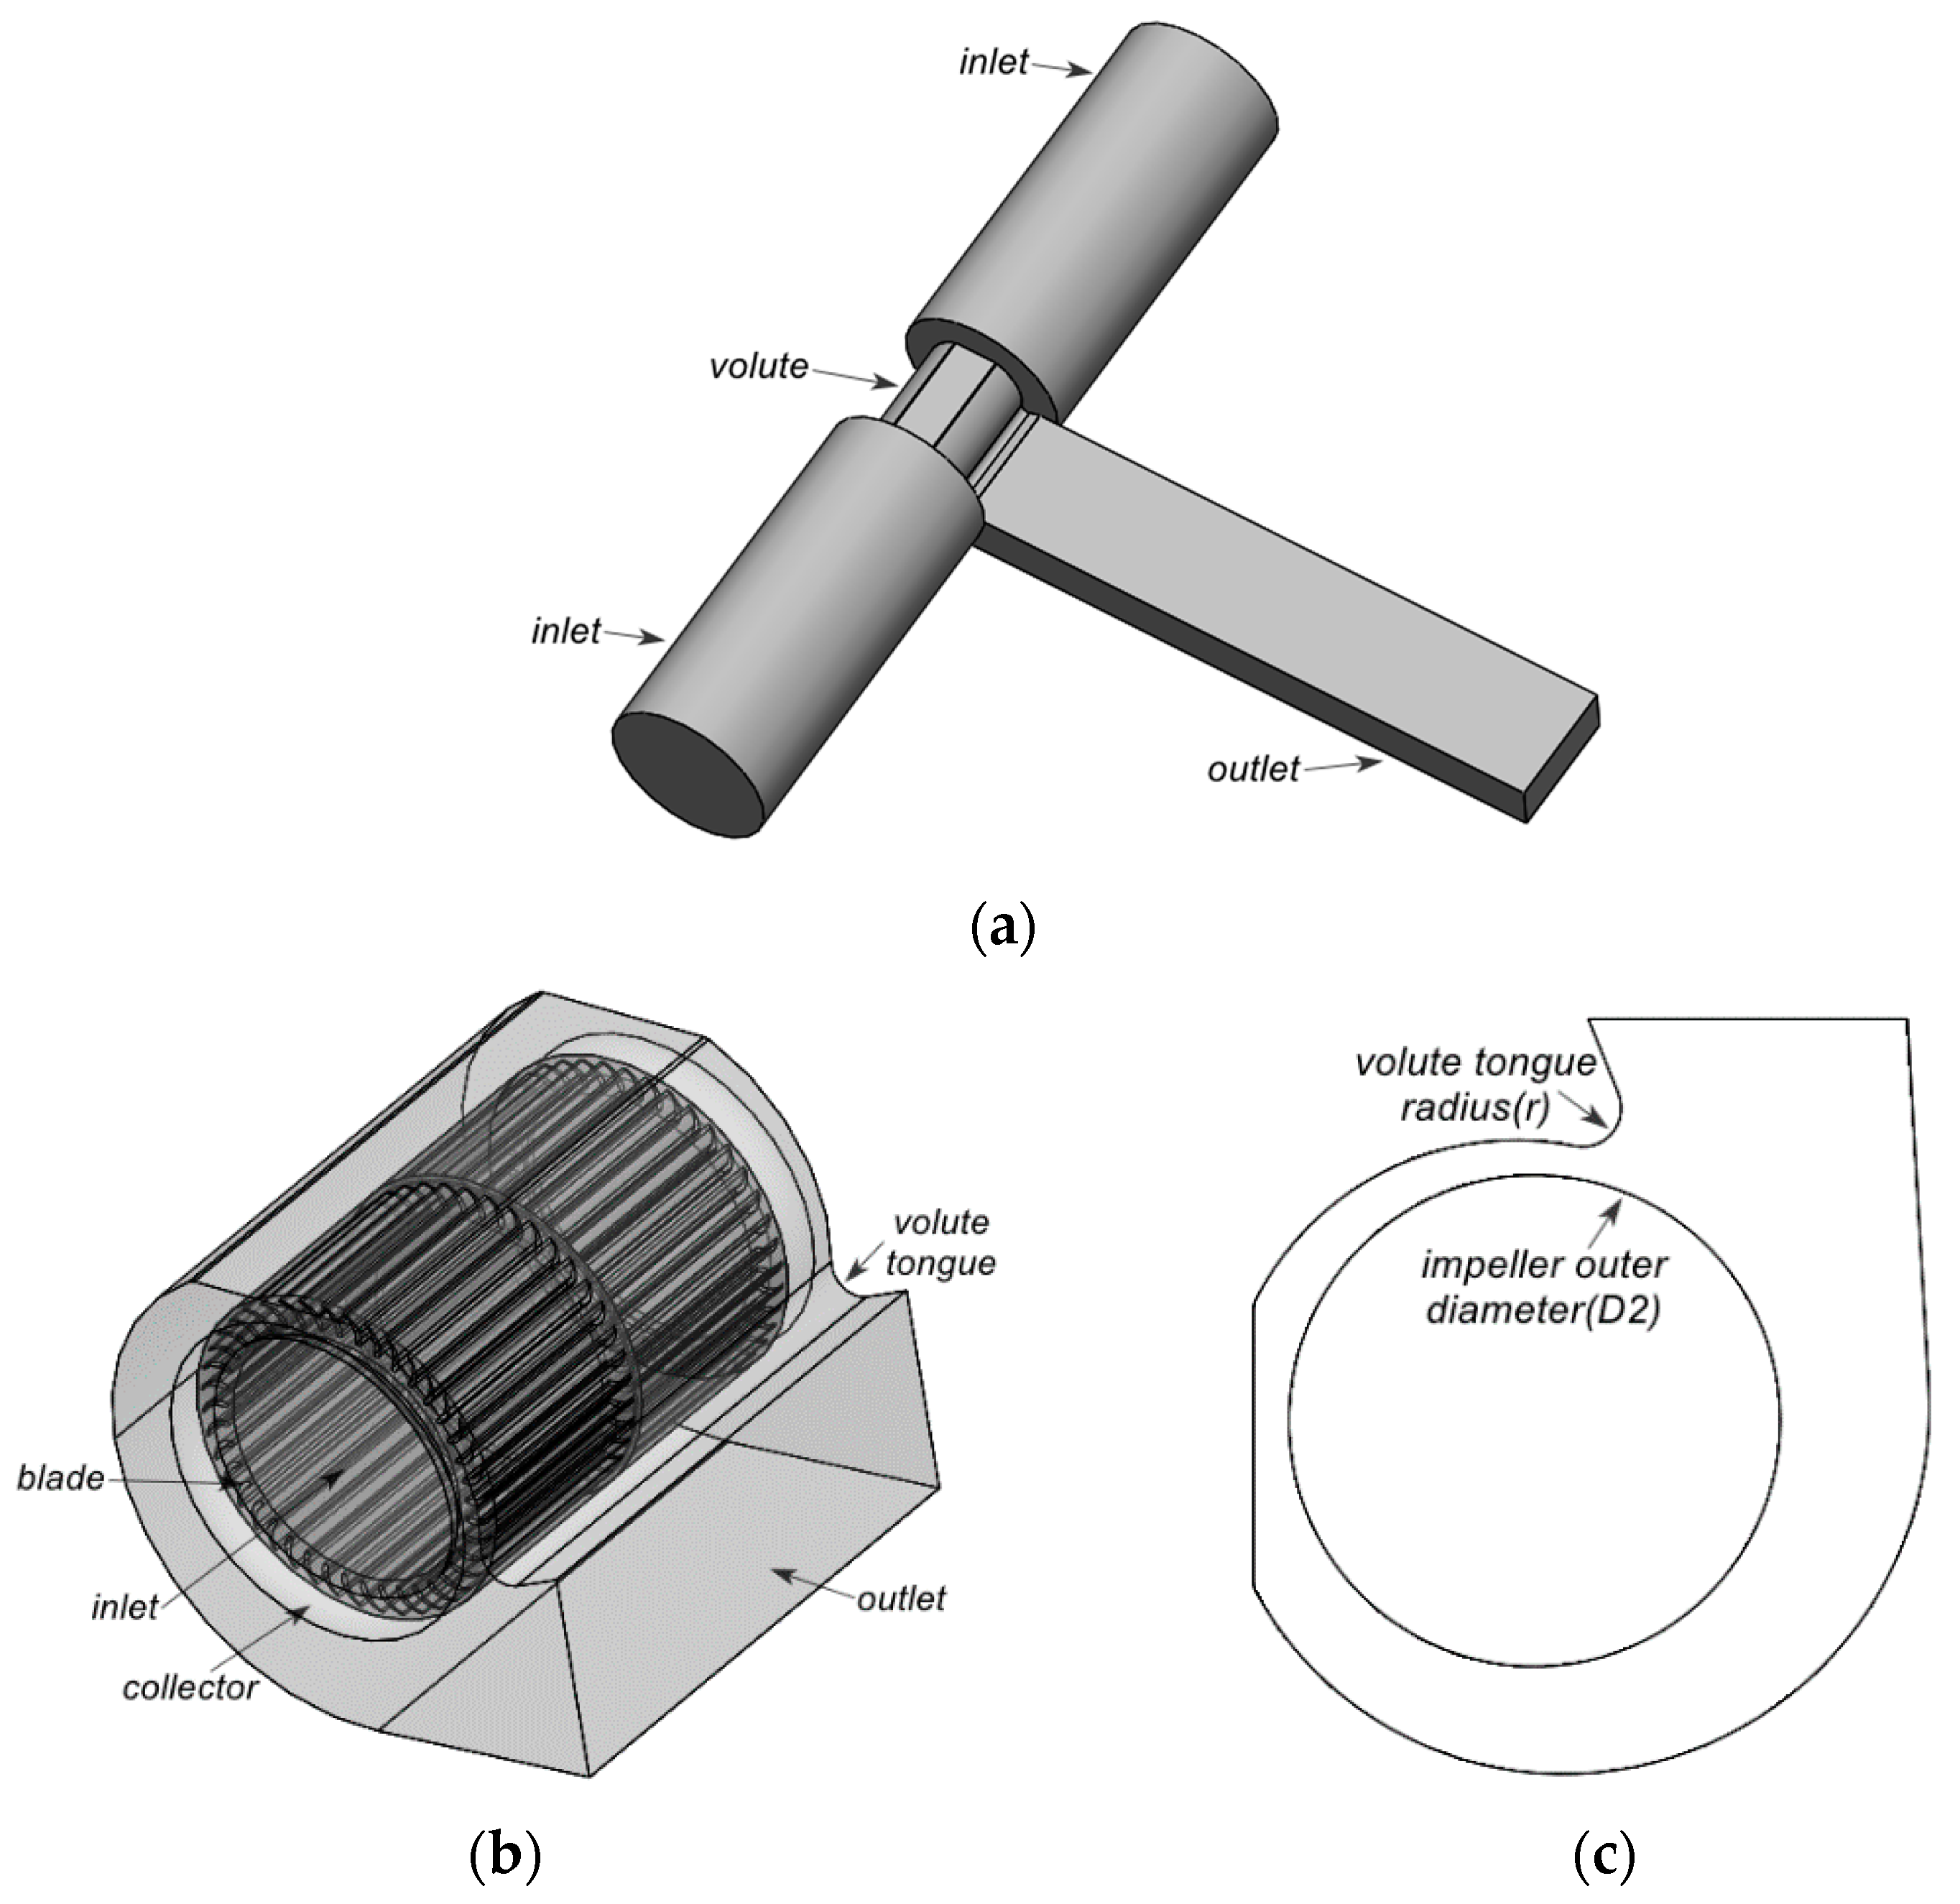
2.1. Fan Configuration

The fan in this investigation is a double-suction, forward-curved multi-blades Sirocco fan which is shown in Figure 1. The blades are staggered on both sides of the impeller’s central disk with 41 blades on each side. The air enters the volute and impeller from the inlet domain on both sides of the fan and moves out from the outlet domain. Table 1 lists the specifications of the baseline model. The radius of volute tongue of the baseline model is 11 mm and the location is denoted in the figure. In this work, we investigate the effect of volute tongue radius at four values, that is, r = 4 mm, 9 mm, 11 mm and 13 mm, on the aerodynamic and aeroacoustic characteristics of the fan at the designed flow rate 365 m3/h.

2.2. Numerical Simulation Method

The internal flow of the Sirocco fan is governed by the conservation of mass and momentum equations:
u i x i = 0
u i t + u j ( u i ) x j = f i 1 ρ P * x i + ν 2 u i x j x j ,
where ρ represents the density of the air; x i is the direction component of the Cartesian coordinate system;   u i is the velocity component; P * is the pressure considering the conversion of turbulent kinetic energy and centrifugal force; f i is the component of the volume force. ν is the kinematic viscosity coefficient:
ν = 1 ρ ( μ + μ t ) = μ ρ + C μ k 2 ε ,
where μ is the molecular viscosity coefficient and μ t is the vortex viscosity coefficient. In the numerical simulation, we use the realizable k-ε turbulence model with rotation effect correction in which C μ is calculated by the following formula:
C μ = 1 A 0 + A S k U * ε ,
in which A 0 = 4.04 , A S = 6 cos ϕ , ϕ = 1 3 cos 1 ( 6 W ) , W = S i j S j k S k i S ˜ , S ˜ = S i j S i j , S i j = 1 2 ( u j x i + u i x j ) , U * S i j S i j +   Ω ˜ i j   Ω ˜ i j ,   Ω ˜ i j = Ω i j 2 ε i j k ω k , Ω i j =   Ω ¯ i j ε i j k ω k .   Ω ¯ i j is the laminar curl with angular velocity.
The transport equations for the turbulent kinetic energy k and turbulent dissipation rate ε in realizable k-ε turbulence models are as follows:
t ( k ) + x i ( k u j ) = 1 ρ x i [ ( μ + μ t σ k ) k x j ] + G k + G b ρ ε Y M + S k
t ( ε ) + x j ( ε u j ) = 1 ρ x j [ ( μ + μ t σ k ) ε x j ] + C 1 S ε C 2 ε 2 k + v ε + C 1 ε ε k C 3 ε G b + S ε .
In the equation, G k and   G b represent the turbulent kinetic energy terms generated by laminar velocity gradient and buoyancy, respectively. Y M represents the contribution to the dissipation rate of the expansion of turbulent pulsation to the global flow in compressible flows. C 1 ε   and C 2 are constants. σ k   and σ ε   are the Prandtl numbers. S k and S ε are user-defined turbulent kinetic energy and turbulent dissipation source terms. For the incompressible air as the working medium, G b = 0 and   Y M = 0.
In this work, we performed both RANS and URANS simulations using ANSYS-Fluent 17.0 (Version, ANSYS, Inc., Canonsburg, PA, USA, 2016) for the same models and flow parameters. In the simulations, second-order upwind scheme is used for the spatial discretization of all derivative terms; the SIMPLE method is used for the coupling of velocity and pressure and the moving reference frame (MRF) method is used to treat the rotation of the impeller. The boundary conditions are the same for both simulation approaches. Constant mass flow rate is prescribed at the two inlet sections and zero gauge pressure at the outlet section. No-slip boundary condition is set for velocity on all solid walls. We first perform the RANS simulation until the converged result with relative residual less than 10−3 is obtained for the equations of mass, momentum, turbulent kinetic energy and turbulent dissipation rate. The result is then used as initial condition to start the URANS simulation and the simulation continues as the impeller rotates for ten revolutions before the data are collected. The physical time step size is fixed as the impeller rotates for one degree, thus 360 steps are required for one revolution of the impeller.

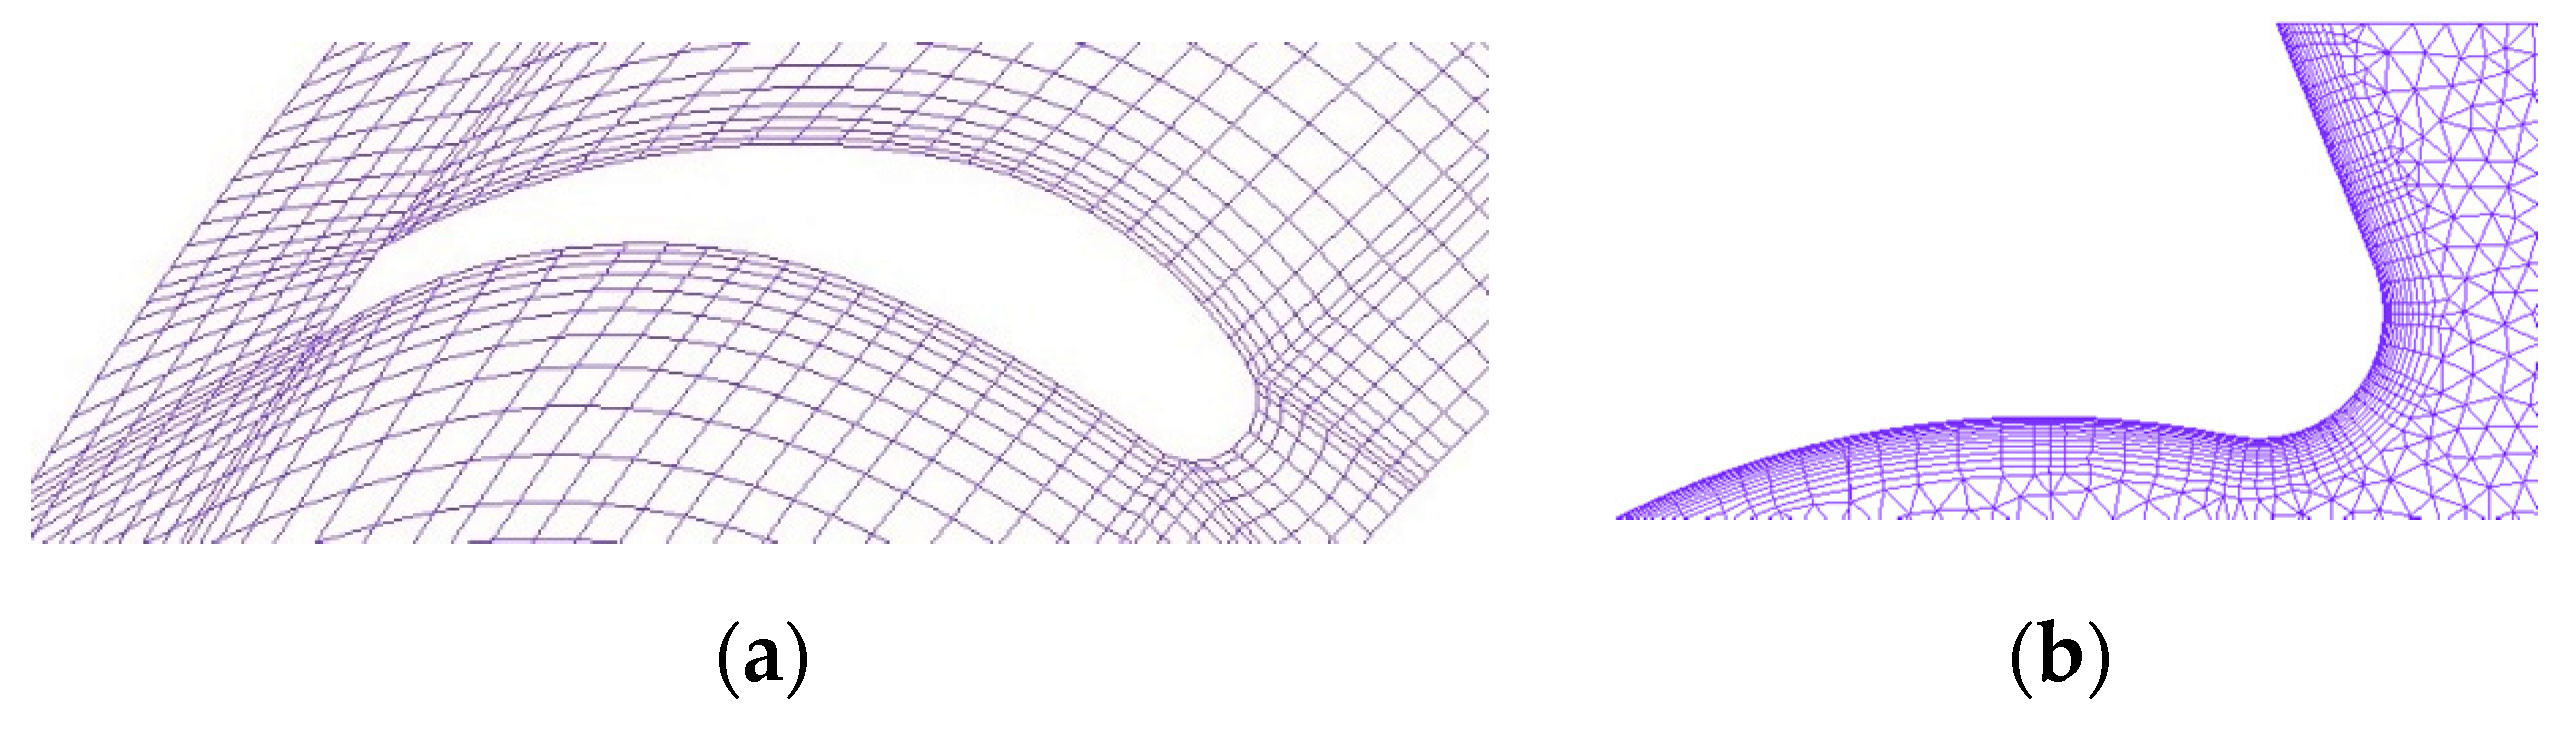
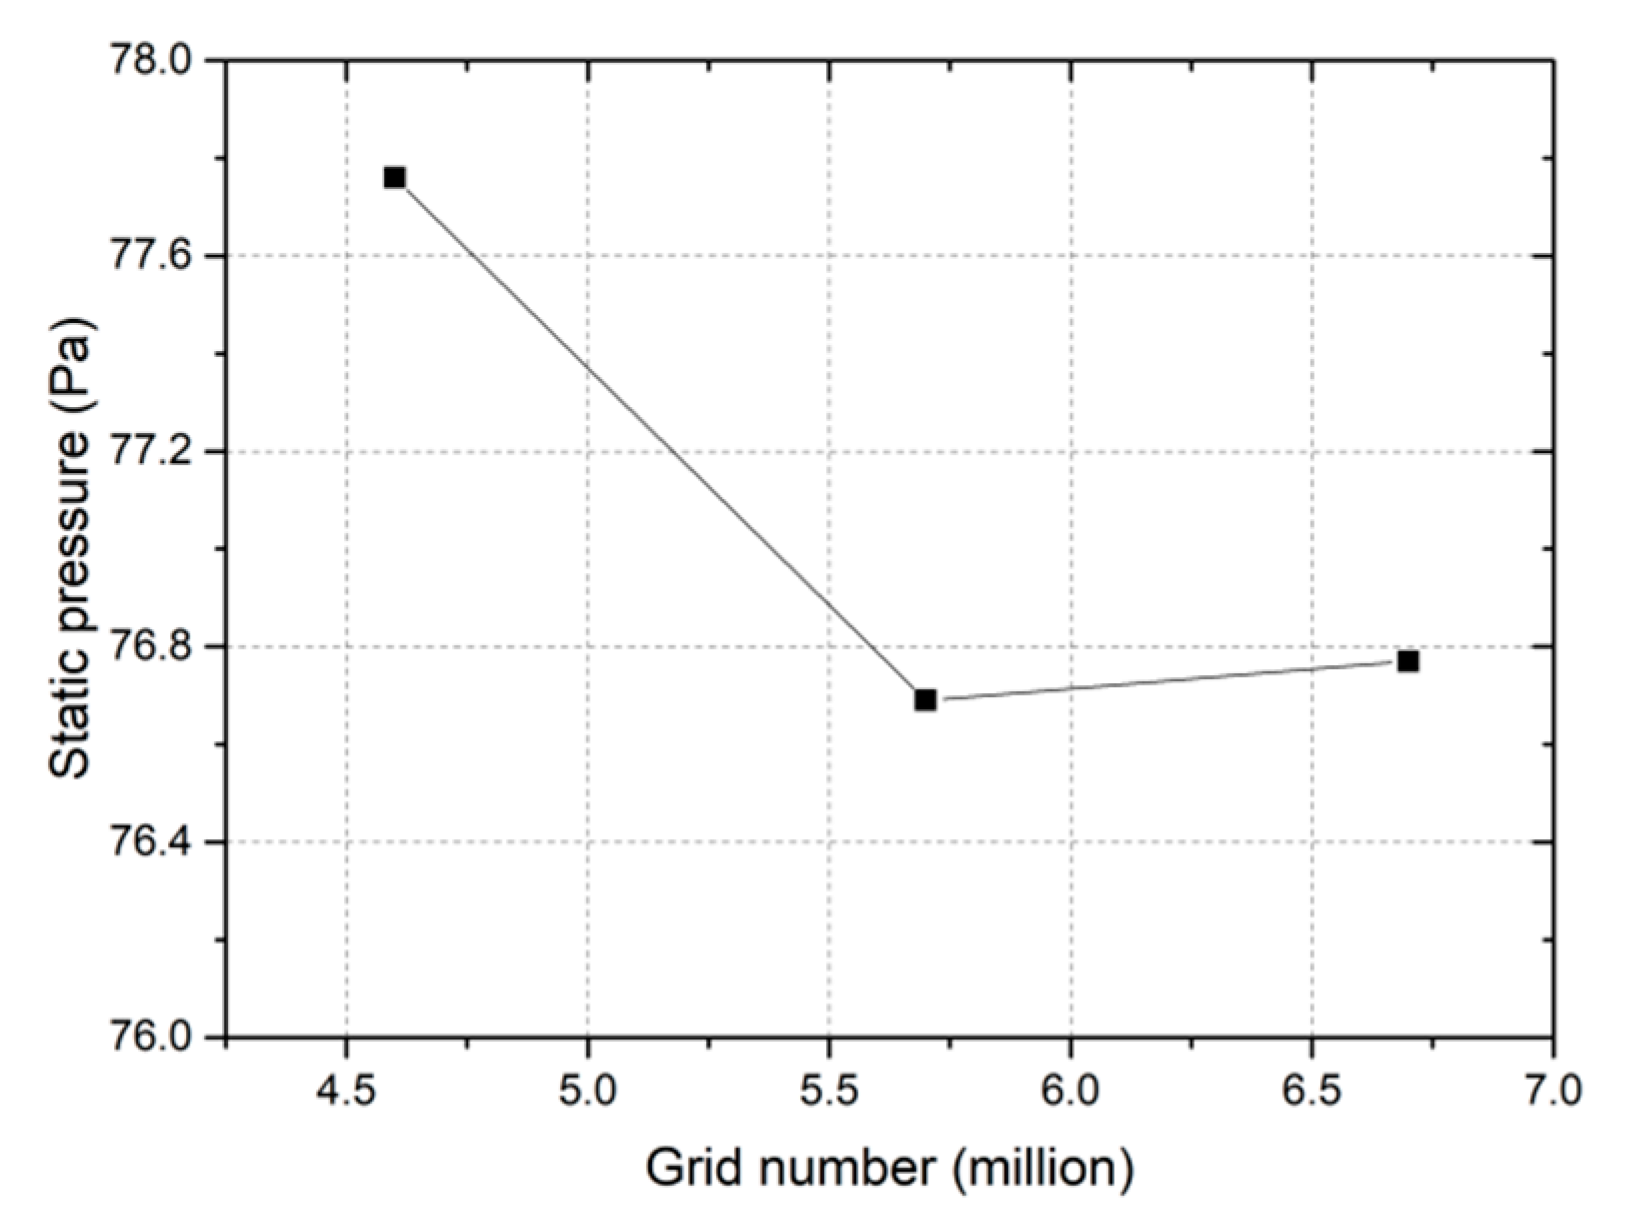
2.3. Grid Independence Study

The computational domains of the fan include two inflow domains on both sides, an outflow domain, a volute domain, an impeller domain and the intermediate flow channel domain of the impeller. The impeller and intermediate flow channel of the impeller constitute the rotational domain, while the other domains are set stationary. The impeller, inflow and outflow domains are discretized by block-structured grid, while the volute domain is discretized by unstructured grids considering its complex geometry and subsequent geometrical modifications. Figure 2 shows the grid distributions adjacent to the impeller and volute and the grids number is shown in Table 2.
In this paper, the static pressure rise, computed as the difference between the static pressure at the outflow and inflow sections of the fan, is used as the indicator for the grid independence study under design flow rate of 365 m3/h. The grid number is changed mainly for the impeller domain. Three sets of impeller grids with the number of about 4.6 million, 5.7 million and 6.7 million are used, respectively. The variation of static pressure rise with grid number is shown in Figure 3. As the number of grids increases from 4.6 million to 5.7 million, the variation of static pressure is 1.07 Pa; as the grid number continues to change to 6.7 million, the variation of static pressure rise is only 0.08 Pa, which is only 0.1% higher than the static pressure at 5.7 million. Therefore, we consider that the influence of a higher grid number on the computational results can be negligible, so the impeller domain with a grid number about 5.7 million is chosen for subsequent work.

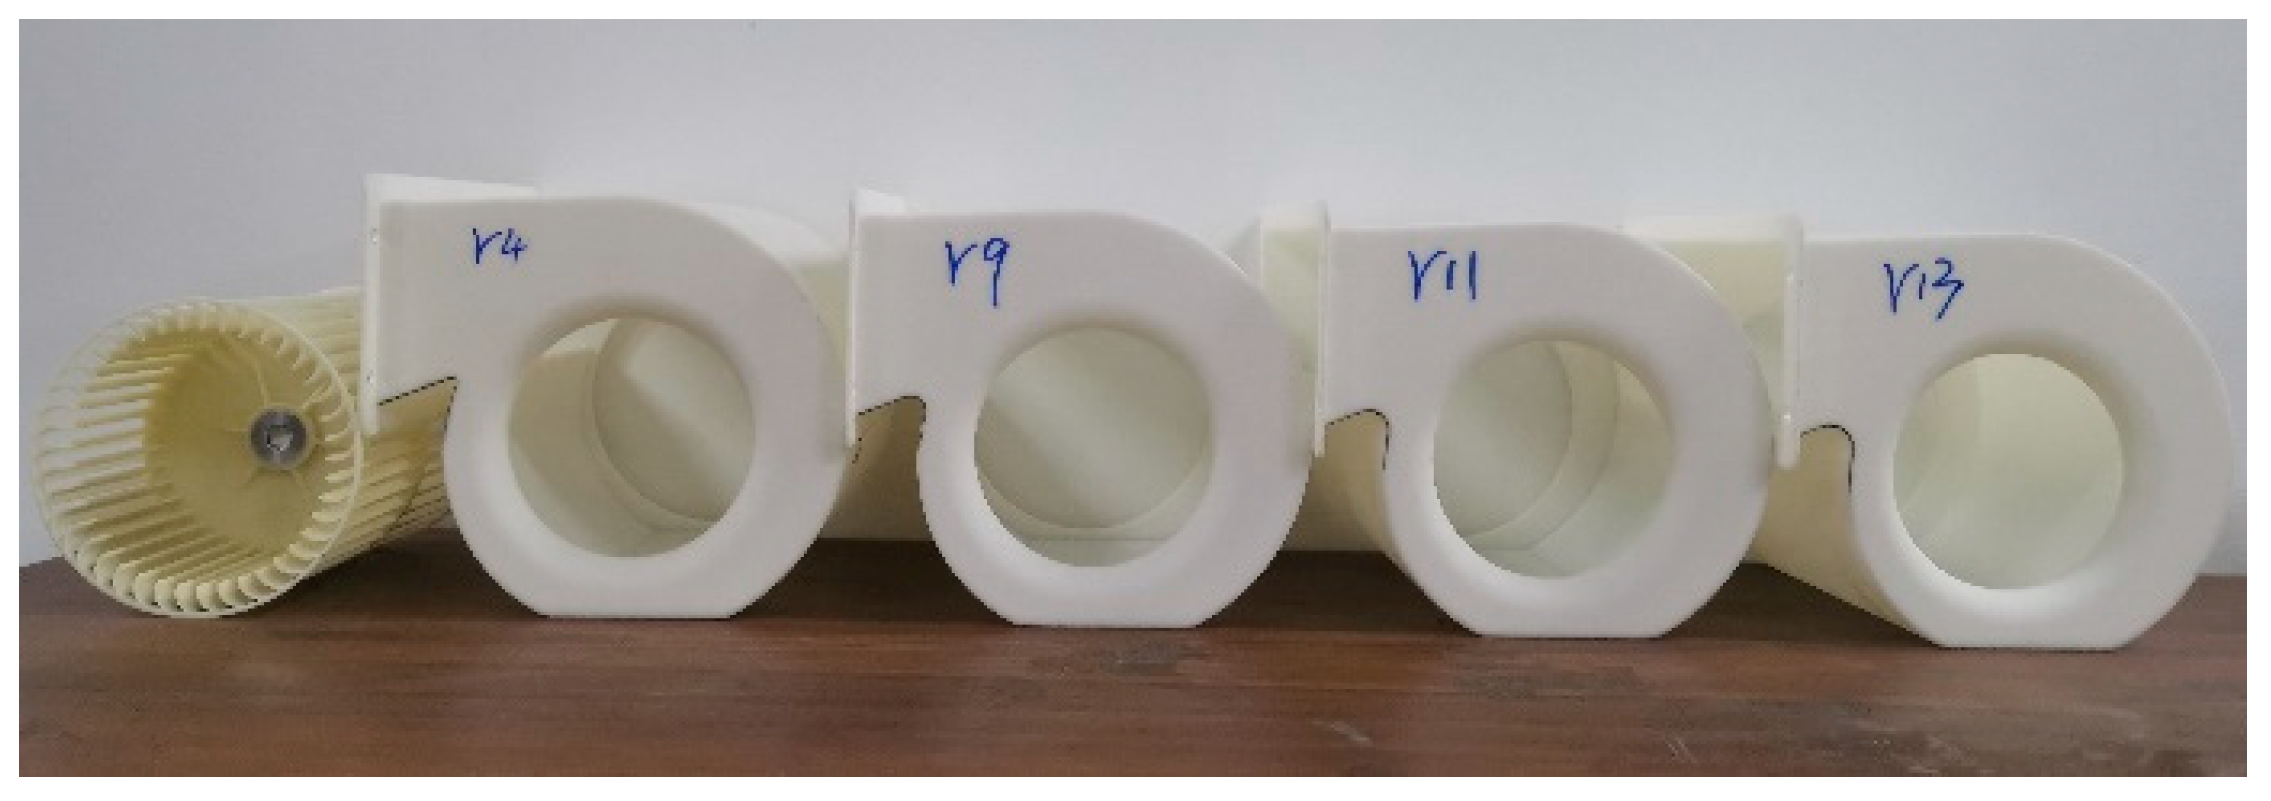
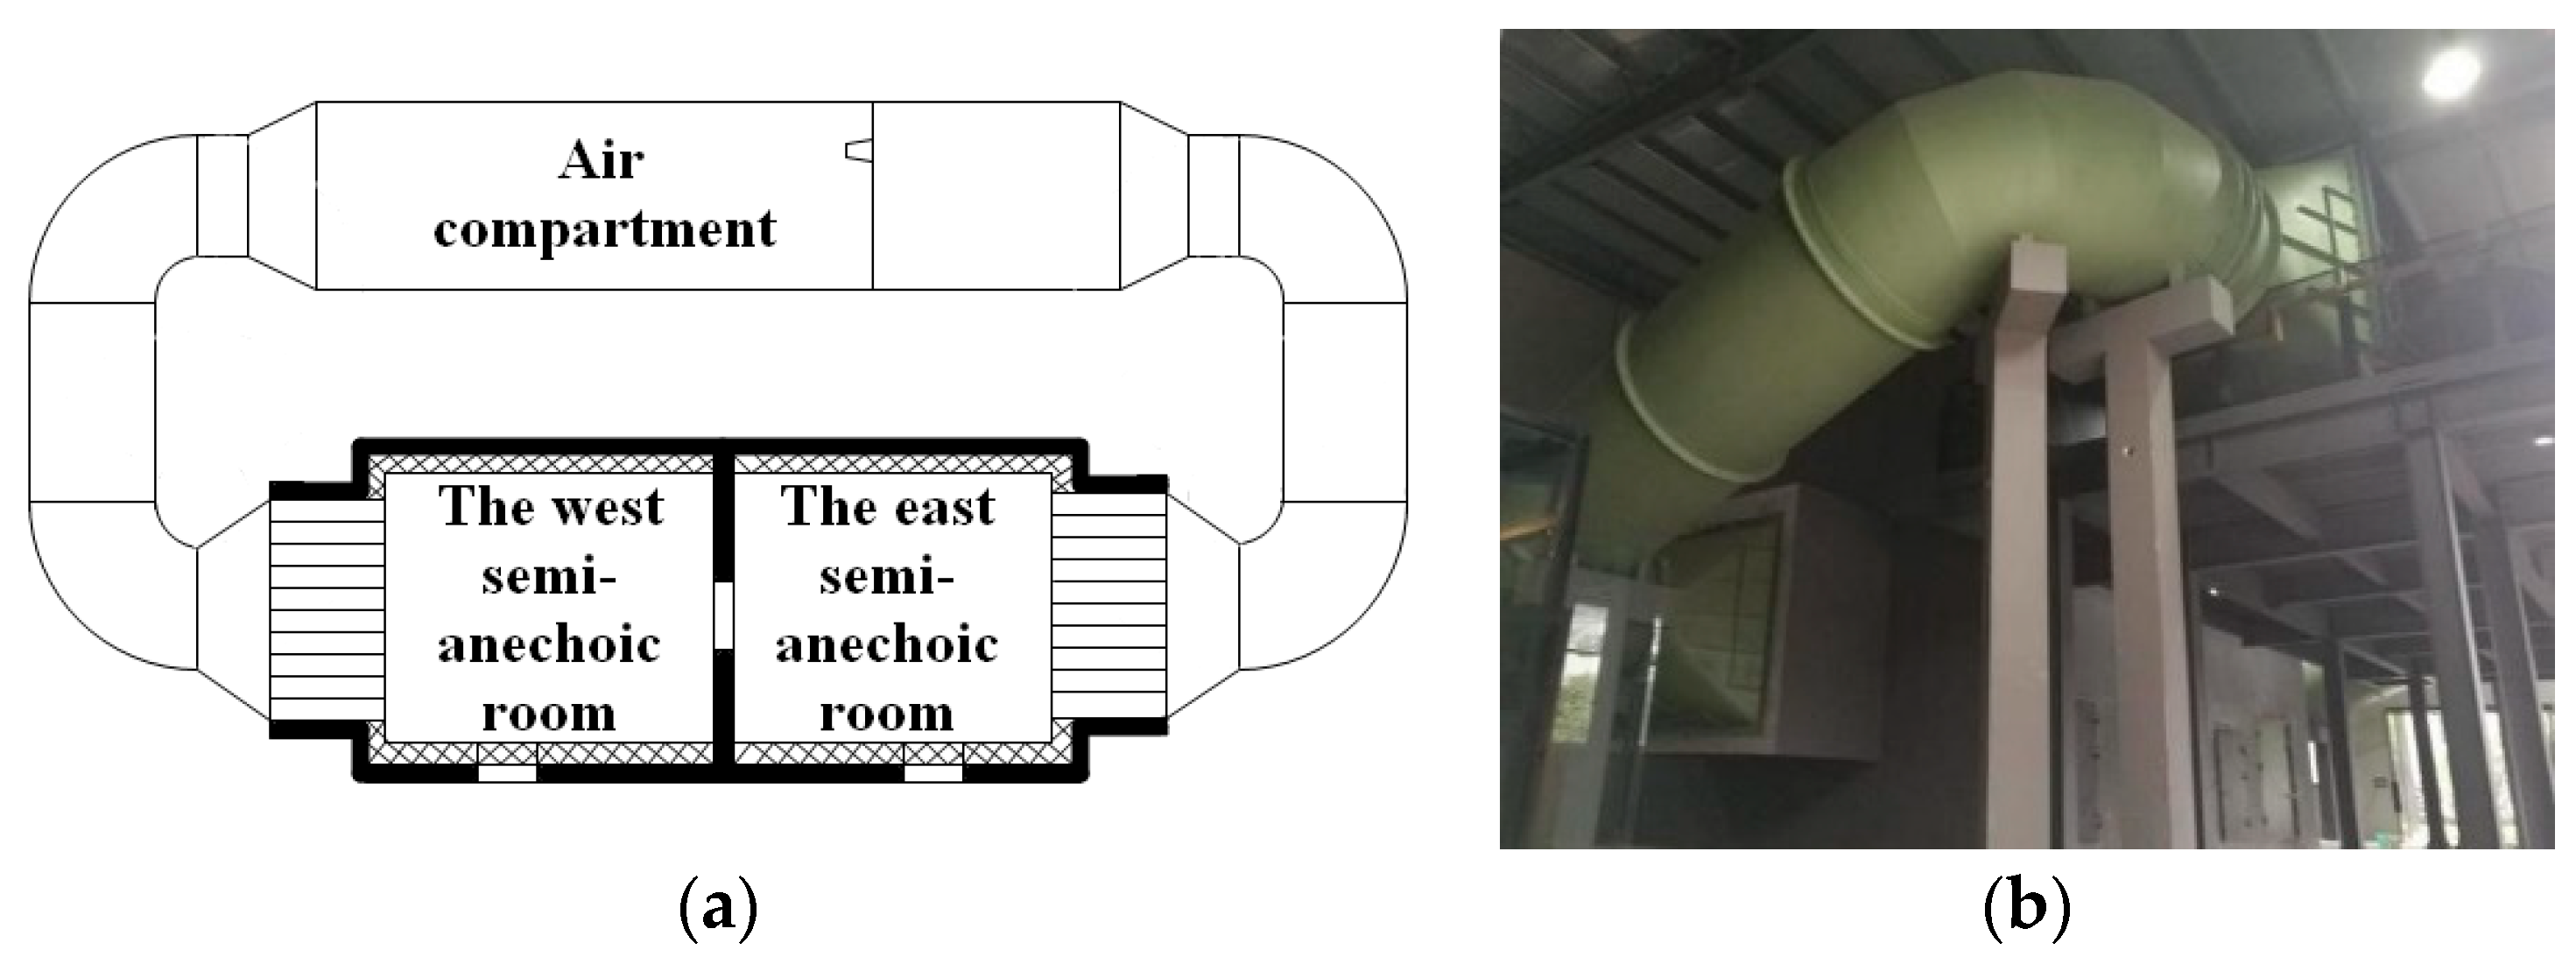
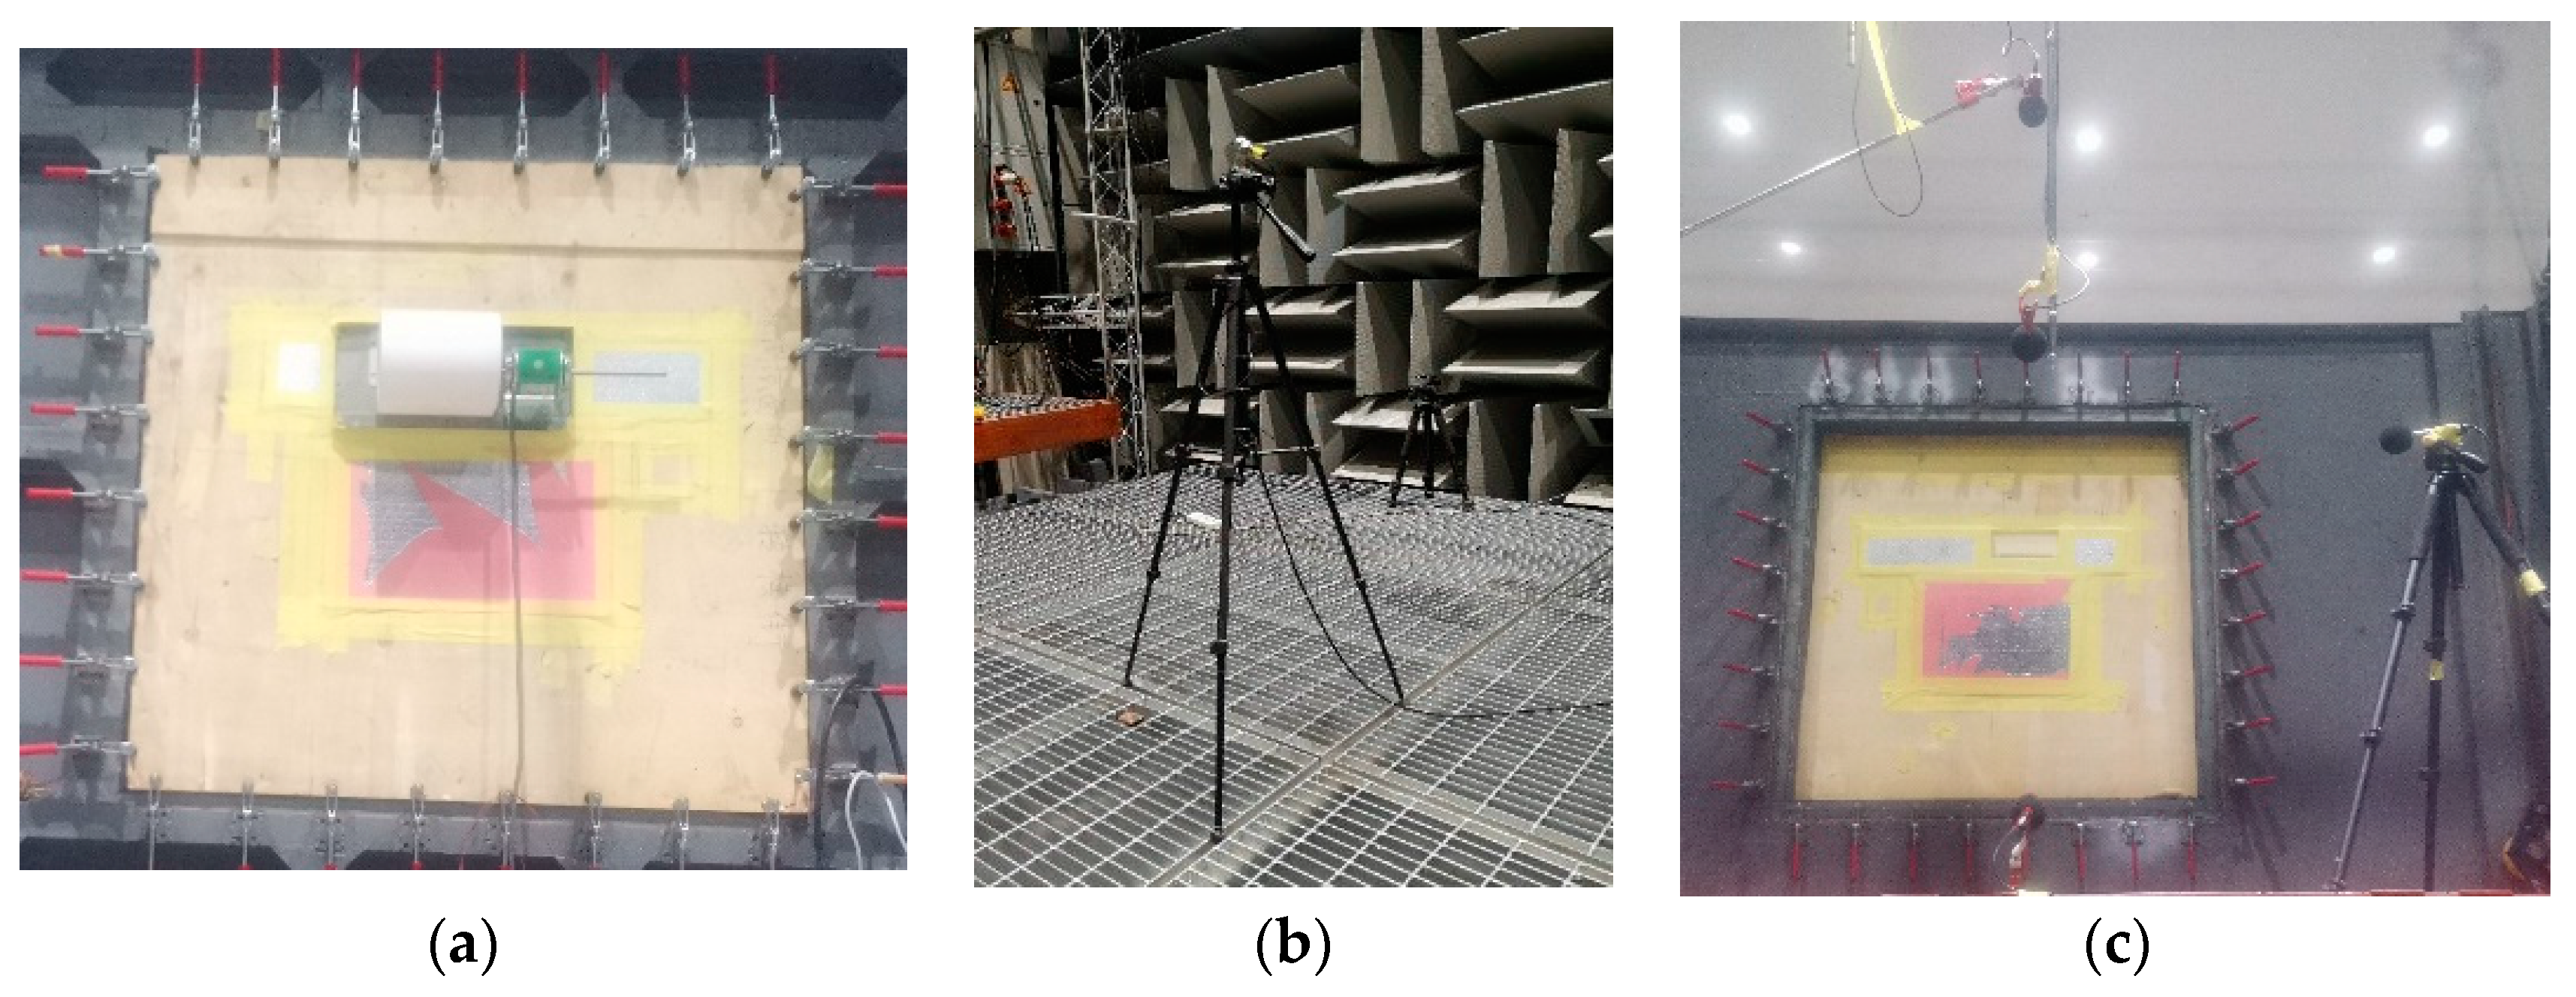
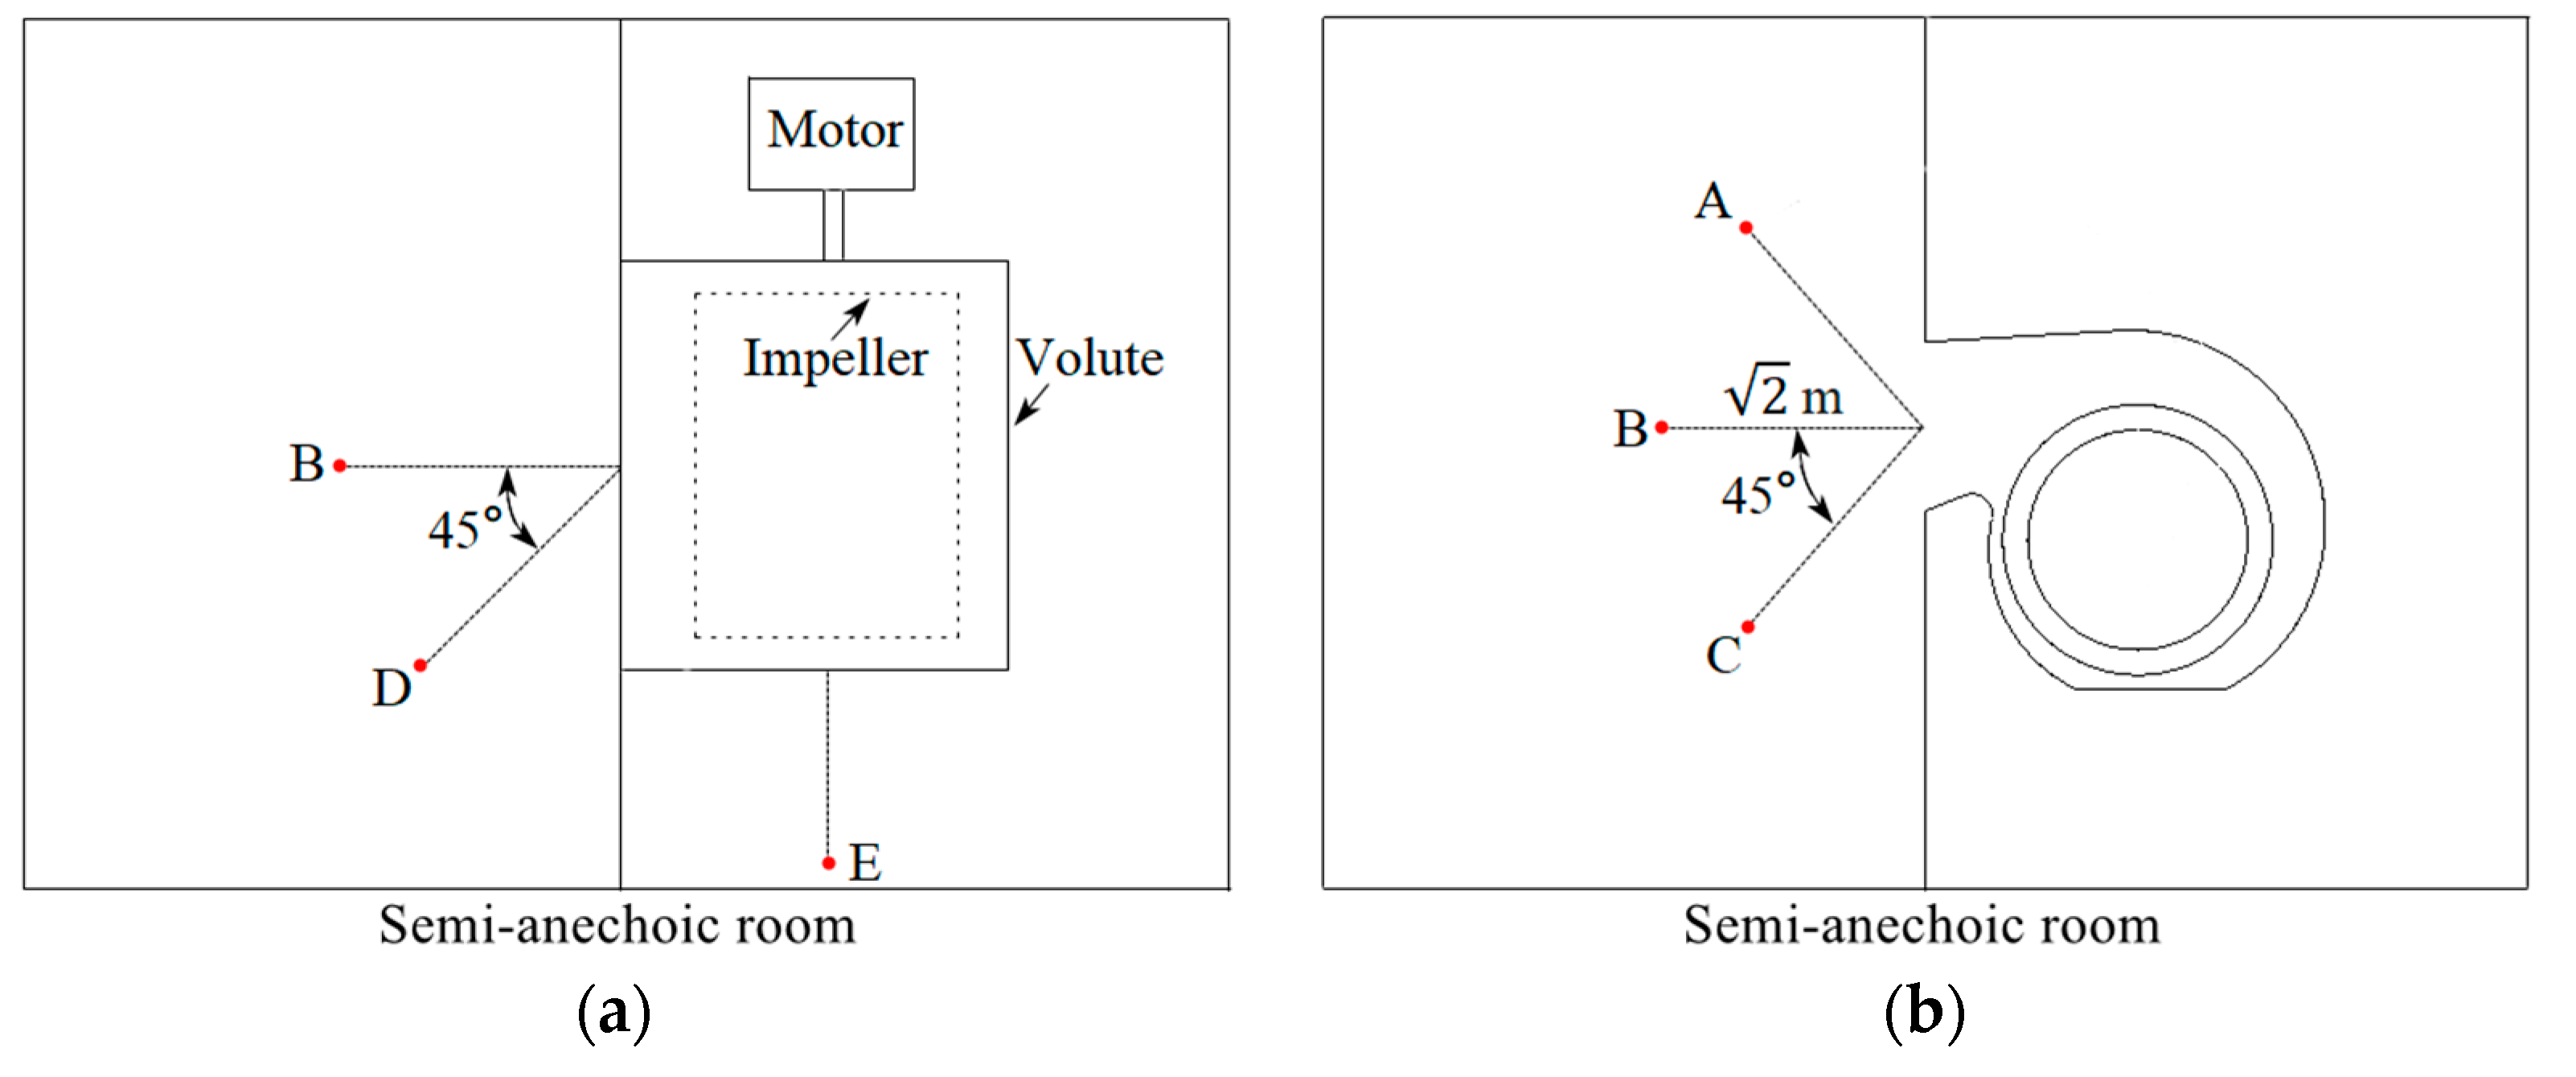
2.4. Experiment Details

The various volute models of the Sirocco fan are made by 3D printing and are experimentally tested in the aerodynamic-aeroacoustic laboratory of Zhejiang Yilida Ventilator Co., Ltd. (Taizhou, China). The experimental device is designed according to National Standard of China GB/T1236-2017 and conforms to the International Standard ISO5801-2007. The semi-anechoic noise test is designed according to ISO3745-2003. The noise monitoring can be carried out synchronously when the aerodynamic performance of the fan is tested. The volute models and the impeller are comparably shown in Figure 4. The schematic diagram and photo of the experimental facility are shown in Figure 5. The size of the east and west semi-anechoic room is 5200 mm × 4800 mm × 7000 mm and 5200 mm × 5600 mm × 7000 mm, respectively and the air compartment size is 3000 mm × 3000 mm × 9000 mm. The semi-anechoic room and the air compartment are connected by a circular pipe and the overall loop is a closed-chamber circulation structure. The measurement system mainly includes fan, motor, photoelectric infrared speed sensor, microphone and so forth, as shown in Figure 6. The test facility could measure and record the pressure and temperature of the inlet and outlet flows and the aerodynamic noise in a synchronous way.

3. Results and Discussion

3.1. Aerodynamic Performances

The static pressure rise and static pressure efficiency are the key parameters reflecting the aerodynamic performances of the Sirocco fan and is experimentally measured as well as simulated in this work. Figure 7 gives the time history and time-averaged value of the static pressure rise of the fan obtained by URANS and compared with those obtained by RANS simulation and experiment. Table 3 and Table 4 list the static pressure rise and efficiency predicted by experiment, RANS and URANS in time-averaged sense.
It is seen from the figure and tables that for models with r = 9 mm, 11 mm and 13 mm, the relative difference between the results of RANS and experiment is 6.3% at maximum which is of engineering significance. However, the URANS produce much better consistent data with respect to the experimental one; the maximum relative difference between the time-averaged static pressure rise and experimental data is only 0.7%. This reflects that the URANS simulation is more consistent with the realistic operation of the fan and is capable to simulate the flow inside the fan more accurately. For the model with r = 4 mm, the sharper volute tongue strongly destabilize the local flow around the outlet of the volute, thus the pressure rise substantially fluctuates with a large amplitude and the periodicity due to impeller rotation is clearly observed. Both the results produced by RANS and URANS in time-averaged sense notably deviate from the experimental data with relative difference about 10%. Therefore, we believe that the accuracy of simulation is greatly affected by the pulsating flow and the simulation is less capable in accurately predicting the internal flow of the fan.
Comparing the models with different volute tongue radius, it can be found that the pressure fluctuation in URANS from the 5th to the 10th revolution of the impeller presents the smallest amplitude for the r = 13 mm volute, which almost perfectly coincides with the time-average value. For the r = 9 mm and 11 mm models, the amplitude slightly increases but is still small compared with the magnitude of pressure rise. The amplitude is the highest for the r = 4 mm model. It is also noted that as the radius decreases, the time-averaged pressure monotonically increases from r = 13 mm to r = 9 mm, while the increasing generally stops for r = 4 mm. This indicates that smaller radius will generate stronger pressure pulsation and increases the pressure rise to different degrees. For the r = 4 mm model, notable quasi-periodic pressure fluctuation is observed in which one cycle approximately corresponds to 0.05 s as the revolution of the impeller; this is an indication that the sharper volute tongue could generate strong pulsating flow compared with other models.

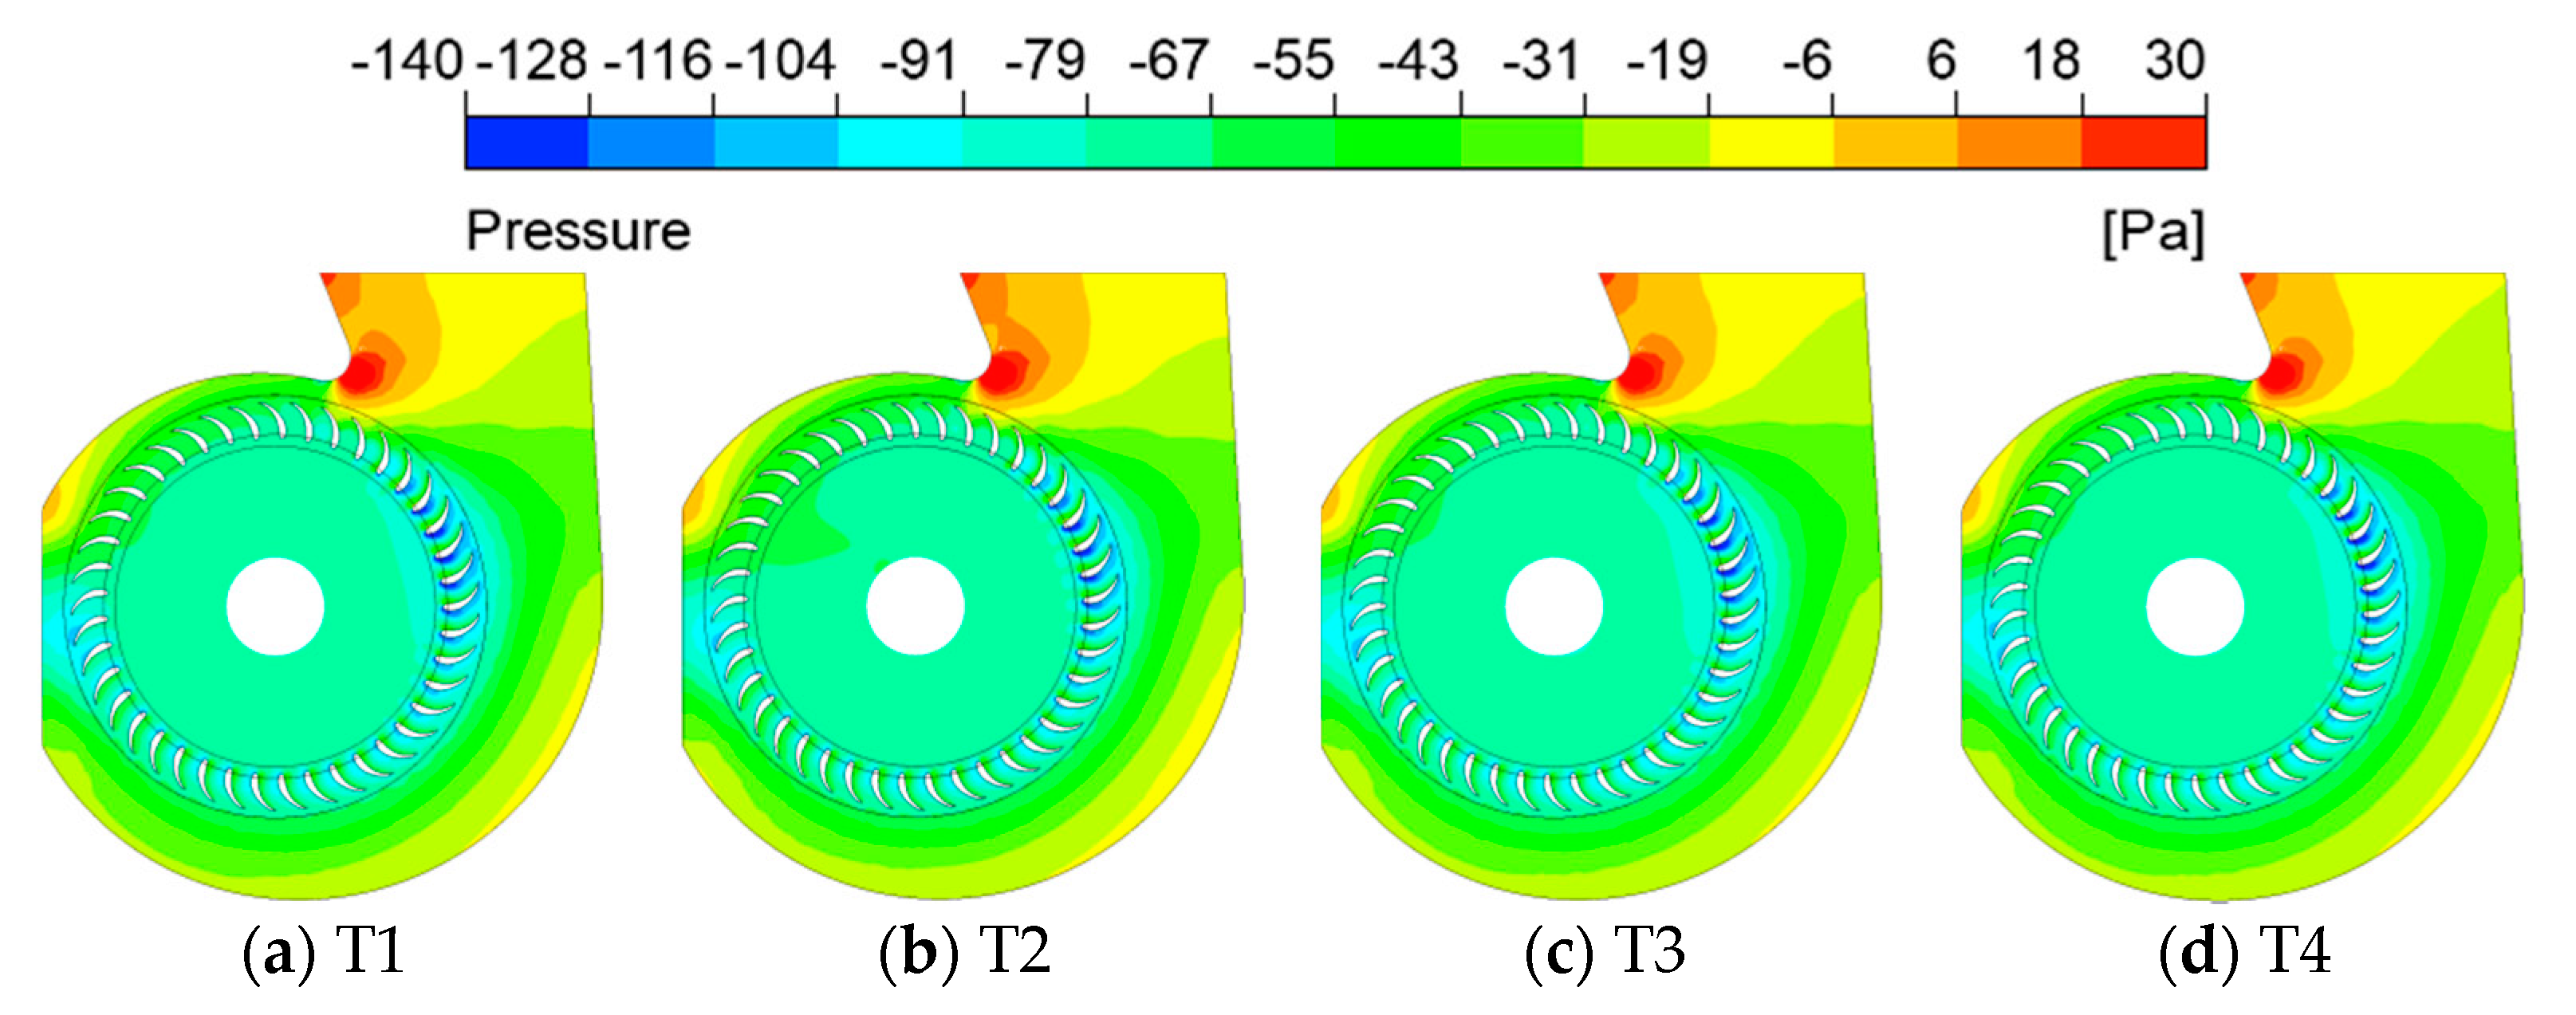
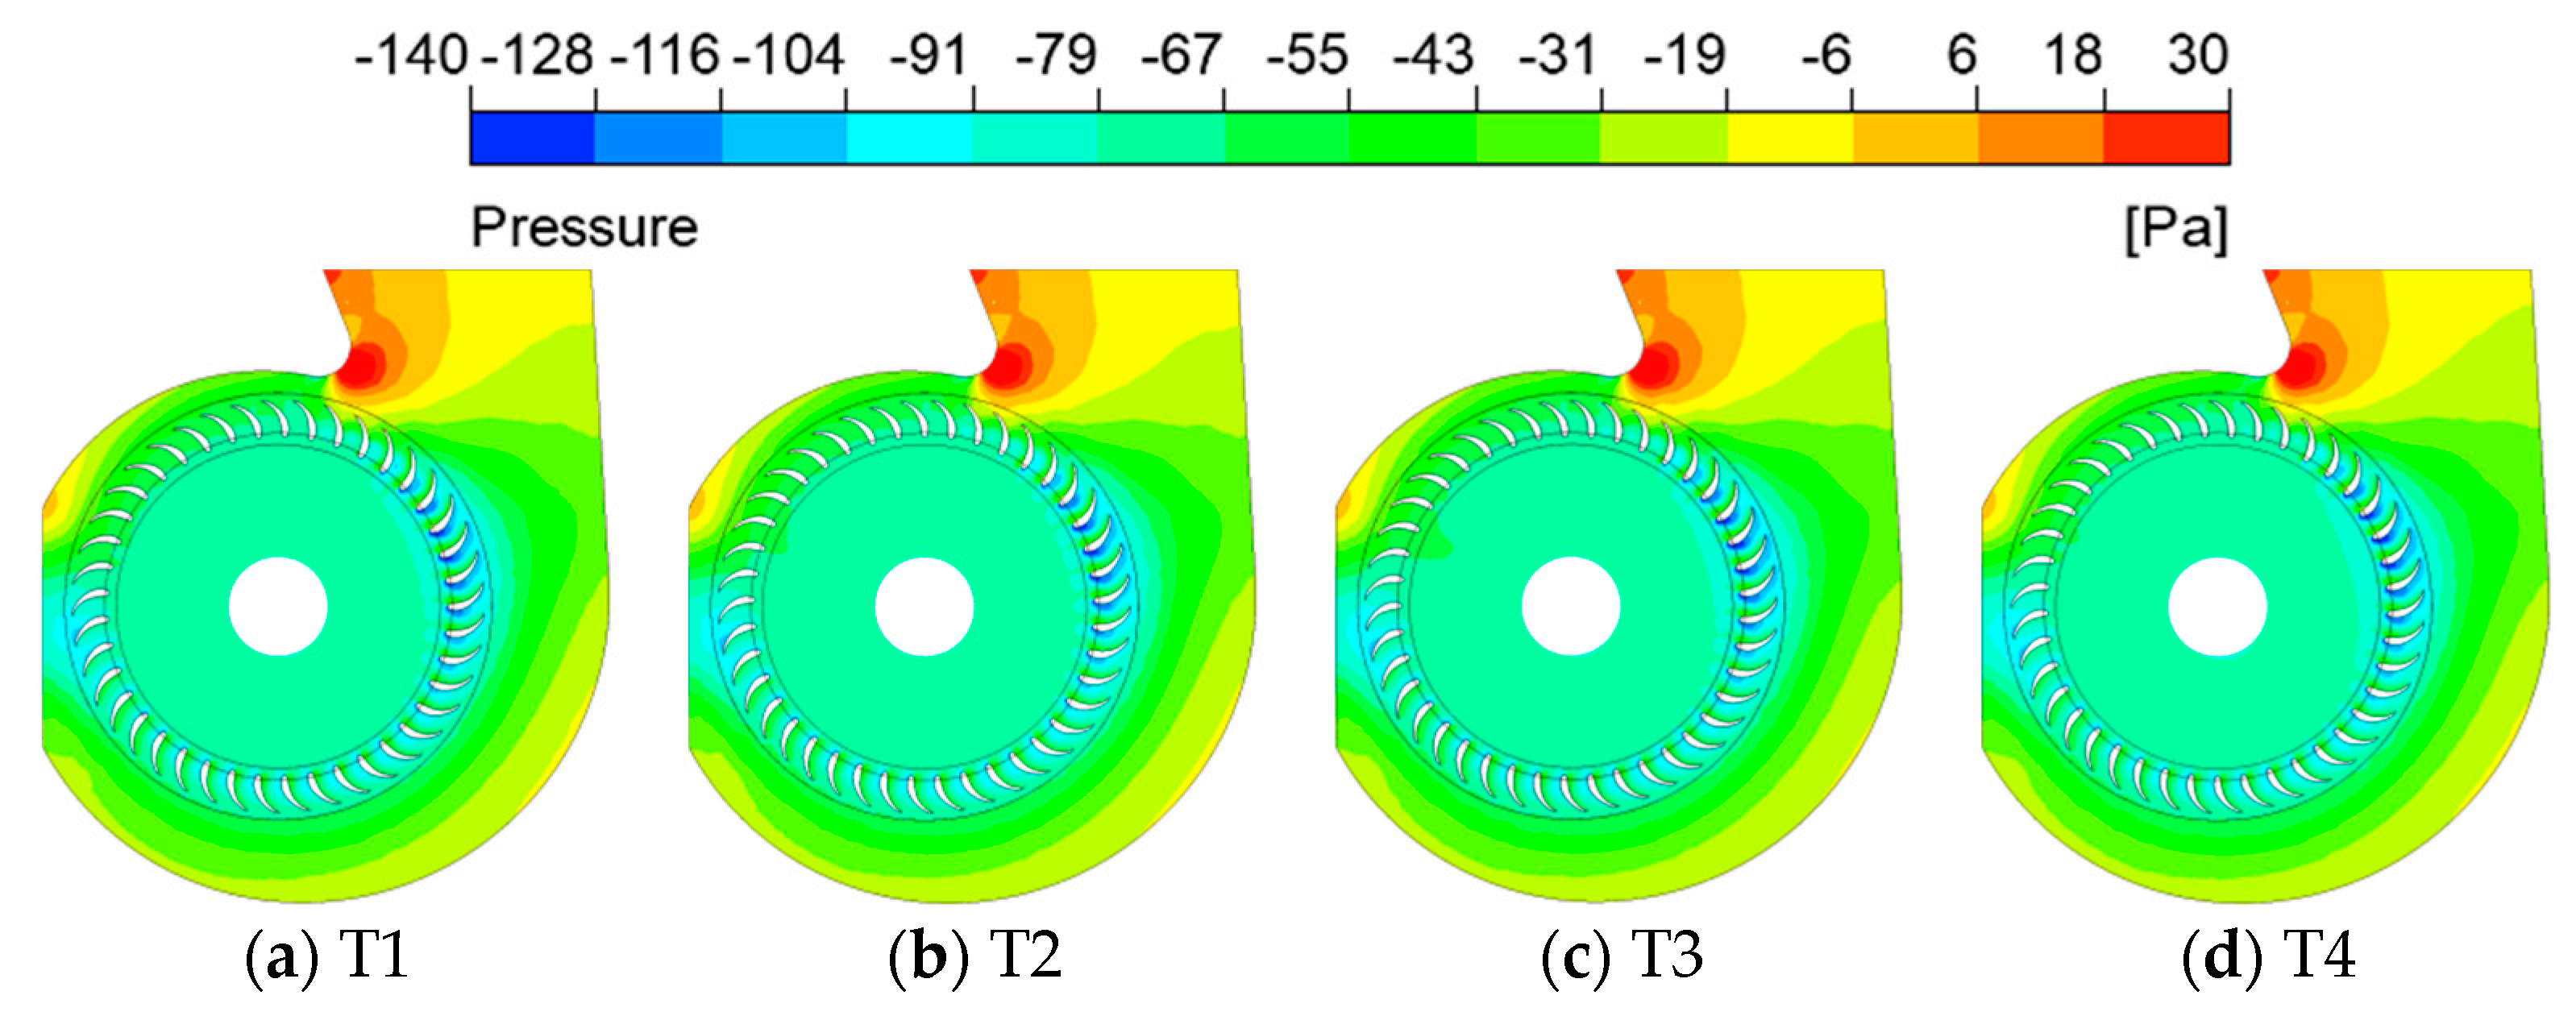
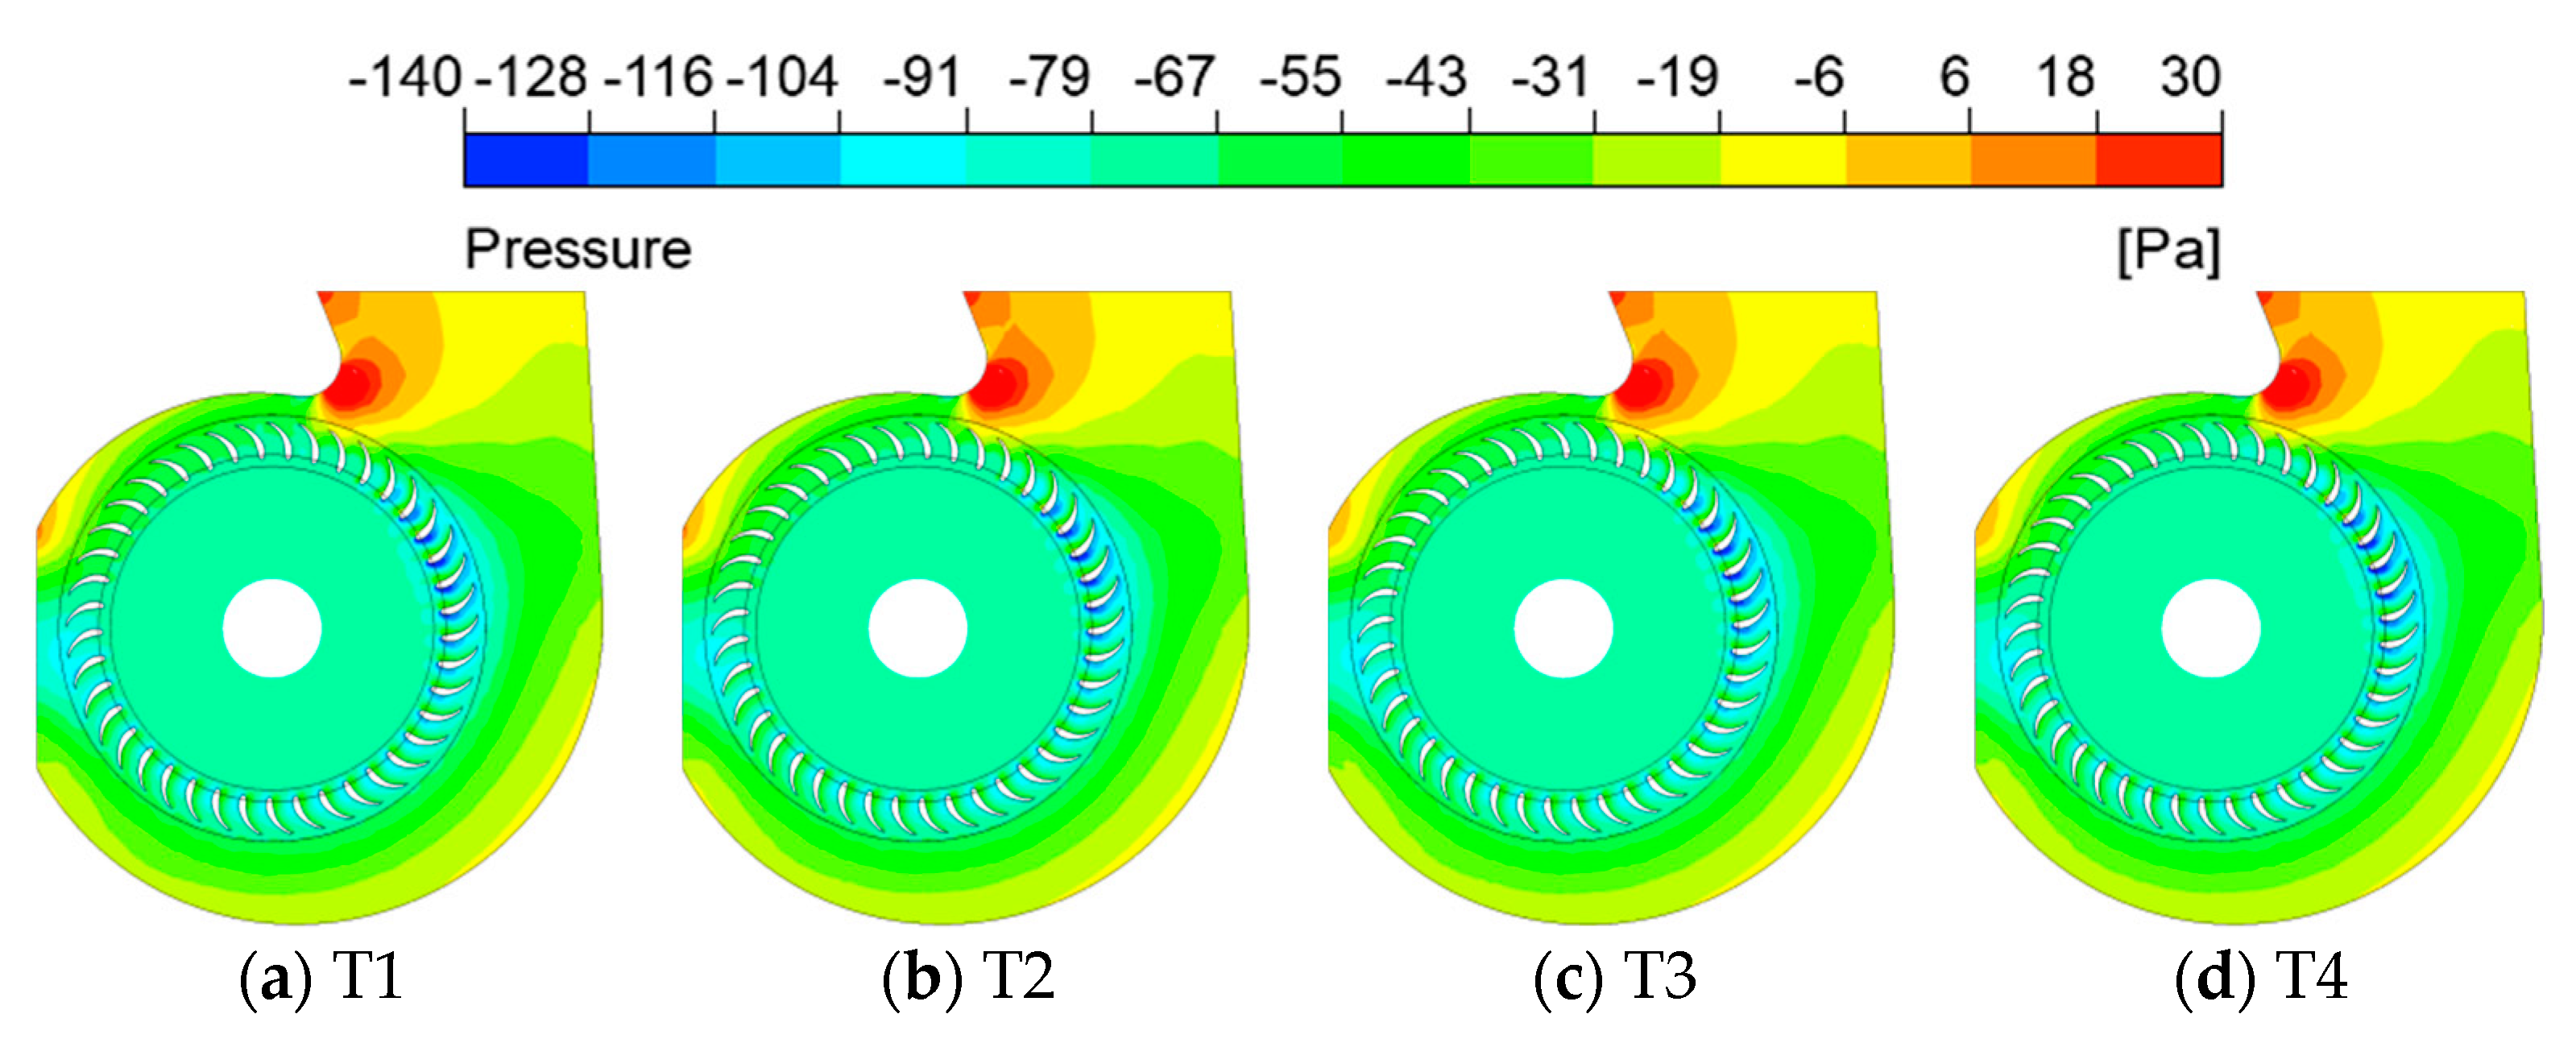
3.2. General Characteristics of Internal Flow

The transient flow in the impeller and volute is analyzed for the 10th revolution of the impeller at four moments, that is, T1, T2, T3 and T4, with time interval between neighboring two moments as the impeller rotates for 90°. Figure 8, Figure 9, Figure 10 and Figure 11 show the distribution of static pressure on axial cross-section Z = 4 mm which is close to the central disc of the impeller.
It is clearly seen that for models with r = 9 mm, 11 mm and 13 mm, the pressure distribution is quite similar at different moments in both the impeller and volute which is consistent with the conclusion obtained in Figure 7. The pressure has a minor fluctuation not only exhibited by its global behavior as the static pressure rise of the fan but also in a local manner. For the r = 4 mm model, noticeable temporal variations of pressure field are observed especially in the region between the volute tongue and outlet of the impeller. At time T2, the high-pressure area near the volute tongue is substantially smaller than that at the moment T1, while it increases in size at T3 and continues increasing to a certain extent at T4. Meanwhile, the low-pressure region that covers most of the impeller at time T2 has a wider distribution and a lower pressure magnitude. The above phenomenon indicates that the velocity of passage flow in the impeller is higher at T2 and the flow moves smoothly around the volute tongue. However, the flow is greatly affected by the sharp volute tongue and experiences pronounced changes.
Comparing the pressure distribution of different models, it can be found that for the r = 9 mm, 11 mm and 13 mm models, the high-pressure region in the vicinity of the volute tongue slightly expands in area, while it is notably smaller for the r = 4 mm model. As the flow velocity is in a state of change, at T2, part of the impeller passage exhibits a certain range of low pressure areas due to the higher flow velocity. This indicates that the volute tongue radius not only affects the flow near the volute tongue but also indirectly affects the flow in other region away from it.

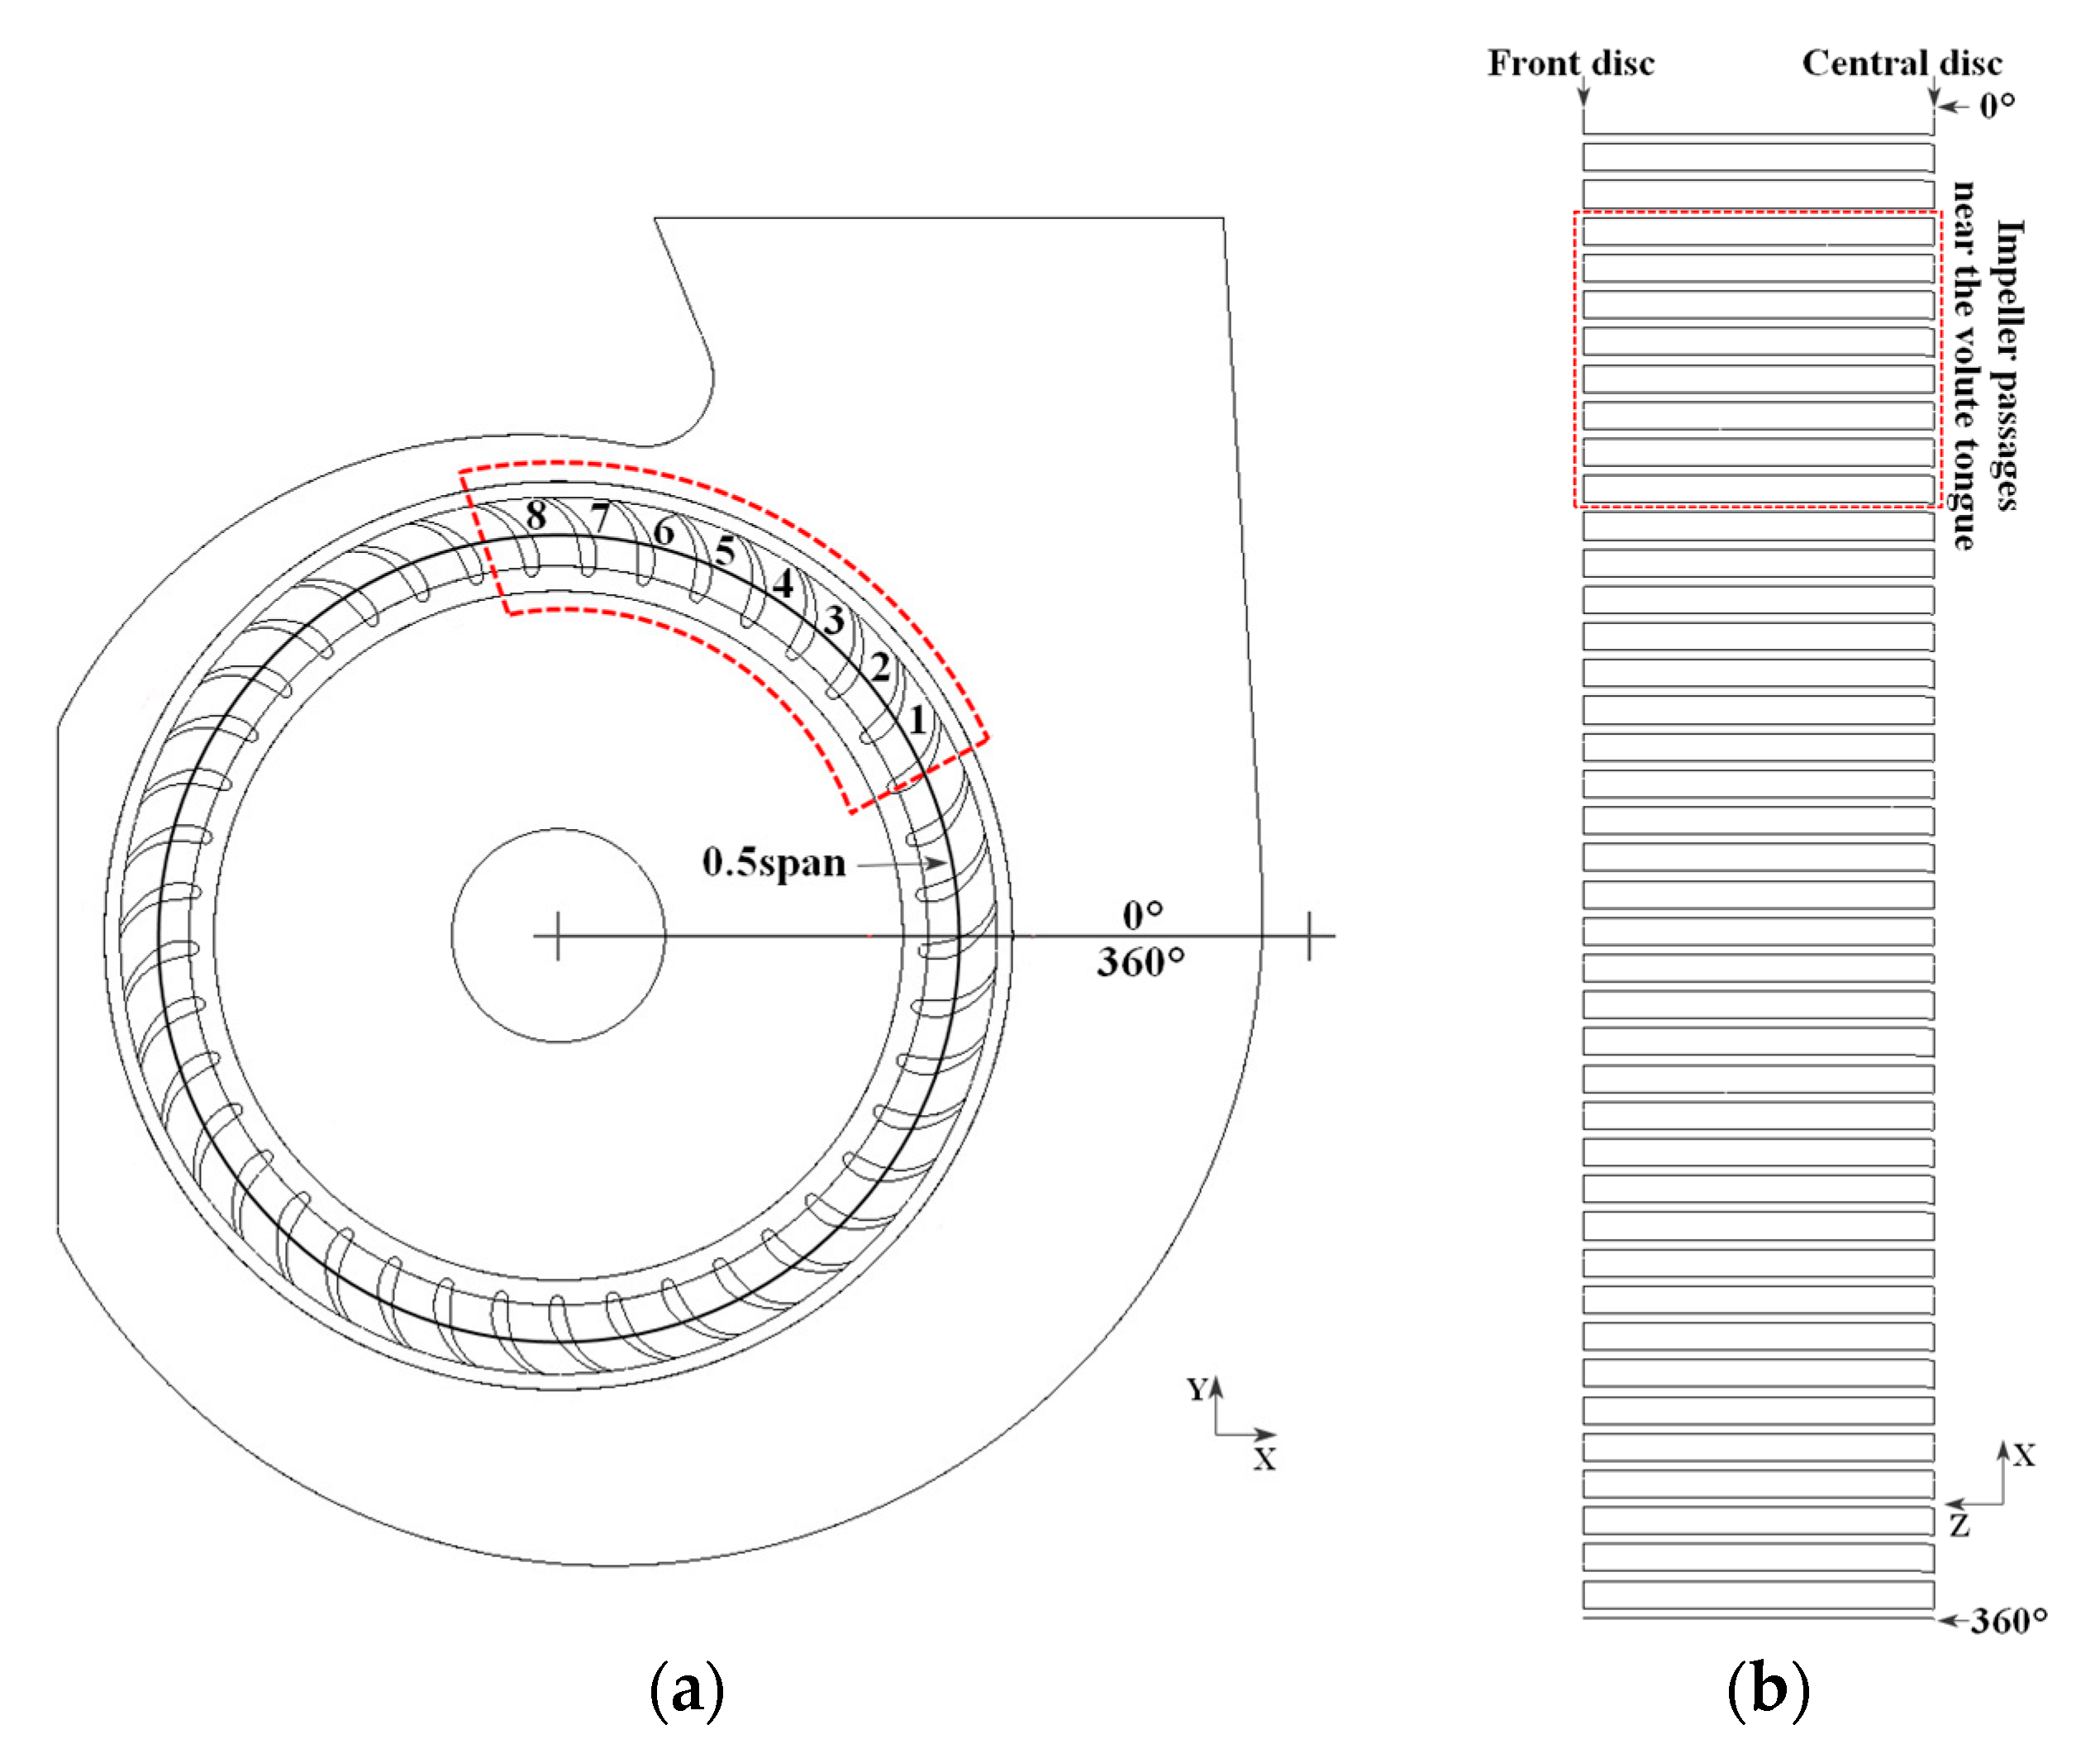
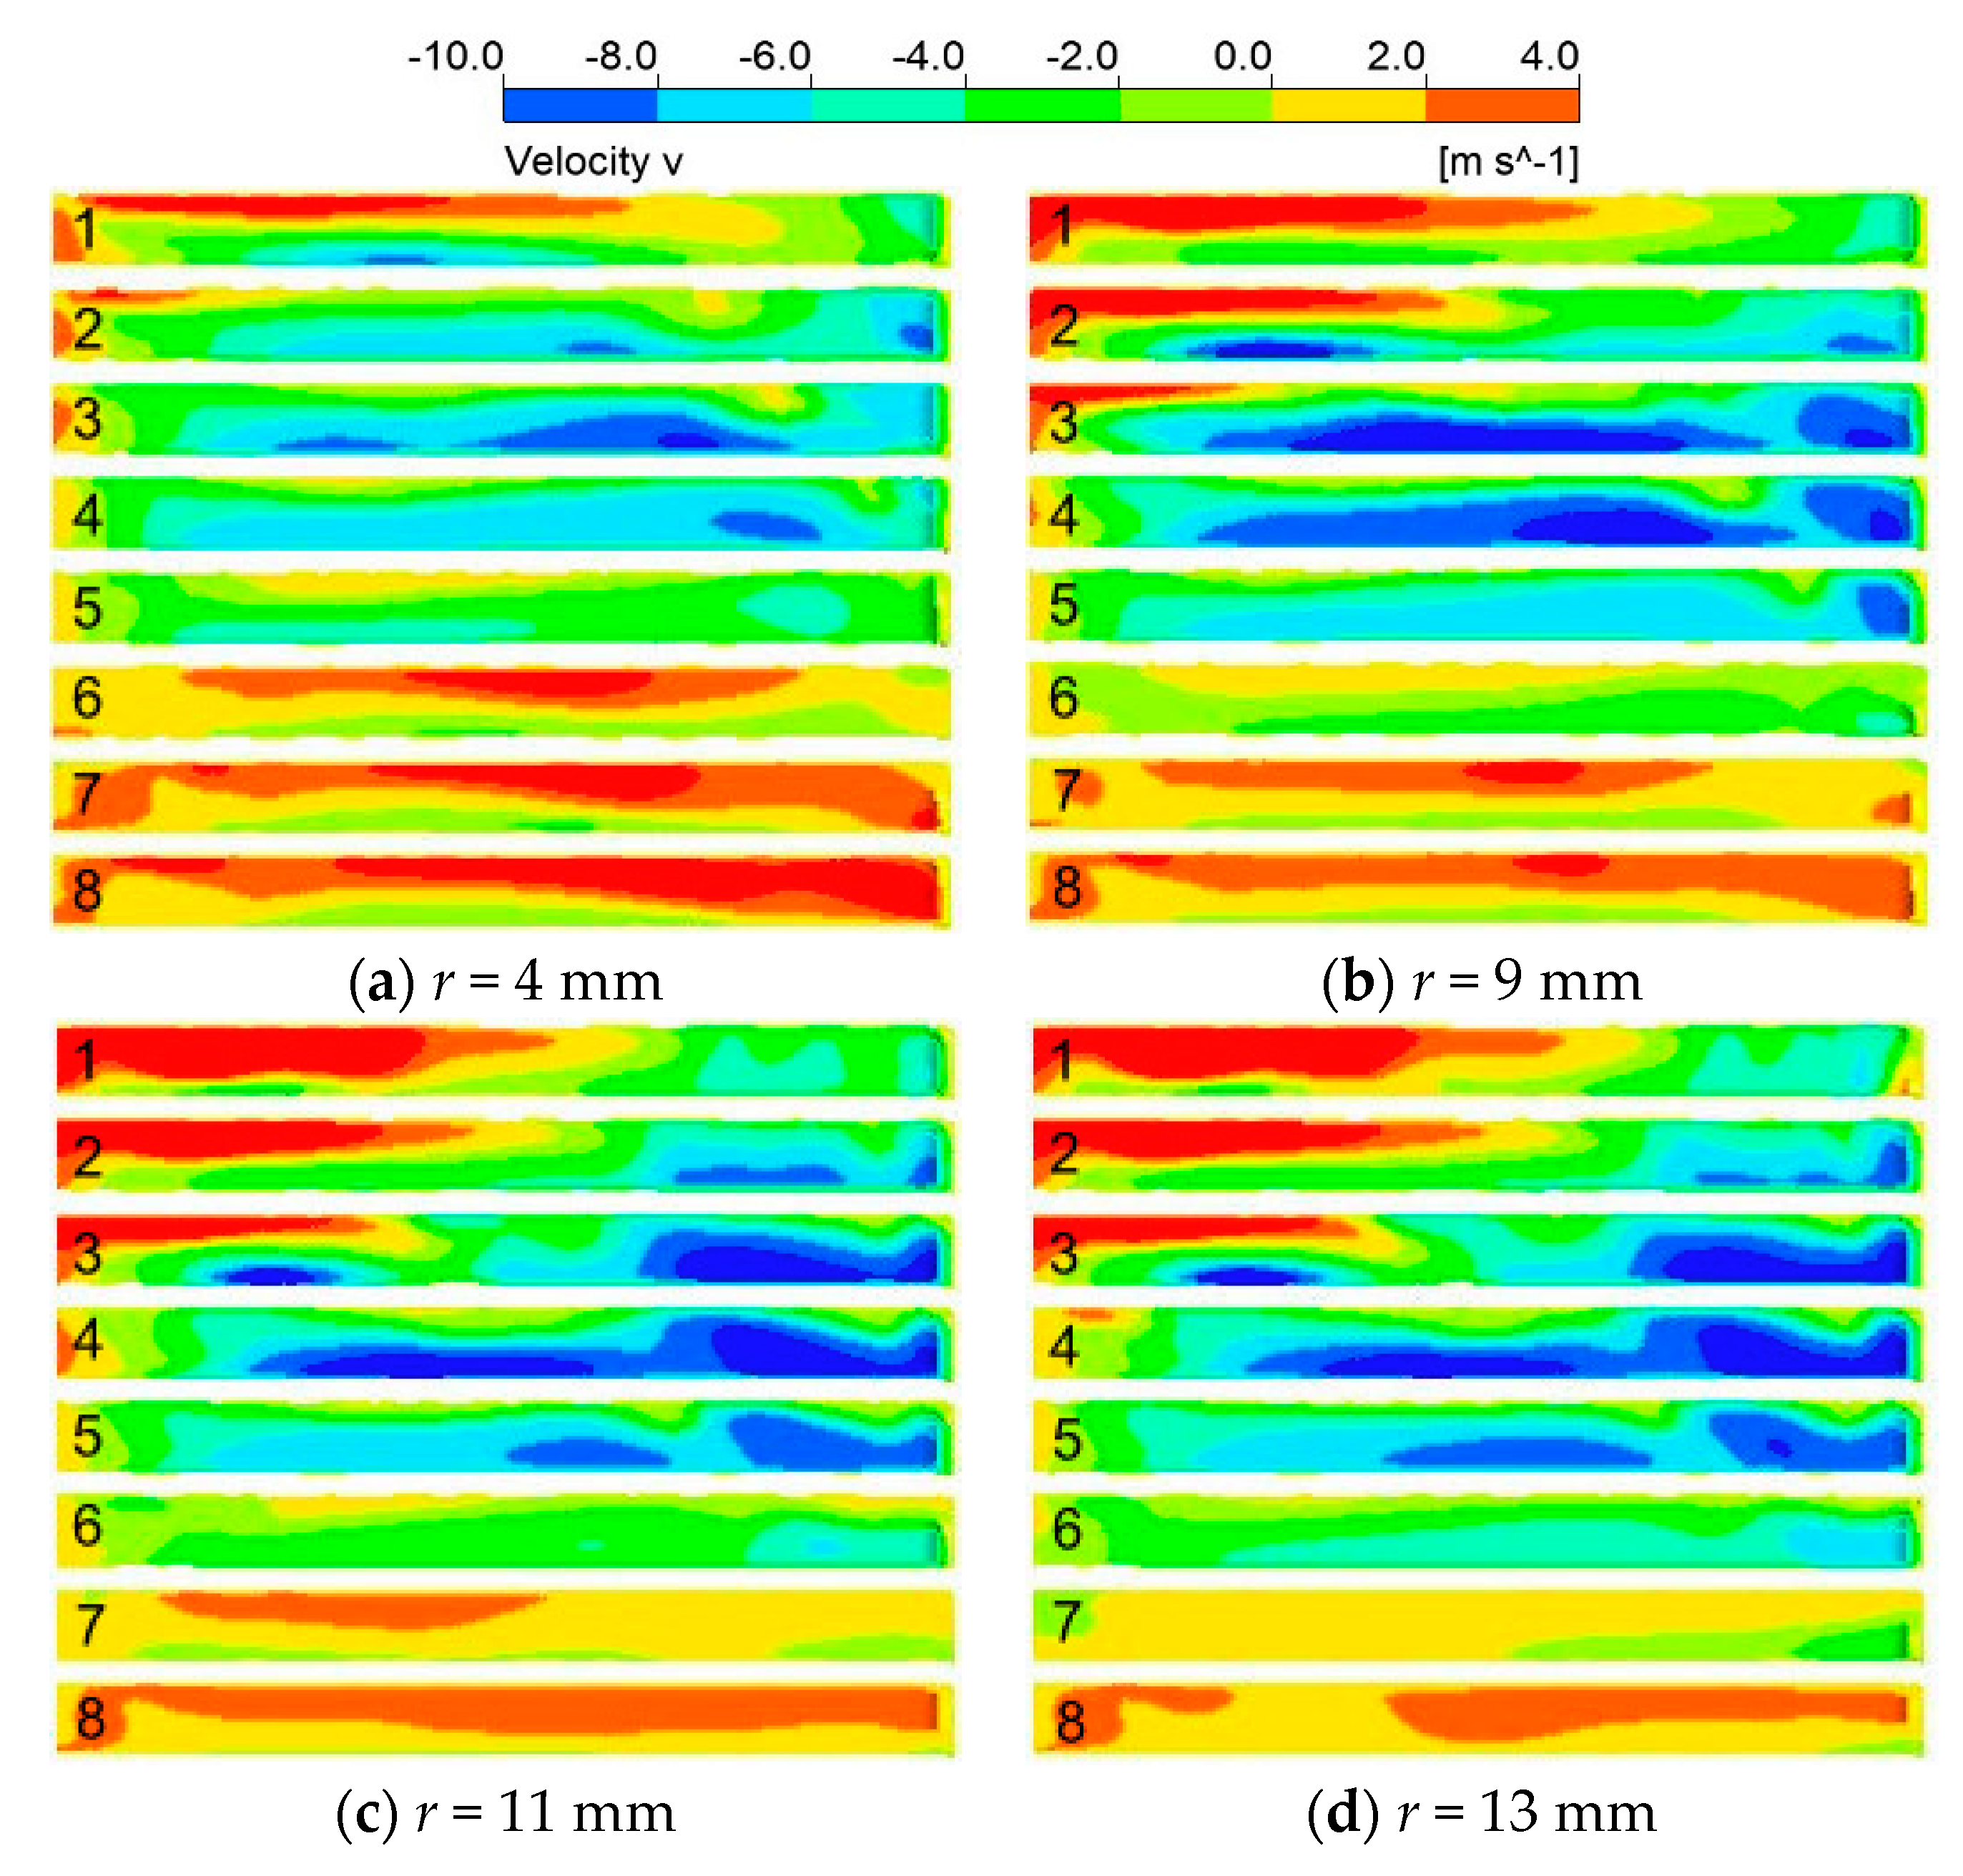
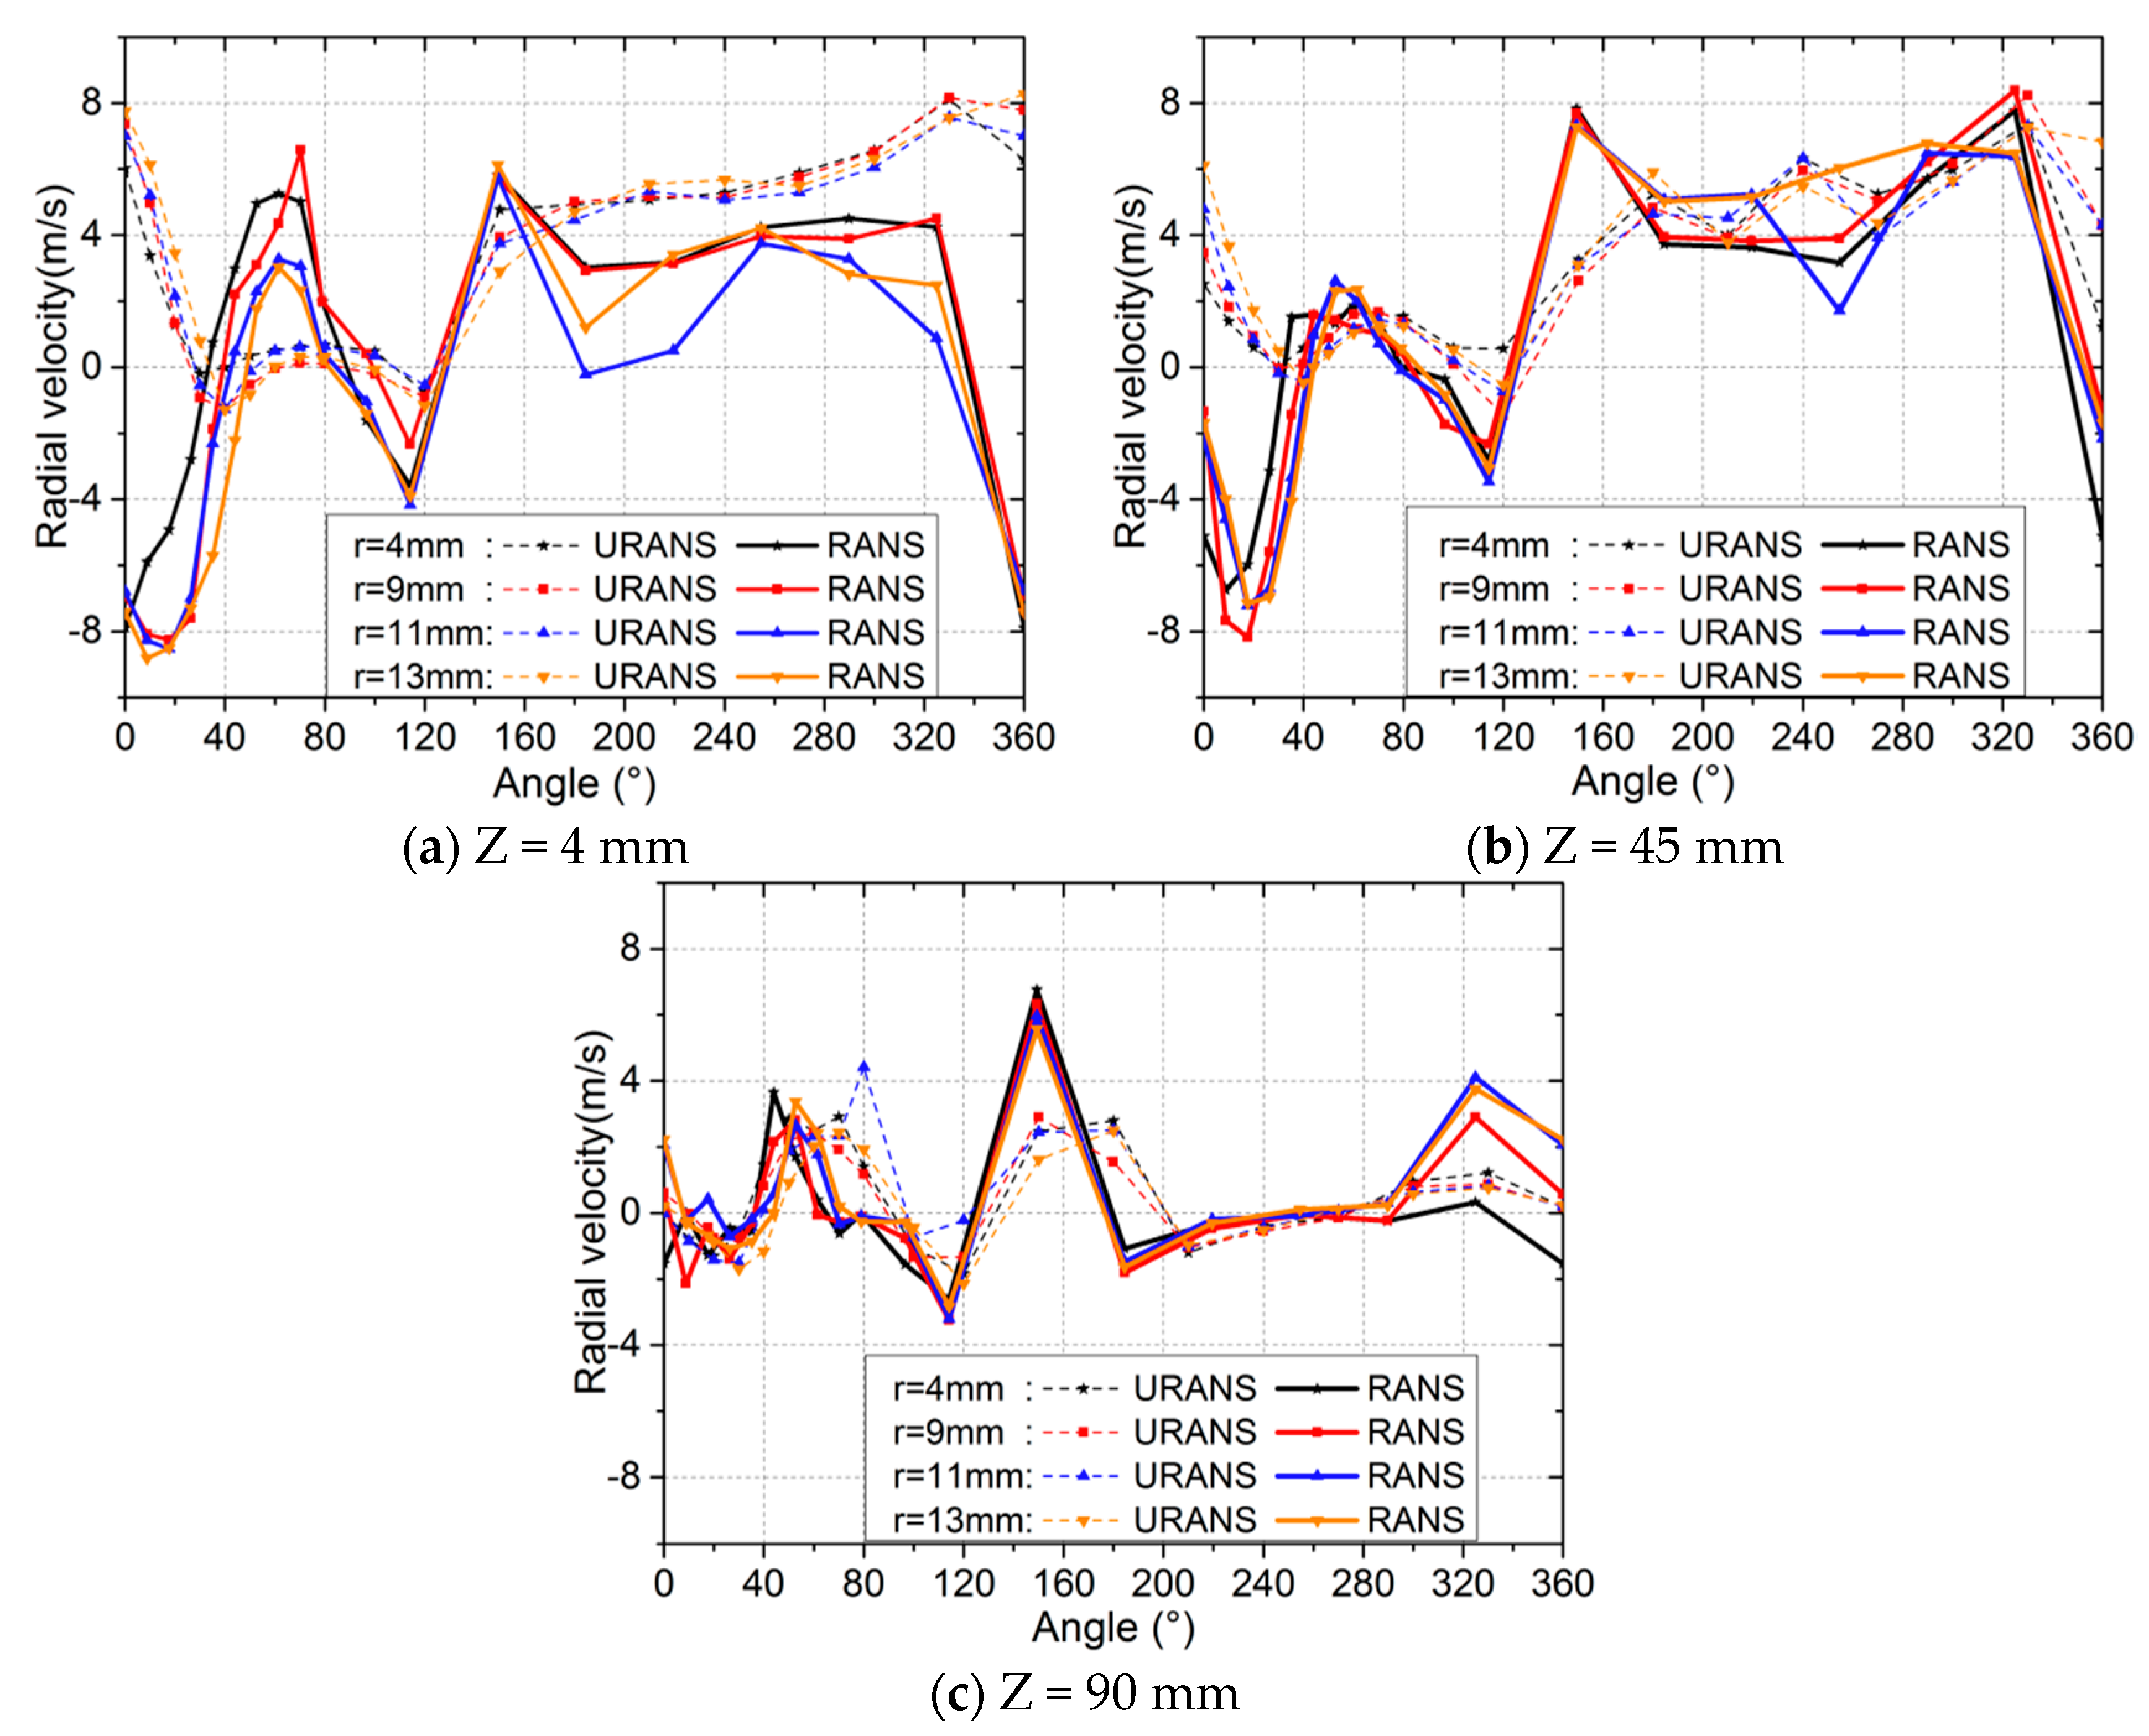
3.3. Reversed Flow in Impeller Near the Volute Tongue

3.3.1. Reversed Flow Predicted by RANS

It is seen in Figure 8, Figure 9, Figure 10 and Figure 11 that there is great pressure fluctuation in the passages of the impeller near the volute tongue, thus reversed flow, that is, in the direction from the outlet to inlet of the impeller, may form during part of the revolution cycle. In order to explore the influence of volute tongue radius on reversed flow, in this section we present and analyze the flow in the impeller passages near the volute tongue. Figure 12 gives the schematic of the eight selected impeller passages. The angular cross-section at the 50% spanwise height is chosen as a representation covering the passages around the volute tongue and is expanded as on the X-Z plane in the figure. The distribution of v-velocity of flow in the selected passages is plotted in Figure 13. Since the selected blade passages are basically located in the region between 30° and 100°, the positive and negative v-velocity could generally indicate the forward passage flow which moves from the inlet to outlet of the blade passage and the reversed flow moving from the outlet to the inlet of the impeller.
It is seen in Figure 13 that there is almost no reversed flow in passage-7 and passage-8 as predicted by the steady-state RANS simulation, while reversed flow of different scales and intensity form in passages 1–6. There is a large region with strong reversed flow close to the suction surface of the impeller and the central disc of the impeller, while forward flow is mainly observed near the pressure surface of the blade. Reversed flow starts to form in passage-6; the reversed flow with small magnitude occupies only a small region for the r = 4 mm mode but gradually expands in size and intensified as the radius increases. The same variation pattern of the reversed flow is also observed in passage-5. This variation pattern is attributed to the fact that the volute surface covers almost the whole passage-5 and passage-6 for the r = 4 mm model that the passage flow is not affected by the volute tongue, while for the models of r = 9–13 mm the volute tongue locates right beside the two passages, thus the flow is influenced by the local flow in the volute and presents reversed flow. For flow in passage 1–4, it is found that as the radius increases, there is more forward flow in the corner region of the pressure surface of the blade and the front disc of the impeller and the reversed flow still exists especially for passage-3 and passage-4. In general, the results of steady-state RANS simulation could reflect the primary characteristics of flow direction in the blade passages near the volute tongue.

3.3.2. Reversed Flow Predicted by URANS

In this section, the temporal variation of passage flow in the impeller is analyzed based on the transient results obtained by URANS simulation. We choose three fixed points in passage-1 at the middle between the pressure and suction side of the blade and on the Z = 4 mm, 45 mm and 90 mm axial cross-sections as the monitoring points and record the temporal variation of radial (r-) velocity as the passage moves to a series of circumferential positions with the rotation of impeller, as shown in Figure 14a, thus the variation of velocity reflect the temporal variation of the passage flow. The radial velocity is computed by vector manipulation based on u-velocity and v-velocity and forward and backward flows are identified as the radial velocity is positive and negative, respectively. To focus on the effect of volute tongue on the passage flow in the impeller, more circumferential positions are selected in the region near the volute tongue, while fewer monitoring points are positioned in the rest part of the circumference. Moreover, to facilitate the direct comparison with the steady-state RANS result, we also computed the radial velocity based on the result of RANS simulation at several circumferential positions which are identical with those for the URANS result, as shown in Figure 14b. Since the impeller is axisymmetric about the center of the geometry, the RANS result presents the variation of radial velocity under the Euler framework, while the URANS result is obtained under the Lagrange framework. The difference between the RANS and URANS results reveal the different capabilities of the two approaches.
Figure 15 presents the circumferential distribution of radial velocity for monitoring points on the Z = 4 mm, 45 mm and 90 mm axial cross-sections. For the Z = 4 mm cross-section close to the central disc of the double-suction impeller, the transient results show that there are primarily three regions for all four models categorized by the radial velocity, that is, the forward flow region roughly lower than 30°, the reversed flow region in the range between 30° and 130° and forward flow region after 130°. For the r = 4 mm model, the reversed flow is observed to occupy only a small region and the magnitude of radial velocity is lower compared with other three models and the flow turns to be forward around 70°. As the volute tongue radius increases to r = 13 mm, stronger reversed flow generates within this region. Referring Figure 14a, it can be concluded that as the blade passage approaching to the circumferential position Φ1, the magnitude of radial velocity of the reversed flow first increases and then decreases and then exhibits a local maximum near Φ2. The reduction of the volute tongue radius could reduce the range and velocity magnitude of reversed flow. In the range 0–30°, the radial velocity gradually decreases until it reaches zero and gradually increases in the range 130–360°. Comparing the RANS and URANS results, we can notice that there is great difference between the curves for both forward and reversed flows and for almost the entire circumference of the impeller which may be attributed to the existence of the central disc. For the Z = 45 mm cross-section, the transient result show that reversed flow also exists in quite small regions around the circumferential positions 30° and 120°, that is, close to Φ1 and Φ2 as shown in Figure 14a. The variation pattern of radial velocity in the circumferential direction is similar with that of the Z = 4 mm cross-section. A comparison of RANS and URANS results demonstrate that significant differences in the range 320–400° (40°) and 80–180°; in particular, the flow can be falsely predicted as reversed flow by RANS and the magnitude of velocity also deviate a lot compared with the URANS data. For the Z = 90 mm cross-section close to the front disc of the impeller, the transient result shows that reversed flow appear in the regions 0–40°, 110–130° and 200–270° although the magnitude of radial velocity is minor. The influence of volute tongue radius on the radial velocity is comparably smaller than those on the Z = 4 mm and 45 mm cross-sections. Pronounced difference is still observed between the RANS and URANS results.
Since the flow enters the impeller from the front disc, the velocity direction changes from axial to radial as it gradually approaches the central disc. Therefore, near the front disc of the impeller, the radial velocity of the flow is relatively small and the degree of velocity change is small, which can be observed by comparing the distribution of the radial velocity on the three sections. The reversed flow roughly in the region 30–130° has the smallest and largest range on the Z = 45 mm and Z = 90 mm cross-sections in RANS and URANS results, respectively, which reflects that the flow near the central disc is less affected by the rotation of impeller. The comparison of RANS and URANS results show that the circumferential variation of velocity magnitude is much larger for the RANS simulation particularly on the Z = 4 mm cross-section where the RANS result is also greatly affected by the volute tongue radius.

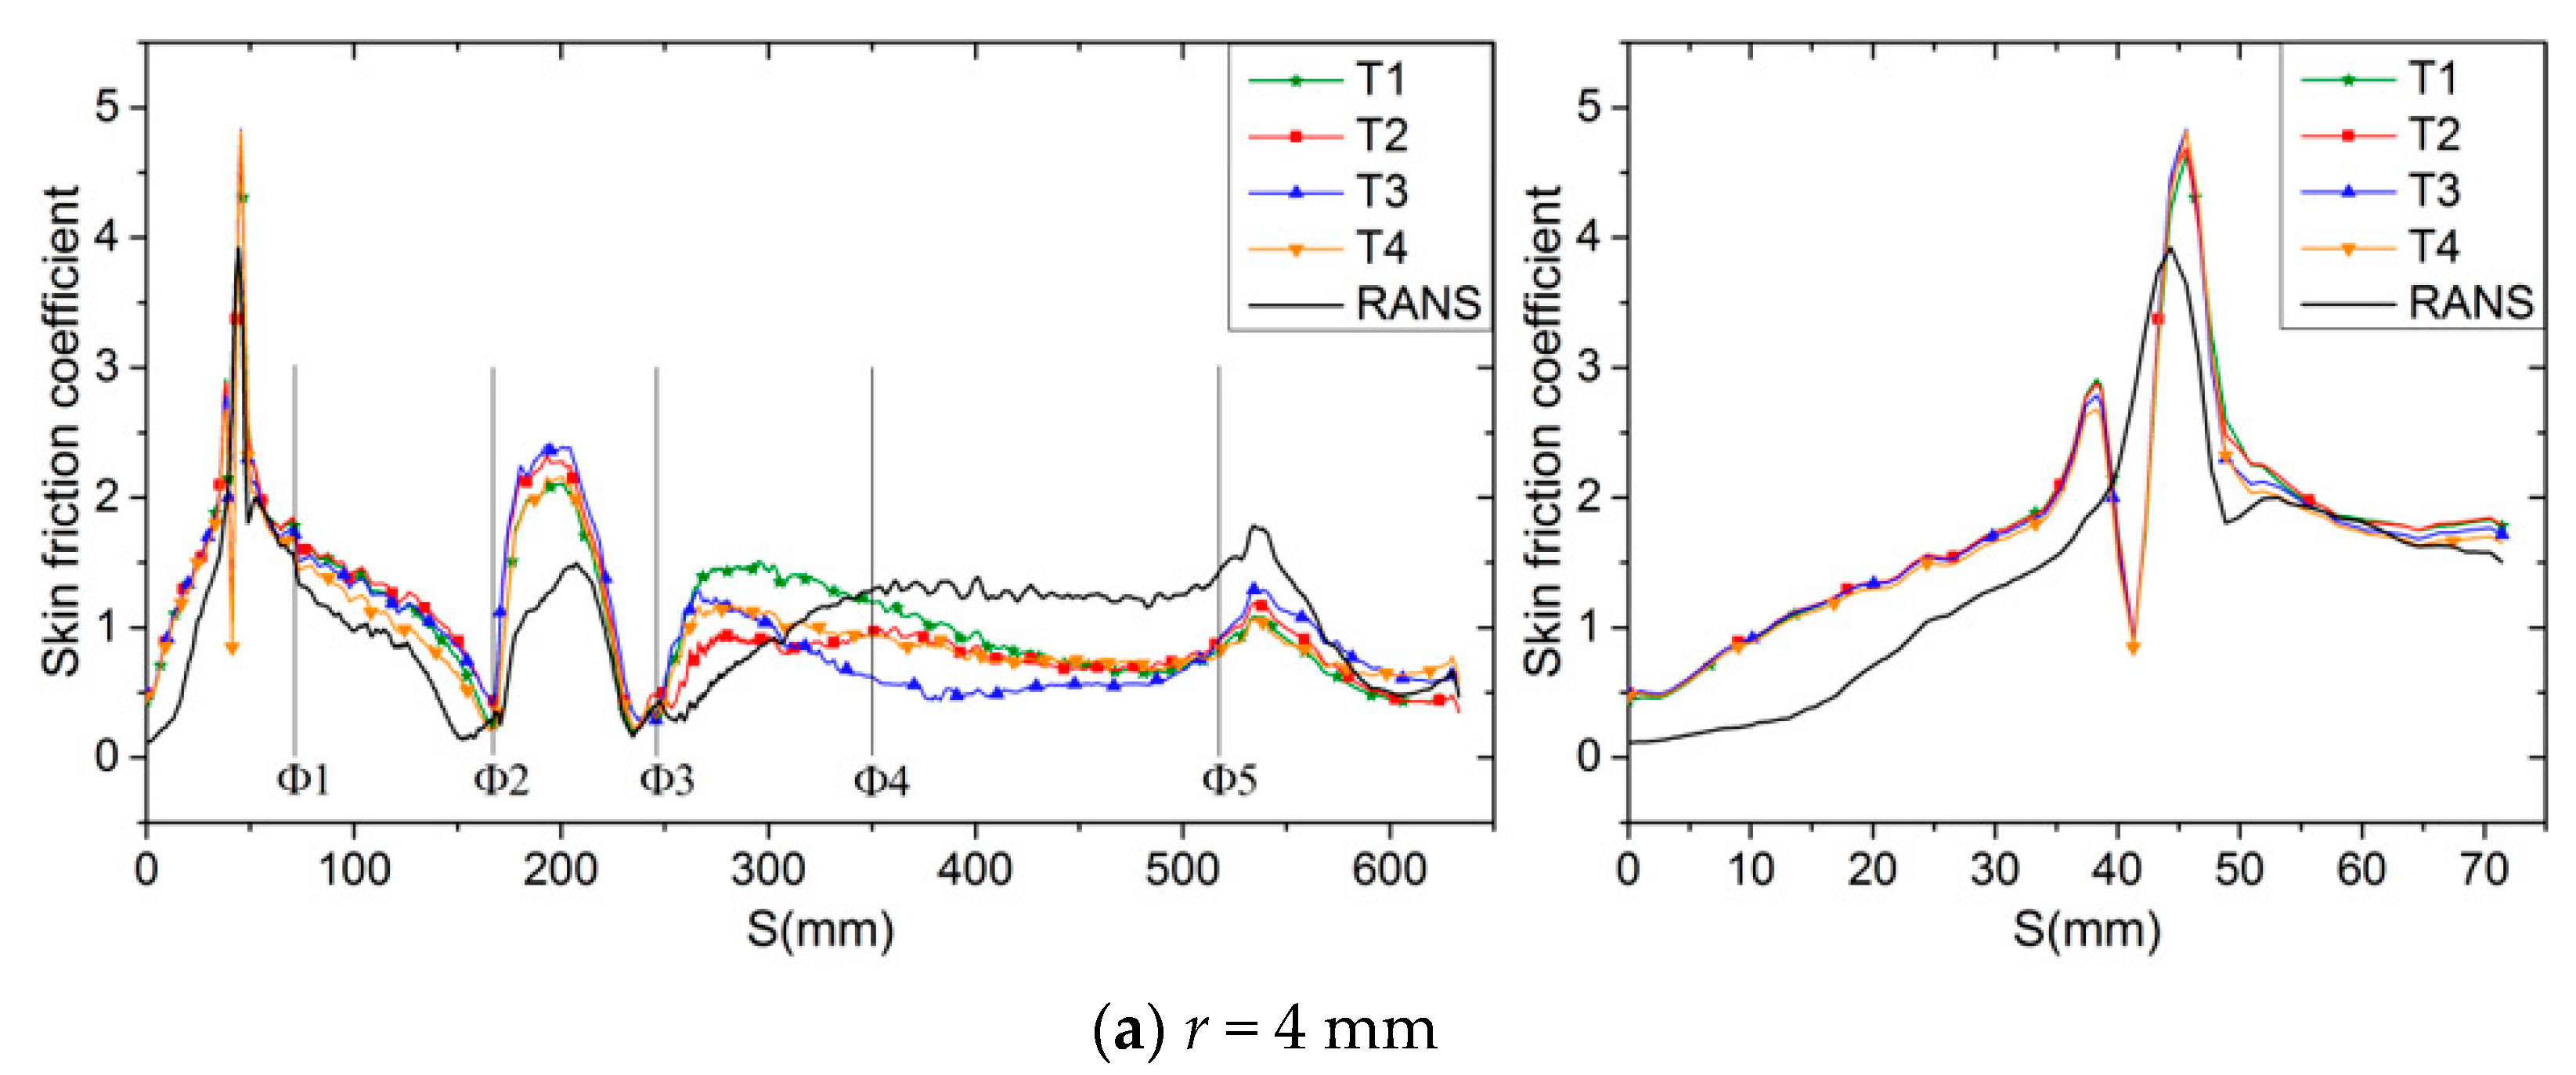
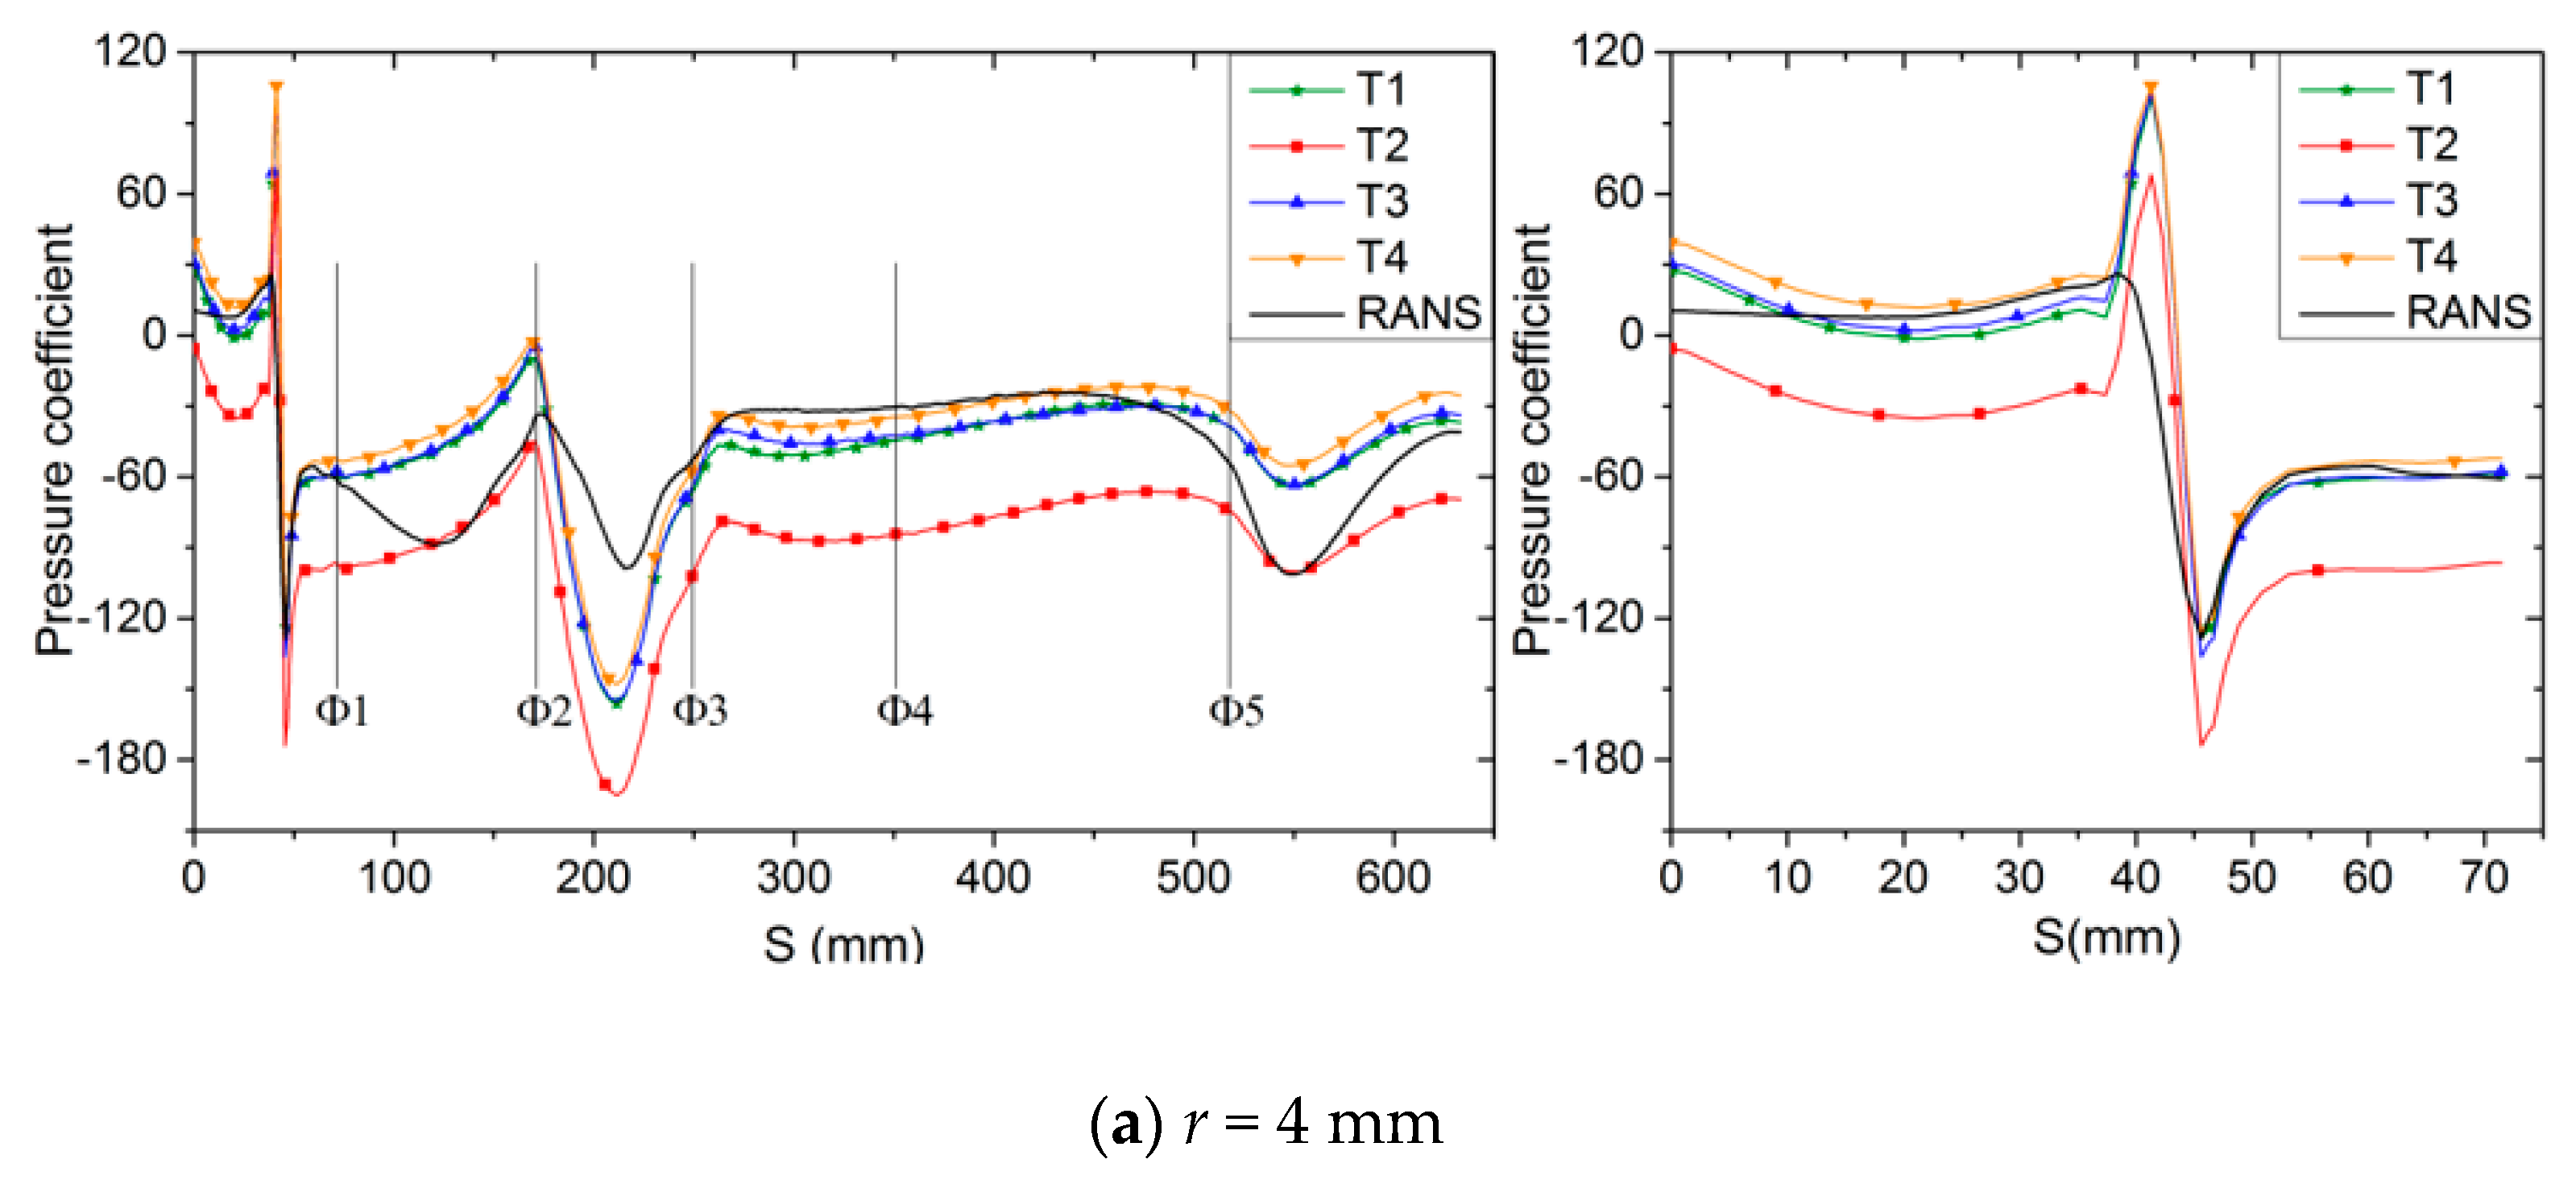
3.4. Near-Wall Flow of the Volute Surface

For the Sirocco fan investigated in this work, the geometry of the volute is modified only for its tongue, while the rest majority part of the volute surface keeps unchanged. In this section, we analyze the near-wall flow of the volute surface to explore how the modification on the volute tongue affects the flow around the whole circumference of the volute. The near-wall flow is studied on the Z = 4 mm axial cross-section close to the central disc at four moments T1, T2, T3 and T4 same as those shown in Figure 8, Figure 9, Figure 10 and Figure 11 and the steady-state RANS result is also provided for comparison. The distributions of pressure coefficient and skin friction coefficient will be given on a local coordinate S along the surface of the volute with the origin chosen at the exit of the volute, as shown in Figure 14a.

3.4.1. Distribution of Skin Friction Coefficient on the Volute Surface

Figure 16 shows the distribution of skin friction coefficient (Cf) around the whole surface of the volute (left subfigure) and the enlarge view for the curves around the volute tongue (right subfigure). For the r = 4 mm model, the magnitude of Cf drastically increases in the volute tongue region and the local near-wall flow is almost steady-state from S = 0 to S = Φ1, as reflected by the overlapping curves of various moments; this indicates that although the flow in the impeller is highly fluctuating (as seen in Figure 8), it hardly impose obvious fluctuation for the near-wall flow of the volute. we have observed two peaks of Cf and one valley in the region around the volute tongue and the magnitude of Cf changes dramatically, This is because it is not only close to the outlet of the volute but also has significant changes in wall structure, so the flow state here is the most complex and diverse. The temporal fluctuation of Cf in the rest part of the volute surface is relatively significant. In the region from Φ1 to Φ2, the magnitude of Cf gradually decreases which indicates the decelerated flow. From Φ2 to Φ3, the magnitude of Cf increases first and then decreases. Since Φ2 and Φ3 are located at the two corners of the bottom of the volute, it suggests that the abrupt change of volute geometry will affect the local near-wall flow. From Φ3 to Φ5, the magnitude of Cf first increases rapidly and then slowly decreases to varying degrees. This variation pattern may be caused by the varied geometry of volute surface from a flat one to a curved one and then gradually varies as an arc and it is also related to the variation of spacing between the impeller and volute surface. In general, in the majority part from Φ3 to Φ5, the variation of Cf is mild as well as the near-wall flow. For the surface at the outlet section of the volute beyond Φ5, the distance between the volute and the impeller is large that the local flow is decelerated, thus the magnitude of Cf also reduces.
For other models of r = 9 mm, 11 mm and 13 mm, the curves of Cf shows a certain degree of temporal fluctuations and the variation pattern is basically consistent with that of r = 4 mm. Comparing the several models, it can be observed that in the range between S = 0 and S = Φ1, there are always two local peaks. The difference is that with decreasing radius, the slope of Cf curve before and after the valley point is higher and the variation is more intense, which indicates that the decreasing radius generates a smaller low-velocity region where the flow is less affected and thus is beneficial to the aerodynamic performance of the fan. Moreover, the magnitude of second peak reduces with increasing radius from about 5.7 at r = 4 mm to 4.7 at r = 13 mm; it means small radius is more likely to produce a high-velocity flow at the initial position of the recirculating flow at the tongue. In the region beyond Φ1, the unsteadiness of near-wall flow is observed to be quite different on the volute surface; substantial fluctuation is found beyond Φ1, Φ3, Φ2 and Φ1 for the four models but the fluctuation is generally the strongest for the r = 4 mm model. The RANS and URANS simulations have generally consistent predictions on the variation of Cf around the volute surface especially in the region beyond Φ1. There is a significant gap between the results of two approaches in the region from S = 0 to S = Φ1 and the RANS approach fails to capture the two peaks, which demonstrates that although RANS could only depict the general variation of near-wall flow but not capable for the details in the region with great geometrical variation.

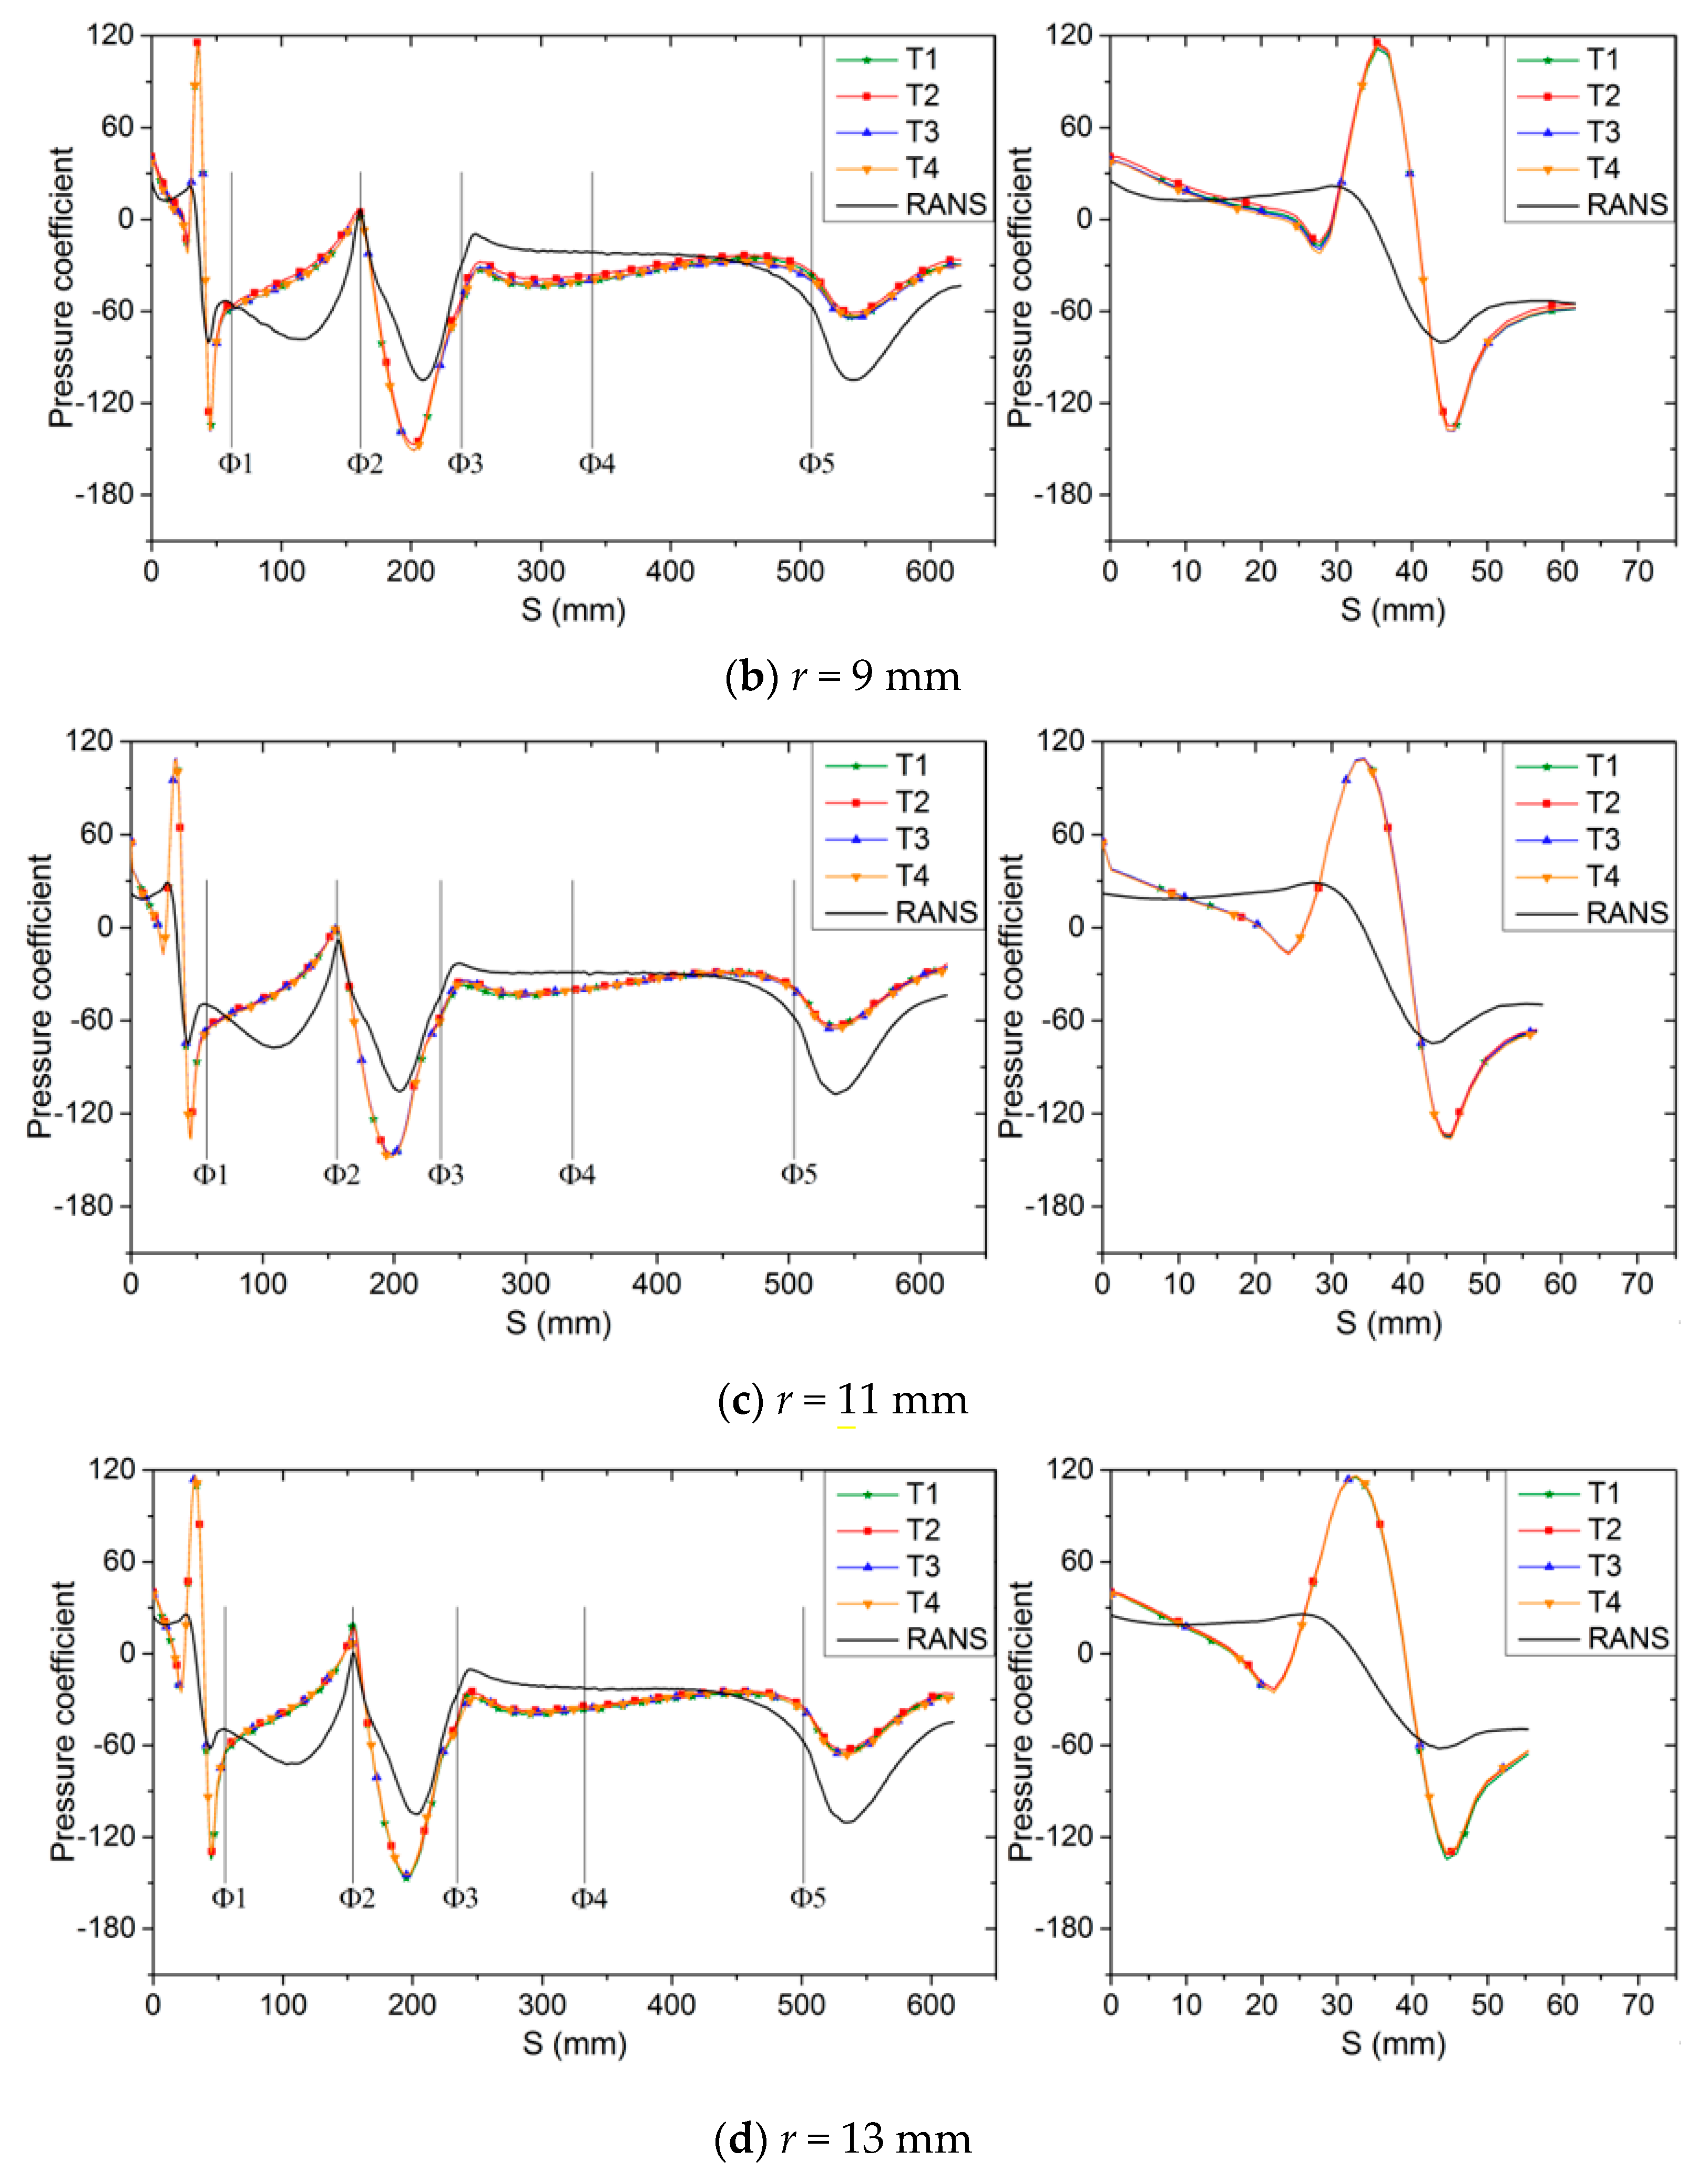
3.4.2. Distribution of Pressure Coefficient on the Volute Surface

The near-wall flow of the volute surface is greatly affected by the pressure gradient field. Figure 17 shows the distribution of pressure coefficient (Cp) around the whole surface of the volute (left subfigure) and the enlarge view for the curves around the volute tongue (right subfigure). For the r = 4 mm model, the distribution of Cp varies generally as a whole in time, that is, the magnitude of Cp at different position synchronously increases or decreases, which indicates that the pressure on the volute surface has obvious unsteady characteristics during the whole cycle of the revolution of impeller. In the region from S = 0 to S = Φ1, there is noticeable fluctuation of Cp compared with the quasi-steady Cf, while the pressure gradient field, as measured by the slope of the curve, does not vary a lot during the whole cycle, thus the velocity of near-wall flow does not show remarkable temporal variation. From the peak value at S = 0, favorable pressure gradient (FPG) with a sharp decrease and then a relatively slow decrease of pressure deteriorates the movement of flow towards the outlet of volute. The APG field from the valley to Φ1 will accelerates the near-wall flow. At the volute tongue, the sharp increase and decrease of Cp clearly show the pressure variation characteristics under the impact of the flow. There is an adverse pressure gradient field (dp/ds > 0) from Φ1 to Φ2 which is detrimental to the movement of the near-wall flow and may even cause flow separation. From Φ2 to Φ3, the pressure coefficient first decreases and then increases, indicating that the flow velocity may be accelerated and then decelerated in this region. In the region from Φ3 to Φ5, the magnitude of Cp varies relatively smoothly with only minor increase. It is found that the distance between the volute surface and the impeller gradually expands within this region, the geometry of the volute surface abruptly changes from a flat surface to a curved surface and then slowly changes to an arc, which makes the flow smooth in this region. In the region after Φ5, the magnitude of Cp decreases and then increases again until the outlet of the volute because the distance between the impeller and the volute surface increases rapidly which reduces the pressure. For other three models, the variation of Cp is similar to that of the r = 4 mm model.
Comparing the Cp distribution of four models, it can be seen that the variation is quite similar for the r = 9–13 mm models where the temporal variation is negligible, while the highly fluctuating flow induce noticeable pressure fluctuation for the r = 4 mm model which is consistent with the observations in Figure 8. Around the volute tongue, the Cp curve has the steepest increasing and decreasing trend, while the variation is less pronounced for other three models.
The variation of Cp has similar pattern as predicted by RANS and URANS approaches although the magnitude deviates to some degree; the steady-state RANS result could generally reflect the variation but the magnitude is still not accurately predicted even for the r = 9–13 mm models where the flow is quasi-steady.

3.5. Staic Pressure Fluctuation and Its Propagation

From the discussions above, we can conclude that the fluctuation of flow is dependent on the volute tongue radius and is different in the impeller or in the volute. To further analyze the static pressure fluctuation, a series of static pressure monitoring points are set on the Z = 4 mm axial cross-section near the central disc where the time history of pressure are recorded during the 8th to 10th revolution in the URANS simulation, as shown in Figure 18. The monitoring points are located in the region where the temporal variation of local flow is significant and can be compared to reveal the propagation of the fluctuation. Monitors A/B/C1/D1 are set along the circumference of impeller with a radius of 70.5 mm (the outer diameter of the impeller is 70 mm) to analyze the circumferential variation of pressure. Monitors C1/C2/C3 and D1/D2/D3 are respectively set in the 270° and 360° directions of the coordinate system. The distance between C1, C2 and C3 is 14.8 mm and the distance between D1, D2 and D3 is 20.8 mm. These monitors are chosen to analyze the time history of static pressure in radial direction between impeller and volute. In order to analyze the influence of volute tongue radius on the surrounding flow, monitors F and E are set at the exit of the impeller close to the volute tongue and the pressure fluctuation data at monitor A is also used for analysis. On the surface of the volute tongue, the apex H and two points G and I where the curved section connects with the straight sections tangentially are selected to analyze the pressure fluctuation of the volute tongue region.

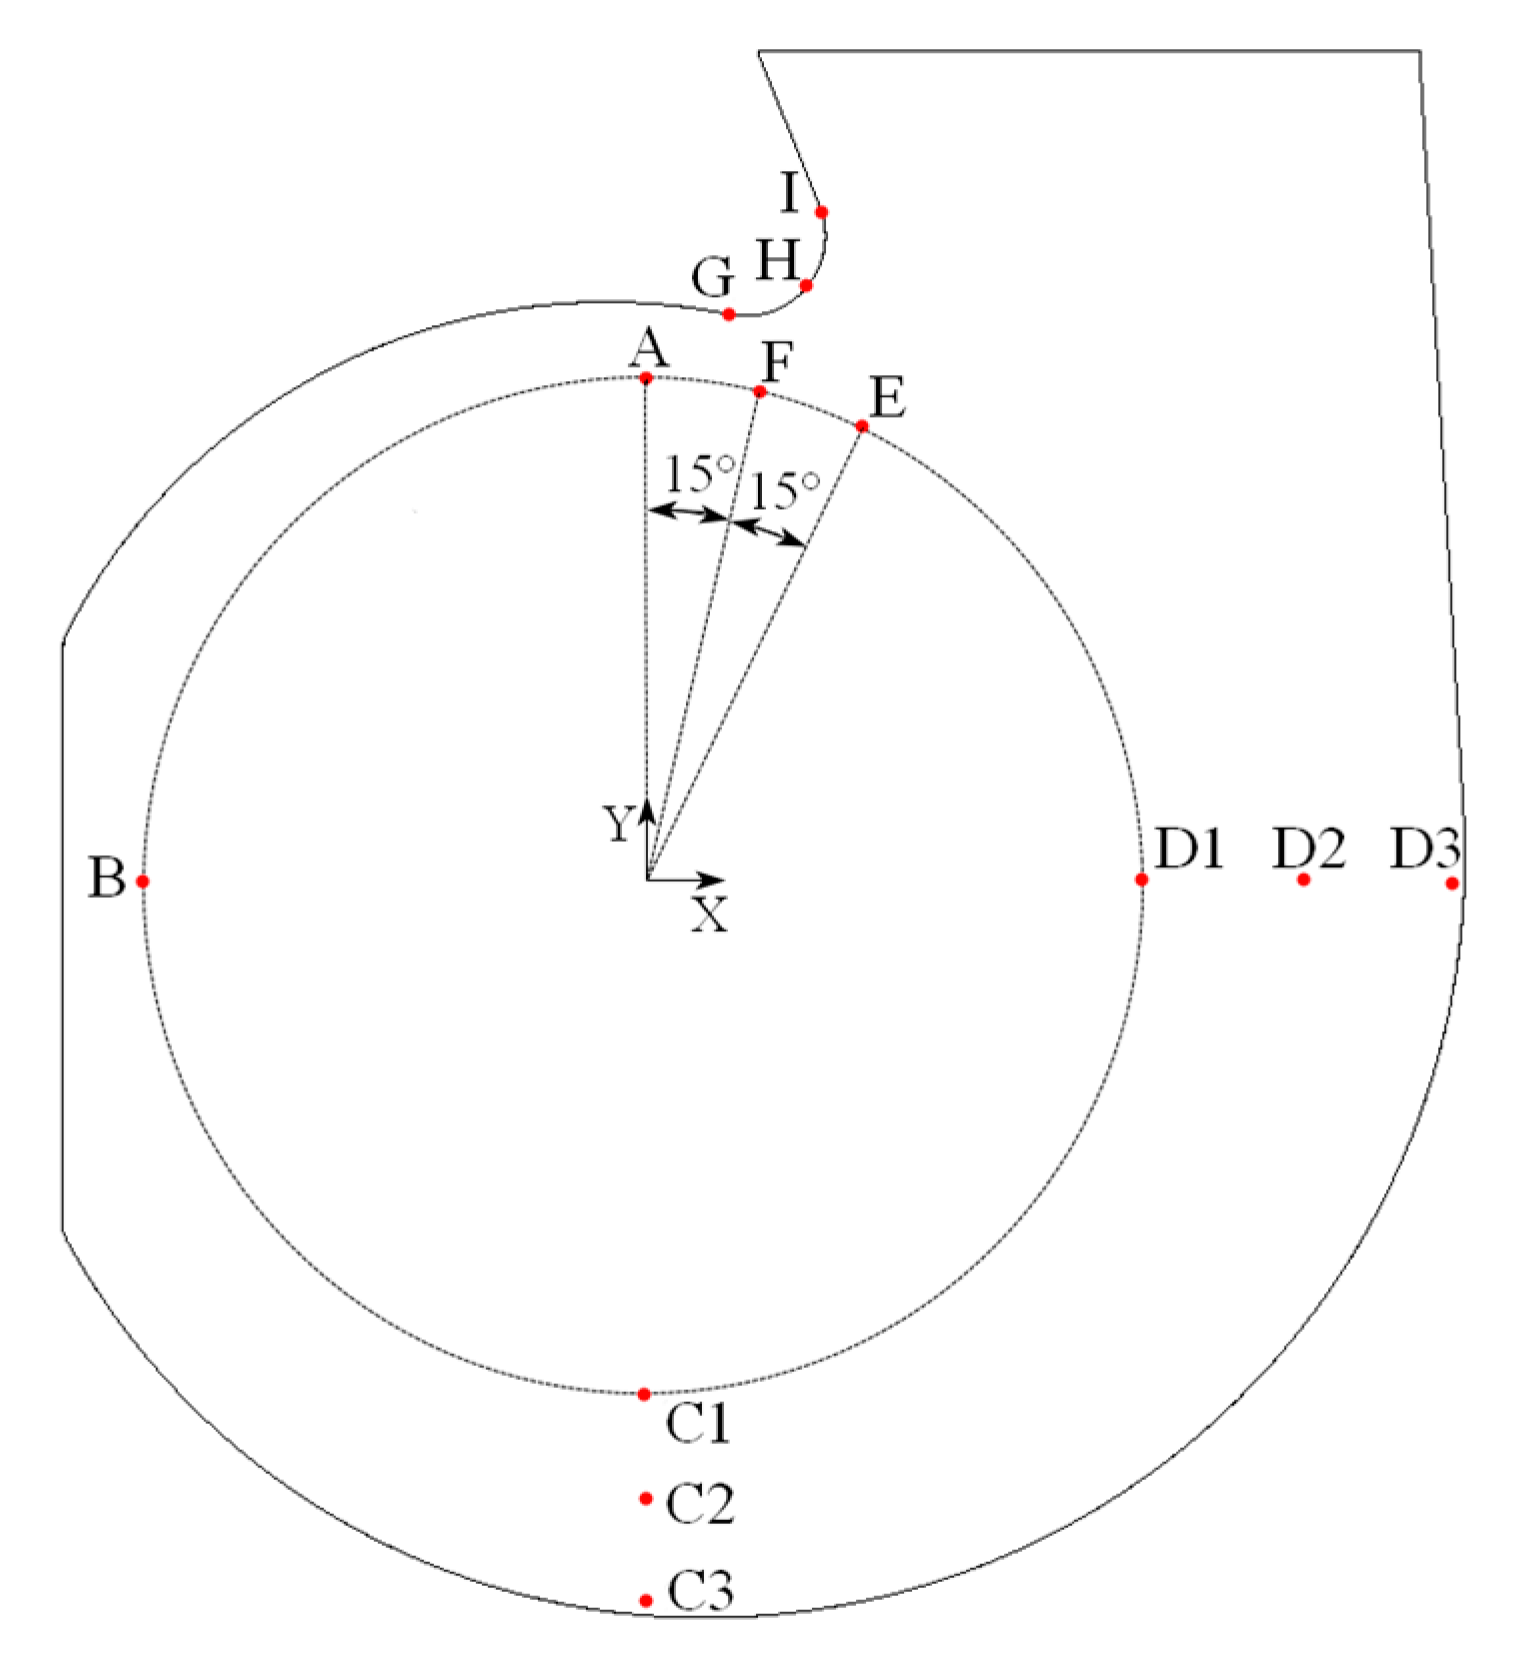
3.5.1. Static Pressure Fluctuation along the Circumference of the Impeller Outlet

Figure 19 shows the time history of pressure at monitors A/B/C1/D1 along the circumference of the outlet of the impeller. It is seen that for the r = 4 mm model, the pressure exhibits a remarkable fluctuating mode at all four monitors; three periods with large amplitudes are observed corresponding to the three revolutions of the impeller. The remarkable fluctuation shows different patterns at the various monitors. However, for the r = 9 mm, 11 mm and 13 mm models, the fluctuating amplitude is greatly reduced for all monitors; the pressure actually fluctuates in a quasi-periodic mode with the number of period during one revolution of impeller equals to the number of blades. The fluctuation at the four monitors shows obvious differences; the amplitude is the maximum for monitor-A and minimum for monitor-B and is mild for monitor-C and monitor-D. This indicates that the unsteadiness of pressure is greatly weakened as the monitor is away from the volute tongue, while the weakening is not proportional to the distance from the monitor to volute tongue but also depends on the interaction of impeller and volute.
The time-averaged value of pressure is also affected the volute tongue radius. For monitor-A, the time-averaged pressure is relatively higher for the r = 4 mm and 9 mm models and lower for other two but the difference is minor. The time-averaged value for the r = 4 mm model is always the lowest for other three monitors. Although the volute is modified only around the tongue, it does have influence on the flow in the volute far away from the tongue through an indirect way; as the volute tongue radius decreases, the time-averaged pressure at the outlet of the impeller close to the volute tongue is increased, while decreased to a certain extent at other three monitors away from the volute tongue.
Considering the volute geometry exemplified in Figure 18 and the URANS data of radial velocity in Figure 15, it can be found that the radial velocity is near zero in the blade passages corresponding to monitor-A (around 52°), while it increases to around 3 m/s at monitor-B (around 140°) which results in the decreasing pressure from monitor-A to monitor-B. However, the magnitude of radial velocity in the blade passages further increases to 4.5 m/s at monitor-C1 (around 230°) and the pressure is also increased; this may be caused by the significant increase in the distance between impeller and volute. From point C1 to point D1 (around 325°), although the distance is increased to a certain extent than that at point C1, the radial velocity in the blade passages changes from 4.5 m/s to 8 m/s, so the pressure at point D1 may be more affected by the radial velocity which reduces the local pressure.
For the pressure at the present monitors, the pressure obtained by RANS is normally far deviated from the time-averaged URANS result. The pressure computed by RANS is normally over-predicted for monitor-A, -B and -C1 but is under-predicted by monitor-D and the relative difference can be up to about 30%. For the volute with small tongue radius such as r = 4 mm, the minimum relative difference is found at the monitor near the volute tongue, while for other models well consistency is found at monitor-C1 which is the furthest away from the volute tongue.

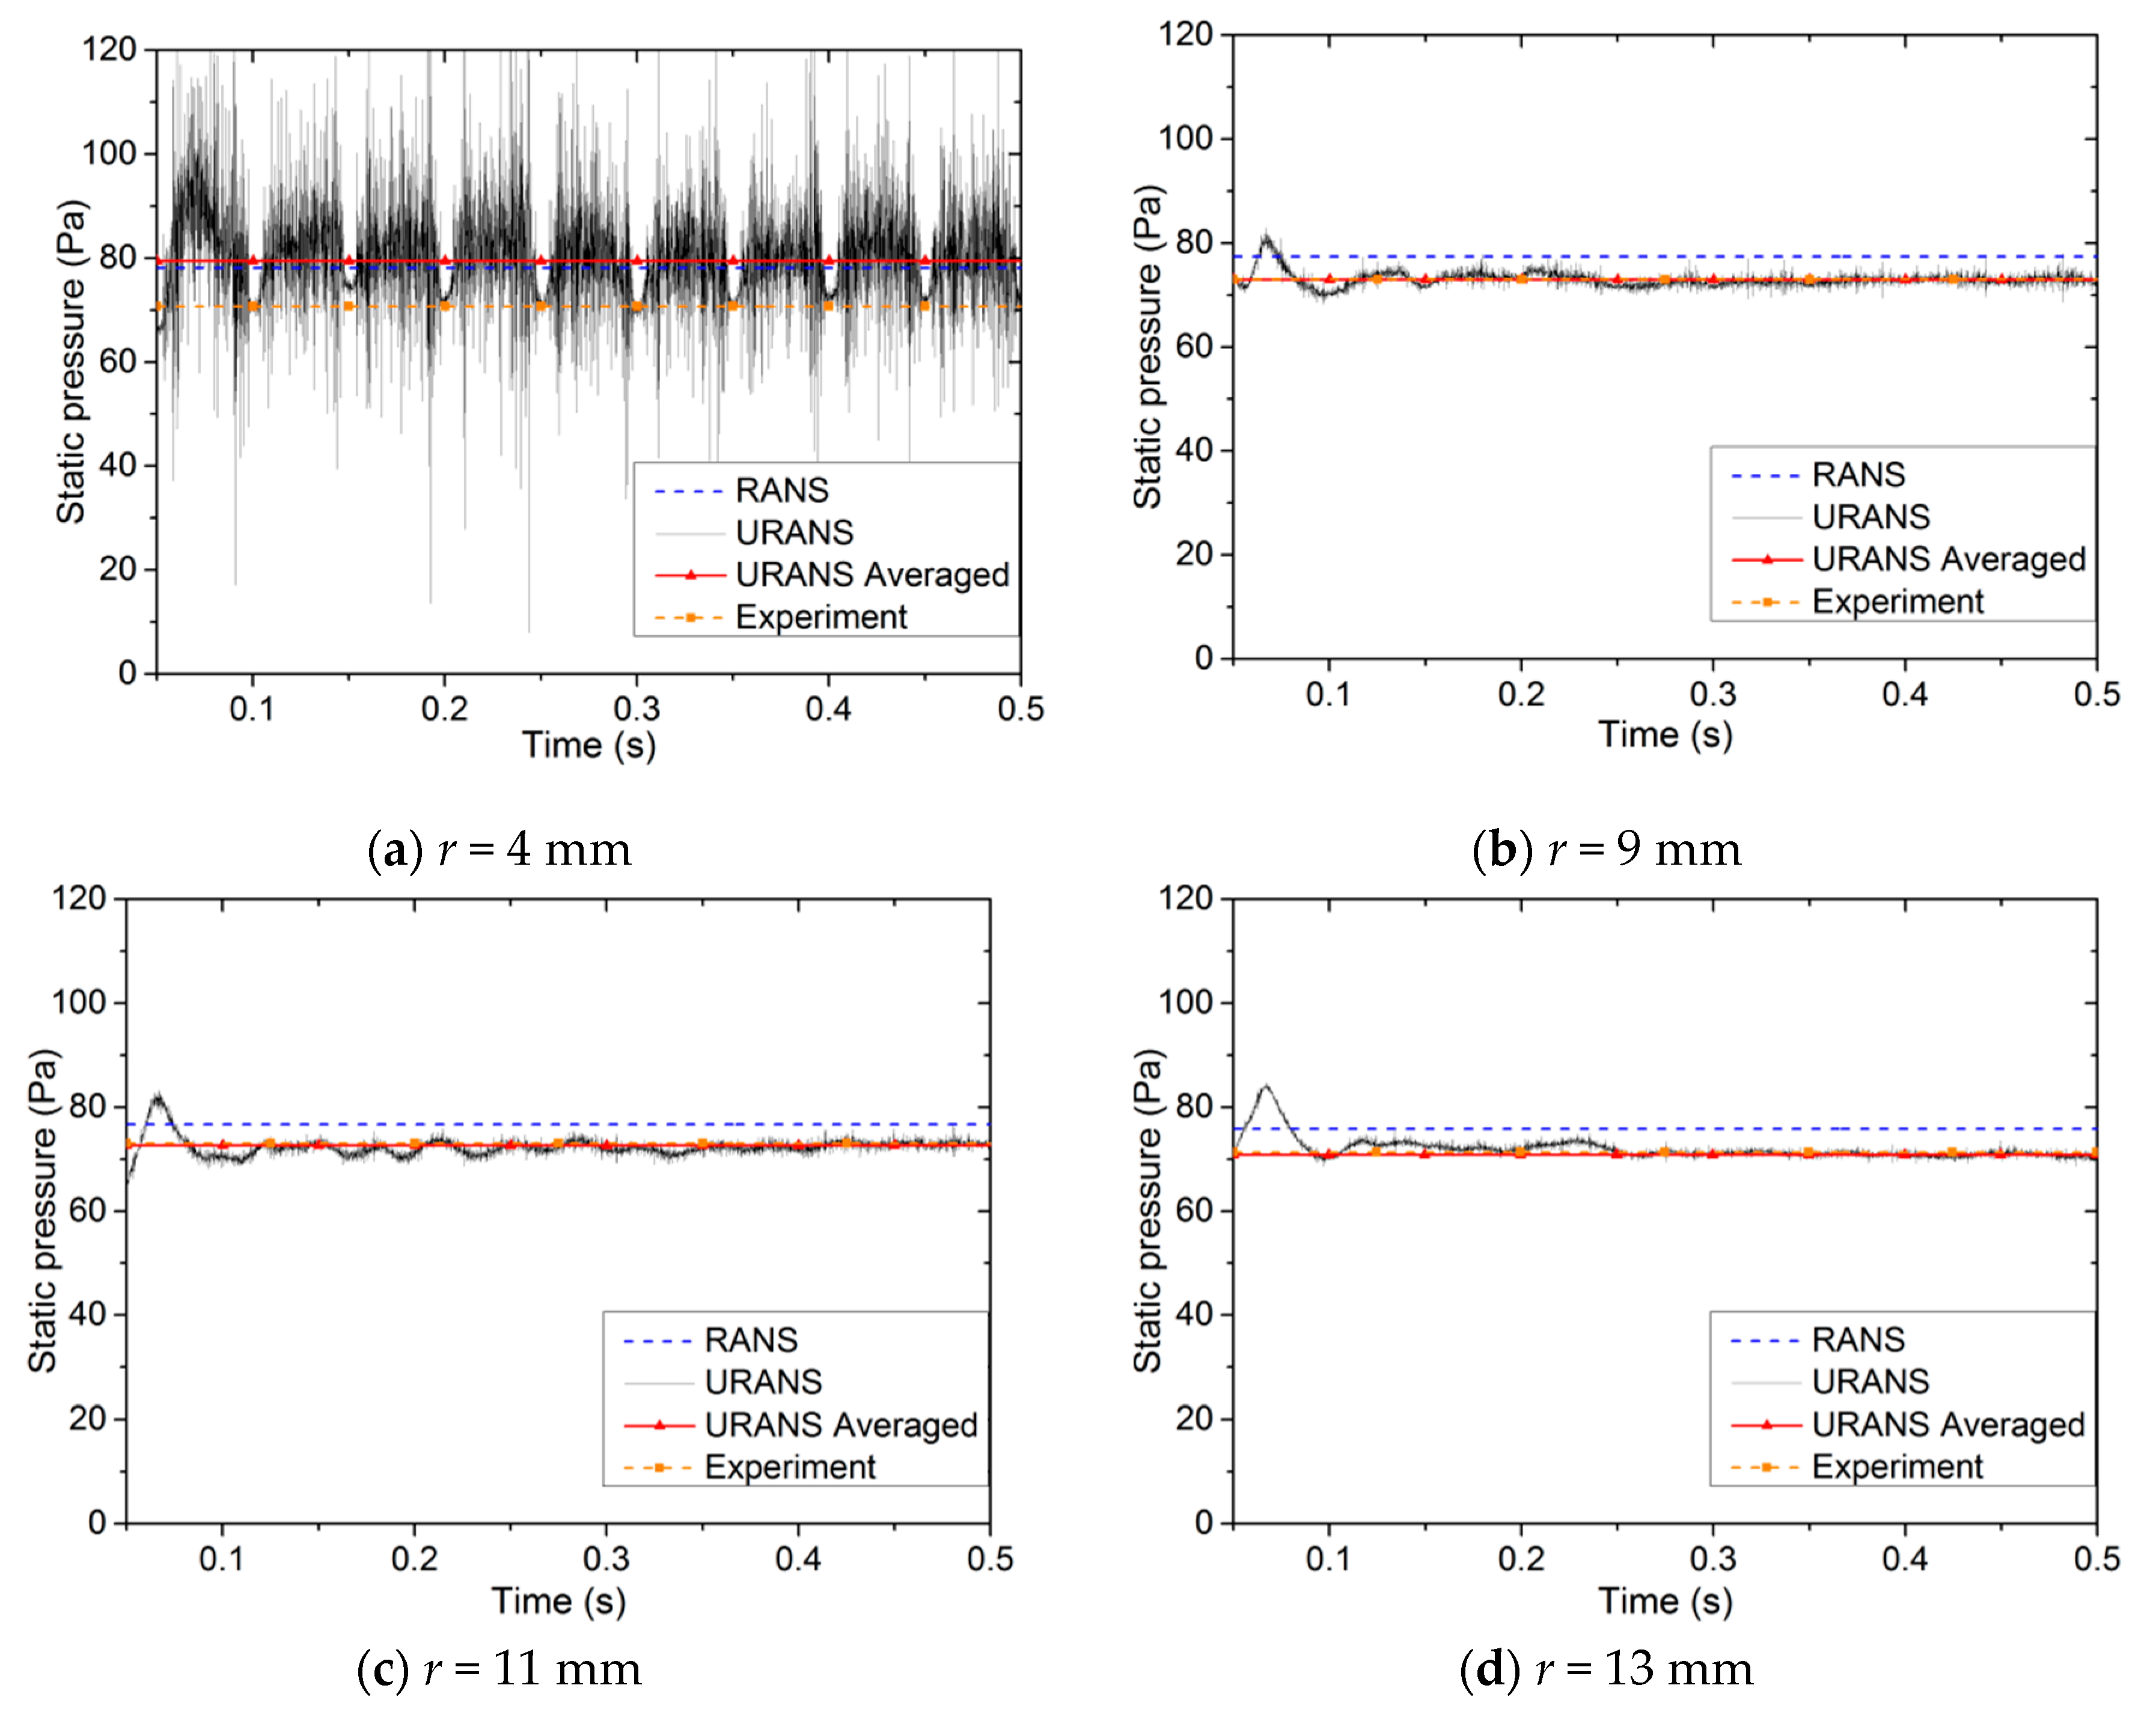
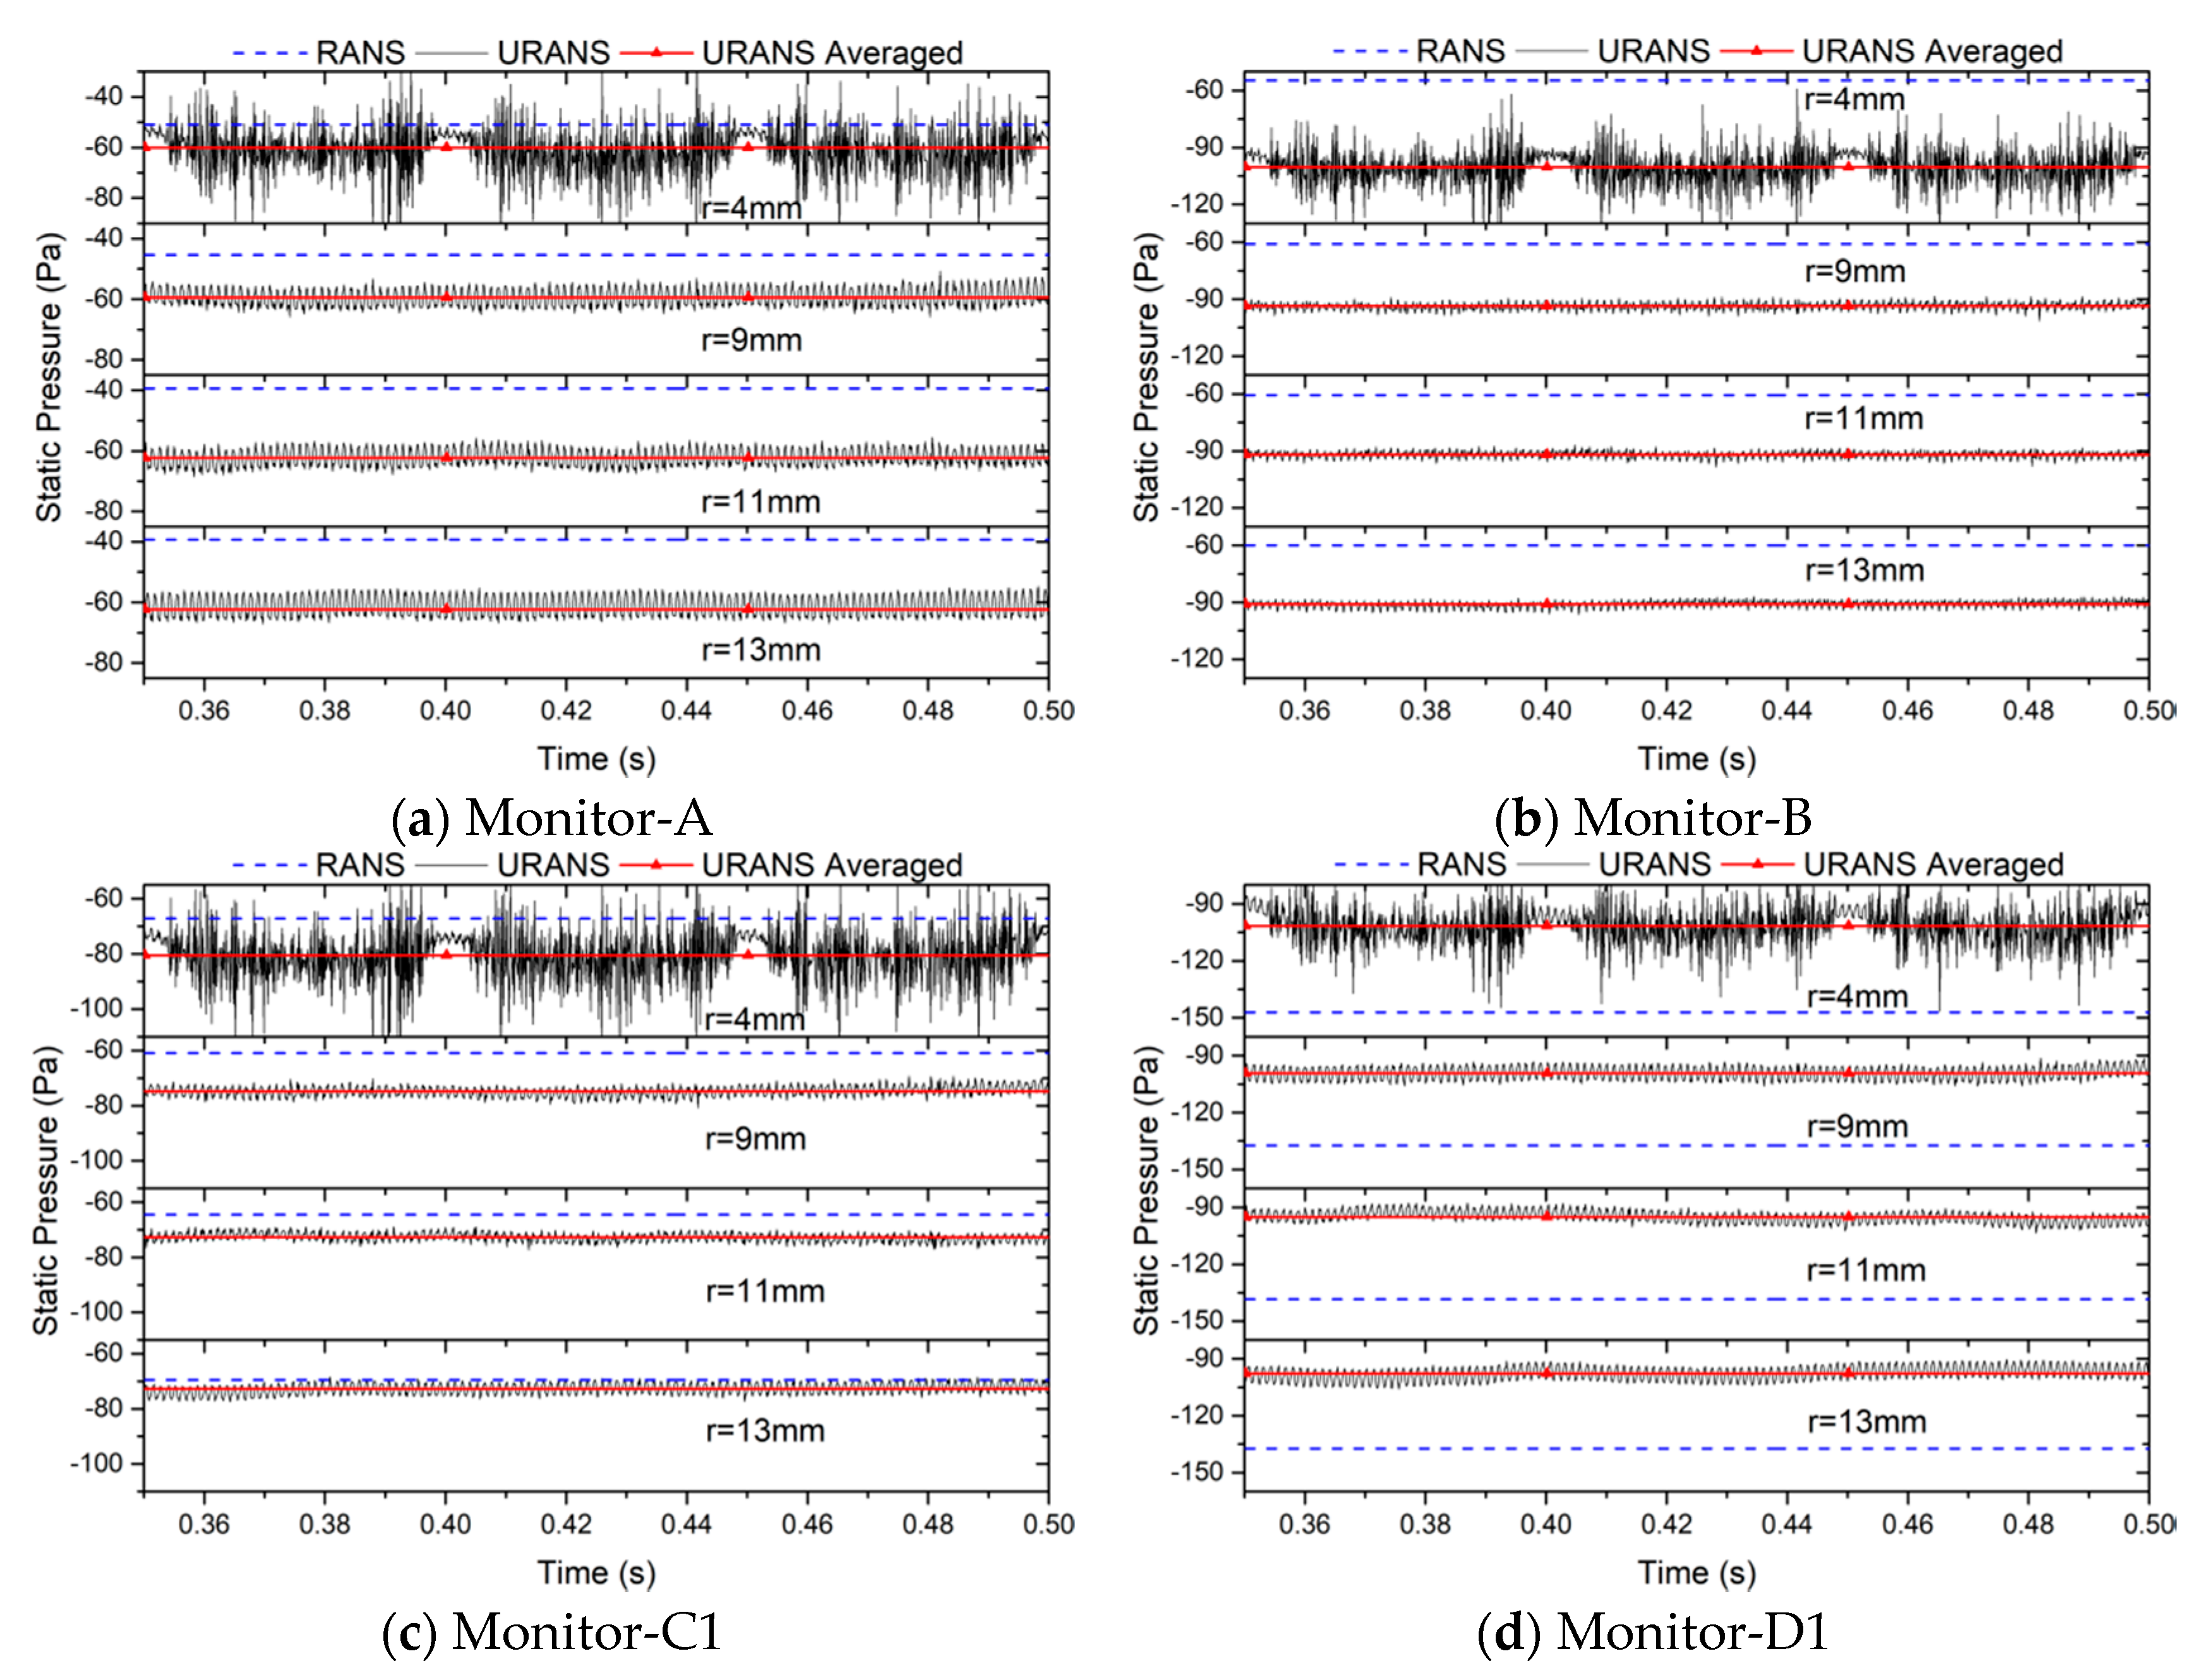
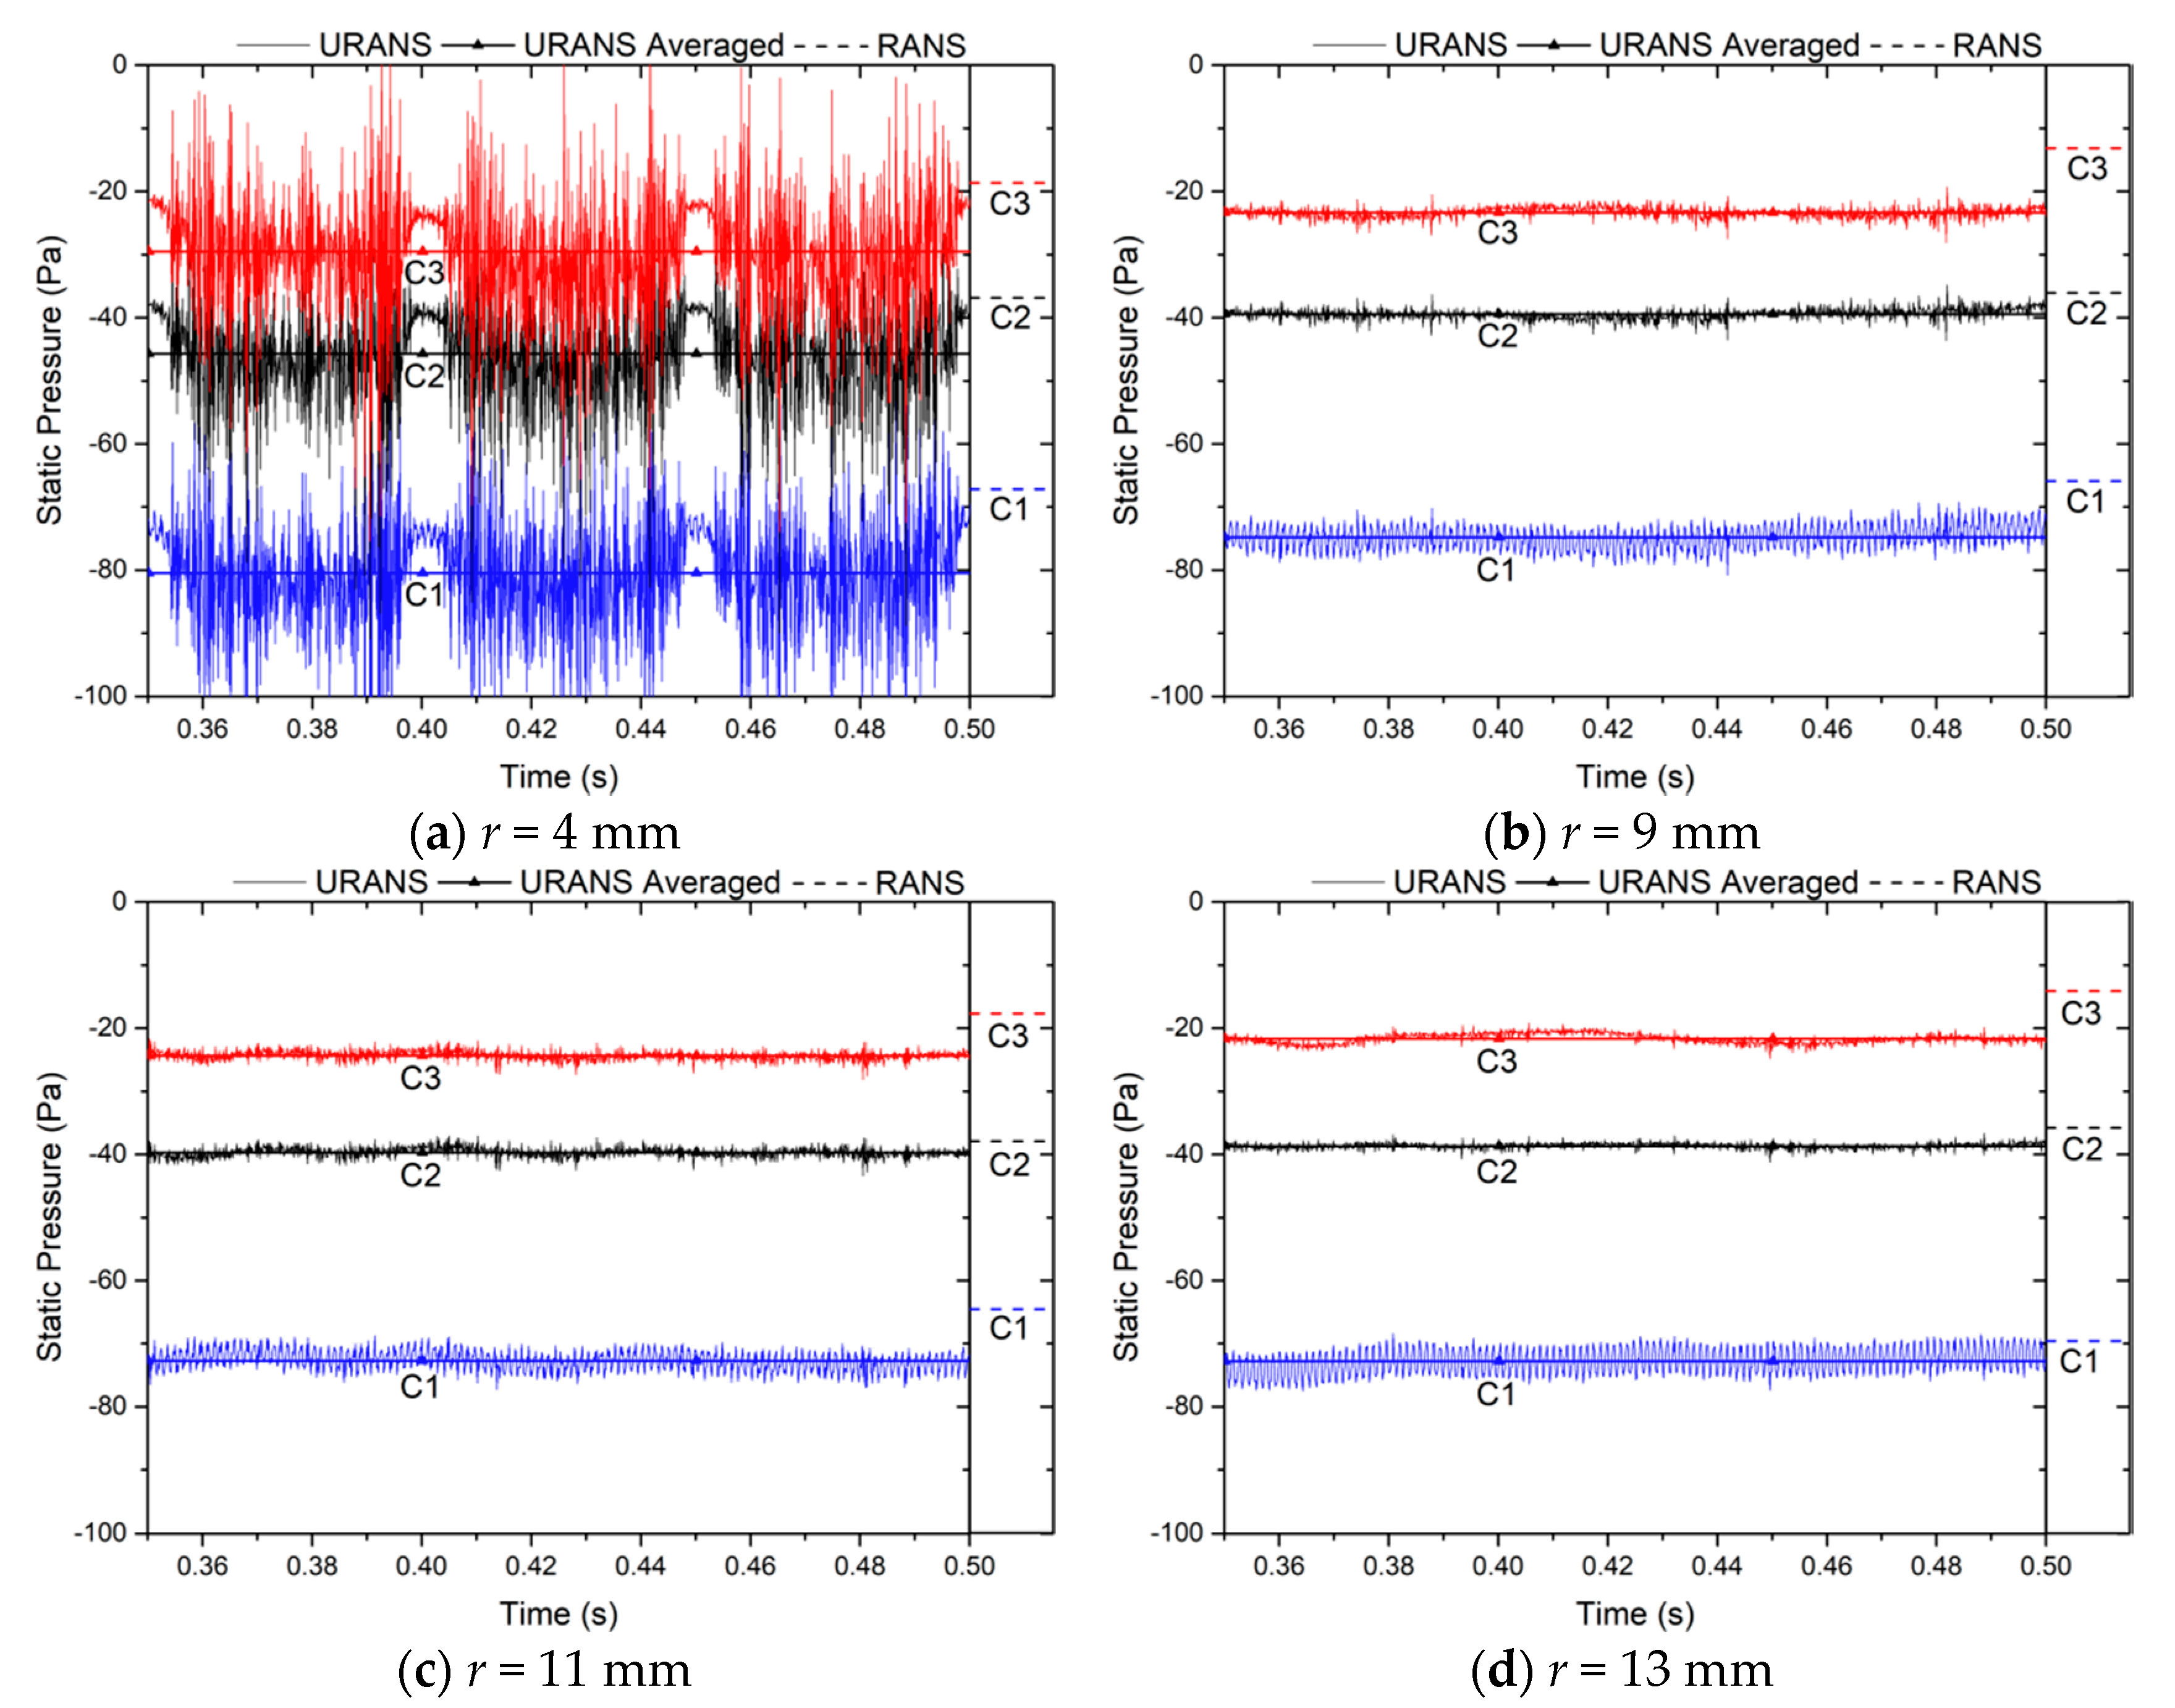
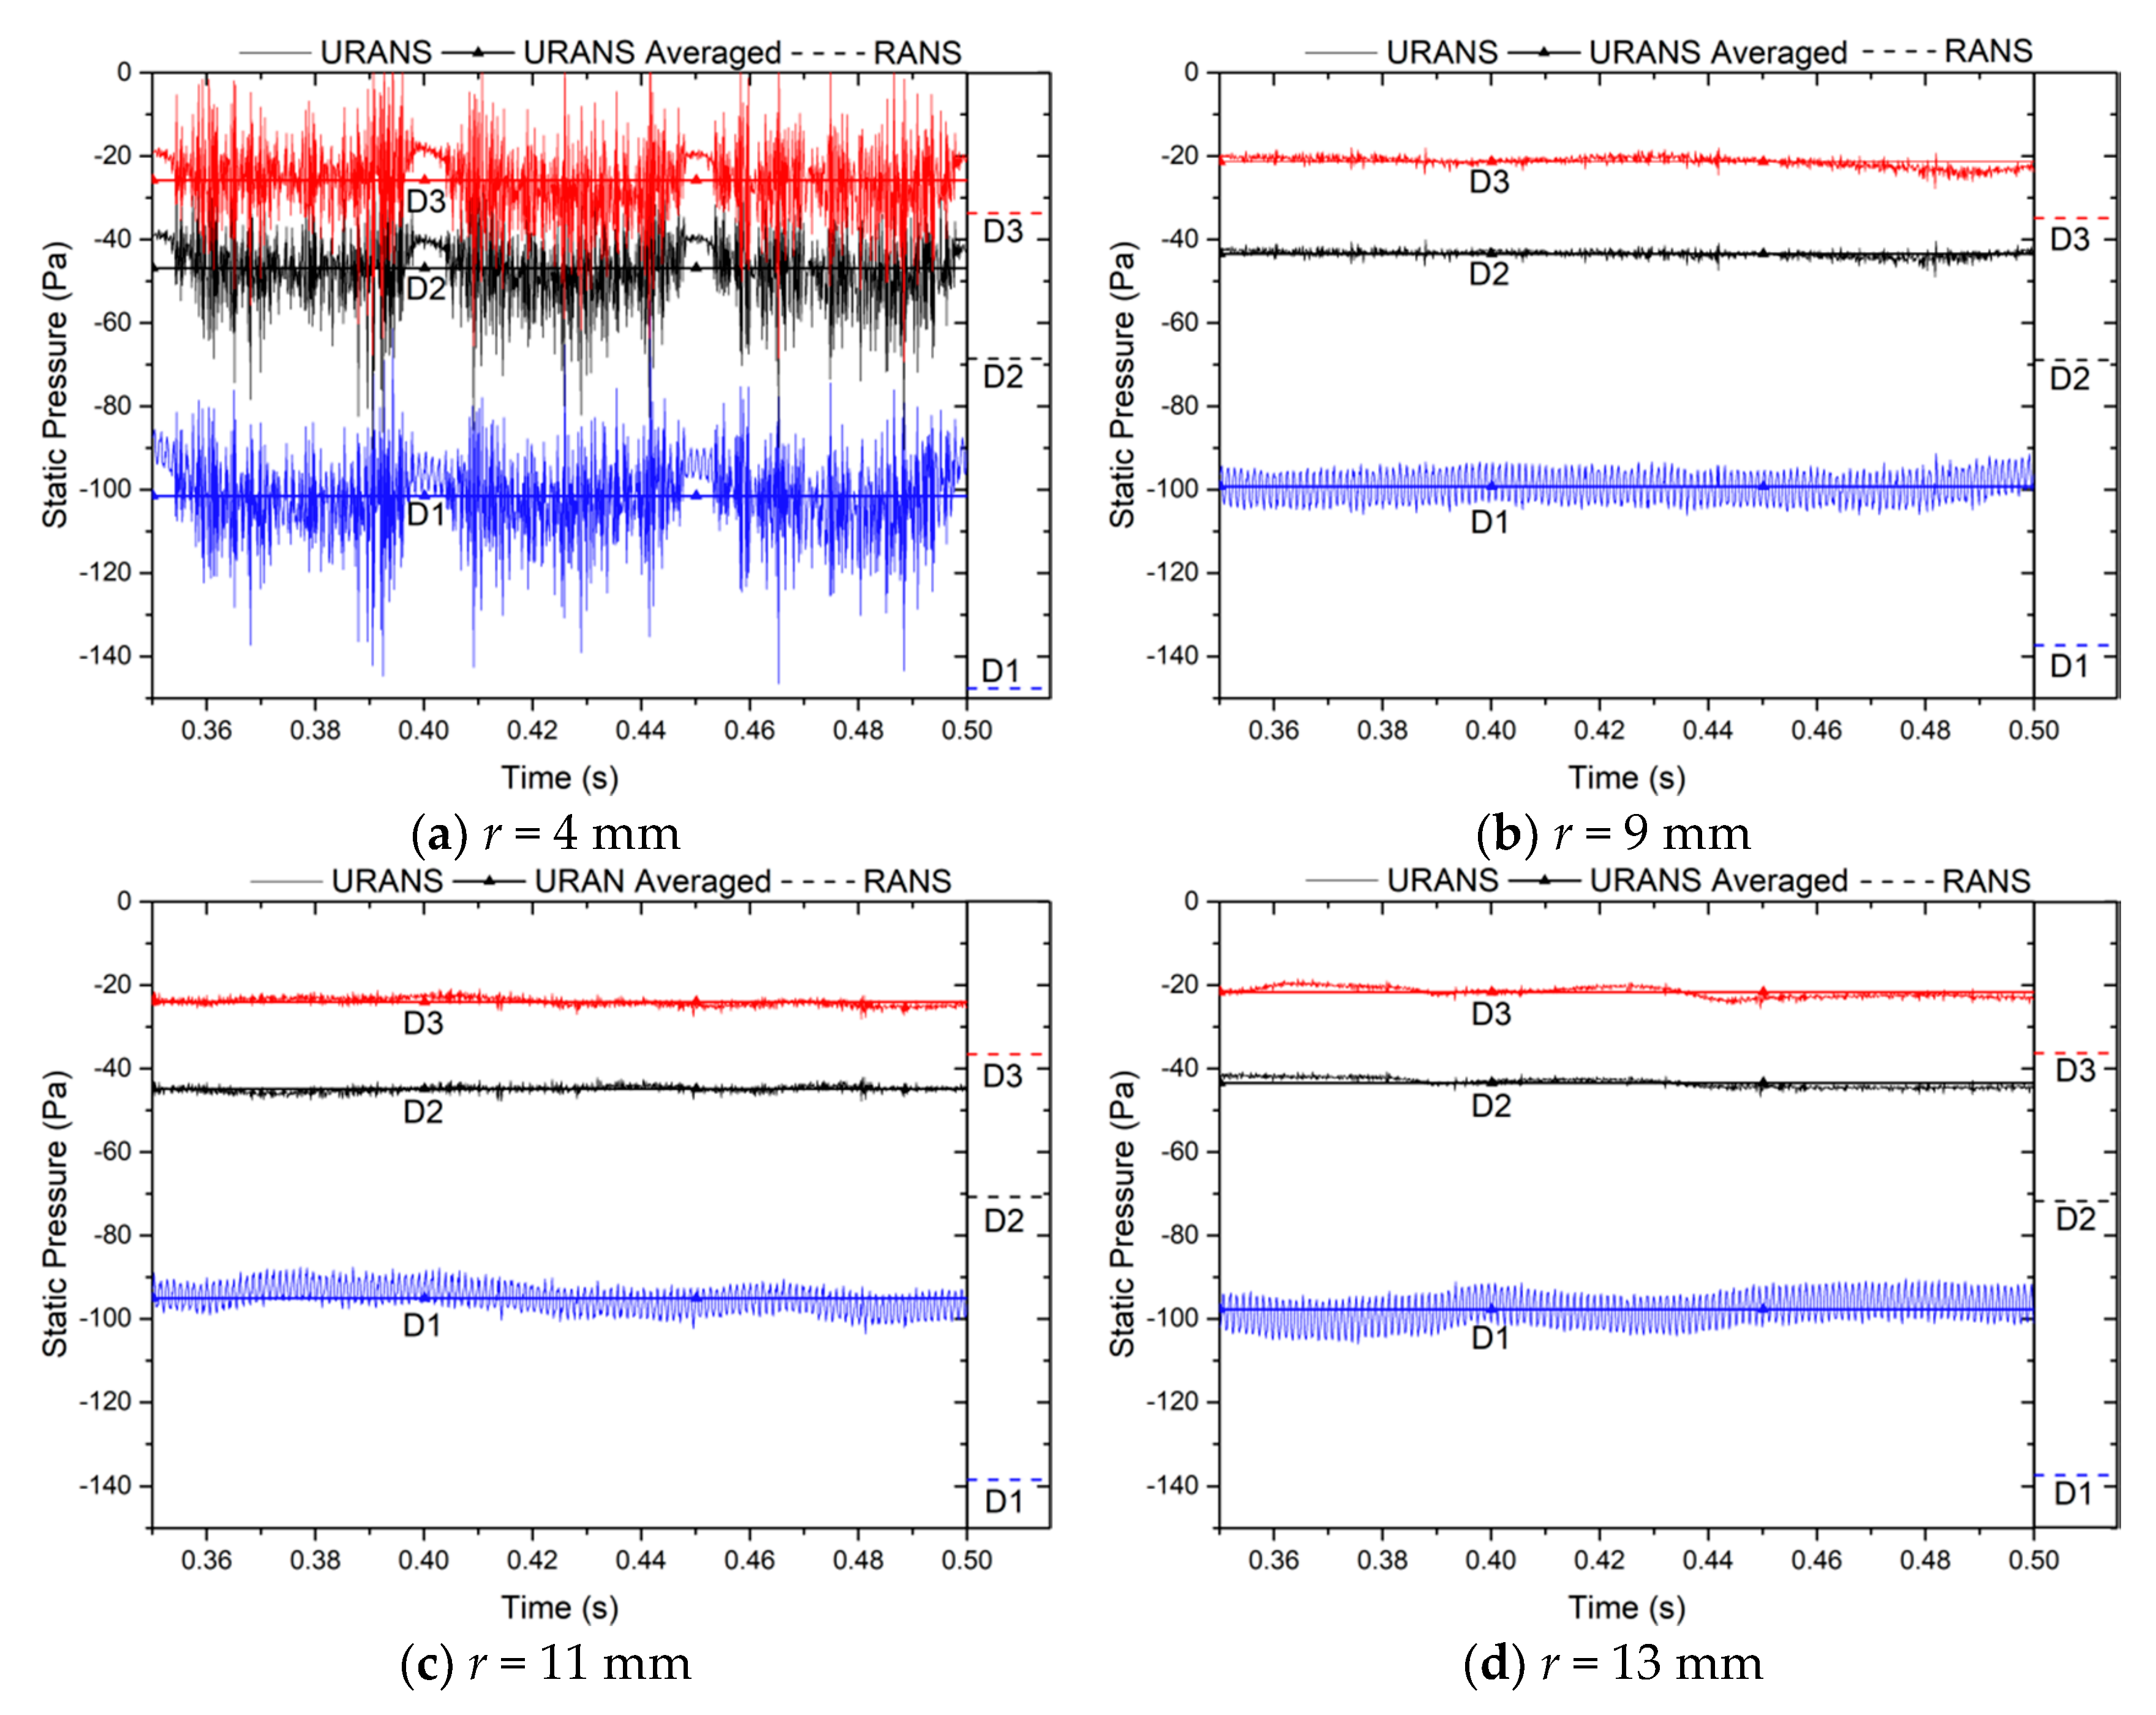
3.5.2. Static Pressure Fluctuation along the Radial Direction in the Volute

The comparison of pressure fluctuation monitored at C1/C2/C3 reflects the influence of volute tongue radius on flow far away from it, as given in Figure 20. It is seen that generally, the pressure presents strong fluctuation at all three monitors for the r = 4 mm model and quasi-periodic fluctuation is clearly seen corresponding to the three revolutions of the impeller. The fluctuation reduces significantly for monitors of other three models. This indicates that although only the volute tongue is modified, it induces the variation of local flow with would further affect the flow in the whole volute in an indirect way.
The time-averaged pressure does not vary a lot for different models but is greatly dependent on the radial position of the monitor. For each model, the time-averaged pressure is the lowest for monitor-C1 which locates near the volute outlet and increases as the flow moves outwards toward the volute where the pressure is recovered from the kinetic energy of fluid. For the r = 9 mm, 11 mm and 13 mm models, the amplitudes of pressure fluctuation of monitor-C2 and -C3 are similar and are much smaller than that of monitor-C1, which reveals that the fluctuation of near-wall of the volute surface is greatly damped via viscous mechanism by the wall.
By comparing the results obtained by RANS and URANS, it is found that the RANS simulation normally over-predicts the pressure at all monitors. The degree of over-prediction is larger for the model with smaller tongue radius as the flow has stronger unsteadiness and is relatively larger for monitor-C1 since the jet-wake structure for the outflow of impeller is inherently unsteady and could not be revealed by RANS.
The time-history of pressure for flow towards the outlet of the volute is represented by monitors D1/D2/D3 as shown in Figure 21. It is seen that substantial fluctuation of pressure appear for the r = 4 mm model, while the fluctuation is greatly attenuated for other models. For each model, the pressure is the highest for the monitor close to the volute surface and lowest close to the impeller, the same variation tendency as the monitors C1/C2/C3. The amplitude of fluctuation is also the largest for monitor-D1 where the unsteady flow out of the impeller dominates. As the volute tongue radius increases, the fluctuating amplitude does not vary much at all in monitors for the r = 9 mm, 11 mm and 13 mm models. For the data obtained by monitors D1/D2/D3, it is different from those of C1/C2/C3 that the steady-state RANS simulations always under-predict the time-averaged pressure especially for monitor-D1 which is the closest to the outlet of impeller.

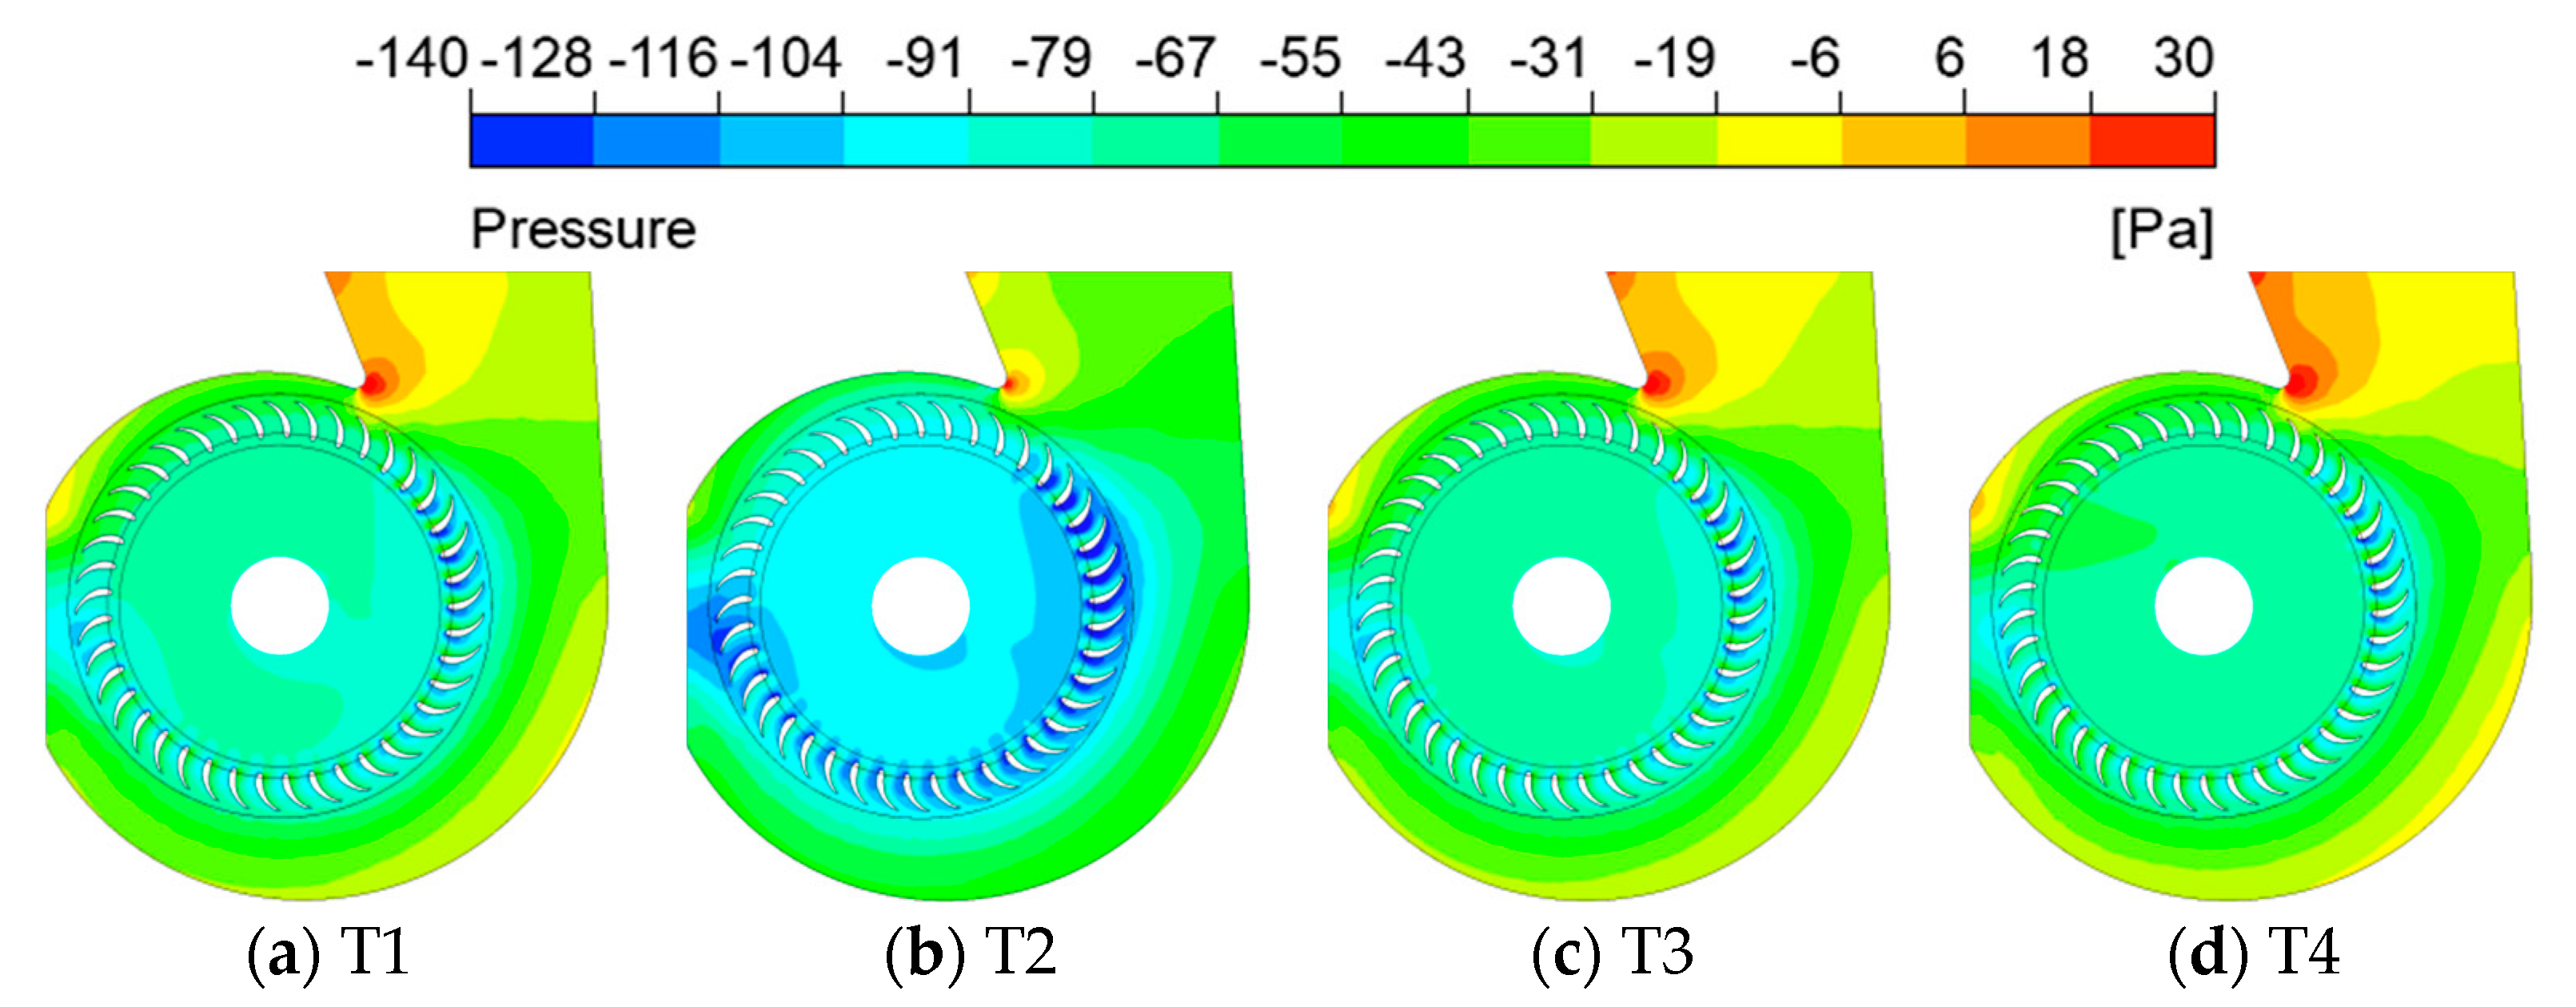
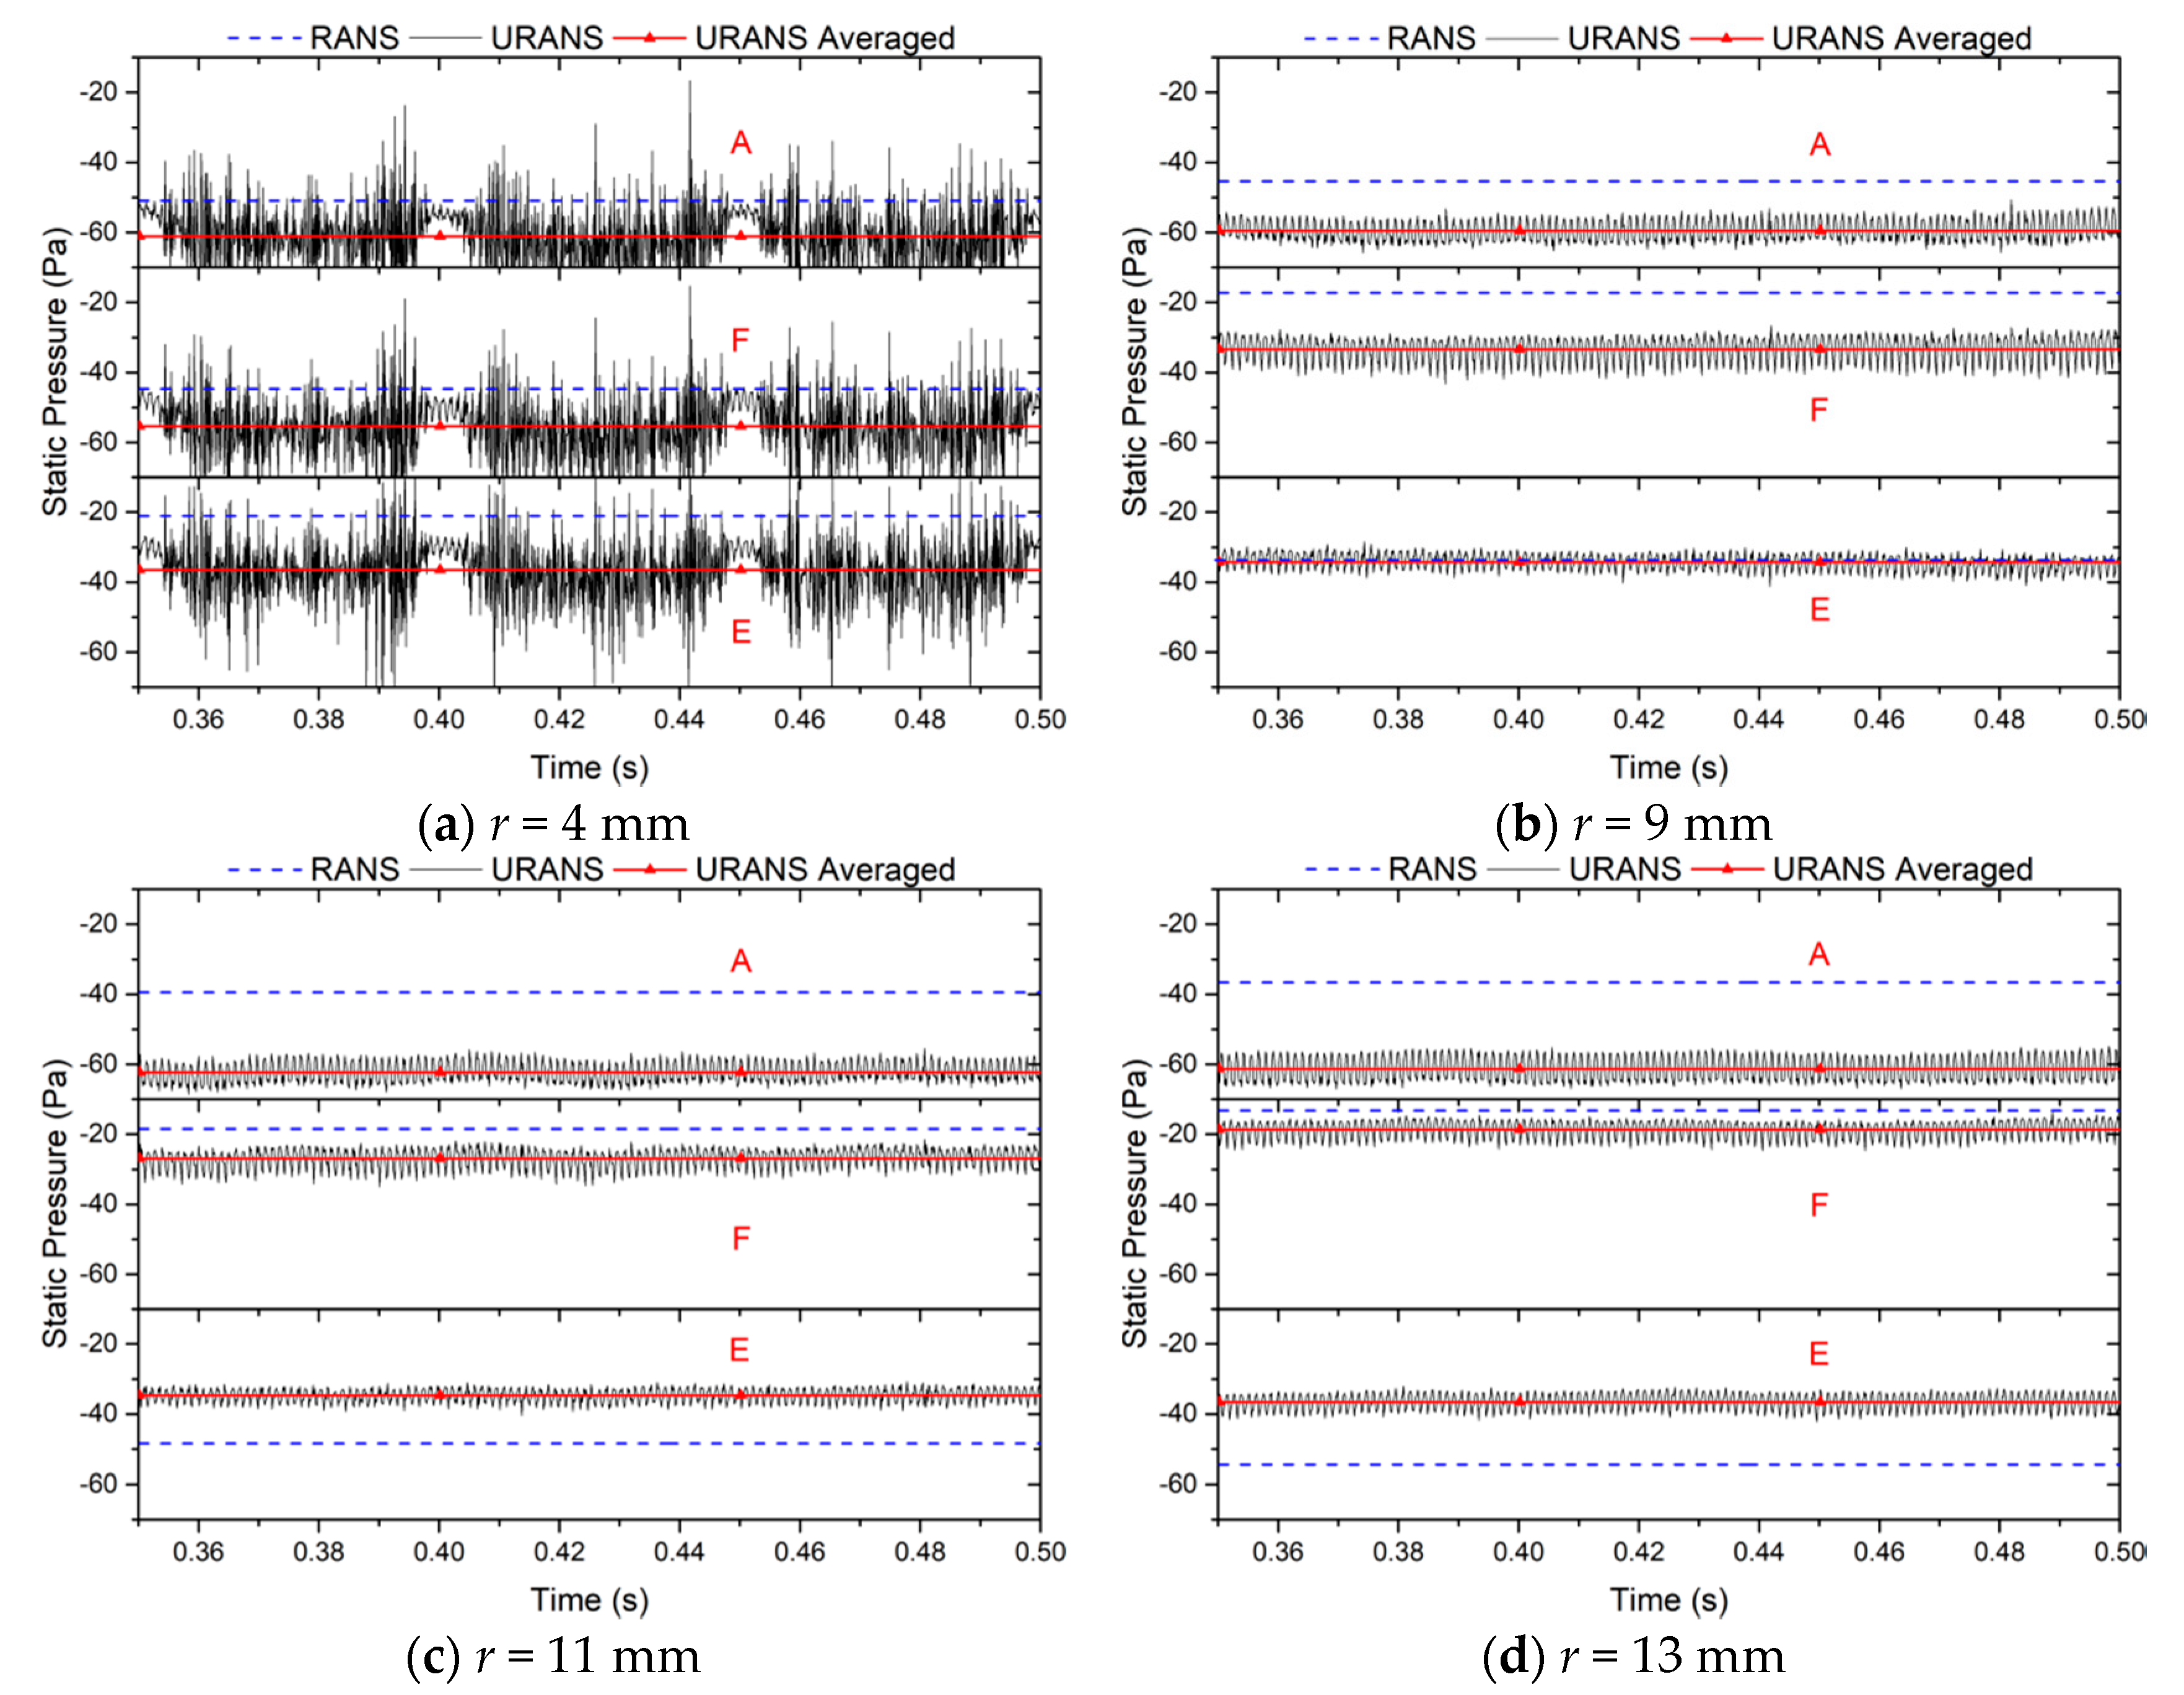
3.5.3. Static Pressure Fluctuation Near the Volute Tongue

Since the flow moving out of the impeller will directly impinge on the volute tongue in the region around monitor-A, here we present and discuss the pressure fluctuation at monitors A/F/E in Figure 22 which are located at the outlet of the impeller and around the volute tongue. The time-averaged pressure is the lowest at monitor-A and highest at monitor-E for the r = 4 mm model, while for other models the value can be higher for monitor-E or -F depending on the volute radius and the difference is relatively smaller. This is partially attributed to the modification of volute tongue geometry that as its radius decreases, the flow patterns at monitor-E approach to that of monitor-F since monitor-E is also blocked by the volute tongue. Consequently, the position of the highest pressure at the outlet of the impeller near the volute tongue also changes accordingly, that is, distance between the circumferential position at the outlet of impeller with highest pressure and the volute tongue is almost fixed. Although there is a certain degree of difference between RANS and URANS results, we find RANS usually over-predict the pressure at monitor-A and -F and the magnitude of over-prediction gets remarkable as the volute tongue radius increases. For the flow at monitor-E, the predicted pressure of RANS is higher than that of the time-averaged URANS data for the r = 4 mm model and lower for r = 11 mm and 13 mm models.

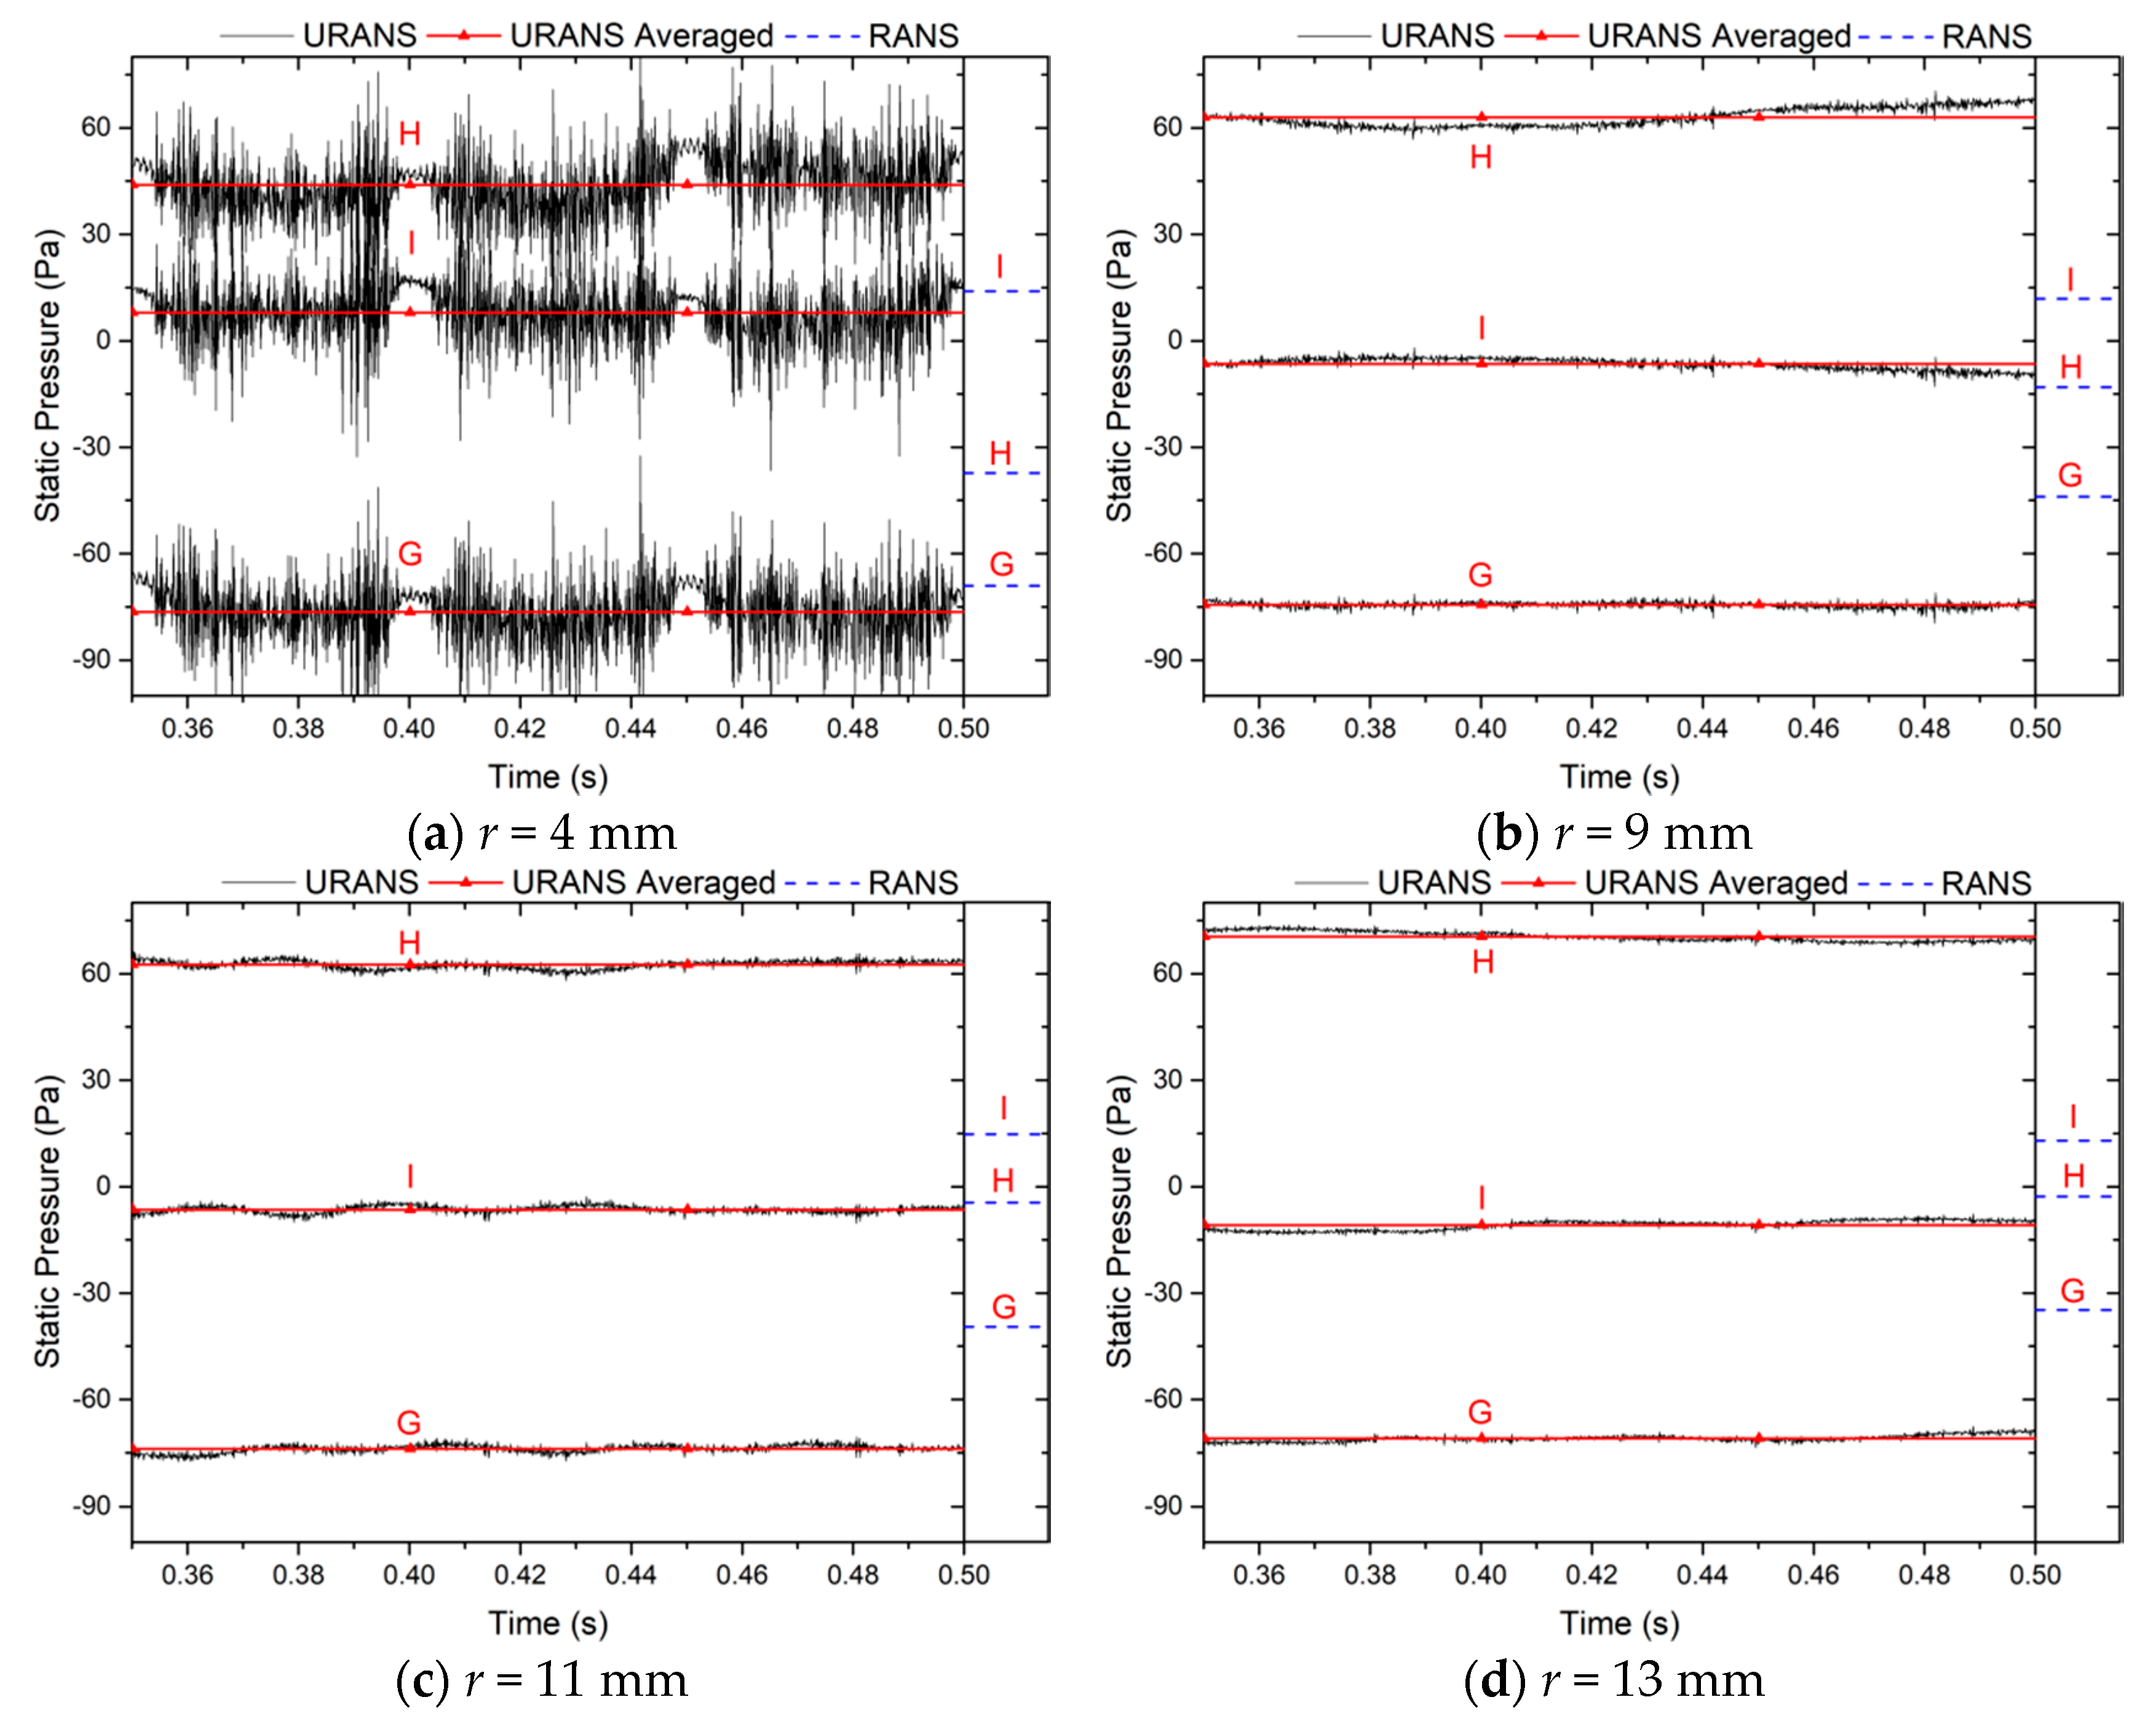
3.5.4. Characteristics of Static Pressure Pulsation at the Volute Tongue

The monitors G/H/I are positioned right at the surface of volute tongue in which monitor-G and monitor-H are closer to the impeller that the flow may impinge on them, while monitor-I is at the outlet section of the volute and is free of flow impingement. Figure 23 shows the time history of pressure at the three monitors. The pressure fluctuation is still notable for the r = 4 mm model, while the amplitude is negligible for the other three models compared with data obtained at other monitors. The time-average pressure for monitor-H at the curved section of the volute tongue has the largest value and is lowest for monitor-G inside of the volute tongue. This indicates that the outflow of the impeller generally impinges on the position of monitor-H but moves partially in a tangential way over the volute surface at monitor-G in the form of recirculating flow. The time-averaged pressure at a certain monitor varies with the volute tongue radius. For all monitors G/H/I, the pressure is the lowest for the r = 4 mm model and highest for the r = 13 mm model, indicating that the increasing of volute tongue radius will increase the local pressure at the center of the tongue region; however, the pressure in the volute tongue region close to the volute exit will be reduced to a certain extent.
The steady-state RANS simulation gives the worst prediction of pressure especially for monitor-H in the curved section probably due to the inaccurate solution of local flow velocity. It shows that for the pressure distribution at the volute tongue, the high-pressure concentration area predicted by RANS is more biased toward the exit of the volute. For the same model, the RANS results at the monitor-I do not show a pressure variation trend as the URANS results, while it is the same for monitor-G and monitor-H.

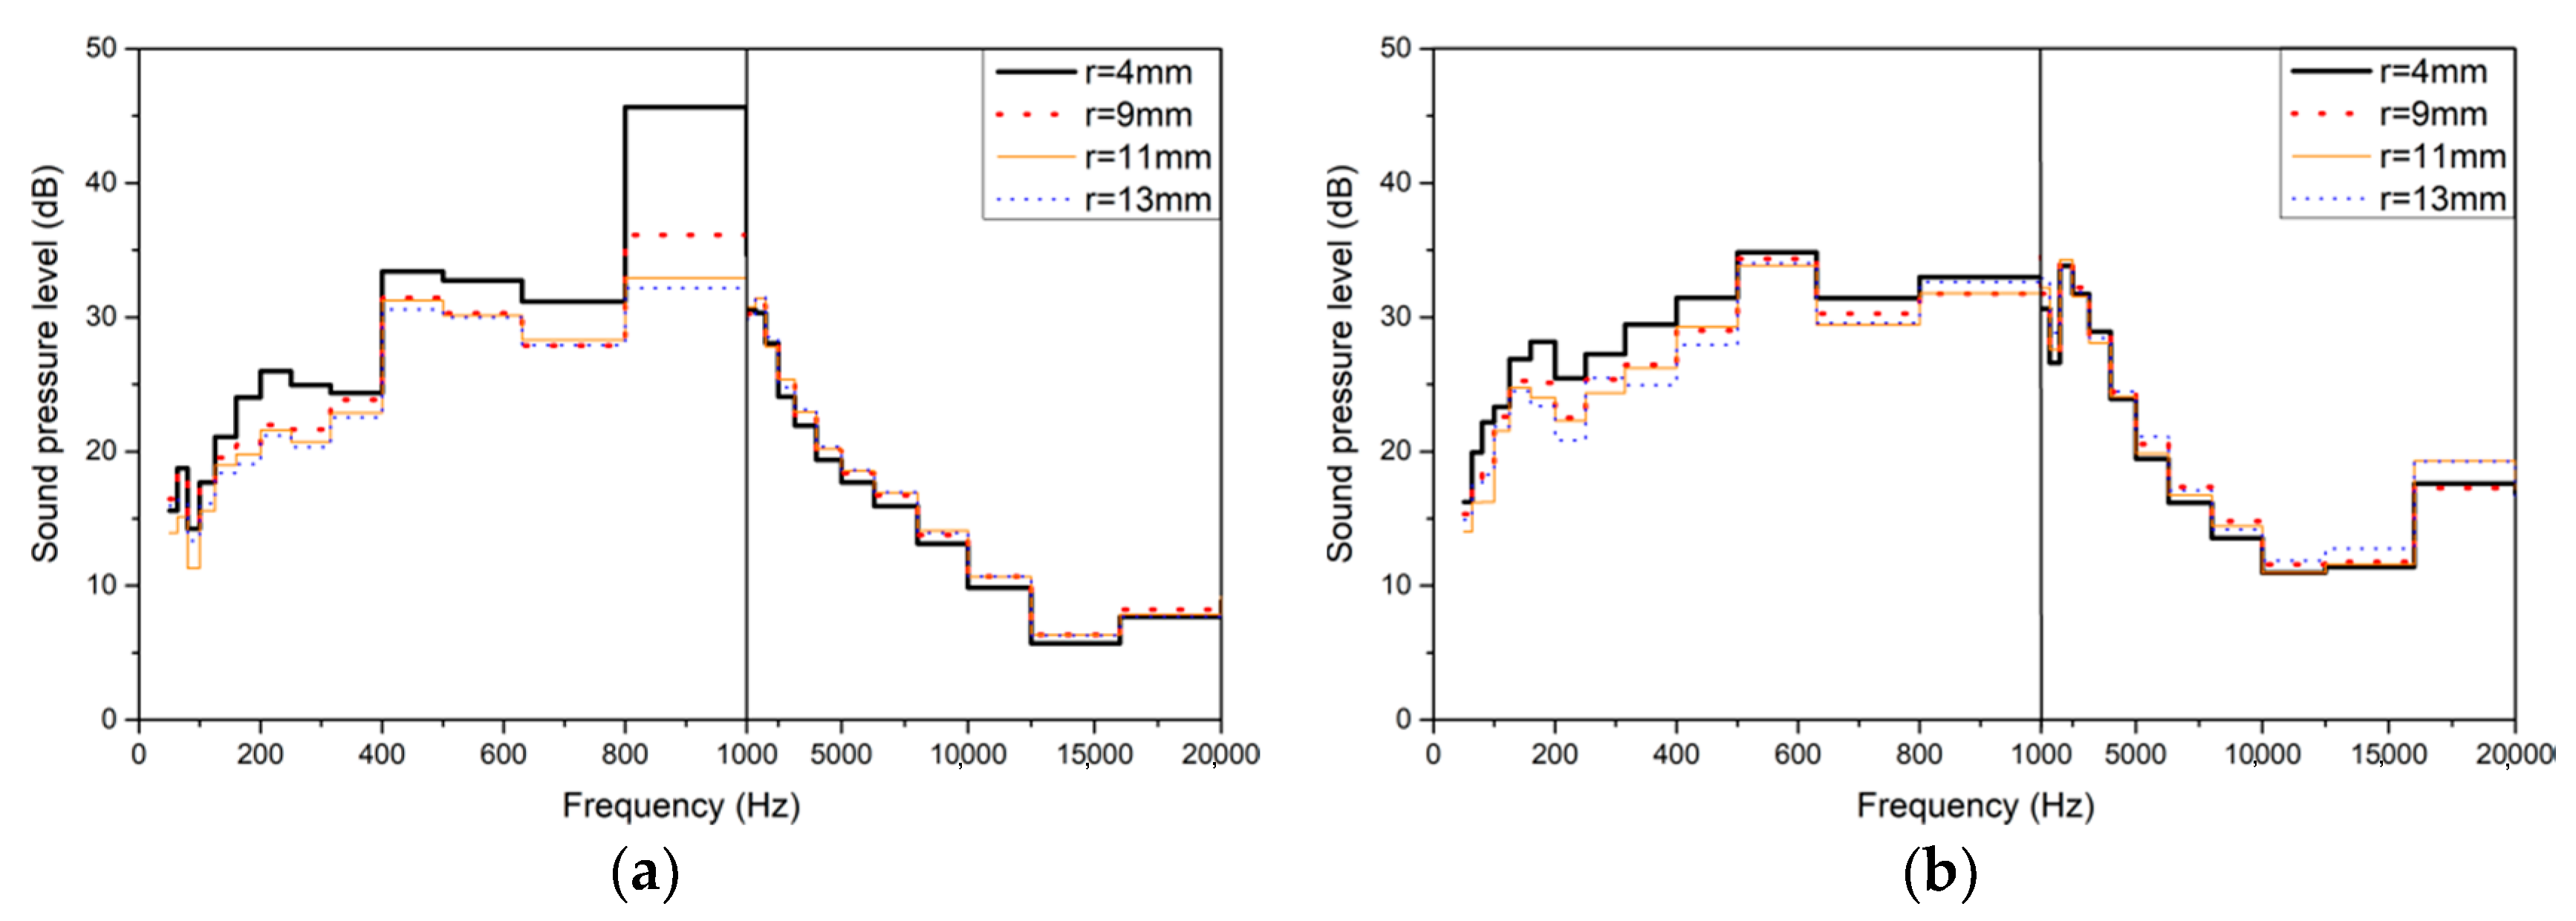
3.6. Aeroacoustic Characteristics

In this work, the internal flow of the Sirocco fans is numerical investigated using the RANS and URANS approaches considering the efficiency and feasibility of computational resources. The results reflect the general characteristics of the temporal variation and spatial distributions of certain quantities but is insufficient in capturing the subtle pressure fluctuation, thus the aeroacoustic characteristics cannot be numerically computed. In this section, we present the experimental results regarding the aeroacoustic characteristics of the various models.
The influence of volute tongue radius of the far-field noise characteristics are analyzed in this section. The schematic of the arrangements of microphones is shown in Figure 24; four microphones A/B/C/D are positioned at the inlet of the fan and one microphone-E is positioned at the outlet of the fan. The sound pressure level (SPL) measured at each microphone is listed in Table 5 for the various volute models. For the microphones A/B/C/D at the outlet of the fan, it is seen in the table that the SPL measured at microphones A/B/C/D increases significantly as the volute tongue radius decreases especially for the r = 4 mm model. The SPL of the r = 9 mm, 11 mm and 13 mm models is of the same level with maximum relative difference less than 2%. The SPL measured at microphone-E at the inlet of the fan exhibits smaller difference for the several models. By comparing the SPL at the several microphones, it can be found that the SPL measured by microphone B/C is relatively higher than that of A/D because the flow at the outlet of the volute has a larger velocity in the direction of B/C which will produce a stronger SPL.
Figure 25 shows the spectrum of 1/3 octave band of noise obtained at monitor-B at the outlet of volute and monitor-E at the inlet of volute. Considering that the blade passage frequency (BPF) of the impeller is 820 Hz, it is seen in the figure that the maximum SPL of the two monitors is around the frequency of BPF for all models, thus it contributes the most to the overall SPL of the fan. The volute model with smaller radius has a higher magnitude of SPL roughly for the low frequency regime, while in the high frequency regime the volute with larger radius has a higher SPL. The SPL increases significantly in most of the low frequency regime for volutes with small tongue radius, while the reduction in the high frequency regime is relatively small. As the volute tongue radius varies within a certain range, such as r = 9 mm to r = 13 mm, the SPL in most frequency regimes is relatively less affected by the tongue radius.

4. Conclusions

This work presents an experimental and numerical investigation on the influence of volute tongue radius on the aerodynamic and aeroacoustic characteristics of a Sirocco fan. The simulations are performed by both RANS and URANS approaches to comparably explore their capability, accuracy and reliability for such configurations. The characteristics of internal flow under the effect of different volute tongue radius are presented in terms of the aerodynamic quantities, the flow within the impeller and near-wall flow on the volute surface, the pressure fluctuation within the volute and the aeroacoustic characteristics. The experimental and numerical results have the following conclusions:
  • The volute with small tongue radius could improve the static pressure and static pressure efficiency of the fan until r = 9 mm by affecting the flow patterns in the tongue region as well as far away from the volute tongue. The steady-state RANS simulation fails to accurately predict the static pressure for all models, while the URANS results are highly consistent with the experimental data.
  • Reversed flow forms within the impeller passages close to the volute tongue, as captured by both RANS and URANS simulations by monitoring the passage flow at a fixed point for the whole revolution of the impeller. The volute tongue with small radius could reduce the size and velocity magnitude of reversed flow; the variation amplitude of velocity of passage flow is small near the front disc, while is larger for that near the central disc.
  • The near-wall flow of the volute surface is affected by the volute tongue radius in the vicinity of the volute tongue as well as far away from it, as revealed by the distribution of pressure coefficient and skin friction coefficient. The reduction of volute tongue radius produces FPG and APG field in the tongue region and thus affects the local near-wall flow. For models with small volute tongue radius, the pressure coefficient and skin friction coefficient on the volute surface exhibit notable unsteady pulsations depending on the circumferential position.
  • The pressure fluctuation is monitored by URANS at the outlet of the impeller, in the volute and around the volute tongue. The fluctuating amplitude is substantially large for the r = 4 mm model which shows time-periodicity regarding the passing of single blade as well as the revolution of whole impeller, while the pressure fluctuation for all monitors of the other models is comparably minor. It is also found that the steady-state RANS simulation could over-predict or under-predict the pressure depending on the position of the monitor and the volute model and the discrepancy could up to more than 30%.
  • The comparison between RANS and URANS results shows that generally, the RANS approach could reasonably reveal the flow patterns within the fan. However, the quantitative analysis on the local flow shows discrepancy compared with the time-average value obtained from URANS simulation and the difference can be large for certain quantities. The RANS approach may not be a suitable choice even if results of engineering accuracy are required.
  • The experimental results show the noise of the fan generally decreases with the volute tongue radius and the sound pressure level is the most pronounced for the r = 4 mm model because of the highly fluctuating flow. The noise measured at the inlet of the fan is less affected by the volute tongue radius.
It should be emphasized here that the findings concluded in this work is considered only suitable for fan models of similar geometry, especially the small-size Sirocco fans and centrifugal fans under certain flow conditions. The effect of volute tongue radius on other types of fans or fluid machines needs to be investigated in the following works. The comparison of RANS and URANS approaches is also limited to the k-ε turbulence model and the conclusions may be different both in variation trend and magnitude as other turbulence models are employed.

Author Contributions

Conceptualization, X.R. and W.Z.; data curation, X.R.; formal analysis, X.R.; funding acquisition, W.Z. and Z.Z.; investigation, X.R. and W.Z.; methodology, X.R.; project administration, W.Z. and Z.Z.; resources, J.W., X.Y., H.H. and W.Z.; software, X.R.; validation, X.R., L.L., J.W., X.Y., H.H. and W.Z.; writing—original draft, X.R.; writing—review and editing, W.Z. and Z.Z. All authors have read and agreed to the published version of the manuscript.

Funding

This work was supported by National Natural Science Foundation of China (51706205), Zhejiang Public Welfare Project (LGG20E060001) and Zhejiang Province Science and Technology Plan Project (2020C04011).

Conflicts of Interest

The authors declare no conflict of interest.

References

  1. Rafael, B.T.; Sandra, V.S.; Juan, P.H.C.; Carlos, S.M. Numerical calculation of pressure fluctuations in the volute of a centrifugal fan. J. Fluids Eng. 2006, 128, 359–369. [Google Scholar] [CrossRef]
  2. Dilin, P.; Sakai, T.; Wilson, M.; Whitfield, A. Computational and experimental evaluation of the performance of a centrifugal fan volute. Proc. Inst. Mech. Eng. Part A J. Power Energy 1998, 212, 235–246. [Google Scholar] [CrossRef]
  3. Okauchi, H.; Suzuka, T.; Sakai, T.; Whitfield, A. The effect of volute tongue and passage configuration on the performance of centrifugal fan. In Proceedings of the International Compressor Engineering Conference, West Lafayette, IN, USA, 16–19 July 2002. [Google Scholar]
  4. Whitfield, A.; Johnson, M.A. The effect of volute design on the performance of a turbocharger compressor. International. In Proceedings of the Compressor Engineering Conference, West Lafayette, IN, USA, 16–19 July 2002. [Google Scholar]
  5. Xiao, M.N.; Xiao, Q.; Dou, H.S.; Ma, X.Y.; Chen, Y.N.; He, H.J.; Ye, X.X. Study of flow instability in a centrifugal fan based on energy gradient theory. J. Mech. Sci. Technol. 2016, 30, 507–517. [Google Scholar] [CrossRef]
  6. Pan, D.; Whitfield, A.; Wilson, M. Design considerations for the volutes of centrifugal fans and compressors. Proc. Inst. Mech. Eng. Part C J. Mech. Eng. Sci. 1999, 213, 401–410. [Google Scholar] [CrossRef]
  7. Lun, Y.X.; Lin, L.L.; He, H.J.; Ye, X.X.; Zhu, Z.C.; Wei, Y.K. Effects of vortex structure on performance characteristics of a multiblade fan with inclined tongue. Proc. Inst. Mech. Eng. Part A J. Power Energy 2019, 233, 1–15. [Google Scholar] [CrossRef]
  8. Sandra, V.S.; Rafael, B.T.; Carlos, S.M.; Jose, G.P. Unsteady flow pattern characteristics downstream of a forward-curved blades centrifugal fan. J. Fluids Eng. 2001, 123, 265–270. [Google Scholar] [CrossRef]
  9. Sina, S.; Javad, A. Experimental and numerical analysis of eight different volutes with the same impeller in a squirrel-cage fan. In Proceedings of the 13th WSEAS International Conference on Automatic Control, Modelling &Simulation, Lanzarote, Spain, 27–29 May 2011; pp. 198–203. [Google Scholar]
  10. Zhou, S.Q.; Li, Y.B. Volute characteristics of centrifugal fan based on dynamic moment correction method. Proc. Inst. Mech. Eng. Part A J. Power Energy 2019, 233, 176–185. [Google Scholar] [CrossRef]
  11. Sunil, R.P.; Sandip, T.C.; Nitin, S.J.; Shivaraj, S.V. Effect of volute tongue clearance variation on performance of centrifugal blower by numerical and experimental analysis. Mater. Today-Proc. 2018, 5, 3883–3894. [Google Scholar] [CrossRef]
  12. Zhang, L.; Wang, S.L.; Hu, C.X.; Zhang, Q. Multi-objective optimization design and experimental investigation of centrifugal fan performance. Chin. J. Mech. Eng. 2013, 26, 1267–1276. [Google Scholar] [CrossRef]
  13. Lee, Y.T.; Vineet, A.; Ashvin, H.; Michael, E.S.; Lawrence, P.M.; Roger, B.; Roderick, M.C. Impeller design of a centrifugal fan with blade optimization. Int. J. Rotating Mach. 2011, 2011, 537824. [Google Scholar] [CrossRef] [Green Version]
  14. Wang, Y.; Dong, Q.L.; Zhang, Y.L. Meridional shape design and the internal flow investigation of centrifugal impeller. Proc. Inst. Mech. Eng. Part C J. Mech. Eng. Sci. 2017, 231, 4319–4330. [Google Scholar] [CrossRef]
  15. Kim, J.H.; Cha, K.H.; Kim, K.Y. Parametric study on a forward-curved blades centrifugal fan with an impeller separated by annular plate. J. Mech. Sci. Technol. 2013, 27, 1589–1595. [Google Scholar] [CrossRef]
  16. Ni, S.S.; Cao, W.B.; Xu, J.; Wang, Y.D.; Zhang, W. Effects of an inclined blade on the performance of a sirocco fan. Appl. Sci. 2019, 9, 3154. [Google Scholar] [CrossRef]
  17. Kim, K.Y.; Seo, S.J. Shape optimization of forward-curved-blade centrifugal fan with Navier-Stokes analysis. J. Fluids Eng. 2004, 126, 735–742. [Google Scholar] [CrossRef]
  18. Tarek, M.; Seung, O.P. A study of impeller-diffuser-volute interaction in a centrifugal fan. J. Turbomach. 2005, 127, 84–90. [Google Scholar] [CrossRef]
  19. Koen, H.; Rene, A.V.D.B. Numerical simulation of impeller-volute interaction in centrifugal compressors. J. Turbomach 1999, 121, 603–608. [Google Scholar] [CrossRef]
  20. Karanth, K.V.; Sharma, N.Y. CFD analysis on the effect of radial gap on impeller-diffuser flow interaction as well as on the flow characteristics of a centrifugal fan. Int. J. Rotating Mach. 2009, 2009, 293508. [Google Scholar] [CrossRef] [Green Version]
  21. Lee, Y.T. Impact of fan gap flow on the centrifugal impeller aerodynamics. J. Fluids Eng. 2010, 132, 091103. [Google Scholar] [CrossRef]
  22. Jose, G.; Joaquin, F.; Eduardo, B.; Carlos, S. Numerical simulation of the dynamic effects due to impeller-volute interaction in a centrifugal pump. J. Fluids Eng. 2002, 124, 348–355. [Google Scholar] [CrossRef]
  23. Daniel, O.B.; Lutz, K.; Ronald, D.F. Effect of relative impeller-to-volute position on hydraulic efficiency and static radial force distribution in a circular volute centrifugal pump. J. Fluids Eng. 2000, 122, 598–605. [Google Scholar] [CrossRef]
  24. Younsi, M.; Bakir, F.; Kouidri, S.; Rey, R. Numerical and experimental study of unsteady flow in a centrifugal fan. Proc. Inst. Mech. Eng. Part A J. Power Energy 2007, 221, 1025–1036. [Google Scholar] [CrossRef]
  25. Bechara, W.; Bailly, C.; Lafon, P.; Candel, S.M. Stochastic approach to noise modeling for free turbulent flows. AIAA J. 1994, 32, 455–463. [Google Scholar] [CrossRef] [Green Version]
  26. Billson, M.; Eriksson, L.E.; Davidson, L. Jet noise prediction using stochastic turbulence modeling. In Proceedings of the 9th AIAA/CEAS Aeroacoustics Conference and Exhibit, Hilton Head, SC, USA, 12–14 May 2003. [Google Scholar] [CrossRef] [Green Version]
  27. Ewert, R. Slat Noise Trend Predictions using CAA with Stochastic Sound Sources from a Random Particle Mesh method (RPM). In Proceedings of the 12th AIAA/CEAS Aeroacoustics Conference (27th AIAA Aeroacoustics Conference), Cambridge, MA, USA, 8–10 May 2006. [Google Scholar] [CrossRef]
  28. Ewert, R. Broadband slat noise prediction based on CAA and stochastic sound sources from a fast random particle-mesh (RPM) method. Comput. Fluids 2008, 37, 369–387. [Google Scholar] [CrossRef]
  29. Bailly, C.; Bogey, C.; Marsden, O. Progress in direct noise computation. J. Aeroacoust. 2010, 9, 123–143. [Google Scholar] [CrossRef] [Green Version]
  30. Sandberg, D.; Jones, L.E. Direct numerical simulations of airfoil self-noise. Procedia Eng. 2010, 6, 274–282. [Google Scholar] [CrossRef] [Green Version]
  31. Dawi, A.H.; Akkermans, R.A.D. Spurious noise in direct noise computation with a finite volume method for automotive applications. Int. J. Heat Fluid Flow 2018, 72, 243–256. [Google Scholar] [CrossRef]
  32. Dawi, A.H.; Akkermans, R.A.D. Direct and integral noise computation of two square cylinders in tandem arrangement. J. Sound Vib. 2018. [Google Scholar] [CrossRef]
  33. Deuse, M.; Sandberg, R.D. Parametric study of multiple aerofoil self-noise sources using direct noise computation. In Proceedings of the 25th AIAA/CEAS Aeroacoustics Conference, Melbourne, Australia, 20–23 May 2019. [Google Scholar] [CrossRef]
  34. Dawi, A.H.; Akkermans, R.A.D. Direct noise computation of a generic vehicle model using a finite volume method. Comput. Fluids 2019, 191, 104243. [Google Scholar] [CrossRef]
  35. Dierke, J.; Akkermans, R.A.D.; Delfs, J.W.; Ewert, R. Installation Effects of a Propeller Mounted on a Wing with Coanda Flap. Part II: Numerical Investigation and Experimental Validation. In Proceedings of the 20th AIAA/CEAS Aeroacoustics Conference, Atlanta, GA, USA, 16–20 June 2014. [Google Scholar] [CrossRef] [Green Version]
  36. Dobrzynski, W.; Ewert, R.; Pott-Pollenske, M.; Herr, M.; Delfs, J. Research at DLR towards airframe noise prediction and reduction. Aerosp. Sci. Technol. 2008, 12, 80–90. [Google Scholar] [CrossRef]
  37. Ewert, R.; Dierke, J.; Siebert, J.; Neifeld, A.; Appel, C.; Siefert, M.; Kornow, O. CAA broadband noise prediction for aeroacoustic design. J. Sound Vib. 2011, 330, 4139–4160. [Google Scholar] [CrossRef]
Figure 1. Baseline model. (a) fan model; (b) impeller and volute; (c) definition of radius of volute tongue.
Processes 08 01442 g001
Figure 2. (a): The grids around the blade, (b): The grids around the volute tongue.
Processes 08 01442 g002
Figure 3. Variation of static pressure rise with grid number of impeller domain.
Processes 08 01442 g003
Figure 4. Impeller and volute with tongue radius r = 4 mm, 9 mm, 11 mm and 13 mm.
Processes 08 01442 g004
Figure 5. (a) The schematic diagram, (b) photo of the facility.
Processes 08 01442 g005
Figure 6. Test equipment: (a) fan and motor; (b) photoelectric infrared speed sensor; (c) microphone.
Processes 08 01442 g006
Figure 7. Time history of static pressure and its averaged value computed by unsteady Reynolds-Averaged Navier-Stokes (URANS) in comparison with those of Reynolds-Averaged Navier-Stokes (RANS) and experiment.
Processes 08 01442 g007
Figure 8. Distribution of static pressure on Z = 4 mm cross-section for the r = 4 mm model.
Processes 08 01442 g008
Figure 9. Distribution of static pressure on Z = 4 mm cross-section for the r = 9 mm model.
Processes 08 01442 g009
Figure 10. Distribution of static pressure on Z = 4 mm cross-section for the r = 11 mm model.
Processes 08 01442 g010
Figure 11. Distribution of static pressure on Z = 4 mm cross-section for the r = 13 mm model.
Processes 08 01442 g011
Figure 12. (a) Selected blade passages near the volute tongue, (b) the expanded view of the passages.
Processes 08 01442 g012
Figure 13. Distribution of v-velocity in the blade passages near the volute tongue.
Processes 08 01442 g013
Figure 14. (a) Positions for the transient motion of the fixed point where pressure is recorded in URANS simulation; (b) positions where pressure is recorded in RANS simulation.
Processes 08 01442 g014
Figure 15. Variation of radial velocity within the blade passages.
Processes 08 01442 g015
Figure 16. Distribution of skin friction coefficient around the volute surface (left column) and the enlarged view around the volute tongue (right column) on the Z = 4 mm cross-section.
Processes 08 01442 g016aProcesses 08 01442 g016b
Figure 17. Distribution of pressure coefficient around the volute surface (left column) and the enlarged view around the volute tongue (right column) on the Z = 4 mm cross-section.
Processes 08 01442 g017aProcesses 08 01442 g017b
Figure 18. Positions for the static pressure monitors within the volute.
Processes 08 01442 g018
Figure 19. Static pressure fluctuation at monitors A/B/C1/D1.
Processes 08 01442 g019
Figure 20. Static pressure fluctuation at monitors C1/C2/C3.
Processes 08 01442 g020
Figure 21. Static pressure fluctuation at monitors D1/D2/D3.
Processes 08 01442 g021
Figure 22. Static pressure fluctuation at monitors A/E/F.
Processes 08 01442 g022
Figure 23. Static pressure fluctuation at monitors G/H/I.
Processes 08 01442 g023
Figure 24. Positions of microphones in the aeroacoustic test. (a) Top view of the positions of the probes; (b) side view of the positions of the probes.
Processes 08 01442 g024
Figure 25. Noise spectrum: (a) Spectrum of 1/3 octave band of microphone-B; (b) Spectrum of 1/3 octave band of microphone-E.
Processes 08 01442 g025
Table 1. Specifications for the baseline Sirocco fan.
SpecificationValue
Flow rate, Qn (m3/h)365
Rotation speed of impeller (rpm)1200
Impeller outer diameter, D2 (mm)140
Impeller inner diameter, D1 (mm)55
Volute width, B (mm)228
Impeller width, b (mm)190
Number of blades, Z41
Volute tongue radius, r (mm)11
Table 2. Number of grids of the computational domain.
ComponentNumber of Grids (103)
Impeller5685
Inlet904
Outlet204
Volute1513
Total8306
Table 3. Experimental and numerical results of static pressure.
Methodr = 4 mmr = 9 mmr = 11 mmr = 13 mm
Experiment70.6872.9873.0471.33
RANS78.3777.3876.6975.83
URANS averaged79.4372.9172.6570.84
Table 4. Experimental and numerical results of static pressure efficiency.
Methodr = 4 mmr = 9 mmr = 11 mmr = 13 mm
Experiment30.66%32.01%31.22%30.53%
RANS31.00%30.17%29.86%29.00%
URANS averaged37.18%33.27%33.75%32.33%
Table 5. The sound pressure level monitored by different microphones (dB).
ModelABCDE
r = 4 mm44.4146.9946.3945.4343.03
r = 9 mm41.6841.7741.8941.1742.76
r = 11 mm41.0441.0641.1240.2742.47
r = 13 mm40.9740.9741.6640.6142.93
Publisher’s Note: MDPI stays neutral with regard to jurisdictional claims in published maps and institutional affiliations.

