Article

Research on Green Management Effect Evaluation of Power Generation Enterprises in China Based on Dynamic Hesitation and Improved Extreme Learning Machine

1
School of Economics and Management, North China Electric Power University, Beijing 102206, China
2
Beijing Key Laboratory of New Energy and Low-Carbon Development, North China Electric Power University, Beijing 102206, China
3
State Grid Energy Research Institute Co., LTD., Beijing 102209, China
4
School of Economics and Management, Yan’an University, Yan’an 716000, China
*
Author to whom correspondence should be addressed.
Processes 2019, 7(7), 474; https://doi.org/10.3390/pr7070474
Submission received: 10 June 2019 / Revised: 8 July 2019 / Accepted: 16 July 2019 / Published: 22 July 2019
(This article belongs to the Section Environmental and Green Processes)

Abstract

:
Carbon emissions and environmental protection issues have become the pressure from the international community during the current transitional stage of China’s energy transformation. China has set a macro carbon emission target, which will reduce carbon emissions per unit of Gross Domestic Product (GDP) by 40% in 2020 and 60–65% in 2030 than that in 2005. To achieve the emission reduction target, the industrial structure must be adjusted and upgraded. Furthermore, it must start from a high-pollution and high-emission industry. Therefore, it is of practical significance to construct a low-carbon sustainability and green operation benefits of power generation enterprises to save energy and reduce emissions. In this paper, an intuitionistic fuzzy comprehensive analytic hierarchy process based on improved dynamic hesitation degree (D-IFAHP) and an improved extreme learning machine algorithm optimized by RBF kernel function (RELM) are proposed. Firstly, we construct the evaluation indicator system of low-carbon sustainability and green operation benefits of power generation enterprises. Moreover, during the non-dimensional processing, the evaluation index system is determined. Secondly, we apply the evaluation indicator system by an empirical analysis. It is proved that the D-IFAHP evaluation model proposed in this paper has higher accuracy performance. Finally, the RELM is applied to D-IFAHP to construct a combined evaluation model named D-IFAHP-RELM evaluation model. The D-IFAHP evaluation results are used as the input of the training sets of the RELM algorithm, which simplifies the comprehensive evaluation process and can be directly applied to similar projects.

1. Introduction

1.1. Motivation

By 2018, the standard coal consumption rate of China’s 6000 kW and above thermal power units is 308 g/kWh, which is 1 g/kWh lower than that of 2017 [1]. The power generation industry has always been an important research indirection for energy conservation and emission reduction. According to the 13th Five-Year Plan, the installed capacity of wind power and photovoltaic power generation will reach 210 GW and 110 GW, respectively, in 2020, with an average annual growth rate of 9.9% and 21.2%, respectively. Therefore, low-carbon power supply structure is an important energy-saving and emission-reduction method for power generation enterprises [2]. In order to achieve long-term planning and sustainable development, power generation enterprises must adjust the power supply structure and update low-carbon power technology [3]. On this basis, they can maximize the efficiency of energy-saving and emission-reduction operations. Although there are many studies on energy conservation and emission reduction in the power industry, they mainly focus on macroeconomy sectors and use physical indicators of energy and emissions, such as standard coal consumption per unit of power generation, enterprise electricity consumption rate, etc. These indicators can reflect the actual effect of energy conservation and emission reduction in the macroeconomy sector, but cannot comprehensively reflect the sustainable operation efficiency of power generation enterprises in microscopic indirection. Therefore, there is currently a lack of research in this indirection. At present, China is at a critical stage of energy transformation. The government’s control over the clean production of traditional thermal power generation enterprises is becoming more and more strict. Many power generation companies lack the green and clean sustainable operation capability and their profits are seriously declining. Therefore, we propose evaluation indicator system of low-carbon sustainability and green operation benefits of power generation enterprises to obtain the direction and signal of future profit margins.
In summary, the research goal of this paper is as follows.
  • Putting forward a new concept of low-carbon sustainability and green operation benefits for power generation enterprises, which is different from the previous single-generation clean production evaluation of power generation enterprises, and the focus is more on green sustainability and market transactions.
  • The study results can provide reference for the supervision departments of the low-carbon sustainability assessment to evaluate the low-carbon sustainability and green operation in China, and then promotes energy conservation in the power generation industry.
  • Linking the clean production evaluation with sustainable profitability and promoting the indicator system to guide the transformation of power generation enterprises under the background of China’s energy revolution.

1.2. Paper Innovation

In this paper, the main innovations are as follows.
(1) The traditional research on energy saving and emission reduction is mainly focused on the macro level, however, there are few studies on the enterprise level. Therefore, we construct an evaluation system about low-carbon sustainability and green operation benefits for power generation enterprises.
(2) Traditional fuzzy theory can only describe the two states of “positive” and “negative”. Intuitionistic fuzzy set theory is an extension of fuzzy theory. The intuitionistic fuzzy set proposed in this paper also considers the state of hesitation, describing fuzzy information and uncertainty. Moreover, the information is more flexible and practical.
(3) We improve the generalization ability of the evaluation model proposed in this paper. We input the evaluation result of intuitionistic fuzzy analytic hierarchy process optimized by dynamic hesitation degree (D-IFAHP) to the training set of an improved extreme learning machine algorithm optimized by RBF kernel function (RELM) algorithm to achieve further optimization. The results of RELM training can verify the effectiveness of the proposed evaluation method. At the same time, the application of RELM algorithm will greatly improve the evaluation accuracy and the speed.

1.3. Structure of the Article

The structure of this paper is as follows: Section 2 conducts literature review; Section 3 establishes the evaluation index system of energy-saving and emission-reduction sustainable operation efficiency of power generation enterprises; Section 4 introduces the intuitionistic fuzzy analytic hierarchy process of dynamic hesitation optimization and the improved principle of extreme learning machine algorithm; Section 5 verifies the validity and applicability of the evaluation model proposed in this paper by example analysis; Section 6 summarizes the research results of the full text.

2. Literature Review

In recent years, researchers have conducted a large number of comprehensive evaluation studies on power generation companies, such as safety production [4,5,6], competitiveness [7,8,9], and investment and operation [10,11,12]. Based on the dimensions and direction of index construction in the research of these papers, we extract indicators related to the low-carbon sustainability and green operation benefits of power generation enterprises. Lu [4] designed the index system from four aspects: management factors, personnel factors, environmental factors, and equipment factors. Shi et al. [5] used safety system engineering methods to measure the safety of power plants based on four aspects: personal safety, equipment safety, basic management, and on-site management. Li [6] used the three dimensions of safety production management, equipment safety, labor safety, and operating environment as the criterion layer of fuzzy analytic hierarchy process. Wei [7] considered the six criteria layers, namely the enterprise scale and its development capability, operational capability, unit power generation cost, market share, safety and reliability, and production efficiency. Li et al. [8] established an index system based on production cost, operational efficiency, auxiliary services, technical equipment, market share, and safety production. Zhang et al. [9] built an ideal evaluation framework and indicator system for comprehensive competitiveness of enterprises from two sources: external sources, internal sources. Liu [10] studied and analyzed the clean production evaluation methods and index system of thermal power industry. Ren et al. [11] used the data envelopment analysis (DEA) model to test the coordinated development efficiency and transformation trend of electric energy production and environment in China’s thermal power industry. Jia et al. [12] compared main indicators of clean production in the thermal power industry and evaluated the company’s clean production level in the thermal power industry and its successful clean production. Chen et al. [13] established a carbon emission calculation model adapted to different power dispatch modes and proposed to generate electricity annually. Shi [14] constructed a results-oriented quantitative power industry energy conservation and emission reduction performance evaluation index system. He et al. [15] designed a relationship diagram between energy-saving performance and emission reduction performance and a triangular diagram of coordination performance between energy-saving performance, emission-reduction performance, and economic benefit. Liu [16] applied the improved Technique for Order Preference by Similarity to an Ideal Solution (TOPSIS) to establish a comprehensive evaluation model for energy saving and emission reduction effects of power grid enterprises. Zhu [17] combined qualitative indicators with quantitative indicators, and constructed indicators based on fuzzy analytic hierarchy process. Zhao [18] constructed the performance evaluation index system and evaluation model for energy saving and emission reduction and used fully arranged polygon graphic index method to conduct static evaluation research and dynamic evaluation research with systematic evidence.
The methods of comprehensive evaluation mainly include analytic hierarchy process, sequential relationship method, entropy weight method, fuzzy theory, matter element expansion method, and TOPSIS. In recent years, the fuzzy theory has been widely used in comprehensive evaluation in various fields [19,20,21,22,23,24]. Therefore, based on the validity of these studies, we attempt to introduce fuzzy theory into the evaluation of the low-carbon sustainability and green operation benefits. Bai et al. [19] constructed Public–Private Partnership (PPP) project’s sustainability risk factor system based on the fuzzy comprehensive evaluation model (FCEM). The results showed that the model was reasonable for assessing the sustainability risk level of PPP projects. Li et al. [20] proposed a qualitative and quantitative comprehensive risk assessment method combining fuzzy mathematics and grey system theory to analyzed Chinese overseas refinery project. Zhao et al. [21] proposed an evaluation index system for assessing the performance of Strong Smart Grid (SSG) from the perspective of sustainable development. The fuzzy TOPSIS method and the random analytic hierarchy process (AHP) were used to solve the deviation. Wu et al. [25] used the triangular intuitionistic fuzzy number (TIFN) to establish a comprehensive electric vehicle charging selection (EVCS) decision framework for residential communities. An evaluation system was constructed from the perspective of economic, social, and environmental of residential communities. They used fuzzy VlseKriterijumska Optimizacija I Kompromisno Resenje (fuzzy-VIKOR) method to evaluate the comprehensive EVCS site of the residential community. The results of the study showed that the EVCS site of the Sijiqing community in Haidian District is the best site. Zhang [26] used interval intuitionistic fuzzy numbers (IVIFN) to represent the inaccurate evaluation of the best alternative to photovoltaic cells. Xu et al. [27] proposed a new method to check the consistency of intuitive preferences and optimized the fuzzy values and attributes of classical AHP and intuitionistic fuzzy AHP (IFAHP). The example proved that IFAHP can be used to deal with more complex problems. Gao et al [28] used IFAHP to evaluated the port competitiveness of Quanzhou Port and pointed out directions for the future development. Dai et al [29] applied fuzzy group ideal point method to evaluate the sustainable development of power grid enterprises, and the results showed that the proposed method have the best performance.
In summary, based on these literature studies, we believe that traditional intuitionistic fuzzy analytic hierarchy process (IFAHP) has certain limitations. Firstly, the AHP relies too much on the subjectivity of experts; secondly, the fuzzy analytic hierarchy process (FAHP) cannot accurately express the abandonment or hesitation. Therefore, it is not suitable to deal with the problem of low-carbon sustainability and green operation benefits evaluation of power generation enterprises involving multiple different dimensions. Therefore, we propose an intuitionistic fuzzy comprehensive analytic hierarchy process based on improved dynamic hesitation degree (D-IFAHP) to achieve the effectiveness of low-carbon sustainability and green operation benefits evaluation of power generation enterprises.
With the advancement of intelligent algorithms, more and more simple artificial intelligence algorithms are applied in the field of comprehensive evaluation. The extreme learning machine (ELM) is essentially a single hidden layer neural network algorithm. ELM does not need to be adjusted during the execution, and only the weight of the hidden layer needs to be adjusted. Therefore, ELM has been widely used in recent years. Sun et al. [30] proposed a hybrid model based on principal component analysis (PCA) and regularized extreme learning machine, and made CO2 emissions prediction in China. Sun et al. [31] used the particle swarm optimization algorithm to optimize the input weight and threshold of the extreme learning machine, which improved the accuracy of the prediction and the operation speed of the algorithm. Li et al. [32] used the kernel learning function to optimize the extreme learning machine algorithm. The influence factor obtained by the grey correlation degree were input into the prediction algorithm to realize the prediction of carbon emission in the Beijing–Tianjin–Hebei region. Guo et al. [
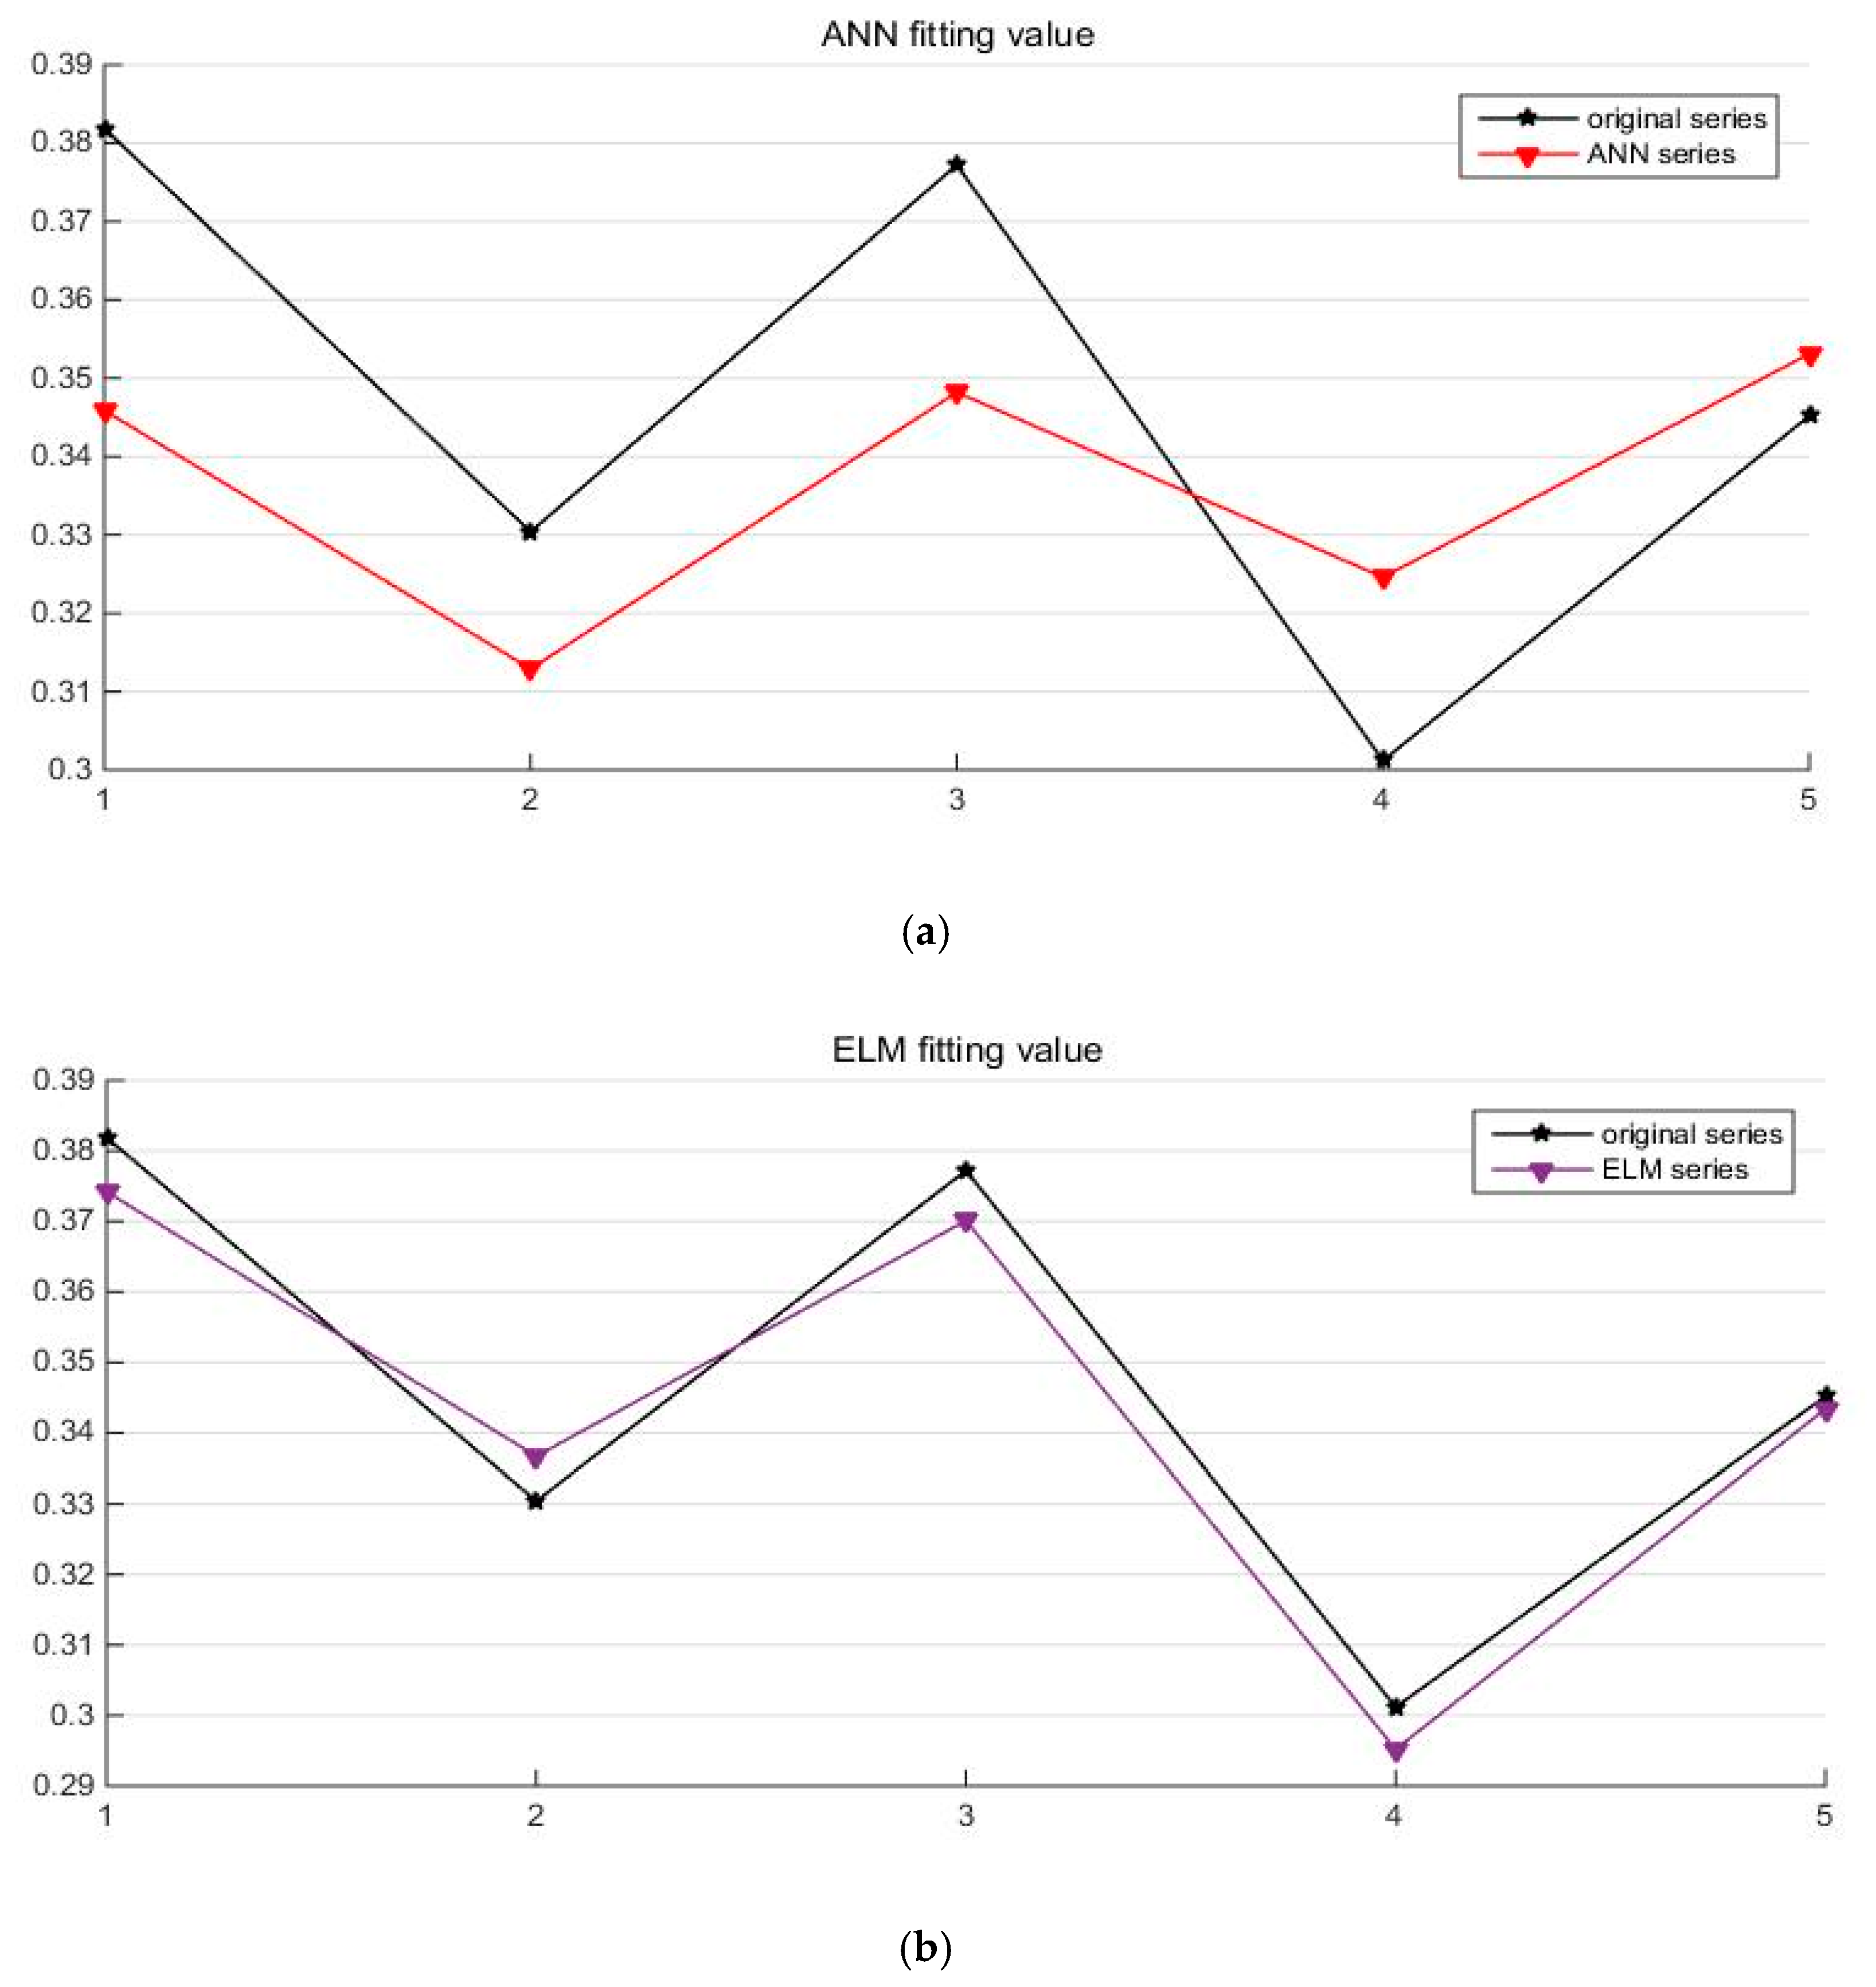
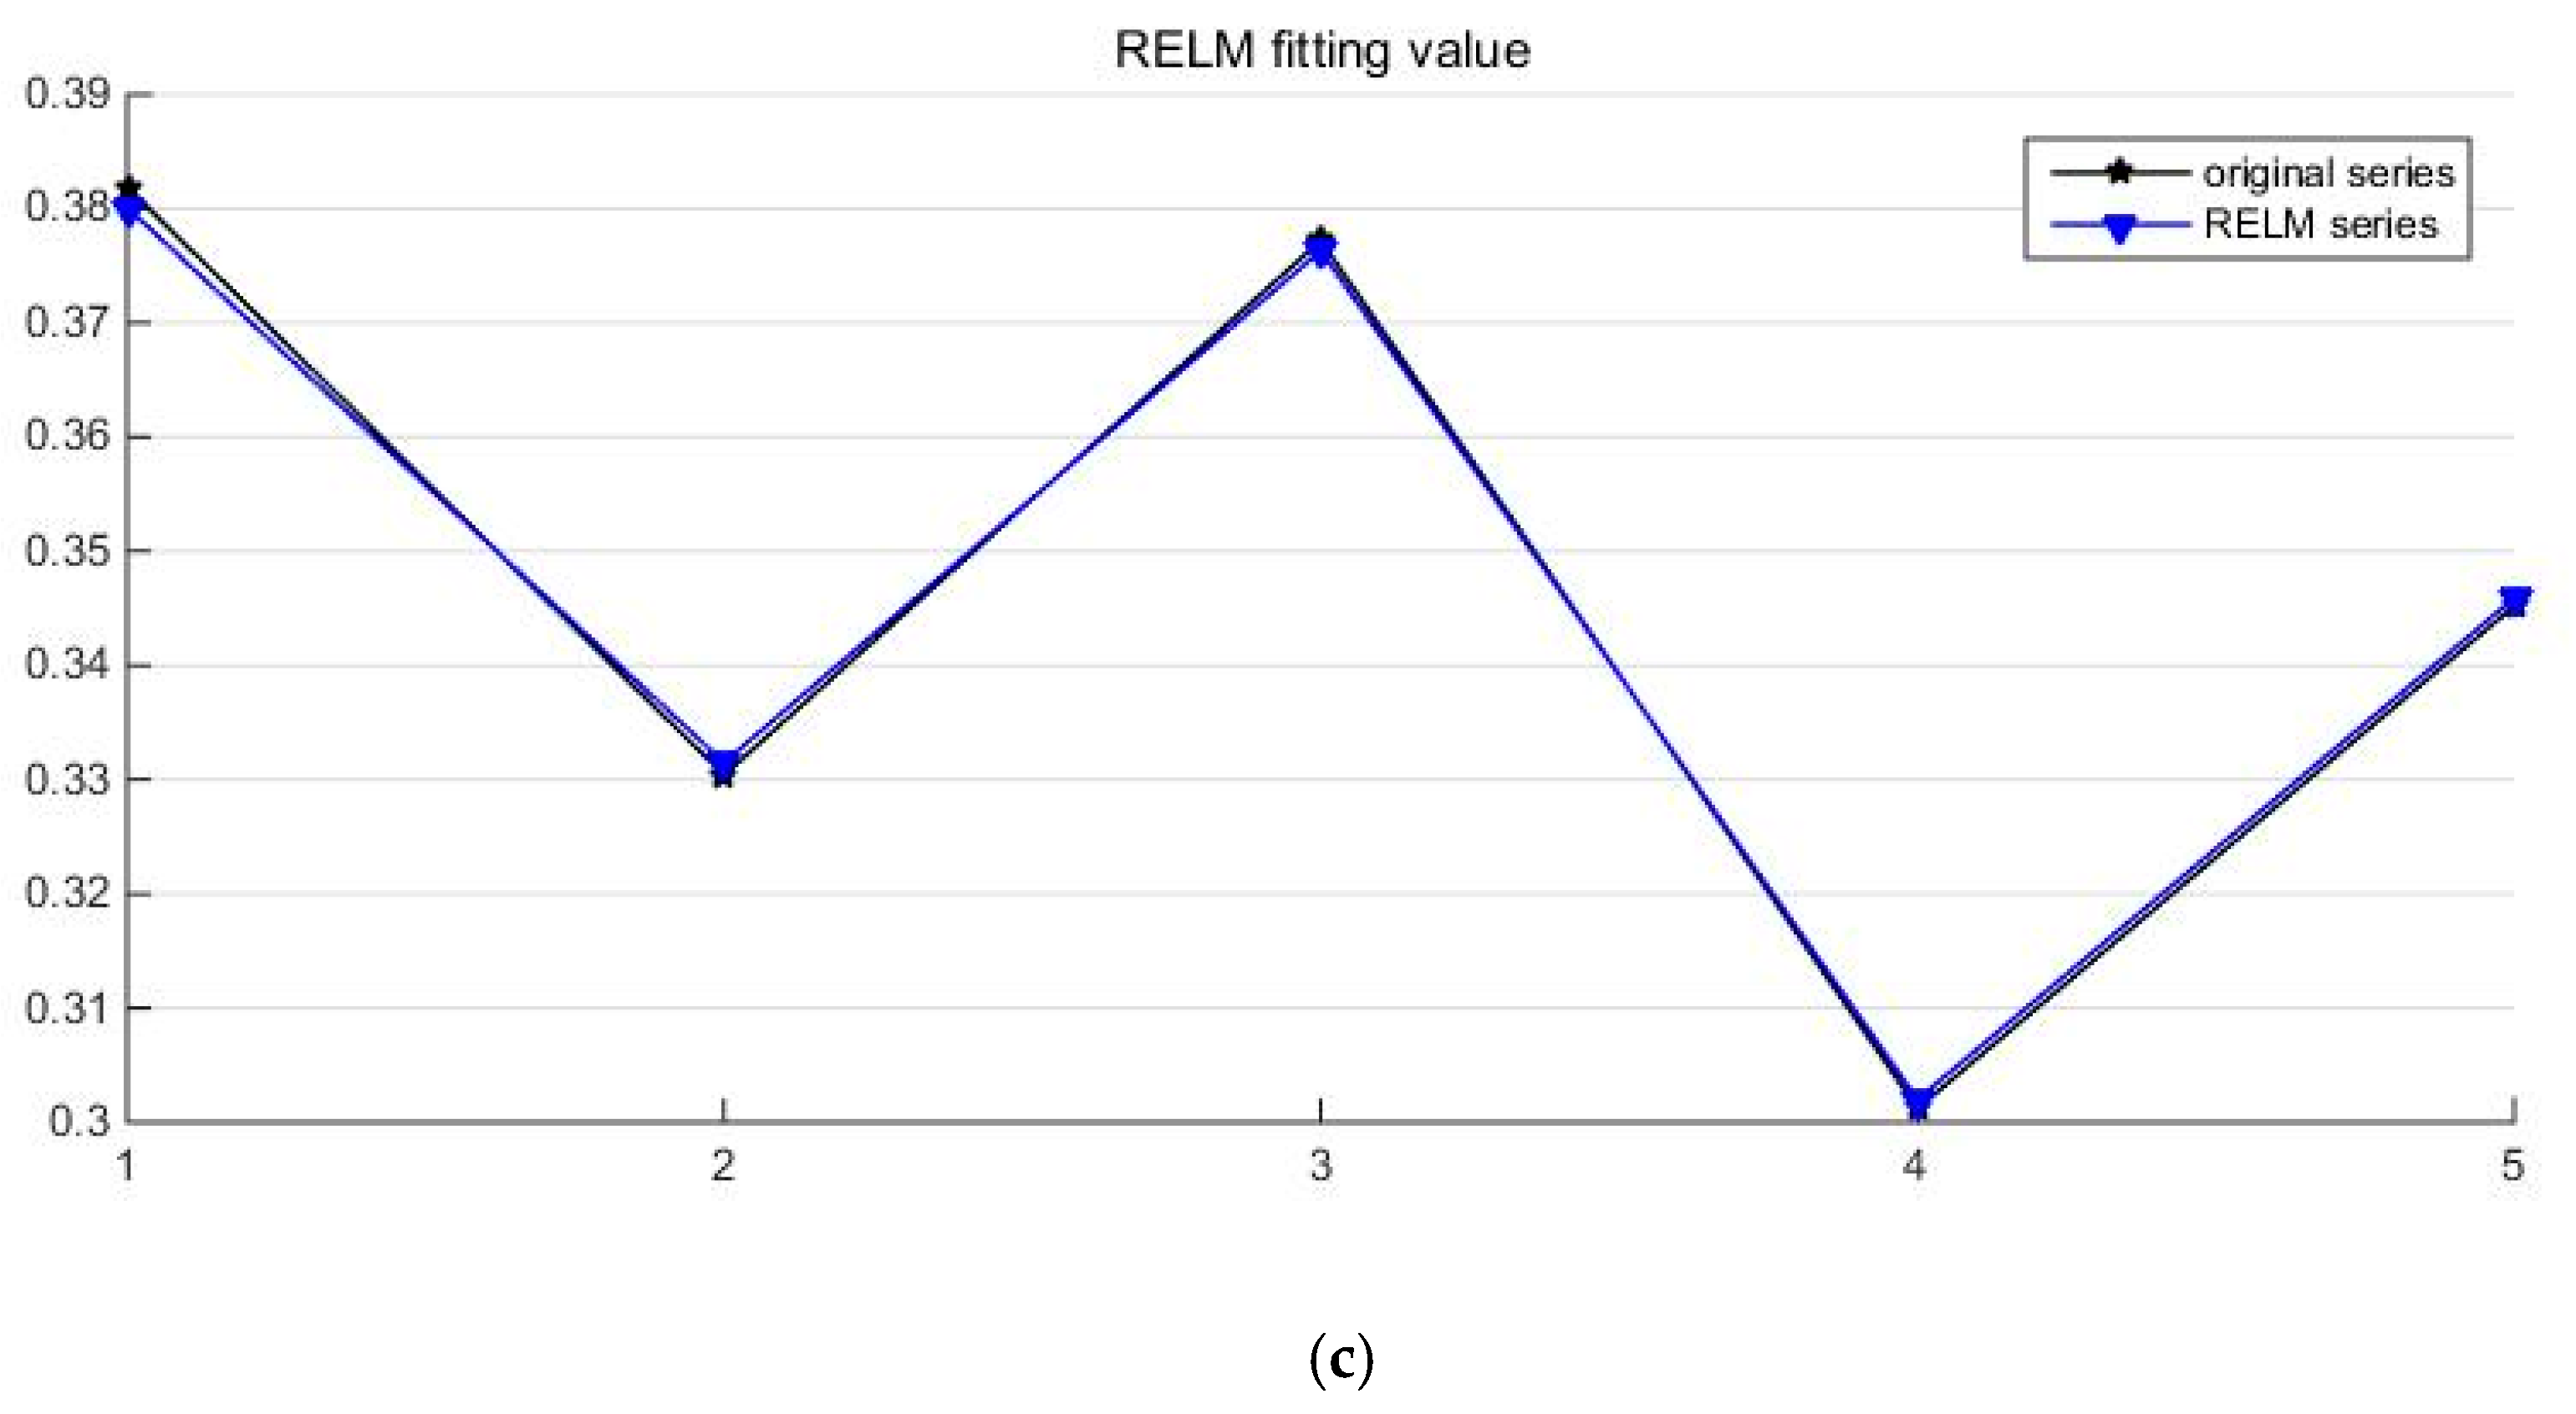
33] proved that the RELM can improve its robustness and has more accurate prediction capabilities. Therefore, we also apply RELM intelligent algorithm to achieve the intelligent and generalization performance of low-carbon sustainability and green operation benefits evaluation of power generation enterprises.

3. Constructing an Evaluation Indicator System of Low-Carbon Sustainability and Green Operation Benefits of Power Generation Enterprises

3.1. Evaluation Indicator System Construction

In this paper, the evaluation indicator system construction includes the following steps:
(1) Determine preliminary evaluation indicators
According to many literature studies, four dimensions of economic development, operational production, resources and environmental protection, and green market trading were selected. Initially, 35 evaluation indicators including quantitative and qualitative were selected.
(2) Ensure final evaluation indicator
In this study, the qualitative indicators were selected by the Delphi expert evaluation method, and many power system experts were invited. Each evaluation index was scored from 0 to 100 according to its importance. The higher the score, the higher the importance of the index. If the score of the indicator given by the expert i (i = 1, 2, 3, 4, 5...) is lower than 50, the indicator will be abandoned. The indicators that are not important to evaluation of the low-carbon sustainability and green operation benefit evaluation index system for the power generation enterprise will be abandoned.
(3) Establish final evaluation indicator system
According to the expert assessment, the scores of some indicators are lower than the given value, and they are abandoned. All indicators and their scores are shown in Table A1 of Appendix A. Finally, an evaluation indicator system is established, as shown in Figure 1.

3.2. Indicator Description

3.2.1. Economic Development

As a core dimension of low-carbon sustainability and green operation benefits evaluation, high-quality management capabilities can provide strong support for power generation enterprises’ low-carbon sustainability and green operation benefits. Therefore, in the process of selecting indicators, we mainly select financial management indicators that are closely related to the daily operation of power generation companies. The specific explanation is shown in Table 1.

3.2.2. Operational Production

The operational production indicators are an important part of the low-carbon sustainability and green operation benefits evaluation, covering the most-level three-level indicators, and extracting evaluation indicators from the daily operations of power generation companies. The indicators are explained in Table 2.

3.2.3. Resources and Environmental Protection

Resources and environmental protection focus on the ability of power generation companies in terms of green operating income. The indicators are explained in Table 3.

3.2.4. Green Market Trading

Along with the development of green market trading, the activeness of power generation enterprises in China’s green trading market, such as the carbon emissions trading market and the green certificate market, can effectively reflect the operational efficiency of low-carbon sustainability and green operation benefits. The specific explanation is shown in Table 4.

4. Methodology

We apply the intuitionistic fuzzy analytic hierarchy process optimized by dynamic hesitation degree (D-IFAHP) and RELM to comprehensively evaluate the low-carbon sustainability and green operation benefits of power generation enterprises.

4.1. Intuitionistic Fuzzy Analytic Hierarchy Process Optimized by Dynamic Hesitation Degree (D-IFAHP)

Bulgarian scholar Atanassov et al. [22] proposed the definition of intuitionistic fuzzy sets and basic arithmetic rules, based on the theory, we propose the intuitionistic fuzzy analytic hierarchy process optimized by dynamic hesitation degree (D-IFAHP).
Definition 1.
A is Intuitionistic fuzzy number, μ A ( x ) and v A ( x ) are respectively the membership and non-affiliation of element x in X that is a non-empty set.
A = { x , μ A ( x ) , v A ( x ) | x X }
μ A : X [ 0 , 1 ] , x X μ A ( x ) [ 0 , 1 ]
v A : X [ 0 , 1 ] , x X v A ( x ) [ 0 , 1 ]
And they meet the conditions as follows.
0 μ A ( x ) + v A ( x ) 1 , x X
Definition 2.
π A ( x ) is the degree of hesitation.
π A ( x ) = 1 μ A ( x ) v A ( x ) , x X
Definition 3.
α = ( μ α , v α ) , α 1 = ( μ α 1 , v α 1 ) and α 2 = ( μ α 2 , v α 2 ) are all intuitionistic fuzzy numbers, and the calculation rules are as follows.
α 1 + α 2 = ( μ α 1 + μ α 2 μ α 1 μ α 2 , v α 1 v α 2 )
α 1 α 2 = ( μ α 1 μ α 2 , μ α 1 + μ α 2 v α 1 v α 2 )
Then, the steps of the intuitionistic fuzzy analytic hierarchy process are as follows.
Step 1: Constructing an intuitionistic fuzzy judgment matrix.
R = ( r i j ) n × n
r i j = ( μ i j , v i j )
π i j = 1 μ i j v i j
In the formula, i and j represent the rows and columns of the intuitionistic fuzzy judgment matrix.
Step 2: Calculating the final score and ensure the scale. In order to quantify the importance of indicators, we apply the intuitionistic fuzzy scale [24] to describe it, which has been shown in Table 5.
Step 3: Checking consistency. The distance consistency test of the intuitionistic fuzzy judgment matrix is as follows,
d ( R ¯ , R ) = 1 2 ( n 1 ) ( n 2 ) i = 1 n j = 1 n ( | μ ¯ i j μ i j | + | v ¯ i j v i j | + | π ¯ i j π i j | )
(1)
when j > i , let r ¯ i j = ( μ ¯ i j , v ¯ i j ) ,
μ ¯ i j = t = i + 1 j 1 μ i t μ t j j i 1 t = i + 1 j 1 μ i t μ t j j i 1 + t = i + 1 j 1 ( 1 μ i t ) ( 1 μ t j ) j i 1 , j > i + 1
v ¯ i j = t = i + 1 j 1 v i t v t j j i 1 t = i + 1 j 1 v i t v t j j i 1 + t = i + 1 j 1 ( 1 v i t ) ( 1 v t j ) j i 1 , j > i + 1
(2)
when j = i + 1 ,
r ¯ i j = ( μ i j , v i j )
(3)
when j < i
r ¯ i j = ( v ¯ i j , μ ¯ i j )
Step 4: Correcting the consistency. Changing the intuitionistic fuzzy consistency judgment matrix by adjusting different iterative parameters until it finally passes the consistency test. The parameter range is iterating at 0.01 from 0.
μ ˜ i j = ( μ i j ) 1 σ ( μ ¯ i j ) σ ( μ i j ) 1 σ ( μ ¯ i j ) σ + ( 1 μ i j ) 1 σ ( 1 μ ¯ i j ) σ , i , j = 1 , 2 , , n
v ˜ i j = ( v i j ) 1 σ ( v ¯ i j ) σ ( v i j ) 1 σ ( v ˜ i j ) σ + ( 1 v i j ) 1 σ ( 1 v ˜ i j ) σ , i , j = 1 , 2 , , n
Step 5: Bringing the corrected result into the Formula (11) for consistency check until it finally passes the test.
d ( R ˜ , R ) = 1 2 ( n 1 ) ( n 2 ) i = 1 n j = 1 n ( | μ ˜ i j μ i j | + | v ˜ i j v i j | + | π ˜ i j π i j | )
Step 6: Calculating the indicator weight,
ω i = [ j = 1 n μ ¯ i j i = 1 n j = 1 n ( 1 v ¯ i j ) , 1 j = 1 n ( 1 v ¯ i j ) i = 1 n j = 1 n μ ¯ i j ] , i = 1 , 2 , , n
Step 7: Obtaining the dynamic hesitation degree. In order to improve the adaptability, a penalty mechanism is proposed in the paper to adjust the hesitation degree.
π i j = ( 1 n π N π ) π i j
In the formula, N π is the total number of indicators, n π is the performance of low-carbon sustainability and green operation benefits.
Step 8: Evaluating low-carbon sustainability and green operation of power generation enterprises,
ω 1 ω 2 = ( μ ω 1 μ ω 2 , v ω 1 + v ω 2 v ω 1 v ω 2 )
ω 1 ω 2 = ( μ ω 1 + μ ω 2 μ ω 1 μ ω 2 , v ω 1 v ω 2 )
The weight of the second-level indicators and the final weight are as follows,
ω ( C i ) = ω B k ω C i , k = 1 , 2 , , m ; i = 1 , 2 , , n
W = i + 1 n ω ( C i ) , i = 1 , 2 , , n
Step 9: After completing the above calculation steps, the final comprehensive evaluation is carried out, which is as follows,
ρ ( W ) = 0.5 ( 1 + π w ) ( 1 μ w )
In the formula, π ω is the hesitation degree and μ ω is the membership of the weighted calculation.
We divide the low-carbon sustainability and green operation efficiency grades of power generation enterprises into I, II, III, IV, V, which is as shown in Table 6.

4.2. Extreme Learning Machine Algorithm Optimized by RBF Kernel Function

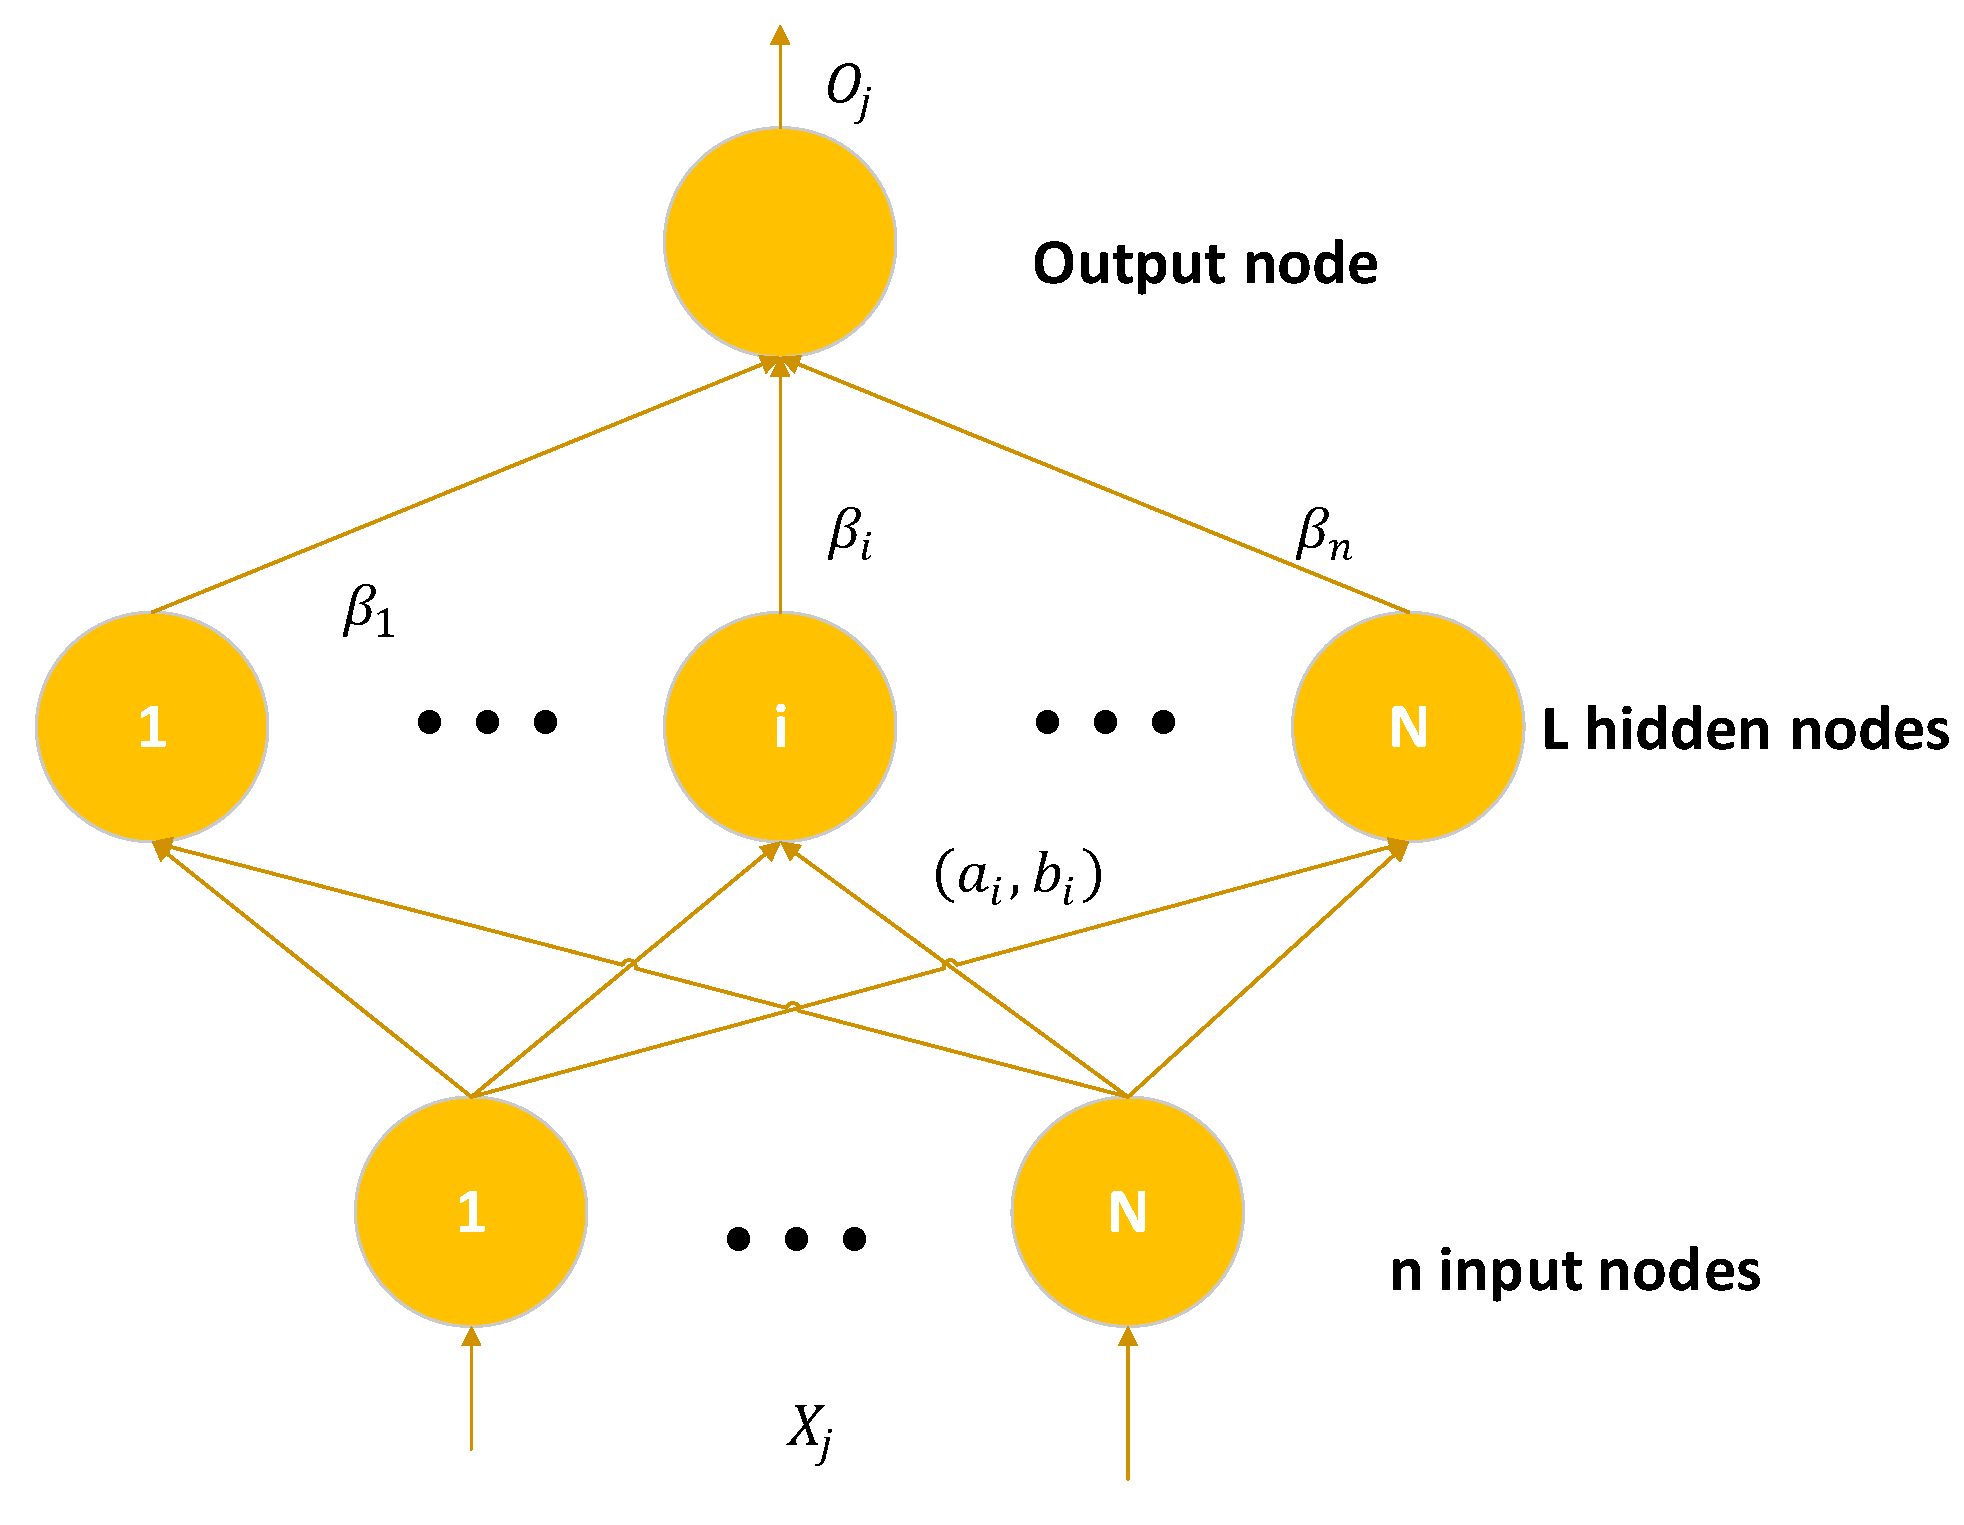
Extreme learning machine is a new single hidden layer feed-forward neural network algorithm invented by Huang [34] which has the advantages of high speed. It has the advantages of high learning efficiency and strong fitting ability [33]. The topological structure of the extreme learning machine is shown in Figure 2.
The operation of the extreme learning machine is as follows,
For a single hidden layer neural network, assuming there are N arbitrary samples ( X i , T i ) , where X i = [ x i 1 , x i 2 , x i n ] T R n , T i = [ t i 1 , t i 2 , t i n ] T R m . X i is factor samples set and T i is target set.
A neural network with hidden layers h ( x ) can be expressed as [35],
i = 1 L γ i f ( W i · X j + b i ) = O j , j = 1 , 2 , n
In the formula, f ( x ) is the activation function, W i = [ w i 1 , w i 2 , w i n ] T is input weight, γ i is output weight, and b i is the offset of the hidden layer unit.
Because the single hidden layer map h ( x ) in extreme learning machine algorithm has the same effect as the RBF kernel function K ( x i , x j ) , we replace the single hidden layer map h ( x ) by K ( x i , x j ) . Kernel matrix Ω E L M is defined according to the Mercer condition,
Ω E L M = H H T = h ( x i ) h ( x j ) = K ( x i , x j )
According to the standard optimization principle, the original objective function can be expressed as,
min L p = 1 2 ω 2 + 1 2 C i = 1 n ξ i 2
In the formula, C is a regular coefficient and ξ i is a training error.
According to the KKT theory (Karush–Kuhn–Tucker conditions), the original objective function can be transformed into,
L p k e l m = 1 2 ω 2 + 1 2 C i = 1 n ξ i 2 i = 1 n η i ( ψ ( x i ) ω y i + ξ i )
In the formula, η i is the Lagrange operator, ψ ( x i ) is original objective function.
The output of the RELM algorithm is,
ω = i = 1 n η i ψ ( x i ) T = ψ T η
In the formula, C ξ i = η i , ψ ( x i ) ω y i + ξ i = 0 .

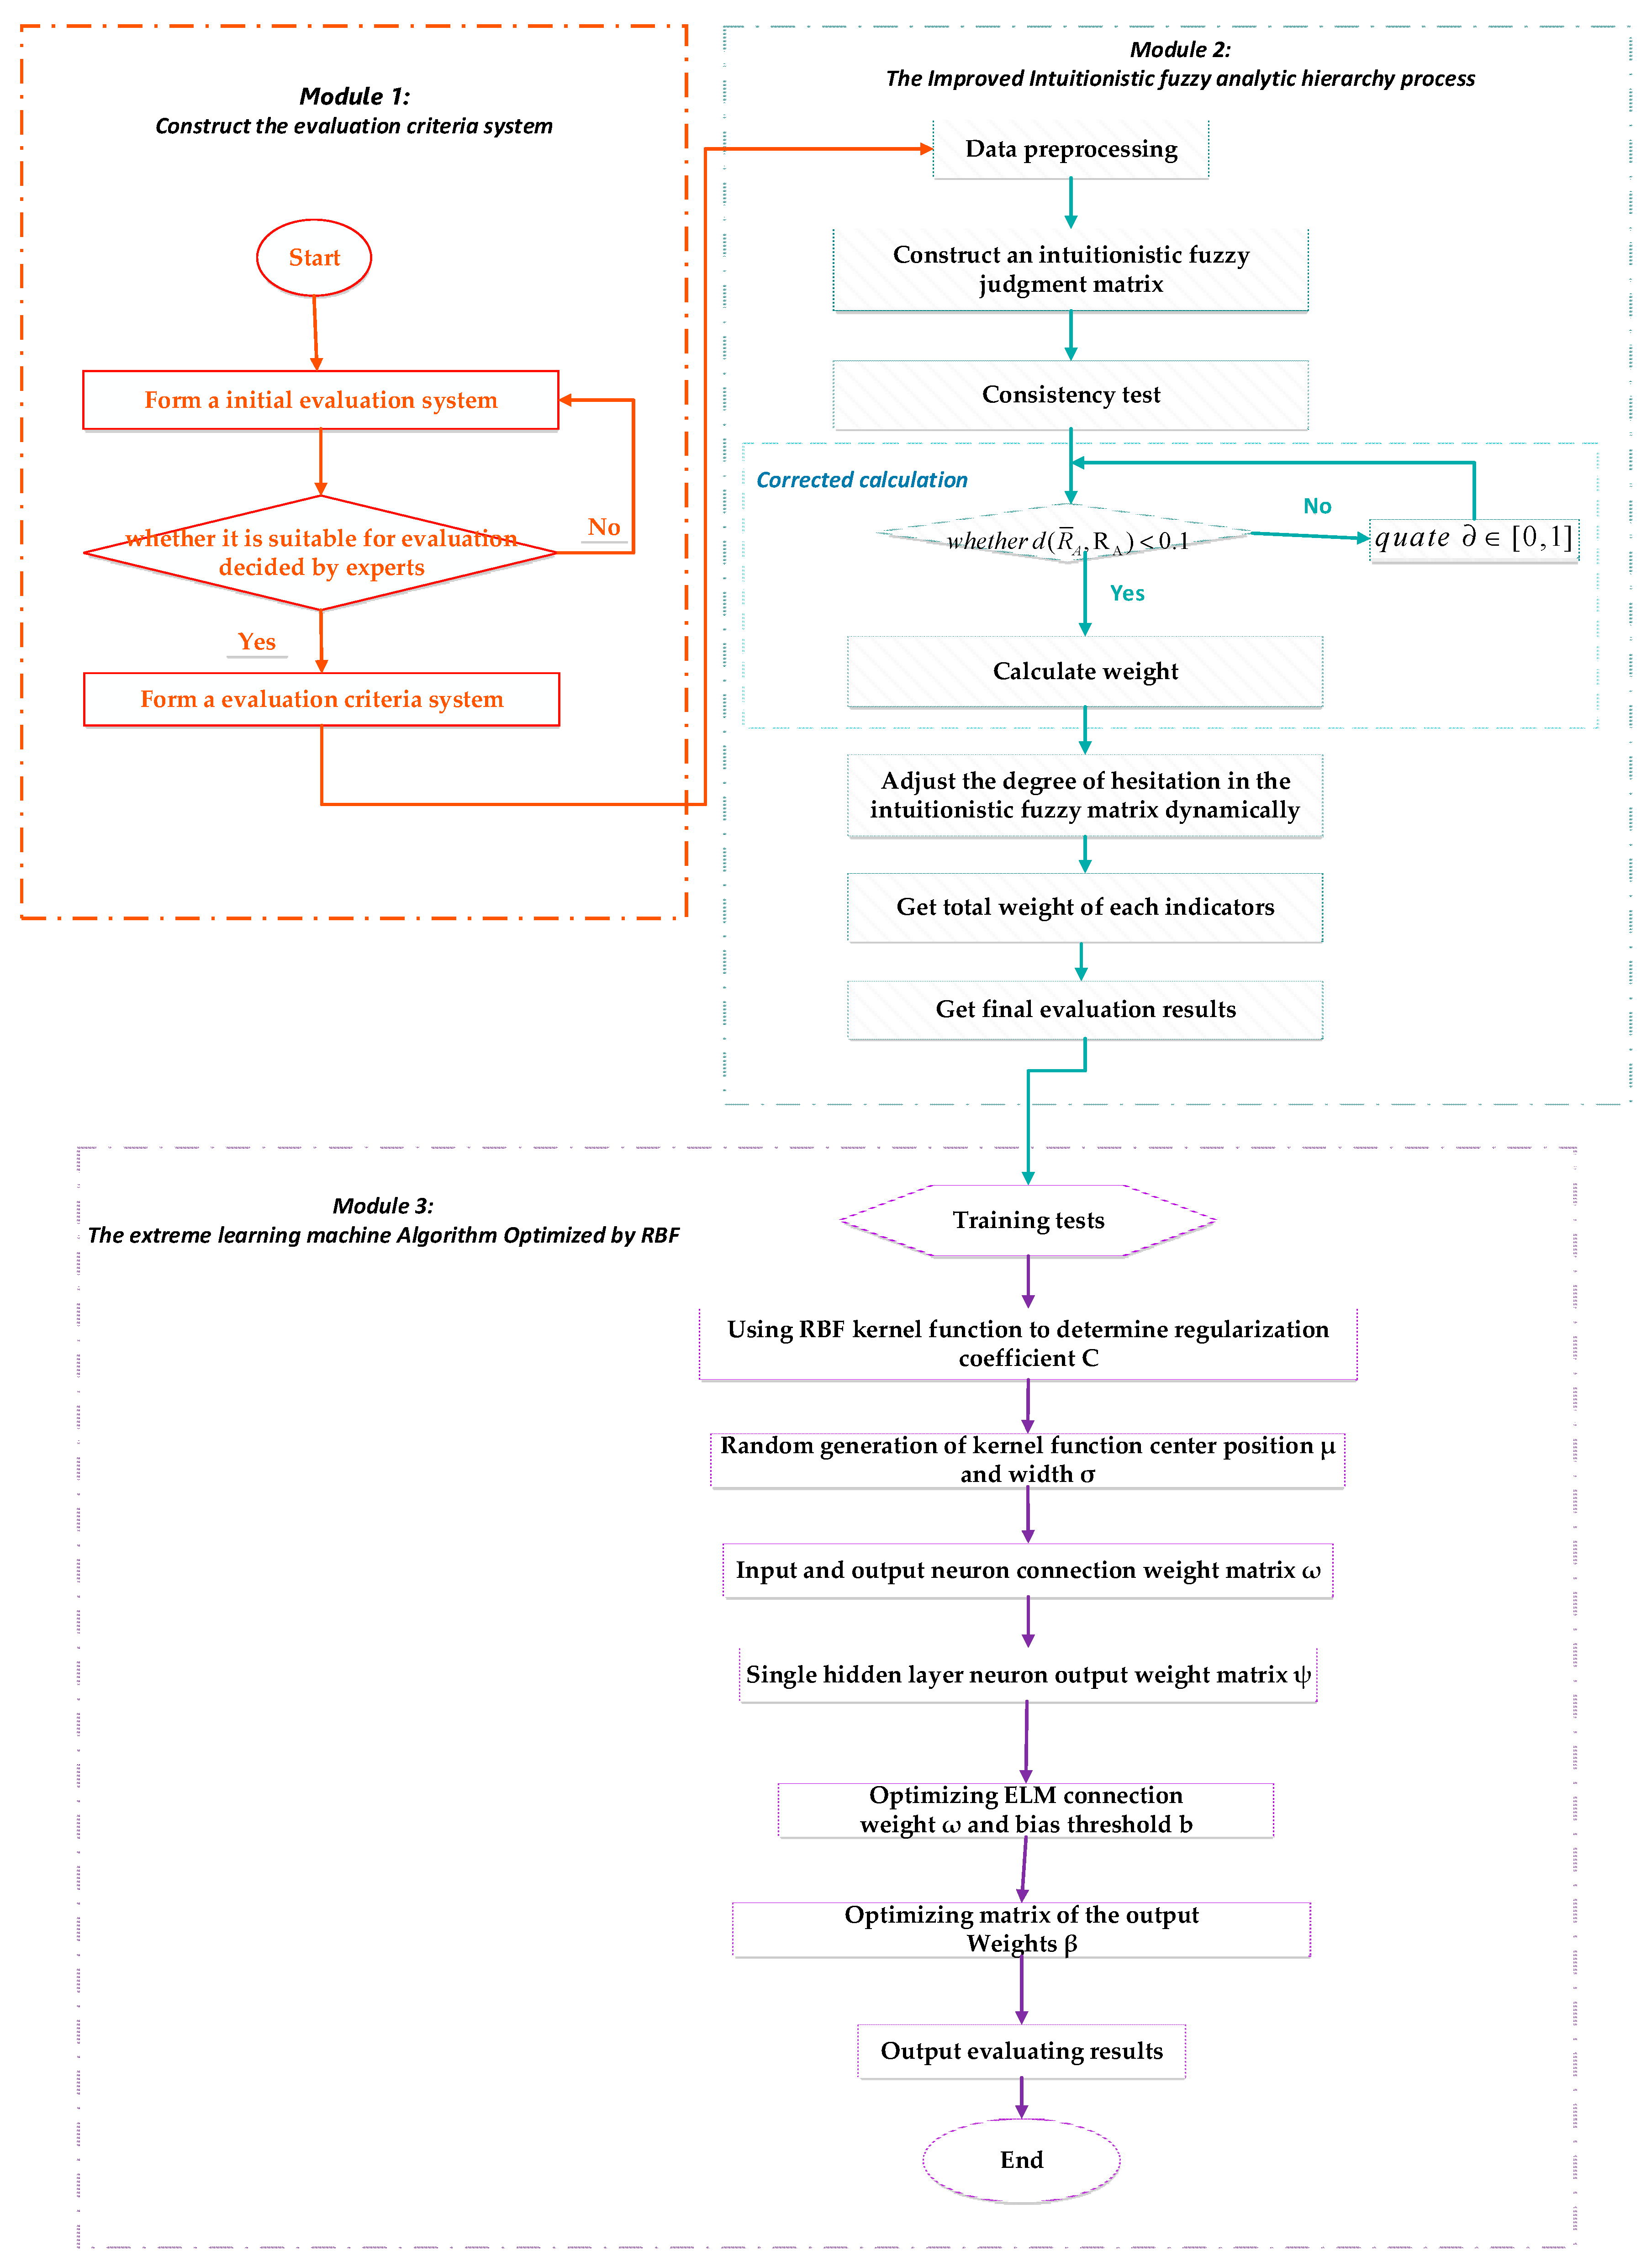
4.3. The Flow Chart of Evaluation Process

In summary, the overall process consists of three modules, which includes an evaluation indicator system module, an intuitionistic fuzzy comprehensive analytic hierarchy process based on improved dynamic hesitation degree (D-IFAHP) module and the RELM module. The overall flow chart is shown in Figure 3:

5. Case Study and Discussion

We select five power generation enterprises (①–⑤) in East China, North China, and South China and sort them by D-IFAHP. Then, we compare ranking results with other evaluation methods. Finally, we input the results of D-IFAHP to the training set of RELM algorithm to realize the evaluation process more intelligent.

5.1. Analysis of Low-Carbon Sustainability and Green Operation Benefits Based on D-IFAHP

Qualitative indicators are converted into quantitative indicators by using expert scoring. We invite several experts to score 0–100 and use the average as the final score of the indicator. We display analysis details of enterprise ① as follows.
According to the initial data of enterprise ① and the scores of experts, the intuitionistic fuzzy judgment matrix of enterprise ① is calculated. By arithmetically averaging the index preference relations given by experts, the intuition fuzzy preference relationship of both first and second level indicators are finally obtained. Some details are as shown in Table 7 and Table 8, other details are shown in Table A2 and Table A3 of Appendix A:
According to Formulas (9)–(17), the consistency judgment matrix of enterprise ① can be obtained:
R ¯ 1 = [ ( 0.50 ,   0.30 ,   0.20 ) ( 0.46 ,   0.42 ,   0.12 ) ( 0.35 ,   0.46 ,   0.19 ) ( 0.28 ,   0.41 ,   0.31 ) ( 0.42 ,   0.46 ,   0.12 ) ( 0.50 ,   0.30 ,   0.20 ) ( 0.35 ,   0.53   , 0.12 ) ( 0.33 ,   0.39 ,   0.28 ) ( 0.43 ,   0.34 ,   0.23 ) ( 0.52 ,   0.35 ,   0.13 ) ( 0.50 ,   0.30 ,   0.20 ) ( 0.48 ,   0.38 ,   0.86 ) ( 0.49 ,   0.23 ,   0.28 ) ( 0.39 ,   0.33 ,   0.28 ) ( 0.38 ,   0.48 ,   0 , 14 ) ( 0.50 ,   0.30 ,   0.20 ) ]
Calculate the distance between R 1 and R ¯ 1 to get d ( R ¯ 1 , R 1 ) = 0.2038 > 0.1 , which is faili ω 1 ω 2 ng the consistency test. It need further set the parameters to adjust distance. Let σ = 0.45 and use (18)–(24) to adjust the distance, so we get:
R ˜ 1 = [ ( 0.50 ,   0.30 ,   0.20 ) ( 0.46 ,   0.42 ,   0.12 ) ( 0.44 ,   0.39 ,   0.17 ) ( 0.36 ,   0.46 ,   0.18 ) ( 0.42 ,   0.46 ,   0.12 ) ( 0.50 ,   0.30 ,   0.20 ) ( 0.42 ,   0.44   , 0.14 ) ( 0.40 ,   0.41 ,   0.19 ) ( 0.49 ,   0.34 ,   0.17 ) ( 0.52 ,   0.33 ,   0.15 ) ( 0.50 ,   0.30 ,   0.20 ) ( 0.52 ,   0.35 ,   0.13 ) ( 0.51 ,   0.32 ,   0.17 ) ( 0.53 ,   0.29 ,   0.18 ) ( 0.38 ,   0.48 ,   0 , 14 ) ( 0.50 ,   0.30 ,   0.20 ) ]
After calculation, d ( R ˜ 1 , R 1 ) = 0.0824 < 0.1 . So, the matrix R ˜ 1 passes the consistency test. Then R ˜ 1 is substituted into (19) to calculate the first-level indicator weight:
ω 1 = ( 0.24 , 0.69 )
Similarly, based on the each-level indicator weight, the total weight of each indicator.
ω t = ω 1 ω 2 ω 3 = ( 0.24 , 0.69 ) ( 0.52 , 0.53 ) ( 0.31 , 0.63 ) = ( 0.03 , 0.94 )
The total weight of the enterprise ① can be obtained in Table 9.
After collecting enterprise ① total weight information for fuzzy information, we substitute it to (24), and get:
W 1 = j = 1 22 ω j = ( 0.03 , 0.94 ) ( 0.03 , 0.94 ) ( 0.02 , 0.93 ) ( 0.03 , 0.88 ) ( 0.03 , 0.87 ) ( 0.04 , 0.91 ) ( 0.03 , 0.88 ) ( 0.04 , 0.90 ) ( 0.03 , 0.89 ) ( 0.01 , 0.97 ) ( 0.01 , 0.97 ) ( 0.01 , 0.96 ) ( 0.01 , 0.96 ) ( 0.02 , 0.92 ) ( 0.02 , 0.92 ) ( 0.01 , 0.91 ) ( 0.01 , 0.88 ) ( 0.02 , 0.93 ) ( 0.01 , 0.91 ) ( 0.02 , 0.93 ) ( 0.03 , 0.89 ) ( 0.02 , 0.86 ) = ( 0.45 , 0.16 )
Similarly, information aggregation for enterprises ②, ③, ④, and ⑤ can also be obtained:
W 2 = j = 1 22 ω j = ( 0.51 ,   0.07 )
W 3 = j = 1 22 ω j = ( 0.52 ,   0.09 )
W 4 = j = 1 22 ω j = ( 0.52 ,   0.10 )
W 5 = j = 1 22 ω j = ( 0.57 ,   0.12 )
Substituting the above aggregated results into (25), the final evaluation results are shown in Table 10.

5.2. Comparative Analysis of Low-Carbon Sustainability and Green Operation Benefits Based on D-IFAHP, IFAHP, and FAHP

In order to further verify the proposed D-IFAHP has better performance in flexibility and practicability, we apply the same data input to the traditional IFAHP method and the FAHP method; all evaluation results are shown in Table 11 and Figure 4:

5.3. Low-Carbon Sustainability and Green Operation Benefits of Power Generation Enterprises Based on D-IFAHP-RELM Evaluation Model

Based on the D-IFAHP evaluation result, we used sample data of the five power generation enterprises as the input data of RELM model. The parameters of RELM evaluation model are shown in Table 12:
In order to compare the rationality and superiority, we compared the assessment results of artificial neural network (ANN), ELM, and RELM, training results of different evaluation models are shown in Figure 5.
The relative error of ANN, ELM, and RELM models are shown in Table 13.

5.4. Discussions

Based on the case study comparison, some discussion results can be obtained:
(1) Table 11 and Figure 4 show that the evaluation results of the FAHP and IFAHP methods cannot clearly show difference between the indicators of the sustainable operation efficiency of energy-saving and emission reduction of power generation enterprises. Compared with the D-IFAHP and IFAHP methods, the resolution of D-IFAHP is higher. Therefore, D-IFAHP can better reflect the difference in the sustainable operational benefits of energy conservation and emission reduction of five power generation enterprises.
(2) From Figure 5 and Table 13, we can conclude that average relative error of the RELM evaluation model is the smallest, so the test results of which are more accurate. Therefore, it can be used in low-carbon sustainability and green operation benefits of power generation enterprises.
(3) If the sample data is small, we can directly use the D-IFAHP evaluation model proposed in the paper for evaluation. However, when the evaluation sample increases, continuing to use D-IFAHP will increase the difficulty and time cost of the calculation. The D-IFAHP-RELM evaluation model proposed in this paper can solve this problem. Firstly, some samples are evaluated by D-IFAHP, and this part of the sample is used as the input of RELM model of training sets. After obtaining the optimal parameters of the model, the RELM model is used to complete the evaluation procedure of the remaining samples, which can avoid complex calculation processes.

6. Conclusions

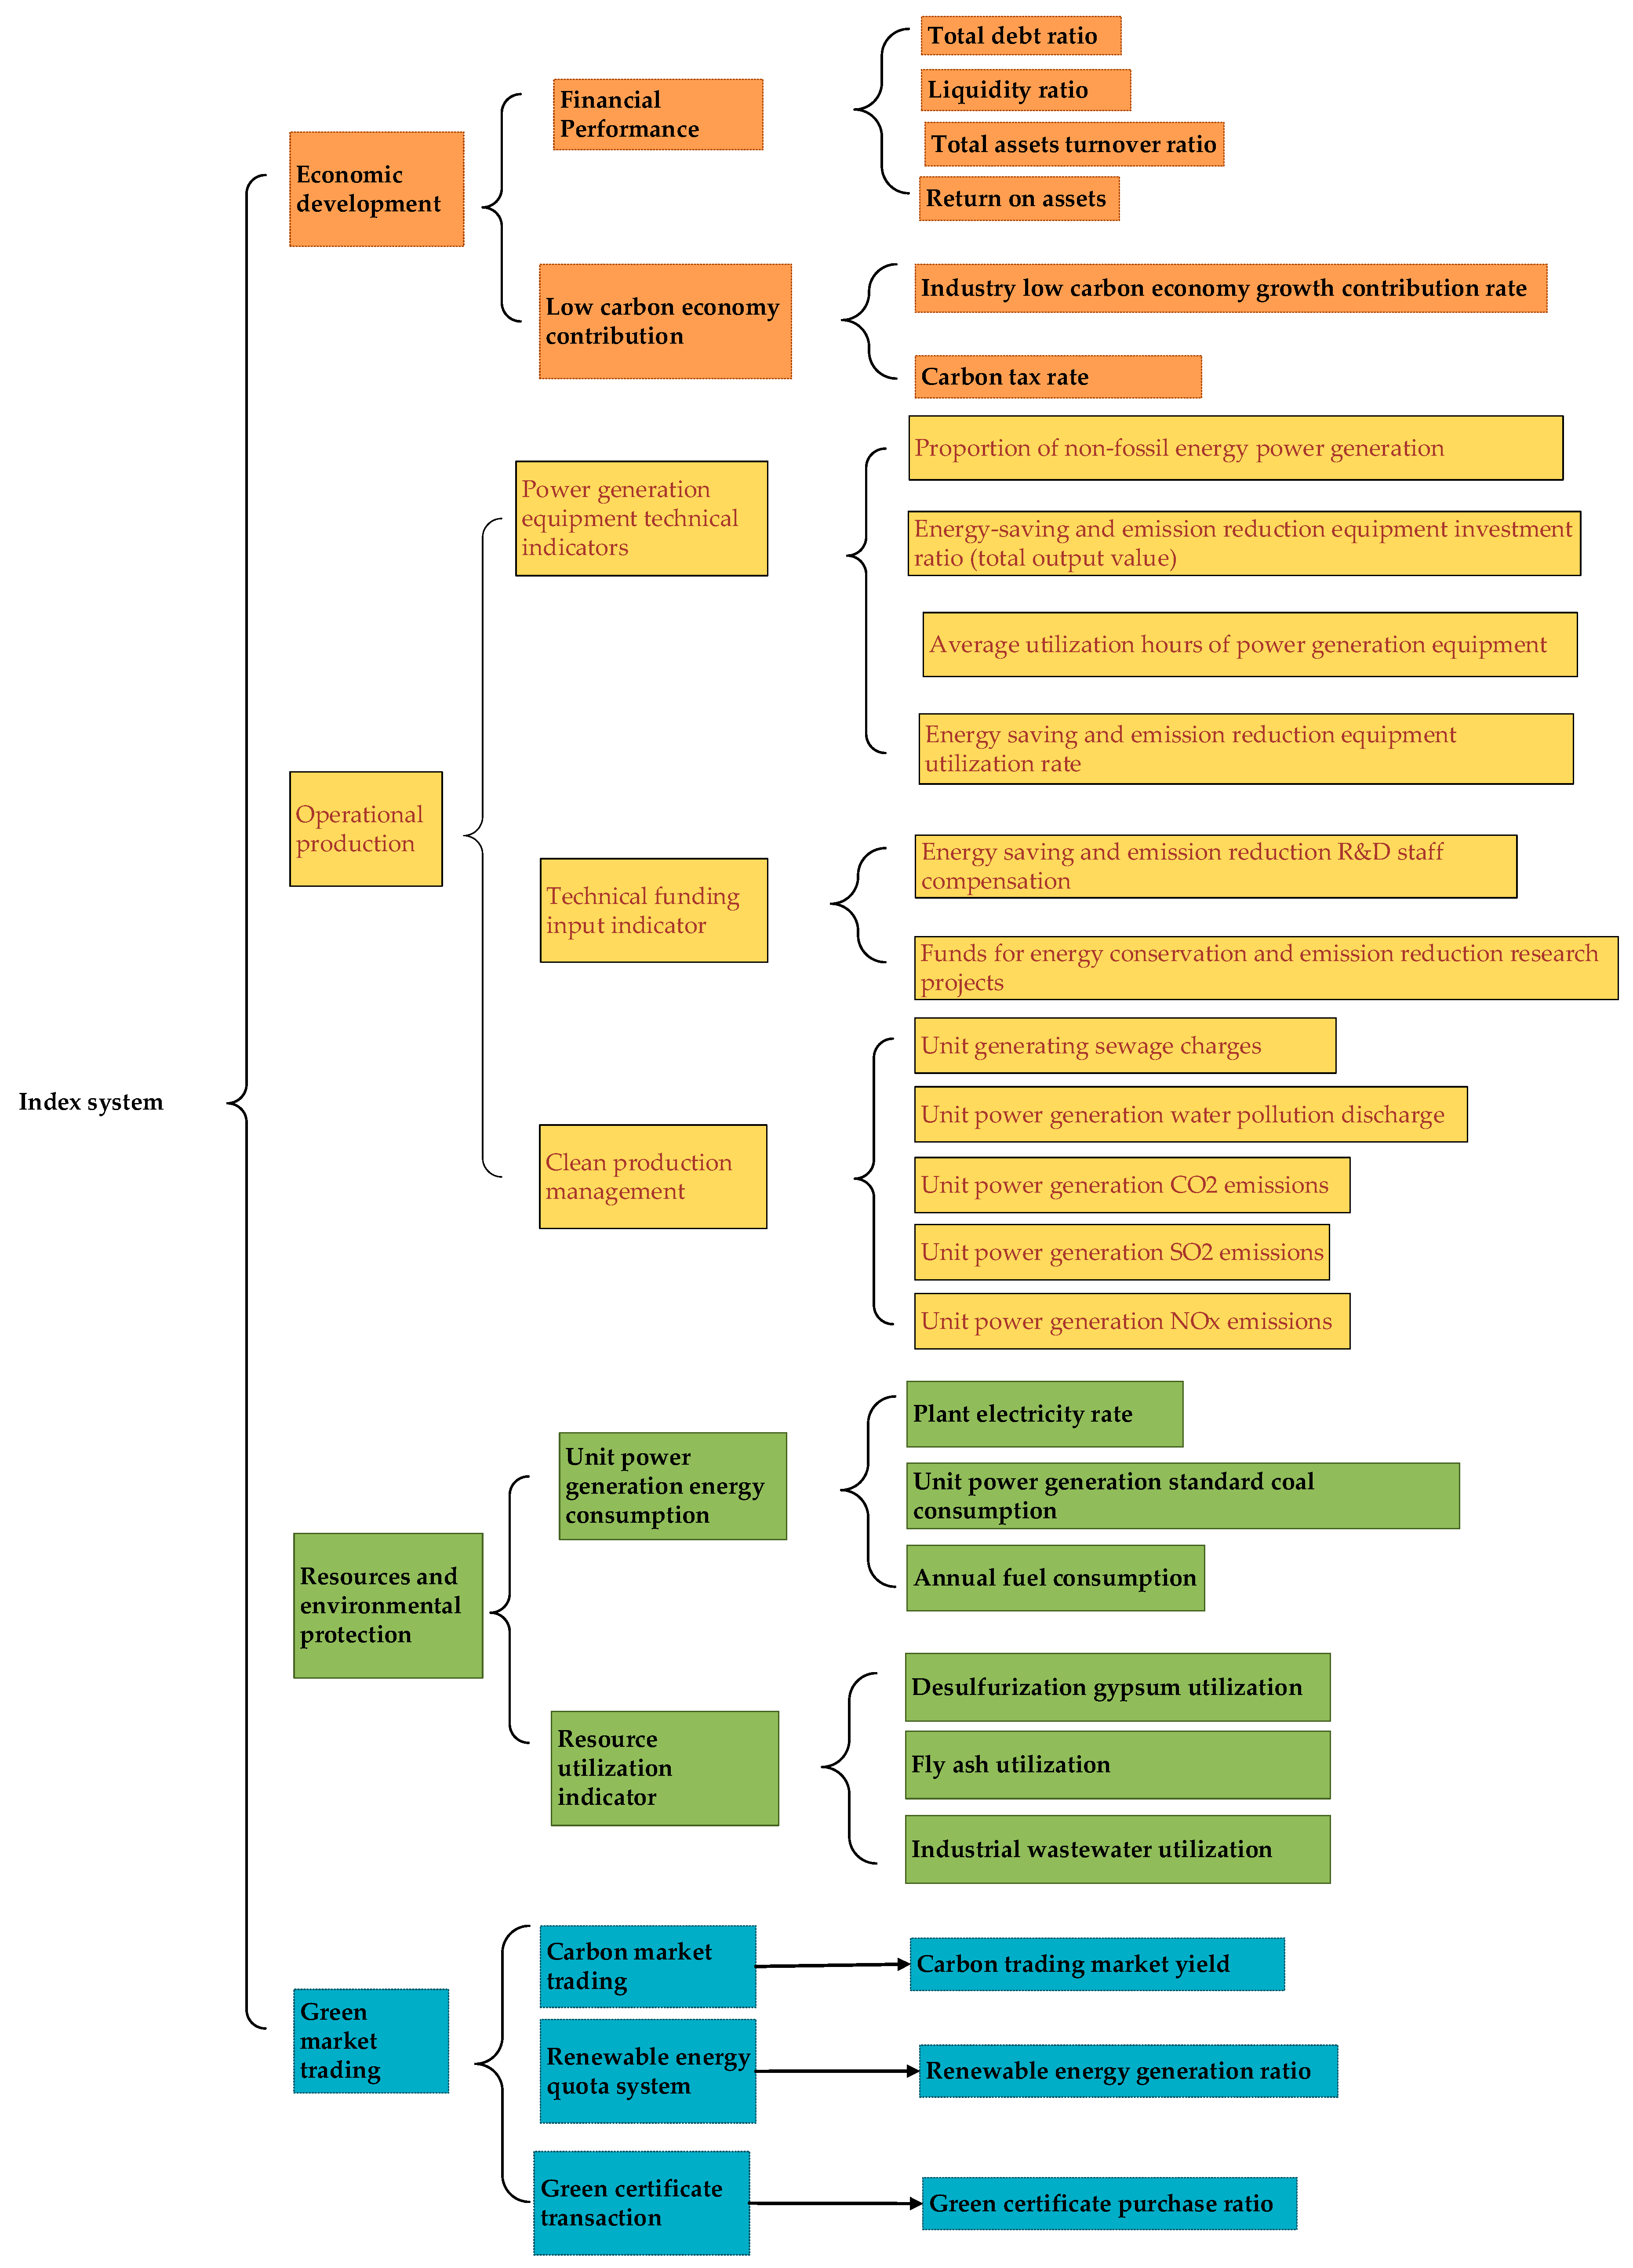
In order to evaluate the low-carbon sustainability and green operation benefits of power generation enterprises, we chose 26 indicators from economic development, operational production, resources and environmental protection, and green market trading based on the extensive literature research. Through the dynamic hesitancy degree improved intuitionistic fuzzy AHP method (D-IFAHP), we improved the traditional intuitionistic fuzzy AHP method by the rationality of objectivity. Then, the RELM intelligent algorithm is applied to avoid complex calculation processes.
Main results of this paper are as follows:
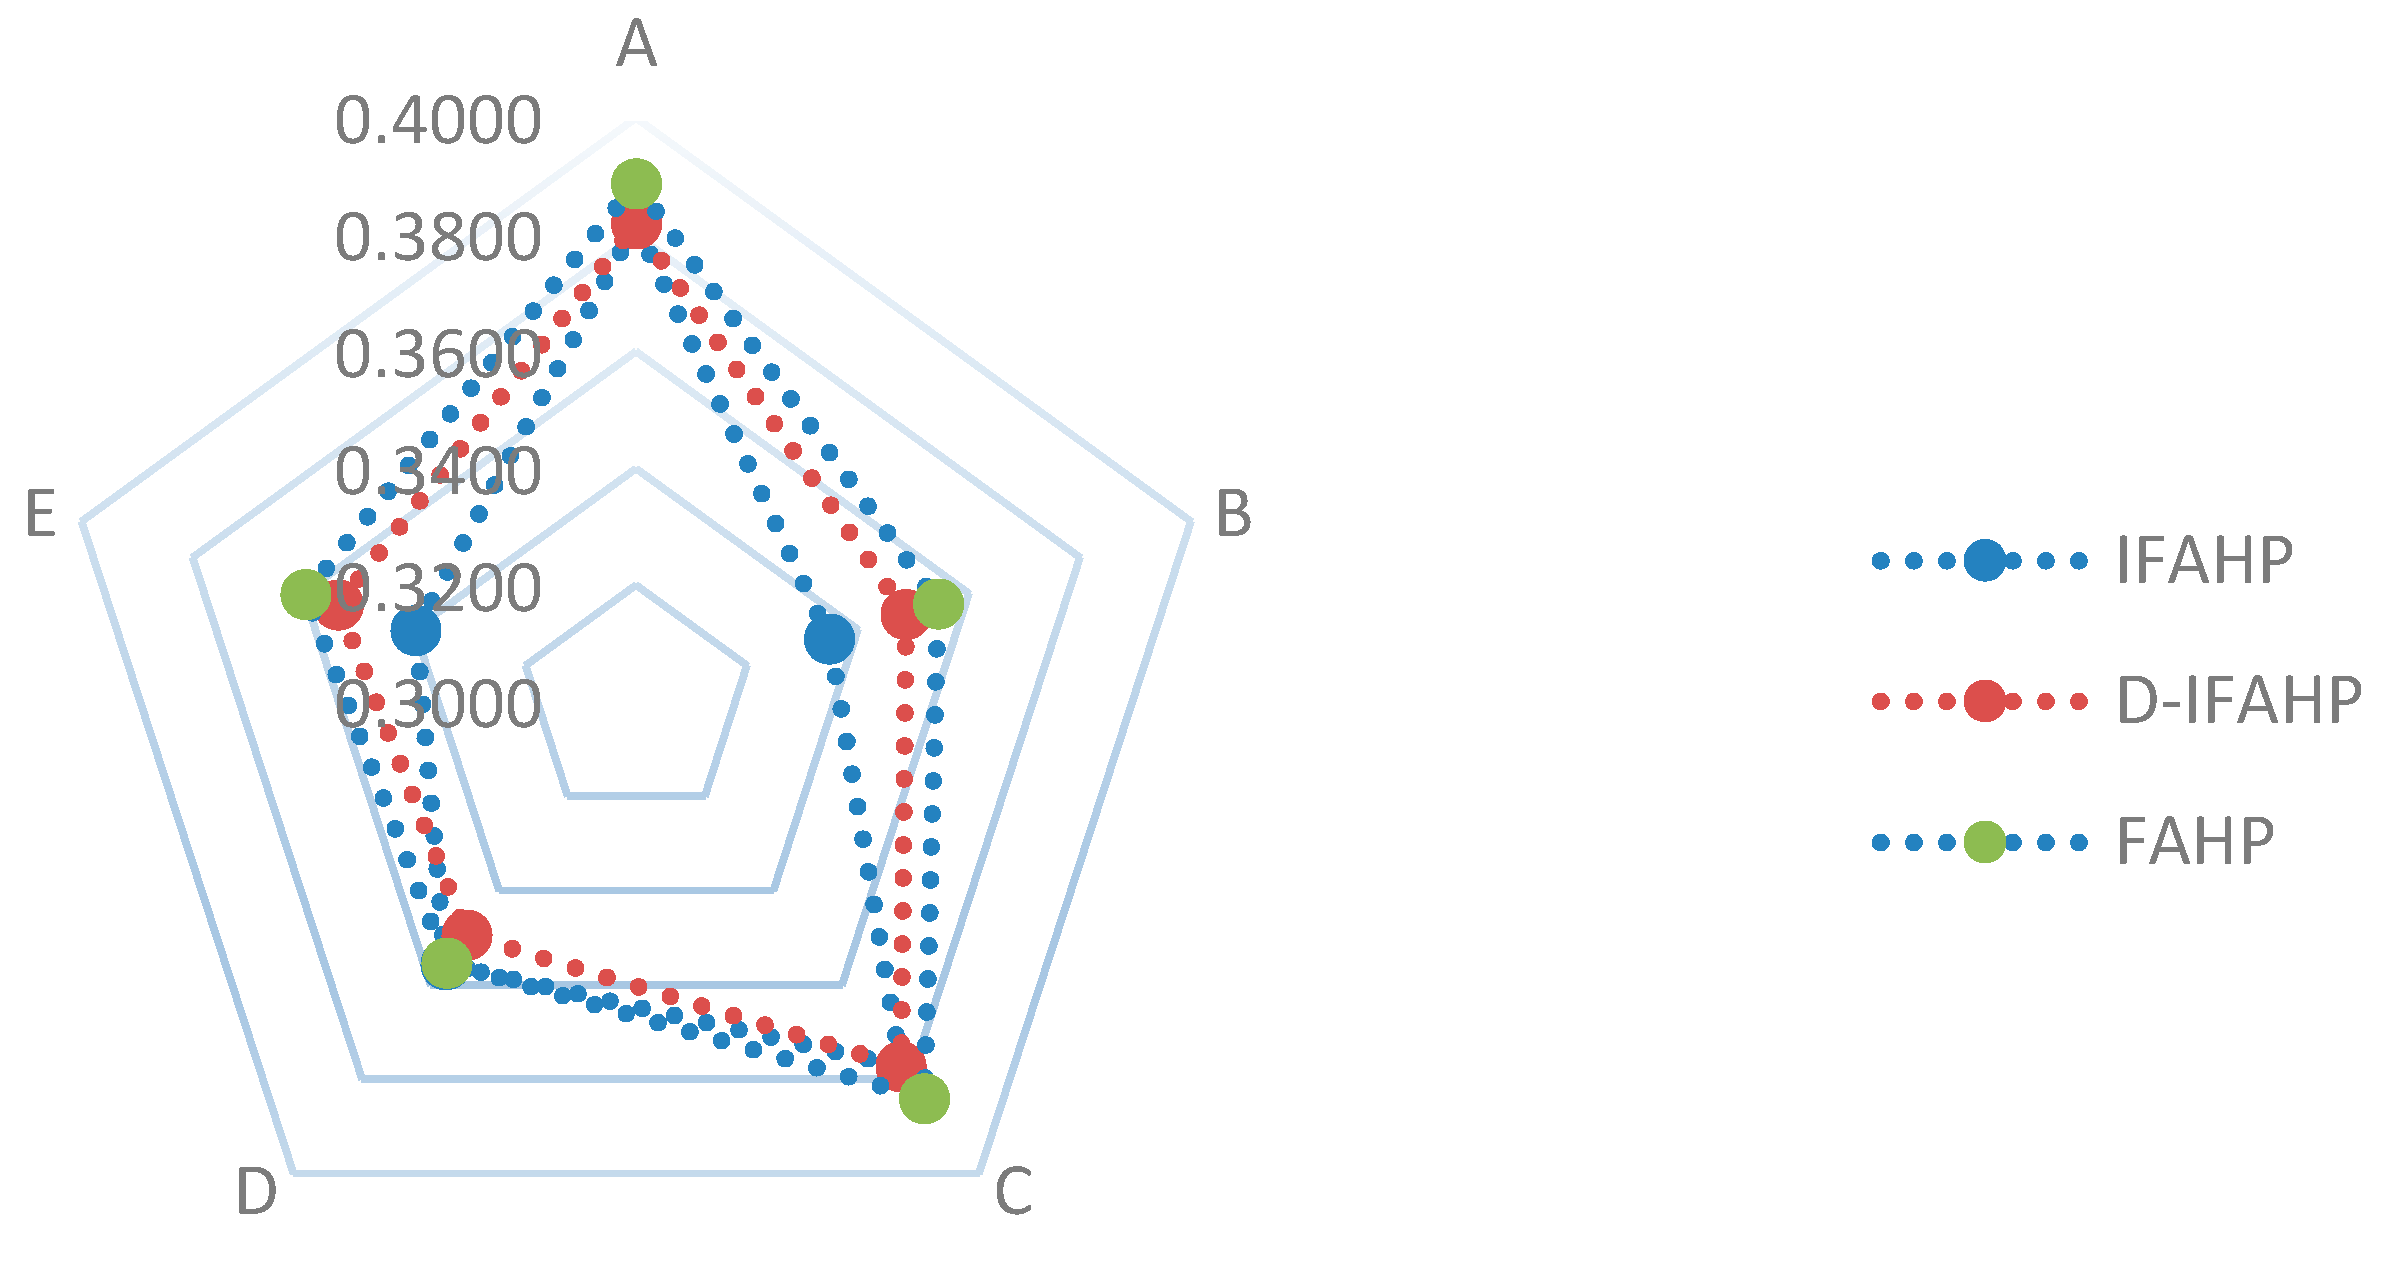
(1) The shortcomings of the traditional IFAHP and FAHP are proved, which is lack of objectivity. Therefore, decision makers cannot express abstention or hesitancy. Based on the IFAHP, a new parameter (nonmembership function) is added and then a new fuzzy set is formed, which has stronger flexibility. Empirical analysis proves the accuracy of low-carbon sustainability and green operation benefits evaluation of D-IFAHP.
(2) RELM intelligent algorithm can improve the accuracy and speed of traditional ELM algorithm. The evaluation results based on D-IFAHP can quickly be applied as input of RELM model, which can simplify the calculation process of large amount of sample data and reduce the time cost.
(3) D-IFAHP- RELM model is suitable for low-carbon sustainability and green operation benefits for power generation enterprises. The application of RELM algorithm will greatly improve the speed of evaluation. As long as the index value of the company is used as the input of the RELM algorithm, the evaluation grades and results of each company can be obtained quickly. Therefore, the low-carbon sustainability and green operation benefits evaluation system proposed in this paper has effective operation and heterogeneity and practical performance, which can effectively improve the sustainable profit of power companies and ultimately realize China’s energy transformation.

Author Contributions

In this research activity, all authors were involved in the data collection and preprocessing phase, model constructing, empirical research, results analysis and discussion, and manuscript preparation. All authors have approved the submitted manuscript.

Funding

This research was funded by the National Natural Science Foundation of China, grant number (71573084), the Beijing Municipal Social Science Foundation, grant number (16JDYJB044), the 2018 key Projects of Philosophy and Social Sciences Research, Ministry of Education, China (18JZD032), and the Fundamental Research Funds for the Central Universities (2019QN067).

Acknowledgments

The completion of this paper has been helped by many teachers and classmates. We would like to express our gratitude to them for their help and guidance.

Conflicts of Interest

The authors declare no conflict of interest.

Appendix A

Table A1. Average scores of preliminary indicators.
DimensionIndicatorsAverage ScoreWhether to Keep
Economic developmentTotal debt ratio88.3
Liquidity ratio84.6
Total assets turnover ratio86.9
Return on assets87.8
industry low carbon economy growth contribution89.3
Carbon tax rate90.2
Operational productionProportion of non-fossil energy generation86.3
Energy-saving and emission reduction equipment investment ratio78.5
Average utilization hours of power generation equipment77.3
Energy saving and emission reduction equipment utilization rate75.6
Energy saving and emission reduction R&D staff compensation67.4
Funds for energy conversation and emission reduction research projects68.5
Unit generating sewage charges86.3
Unit power generation water pollution discharge82.0
Unit power generation CO2 emissions88.3
Unit power generation SO2 emissions85.4
Unit power generation NOx emissions83.7
Energy-saving equipment usage rate73.1
Environmental equipment investment rate49.4×
Unit power generation water withdrawal38.2×
Standard coal consumption rate44.7×
Resources and environmental protectionPlant electricity rate86.4
Unit power generation standard coal consumption82.5
Annual fuel consumption81.6
Desulfurization gypsum utilization83.4
Fly ash utilization81.5
Industrial wastewater utilization63.9
Noise compliance rate20.5×
Pollutant discharge compliance rate49.9×
Desulfurization efficiency rate39.9×
Green market tradingCarbon trading market yield89.3
Renewable energy generation ratio83.6
Green certificate purchase ratio88.3
Renewable energy quota ratio46.2×
Table A2. Intuition fuzzy preference relationship of operational production indicators.
B1B2B3B4B5B6B7B8B9B10B11
B1(0.50, 0.30, 0.20)(0.40, 0.45, 0.15)(0.50, 0.30, 0.20)(0.50, 0.30, 0.20)(0.50, 0.30, 0.20)(0.30, 0.60, 0.10)(0.50, 0.30, 0.20)(0.30, 0.60, 0.10)(0.50, 0.30, 0.20)(0.50, 0.30, 0.20)(0.50, 0.30, 0.20)
B2(0.40, 0.45, 0.15)(0.50, 0.30, 0.20)(0.50, 0.30, 0.20)(0.50, 0.30, 0.20)(0.30, 0.60, 0.10)(0.50, 0.30, 0.20)(0.40, 0.45, 0.15)(0.40, 0.45, 0.15)(0.40, 0.45, 0.15)(0.40, 0.45, 0.15)(0.40, 0.45, 0.15)
B3(0.50, 0.30, 0.20)(0.30, 0.60, 0.10)(0.40, 0.45, 0.15)(0.30, 0.60, 0.10)(0.50, 0.30, 0.20)(0.40, 0.45, 0.15)(0.50, 0.30, 0.20)(0.50, 0.30, 0.20)(0.50, 0.30, 0.20)(0.50, 0.30, 0.20)(0.50, 0.30, 0.20)
B4(0.30, 0.60, 0.10)(0.40, 0.45, 0.15)(0.50, 0.30, 0.20)(0.50, 0.30, 0.20)(0.30, 0.60, 0.10)(0.50, 0.30, 0.20)(0.30, 0.60, 0.10)(0.30, 0.60, 0.10)(0.50, 0.30, 0.20)(0.30, 0.60, 0.10)(0.40, 0.45, 0.15)
B5(0.50, 0.30, 0.20)(0.50, 0.30, 0.20)(0.30, 0.60, 0.10)(0.40, 0.45, 0.15)(0.50, 0.30, 0.20)(0.40, 0.45, 0.15)(0.40, 0.45, 0.15)(0.40, 0.45, 0.15)(0.40, 0.45, 0.15)(0.40, 0.45, 0.15)(0.50, 0.30, 0.20)
B6(0.40, 0.45, 0.15)(0.40, 0.45, 0.15)(0.30, 0.60, 0.10)(0.50, 0.30, 0.20)(0.40, 0.45, 0.15)(0.50, 0.30, 0.20)(0.40, 0.45, 0.15)(0.50, 0.30, 0.20)(0.50, 0.30, 0.20)(0.40, 0.45, 0.15)(0.30, 0.60, 0.10)
B7(0.50, 0.30, 0.20)(0.40, 0.45, 0.15)(0.50, 0.30, 0.20)(0.40, 0.45, 0.15)(0.50, 0.30, 0.20)(0.50, 0.30, 0.20)(0.50, 0.30, 0.20)(0.60, 0.25, 0.15)(0.40, 0.45, 0.15)(0.50, 0.30, 0.20)(0.50, 0.30, 0.20)
B8(0.40, 0.45, 0.15)(0.50, 0.30, 0.20)(0.40, 0.45, 0.15)(0.50, 0.30, 0.20)(0.40, 0.45, 0.15)(0.50, 0.30, 0.20)(0.30, 0.60, 0.10)(0.30, 0.60, 0.10)(0.20, 0.75, 0.05)(0.30, 0.60, 0.10)(0.40, 0.45, 0.15)
B9(0.50, 0.30, 0.20)(0.30, 0.60, 0.10)(0.50, 0.30, 0.20)(0.40, 0.45, 0.15)(0.50, 0.30, 0.20)(0.30, 0.60, 0.10)(0.40, 0.45, 0.15)(0.50, 0.30, 0.20)(0.60, 0.25, 0.15)(0.30, 0.60, 0.10)(0.50, 0.30, 0.20)
B10(0.30, 0.60, 0.10)(0.50, 0.30, 0.20)(0.40, 0.45, 0.15)(0.50, 0.30, 0.20)(0.50, 0.30, 0.20)(0.40, 0.45, 0.15)(0.50, 0.30, 0.20)(0.70, 0.20, 0.10)(0.30, 0.60, 0.10)(0.40, 0.45, 0.15)(0.50, 0.30, 0.20)
B11(0.40, 0.45, 0.15)(0.40, 0.45, 0.15)(0.30, 0.60, 0.10)(0.30, 0.60, 0.10)(0.40, 0.45, 0.15)(0.50, 0.30, 0.20)(0.30, 0.60, 0.10)(0.50, 0.30, 0.20)(0.30, 0.60, 0.10)(0.50, 0.30, 0.20)(0.30, 0.60, 0.10)
Table A3. Intuition fuzzy preference relationship of resources and environmental protection indicators.
C1C2C3C4C5C6
C1(0.40, 0.45, 0.15)(0.50, 0.30, 0.20)(0.30, 0.60, 0.10)(0.40, 0.45, 0.15)(0.40, 0.45, 0.15)(0.40, 0.45, 0.15)
C2(0.50, 0.30, 0.20)(0.40, 0.45, 0.15)(0.40, 0.45, 0.15)(0.50, 0.30, 0.20)(0.40, 0.45, 0.15)(0.40, 0.45, 0.15)
C3(0.30, 0.60, 0.10)(0.50, 0.30, 0.20)(0.50, 0.30, 0.20)(0.40, 0.45, 0.15)(0.50, 0.30, 0.20)(0.50, 0.30, 0.20)
C4(0.50, 0.30, 0.20)(0.50, 0.30, 0.20)(0.40, 0.45, 0.15)(0.50, 0.30, 0.20)(0.50, 0.30, 0.20)(0.30, 0.60, 0.10)
C5(0.40, 0.45, 0.15)(0.40, 0.45, 0.15)(0.50, 0.30, 0.20)(0.30, 0.60, 0.10)(0.40, 0.45, 0.15)(0.30, 0.60, 0.10)
C6(0.50, 0.30, 0.20)(0.50, 0.30, 0.20)(0.30, 0.60, 0.10)(0.30, 0.60, 0.10)(0.50, 0.30, 0.20)(0.30, 0.60, 0.10)

References

  1. Wang, Q.; Jiang, R. Is China’s economic growth decoupled from carbon emissions? J. Clean. Prod. 2019, 225, 1194–1208. [Google Scholar] [CrossRef]
  2. Bao, C.; Xu, M.T. Cause and effect of renewable energy consumption on urbanization and economic growth in China’s provinces and regions. J. Clean. Prod. 2019, 231, 483–493. [Google Scholar] [CrossRef]
  3. Song, X.G.; Zhou, Y.X.; Jia, W. How do Economic Openness and R&D Investment Affect Green Economic Growth?—Evidence from China. Resour. Conserv. Recycl. 2019, 146, 405–415. [Google Scholar]
  4. Lu, W.L. Research on Safety Lean Management and Implementation Effect Evaluation Thermal Power Enterprise. Master’s Thesis, North China Electric Power University, Beijing, China, 2017. [Google Scholar]
  5. Shi, Q.S.; Tu, N. The application of hierarchy gray assessment in safety evaluation of power plant. J. Shanghai Inst. Electr. Power 2005, 1, 81–84. [Google Scholar]
  6. Li, C.; Yang, Z.X.; Song, L. Construction and application of synthetic safety assessment model for power plants. Comput. Eng. Appl. 2010, 2, 230–233. [Google Scholar]
  7. Li, W.; Wang, J.; Niu, D.X. Competitive ability evaluation for generation enterprises based on combinational weight. J. North China Electr. Power Univ. 2006, 5, 93–96. [Google Scholar]
  8. Li, H.Z.; He, H.F.; Guo, X. Evaluation of independent generation’s competence after separation of grid and generation. Power Syst. Technol. 2004, 20, 7–10. [Google Scholar]
  9. Zhang, L.H.; Gu, R.; Wu, Y.F. The source and evaluation model on the competitiveness of generation enterprises. Value Eng. 2006, 2, 75–78. [Google Scholar]
  10. Liu, L.Z. Opinion and Evaluation of Cleaner Production in Thermal Power Industry; Energy Environmental Protection: Hartford, CT, USA, 2011; Volume 1, pp. 62–64. [Google Scholar]
  11. Ren, Y.L.; Liu, N.; Liu, H. A Comprehensive Evaluation of DEA of China’s Thermal Power Industry Efficiency Turn towards the Coordinated development of electricity energy and environment. East China Econ. Manag. 2011, 4, 80–82. [Google Scholar]
  12. Jia, H.J.; Haung, X.C.; Xie, Y.P. Assessment and Analysis of Cleaner Production Standard in the Power Plant Industry; Energy Environmental Protection: Hartford, CT, USA, 2010; Volume 2, pp. 54–57. [Google Scholar]
  13. Chen, Q.X.; Zhou, T.R.; Kang, C.Q.; Xia, Q. An Assessment Model of Low-carbon Effect and Its Application to Energy Saving Based Generation Dispatching. Autom. Electr. Power Syst. 2009, 16, 24–29. [Google Scholar]
  14. Shi, Y. Research on the Performance Evaluation of Energy-Saving and Emission Reduction in Electric Power Industry. Master’s Thesis, North China Electric Power University, Beijing, China, 2010. [Google Scholar]
  15. He, W.; Qin, N.; He, K.H.; Xu, F.L.; Wang, Y. Monitoring and evaluation of energy-saving and pollution reduction performance (ESPRP)and its coordination with economic benefit. Acta Sci. Circumstantiae 2010, 7, 1499–1509. [Google Scholar]
  16. Liu, Q.Y. The Study on Comprehensive Evaluation about Energy-Saving and Emission Reduction Contribution Effect of Power Grid Enterprise. Master’s Thesis, North China Electric Power University, Beijing, China, 2012. [Google Scholar]
  17. Zhu, C.Y. Donghua Thermal Power Plant Energy Conservation Technology Path Design and Evalution. Master’s Thesis, North China Electric Power University, Beijing, China, 2014. [Google Scholar]
  18. Zhao, X.Y. Study on Performance Evaluation of Energy-Saving and Emission Reduction in Thermal Power Enterprises. Master’s Thesis, North China Electric Power University, Beijing, China, 2017. [Google Scholar]
  19. Bai, L.B.; Li, Y.; Du, Q.; Xu, Y.D. A Fuzzy Comprehensive Evaluation Model for Sustainability Risk Evaluation of PPP Projects. Sustainability 2017, 9, 1890. [Google Scholar] [CrossRef]
  20. Li, H.; Dong, K.Y.; Jiang, H.D.; Sun, R.J.; Guo, X.Y.; Fan, Y.Q. Risk Assessment of China’s Overseas Oil Refining Investment Using a Fuzzy-Grey Comprehensive Evaluation Method. Sustainability 2017, 9, 696. [Google Scholar] [CrossRef]
  21. Zhao, H.R.; Li, N. Performance Evaluation for Sustainability of Strong Smart Grid by Using Stochastic AHP and Fuzzy TOPSIS Methods. Sustainability 2016, 8, 129. [Google Scholar] [CrossRef]
  22. Atanassov, K.T. Intuitionistic Fuzzy Sets. Fuzzy Sets Syst. 1986, 20, 87–96. [Google Scholar] [CrossRef]
  23. Atanassov, K.T. Remarks on the Intuitionistic Fuzzy Sets. Fuzzy Sets Syst. 1992, 51, 117–118. [Google Scholar] [CrossRef]
  24. Atanassov, K.T. New Operations Defined over the Intuitionistic Fuzzy Sets. Fuzzy Sets Syst. 1994, 61, 137–142. [Google Scholar] [CrossRef]
  25. Wu, Y.N.; Xie, C.; Xu, C.B.; Li, F. A Decision Framework for Electric Vehicle Charging Station Site Selection for Residential Communities under an Intuitionistic Fuzzy Environment: A Case of Beijing. Energies 2017, 10, 1270. [Google Scholar] [CrossRef]
  26. Zhang, X.L. New Interval-Valued Intuitionistic Fuzzy Behavioral MADM Method and Its Application in the Selection of Photovoltaic Cells. Energies 2016, 9, 835. [Google Scholar] [CrossRef]
  27. Xu, Z.S.; Liao, H. Intuitionistic Fuzzy Analytic Hierarchy Process. IEEE Trans. Fuzzy Syst. 2014, 22, 749–761. [Google Scholar] [CrossRef]
  28. Gao, T.L.; Na, S.Y.; Dang, X.H.; Zhang, Y.L. Study of the Competitiveness of Quanzhou Port on the Belt and Road in China Based on a Fuzzy-AHP and ELECTRE III Model. Sustainability 2018, 10, 1253. [Google Scholar] [CrossRef]
  29. Dai, S.Y.; Niu, D.X. Comprehensive Evaluation of the Sustainable Development of Power Grid Enterprises Based on the Model of Fuzzy Group Ideal Point Method and Combination Weighting Method with Improved Group Order Relation Method and Entropy Weight Method. Sustainability 2017, 9, 1900. [Google Scholar]
  30. Sun, W.; Wang, C.F.; Zhang, C.C. Factor analysis and forecasting of CO2 emissions in Hebei, using extreme learning machine based on particle swarm optimization. J. Clean. Prod. 2017, 162, 1095–1101. [Google Scholar] [CrossRef]
  31. Sun, W.; Sun, J.Y. Prediction of carbon dioxide emissions based on principal component analysis with regularized extreme learning machine: The case of China. Environ. Eng. Res. 2017, 22, 302–311. [Google Scholar] [CrossRef] [Green Version]
  32. Li, M.L.; Wang, W.; De, G.J.R.F.; Ji, X.H.; Tan, Z.F. Forecasting Carbon Emissions Related to Energy Consumption in Beijing-Tianjin-Hebei Region Based on Grey Prediction Theory and Extreme Learning Machine Optimized by Support Vector Machine Algorithm. Energies 2018, 11, 2475. [Google Scholar] [CrossRef]
  33. Guo, B.X.; Li, J. Kernel extreme learning machine for indoor positioning in location finger printing. Comput. Eng. Appl. 2016, 52, 78–83. [Google Scholar]
  34. Huang, G.B.; Bai, Z.; Kasun, L.L.C.; Vong, C.M. Local respective fields based extreme learning machine. IEEE Comput. Intell. 2015, 10, 18–29. [Google Scholar] [CrossRef]
  35. Wu, J.J. Short-Term Wind Power Prediction Research Based on Extreme Learning Machine. Master’s Thesis, North China Electric Power University, Beijing, China, 2017. [Google Scholar]
Figure 1. Low-carbon sustainability and green operation benefits evaluation index system of power generation enterprises.
Processes 07 00474 g001
Figure 2. The topological structure of the extreme learning machine algorithm.
Processes 07 00474 g002
Figure 3. Flow chart of comprehensive evaluation of low-carbon sustainability and green operation benefits to power generation enterprises.
Processes 07 00474 g003
Figure 4. Comparison of comprehensive evaluation values of different evaluation methods.
Processes 07 00474 g004
Figure 5. Training results of RELM and ELM evaluation models: (a) Training results of artificial neural network (ANN) model; (b) Training results of ELM model; (c) Training results of RELM model.
Processes 07 00474 g005aProcesses 07 00474 g005b
Table 1. Economic development indicators.
IndicatorDescription
Total debt ratio (A1)The ability to use creditors to provide funds for business activities
Liquidity ratio (A2)The ability to repay short-term debt
Total assets turnover ratio (A3)Net income/Average total assets
Return on assets (A4)Net profit per unit of assets
Industry low carbon economy growth contribution rate (A5)The output value of the cleaning unit/Total output value of the industry
Carbon tax rate (A6)Carbon tax cost/Total tax
Table 2. Operational production indicators.
IndicatorDescription
Proportion of non-fossil energy power generation (B1)Non-fossil energy unit generating capacity/Total generating capacity
Energy-saving and emission reduction equipment investment ratio (B2)Emission-reducing equipment/Total equipment cost of the enterprise
Average utilization hours of power generation equipment (B3)Operating hours of average power generation equipment capacity under full load operating conditions
Energy saving and emission reduction equipment utilization rate (B4)Energy-saving and emission reduction power generation equipment full-load operation hours
Energy saving and emission reduction R&D staff compensation (B5)Labor cost of energy saving and personnel emission reduction R&D
Funds for energy conversation and emission reduction research projects (B6)Project cost of energy saving and emission reduction technology research and development
Unit generating sewage charges (B7)Production of pollutants per unit of electric power
Unit power generation water pollution discharge (B8)Produce polluted water discharged by one unit of electric power
Unit power generation CO2 emissions (B9)Production of a unit of CO2 emissions
Unit power generation SO2 emissions (B10)Production of a unit of SO2 emissions
Unit power generation NOx emissions (B11)Production of a unit of NOx emissions
Table 3. Resources and environmental protection indicators.
IndicatorDescription
Plant electricity rate (C1)Variable power consumption/Power generation per unit time
Unit power generation standard coal consumption (C2)One unit of electric power/Consumption of standard coal
Unit power generation oil consumption (C3)One unit of electric power/Consumption of standard oil
Desulfurization gypsum utilization (C4)Annual utilization of desulfurized gypsum/Total annual production
Fly ash utilization (C5)Ability to utilize fly ash resources
Industrial wastewater utilization (C6)Ability to treat industrial wastewater
Table 4. Green market trading indicators.
IndicatorDescription
Carbon trading market yield (D1)Participation in the carbon emissions market
Renewable energy generation ratio (D2)Production of renewable energy power
Green certificate purchase ratio (D3)Participation in green certificate market
Table 5. Intuitionistic fuzzy scale of low-carbon sustainability and green operation benefits of power generation enterprises.
MeaningScale
i is exceedingly superior to j (0.90, 0.10, 0.00)
i is strongly superior to j (0.80, 0.15, 0.05)
i is obviously superior to j (0.70, 0.20, 0.10)
i is slightly superior to j (0.60, 0.25, 0.15)
i is equivalent to factor j ( i j )(0.50, 0.30, 0.20)
j is slightly superior to i (0.40, 0.45, 0.15)
j is obviously superior to i (0.30, 0.60, 0.10)
j is strongly superior to i (0.20, 0.75, 0.05)
j is exceedingly superior to i (0.10, 0.90, 0.00)
Table 6. Low-carbon sustainability and green operation benefits rating of power generation enterprises.
Evaluation LevelVIVIIIIII
Score[0.9, 1][0.8, 0.9)[0.6, 0.8)[0.45, 0.6)[0, 0.45)
Table 7. Intuition fuzzy preference relationship of first-level indicators.
ABCD
A(0.50, 0.30, 0.20)(0.40, 0.45, 0.15)(0.50, 0.30, 0.20)(0.50, 0.30, 0.20)
B(0.70, 0.20, 0.10)(0.50, 0.30, 0.20)(0.50, 0.30, 0.20)(0.60, 0.25, 0.15)
C(0.50,0.30,0.20)(0.30, 0.60, 0.10)(0.50, 0.30, 0.20)(0.30, 0.60, 0.10)
D(0.40, 0.45, 0.15)(0.40, 0.45, 0.15)(0.60, 0.25, 0.15)(0.50, 0.30, 0.20)
Table 8. Intuitionistic fuzzy preference relationship of green market trading indicators.
D1D2D3
D1(0.50, 0.30, 0.20)(0.40, 0.45, 0.15)(0.50, 0.30, 0.20)
D2(0.40, 0.45, 0.15)(0.50, 0.30, 0.20)(0.40, 0.45, 0.15)
D3(0.20, 0.75, 0.05)(0.30, 0.60, 0.10)(0.50, 0.30, 0.20)
Table 9. Total weight of A company.
First-Level ( ω 1 )Second-Level ( ω 2 )Third-Level ( ω 3 )Total Weight ( ω t )
( 0.24 ,   0.69 ) ( 0.52 ,   0.53 ) ( 0.31 ,   0.63 ) ( 0.03 ,   0.94 )
( 0.28 ,   0.61 ) ( 0.03 ,   0.94 )
( 0.21 ,   0.52 ) ( 0.03 ,   0.93 )
( 0.36 ,   0.34 ) ( 0.43 ,   0.41 ) ( 0.03 ,   0.88 )
( 0.40 ,   0.38 ) ( 0.03 ,   0.87 )
( 0.21 ,   0.71 ) ( 0.42 ,   0.41 ) ( 0.52 ,   0.53 ) ( 0.04 ,   0.91 )
( 0.35 ,   0.34 ) ( 0.03 ,   0.88 )
( 0.45 ,   0.44 ) ( 0.47 ,   0.46 ) ( 0.04 ,   0.90 )
( 0.40 ,   0.38 ) ( 0.03 ,   0.89 )
( 0.18 ,   0.66 ) ( 0.36 ,   0.71 ) ( 0.22 ,   0.72 ) ( 0.01 ,   0.97 )
( 0.23 ,   0.72 ) ( 0.01 ,   0.97 )
( 0.14 ,   0.62 ) ( 0.01 ,   0.96 )
( 0.17 ,   0.64 ) ( 0.01 ,   0.96 )
( 0.27 ,   0.59 ) ( 0.45 ,   0.45 ) ( 0.02 ,   0.92 )
( 0.42 , 0.41 ) ( 0.02 ,   0.92 )
( 0.20 ,   0.50 ) ( 0.49 ,   0.48 ) b ( 0.01 ,   0.91 )
( 0.34 ,   0.31 ) ( 0.01 ,   0.88 )
( 0.19 ,   0.67 ) ( 0.47 ,   0.46 ) ( 0.32 ,   0.65 ) ( 0.02 ,   0.93 )
( 0.21 ,   0.52 ) ( 0.01 , 0.91 )
( 0.28 ,   0.60 ) ( 0.02 ,   0.93 )
( 0.40 ,   0.38 ) ( 0.44 , 0.50 ) ( 0.03 , 0.89 )
( 0.36 ,   0.34 ) ( 0.02 ,   0.86 )
Table 10. Power generation enterprises energy-saving emission reduction sustainable operation efficiency score results.
Enterprises
Score0.380.330.370.300.34
Sort14253
Table 11. Comprehensive evaluation value of different evaluation methods.
EnterprisesComprehensive Evaluation Value
IFAHPD-IFAHPFAHP
0.38190.38190.3886
0.33480.33040.3544
0.37720.37720.3840
0.33560.30120.3553
0.33970.34520.3596
Table 12. Improved extreme learning machine algorithm optimized by RBF kernel function (RELM) model parameter set.
ParameterValue
Regularization coefficient C0.5
RBF kernel parameter[0.15, 0.25]
Number of nodes in hidden layer210
Table 13. The relative error of ELM model and evaluation results.
EnterprisesD-IFAHP Evaluation ResultANNRELMELM
Training ResultsRE (%)Training ResultsRE (%)Training ResultsRE (%)
0.38190.3459−9.42650.3801−0.47130.3742−2.0162
0.33040.3129−5.29660.33150.33290.33671.9068
0.37720.3482−7.68820.3763−0.23860.3701−1.8823
0.30120.32467.76890.3020.26560.2952−1.9920
0.34520.35312.28850.34590.20280.3434−0.5214

