Article

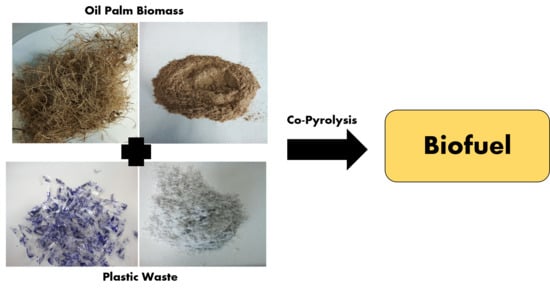
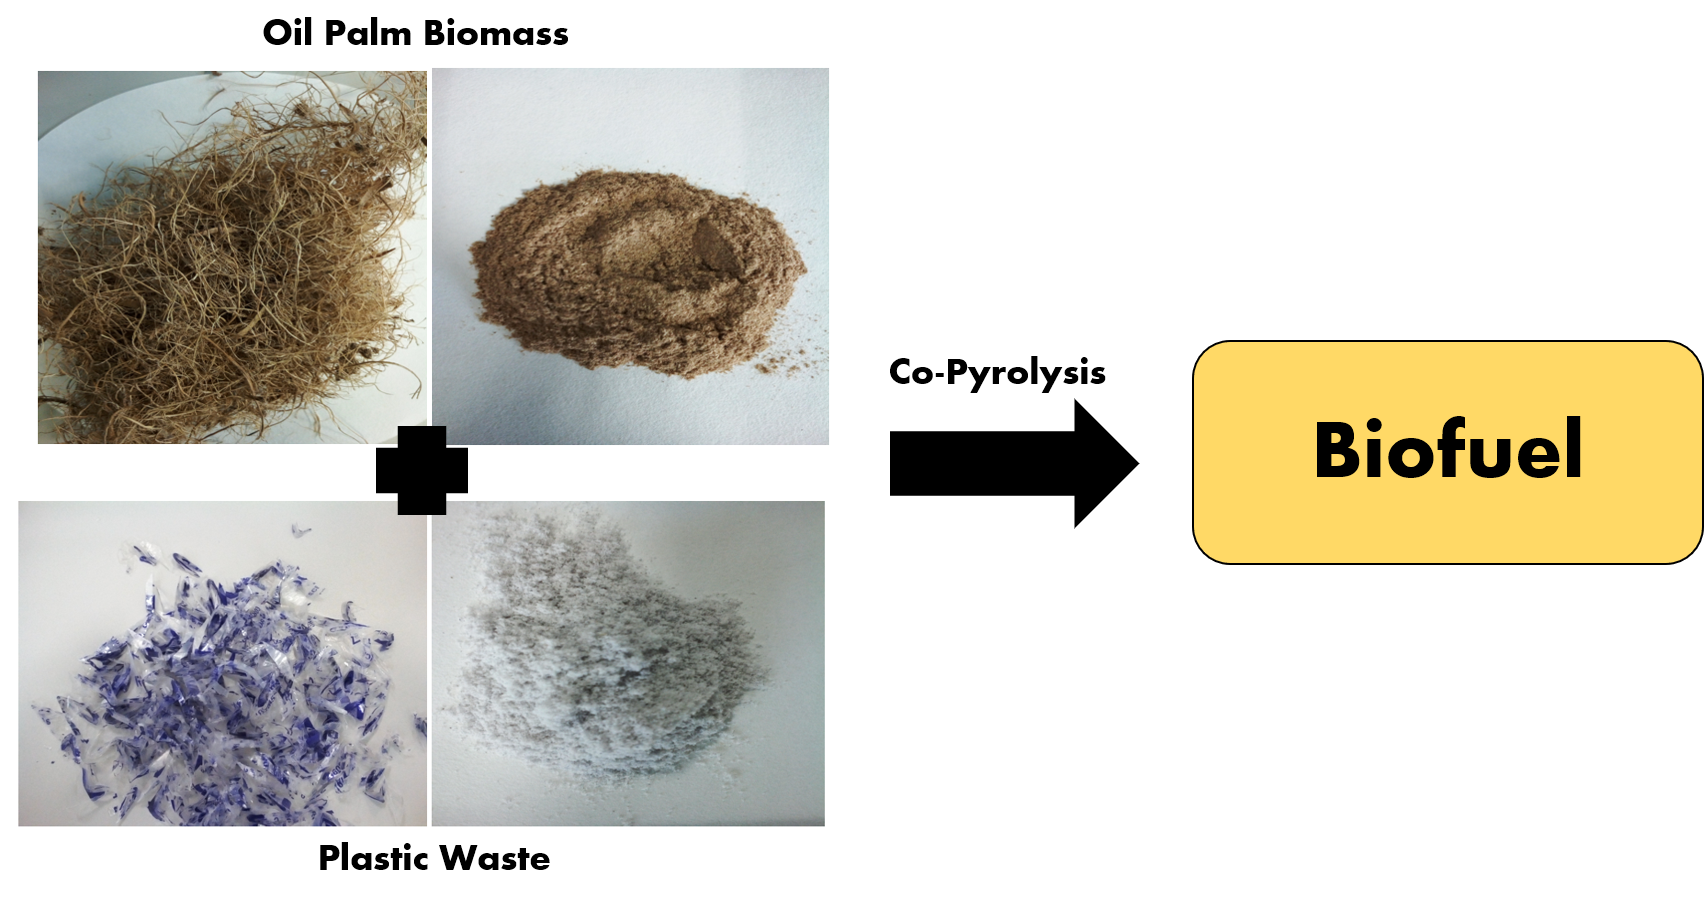
Thermal Analysis of Nigerian Oil Palm Biomass with Sachet-Water Plastic Wastes for Sustainable Production of Biofuel

1
Institute of Sustainable Energy (ISE), Universiti Tenaga Nasional (The Energy University), Jalan IKRAM-UNITEN, Kajang 43000, Malaysia
2
School of Engineering, Monash University Malaysia, Jalan Lagoon Selatan, Bandar Sunway 46150, Malaysia
3
Institute of Biological Sciences, Faculty of Science, University of Malaya, Kuala Lumpur 50603, Malaysia
4
Department of Chemical and Environment Engineering, Faculty of Science and Engineering, Jalan Broga Semenyih 43500, Malaysia
*
Authors to whom correspondence should be addressed.
Processes 2019, 7(7), 475; https://doi.org/10.3390/pr7070475
Submission received: 17 June 2019 / Revised: 5 July 2019 / Accepted: 8 July 2019 / Published: 23 July 2019
(This article belongs to the Special Issue Green Technologies: Bridging Conventional Practices and Industry 4.0)

Abstract

:
Nigeria, being the world’s largest importer of diesel-powered gen-sets, is expected to invest in bio-fuels in the future. Hence, it is important to examine the thermal properties and synergy of wastes for potential downstream resource utilization. In this study, thermal conversion as a route to reduce the exploding volume of wastes from sachet-water plastic (SWP) and oil palm empty fruit bunch (OPEFB) biomass was studied. Thermogravimetric (TGA) and subsequent differential scanning calorimeter (DSC) was used for the analysis. The effect of heating rate at 20 °C min−1 causes the increase of activation energy of the decomposition in the first-stage across all the blends (0.96 and 16.29 kJ mol−1). A similar phenomenon was seen when the heating rate was increased from 10 to 20 °C min−1 in the second-stage of decomposition. Overall, based on this study on the synergistic effects during the process, it can be deduced that co-pyrolysis can be an effective waste for energy platform.

Graphical Abstract

1. Introduction

Concern about the growing demand for energy, with emphasis on the developing economies, has prompted the urgent calls to implement renewable energy planning and advancement in reducing solid waste by utilizing it for energy production. The use of conventional energy sources is largely responsible for increasing CO2 emissions in the atmosphere [1]. Thus, it is regarded as the underlying cause of greenhouse gas emissions and global warming. It was reported that the African energy-related CO2 emissions are projected to increase by about 40% by the year 2030, with Nigeria contributing significantly to this growth [2].
According to the Power Africa Fact Sheet in Nigeria, only 45% of the nation has access to the national power grid [3]. This electricity mix percentage is mostly generated using 80% natural gas and 20% hydropower [4]. Another electrification method is the use of diesel-powered generator sets (gen-sets). Self-generation of electricity became necessary to avoid blackouts, especially in the densely-populated northern region of Nigeria. Furthermore, it is estimated that demand for energy in Nigeria will grow by at least 500% by 2035. However, the current trajectory of the electricity supply will increase by around just 1% in the same period [5]. The current situation of the power generation requires a new approach to impede the growing threats of CO2 emissions from gen-sets. In this context, alternative energy generation from local biomass could be one of the most viable solutions to instantly minimize the intake of fossil fuels to reduce environmental complications [6,7,8].
Energy from waste, mainly lignocellulosic, is advantageous due to its widely recognized social, economic, environmental and renewable properties [9]. At the same time, plastic waste poses an ecological dilemma due to its long life-time, and symbolizes an essential element of waste management [10]. According to Ben-Iwo et al. and Stoler, biomass and sachet water plastics produced from agricultural and industrial activities in Nigeria are estimated to be nearly 144 million ton y−1 and 70–100 million ton y−1, respectively [11,12]. Sachet water, primarily known as ‘pure water’, is symbolic to the sub-Saharan region of Africa, sold in mechanically-sealed 500 mL plastic sleeves at a unit price of not more than 0.10 US $. This water is regarded as a multibillion-dollar industry. The primary concern related to this water industry is the generation of plastic waste that continues to be one of the most significant threats to the region because of clogging gutters, causing routine flooding and exposing residents to a variety of health risks. In Nigeria, waste from plastics comprises about 65% of national solid waste streams. Therefore, in this study, the thermal and kinetic behavior of plastic waste will be examined, and the possible application of this waste for energy generation and as a platform for waste management will be explored.
Several methods, including gasification, hydrothermal liquefaction, combustion and pyrolysis, have been explored to treat the waste biomass [13,14,15]. Among these, pyrolysis involves the thermochemical decomposition of hydrocarbon or organic materials (usually biomass) at elevated temperatures in the absence of oxygen. Through the pyrolysis process, biomass will be converted into energetic products, such as bio-oil, syngas and bio-char. Researchers have explored a possible solution by co-pyrolysis of plastic waste with biomass [16]. The co-pyrolysis with plastics is preferred due to its ability to balance the ratios of carbon, oxygen, and hydrogen in the bio-oil derived from biomass pyrolysis [17]. In general, plastics are known to have high hydrogen compounds which make them suitable, and the potential substrate to improve the quality of the bio-oil product. Previous investigations claim apparent interactions and synergistic effects between biomass and plastics in the co-pyrolysis [18]. The inherent individual characteristics observed were due to the lower thermal stability of biomass being caused by the presence of plastics. These contradictions may have been caused by significant variations in composition, the origins of biomass, and complexity of chemical reactions during pyrolysis [19]. Thus, the need for increased research on the thermal and physio-chemical anatomization of biomass and secondary waste resources to predict the downstream product, as well as the associated environmental impacts, is necessary.
To the author’s knowledge, no data is available on the pyrolysis of Nigerian oil palm empty fruit bunch (OPEFB), sachet-water plastic wastes (SWP) and their blends. In view of the large amount of OPEFB and SWP produced in Nigeria, it is necessary that a study on waste-to-value added product should be undertaken. Further, the results are expected to provide useful information for individuals and institutions who are interested in using Nigerian biomass and plastics for thermochemical conversion. Therefore, the objective of the study is to determine the thermal behavioral properties and synergy (if any) between OPEFB and SWP wastes as a potential application in renewable biofuel and biomaterials.

2. Materials and Methods

2.1. Biomass Samples

The OPEFB samples were provided by the Nigeria Institute for Oil Palm Research (NIFOR), Nigeria and SWP (Low Density Polyethylene) were acquired from Deezor Pharmaceuticals Limited, Nigeria. The samples were dried in an oven at 105 °C for 24 h and then ground in Fristch Pulverisette (model 19) to the size of 250 µm and further to 200 µm size in a Fristch Pulverisette (model 16).
The biomass-plastic (OPEFB and SWP) blends were prepared with different weight percentages (wt.%) of 20%, 40%, 50%, 60%, 80%, and 100%. However, for DSC analysis, the blends of 10, 20 and 30 wt.% of biomasses to plastic blends were used. The ratio of SWP to OPEFB was capped at maximum of 30% (w/w) to retain OPEFB as the major component of the sample based on results from TGA analysis of this work. To make certain of the blending homogeneity, samples were put through vortex shaker (IKA Vortex 3) for two minutes at 2500 rpm.

2.2. Elemental and Proximate Analysis

The ultimate/elemental analysis of the sample was performed using a CHNS/O analyzer (2400 model by PerkinElmer, Waltham, MA, USA), followed ASTM D5373-93 method. The volatile matter, fixed carbon and ash content of the sample (proximate analysis), however, were determined according to ASTM E 897-82 and ASTM D 1102-84 method. All experiments were conducted in triplicated and averaged values are reported in Table 1.

2.3. Thermal Analysis Using Thermogravimetric Analysis (TGA) and Differential Scanning Calorimetry (DSC)

Pyrolysis of original and blend samples (~4 mg) was carried out in a programmable TG analyzer (DSC-TGA Q Series instrument and SDT Q600 thermal analyser, manufactured by TA Instrument, New Castle, DE, USA) from room temperature to 800 °C and at two heating rates (10 and 20 °C min−1). Isothermal DSC measurements can be successfully applied for information about the heat capacity as a function of temperature during phase transitions, autoxidation, thermal decomposition and adsorption of different kinds of fuels [20]. For DSC (DSC823 manufactured by Mettler Toledo) experiments, the samples were heated from 25 °C to 600 °C at a heating rate of 15 °C min−1 to measure the heat flow during pyrolysis. For all experiments (TGA/DSC), nitrogen was used as an inert carrier gas with a flow rate of 50 mL min−1. The instrument continuously recorded TG and DTA data which were used to analyze its thermal characteristics and to calculate the kinetic parameters. All tests were performed in triplicates to ensure reproducibility.

2.4. Kinetic Reaction

Several models have been used in kinetic analysis [21,22,23]. The Coats-Redfern is one of the most widely-used approach to obtain the kinetic parameters of carbonaceous materials [24]. It is a model-fitting method to determine the activation energy, pre-exponential factor and reaction order from a single measurement of thermogravimetric [25]. In general, biomass pyrolysis can be characterized using an infinite number of reaction mechanisms, described by the n-order law:
d α dt = k ( T ) f ( α )
f ( α ) = ( 1 α ) n
where k(T) is the reaction rate constant, α indicates the amount of conversion or the fractional weight loss (Equation (3)), and n is the reaction order.
α = m i m o m i m f
where mi, mo and mf are the initial mass, the current mass at time ‘t’ and the final mass of the sample respectively. Note that α value is always between 0 and 1.
The reaction rate constant, k(T) is a function of temperature, T with a unit of K and can be expressed as (Equation (4)) based on Arrhenius relationship.
k ( T ) = A e E a R T
where A symbolizes the pre-exponential factor (min−1). On the other hand, Ea indicates the activation energy of the decomposition reaction (kJ mol−1) and R is the universal gas constant (8.314 J mol−1 K−1). By substituting (Equation (1)) and (Equation (3)) into (Equation (4)), the kinetic equation for the sample decomposition is expressed as follow:
d α dt = A e E a R T ( 1 α ) n
For the non-isothermal case (at constant heating rate, β), however, the above equation can be further modified to:
d α dT · dT dt = A e E a R T ( 1 α ) n
As
β = dT dt
Hence, the final kinetic equation in non-isothermal TG experiments is:
d α dT = A β e E a R T ( 1 α ) n
According to Coats and Redfern method, Equation (8) was then rearranged, integrated and finally expressed as:
l n { l n ( 1 α ) T 2 } = l n { ψ ( 1 2 R T E a ) } E a R T
where ψ = A R β E a and the reaction is assumed to be first-order.
By assuming 2 R T E a 1 , ln { ψ ( 1 2 R T E a ) } ln ( ψ ) [26]. Thus, Equation (9) can be further modified to:
l n { l n ( 1 α ) T 2 } = l n ( ψ ) E a R T
By plotting this equation, the activation energy and the pre-exponential factor can then be determined.

3. Results and Discussion

3.1. Characteristic properties of OPEFB and SWP

In Table 1, the proximate analysis shows that the volatile matter (OPEFB: 81.4%; SWP: 99.6%) and fixed carbon (OPEFB: 18.6%; SWP: 0%) yielded high-level reactivity and volatility benefits which were appropriate for production of liquid fuels [27]. Nonetheless, the values in this study differ slightly, i.e., by around 2%, from the experimental analysis of OPEFB reported by Oyedun et al. but are comparable to those in other agricultural residues [27]. This could be attributed to the erratic nature of biomass due to species of plant being used, the age of those plants, or the climate of the plantation. Interestingly, crop origin did slightly affect the (O) element property in biomass material that is in the scope of 40 wt.% to 44 wt.%. Additionally, the ash content was at 4.6%, which was more consistent with the results from [28,29]. Therefore, this low value of ash is expected to have a positive effect on heating value since high-level ash quotas in biomass are known to lead to unfavorable yield conditions in terms of liquid by-product in fast pyrolysis [30].
The pure samples (OPEFB: SWP) contained traces of Carbon (C), 54.4: 86.93%, Oxygen (O) 36.44: 1.39% and Hydrogen (H) 7.64: 16.54% respectively. The plastic material had higher C and lower O contents, and therefore lower O/C ratio. On the other hand, the OPEFB biomass had higher sulphur contents compared to the SWP plastics. The content of sulphur (0.48%) in OPEFB is slightly higher than in the SWP (0.12%) of plastic wastes. It has been reported that the typical amount of sulphur in oil palm empty fruit bunch biomass materials is in the range of <0.1 to 0.68% [27,29]. Thus, the 0.48 wt.% value determined in this study is consistent, irrespective of the geographical location. The trace of sulphur in plastic could be because waste plastic contains some contamination, e.g., in the pigment used to impart color in the plastic material [31].

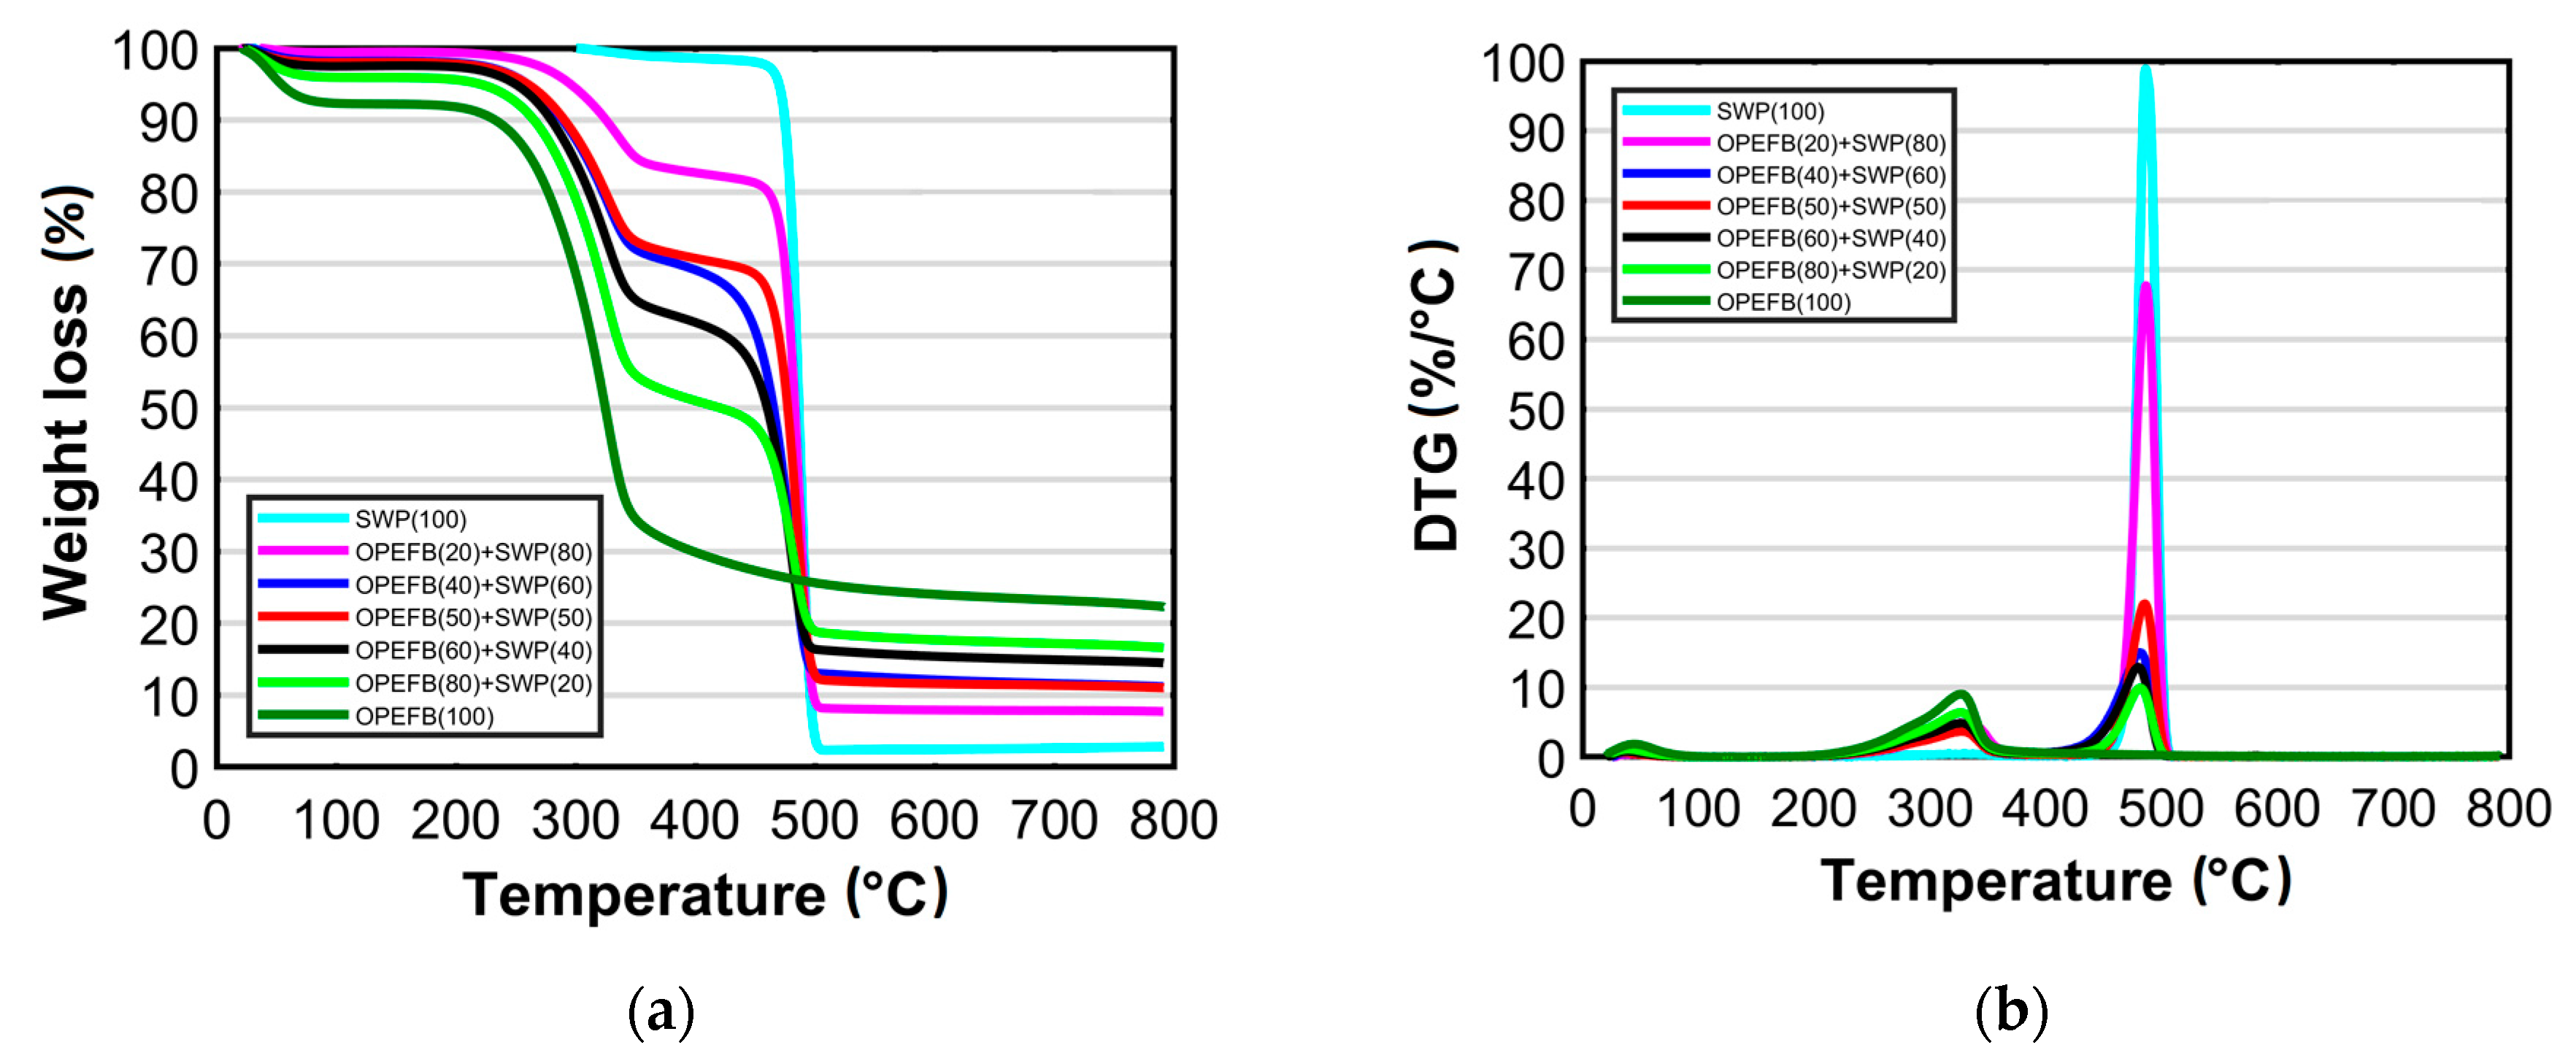
3.2. Thermal Characteristics

Figure 1 and Figure 2 show the TG and DTG curves of OPEFB, SWP, and their blends at a heating rate of 10 and 20 °C min−1 in a nitrogen environment. The pyrolysis process in the present study was differentiated into three main stages; (a) drying stage (30–120 °C), (b) pyrolysis stage (120–500 °C), and (c) char stage (500–800 °C).
The initial weight loss that occurred during the drying stage from room temperature to about 120 °C is due to the removal of free and bound moisture content. SWP showed almost no mass loss in the drying stage as compared to OPEFB (which suffered about 7.1 wt.% mass loss in this region) [32]. The drying stage can also be detected from the presence of the first small peak in the DTG curves (Figure 1B and Figure 2B). A similar phenomenon was also reported by Xu et al. in their work on pine sawdust with and without polyvinylidene [19].
The pyrolysis stage follows immediately after the moisture was released in two stages; (a) pyrolysis of light volatization between 120 and 220 °C. At this stage, the chemical structure of the polymer and biomass starts to depolymerize and soften though without any loss in mass [16]. The next significant weight loss occurred during (b), the main pyrolysis in the temperature range between 220 °C and 500 °C due to the removal of heavy organic compounds. The pyrolysis of original OPEFB and SWP showed only one major peak in the central pyrolysis region. The total weight loss in this region for OPEFB and SWP was about 62 wt.% and 94 wt.%, respectively. Basically, during this stage, the biomass gets converted into volatiles which contain condensable and non-condensable gases. Original SWP plastic (100%) depicted a single peak at both heating rates (10 and 20 °C min−1) in this region, as evident in Figure 1A and Figure 2A. The major weight loss (~94 wt.%) for SWP started at 456 °C (at 10 °C min−1) and 398 °C (at 20 °C min−1) and completed at 505 °C (at 10 °C min−1) and 497 °C (at 20 °C min−1). This thermal behavior of plastic was similar to that in previous studies [27,33]. The thermal decomposition of plastic is vastly different among biomass materials due to different chemical bonds. The degradation mechanisms of polymers are due to the rapid primary hemolytic scission and intra-molecular hydrogen transfer in macro-radical forming oligomers at low temperatures, i.e., around 300 °C [34]. This random scission and de-polymerization occur at intermediate temperatures of 500 °C, further b-scission, and intra-molecular hydrogen transfer to form ethylbenzene, toluene, and a-methylstyrene at ~600 °C [34]. In theory, lignocellulosics such as oil palm empty fruit bunch is acknowledged to contain significant amounts of cellulose, hemicellulose and lignin [35], and the devolatilization has been shown to primarily correspond to the degradation of the components occurring in this region of significant weight loss [36]. Within this temperature range, the devolatilization stages of OPEFB can be divided into the lower temperature stage between, 195 °C and 300 °C, representing hemicellulose decomposition, and the intermediate temperature stage, 270–370 °C representing cellulose decomposition. It was reported that the significant devolatilization of biomass is because of the thermal formation of more stable and stronger bonds which replace the weaker bonds in the biomass structure [37]. The findings of the present study are in agreement with those obtained by previous researchers [38,39].
Some interesting facts were revealed when the OPEFB biomass was blended with SWP at different weight percentage ratios. Obvious differences in the pyrolysis of the original OPEFB/SWP from blend were noticed in the central pyrolysis region. The blends showed two peaks, with the DTG peak height and positions depicting the reactivity of the materials [40]. For instance, with the increase in biomass weight percentage in the blend, the reactivity and the mass loss rate of blends decreased significantly, depicting some degree of interaction between the two samples. Thus, it seems that the decomposition of biomass is, to some extent, affected by the presence of plastic and vice versa. According to Fang et al., the pattern of the fractured surface characteristic of OPEFB may provide substantial information about the adhesion and interfacial compatibility between the OPEFB fiber and SWP during co-pyrolysis [41]. The fractured surfaces in OPEFB also implies the potential of the higher hygroscopic behavior of the material. Hence, simultaneous degradation may be observed during the co-pyrolysis process, and thus, might re-orientate the chemical and thermal features of the co-pyrolysis.
Furthermore, it is reported that plastic starts softening at around 365 °C, but does not decompose completely [32]. In this study, based on Figure 1A and Figure 2A, it can be observed that there was a slight drop in the weight loss of the SWP, which indicated that within the heating range there was an effect on the heat and mass transfer process. The peaks in this stage might overlap due to the simultaneous devolatilization of both OPEFB and SWP materials, resulting in an amplified synergetic effect. Also, a gap exists between the 2nd and 3rd peaks of the DTG curves (Figure 1B and Figure 2B), which is similar to the results obtained by Oyedun et al. [27]. Worthy of note in Figure 2B is the fact that the OPEFB (50) +SWP (50) blend and SWP (100) depicted tails in the second peak at temperatures beyond 500 °C. This feature is different to the pyrolysis under 10 °C min−1 shown in Figure 1B. This might be due to the uneven pyrolysis of the constituents. In many cases, this is difficult to avoid due to the preparation procedures of the samples.
Table 2 displays the initial and final temperatures, peak temperatures and total mass loss in the main pyrolysis stage for biomasses and their blends. A shift in the pyrolysis range and peak temperature was observed due to biomass with SWP blending. A similar observation was reported in a previous work [42], and can be attributed to the thermal resistance between the reacting and evolved species which occur at higher heating rates. The initial degradation temperature in Table 2 shows the minimum temperature where the feedstock starts to decompose, which is also important because it gives information about the minimum ignition temperature required to decompose the material. For instance, the initial degradation temperature of OPEFB was 225 °C, as reported by Abdullah and Gerhauser [28]. However, in the present study, it was about 216 °C, a slightly lower than the values reported by previous authors. This could be due to the difference in the analysis method such as particle size at 250–355 μm; furthermore, a 100 mL min−1 nitrogen flowrate was applied in the work of Abdullah and Gerhauser [28]. On the other hand, the initial degradation temperature for SWP was in close agreement with the study of Banat and Fares [43].
The last stage is called char or the carbonization stage, in which the carbon-rich residual is formed due to the relatively slow degradation of lignin. In this study, slow and steady weight loss could be observed at temperatures of around 500 °C. Typically, the degradation of lignin starts from the very early stage, i.e., from 300 °C and continues until 800 °C [44]. In this study, the carbonization stage of the lignin component of biomass OPEFB takes place within a temperature range of approximately 375–800 °C. The mass loss in this stage was about 22 wt.% for OPEFB. Meanwhile, the final residue from the carbonization stage of SWP was about 5 wt.% at 500 °C and completely melted at 650 °C. The leftover char residues at the end of pyrolysis (~700 °C) were about OPEFB20+SWP80 (17.2 &17.7 wt.%), OPEFB40 + SWP60 (14.9 & 13.8 wt.%), OPEFB50+SWP50 (11.3 & 2.8 wt.%), OPEFB60+SWP40 (11.3 & 10.5 wt.%), OPEFB80+SWP20 (7.8 & 7.6 wt.%) at 10 and 20 °C min−1 respectively. Among the blends, the char residues decreased in mass loss with increasing portions of OPEFB with OPEFB80+SWP20 showing the highest degradation rate. These variations further suggest a synergetic effect among the biomass and plastic mixtures in that the chemical components of the plastic are acting as catalyst [38,45]. This gives new insights into the behavior of co-adding plastics in the co-pyrolysis of biomass which have not been widely discussed in previous studies. However, the effect of the heating rate on the char residues is less pronounced, except in the case of OPEFB50+SWP50 at 20 °C min−1, which could be attributed to mixing errors.

3.3. TGA Kinetic Analysis
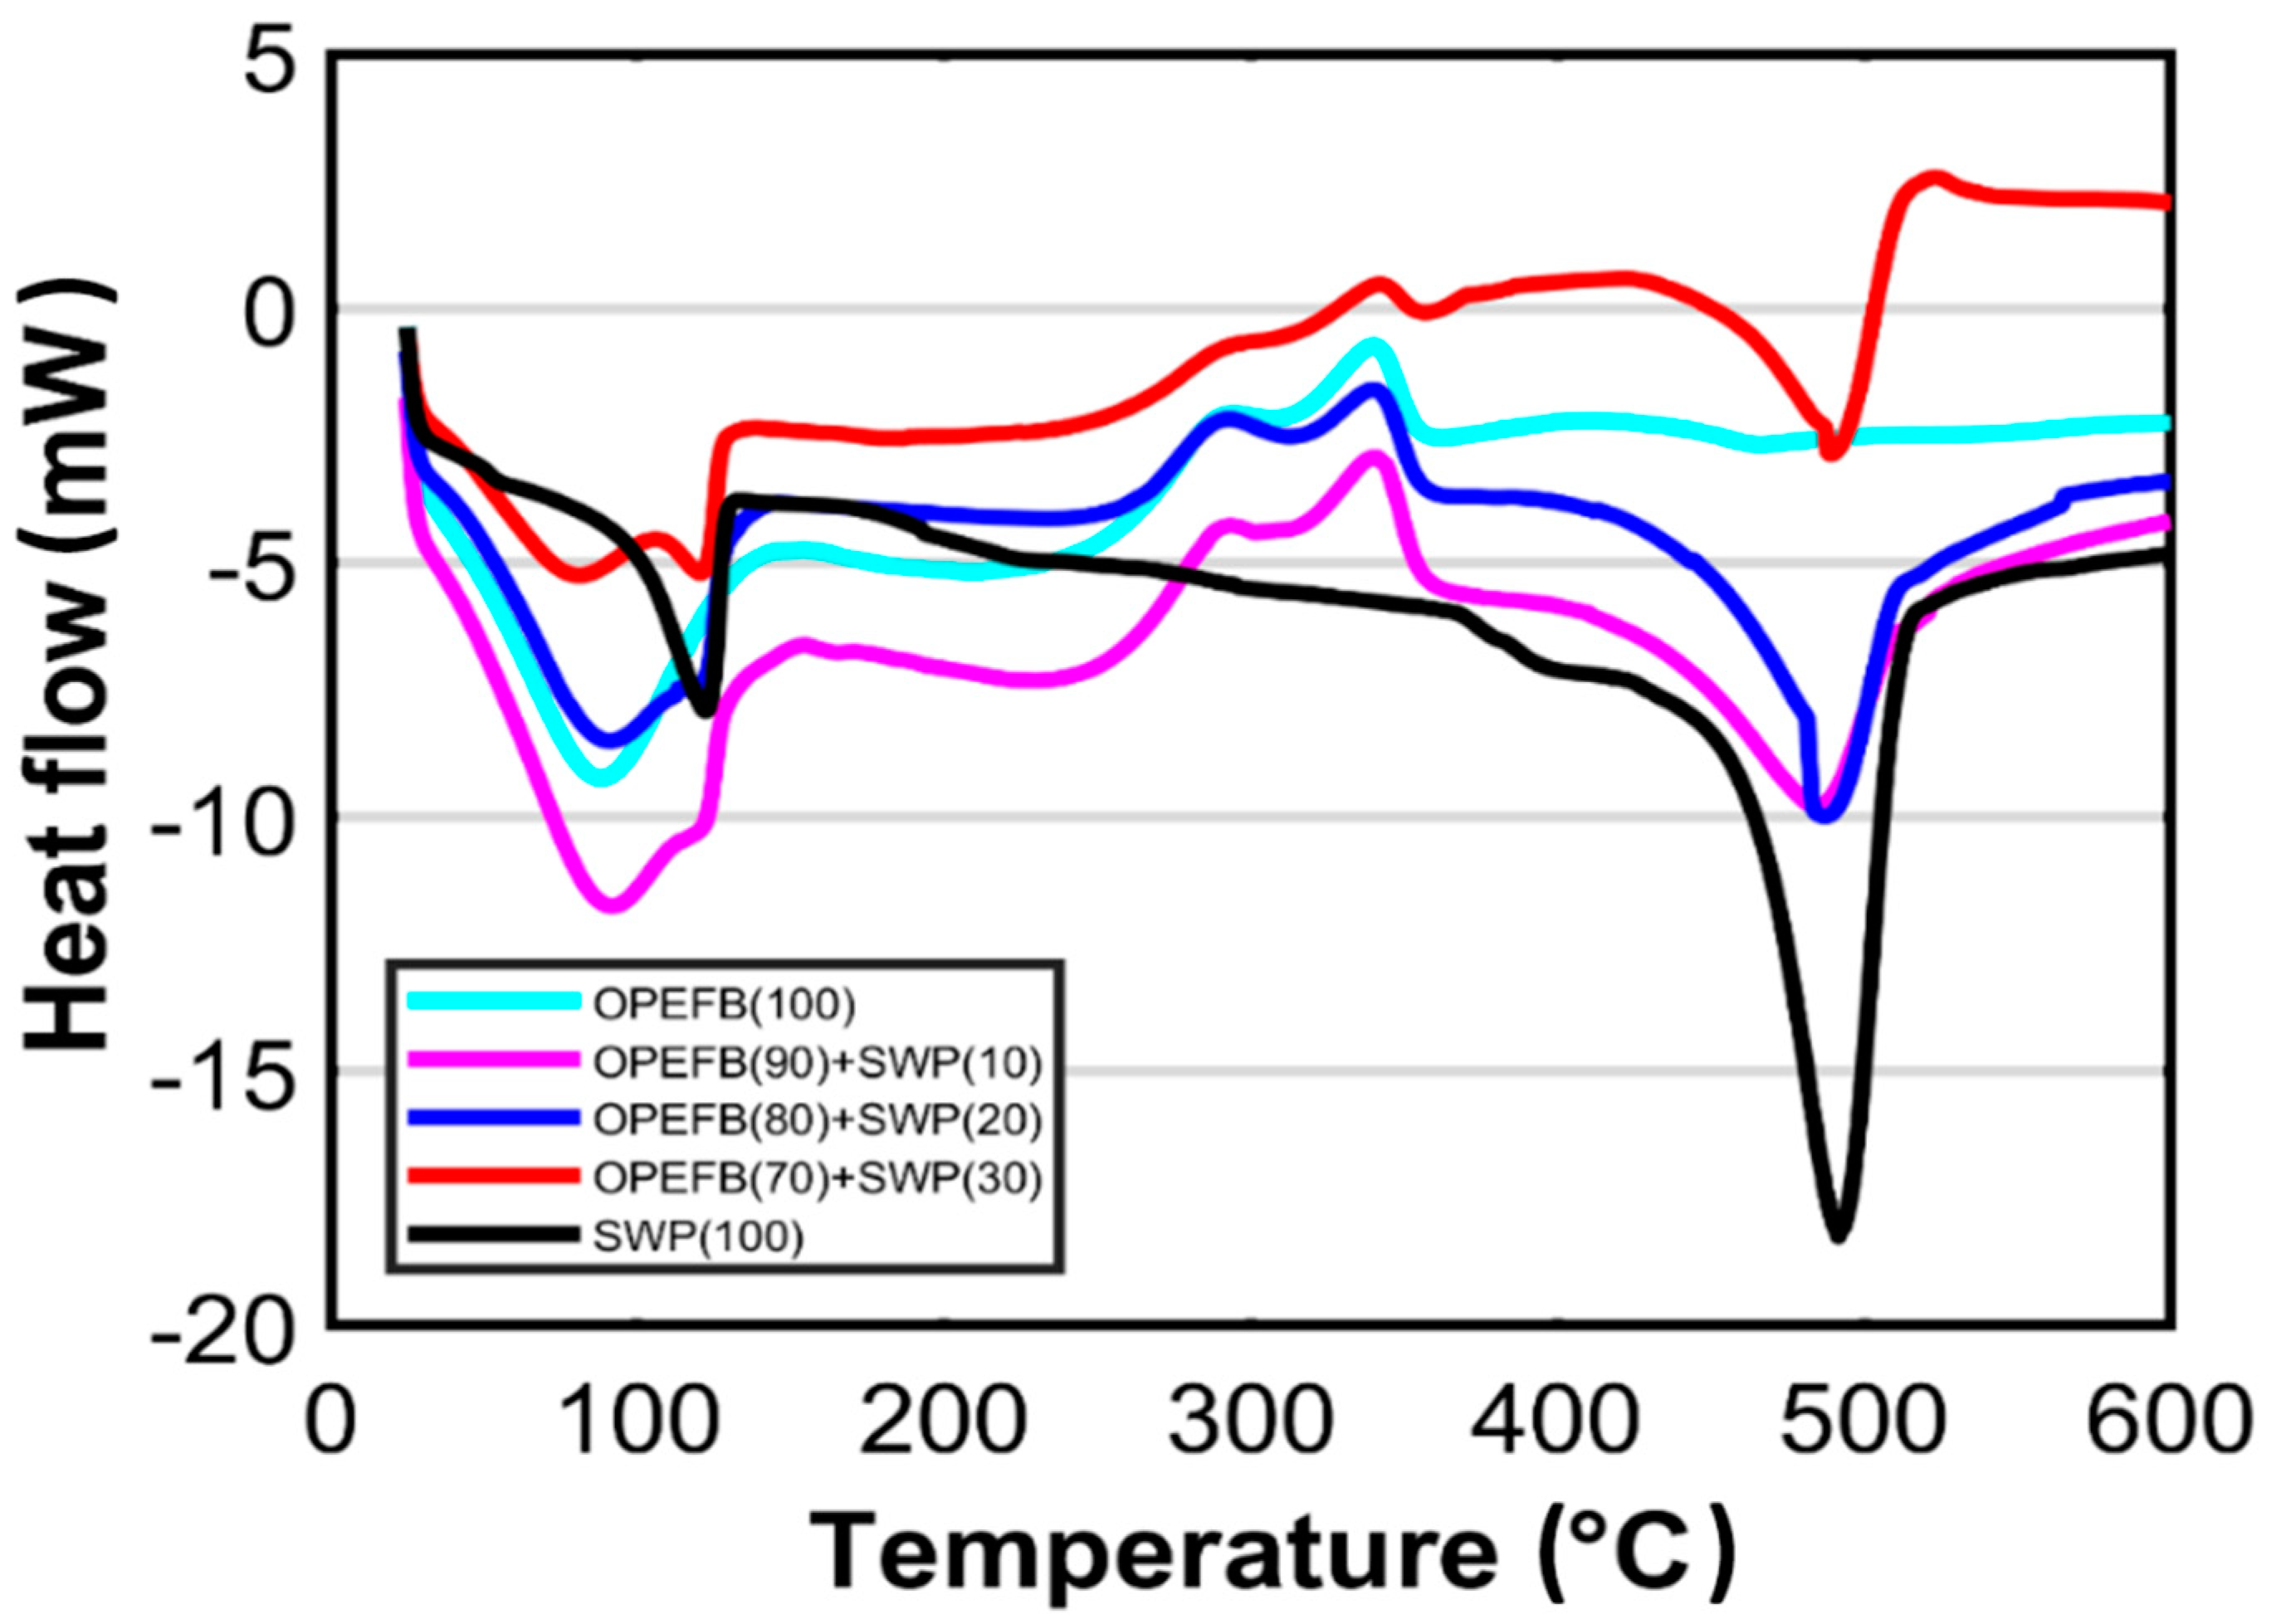
The kinetics parameters of OPEFB, SWP and blends co-pyrolysis were determined using Coat Redfern’s (CR) Method. The activation energy, Ea was estimated from the slope of -(Ea/RT) by a linear fit of the experimental points. By substituting this value back into the CR Equation (Equation (10)) gives the pre-exponential factor. The peak temperature (Tp) of each reaction, as revealed in Figure 1 and Figure 2, is to be expected within a small range around the local maximum of mass loss rate. Listed in Table 3 are the calculated values for the kinetic parameters, including activation energy, Ea, pre-exponential factor, A, and reaction rate constant at peak temperature, of all the samples at the applied heating rates of 10 and 20 °C. In all cases, the value of R2, (correlation coefficient) of the fitting straight line was above 0.90; this indicates that the corresponding non-isothermal model-fitting is in good agreement with the pyrolysis analysis and kinetics [46]. Furthermore, a comparison of the selected heating rates on pyrolysis of blends on solid-state kinetics data is presented. There is limited evidence in the literature of the effects of different heating rates on the kinetics of thermal decomposition to describe the devolatilization process in co-pyrolysis of biomass and plastics.
From Table 3, the thermal decomposition of OPEFB and SWP can be described by a single step reaction, while their blends showed two consecutives first and second step reactions. In view of the results of the kinetic parameters of the isolated samples tabulated in Table 3, it may be seen that a pure sample of SWP at varying heating rates (10 and 20 °C min−1) has the least conversion and slower reactive characteristics due to its higher (Ea) value of 346.93 and 234.36 kJ mol−1. Nonetheless the pre-exponential factor which expresses the probability of colliding molecules resulting in a reaction revealed 2.95 × 10²³ min−1 and 9.13 × 10¹⁵ min−1 respectively. It was also expected that higher heating rates reduce the complex energy required to decompose the polymer atoms. This confirms that plastics decompose at higher temperatures (480–486 °C). As to the isolated OPEFB sample the (Ea) values of 46.83 and 44.21 kJ mol−1 was revealed at 10 and 20 °C min−1 and decomposes at a much lower temperature range (227–334 °C), compared to isolated SWP. Thus, a similar trend could be deduced regarding the effect of heating rate on their activation energies. Nonetheless, the effect of the heating rate is more apparent in the degradation mechanism of solid-state reactions of the SWP. The kinetics parameters in Table 3 also show that the temperature and energy needed to decompose the blends is higher with a higher weight percentage of SWP or plastic. Meanwhile, Nyakuma examined decomposition of pelletized oil palm empty fruit bunch through thermogravimetric analyzer and calculated kinetic parameters in the range from 36.60 kJ mol−1 to 233.92 kJ mol−1 through Popescu method [47]. Also, the apparent (Ea) and (A) obtained with the CR method employed in this study were in accordance with different biomass as demonstrated by the Ea values for oil palm empty fruit bunch, 50.37 kJ mol−1 [27] and those of other biomass species including almond and hazelnut shells (11.2–254.4 kJ mol−1) and (40.3–144.9 kJ mol−1) [48]. Similarly, in comparison with the polystyrene parameters reported in the literature, the activation energy obtained in this study at 10 and 20 ℃ min−1 falls within the reported ~213.78 kJ mol−1 [49] to 253.69 kJ mol−1 [50].
In the case of kinetic results of the blended mixtures generally as expected, the (Ea) manifested a significant increase alongside the corresponding (A) with an increasing percentage of SWP in blends. The experimental data shown in Table 3 revealed that the values obtained for (Ea) and (A) of the SWP/OPEFB blends are relatively different from those of the individual materials. This means that a synergetic effect is observed in the SWP/OPEFB blends that might have an overlapping degradation temperature, which creates the opportunity for free radicals from biomass pyrolysis to participate in reactions of plastic decomposition. For example, the activation energies of 80 and 60% composition of SWP were much higher than the value obtained from the pyrolysis of pure samples, and presented obvious changes with the increase of plastics weight percentage. However, the value of the activation energy and pre-exponential factor decreases when the weight percentage of SWP in the blend decreases. Similar results have been reported in previous studies [17,33]; however, interestingly, the addition of SWP in the OPEFB biomass revealed a negligible effect on the activation energy at the first reaction order of decomposition.
However, at the second stage, an appreciable increase in action energy was revealed. At higher compositions of SWP 80% Ea was 40.08 kJ mol−1 and 240.26 kJ mol−1 at heating rate of 10 °C min−1 in the first and second stages, respectively. A similar trend was observed for the heating rate of 20 °C min−1, where the activation energy of 60% SWP composition was 61.75 kJ mol−1 and 195.99 kJ mol−1 in the first and second stages, correspondingly. On the other hand, the kinetics parameters in Table 3, remarkably show that less energy is required to decompose the blends (below 50%), depicting a favorable synergistic effect between lower mass percentages blends of SWP lowering the activation energy. This technically supports the discrepancy that in co-pyrolysis, the ratio of feed is the most significant variable in product yield and economics [16,51].
Overall, a higher heating rate (20 °C min−1) will lead to (average 10%) an increase in the activation energy of the decomposition in the first stage across all the blends in the range of 0.96 kJ mol−1 and 16.29 kJ mol−1. Remarkably, varying the heating rate from 10 to 20 °C min−1 in the second stage of decomposition reaction shows, as in the previous case, an increase in activation energy, with one exception at OPEFB50:SWP50, while with a 50% SWP in blend, a higher heating rate of 20 °C min−1 favors a decline in the activation energy from 183.00 to 112.16 kJ mol−1. This can be explained by the aforementioned phenomenon whereby the increase in the heating rate on isolated OPEFB and SWP result in decreasing activation energy. In this case, the homogeneous blend of equal samples followed the same reaction pathway correspondingly result in much lower activation energy. It can also be concluded that a significant difference can be seen in the distribution of the thermal and elemental composition.
It can also be concluded that significant differences can be seen in the distribution of the thermal and elemental composition. Furthermore, the SWP can be identified as low density polyethylene (LDPE) from the elemental composition and the pattern of thermal degradation [52]. The SWP presented a heat release rate curve typical for intermediately thin non-charring materials of LDPE family [53]. The burning time was very short, with a steady increase in heat release rate after ignition up to the peak heat release rate at the end of combustion. Furthermore, the heat release rate pattern showed hardly any shoulder, with the pyrolysis involving nearly all the LDPE material at once due to the complete melting of the polymer [54], this interpretation was confirmed by visual observation of the thermogravimetric curves in Figure 1 and Figure 2.

3.4. DSC Analysis

Based on the findings from the TGA analysis, lower portions of SWP in blends do not lead to a significant increase in the energy required to decompose the co-pyrolysis system. Therefore, this section examines further the enthalpy of reaction at 15 °C of lower blends (10, 20 and 30 wt.%) of SWP. Differential scanning calorimetry (DSC) is widely employed to assess the heat evolution and spontaneous combustion of carbonaceous materials, due to its sensitive analyses at relative temperatures [55]. The DSC heat evolution curve stipulates quantitative data of the heat flow, enabling the kinetics analysis during thermal heating. There are several DSC based methods for the kinetic analysis including ASTM methods (Kissinger– Akahira–Sunose and Ozawa–Flynn–Wall) [25] and the Roger & Morris method [56]. The ASTM method relies on measuring the exothermic peak temperature at various heating rate, thereby resulting in the kinetics reflecting the main region of combustion. The profiles of the heat evolution rate of samples (OPEFB-100%, OPEFB-90%: SWP-10%, OPEFB-80%: SWP-20%, OPEFB-70%: SWP-30% and SWP-100%), thermally decomposed from 25 °C to 600 °C at a fixed heating rate of 15 °C/min, are illustrated in Figure 3. The single heating rate DSC test at 15 °C min−1 is the best for the application of ASTM approach, which has the advantage of reducing the required time, compared other approaches [55]. DSC analysis of pure OPEFB and SWP samples registered four and two exotherms, respectively, while each of the blended samples registered three stages. The exothermic effect differs from one material to another depending on the chemical composition and decomposition behavior of the material. The maximum temperature of the exotherms in the first, second, third and fourth regions were seen at 87–122 °C, 240–251 °C, 339–340 °C, and 465–491 °C, respectively. The first region corresponds to moisture release region, and it was found between 42 °C and 131 °C for pure OPEFB sample and between 95 °C and 128 °C for pure SWP sample. The second thermal zone was determined to be between 147 °C and 292 °C for OPEFB and between 152 and 332 °C for sample comprising 70% OPEFB and 30% SWP blends. The third thermal zone was determined to be between 315 and 353 °C for pure OPEFB, 287 and 355 °C, 295 and 354 °C for OPEFB: SWP blended ratios 90:10 and 80:20, respectively. This reflects the heat evolution of the representative samples, in which similar pattern was indicated by the TG and DTG curves in Figure 1 and Figure 2. The melting of the various crystals led to several relatively broad, endothermic and exothermic peaks. The shape of the peak mirrors the size and weight distribution of the crystals and are among the characteristics of a material. The peak region marked on the experimental thermogram corresponds to the region of some physical or physicochemical processes and is dependent on internal factors, such as the structural nature of the material, quantity and thermal conductivity of the sample and external factors such as crucible shape and material, heating rate, the position of the thermocouples [57].
The enthalpy of a material has a direct correlation with the material’s heating value, i.e., the ratio of the enthalpy of complete combustion to its mass [58]. It is an important thermal parameter in the reactor design and predicting efficiency of bioenergy applications. The temperatures and internal energies (enthalpy) corresponding to the beginning, maximum, and the end of the exothermic reactions are summarized in Table 4. The energy of a phase transition was calculated directly from the thermogram of the investigated material from the experimental function according to the kinetics.
Table 4 displays the heat released (J g−1) through the reaction progress; it is not surprising that with increasing the SWP ratios, a shift towards lower H values was observed during the first stage decomposition. Also, isolated SWP sample exhibited lower values of heat released (117.39 J g−1) as compared to the OPEFB (147.69 J g−1) at the first stage of decomposition. It is no surprise that a high amount of heat was recorded during this stage. For the combustion reaction to proceed, energy is needed to overcome the tightly bonded cellulose and hemicellulose to lignin. The results were in agreement to some extent with previous studies [27,59]. Then, the (H) value for isolated OPEFB declined through the four decomposition stages to 18 J g−1. Typically, it is expected for the (Ea) and (H) energies to progressively decrease due to the biomass composition mechanism as each of the components can decompose by parallel exothermic processes. Meanwhile, there was a significant further increase in the (H) of isolated SWP from 117.39 to 1030.19 J g−1 in its first and forth stages of decomposition, which is generally attributed to β-scissors reaction and in agreement with the TG studies. The net enthalpy of pyrolysis for the blended samples studied in this work were 398.18 J g−1 (OPEFB, 90: SWP 10); 365.32 J g−1 (OPEFB, 80: SWP, 20); 317.91 J g−1 (OPEFB, 70: SWP, 30). This can clearly be seen to be higher than that of pure biomass (276.82 J g−1) and much lower than for pure SWP plastic (1147.58 J g−1). The reason for this was that the heat flow of the blended samples at the final stage of decomposition were zero, which would indicate that no degradation reactions had taken place. However, through a comparison of the devolatization stage with the findings of TGA results, it could be observed that enthalpy (40.72) for OPEFB100% was similar to those of TGA. But a significant gap was observed for the case of SWP100%. Nonetheless, blends showed proof of a synergistic effect, and support the TGA findings in which a lower percentage weight of SWP in the co-pyrolysis mixture does not significantly boost energy required for the decomposition in both of the first stages of delovatization (84.42 J g−1 for OPEFB90:SWP10, 59.83 J g−1 for OPEFB80:SWP20, and 88.97 J g−1 for OPEFB70:SWP30) and second stage decomposition (158.21 J g−1 for OPEFB90:SWP10, 161.04 J g−1 for OPEFB80:SWP20, and 145.4 J g−1 for OPEFB70:SWP30).

4. Conclusions

This study examined the thermal decomposition behavior and kinetics of Nigerian native oil palm empty fruit bunch, sachet-water plastic wastes and their blends under non-isothermal inert conditions at different heating rates. The findings show that the co-pyrolysis of OPEFB biomass and SWP plastic mixture exhibits a diverse pyrolysis reactivities at different temperatures. The co-pyrolysis of OPEFB and SWP clearly showed synergic effects due to the difference in thermal behavior and kinetics parameters. In short, the results show that co-pyrolysis can be an effective method to dispose of wastes (biomass and sachet water, SWP) and convert them into useful energy. The experimental data obtained with a model-free method would be helpful in the design and development of energy systems for sustainable waste utilization for energy.

Author Contributions

Conceptualization, S.N. and B.S.; methodology, B.S. and A.A.S.; validation and investigation, B.S. and M.Y.O.; resources, B.S.; writing—original draft preparation, B.S. and M.Y.O.; writing—review and editing, S.N., R.S., and P.L.S.; supervision, S.N. and A.A.S.; funding acquisition, S.N.

Funding

This work was funded by TNB Seed Fund (code: U-TR-RD-18-11). A note of appreciation to iRMC UNITEN for the financial support through publication fund BOLD 2025 (RJO10436494).

Acknowledgments

The authors would also like to acknowledge Monash University Malaysia and Universiti Tenaga Nasional (UNITEN) for the facilities support.

Conflicts of Interest

The authors declare no conflict of interest. Besides, the funders had no role in the design of the study; in the collection, analyses, or interpretation of data; in the writing of the manuscript, or in the decision to publish the results.

References

  1. Norhasyima, R.S.; Mahlia, T.M.I. Advances in CO2 utilization technology: A patent landscape review. J. CO2 Util. 2018, 26, 323–335. [Google Scholar] [CrossRef]
  2. IEA. Excerpt from CO2 Emissions from Fuel Combustion; IEA: Paris, France, 2015. [Google Scholar]
  3. Power Africa. Nigeria Power Africa Fact Sheet; USAID: Washington, DC, USA, 2019.
  4. Aliyu, A.S.; Ramli, A.T.; Saleh, M.A. Nigeria electricity crisis: Power generation capacity expansion and environmental ramifications. Energy 2013, 61, 354–367. [Google Scholar] [CrossRef]
  5. Salman, B.; Neshaeimoghaddam, H. An Evaluation of The Nigeria Electricity Sector Post Privatisation. J. Energy Environ. 2017, 9, 33–37. [Google Scholar]
  6. Financie, R.; Moniruzzaman, M.; Uemura, Y. Enhanced enzymatic delignification of oil palm biomass with ionic liquid pretreatment. Biochem. Eng. J. 2016, 110, 1–7. [Google Scholar] [CrossRef]
  7. Bustos, G.; Arcos, U.; Vecino, X.; Cruz, J.M.; Moldes, A.B. Recycled Lactobacillus pentosus biomass can regenerate biosurfactants after various fermentative and extractive cycles. Biochem. Eng. J. 2018, 132, 191–195. [Google Scholar] [CrossRef] [Green Version]
  8. Martínez-Patiño, J.C.; Ruiz, E.; Cara, C.; Romero, I.; Castro, E. Advanced bioethanol production from olive tree biomass using different bioconversion schemes. Biochem. Eng. J. 2018, 137, 172–181. [Google Scholar] [CrossRef]
  9. Uddin, M.N.; Techato, K.; Taweekun, J.; Mofijur, M.; Rasul, M.G.; Mahlia, T.M.I.; Ashrafur, S.M. An Overview of Recent Developments in Biomass Pyrolysis Technologies. Energies 2018, 11, 3115. [Google Scholar] [CrossRef]
  10. Rocha, E.P.A.; Sermyagina, E.; Vakkilainen, E.; Colodette, J.L.; de Oliveira, I.M.; Cardoso, M. Kinetics of pyrolysis of some biomasses widely available in Brazil. J. Therm. Anal. Calorim. 2017, 130, 1445–1454. [Google Scholar] [CrossRef]
  11. Ben-Iwo, J.; Manovic, V.; Longhurst, P. Biomass resources and biofuels potential for the production of transportation fuels in Nigeria. Renew. Sustain. Energy Rev. 2016, 63, 172–192. [Google Scholar] [CrossRef] [Green Version]
  12. Stoler, J. From curiosity to commodity: A review of the evolution of sachet drinking water in West Africa. Wiley Interdiscip. Rev. Water 2017, 4, e1206. [Google Scholar] [CrossRef]
  13. De Caprariis, B.; Bavasso, I.; Bracciale, M.P.; Damizia, M.; De Filippis, P.; Scarsella, M. Enhanced bio-crude yield and quality by reductive hydrothermal liquefaction of oak wood biomass: Effect of iron addition. J. Anal. Appl. Pyrolysis 2019, 139, 123–130. [Google Scholar] [CrossRef]
  14. Chianese, S.; Fail, S.; Binder, M.; Rauch, R.; Hofbauer, H.; Molino, A.; Blasi, A.; Musmarra, D. Experimental investigations of hydrogen production from CO catalytic conversion of tar rich syngas by biomass gasification. Catal. Today 2016, 277, 182–191. [Google Scholar] [CrossRef]
  15. Nomanbhay, S.; Salman, B.; Hussain, R.; Ong, M.Y. Microwave pyrolysis of lignocellulosic biomass—A contribution to power Africa. Energy Sustain. Soc. 2017, 7, 23. [Google Scholar] [CrossRef]
  16. Abnisa, F.; Wan Daud, W.M.A. A review on co-pyrolysis of biomass: An optional technique to obtain a high-grade pyrolysis oil. Energy Convers. Manag. 2014, 87, 71–85. [Google Scholar] [CrossRef]
  17. Xiong, S.; Zhuo, J.; Zhou, H.; Pang, R.; Yao, Q. Study on the co-pyrolysis of high density polyethylene and potato blends using thermogravimetric analyzer and tubular furnace. J. Anal. Appl. Pyrolysis 2015, 112, 66–73. [Google Scholar] [CrossRef]
  18. Chen, L.; Wang, S.; Meng, H.; Wu, Z.; Zhao, J. Synergistic effect on thermal behavior and char morphology analysis during co-pyrolysis of paulownia wood blended with different plastics waste. Appl. Therm. Eng. 2017, 111, 834–846. [Google Scholar] [CrossRef]
  19. Xu, Z.-X.; Zhang, C.-X.; He, Z.-X.; Wang, Q. Pyrolysis Characteristic and kinetics of Polyvinylidene fluoride with and without Pine Sawdust. J. Anal. Appl. Pyrolysis 2017, 123, 402–408. [Google Scholar] [CrossRef]
  20. Shen, J.; Igathinathane, C.; Yu, M.; Pothula, A.K. Biomass pyrolysis and combustion integral and differential reaction heats with temperatures using thermogravimetric analysis/differential scanning calorimetry. Bioresour. Technol. 2015, 185, 89–98. [Google Scholar] [CrossRef]
  21. Milivojević, A.; Ćorović, M.; Carević, M.; Banjanac, K.; Vujisić, L.; Veličković, D.; Bezbradica, D. Highly efficient enzymatic acetylation of flavonoids: Development of solvent-free process and kinetic evaluation. Biochem. Eng. J. 2017, 128, 106–115. [Google Scholar] [CrossRef]
  22. Costa, R.S.; Vinga, S. Control analysis of the impact of allosteric regulation mechanism in a Escherichia coli kinetic model: Application to serine production. Biochem. Eng. J. 2016, 110, 59–70. [Google Scholar] [CrossRef]
  23. Martínez, I.; Santos, V.E.; Garcìa-Ochoa, F. Metabolic kinetic model for dibenzothiophene desulfurization through 4S pathway using intracellular compound concentrations. Biochem. Eng. J. 2017, 117, 89–96. [Google Scholar] [CrossRef]
  24. Coats, A.W.; Redfern, J.P. Kinetic Parameters from Thermogravimetric Data. Nature 1964, 201, 68–69. [Google Scholar] [CrossRef]
  25. Mishra, R.K.; Mohanty, K. Pyrolysis kinetics and thermal behavior of waste sawdust biomass using thermogravimetric analysis. Bioresour. Technol. 2018, 251, 63–74. [Google Scholar] [CrossRef] [PubMed]
  26. Samaržija-Jovanović, S.; Jovanović, V.; Marković, G.; Marinović-Cincović, M.; Budinski-Simendić, J.; Janković, B. Ethylene–Propylene–Diene Rubber-Based Nanoblends: Preparation, Characterization and Applications. In Rubber Nano Blends; Springer: Cham, Switzerland, 2017; pp. 281–349. [Google Scholar]
  27. Oyedun, A.O.; Tee, C.Z.; Hanson, S.; Hui, C.W. Thermogravimetric analysis of the pyrolysis characteristics and kinetics of plastics and biomass blends. Fuel Process. Technol. 2014, 128, 471–481. [Google Scholar] [CrossRef]
  28. Abdullah, N.; Gerhauser, H. Bio-oil derived from empty fruit bunches. Fuel 2008, 87, 2606–2613. [Google Scholar] [CrossRef] [Green Version]
  29. Sulaiman, F.; Abdullah, N. Optimum conditions for maximising pyrolysis liquids of oil palm empty fruit bunches. Energy 2011, 36, 2352–2359. [Google Scholar] [CrossRef]
  30. Yang, J.; Rizkiana, J.; Widayatno, W.B.; Karnjanakom, S.; Kaewpanha, M.; Hao, X.; Abudula, A.; Guan, G. Fast co-pyrolysis of low density polyethylene and biomass residue for oil production. Energy Convers. Manag. 2016, 120, 422–429. [Google Scholar] [CrossRef]
  31. Lawson, O.E.; Lawson, E.O. Physico-Chemical Parameters and Heavy Metal Contents of Water from the Mangrove Swamps of Lagos Lagoon, Lagos, Nigeria. Adv. Biol. Res. 2011, 5, 8–21. [Google Scholar]
  32. Han, B.; Chen, Y.; Wu, Y.; Hua, D.; Chen, Z.; Feng, W.; Yang, M.; Xie, Q. Co-pyrolysis behaviors and kinetics of plastics–biomass blends through thermogravimetric analysis. J. Therm. Anal. Calorim. 2014, 115, 227–235. [Google Scholar] [CrossRef]
  33. Uzun, B.B.; Yaman, E. Pyrolysis kinetics of walnut shell and waste polyolefins using thermogravimetric analysis. J. Energy Inst. 2017, 90, 825–837. [Google Scholar] [CrossRef]
  34. Bartoli, M.; Rosi, L.; Frediani, M.; Undri, A.; Frediani, P. Depolymerization of polystyrene at reduced pressure through a microwave assisted pyrolysis. J. Anal. Appl. Pyrolysis 2015, 113, 281–287. [Google Scholar] [CrossRef]
  35. Chang, S.H. An overview of empty fruit bunch from oil palm as feedstock for bio-oil production. Biomass Bioenergy 2014, 62, 174–181. [Google Scholar] [CrossRef]
  36. Ro, D.; Kim, Y.-M.; Lee, I.-G.; Jae, J.; Jung, S.-C.; Kim, S.C.; Park, Y.-K. Bench scale catalytic fast pyrolysis of empty fruit bunches over low cost catalysts and HZSM-5 using a fixed bed reactor. J. Clean. Prod. 2018, 176, 298–303. [Google Scholar] [CrossRef]
  37. Chandrasekaran, A.; Ramachandran, S.; Subbiah, S. Determination of kinetic parameters in the pyrolysis operation and thermal behavior of Prosopis juliflora using thermogravimetric analysis. Bioresour. Technol. 2017, 233, 413–422. [Google Scholar] [CrossRef] [PubMed]
  38. Jin, Q.; Wang, X.; Li, S.; Mikulčić, H.; Bešenić, T.; Deng, S.; Vujanović, M.; Tan, H.; Kumfer, B.M. Synergistic effects during co-pyrolysis of biomass and plastic: Gas, tar, soot, char products and thermogravimetric study. J. Energy Inst. 2019, 92, 108–117. [Google Scholar] [CrossRef]
  39. Kai, X.; Li, R.; Yang, T.; Shen, S.; Ji, Q.; Zhang, T. Study on the co-pyrolysis of rice straw and high density polyethylene blends using TG-FTIR-MS. Energy Convers. Manag. 2017, 146, 20–33. [Google Scholar] [CrossRef]
  40. Chong, Y.Y.; Thangalazhy-Gopakumar, S.; Gan, S.; Ng, H.K.; Lee, L.Y.; Adhikari, S. Kinetics and Mechanisms for Copyrolysis of Palm Empty Fruit Bunch Fiber (EFBF) with Palm Oil Mill Effluent (POME) Sludge. Energy Fuels 2017, 31, 8217–8227. [Google Scholar] [CrossRef]
  41. Fang, T.W.; Asyikin, N.; Syasya, N.S.; Shawkataly, A.K.H.; Kassim, M.H.M.; Syakir, M.I. Water Absorption and Thickness Swelling of Oil Palm Empty Fruit Bunch (OPEFB) and Seaweed Composite for Soil Erosion Mitigation. J. Phys. Sci. 2017, 28, 1–17. [Google Scholar] [CrossRef] [Green Version]
  42. Khalid, M.; Ratnam, C.T.; Luqman, C.A.; Salmiaton, A.; Choong, T.S.Y.; Jalaludin, H. Thermal and Dynamic Mechanical Behavior of Cellulose- and Oil Palm Empty Fruit Bunch (OPEFB)-Filled Polypropylene Biocomposites. Polym.-Plast. Technol. Eng. 2009, 48, 1244–1251. [Google Scholar] [CrossRef]
  43. Banat, R.; Fares, M.M. Thermo-Gravimetric Stability of High Density Polyethylene Composite Filled with Olive Shell Flour. Am. J. Ploym. Sci. 2015, 5, 65–74. [Google Scholar]
  44. Yahiaoui, M.; Hadoun, H.; Toumert, I.; Hassani, A. Determination of kinetic parameters of Phlomis bovei de Noé using thermogravimetric analysis. Bioresour. Technol. 2015, 196, 441–447. [Google Scholar] [CrossRef] [PubMed]
  45. Wang, X.; Ma, D.; Jin, Q.; Deng, S.; Stančin, H.; Tan, H.; Mikulčić, H. Synergistic effects of biomass and polyurethane co-pyrolysis on the yield, reactivity, and heating value of biochar at high temperatures. Fuel Process. Technol. 2019, 194, 106127. [Google Scholar] [CrossRef]
  46. Romero Millán, L.M.; Sierra Vargas, F.E.; Nzihou, A. Kinetic Analysis of Tropical Lignocellulosic Agrowaste Pyrolysis. BioEnergy Res. 2017, 10, 832–845. [Google Scholar] [CrossRef] [Green Version]
  47. Nyakuma, B.B. Kinetic analysis of oil palm empty fruit bunch (OPEFB) pellets as feedstock for pyrolysis. PeerJ PrePrints 2015, 3, e1150v1. [Google Scholar]
  48. Wang, S.; Dai, G.; Yang, H.; Luo, Z. Lignocellulosic biomass pyrolysis mechanism: A state-of-the-art review. Prog. Energy Combust. Sci. 2017, 62, 33–86. [Google Scholar] [CrossRef]
  49. Zhang, Y.; Chen, P.; Liu, S.; Peng, P.; Min, M.; Cheng, Y.; Anderson, E.; Zhou, N.; Fan, L.; Liu, C.; et al. Effects of feedstock characteristics on microwave-assisted pyrolysis—A review. Bioresour. Technol. 2017, 230, 143–151. [Google Scholar] [CrossRef]
  50. Uzoejinwa, B.B.; He, X.; Wang, S.; El-Fatah Abomohra, A.; Hu, Y.; Wang, Q. Co-pyrolysis of biomass and waste plastics as a thermochemical conversion technology for high-grade biofuel production: Recent progress and future directions elsewhere worldwide. Energy Convers. Manag. 2018, 163, 468–492. [Google Scholar] [CrossRef]
  51. Hassan, H.; Lim, J.K.; Hameed, B.H. Recent progress on biomass co-pyrolysis conversion into high-quality bio-oil. Bioresour. Technol. 2016, 221, 645–655. [Google Scholar] [CrossRef]
  52. Sogancioglu, M.; Yel, E.; Ahmetli, G. Pyrolysis of waste high density polyethylene (HDPE) and low density polyethylene (LDPE) plastics and production of epoxy composites with their pyrolysis chars. J. Clean. Prod. 2017, 165, 369–381. [Google Scholar] [CrossRef]
  53. Scarfato, P.; Incarnato, L.; Di Maio, L.; Dittrich, B.; Schartel, B. Influence of a novel organo-silylated clay on the morphology, thermal and burning behavior of low density polyethylene composites. Compos. Part B Eng. 2016, 98, 444–452. [Google Scholar] [CrossRef]
  54. Zattini, G.; Leonardi, C.; Mazzocchetti, L.; Cavazzoni, M.; Montanari, I.; Tosi, C.; Benelli, T.; Giorgini, L. Pyrolysis of Low-Density Polyethylene. In Sustainable Design and Manufacturing 2017; SDM 2017; Smart Innovation, Systems and Technologies; Campana, G., Howlett, R., Setchi, R.C.B., Eds.; Springer: Cham, Switzerland, 2017; pp. 480–490. [Google Scholar]
  55. Li, B.; Chen, G.; Zhang, H.; Sheng, C. Development of non-isothermal TGA–DSC for kinetics analysis of low temperature coal oxidation prior to ignition. Fuel 2014, 118, 385–391. [Google Scholar] [CrossRef]
  56. Ozbas, K.E.; Kök, M.V.; Hicyilmaz, C. DSC study of the combustion properties of turkish coals. J. Therm. Anal. Calorim. 2003, 71, 849–856. [Google Scholar] [CrossRef]
  57. Mohan, D.J.; Kullová, L. A study on the relationship between preparation condition and properties/performance of polyamide TFC membrane by IR, DSC, TGA, and SEM techniques. Desalin. Water Treat. 2013, 51, 586–596. [Google Scholar] [CrossRef]
  58. Boycheva, S.; Zgureva, D.; Vassilev, V. Kinetic and thermodynamic studies on the thermal behaviour of fly ash from lignite coals. Fuel 2013, 108, 639–646. [Google Scholar] [CrossRef]
  59. Zhou, L.; Zou, H.; Wang, Y.; Le, Z.; Liu, Z.; Adesina, A.A. Effect of potassium on thermogravimetric behavior and co-pyrolytic kinetics of wood biomass and low density polyethylene. Renew. Energy 2017, 102, 134–141. [Google Scholar] [CrossRef]
Figure 1. (a) TG, and (b) DTG curves for OPEFB and SWP samples and their blends at heating rate of 10 °C min−1.
Processes 07 00475 g001
Figure 2. (a) TG, and (b) DTG curves for OPEFB and SWP samples and their blends at heating rates of 20 °C min−1.
Processes 07 00475 g002
Figure 3. DSC evolutions of sample species evaluated (15 °C min−1).
Processes 07 00475 g003
Table 1. Ultimate and proximate composition of samples.
ComponentMethodComposition (wt.%)
OPEFBSWP
Ultimate analysis
Carbon (C)Elemental analyzer54.4086.93
Hydrogen (H)Elemental analyzer7.6416.54
Oxygen (O)By difference36.441.39
Nitrogen (N)Elemental analyzer1.040.09
Sulphur (S)Elemental analyzer0.480.12
Proximate analysis
Volatile matterASTM E 897-8281.499.6
Fixed carbonBy difference18.60.0
AshASTM D 1102-844.60.4
Table 2. Properties of active pyrolysis zone at different heating rates.
ComponentHeating Rate (°C min−1)Pyrolysis Range (°C)Peak Temperature (°C)Total Mass Loss (%)
OPEFB: SWP
100:010219–38032859.98
20216–36433558.4
80:2010220–502337 & 48472.29
20220–497332 & 48374.5
60:4010232–498339 & 48077.33
20220–502337 & 48581.5
50:5010243–503331 & 48583.40
20237–552304 & 46093.16
40:6010235–503329 & 48183.96
20237–502338 & 48385.7
20:8010262–501329 & 48689.14
20273–501329 & 48490.75
0:10010464–50748694.45
20411–49748092.55
Table 3. Kinetics parameters of samples at different heating rates.
ReactionHeating Rate (°C min−1)Tp (°C)R2Ea (kJ mol−1)A (min−1)Reaction Rate Constant at Tp (min−1)
AverageStandard Deviation
OPEFB 100103270.982146.831.29 × 1030.150.0386
203340.965544.211.18 × 103
OPEFB 80, SWP 20-First stage103310.993448.421.10 × 1030.100.0332
203320.989449.972.84 × 103
OPEFB 80, SWP 20-Second stage104860.946775.143.05 × 1044.224.01
204840.965972.338.05 × 105
OPEFB 60, SWP 40-First stage103200.994849.891.10 × 1030.070.027
203340.992650.852.34 × 103
OPEFB 60, SWP 40-Second stage104800.952393.257.03 × 1050.420.1763
204840.9281123.652.01 × 108
OPEFB 50, SWP 50-First stage103270.993445.813.28 × 1020.040.0107
203160.991049.281.29 × 103
OPEFB 50, SWP 50-Second stage104850.9627183.001.72 × 10120.540.1202
204640.9862112.165.89 × 107
OPEFB 40, SWP 60-First stage103260.974845.463.11 × 1020.060.0223
203340.999261.751.61 × 104
OPEFB 40, SWP 60-Second stage104790.9587217.674.30 × 1070.400.4002
204840.9463195.992.66 × 1013
OPEFB 20, SWP 80-First stage103270.906640.083.91 × 1010.020.0092
203350.968355.971.99 × 103
OPEFB 20, SWP 80–Second stage104810.9395240.261.55 × 10160.620.2648
204820.9393229.867.02 × 1015
SWP 100104860.9092346.932.95 × 10230.710.3111
204800.9540234.361.83 × 1016
Table 4. DSC results of the samples.
Sample (%)TOnset (°C)TPeak (°C)TEndset (°C)Enthalpy, H (J g−1)
First stage
OPEFB, 10042.0687.64131.32147.69
OPEFB, 90: SWP 1045.2191.04130.31155.55
OPEFB, 80: SWP, 2042.0490.42146.40144.45
OPEFB, 70: SWP, 3089.66120.77127.5083.54
SWP, 10095.30122.15122.15117.39
Second stage
OPEFB, 100147.23240.96292.3288.41
OPEFB, 90: SWP, 10---84.42
OPEFB, 80: SWP, 20---59.83
OPEFB, 70: SWP, 30152.08251.87332.9788.97
SWP, 100----
Third stage
OPEFB, 100315.25340.20353.6622.28
OPEFB, 90: SWP, 10287.90339.55355.90158.21
OPEFB, 80: SWP, 20295.60339.89354.82161.04
OPEFB, 70: SWP, 30---145.40
SWP, 100----
Forth stage
OPEFB, 100437.11465.29520.4218.44
OPEFB, 90: SWP, 10423.74484.73517.18-
OPEFB, 80: SWP, 20476.52487.21515.89-
OPEFB, 70: SWP, 30476.17489.27510.80-
SWP, 100455.68491.56511.481030.19

