Article

Shear-Flow Coupled Behavior of Artificial Joints with Sawtooth Asperities

1
Department of Geotechnical Engineering, Tongji University, Shanghai 200092, China
2
Key Laboratory of Geotechnical and Underground Engineering of Ministry of Education, Department of Geotechnical Engineering, Tongji University, Shanghai 200092, China
3
College of Engineering, Tibet University, Lhasa 850011, China
*
Author to whom correspondence should be addressed.
Processes 2018, 6(9), 152; https://doi.org/10.3390/pr6090152
Submission received: 20 July 2018 / Revised: 20 August 2018 / Accepted: 21 August 2018 / Published: 1 September 2018
(This article belongs to the Special Issue Fluid Flow in Fractured Porous Media)

Abstract

:
The coupling between hydraulic and mechanical processes in rock joints has significantly influenced the properties and applications of rock mass in many engineering fields. In this study, a series of regular shear tests and shear-flow coupled tests were conducted on artificial joints with sawtooth asperities. Shear deformation, strength, and seepage properties were comprehensively analyzed to reveal the influence of joint roughness, normal stress, and seepage pressure on shear-flow coupled behavior. The results indicate that the shear failure mode, which can be divided into sliding and cutting, is dominated by joint roughness and affected by the other two factors under certain conditions. The seepage process makes a negative impact on shear strength as a result of the mutual reinforcing of offsetting and softening effects. The evolution of hydraulic aperture during the shear-flow coupled tests embodies a consistent pattern of four stages: shear contraction, shear dilation, re-contraction, and stability. The permeability of joint sample is considerably enlarged with the increase of joint roughness, but decreases with the addition of normal stress.

1. Introduction

The strength and deformability of rock joints have been the subjects of numerous investigations, in design and analysis of underground structures, foundation, slope stability, and risk assessment of underground disposal [1,2,3]. The coupling between hydraulic and mechanical processes in rock joints, as one of these subjects, has received wide attention, since a series of events, including dam failures, landslides, and injection-induced earthquakes, were believed to result from it [4,5,6].
Performing laboratory coupled stress-flow tests is an effective way to study the coupled stress-flow characteristics of rock joint [7]. Iwai [8] presented a one-dimensional model where a rough fracture consists of a series of wedge-shaped increments. Raven and Gale [9] studied the effect of changes in sample size on the normal stress-permeability properties of natural fractures. Durham and Bonner [10] characterized the hydraulic behavior of joints under conditions where fluid migrates. These early studies were limited to investigating the effect of normal loading on fluid flow through rock fractures.
The mutual effects of normal and shear stress on fractures with fluid flow were considered in further studies. Singh [11] measured the permeability of sandstone using triaxial tests, proposing that permeability changed as a function of differential stress. Some studies have been dedicated to jointed rock behavior under triaxial undrained conditions, including pore water pressure behavior, with or without infilled joints [12,13]. Chen [14] investigated the effects of normal stress on the mechanical and hydraulic behavior of fractures. Liu [15] analyzed the relationships between aperture and triaxial stresses, and developed coupled models of seepage and triaxial stresses. Although these investigations involved seepage of rock fractures subjected to three-dimensional stresses, which is more appropriate, the effect of shear stress on the jointed rock has not been involved.
In the past decades, numerous studies have been performed to investigate the shear behavior of rock joints under different conditions: constant normal load (CNL) and constant normal stiffness (CNS) [16,17,18,19,20]. However, the seepage behavior coupling with stress was not comprehensively involved in these studies. A series of shear-flow coupling tests were carried out by Jiang et al., with some empirical relations proposed [21,22,23,24], but they did not investigate the influence of water pressure on permeability characteristics. Olsson and Barton [25] carried out a shear-flow coupled test under low seepage pressure, and studied the influence of joint dilatancy on the joint width. Shi [26] introduced a new sealing system of shear box to achieve higher hydraulic pressure shear-flow coupled tests on jointed rock samples. They developed an empirical equation for obtaining the shear strength of jointed rocks experiencing a higher seepage pressure.
Studies on the interaction of high water pressure, joint roughness coefficients, and normal stress in the shear-flow coupled tests are still few, due to various reasons. In this paper, direct shear tests and shear-flow coupled tests, with different joint roughness, normal stresses, and seepage pressures, were performed to investigate the shear behavior of joint rock, choosing sawtooth surface as a simplification of the natural structure planes. The mechanisms of shear strength, seepage process, and shear failure modes under different conditions are compared and evaluated. The results could improve the basis work for studying the mechanics and hydraulic characteristics of jointed rock mass, thus providing certain engineering application value for problems in underground cavern excavation, reservoir, mining, dam, and other fields.

2. Materials and Methods
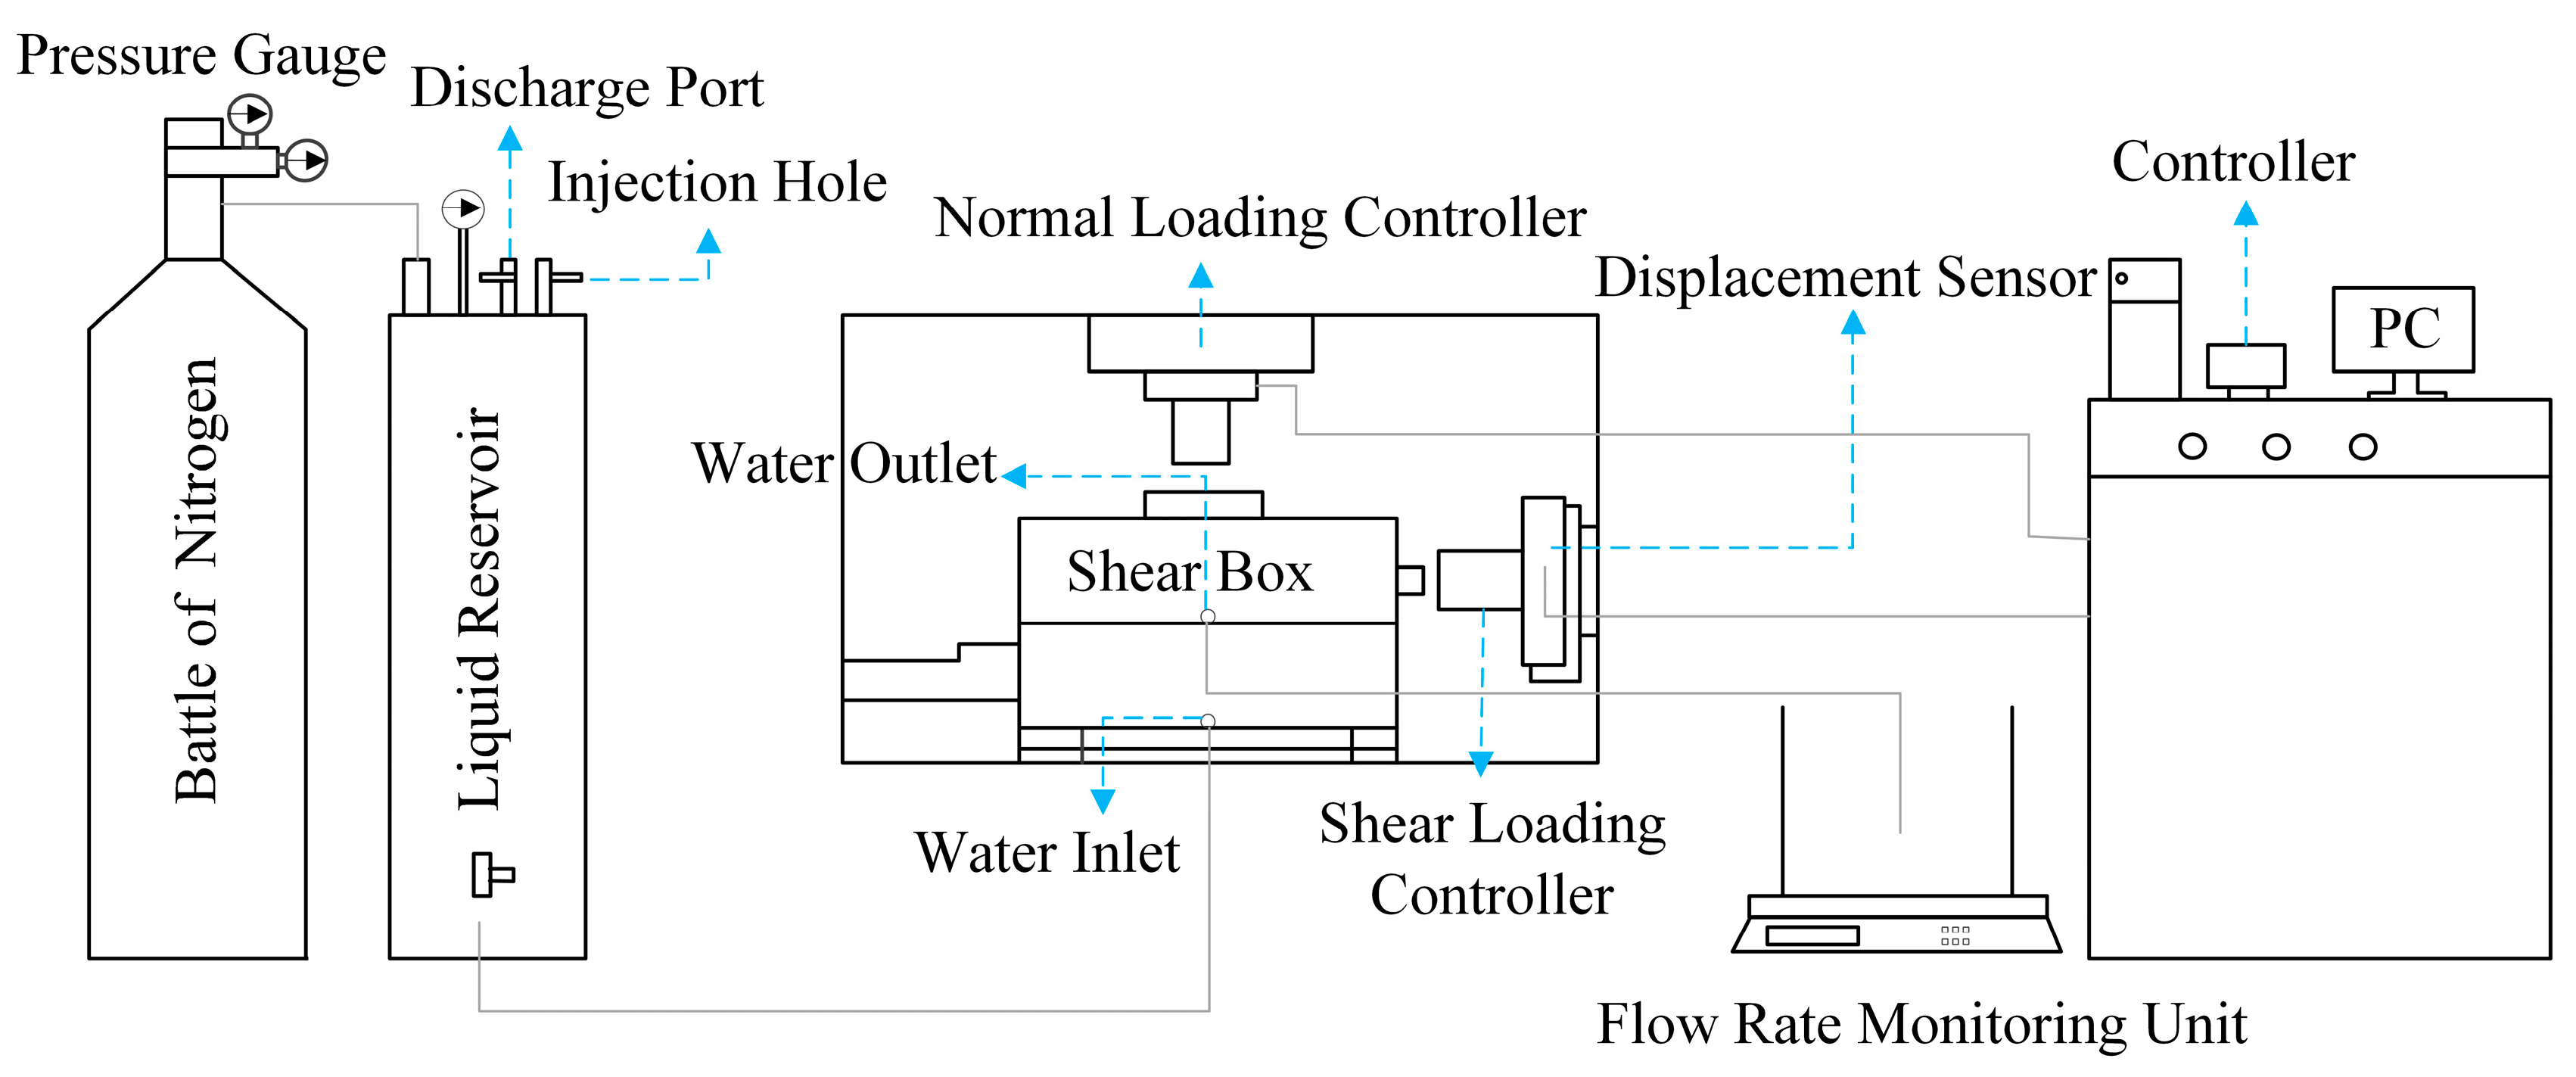
2.1. Test Equipment

The regular shear tests and shear-flow coupled tests were both carried out on the digit-control shear-flow coupled test system, as shown in Figure 1, which was developed by Tongji University and manufactured by Digit-Control Technology Company of Changsha YaXing [27]. The test system mainly includes four parts: servo control unit, normal and tangential loading system, sealed shear box, and seepage loading system. The servo control unit is characterized by rapid speed, high measurement precision, and short feedback time, which can realize the control mode of constant normal load (CNL). The largest normal and tangential stress is 30 MPa, with the measuring accuracy of 1%; the largest deformation measurement range is 25 mm, with the measuring accuracy of ±0.5%.
The maximum shear deformation along the shear flow direction is 15 mm and the maximum seepage pressure is 3 MPa. The joint sample was placed in the middle of the sealed shear box. During the test, the water was pumped from a water tank and flowed into the joint through water inlet under the set pressure. The outflow of the water was collected and weighted. Three sensors were set on the water outlet for averaging to reduce errors.

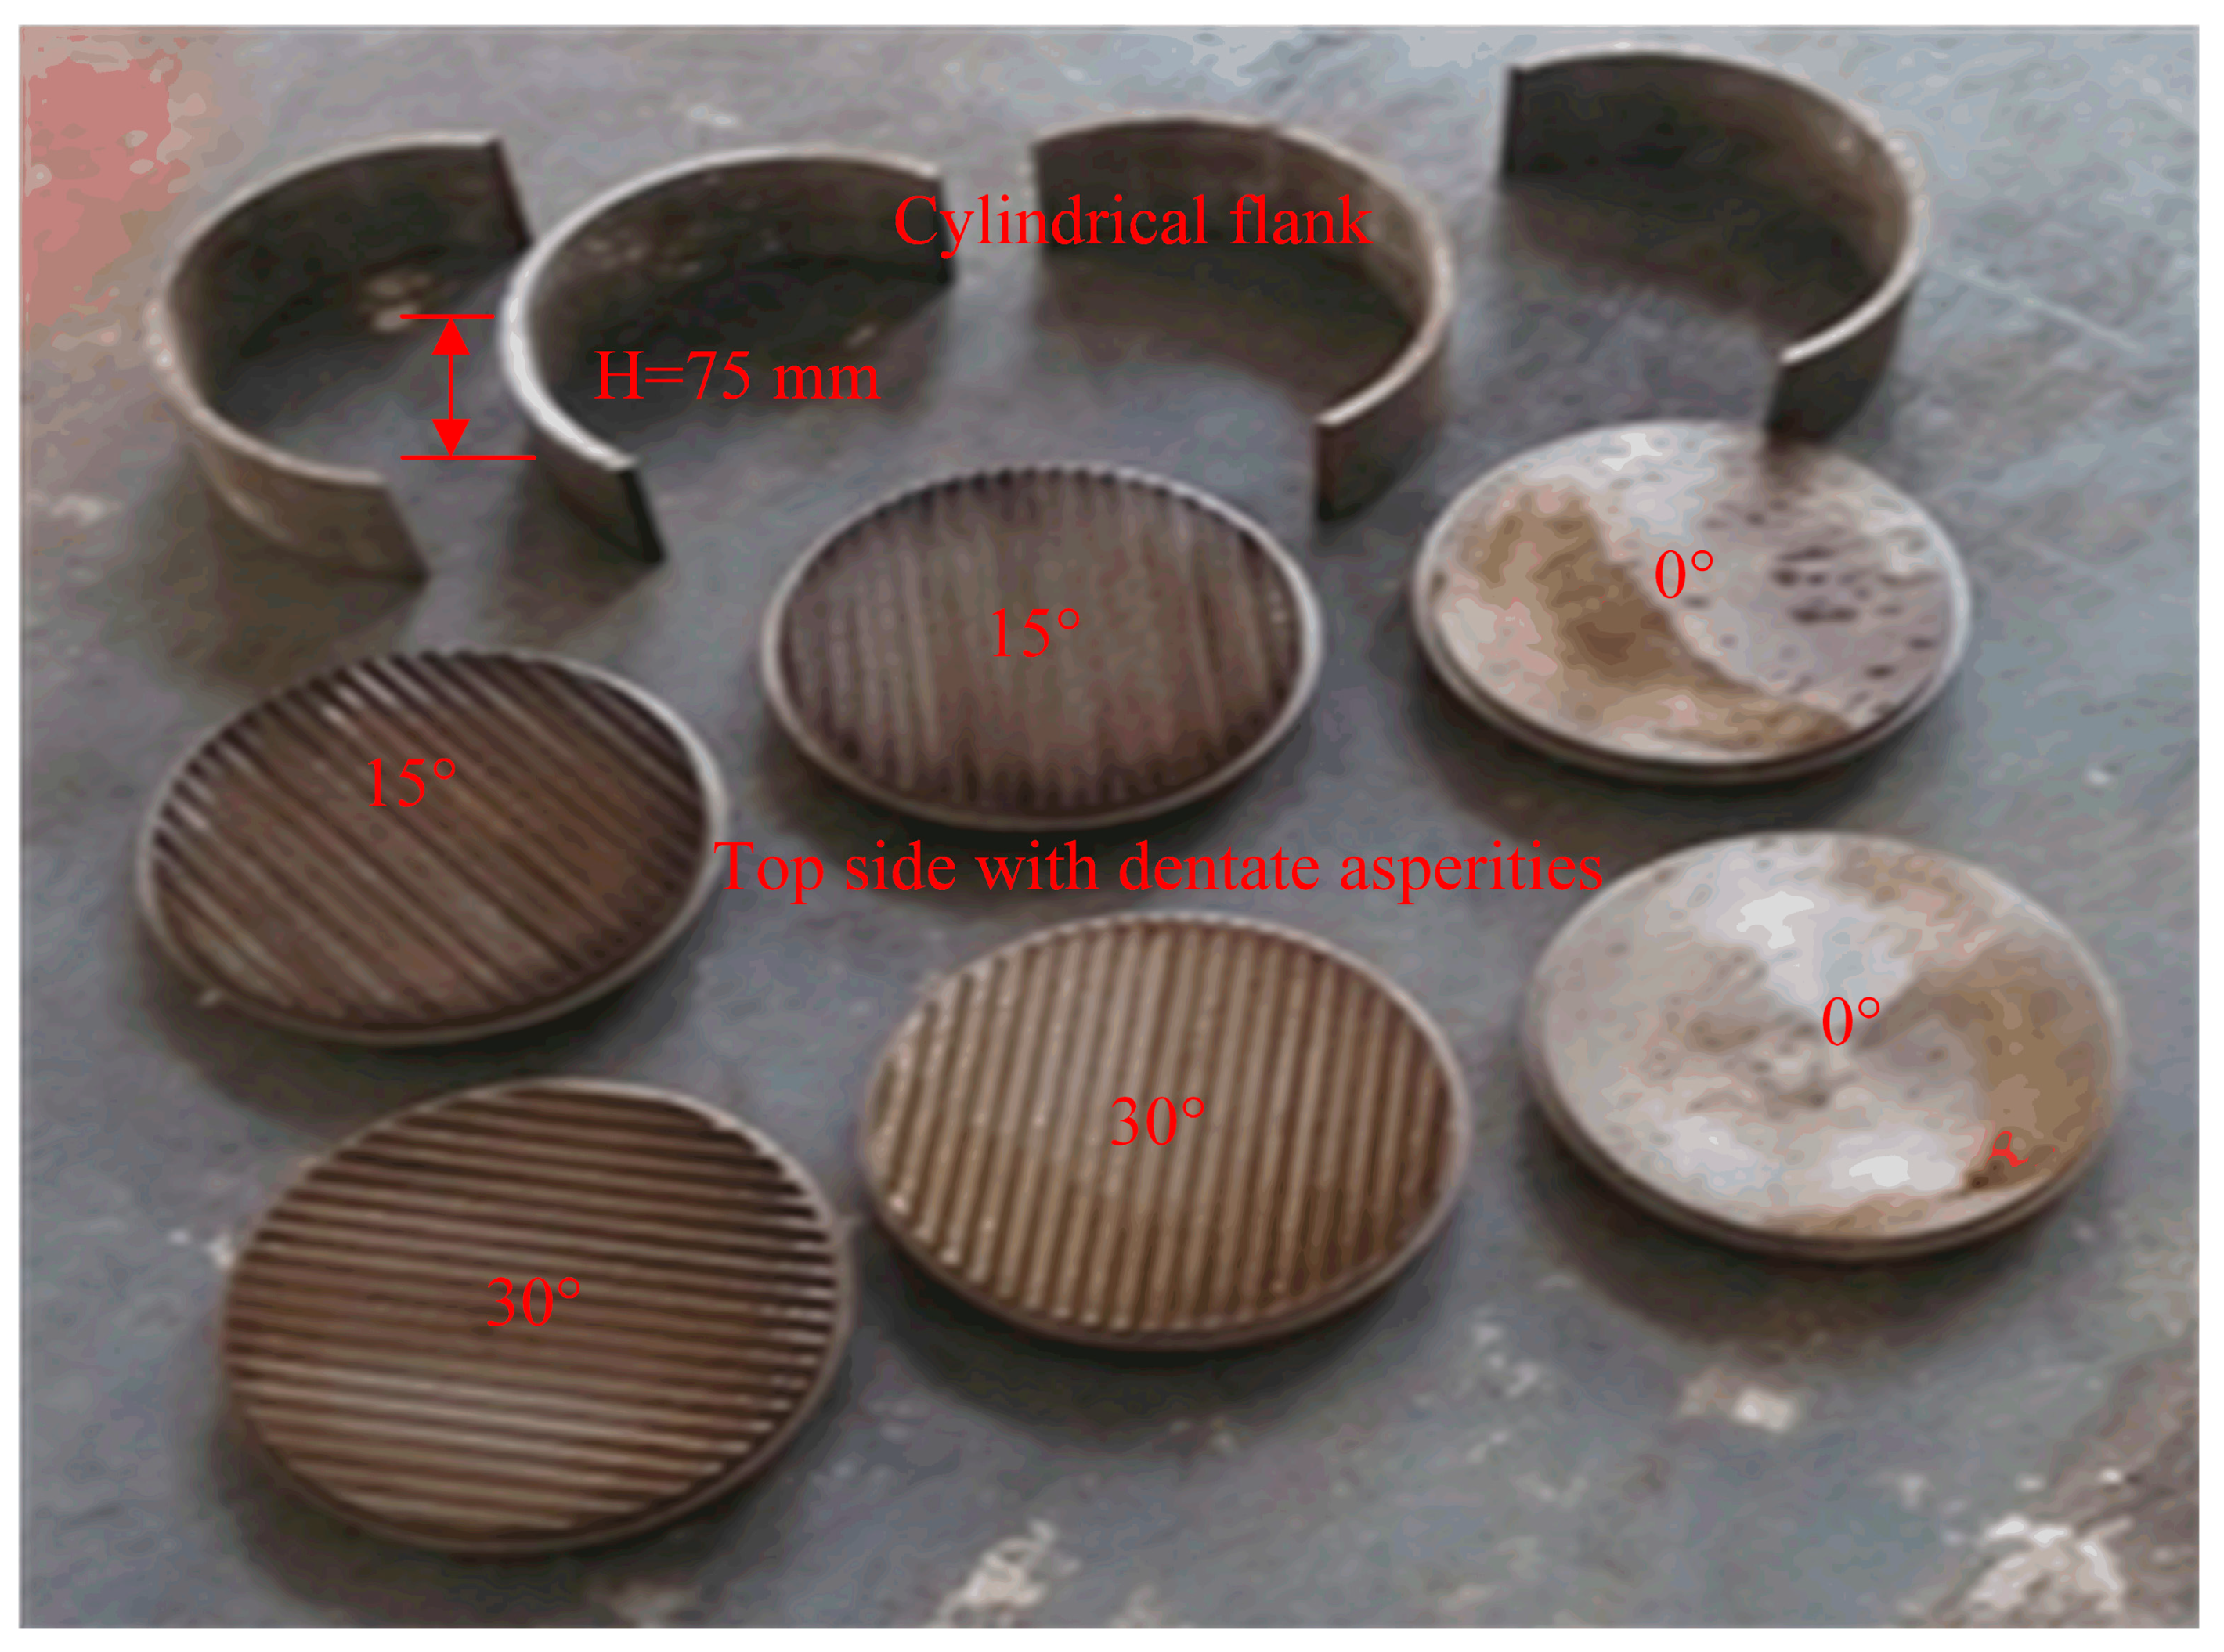
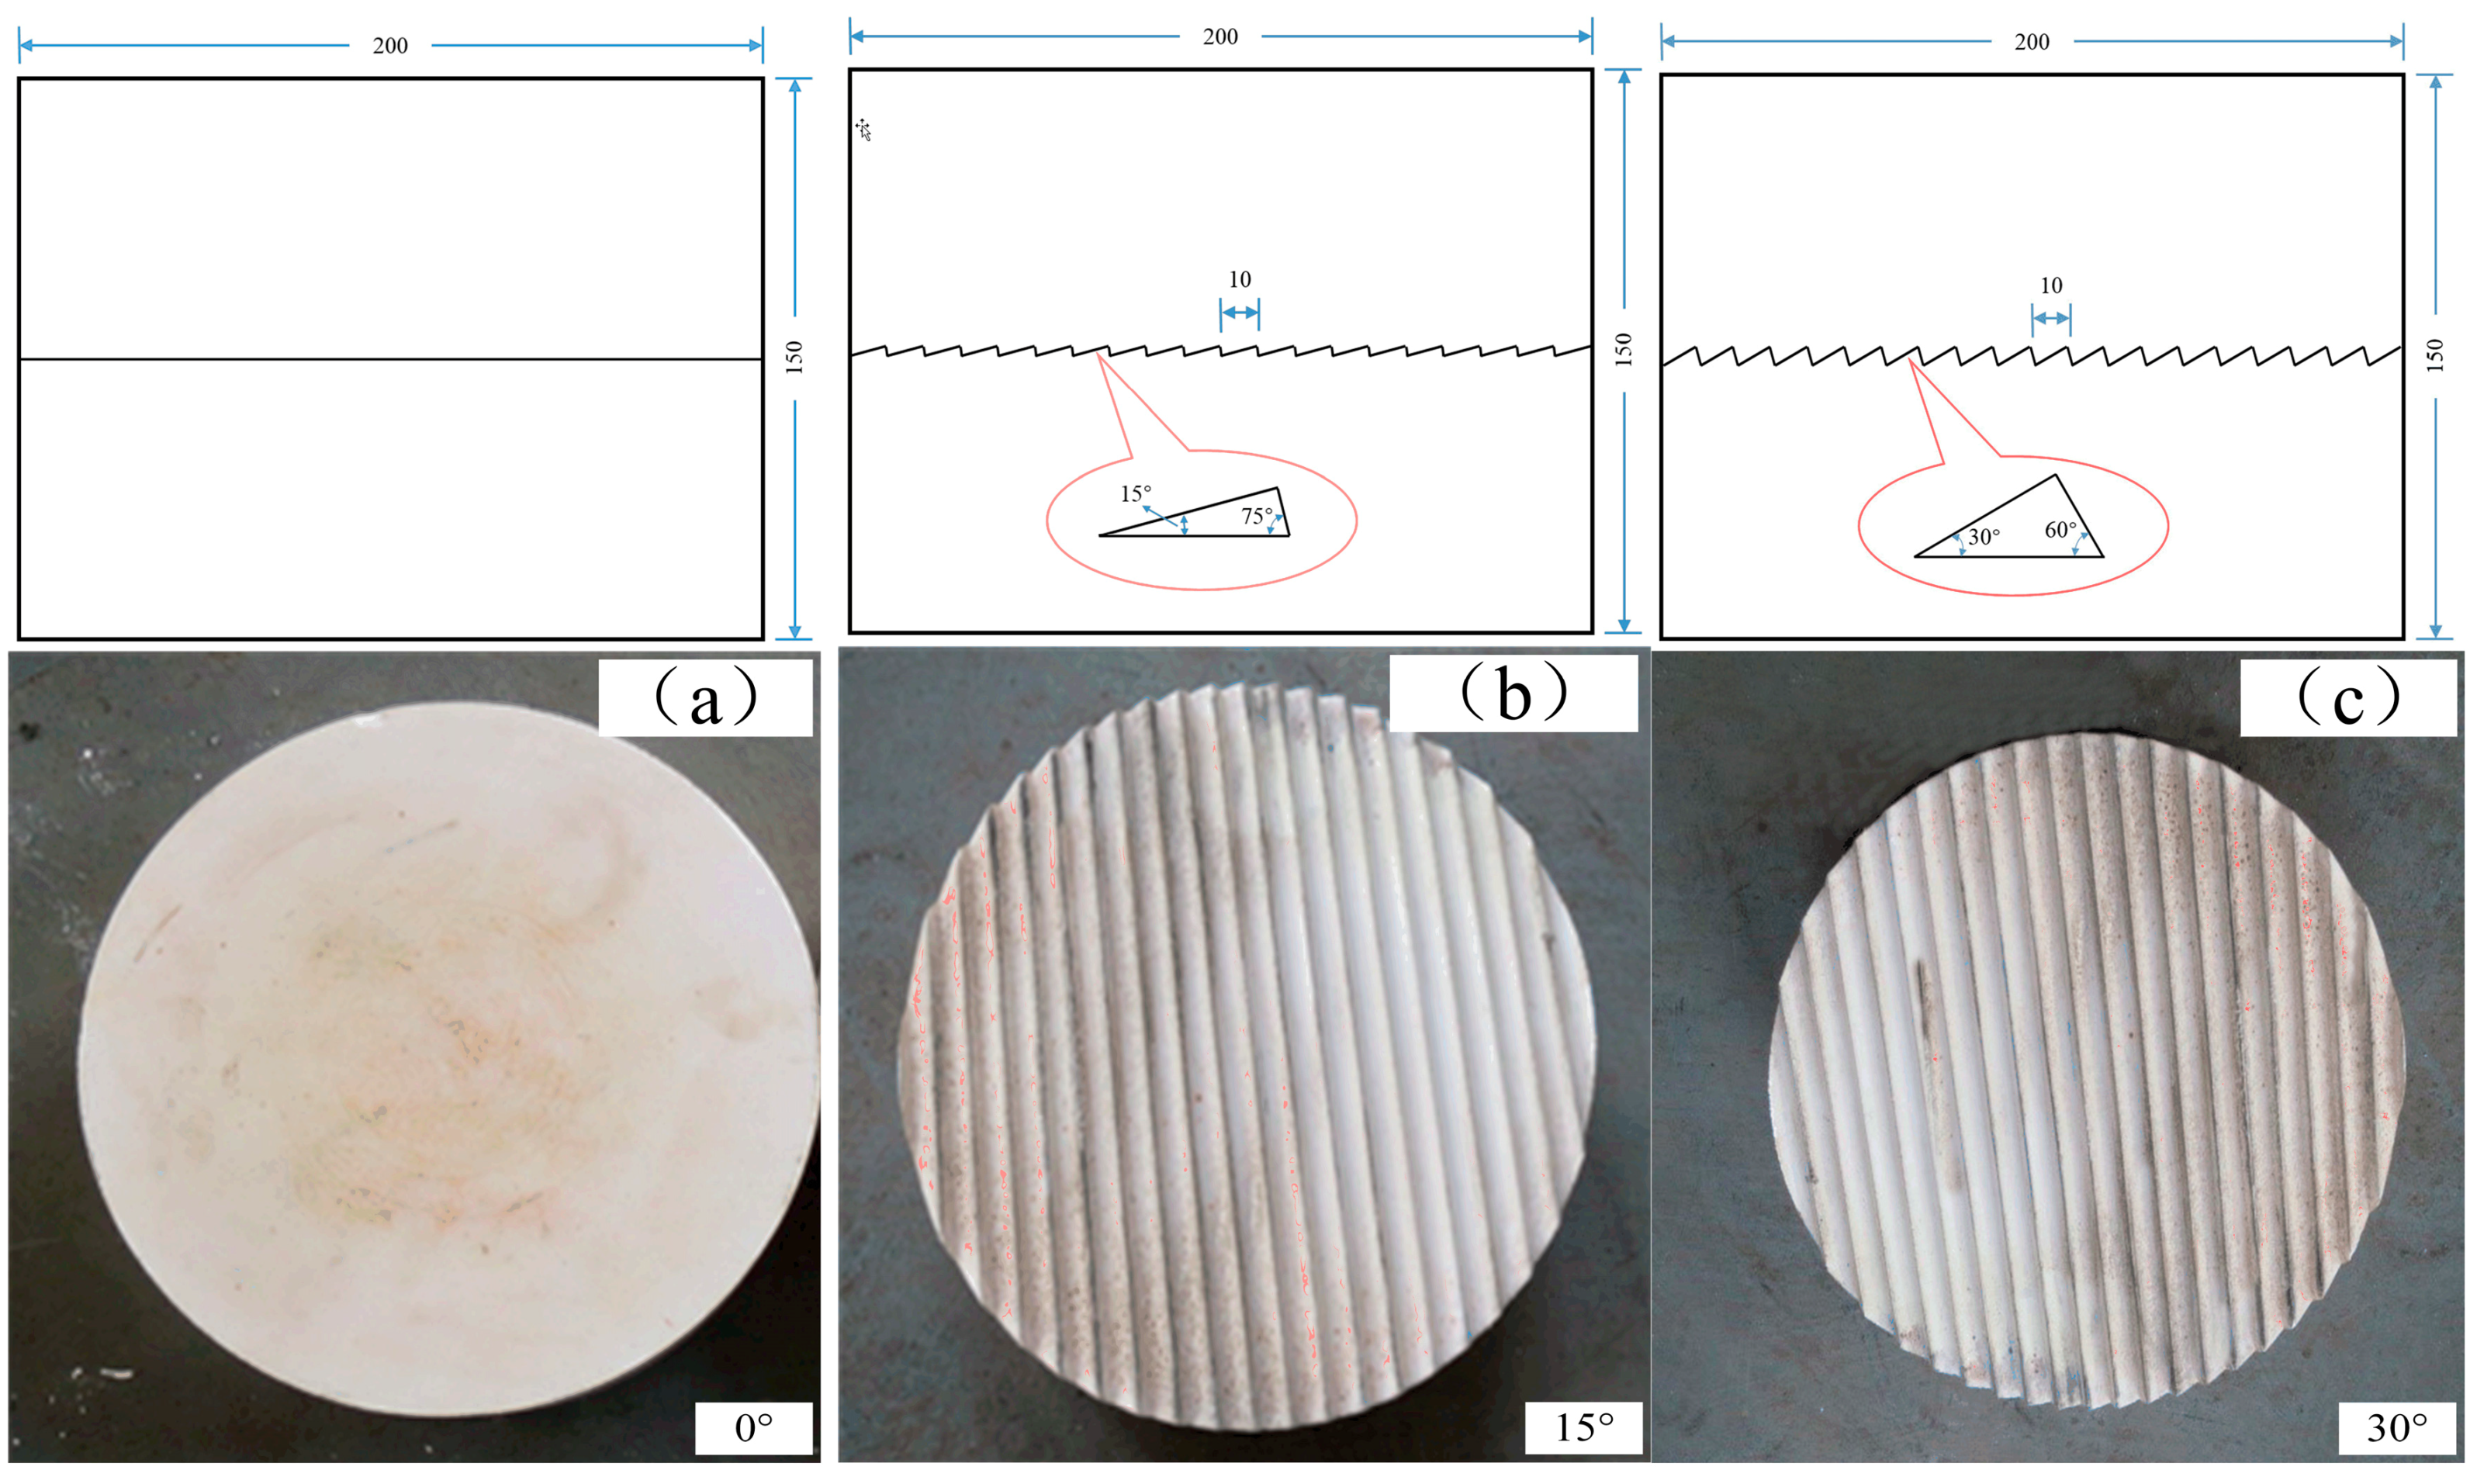
2.2. Sample Preparation

Considering that this study was a fundamental research study, artificial joint samples made of plaster were used to simulate the natural rock structure. Plaster and water were mixed in the ratio of 4:1 by weight, which was based on a previous study [28]. The plaster material could be easily molded into any shape and size, and was ideal for modelling rock samples with low to medium strength [18,19].
To meet the requirement of the shear-flow coupled test system, cylindrical samples with a circular shear surface (φ200 mm × 150 mm) were needed. Some previous studies investigated the hydromechanical properties of joint rock, using cylindrical samples, but with different scales or structures [11,13,14,26,29]. Before the preparation of samples, the molds, as shown in Figure 2, were cleaned and smeared with Vaseline, to ensure successful knockout. The mix of plaster and water was poured into the molds to be solidified for about 30 min, and then left undisturbed for 8 h after being taken out. Then, a hole (φ5 mm) was drilled in the center of the samples as the injection hole of the radiation flow.
Four kinds of samples were prepared: intact samples, samples with smooth profiles, and rough profiles consisting of triangular asperities with either 15° or 30° inclination angles. Details of these profiles are shown in Figure 3. It can be seen that the results of angles greater than 45° are symmetrical with the results of angles less than 45°. Additionally, a previous similar study suggested that the shear properties of the joint with this morphology showed uniqueness when the angle is around 20°, while the cases of 30° and 45° did not show much difference [28]. Therefore, the characteristics of artificial joints samples of joint roughness of 0°, 15°, 30° were studied. In an earlier study, Dove and Frost [30] introduced a roughness parameter, R = As/A0, where As is the actual area of the surface, and A0 is the projected area of the surface. In our experiments, this roughness parameter can be calculated as R = sin θ + cos θ, where θ is the sawtooth angle and 0° < θ < 90°. Therefore, the angle of the asperity was used to represent the roughness of joint surface in this paper, and the roughness increased as this angle increased. The uniaxial compressive strength of these samples was about 25 MPa, obtained though uniaxial compression tests. The regular shear tests were performed to obtain the shear strength parameters of intact samples, which were shown in Table 1.

2.3. Testing Scheme

In both shear tests and shear-flow coupled tests, the normal stresses were chosen to be 1.5 MPa and 2.5 MPa, which were approximately the overburden pressures of the rock masses with burial depths of 60 m and 100 m, respectively. All the tests were performed with the maximum shear displacement of 20 mm, and the shear rate of 2 mm/s.
Three groups of samples with different artificial joint surface were subjected to regular shear testing, and each group has two samples for the two levels of normal stress. In regular shear tests, the normal stress was applied on the sample to the predefined value, and remained for 5 min to ensure the normal stress was stable, and then the shear stress was applied until the sample failed. As for shear-flow coupled tests, the samples were divided into three groups according to different joint roughness, and six samples in each group. When the normal stress was stable, the seepage pressure was applied to the predefined value, which was 0.5 MPa, 1.0 MPa, and 1.5 MPa. Being set through the pressure gauge, as shown in Figure 1, this pressure represented the pressure of the water inlet, namely, the pressure of radiant point on the joint surface. Since the joint surface pressure was impossible to measure directly, the water pressure of radiant point was considered as the mean pressure of joint surface. Although the flow form was radiation, theoretically, the water mostly flowed along the joint surface during the experiments, especially when the seepage pressure is small. Basically, the direction of fluid velocity is parallel to the asperities. As the outlet radiant flow was stable, the shear stress was then applied until the sample failed.
In both shear tests and shear-flow coupled tests, the changing values of shear stress with the increase of shear displacement were documented for further analysis. In order to calculate the hydraulic aperture, it was necessary to measure the seepage amount during the shear-flow coupled tests. The method for obtaining the seepage volume was to stop the test every displacement of 1 mm and measure the volume of water flowing out within 30 s at the outlet of the test system.

3. Results of Shear Tests

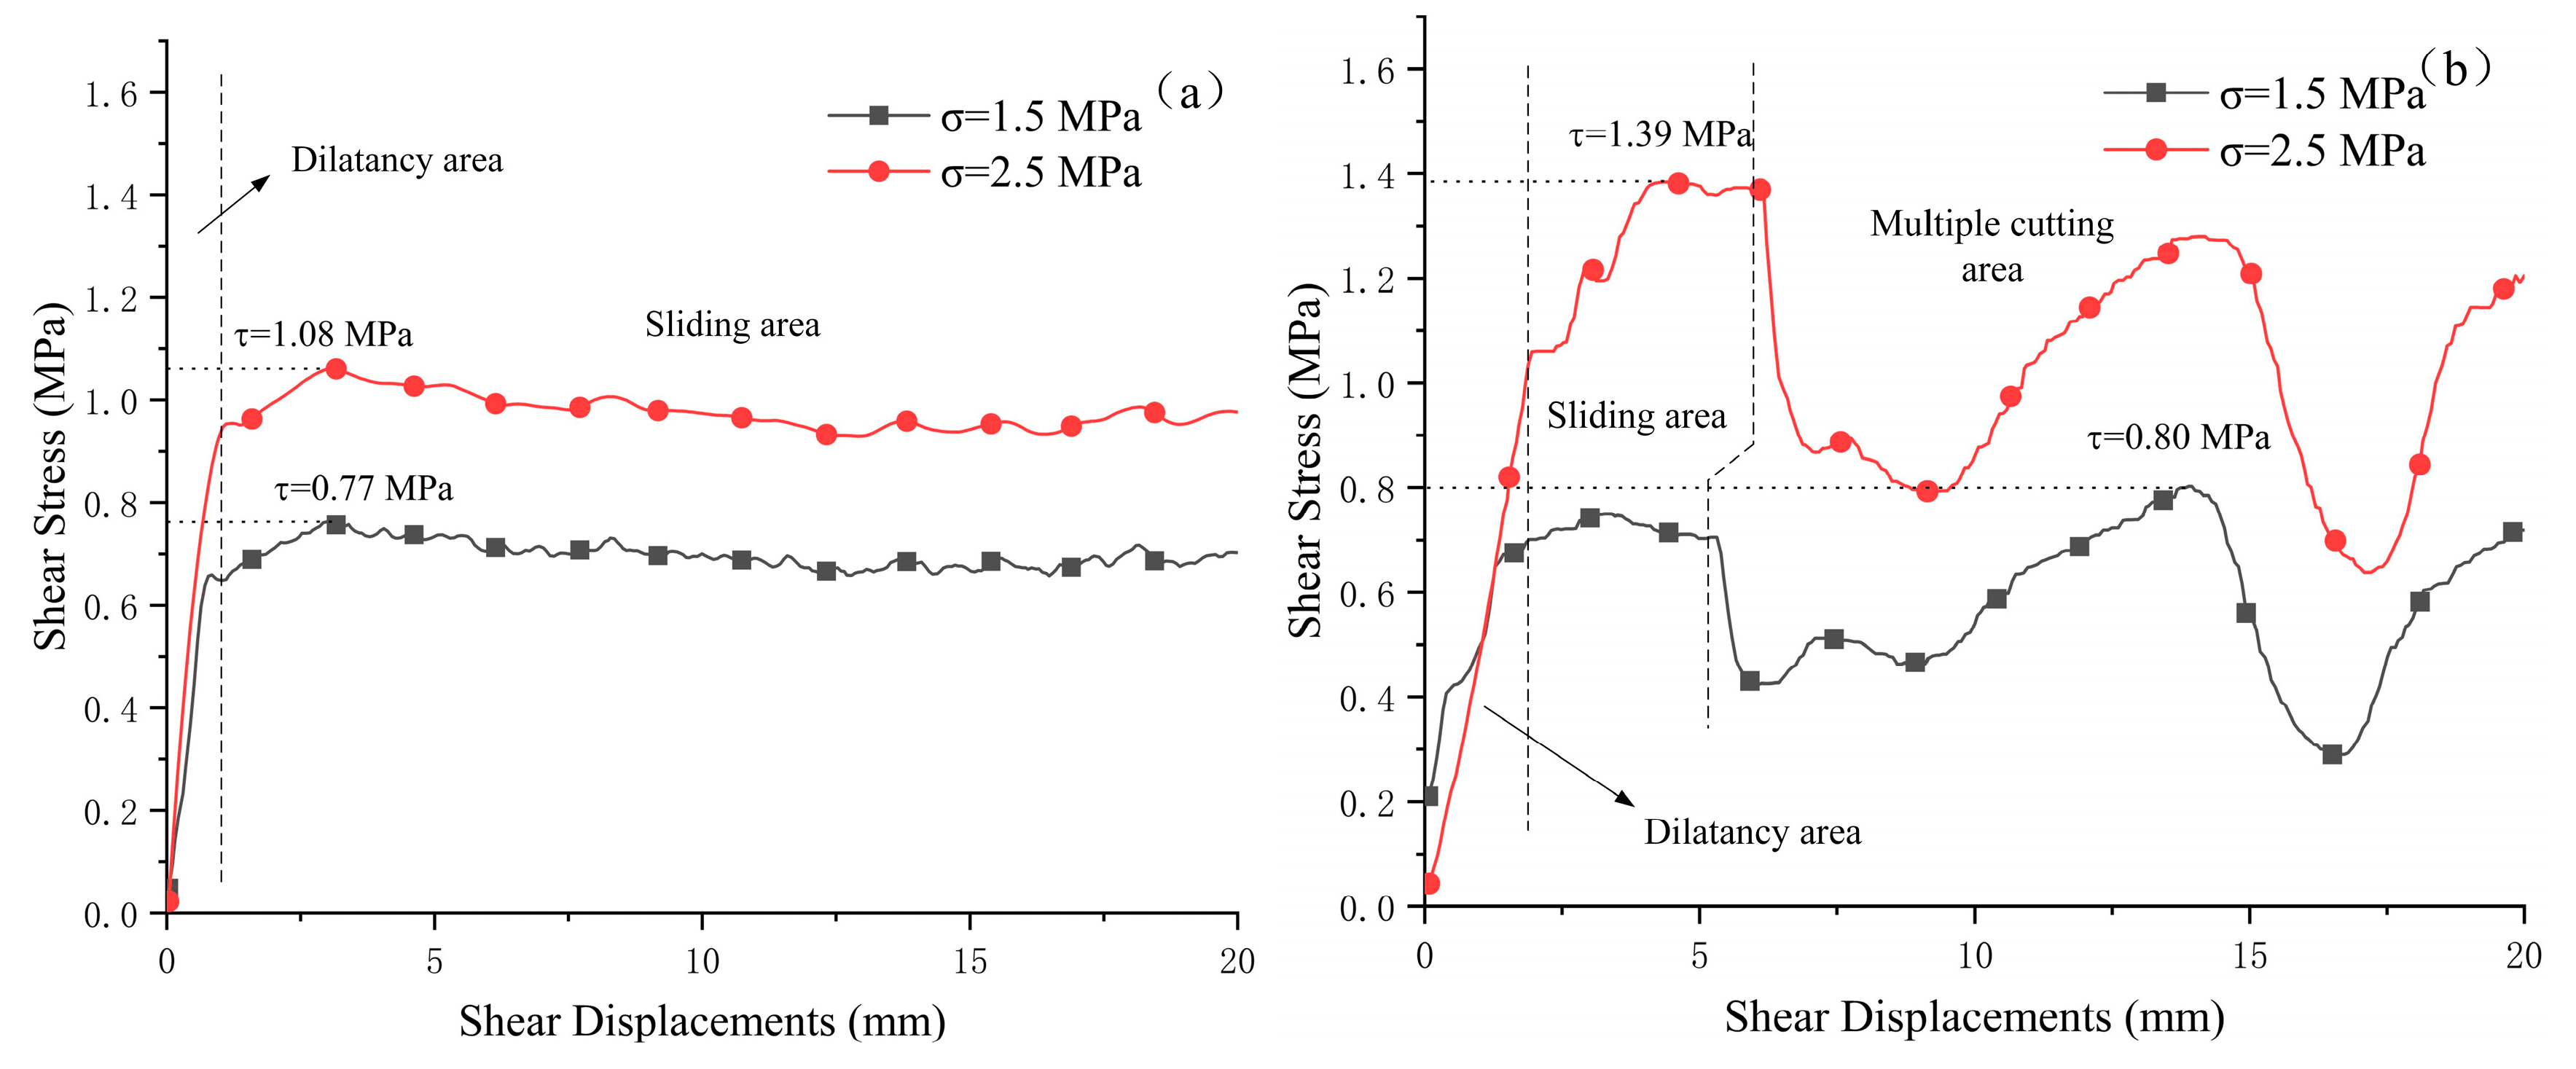
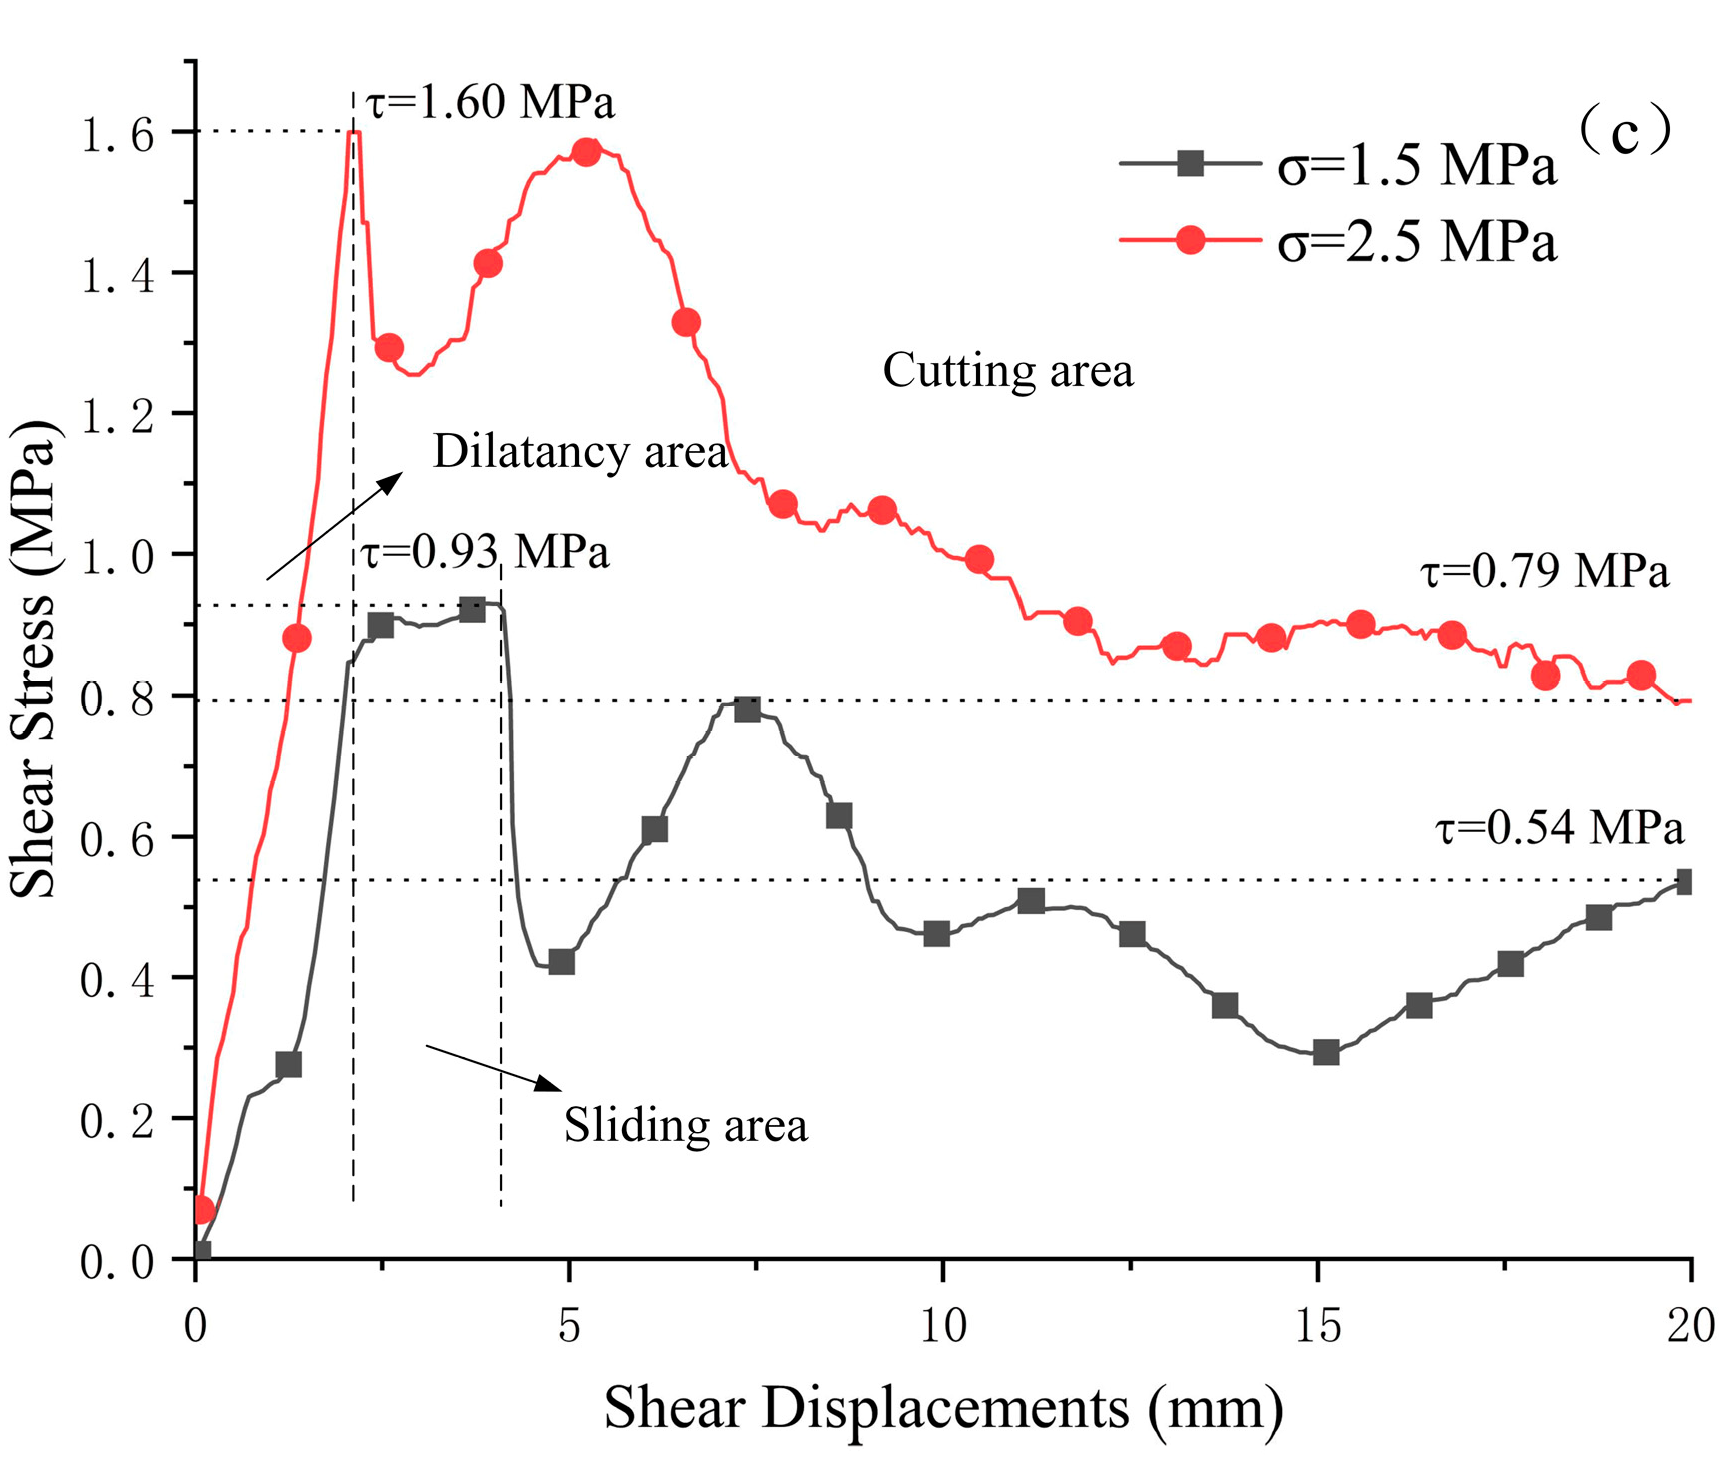
3.1. Shear Deformation Curves

The regular shear tests under two levels of normal stress were carried out on the joint samples with different sawtooth angles. Figure 4 shows the shear deformation curves of these tests. The failure mode of shearing can be obtained by analyzing the shear deformation curves. As shown in Figure 4a, when the joint roughness is 0°, the shear displacement curve is a typical sliding failure mode, showing obvious sliding characteristics, which includes two regions: the shear dilatancy area and the sliding area. As the normal stress increases, the deformation curves keep a similar shape, while the peak shear stress and the residual shear stress increase. Take Figure 4c, for example: the peak stress varies from 0.93 MPa to 1.60 MPa when the normal stress increases to 2.5 MPa; meanwhile, the residual shear stress varies from 0.54 MPa to 0.79 MPa.
In Figure 4b, when the joint roughness is 15°, the shear deformation curves of the joint surface under the normal stress of 1.5 MPa and 2.5 MPa show multiple cutting types. It can be seen that a sliding stage occurs after the initial shear dilatancy area, and then the shear stress rapidly decreases with the increase of deformation. After a fluctuant valley, the shear stress grows slowly until the second peak stress appears. Then, it swiftly falls without a sliding stage and begins to repeat this process. The second peak stress is even larger than the first one in the condition of smaller normal stress. This phenomenon illustrates that the shear failure is sliding failure mode before the first batch of sawteeth are sheared, and the subsequent shear is cutting type, until the wear and destruction of joint surface reach a threshold.
As for the condition of larger sawtooth angle, 30°, it can be observed from Figure 4c that the shear deformation curve also exhibits multiple cutting mode with a short sliding stage when the normal stress is 1.5 MPa. However, the one with larger normal stress of 2.5 MPa does not display a sliding stage after the dilatancy area, but decreases quickly. This indicates that the cutting type failure will be more significant with the increase of normal stress.
It is obvious that the roughness of the joint surface and the normal stress mutually affect the shear failure mode. When the joint surface is smooth, the shear failure is totally in sliding mode. However, when it is rough with a number of high sawteeth, the failure mode tends to change to cutting type. The larger the normal stress is, the bigger this kind of tendency is. The increase of the roughness, meaning the enlargement of the sawtooth, results in a more remarkably interlaced occlusion effect of the contact area, leading to higher strength and more possibility for cutting failure.

3.2. Shear Strength

Shear strength parameters are listed in Table 2, using peak shear strengths obtained from direct shear tests and corresponding normal stresses. In this study, two levels of normal stress are selected. Previous studies have been performed to investigate the shear behavior of joint samples made of similar materials, so the strength parameters in our study are obtained, comprehensively, based on shear tests and other similar studies [26,28].
In Table 2, it is notable that the friction angle increases remarkably as the roughness of joint surface increases. This result is consistent with the observations from shear deformation curves (Figure 4). As the roughness of joint surface increases, the shear failure mode is inclined to cutting type, which allows the interlaced occlusion effect of contact area increasing. In the plaster—plaster interfaces, the ductile and destructive behavior of asperities is proven to have an important influence on the shear strength [19,31]. As a result of the enlargement of the sawtooth, the friction angle reflected from tests is becoming larger. Therefore, the increasing occurrence of cutting mode will result in a larger shear strength, with the addition of joint sawtooth angle.

4. Results of Shear-Flow Coupled Tests

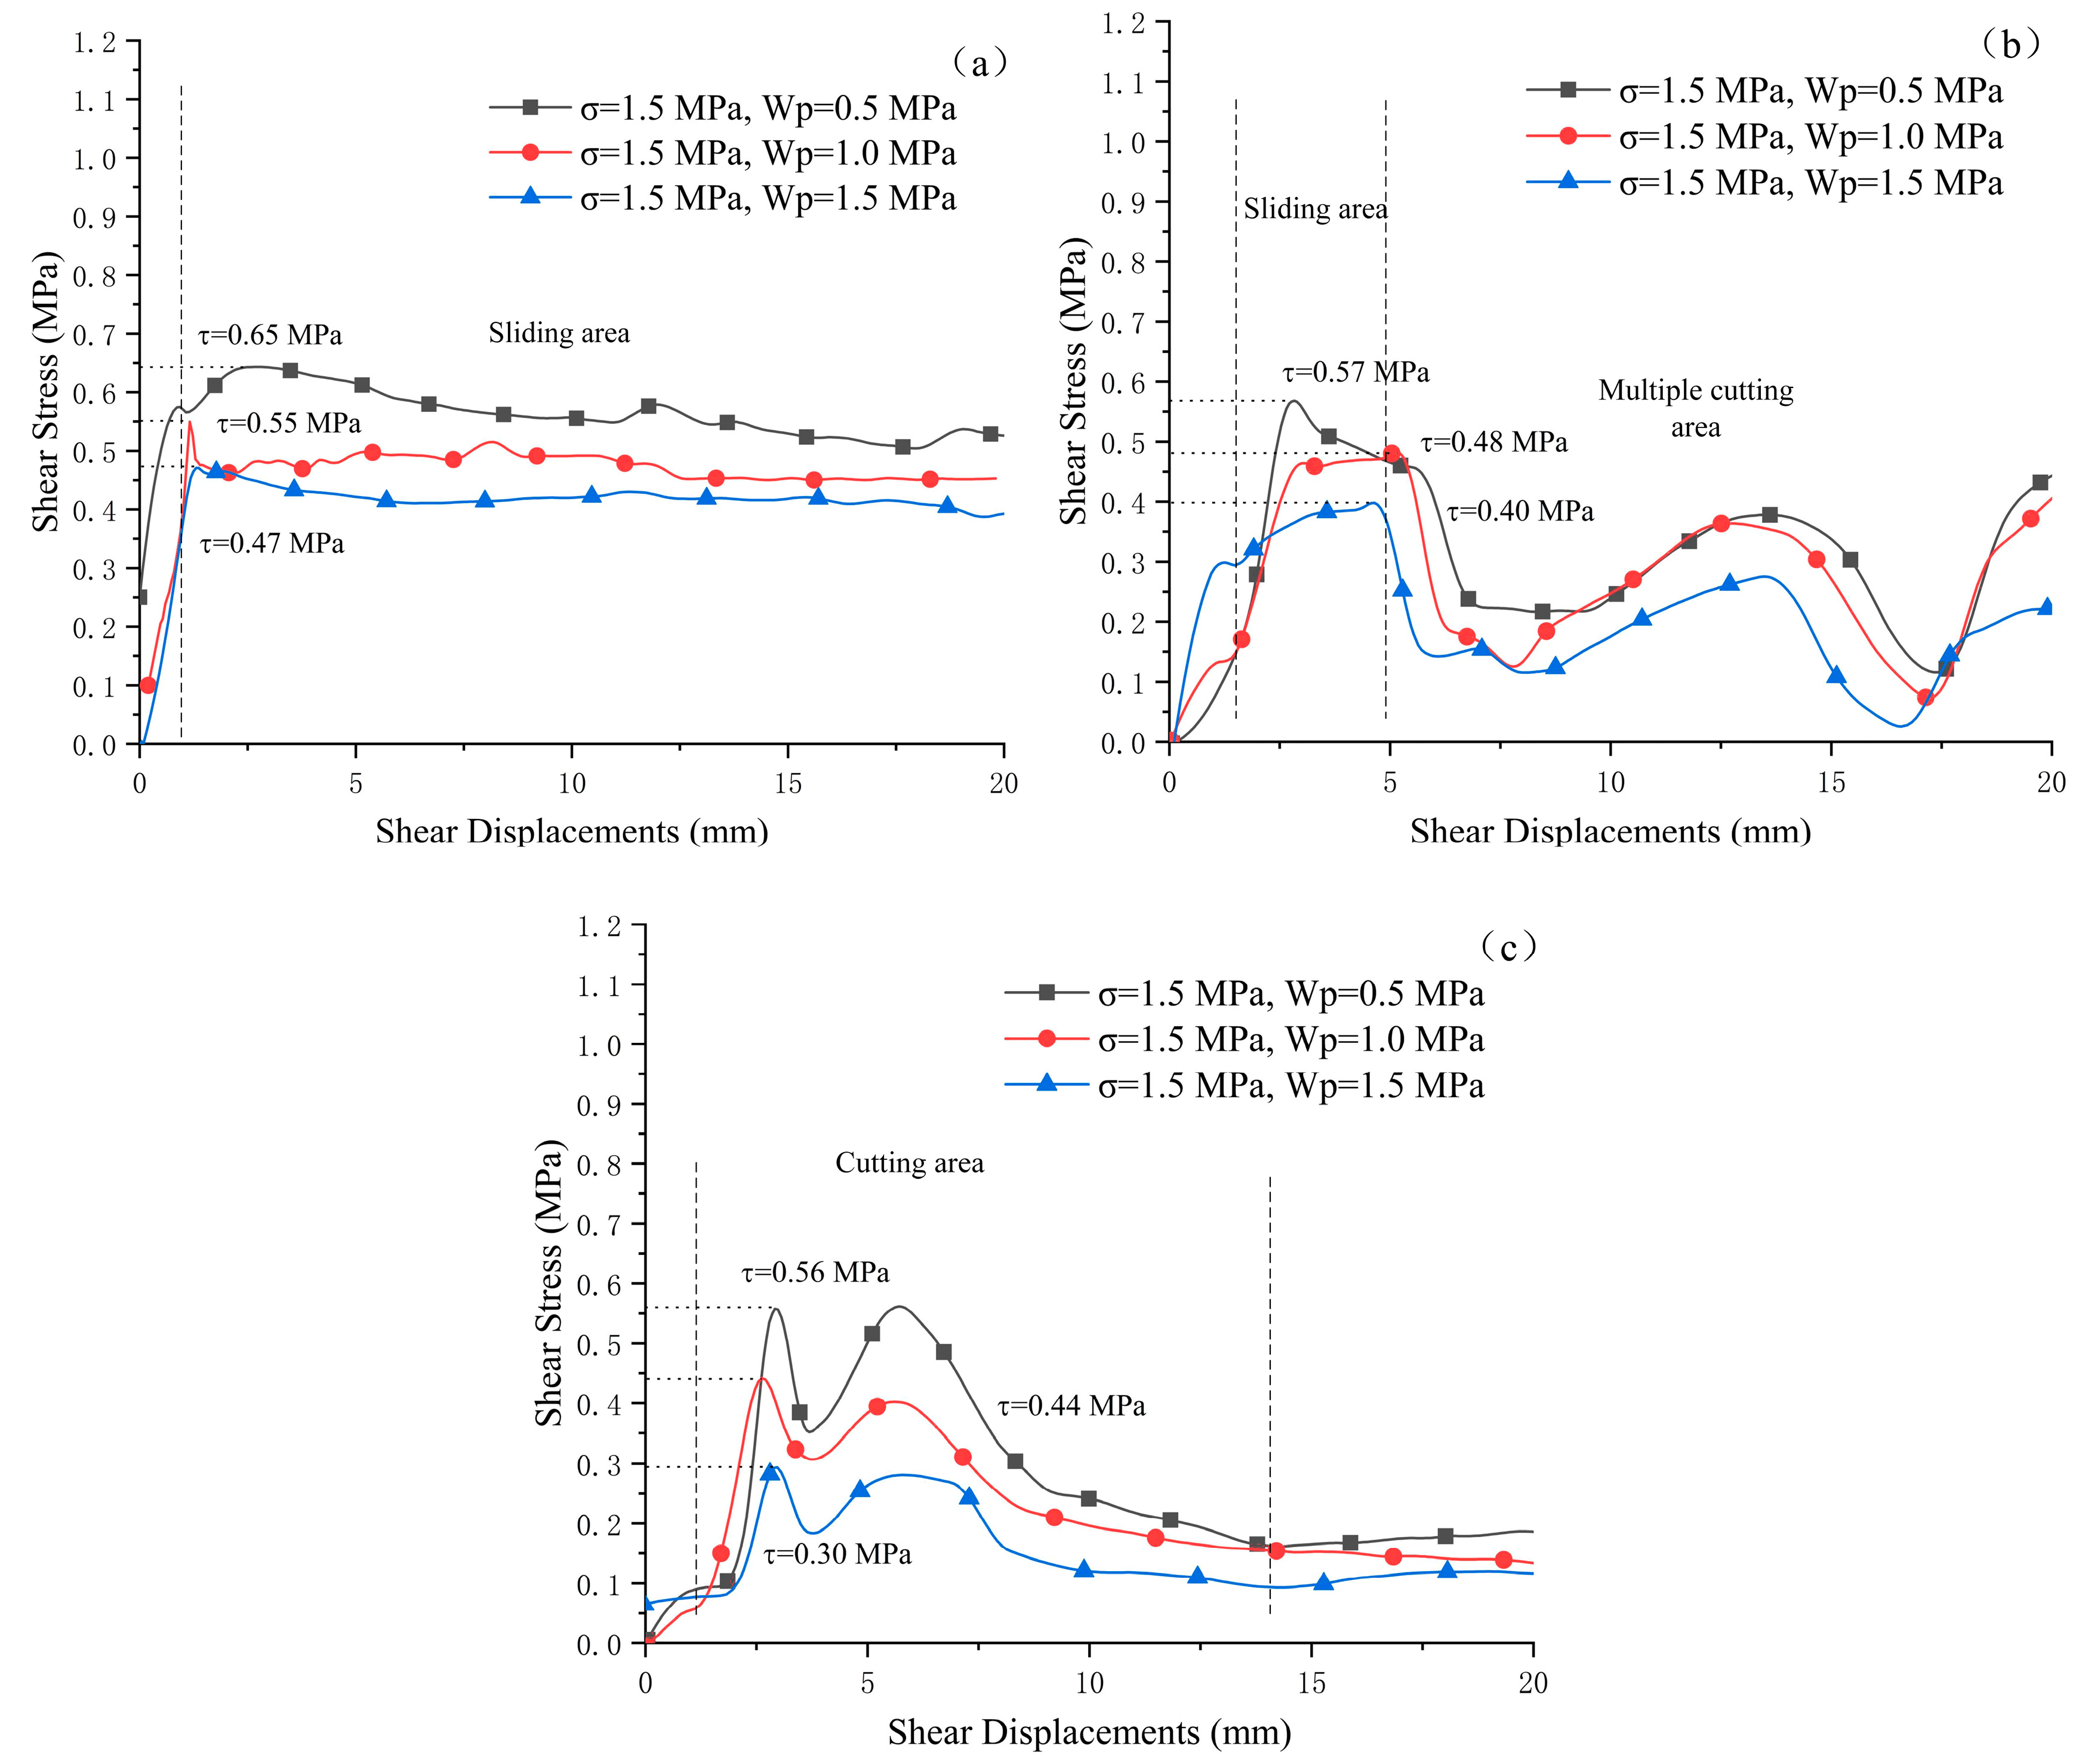
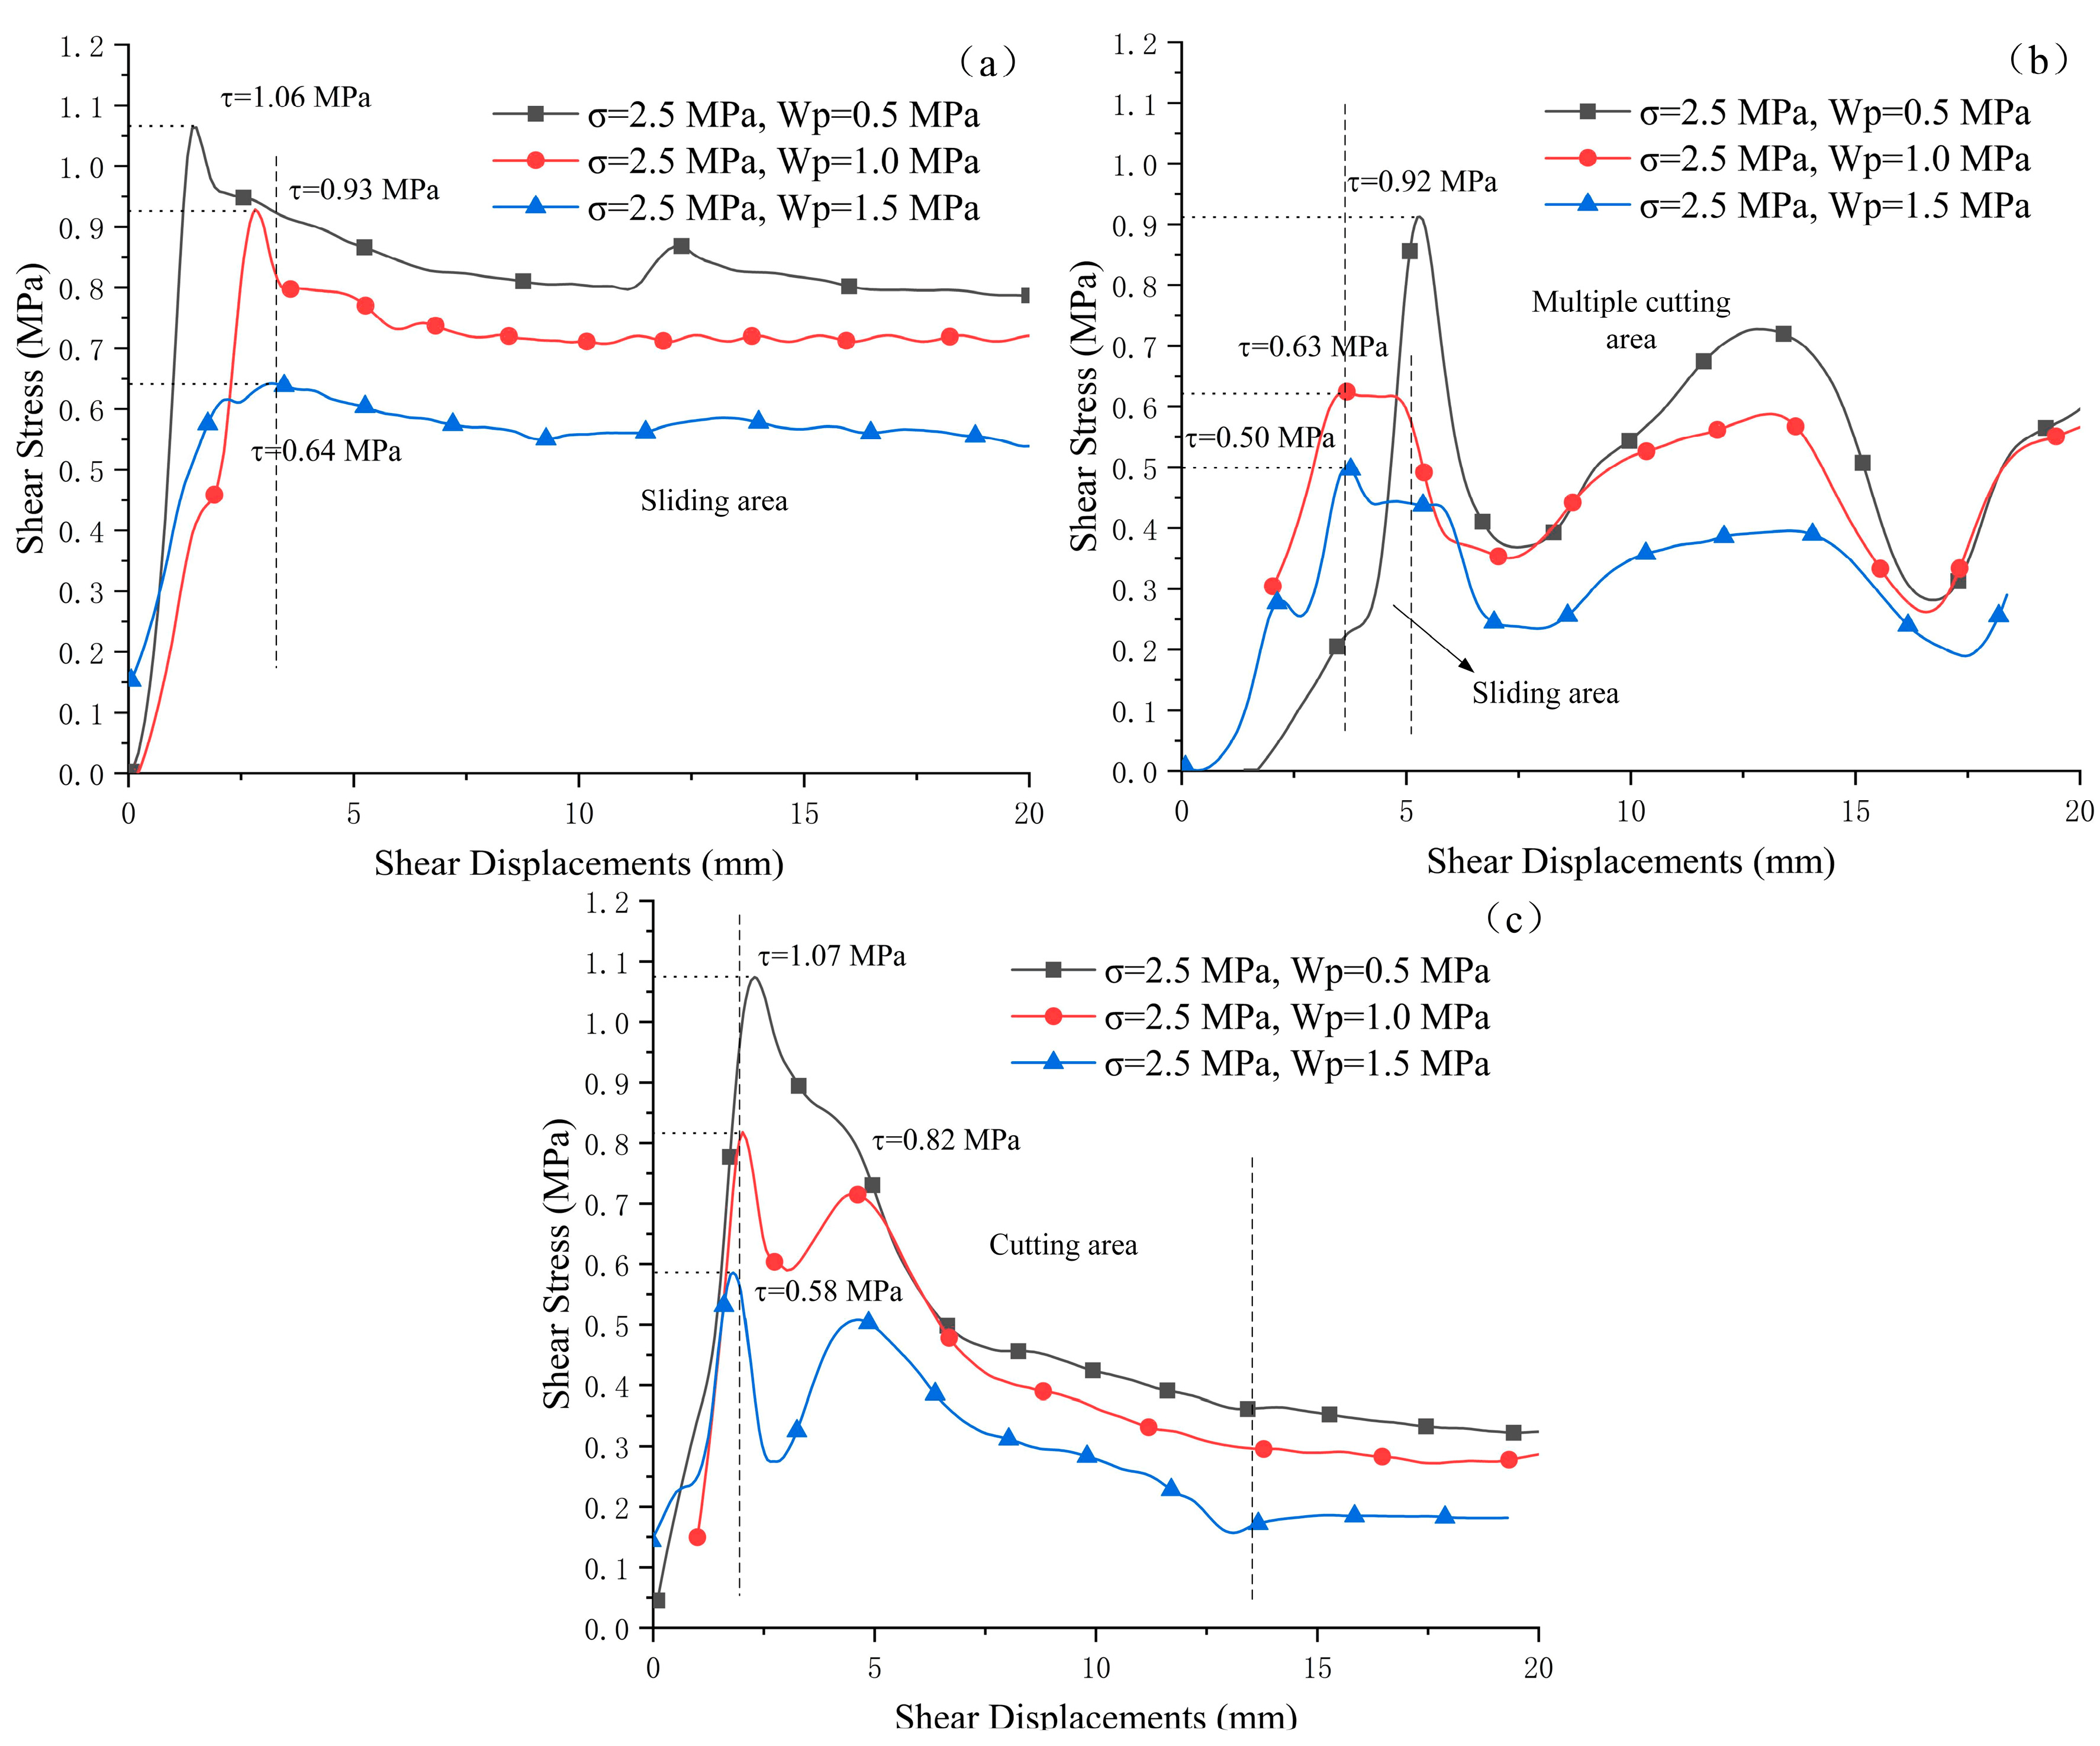
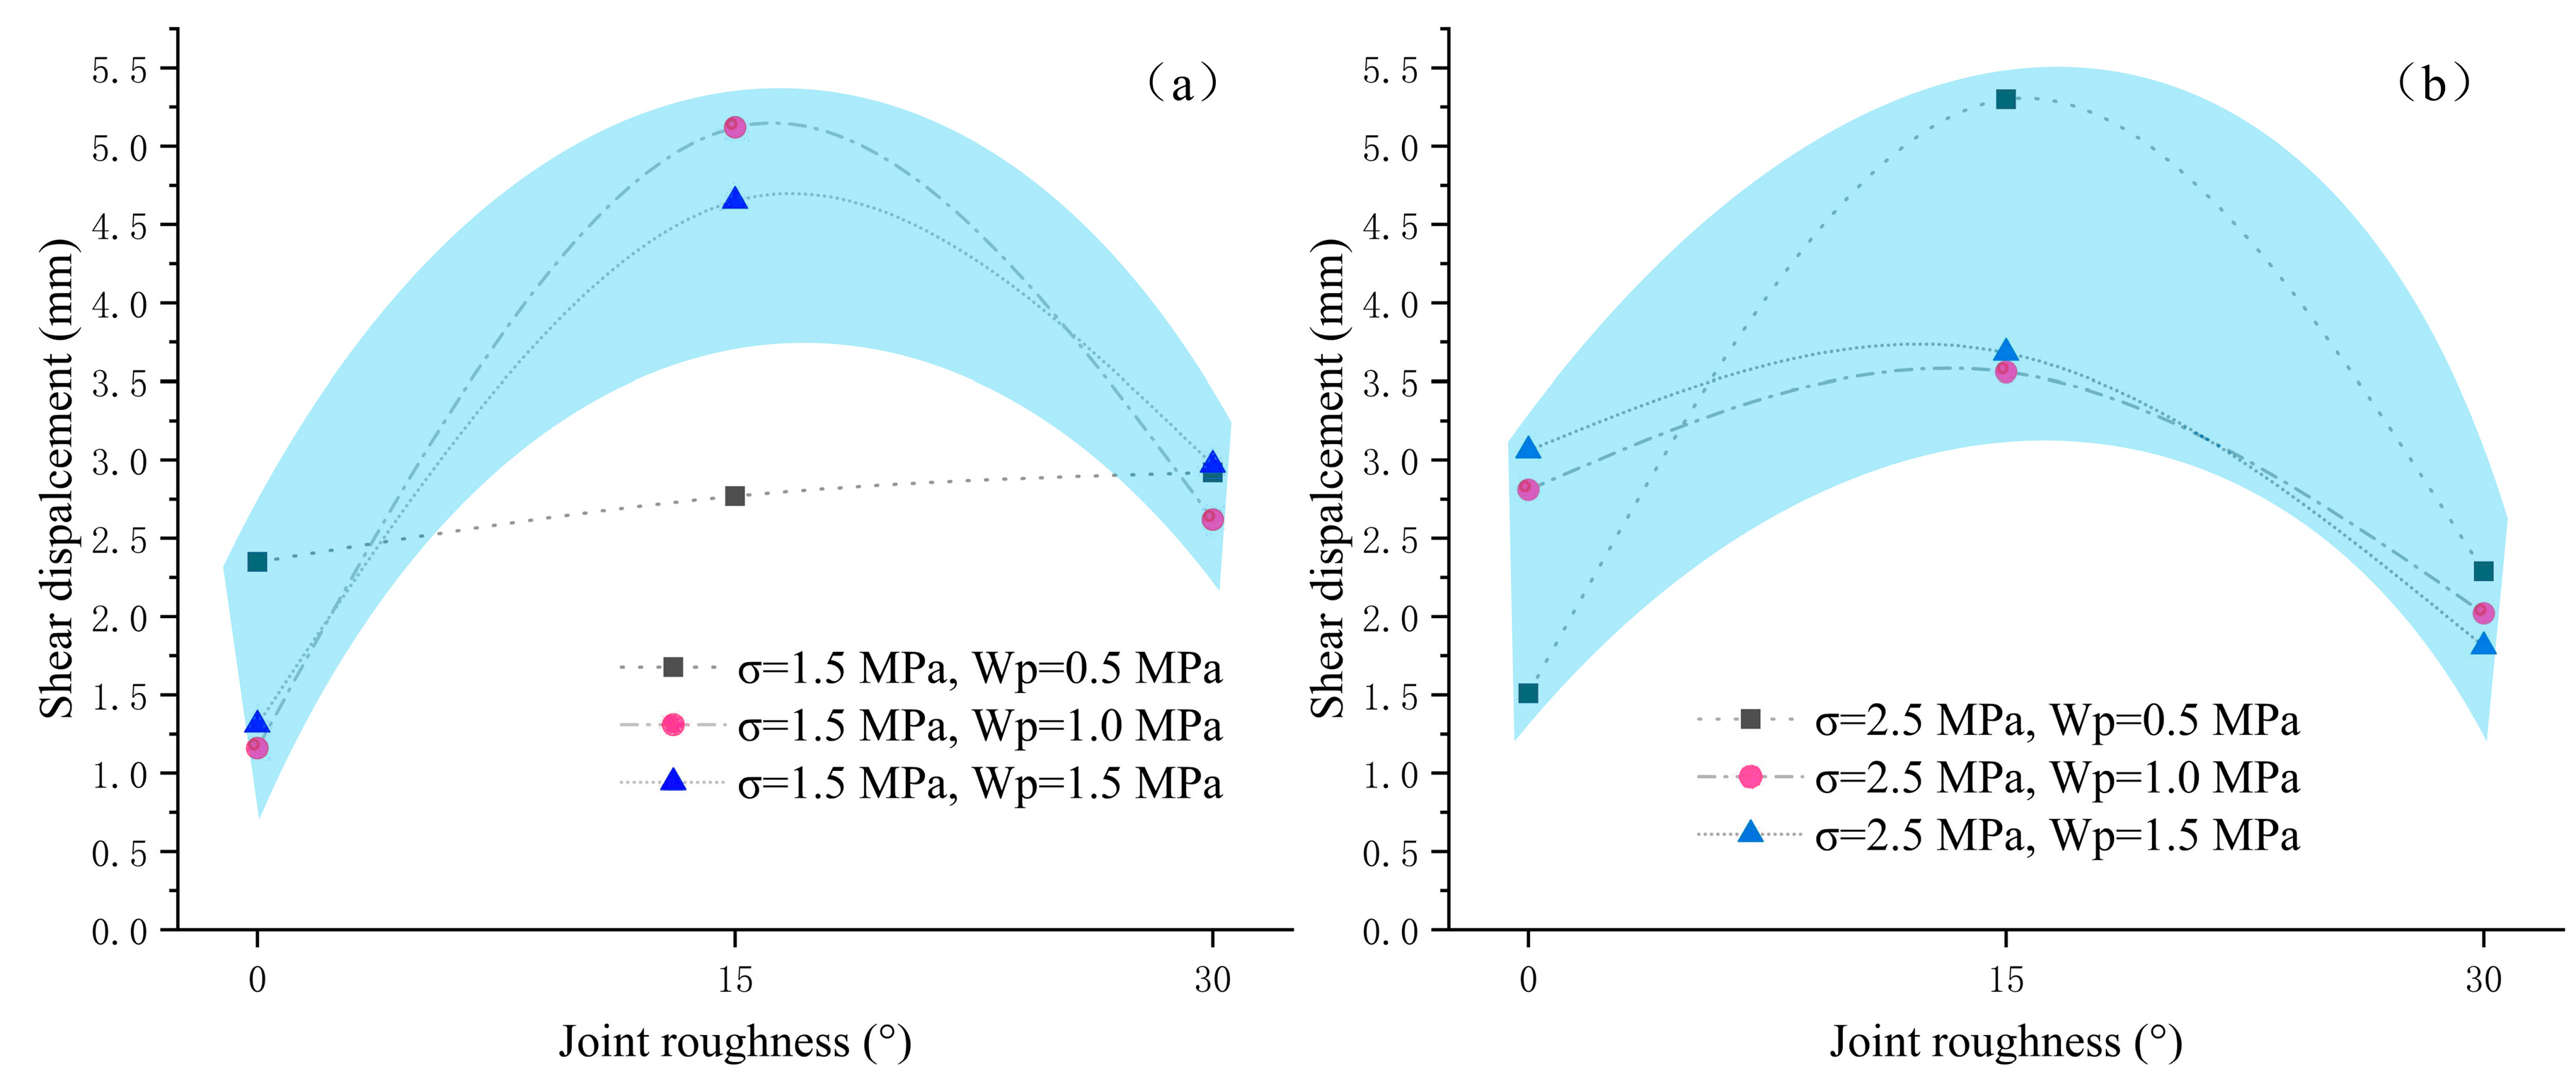
4.1. Shear Deformation Curves of Shear-Flow Coupled Tests

The shear-flow coupled tests were performed on joints samples under two levels of normal stress and three levels of seepage pressure. Figure 5 shows the shear deformation curves with different roughness under different seepage pressures when the normal stress is 1.5 MPa. The curves with the same roughness exhibit the similar pattern. In Figure 5a, under different seepage pressures, the shear stress stays stable after an initial increase, showing the typical characters of sliding failure mode. When the sawtooth angle is 15°, a short stage of sliding mode occurs before the cutting process in Figure 5b. However, the sliding process disappears with the increase of joint roughness, as shown in Figure 5c. After the dilatancy area, the shear stresses increase rapidly until the cutting failure when the sawtooth angle is 30°. Comparing with the results of the regular shear tests, it can be found that the seepage pressure does not have obvious effect on the shear failure mode when the normal stress is small.
Figure 6 gives the shear deformation curves of joint surfaces with different roughness values under different seepage pressures when normal stress is 2.5 MPa. The shear deformation curves with the same roughness show very similar characteristics. The exception appears after the dilatancy area when the joint sawtooth angle is 15°. When the seepage pressure is 0.5 MPa or 1.0 MPa, a small cutting area occurs after the dilatancy (Figure 6b); as the seepage pressure increases to 1.5 MPa, the failure mode changes from cutting to sliding mode at the first peak strength. However, the curves in Figure 6c do not display this feature. It seems that larger seepage pressure contributes to the occurrence of sliding failure when the normal stress is higher, while the increase of roughness is helpful for the occurrence of cutting failure. The impact of roughness exceeds the effect of seepage pressure in Figure 6c, so that cutting failure is prevailing, even with the high seepage pressure.
In summary, it can be found that the increase of seepage pressure results in the reduction of peak shear strength and residual shear strength, in Figure 5 and Figure 6. The shear failure mode changes from sliding to cutting type with the increase of joint roughness, while the increasing seepage pressure has an opposite effect when the normal stress is 2.5 MPa. Comparing Figure 5 with Figure 6, it can be summarized that the normal stress only contributes to the change of peak shear strength, and has no effect on the shear failure mode.
In shear-flow coupled tests, the displacements at the peak strength are extracted and plotted in Figure 7. Figure 7a shows the displacements corresponding to the peak shear strength under the normal stress of 1.5 MPa. When the seepage pressure is 0.5 MPa, it can be seen that the displacements corresponding to the peak shear strength are almost same for different joint roughness. However, for the larger seepage pressure of 1.0 MPa and 1.5 MPa, the peak shear strengthes with the roughness of 15° are obtained at the largest displacements. This phenomenon indicates that the sliding or cutting failure is less likely to happen with the sawtooth angle of 15° when the seepage pressure is large, while this influence of joint roughness can be neglected when the seepage pressure is small (0.5 MPa).
Figure 7b shows the displacement values corresponding to the peak shear stresses under the normal stress of 2.5 MPa. Like those in Figure 7a, the displacements corresponding to the peak stresses for the sawtooth angle of 15° are the largest, even including the one under the seepage pressure of 0.5 MPa. This may suggest that the increase of normal stress highlights the role of joint roughness. Further study is needed to explain why the angle of 15° is special in the shear-flow coupled tests.

4.2. Shear Strength of Shear-Flow Coupled Tests

The shear strength in the shear-flow coupled tests is generally controlled by the roughness, normal stress, and seepage pressure. The shear strength parameters with different roughness and seepage pressures are listed in Table 3. According to the results of regular shear tests, the friction angle increases as the roughness increase. However, in shear-flow coupled tests, the friction angle decreases rapidly with the increase of roughness and seepage pressure, as seen in Table 3.
It can be speculated that the reason for the decrease of shear strength caused by seepage pressure is that this pressure counteracts the effect of normal stress. Furthermore, the seepage process can apparently soften the plaster–plaster interface to damage the original sawtooth structure. This softening effect, which will enhance with the increase of seepage pressure, has been reported by previous studies [26,32]. The mutually reinforcing of offsetting and softening eventually ruins the structure of the joint surface, leading to the quick decrease of shear strength.
The photos of failed joint in the shear-flow coupled tests when normal stress is 2.5 MPa and joint roughness is 15° are selected to illustrate the failure morphology, as shown in Figure 8. It can be observed that when the seepage pressure is 0.5 MPa (Figure 8a), the joint surface with the traces of cutting shear is almost intact, while obvious characteristics of sliding shear can be found under larger seepage pressure in Figure 8b,c. In Figure 8c, some sludge regions can be clearly observed under seepage pressure of 1.5 MPa, which reflects the existence of the softening effect. An intact area in the center of each surface occurs because the contact region will become smaller as the shear test proceeds, due to the cylindrical shape of samples.

4.3. Analysis of Seepage Properties

In the shear-flow coupled field, the permeability of the joint samples can be represented by the value of hydraulic aperture, which can be calculated using the so-called cubic law [33], with the results obtained from the shear-flow coupled test. The cubic law is expressed as follows:
Q = g ν w e 3 12 i ,
where Q is the flow rate; g is the acceleration of gravity; e is the hydraulic aperture; ν is the dynamic viscosity coefficient; w is the width of the flow region; and i is the unit hydraulic gradient.
The hydraulic apertures of joint surfaces under following conditions are calculated: sawtooth angle of 15°/30°, seepage pressure of 1.0 MPa, and normal stress of 1.5/2.5 MPa. Figure 9 displays the hydraulic aperture curves under different normal stresses. It can be observed that these curves have four stages as the shear deformation increases: shear contraction, shear dilation, re-contraction, and stability. In the initial stage of shearing (Stage I), the shear displacement causes joint shrinkage, and the hydraulic aperture of the joint decreases. The reason for this phenomenon is that the joint surfaces are not completely meshed with cracks in the middle, and their initial hydraulic apertures are not zero. Immediately after the adding of normal load, the joint surface has a tendency of compression and closing. As the shearing progresses (Stage II), the dilations of the joint surfaces make the hydraulic aperture increase rapidly [34]. Due to the sliding and cutting damage during the shearing process of the 15° joint surfaces, their hydraulic apertures have some fluctuations with a second peak value in stage III (Figure 9a). However, the shearing of 30° joint surfaces are dominated by the cutting failure mode so that their hydraulic apertures decrease quickly as a result of the complete occlusal, even destruction of sawteeth in stage III. As the tests progress, the contact surfaces become smooth, and all the hydraulic apertures are almost no longer changed, reaching the residual hydraulic aperture (stage IV).
The comparison of experimental results in Figure 9 reflects the influence of the surface morphology on the mechanical aperture evolution. For a roughness of 15° (Figure 9a), a relatively larger void space will be generated between the surfaces after the partial shearing. This will result in smaller values of hydraulic apertures compared to those of 30°. In general, when the shear displacement increases to 6–8 mm, the hydraulic aperture of the joints reaches the maximum value due to the effect of dilatancy.
The increasing normal stress leads to the decrease of hydraulic aperture, which represents the decrease of permeability. This conclusion was demonstrated by many previous studies [11,15,35]. In our tests, the comparison between Figure 9a and Figure 9b illustrates that the permeability of joint sample is considerably enlarged by the increasing surface sawtooth angle. However, some previous studies proved that roughness increases would decrease the fracture transmissivity, thus resulting in greater resistance to flow, and finally, in lower conductivity of rough joints [22,36,37]. This discrepancy can be explained by the significant softening effect of the seepage process, which brings severe damage to the joint surfaces and makes the fracture transmissivity larger.

5. Conclusions

This study performed the regular shear tests and shear-flow coupled tests to comprehensively consider the effect of roughness, normal stress, and seepage pressure on the shear process of artificial joint rock samples. The major conclusions are as follows:
(1)
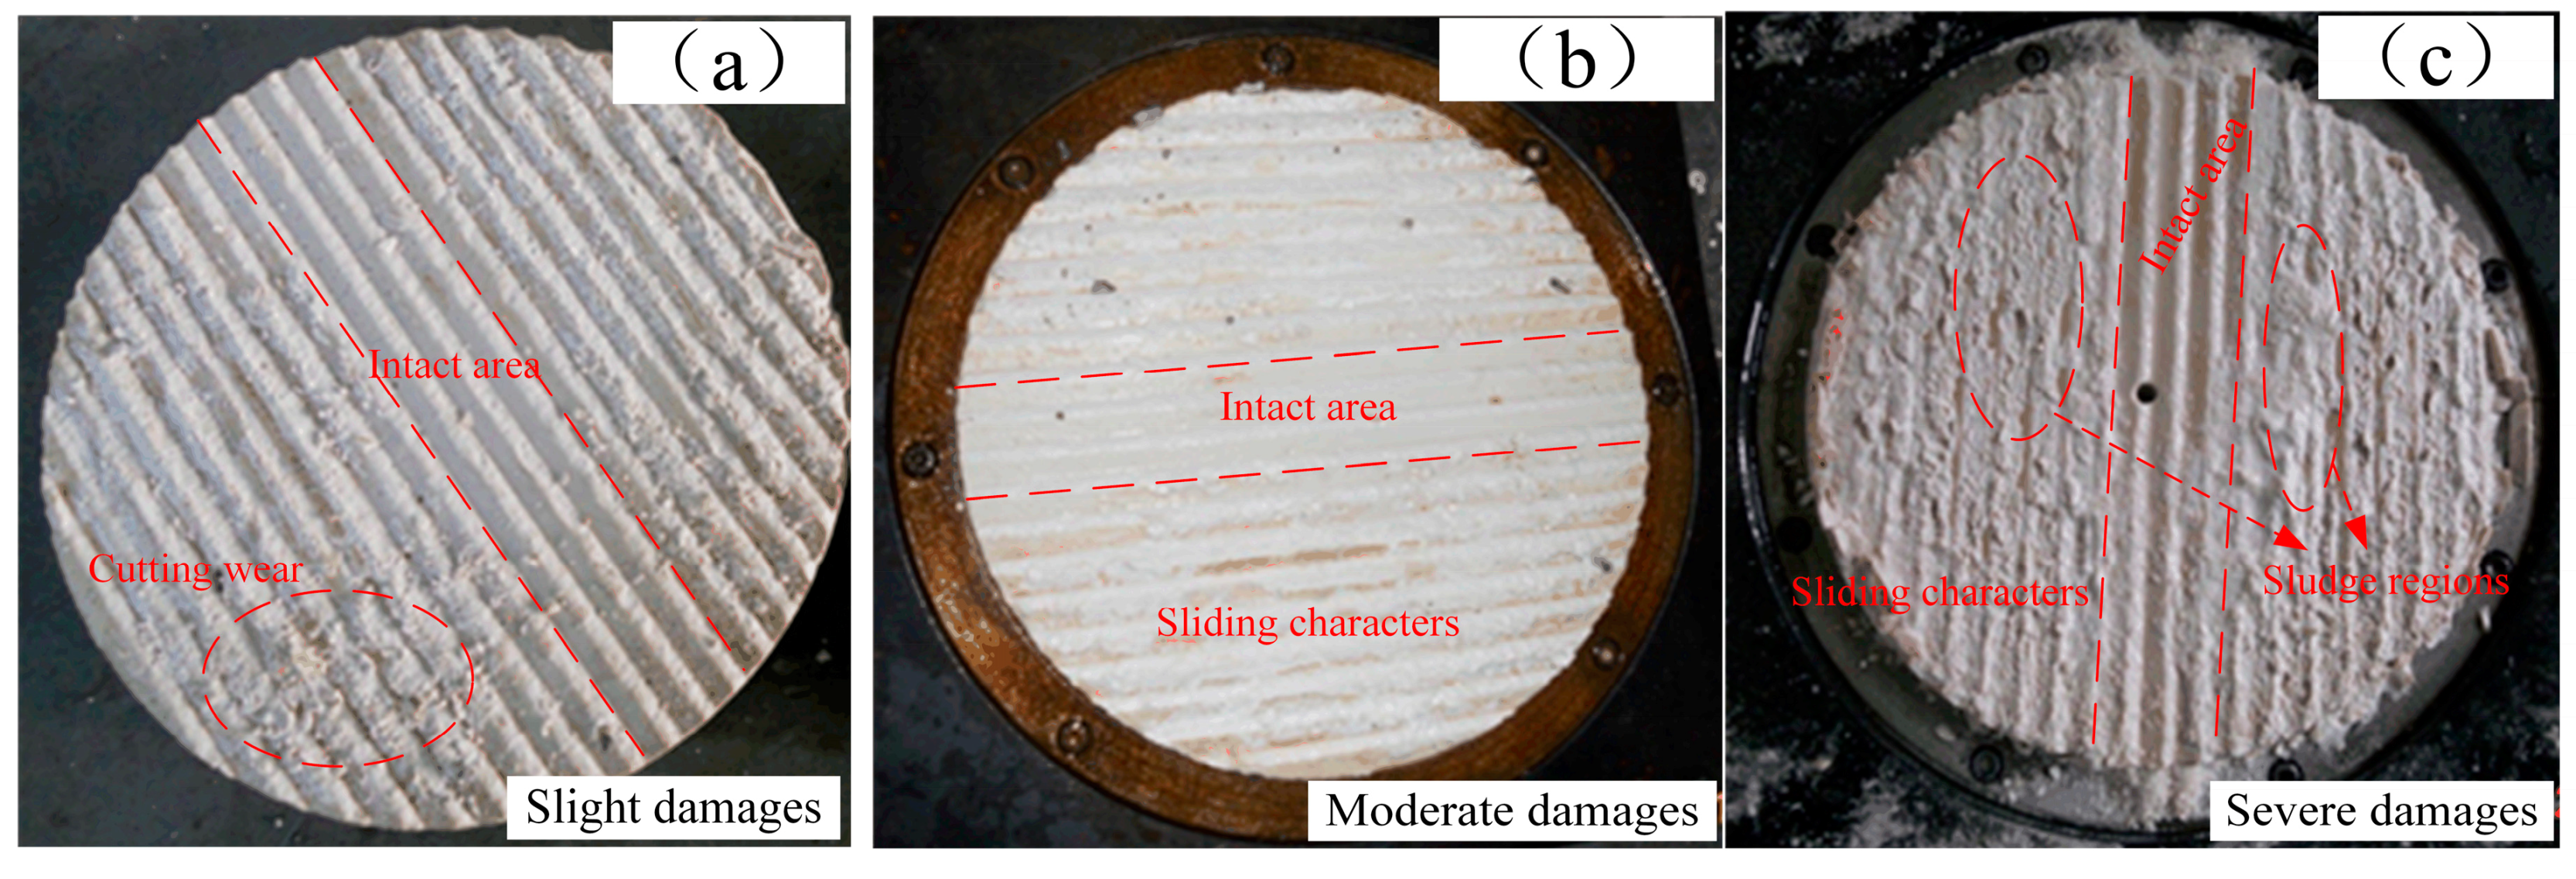
In a dry environment, the roughness of joint surface has a significant influence on the shear failure mode and strength. With the increase of the roughness, the failure mode of the joint changes from sliding failure to cutting failure, and the shear strength becomes larger. The normal stress has little influence on the failure mode of the joint surface when it is small, but has a notable effect when large. With the increase of normal stress, it is less likely that sliding failure would occur.
(2)
The seepage pressure has no obvious effect on the failure mode of the joint sample when the normal stress is 1.5 MPa. However, the failure mode under the normal stress of 2.5 MPa varies from cutting to sliding type as the seepage pressure increases. Under the normal stress of 2.5 MPa, the mode of macroscopic failure depends on the mutual competition between roughness and seepage pressure. The normal stress only contributes to the change of peak shear strength, and has no effect on the shear failure mode in the shear-flow coupled test.
(3)
The seepage process can clearly lower the shear strength of the joint sample. Moreover, this effect will be more significant as the pressure increases. The internal mechanism for this phenomenon is the mutual reinforcing of offsetting and softening effects.
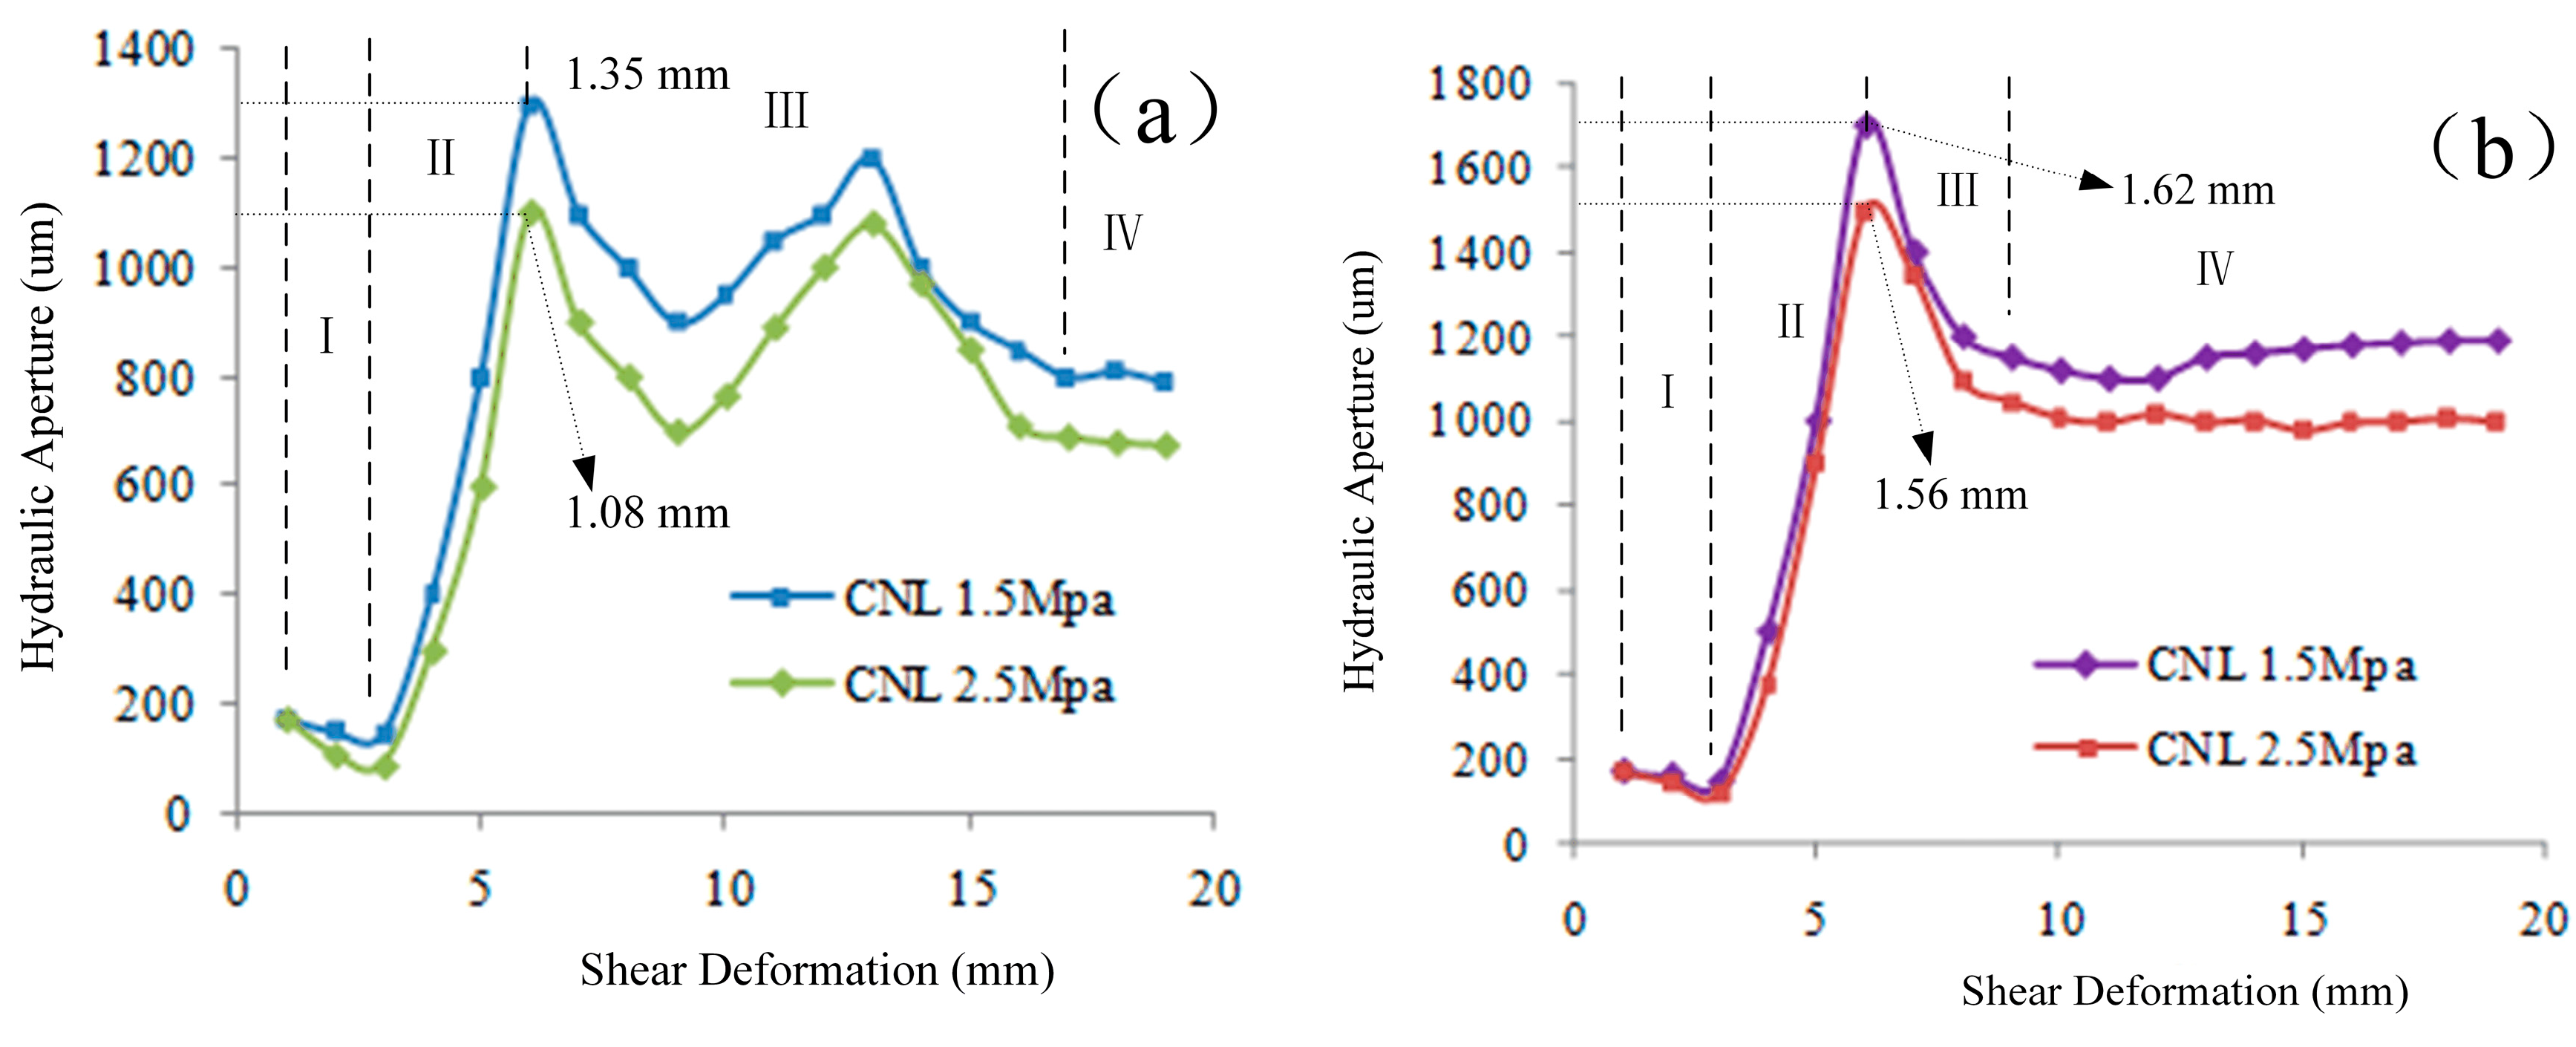
(4)
The evolution of hydraulic aperture during the shear-flow coupled test can be divided into four stages: shear contraction, shear dilation, re-contraction, and stability. The permeability of joint sample is considerably enlarging with the increasing surface sawtooth angle, but decreasing with the addition of normal stress.

Author Contributions

Conceptualization, C.Z. and Z.S.; Data curation, R.Z.; Formal analysis, R.Z.; Funding acquisition, C.Z., Q.Z. and S.Y.; Investigation, R.Z. and S.Y.; Methodology, Q.Z. and Z.S.; Project administration, Z.S.; Supervision, C.Z., Q.Z., Z.S. and S.Y.; Validation, C.Z.; Writing—original draft, R.Z.; Writing—review & editing, C.Z. and Q.Z.

Funding

This research was funded by (the National Key Research and Development Plan) grant number (2017YFC0806000), (the National Natural Science Foundation of China) grant number (41572262, 41502275, 41602287), and (Shanghai Rising-Star Program) grant number (17QC1400600).

Conflicts of Interest

The authors declare no conflict of interest. The funders had no role in the design of the study; in the collection, analyses, or interpretation of data; in the writing of the manuscript, and in the decision to publish the results.

References

  1. Niktabar, S.M.M.; Rao, K.S.; Shrivastava, A.K. Effect of rock joint roughness on its cyclic shear behavior. J. Rock Mech. Geotech. Eng. 2017, 9, 1071–1084. [Google Scholar] [CrossRef]
  2. Barton, N.; Bandis, S.; Bakhtar, K. Strength, deformation and conductivity coupling of rock joints. Int. J. Rock Mech. Min. Sci. Geomech. Abstr. 1985, 22, 121–140. [Google Scholar] [CrossRef]
  3. Chappell, B.A. Rock bolts and shear stiffness in jointed rock masses. J. Geotech. Eng. ASCE 1989, 115, 179–197. [Google Scholar] [CrossRef]
  4. Rutqvist, J.; Stephansson, O. The role of hydromechanical coupling in fractured rock engineering. Hydrogeol. J. 2003, 11, 7–40. [Google Scholar] [CrossRef] [Green Version]
  5. Gangi, A.F. Variation of whole and fractured porous rock permeability with confining pressure. Int. J. Rock Mech. Min. Sci. Geomech. Abstr. 1978, 15, 249–257. [Google Scholar] [CrossRef]
  6. Tsang, Y.W.; Tsang, C.F. Channel model of flow through fractured media. Water Resour. Res. 1987, 23, 467–479. [Google Scholar] [CrossRef] [Green Version]
  7. Xiao, W.M.; Xia, C.C.; Deng, R.G. Advances in development of coupled stress-flow test system for rock joins. Chin. J. Rock Mech. Eng. 2014, 33, 3456–3465. [Google Scholar]
  8. Iwai, K. Fundamental Studies of the Fluid Flow through a Single Fracture. Ph.D. Thesis, University of California, Berkeley, CA, USA, 1976. [Google Scholar]
  9. Raven, K.G.; Gale, J.E. Water flow in a natural rock fracture as a function of stress and sample size. Int. J. Rock Mech. Min. Sci. Geomech. Abstr. 1985, 22, 251–261. [Google Scholar] [CrossRef]
  10. Durham, W.B.; Bonner, B.P. Self-propping and fluid flow in slightly offset joints at high effective pressures. J. Geophys. Res. Solid Earth 1994, 99, 9391–9399. [Google Scholar] [CrossRef]
  11. Singh, A.B. Study of rock fracture by permeability method. J. Geotech. Geoenviron. Eng. 1997, 123, 601–608. [Google Scholar] [CrossRef]
  12. Archambault, G.; Poirier, S.; Rouleau, A.; Gentier, S.; Riss, J. The behavior of induced pore fluid pressure in undrained triaxial shear tests on fractured porous analog rock material specimens. In Mechanics of Jointed and Faulted Rock; CRC Press: Boca Raton, FL, USA, 1998; pp. 555–560. [Google Scholar]
  13. Indraratna, B.; Jayanathan, M. Measurement of pore water pressure of clay-infilled rock joints during triaxial shearing. Geotechnique 2005, 55, 759–764. [Google Scholar] [CrossRef] [Green Version]
  14. Chen, Z.; Narayan, S.P.; Yang, Z.; Rahman, S.S. An experimental investigation of hydraulic behaviour of fractures and joints in granitic rock. Int. J. Rock Mech. Min. Sci. 2000, 37, 1061–1071. [Google Scholar] [CrossRef]
  15. Liu, C.H.; Chen, C.X.; Jaksa, M.B. Seepage properties of a single rock fracture subjected to triaxial stresses. Prog. Nat. Sci. 2007, 17, 1482–1486. [Google Scholar]
  16. Crawford, A.M.; Curran, J.H. The influence of rate- and displacement-dependent shear resistance on the response of rock slopes to seismic loads. Int. J. Rock Mech. Min. Sci. Geomech. Abstr. 1982, 19, 1–8. [Google Scholar] [CrossRef]
  17. Barbero, M.; Barla, G.; Zaninetti, A. Dynamic shear strength of rock joints subjected to impulse loading. Int. J. Rock Mech. Min. Sci. Geomech. Abstr. 1996, 33, 141–151. [Google Scholar] [CrossRef]
  18. Jafari, M.K.; Pellet, F.; Boulon, M.; Hosseini, K.A. Experimental study of mechanical behaviour of rock joints under cyclic loading. Rock Mech. Rock Eng. 2004, 37, 3–23. [Google Scholar] [CrossRef]
  19. Atapour, H.; Moosavi, M. The influence of shearing velocity on shear behavior of artificial joints. Rock Mech. Rock Eng. 2014, 47, 1745–1761. [Google Scholar] [CrossRef]
  20. Niktabar, S.M.M.; Rao, K.S.; Shrivastava, A.K. Automatic static and cyclic shear testing machine under constant normal stiffness boundary conditions. Geotech. Test. J. 2018, 41, 508–525. [Google Scholar] [CrossRef]
  21. Li, B.; Jiang, Y.J. Experimental study and numerical analysis of shear and flow behaviors of rock with single joint. Chin. J. Rock Mech. Eng. 2008, 27, 2431–2439. [Google Scholar]
  22. Li, B.; Jiang, Y.J.; Koyama, T.; Jing, L.R.; Tanabashi, Y. Experimental study of the hydro-mechanical behavior of rock joints using a parallel-plate model containing contact areas and artificial fractures. Int. J. Rock Mech. Min. Sci. 2008, 45, 362–375. [Google Scholar] [CrossRef] [Green Version]
  23. Jiang, Y.J.; Wang, G.; Li, B.; Zhao, X.D. Experimental study and analysis of shear-flow coupling behaviors of rock joints. Chin. J. Rock Mech. Eng. 2007, 26, 2253–2259. [Google Scholar]
  24. Jiang, Y.J.; Li, B.; Tanabashi, Y. Estimating the relation between surface roughness and mechanical properties of rock joints. Int. J. Rock Mech. Min. Sci. 2006, 43, 837–846. [Google Scholar] [CrossRef]
  25. Olsson, R.; Barton, N. An improved model for hydromechanical coupling during shearing of rock joints. Int. J. Rock Mech. Min. Sci. 2001, 38, 317–329. [Google Scholar] [CrossRef]
  26. Shi, Z.M.; Shen, D.Y.; Zhang, Q.Z.; Peng, M.; Li, Q.D. Experimental study on the coupled shear flow behavior of jointed rock samples. Eur. J. Environ. Civ. Eng. 2017, 1–18. [Google Scholar] [CrossRef]
  27. Xia, C.C.; Wang, W.; Wang, X.R. Development of coupling shear-seepage test system for rock joints. Chin. J. Rock Mech. Eng. 2008, 27, 1285–1291. [Google Scholar]
  28. Zhang, Q.Z.; Shen, M.R.; Ding, W.Q.; Clark, C. Shearing creep properties of cements with different irregularities on two surfaces. J. Geophys. Eng. 2012, 9, 210–217. [Google Scholar] [CrossRef]
  29. Wang, G.; Zhang, Y.Z.; Jiang, Y.J.; Liu, P.X.; Guo, Y.S.; Liu, J.K.; Ma, M.; Wang, K.; Wang, S.G. Shear behaviour and acoustic emission characteristics of bolted rock joints with different roughnesses. Rock Mech. Rock Eng. 2018, 51, 1885–1906. [Google Scholar] [CrossRef]
  30. Dove, J.E.; Frost, J.D. A method for measuring geomembrane surface roughness. Geosynth. Int. 1996, 3, 369–392. [Google Scholar] [CrossRef]
  31. Wang, W.B.; Scholz, C.H. Micromechanics of the velocity and normal stress dependence of rock friction. Pure Appl. Geophys. 1994, 143, 303–315. [Google Scholar] [CrossRef]
  32. Su, H.J. Seepage Evolution Mechanism of Deep Buried Jointed Rock Mass and Its Engineering Application. Ph.D. Thesis, China University of Mining & Technology, Xu Zhou, China, 2015. [Google Scholar]
  33. Witherspoon, P.A.; Wang, J.S.Y.; Iwai, K.; Gale, J.E. Validity of cubic law for fluid-flow in a deformable rock fracture. Water Resour. Res. 1980, 16, 1016–1024. [Google Scholar] [CrossRef]
  34. Tang, Z.C.; Xia, C.C.; Xiao, S.G. Constitutive model for joint shear stress-displacement and analysis of dilation. Chin. J. Rock Mech. Eng. 2011, 30, 917–925. [Google Scholar]
  35. Lee, D.; Juang, C.H. Use of permeability as an index to characterize internal structural changes and fracture mechanism. Geotech. Test. J. 1988, 11, 63–67. [Google Scholar] [CrossRef]
  36. Oron, A.P.; Berkowitz, B. Flow in rock fractures: The local cubic law assumption reexamined. Water Resour. Res. 1998, 34, 2811–2825. [Google Scholar] [CrossRef] [Green Version]
  37. Dimadis, G.; Dimadi, A.; Bacasis, I. Influence of fracture roughness on aperture fracture surface and in fluid flow on coarse-grained marble, experimental results. J. Geosci. Environ. Prot. 2014, 2, 59–67. [Google Scholar] [CrossRef]
Figure 1. Structure diagram of shear-flow coupled test system.
Processes 06 00152 g001
Figure 2. Molds for sample preparation.
Processes 06 00152 g002
Figure 3. Diagram of artificial joint samples: (a) joint roughness is 0°; (b) joint roughness is 15°; (c) joint roughness is 30° (unit: mm).
Processes 06 00152 g003
Figure 4. Shear deformation curves of joint surfaces with different roughness under different normal stresses: (a) joint roughness is 0°; (b) joint roughness is 15°; (c) joint roughness is 30°.
Processes 06 00152 g004aProcesses 06 00152 g004b
Figure 5. Shear deformation curves of joint surfaces under different seepage pressures when normal stress is 1.5 MPa: (a) joint roughness is 0°; (b) joint roughness is 15°; (c) joint roughness is 30°.
Processes 06 00152 g005
Figure 6. Shear deformation curves of joint surfaces under different seepage pressures when normal stress is 2.5 MPa: (a) joint roughness is 0°; (b) joint roughness is 15°; (c) joint roughness is 30°.
Processes 06 00152 g006
Figure 7. Displacements corresponding to the peak shear stresses under different seepage pressures: (a) normal stress is 1.5 MPa; (b) normal stress is 2.5 MPa.
Processes 06 00152 g007
Figure 8. Photos of joint surface after the shear-flow coupled tests when normal stress is 2.5 MPa and joint roughness is 15°: (a) Wp = 0.5 MPa; (b) Wp = 1.0 MPa; (c) Wp = 1.5 MPa.
Processes 06 00152 g008
Figure 9. Hydraulic aperture curves under different normal stresses when seepage pressure is 1.0 MPa: (a) joint roughness is 15°; (b) joint roughness is 30°.
Processes 06 00152 g009
Table 1. Shear strength parameters of intact cylindrical specimens.
Normal Stress (MPa)1.52.53.54.5C = 1.62 MPa
ϕ0 = 32°
Shear Strength (MPa)2.232.633.033.44
Table 2. Shear strength parameters of joint samples with different roughness.
RoughnessNormal Stress (MPa)Shear Strength (MPa)Cohesion (MPa)Friction Angle (°)
1.50.770.3017.22
2.51.08
15°1.50.800.0830.54
2.51.39
30°1.50.930.0733.82
2.51.60
Table 3. Shear strength parameters of joint samples with different roughness and seepage pressures.
RoughnessSeepage Pressure (MPa)Shear Stress (MPa)Cohesion (MPa)Friction Angle (°)
σ = 1.5 MPaσ = 2.5 MPa
0.50.651.060.0322.29
1.00.550.930.0220.81
1.50.470.640.219.65
15°0.50.570.920.0419.29
1.00.480.630.258.53
1.50.400.500.255.71
30°0.50.561.070.2027.02
1.00.440.820.1320.80
1.50.300.580.1215.64

