Article

Systematic and Model-Assisted Process Design for the Extraction and Purification of Artemisinin from Artemisia annua L.—Part III: Chromatographic Purification

Institute for Separation and Process Technology, Clausthal University of Technology, 38678 Clausthal-Zellerfeld, Germany
*
Author to whom correspondence should be addressed.
Processes 2018, 6(10), 180; https://doi.org/10.3390/pr6100180
Submission received: 18 July 2018 / Revised: 16 August 2018 / Accepted: 26 September 2018 / Published: 2 October 2018

Abstract

:
In this study, the purification of an extract from Artemisia annua L. using chromatographic methods is studied. In a first step, a screening of different phases and solvents using thin-layer chromatography (TLC) was performed. Then, a laboratory-scale high performance liquid chromatography (HPLC) method was developed and transferred to a pilot scale. A reproducibility study based on 120 injections was carried out. The batch process that was developed and the results from a designed continuous simulated moving bed (SMB) chromatography were compared based on characteristic process numbers and economy.

1. Introduction

The demand for naturally derived pharmaceuticals continues to grow [1,2]. Pharmaceuticals, in contrast to food supplements and natural plant protection agents from plant extracts, must be purified. One example is the anti-malaria agent artemisinin, which is extracted from Artemisia annua L. This agent is administered as a pure substance. Therefore, the plant extract must be purified to pharmaceutical grade. Previous studies have shown that the substance could be extracted by solid–liquid extraction (SLE) using percolation or pressurized hot water extraction (PHWE) [3]. Typically, the purification is performed by liquid–liquid extraction (LLE) (see Part II) chromatography and a final crystallization (see Part IV) [3,4,5,6,7,8,9,10,11,12].
The entire study examines the production of artemisinin from plant extract to pilot scale and is divided into five parts:
Part 0:
Sixt, M.; Strube, J. Systematic and model-assisted evaluation of solvent based- or pressurized hot water extraction for the extraction of Artemisinin from Artemisia annua L. Processes 2017, 5, 86, doi:10.3390/pr5040086 [3].
Part I:
Sixt, Schmidt et al. Systematic and model-assisted process design for the extraction and purification of Artemisinin from Artemisia annua L.—Part I: Conceptual process design and cost estimation. Processes 2018, 6, 161, doi:10.3390/pr6090161 [10].
Part II:
Schmidt, Sixt et al. Systematic and model-assisted process design for the extraction and purification of Artemisinin from Artemisia annua L.—Part II: Model-based design of agitated and packed columns for multistage extraction and scrubbing. Processes 2018, 6, 179, doi:10.3390/pr6100179 [11].
Part III:
Mestmäcker, Schmidt et al. Systematic and model-assisted process design for the extraction and purification of Artemisinin from Artemisia annua L.—Part III: Chromatographic Purification (this article).
Part IV:
Huter, Schmidt et al. Systematic and model-assisted process design for the extraction and purification of Artemisinin from Artemisia annua L.—Part IV: Crystallization. Processes 2018, 6, 181, doi:10.3390/pr6100181 [12].
The schematic production process for artemisinin is shown in Figure 1.
A description of the process shown above is given in (Part I).
The structure of artemisinin is depicted in Figure 2, whereas a detailed description of the target component is given in (Part I).
The purification of the annual mugwort extract after the capture step using LLE is shown in this study. A phase screening using thin-layer chromatography (TLC) was carried out. The most promising adsorbent-eluent combinations were transferred to a laboratory-scale column chromatography. After the selection of a suitable resin–eluent combination, experiments in pilot scale were conducted.
Figure 3 shows the general approach to TLC. The sample and the reference substance were applied to the bottom of the plate. There are two characteristic factors to characterize the TLC chromatogram. The first is the retention factor Rf, which is the ratio from the substance S over the eluent front E. The second factor is the retention factor for a reference substance Rst. Both factors can be calculated with Equations (1) and (2). Suitable Rf factors are approximately 0.3, but the more realistic retention factor for the estimation of the retention is the Rst value [13,14].
R f = M i g r a t i o n   d i s t a n c e : s u b s t a n c e M i g r a t i o n   d i s t a n c e : s o l v e n t   f r o n t = S E
R s t = M i g r a t i o n   d i s t a n c e : s u b s t a n c e M i g r a t i o n   d i s t a n c e : r e f e r e n c e = S R
In the second screening experiment, the possible eluent compositions were transferred to high performance liquid chromatography (HPLC) columns. To characterize the separation, the capacity factor was investigated (Equation (3)).
k i = t R , i t 0 t 0
The purification studies of artemisinin found in the literature can be split into two different fields of interest. The first is the separation of artemisinin from reaction mixtures. In this case, the reaction mixture can be separated (purified) by a simulated moving bed chromatography (SMB) [15,16]. The second field is the purification of the plant extract from Artemisia annua L. Based on this extract, different chromatographic purification strategies are available. One is the purification of the extract using a solid-liquid extraction (SLE). Most of the studies perform a chromatographic purification followed by a crystallization step [17,18,19,20]. Moreover, the pre-purification using crystallization followed by a final chromatographic step is possible [21,22].
For this study, the feasibility of plant extract purification using SMB processes should also be investigated. For this work, the classical 4-zone SMB process was chosen. For this process design, the volumetric flow ratios mi in the four zones were used [23,24,25,26,27,28].
m i = V j ˙ · t T ε · V c o l u m n V c o l u m n · ( 1 ε ) ( j = 1 , , 4 )
For the SMB design, the triangle diagram approach was used (see [29]).
In addition, because of the variety of components, a SMB process without eluent regeneration was investigated. In that SMB, only three zones were used and the entire recycle stream was collected in the raffinate stream. The schematic 4-zone and 3-zone SMB processes are shown in Figure 4.

2. Materials and Methods

2.1. Chemicals

Acetonitrile, n-heptane, isopropyl alcohol (IPA) in analytical grade (VWR®, Darmstadt, Germany), and water (Sartorius® arium® pro, Göttingen, Germany) were used as eluents. The experiments with buffer were carried out in 20 mM NaPi Buffer at pH 7.0. For the experiments in the preparative scale, technical grade ethyl acetate and n-hexane (VWR®, Darmstadt, Germany) were used. All other eluents and salts were obtained from Merck KGaA (Darmstadt, Germany) in analytical grade.
Artemisinin standard substance was ordered from CfM Oskar Tropitzsch (Marktredwitz, Germany). For the detection of the artemisinin on the TLC plates, a vanillin-phosphoric acid reagent was used, which consisted of 1 g vanillin (Alfa Aesar, Karlsruhe, Germany), 25 mL ethanol (Merck KGaA, Darmstadt, Germany), 25 mL water (Sartorius® arium® pro, Göttingen, Germany), and 35 mL phosphoric acid (Merck KGaA, Darmstadt, Germany).

2.2. Feed Material for Chromatographic Measurements
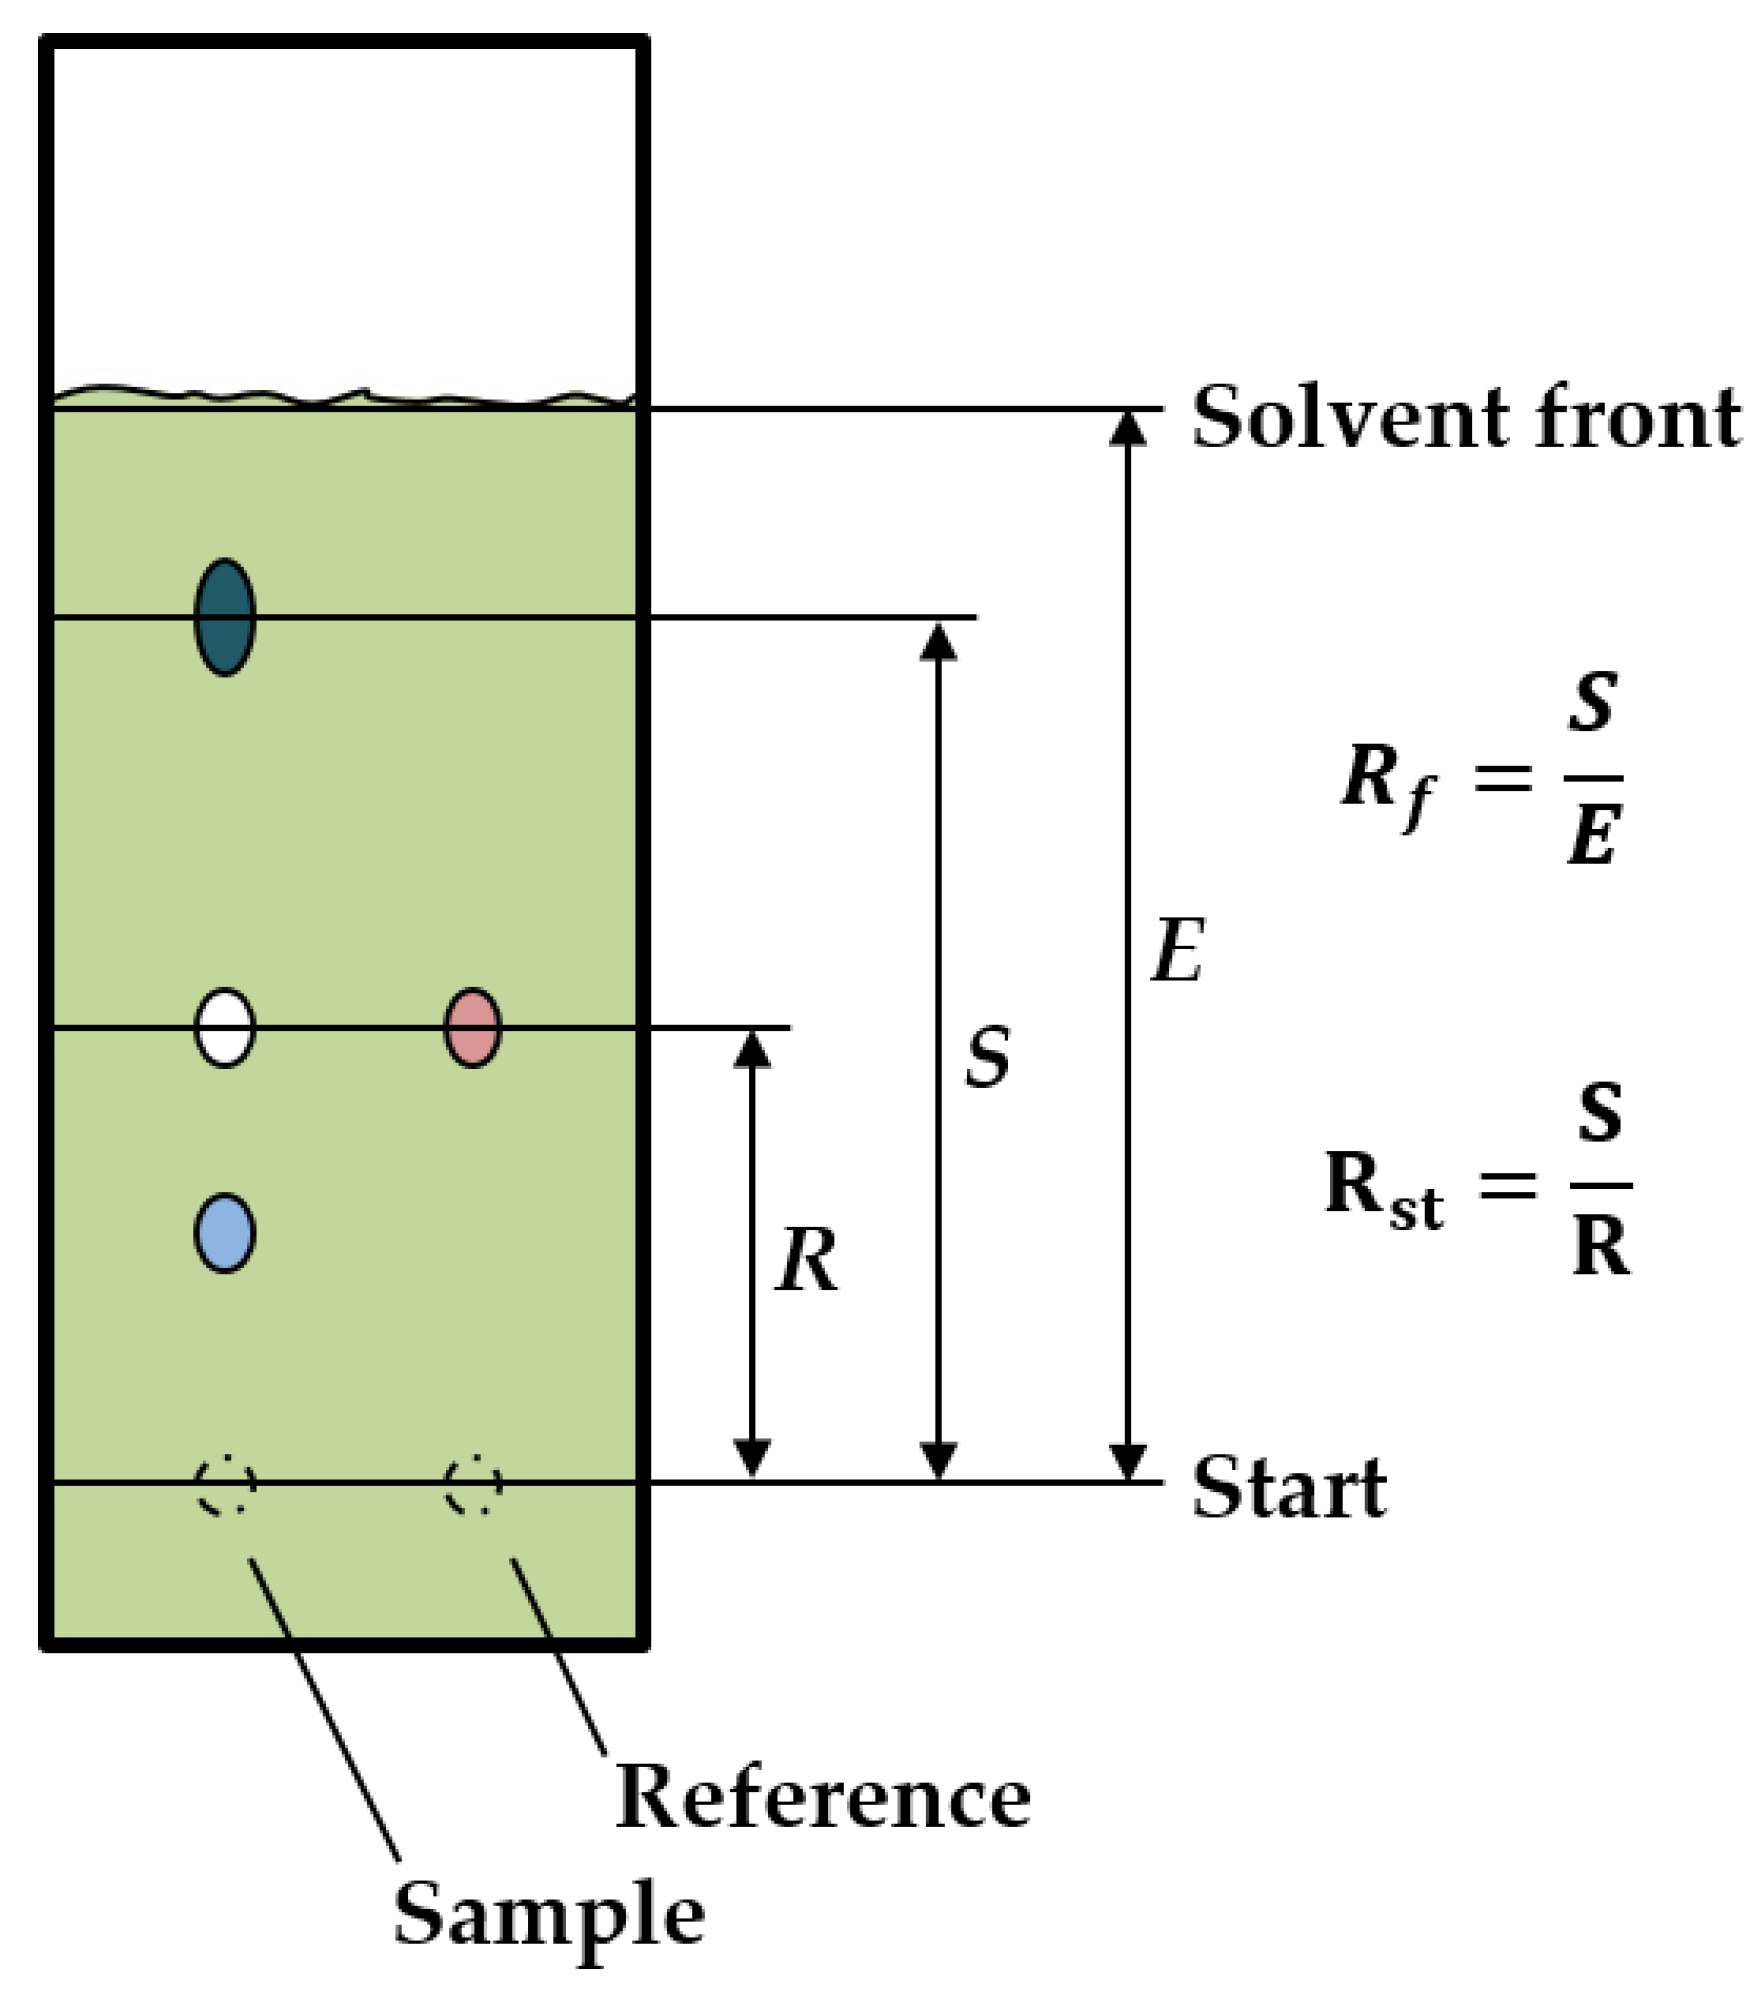
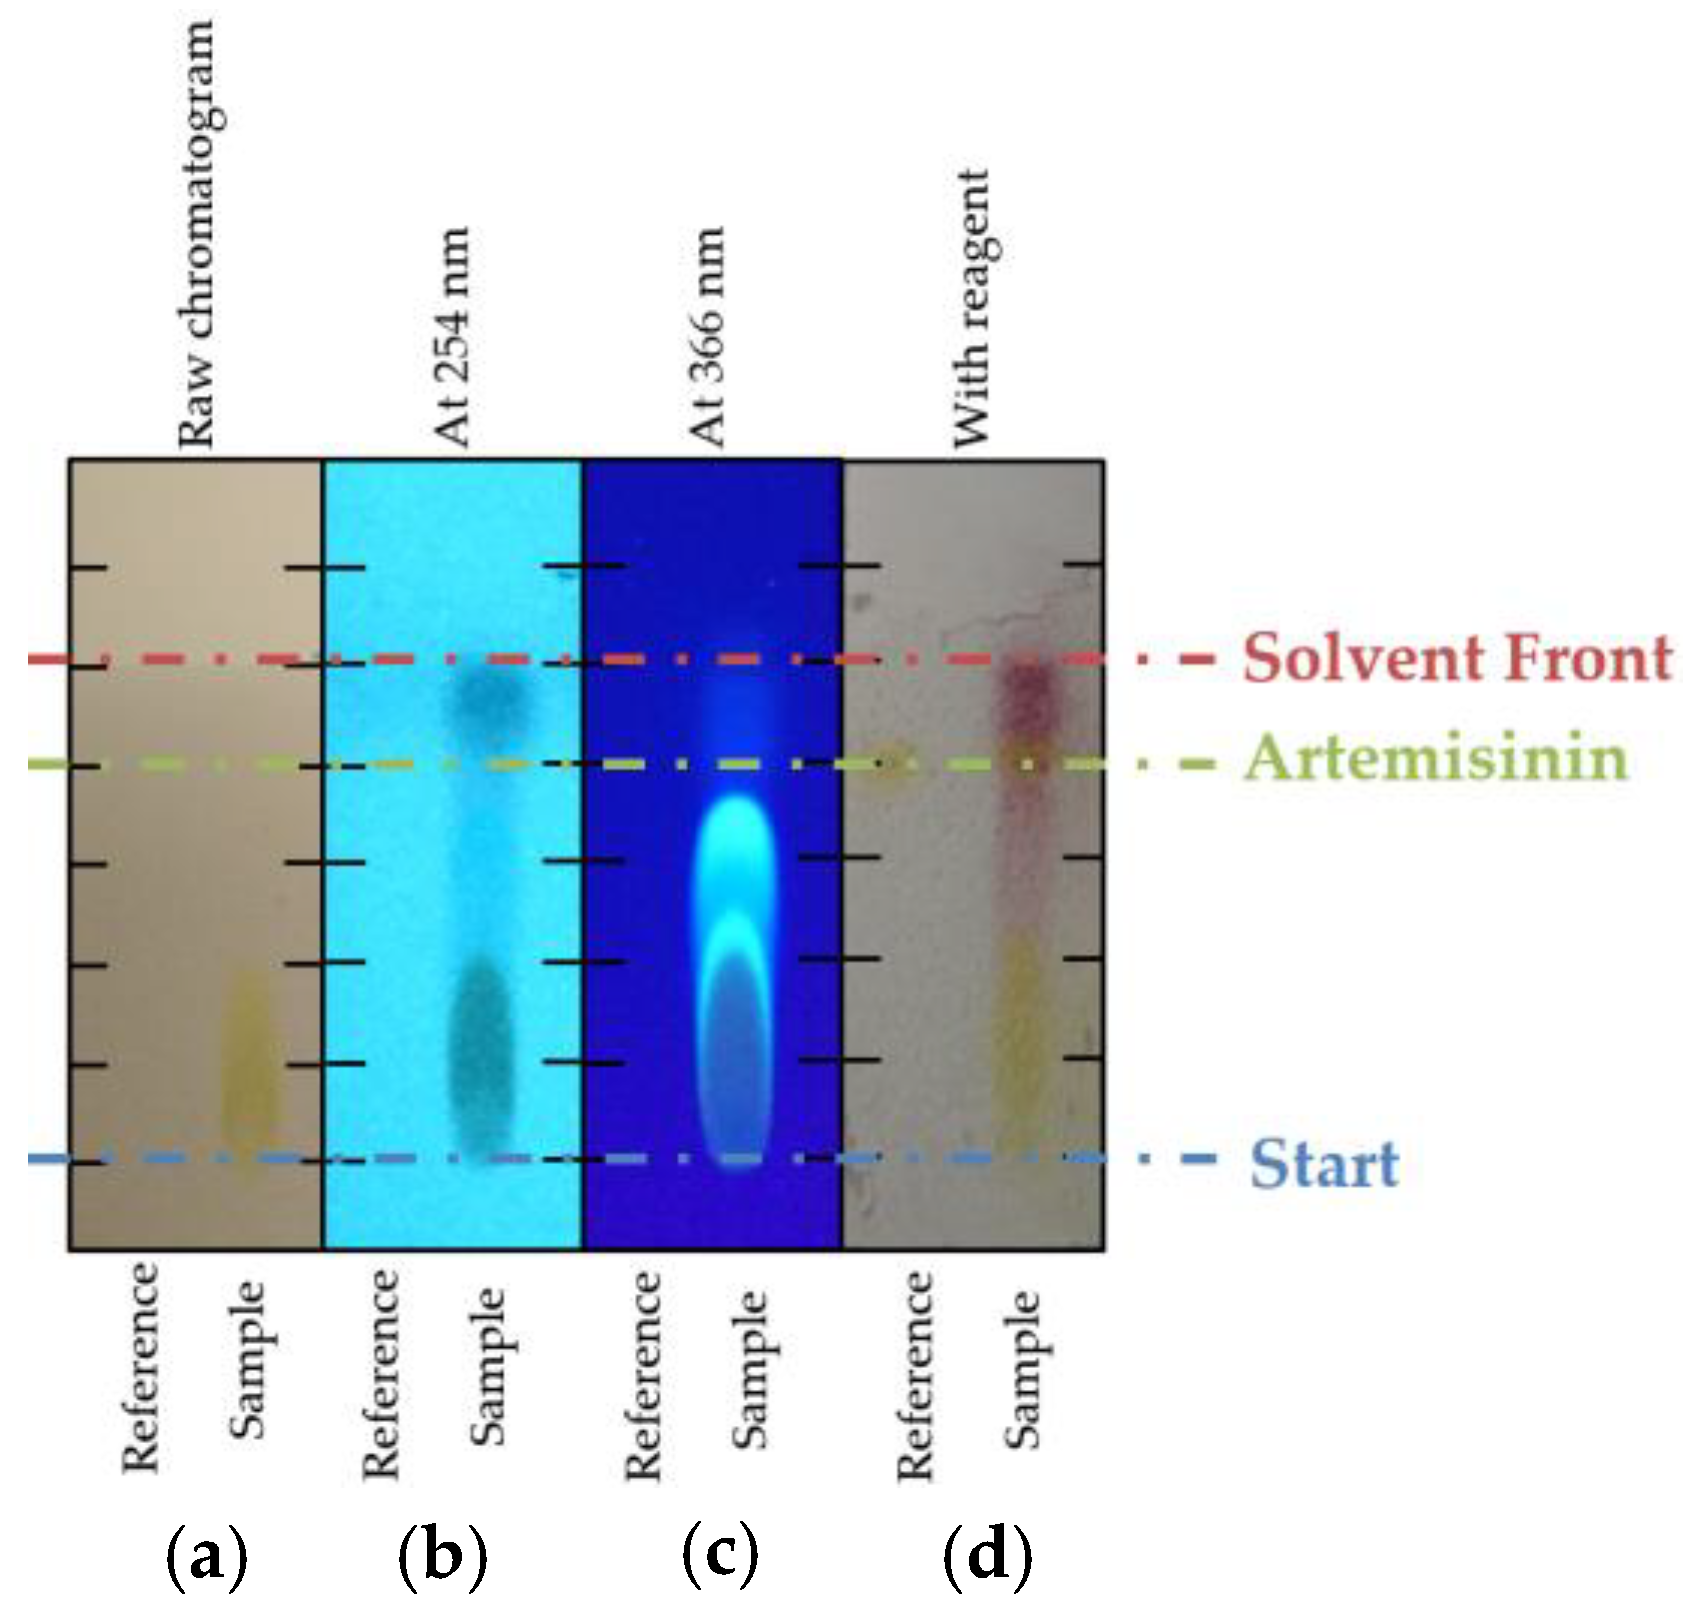
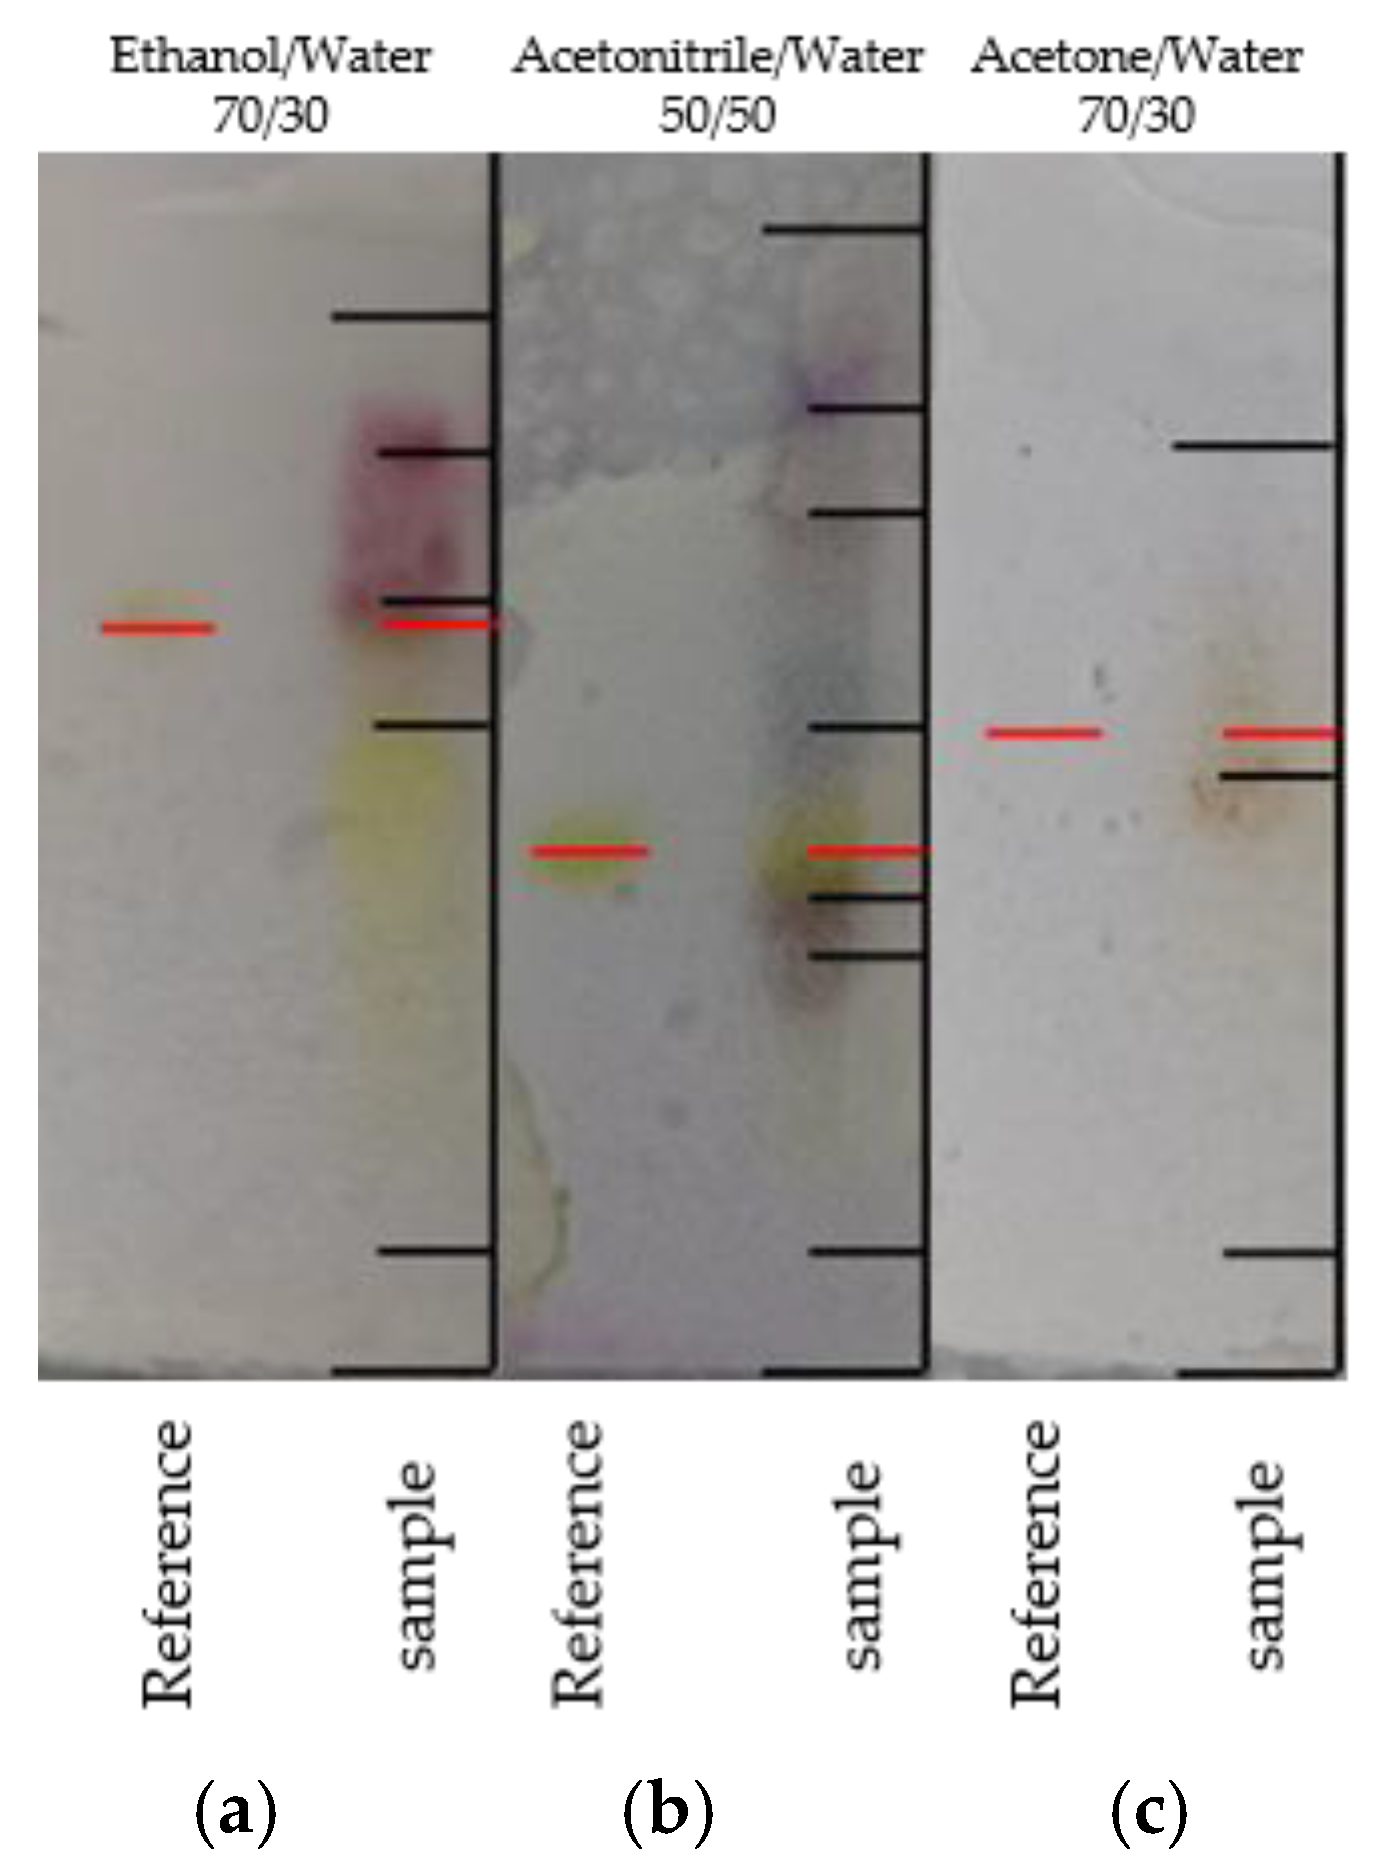
For the chromatographic method development, a pre-purified plant extract was used. To obtain this extract, a solid-liquid extraction (SLE) from mugwort (Artemisia annua L.) using acetone was carried out. A detailed method description of the extraction is given in Sixt et al. [3] and of the extraction with clarification in (Part I). After the SLE, a two-step liquid-liquid extraction (LLE) using extraction columns was carried out. A detailed description has been published by Schmidt et al. (see Part II). The solvents of the raffinate from the second extraction column were completely removed using a rotary evaporator (IKA®-Werke GmbH & Co. KG, Staufen, Germany). The dry extract was dissolved in the eluent composition used in the chromatographic system. The feed concentration was adjusted to 4 g/L and a purity of 84%.

2.3. TLC Screening

The TLC screening was performed using ALUGRAM® Nano-Sil CN/UV (MACHEREY-NAGEL GmbH & Co. KG, Düren, Germany), TLC silica gel 60 RP-18 F254S, and TLC silica gel 60 F254S (Merck KGaA, Darmstadt, Germany). After conditioning in air, 0.5 µL of the sample and the standard were pipetted onto the TLC plate, respectively. The TLC plates were brought into contact with the solvent. After the separation was complete, the TLC plates were analyzed by ultra violet (UV) detection (254 nm and 366 nm) and by vanillin-phosphoric acid reagent in the visible (VIS) spectrum. The dried TLC plates were dipped into the reagent and then heated up to 120–160 °C. This method was based on Jork et al. [33].

2.4. HPLC Columns

The column screening was performed by HPLC using an Elite LaChrom® system. The columns used were LiChrospher® 300 CN 250 mm × 4 mm inner diameter (i.d)., PharmPrep® P100 RP-18e 250 mm × 4.6 mm i.d., and LiChrospher® Si 60 250 mm × 4 mm i.d. All columns were obtained from Merck KGaA (Darmstadt, Germany). The volumetric flow rate was 1 mL/min. For the screening, an overview gradient was used. In this method, a 5 column volume (CV) wash step was carried out followed by a 10 CV linear gradient.
The preparative experiments were carried out using a self-packed Superformance® 600-16 column (Götec-Labortechnik GmbH, Bickenbach, Germany) packed with LiChroprep® Si 60 (Merck KGaA, Darmstadt, Germany). The columns were packed to a bed high of 10 cm. The volumetric flow rate was 6.6 mL/min.

2.5. Analytics

The analysis of artemisinin was performed by HPLC using an Elite LaChrom® device equipped with an evaporation light scattering detector (ELSD) Alltech® 3300 (Grace®, Columbia, SC, USA). The analytical column was a PharmPrep® RP18 250 mm × 4 mm i.d. by Merck® (Merck KGaA, Darmstadt, Germany) operated at 25 °C. The eluents were acetonitrile (VWR®, Darmstadt, Germany) and water (Sartorius® arium® pro, Göttingen, Germany) 60/40 in isocratic mode at 1 mL/min flow. The injection volume was 10 µL and all samples were passed through a 0.2 µm syringe filter. The evaporator temperature of the ELSD was set to 36 °C and the air flow was 1.6 mL/min. Calibration was performed with an external standard ordered from CfM Oskar Tropitzsch (Marktredwitz, Germany) over a range from 1 g/L to 0.001 g/L. The basis of the HPLC analysis protocol can be found in Lapkin et al. [34]. It was slightly modified to fit the setup used in this study.
For the H-NMR analytics, a Bruker AVANCE III 600 MHz spectrometer (Bruker, Rheinstetten, Germany) was used. It was equipped with a broadband observe probe head with z-gradient. The samples were completely evaporated to dryness using a rotary evaporator (IKA®-Werke GmbH & Co. KG, Staufen, Germany). The final analyte was then dissolved in deuterated benzene (C6D6) for measurement.

2.6. Devices and Instruments

The experimental setup consisted of a standard VWR®-Hitachi LaChrom Elite® HPLC system (VWR®, Darmstadt, Germany) with a quaternary gradient pump L2130, Autosampler L-2200, and diode detector L-2455.
The preparative setup consisted of two pumps, namely, LaPrep P110 and LaPrep P314 UV detector (VWR®, Darmstadt, Germany), a Smartline Autosampler 3950 (Knauer Wissenschaftliche Geräte GmbH, Berlin, Germany), and a fraction collector LABOCOL Vario-2000 (LABOMATIC Instruments GmbH, Allschwil, Switzerland).
The rotary evaporator consisted of an RV 10 control V-C Set (IKA®-Werke GmbH & Co. KG, Staufen, Germany) and a VARIO® PC 3000 series vacuum pump (VACUUBRAND GmbH & Co. KG, Wertheim, Germany).

3. Results and Discussion

Purification of artemisinin is of great interest for use as a pharmaceutical anti-malaria agent. A cost-efficient and productive purification process is needed which can achieve the required purity for a pharmaceutical product.
For the process development, a TLC screening was carried out in a first step. The solvents used for this screening and the corresponding TLC phase are shown in Table 1.

3.1. TLC Screening of Different Phases and Solvents
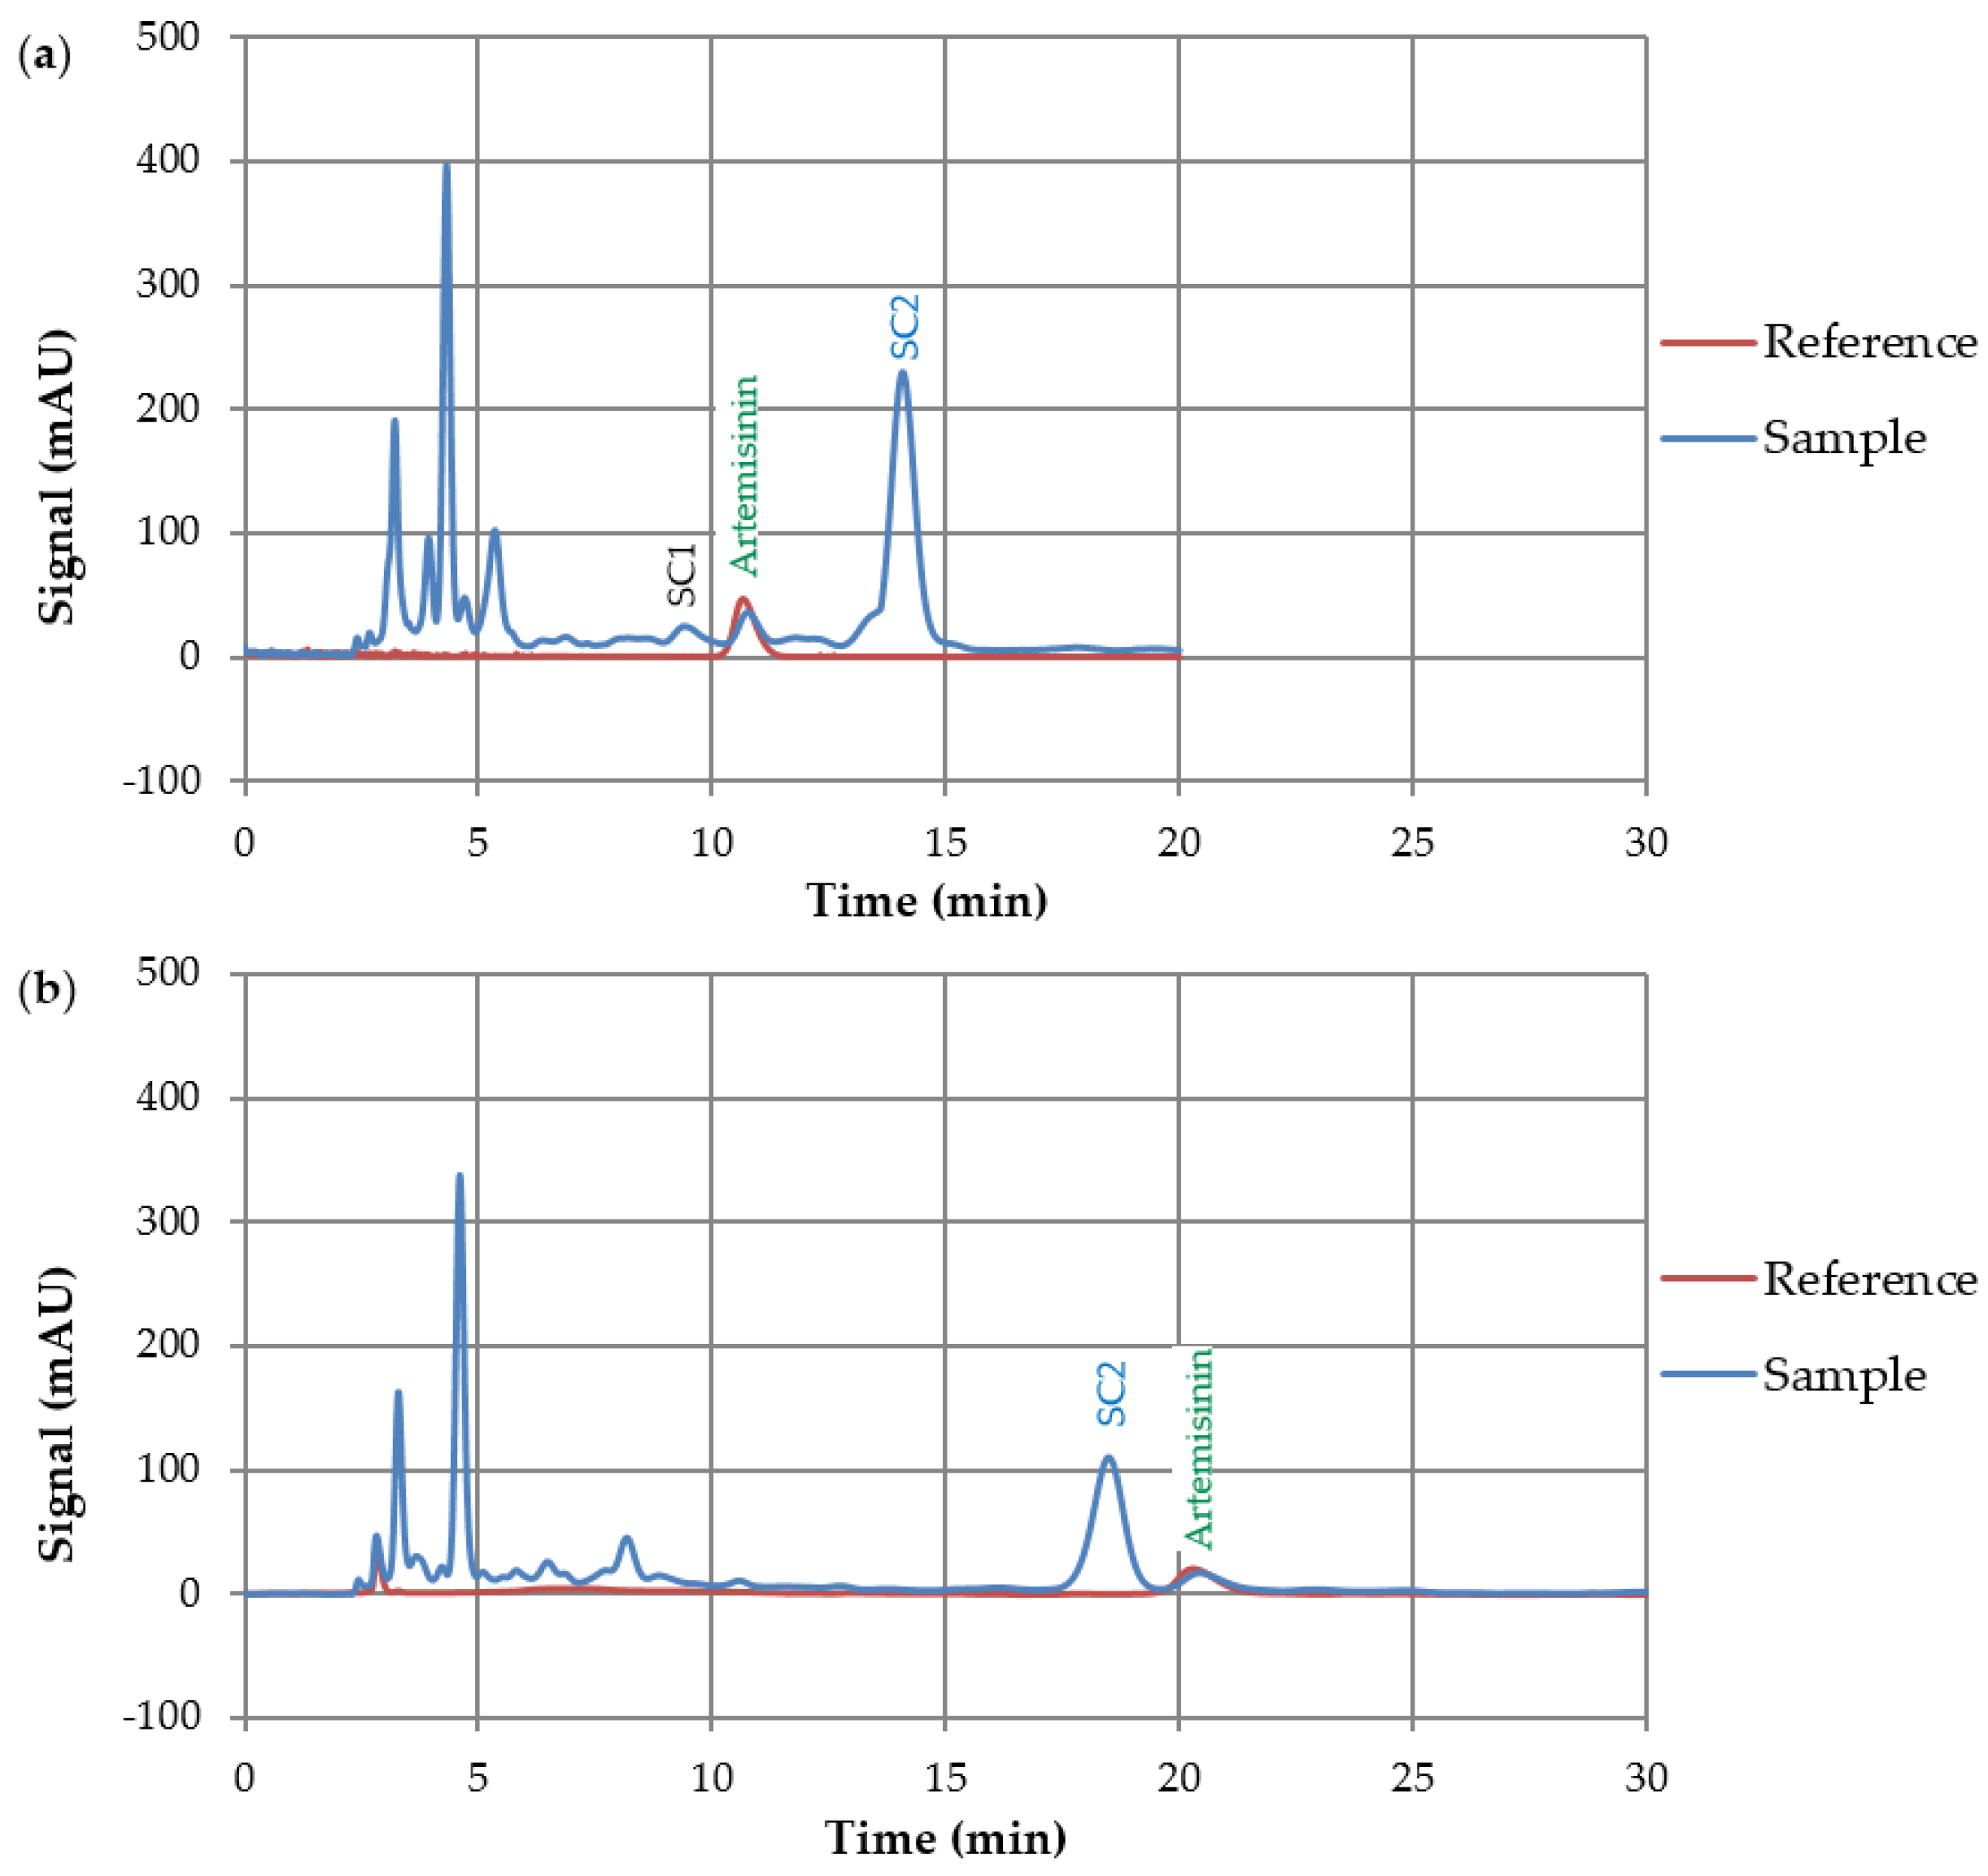
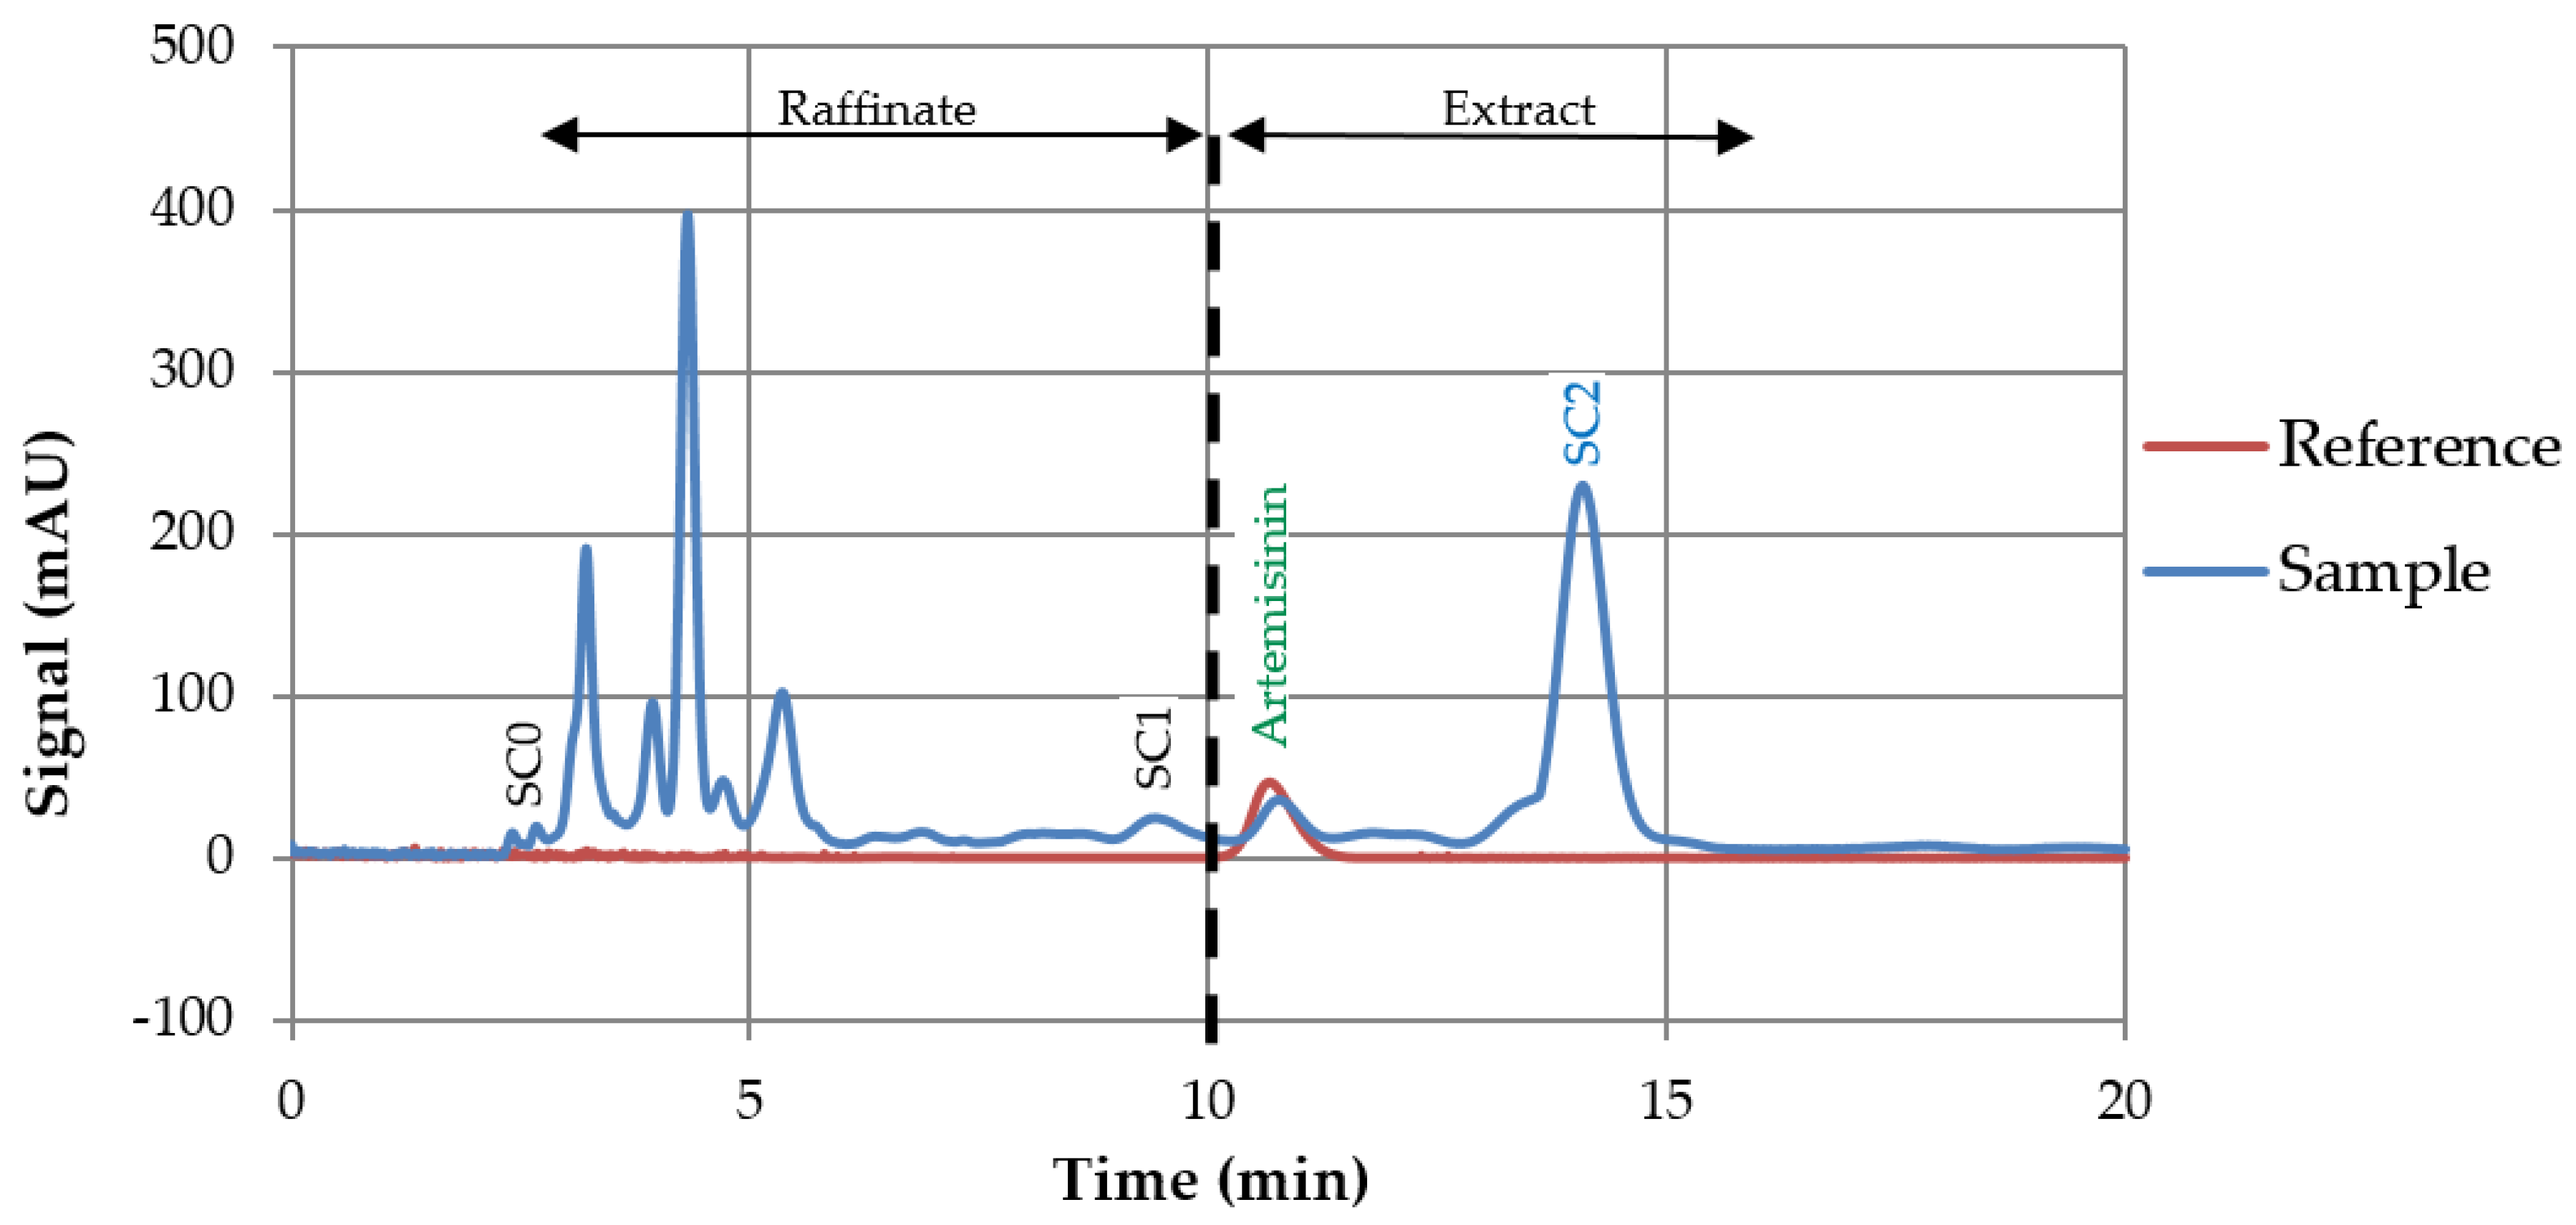
The analysis of the TLC experiments was carried out with UV detection at 254 nm and 366 nm. Additionally, the vanillin-phosphoric acid reagent was used and evaluated under VIS light. Steroids, cucurbitacins, and triterpenes were labeled with this reagent. Figure 5 shows one TLC plate as an example with the three different detection methods. This figure shows that a good visualization of the artemisinin with the reagent can be achieved (the orange component at Rf ~ 0.8). In order to detect different molecular species, detection by UV radiation was also used.
In Figure 6, three chromatograms of the cyano (CN) plate are shown. In Figure 6a, a run with 70 vol % ethanol and 30 vol % water was carried out. Figure 6b shows a run with 50 vol % acetonitrile and 50 vol % water, and Figure 6c shows a run with 70 vol % acetone and 30 vol % water. In the first two chromatograms, a good separation was achieved. Furthermore, the run with ethanol and water showed that the Rf value of the artemisinin was higher than in the other chromatograms. Figure 6c shows a run with a bad separation.

3.2. HPLC Screening

An overview of the solvents used in the HPLC screening is shown in Table 2. The dimensions of the columns used in this section can be seen in Section 2.4.

3.2.1. Column Experiments with Cyano Columns

The TLC experiments point out that the most promising eluent for the cyano stationary phase is a combination of water and acetonitrile. In first column experiments, it was shown that the affinity of the artemisinin in water was too low to bind on the stationary phase. Because of this, a buffer system was used to increase the polarity of the loading eluent. The chromatograms of three different standard solutions are shown in Figure 7. This figure demonstrates that the artemisinin binds to the column and elutes at approximately 27 min. In this method, a 5 CV wash step was carried out followed by a 10 CV gradient from 100 vol % buffer to 95/5 vol % acetonitrile/methanol. The modification with methanol increased the separation performance.
The chromatogram in Figure 7 shows that artemisinin can be separated by the cyano stationary phase. The solubility of artemisinin in some selected eluents is summarized in Table 3. This table shows that the solubility of the target compound in water is very low. Because of this result, the combination of artemisinin and water, more specifically the buffer, was not further investigated.
A very high solubility of artemisinin was given in acetone or acetonitrile. Acetonitrile provided many disadvantages like high toxicity and a low boiling point, leading to high security measures and making it an economically irrational solvent. Moreover, an inline detection using UV-VIS spectra was required, and acetone is therefore not an option as well.

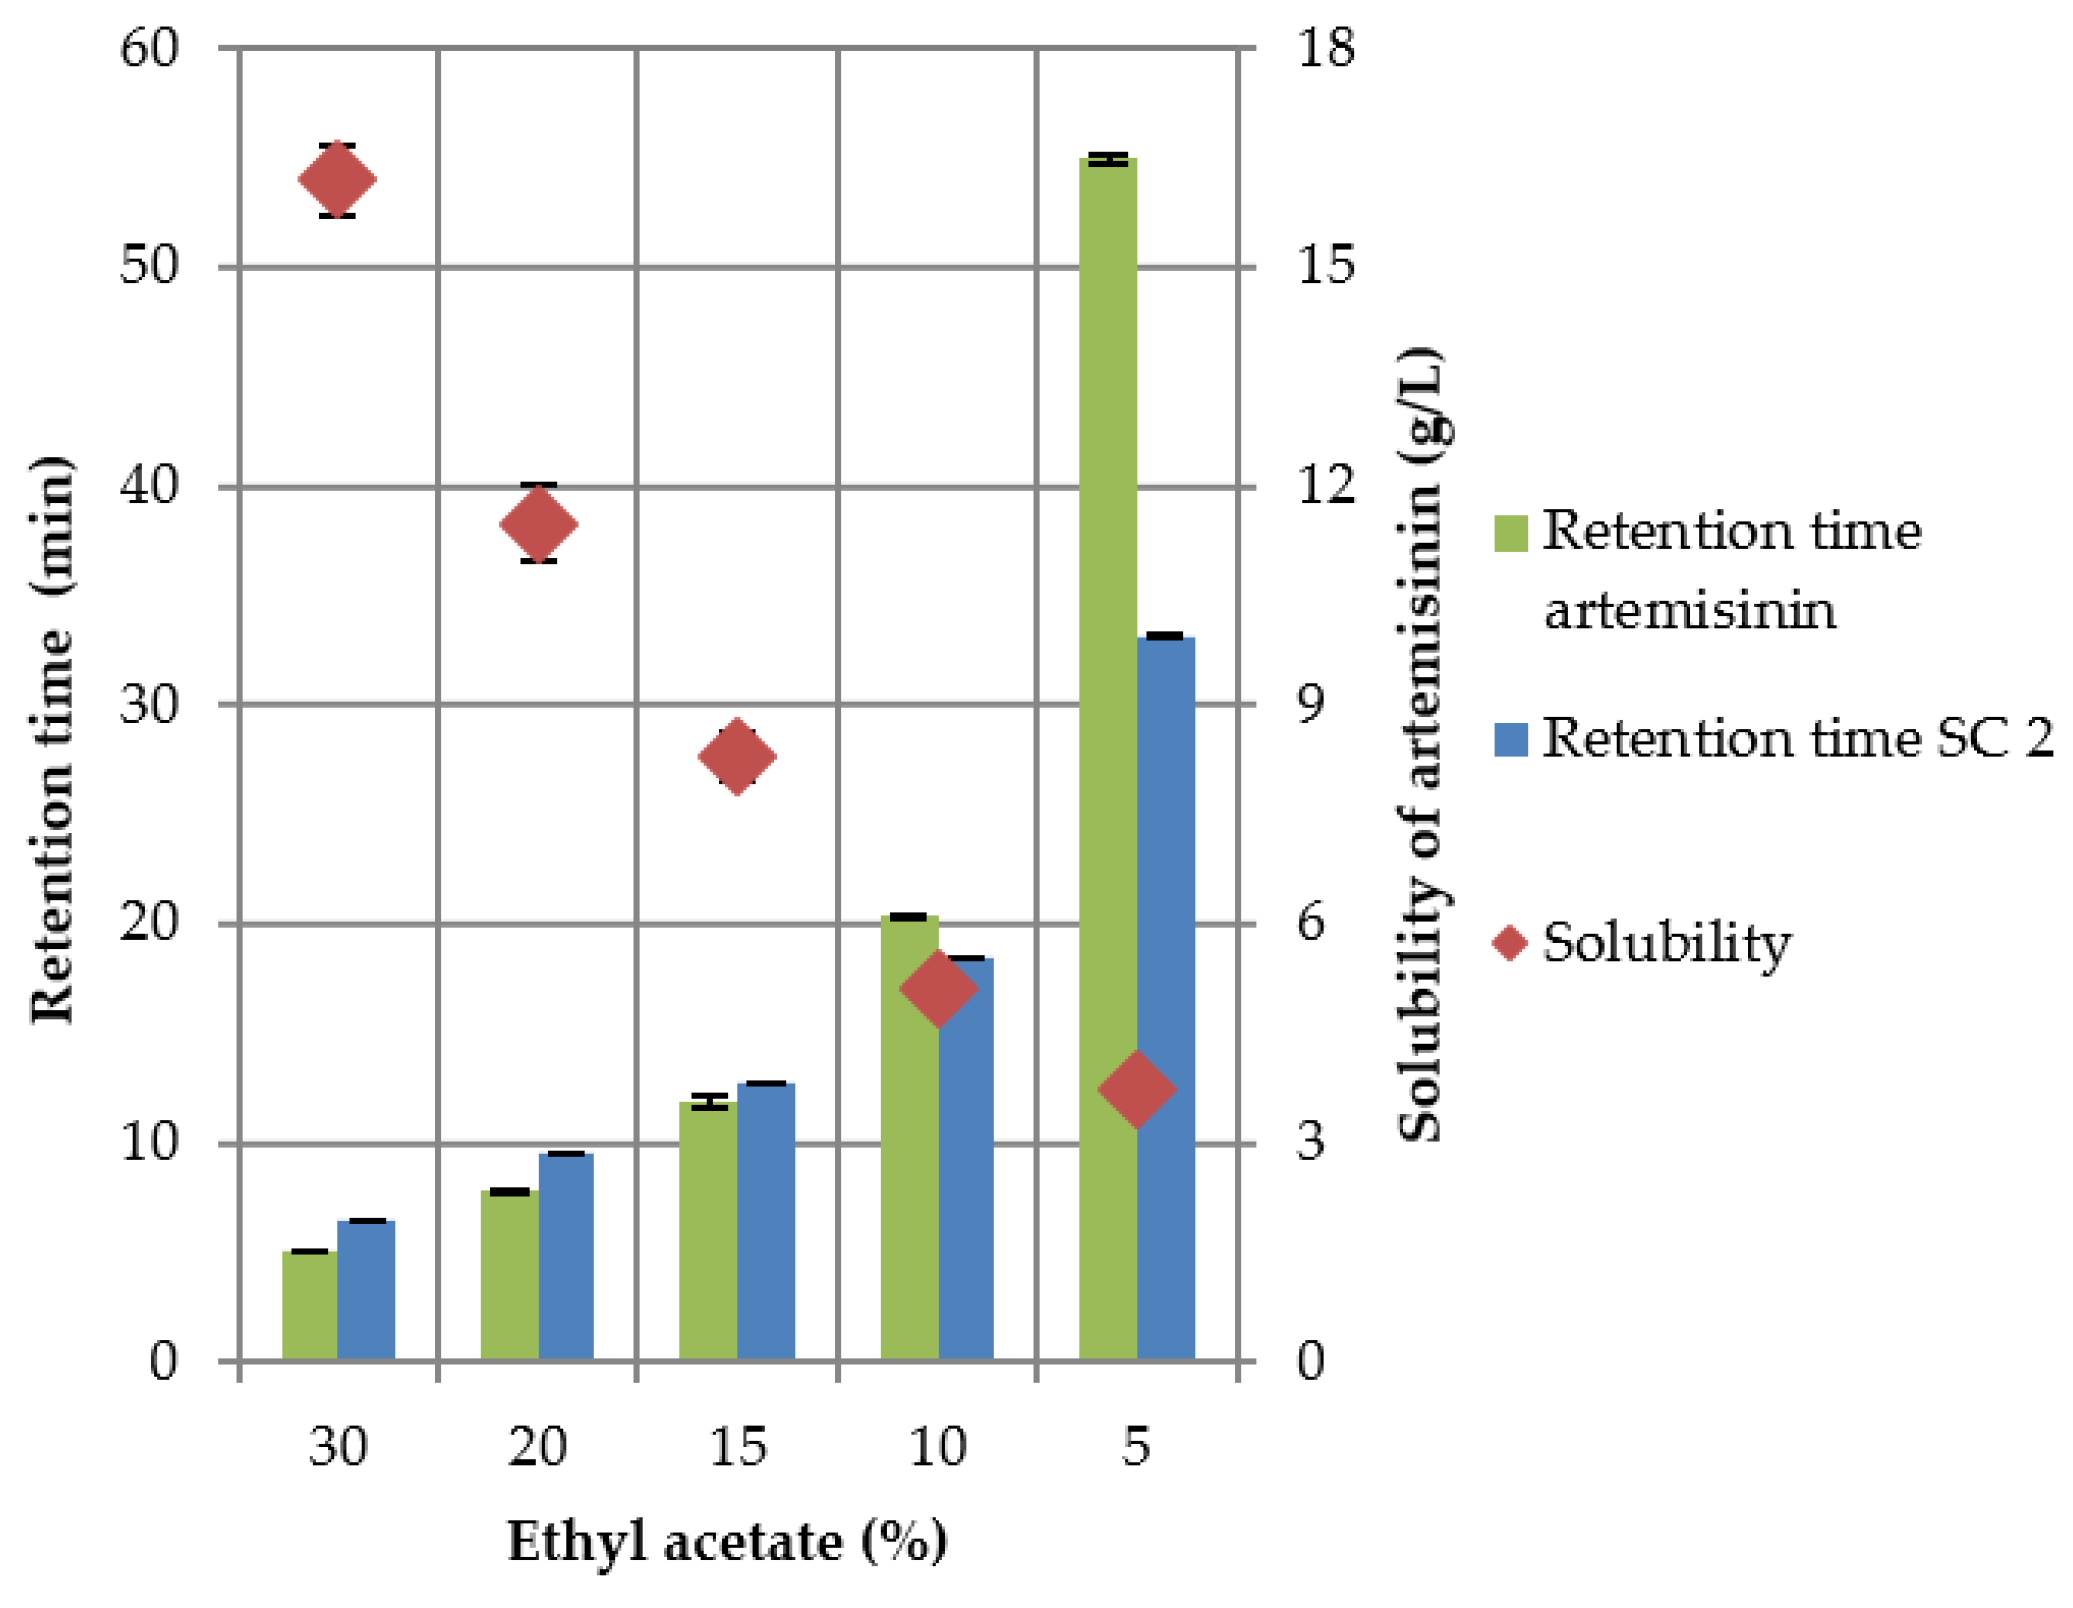
3.2.2. Column Experiments with Normal Phase Columns

Because of the low solubility of artemisinin in water, experiments with normal phase (NP) stationary phases were carried out. Table 4 summarizes some of the results of this screening.
This table shows a high potential of n-hexane and ethyl acetate as solvents for the separation on NP chromatographic resin. To verify this result, further investigations were performed.
The chromatograms of the isocratic runs with 15 vol % and 10 vol % ethyl acetate are shown in Figure 8. In these chromatograms, a shift of side component (SC) 2 and artemisinin can be seen. The examination of the dependency between solvent composition and retention time is depicted in Figure 9. The corresponding chromatograms for the measurement of the retention times at 5 vol %, 20 vol % and 30 vol % ethyl acetate are not given in this publication. The solubility of the artemisinin at the chosen ethyl acetate/n-hexane ratio is taken from Malwade et al. [19].
A gradient method would push the artemisinin and the SC2 component together into one peak because these two components will change their elution order. This has been validated by experiments (chromatograms not shown). Based on the solubility of artemisinin which should be greater than 8 g/L, the selectivity and the method duration, a composition of the eluent consisting of 15 vol % ethyl acetate and 85 vol % n-hexane was chosen. An eluent composition with less ethyl acetate will lead to a lower solubility and a significant increase in the retention time. This will also lead to an increase in the method duration and, based on this, to a reduction in productivity.

3.3. Preparative Experiments

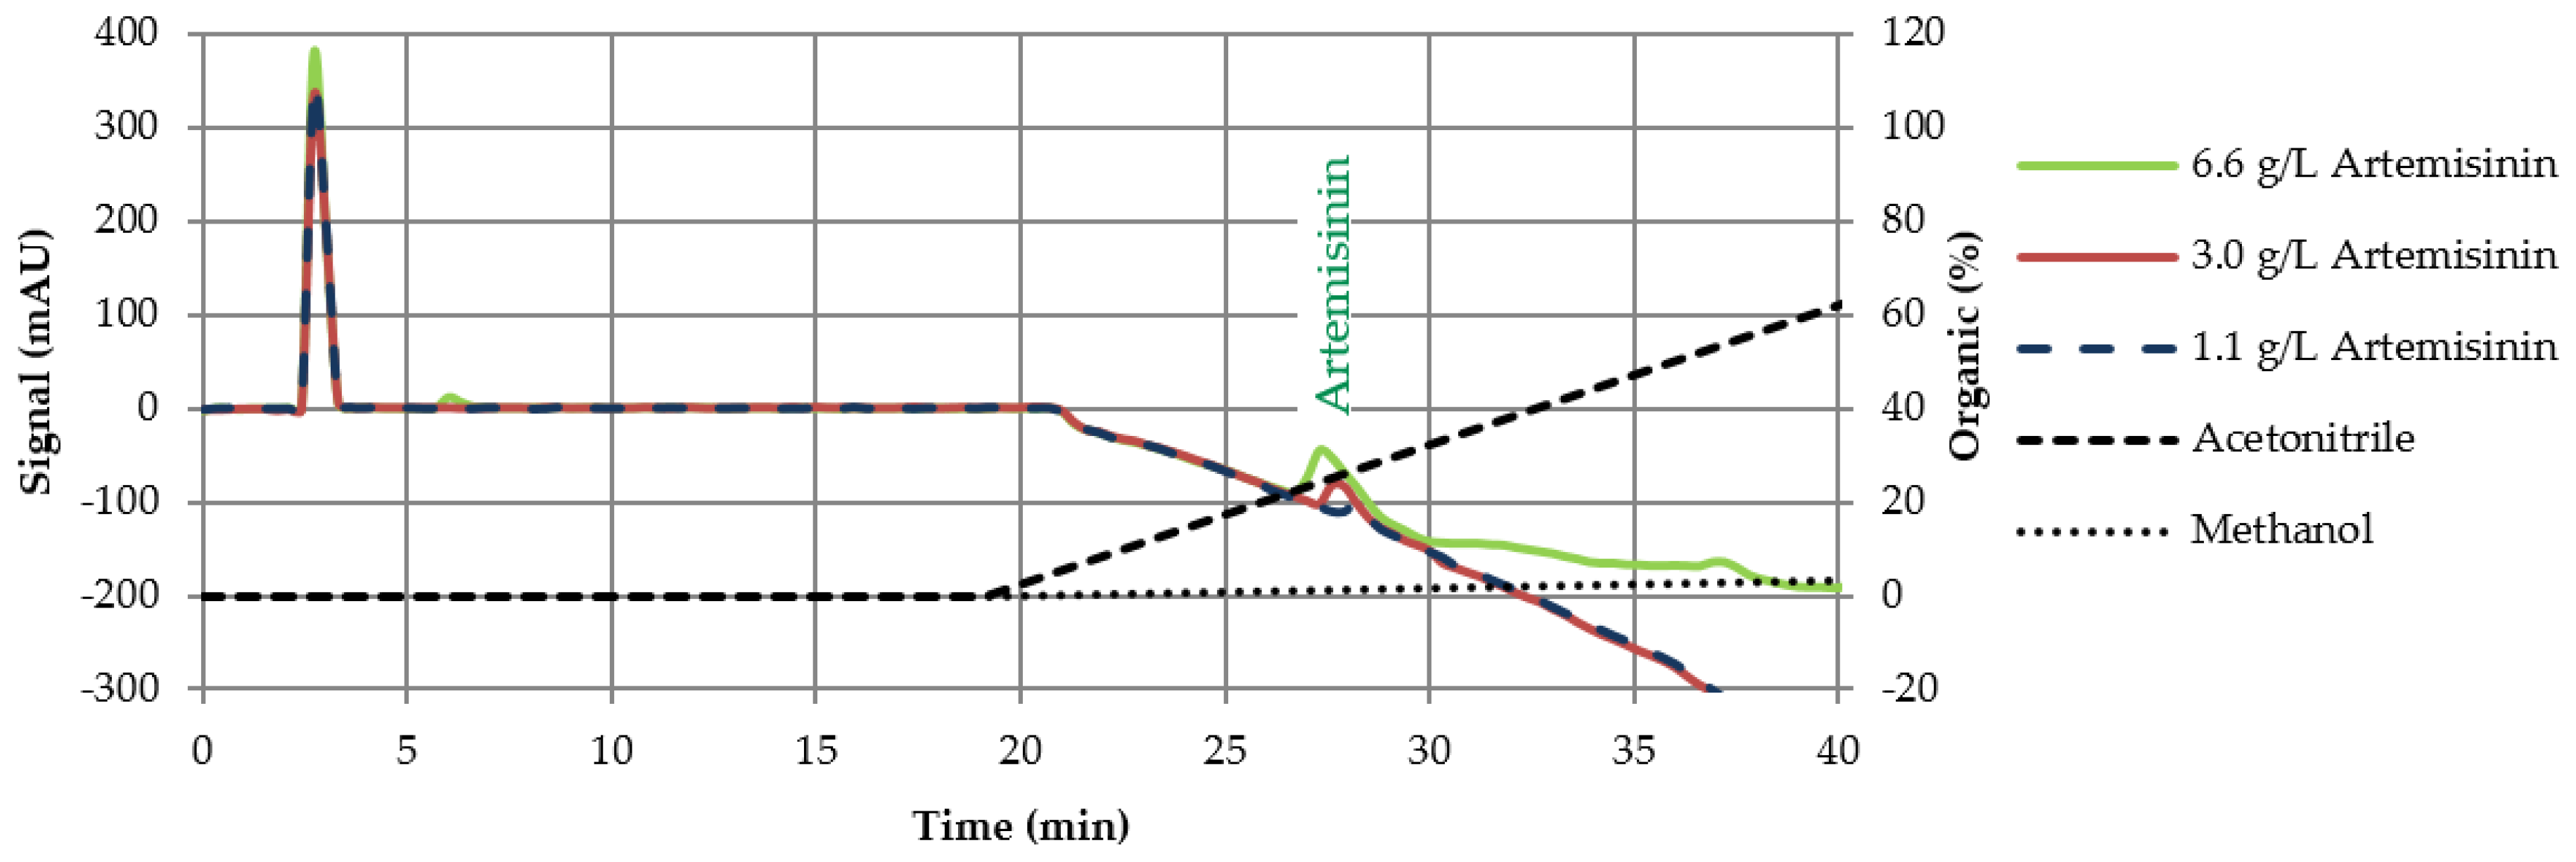
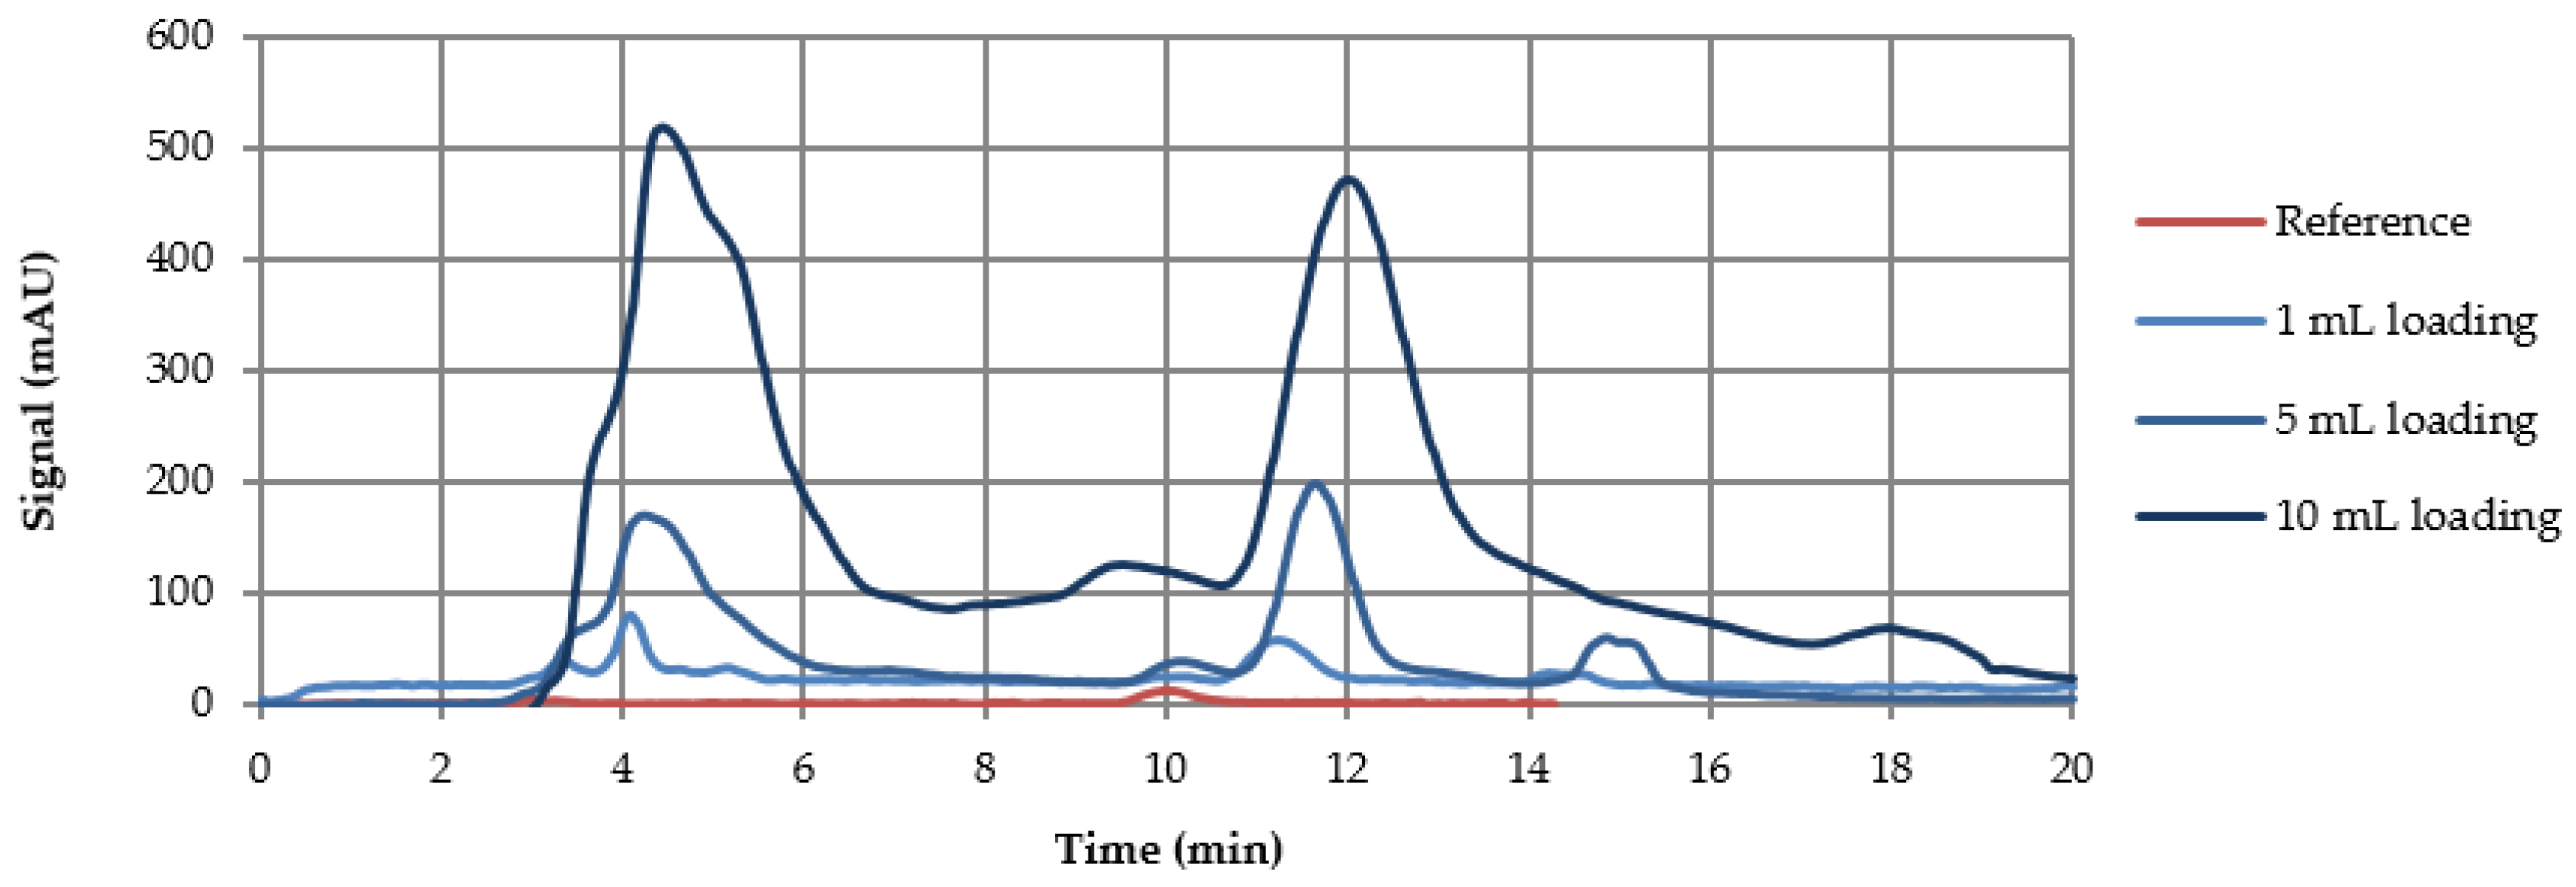
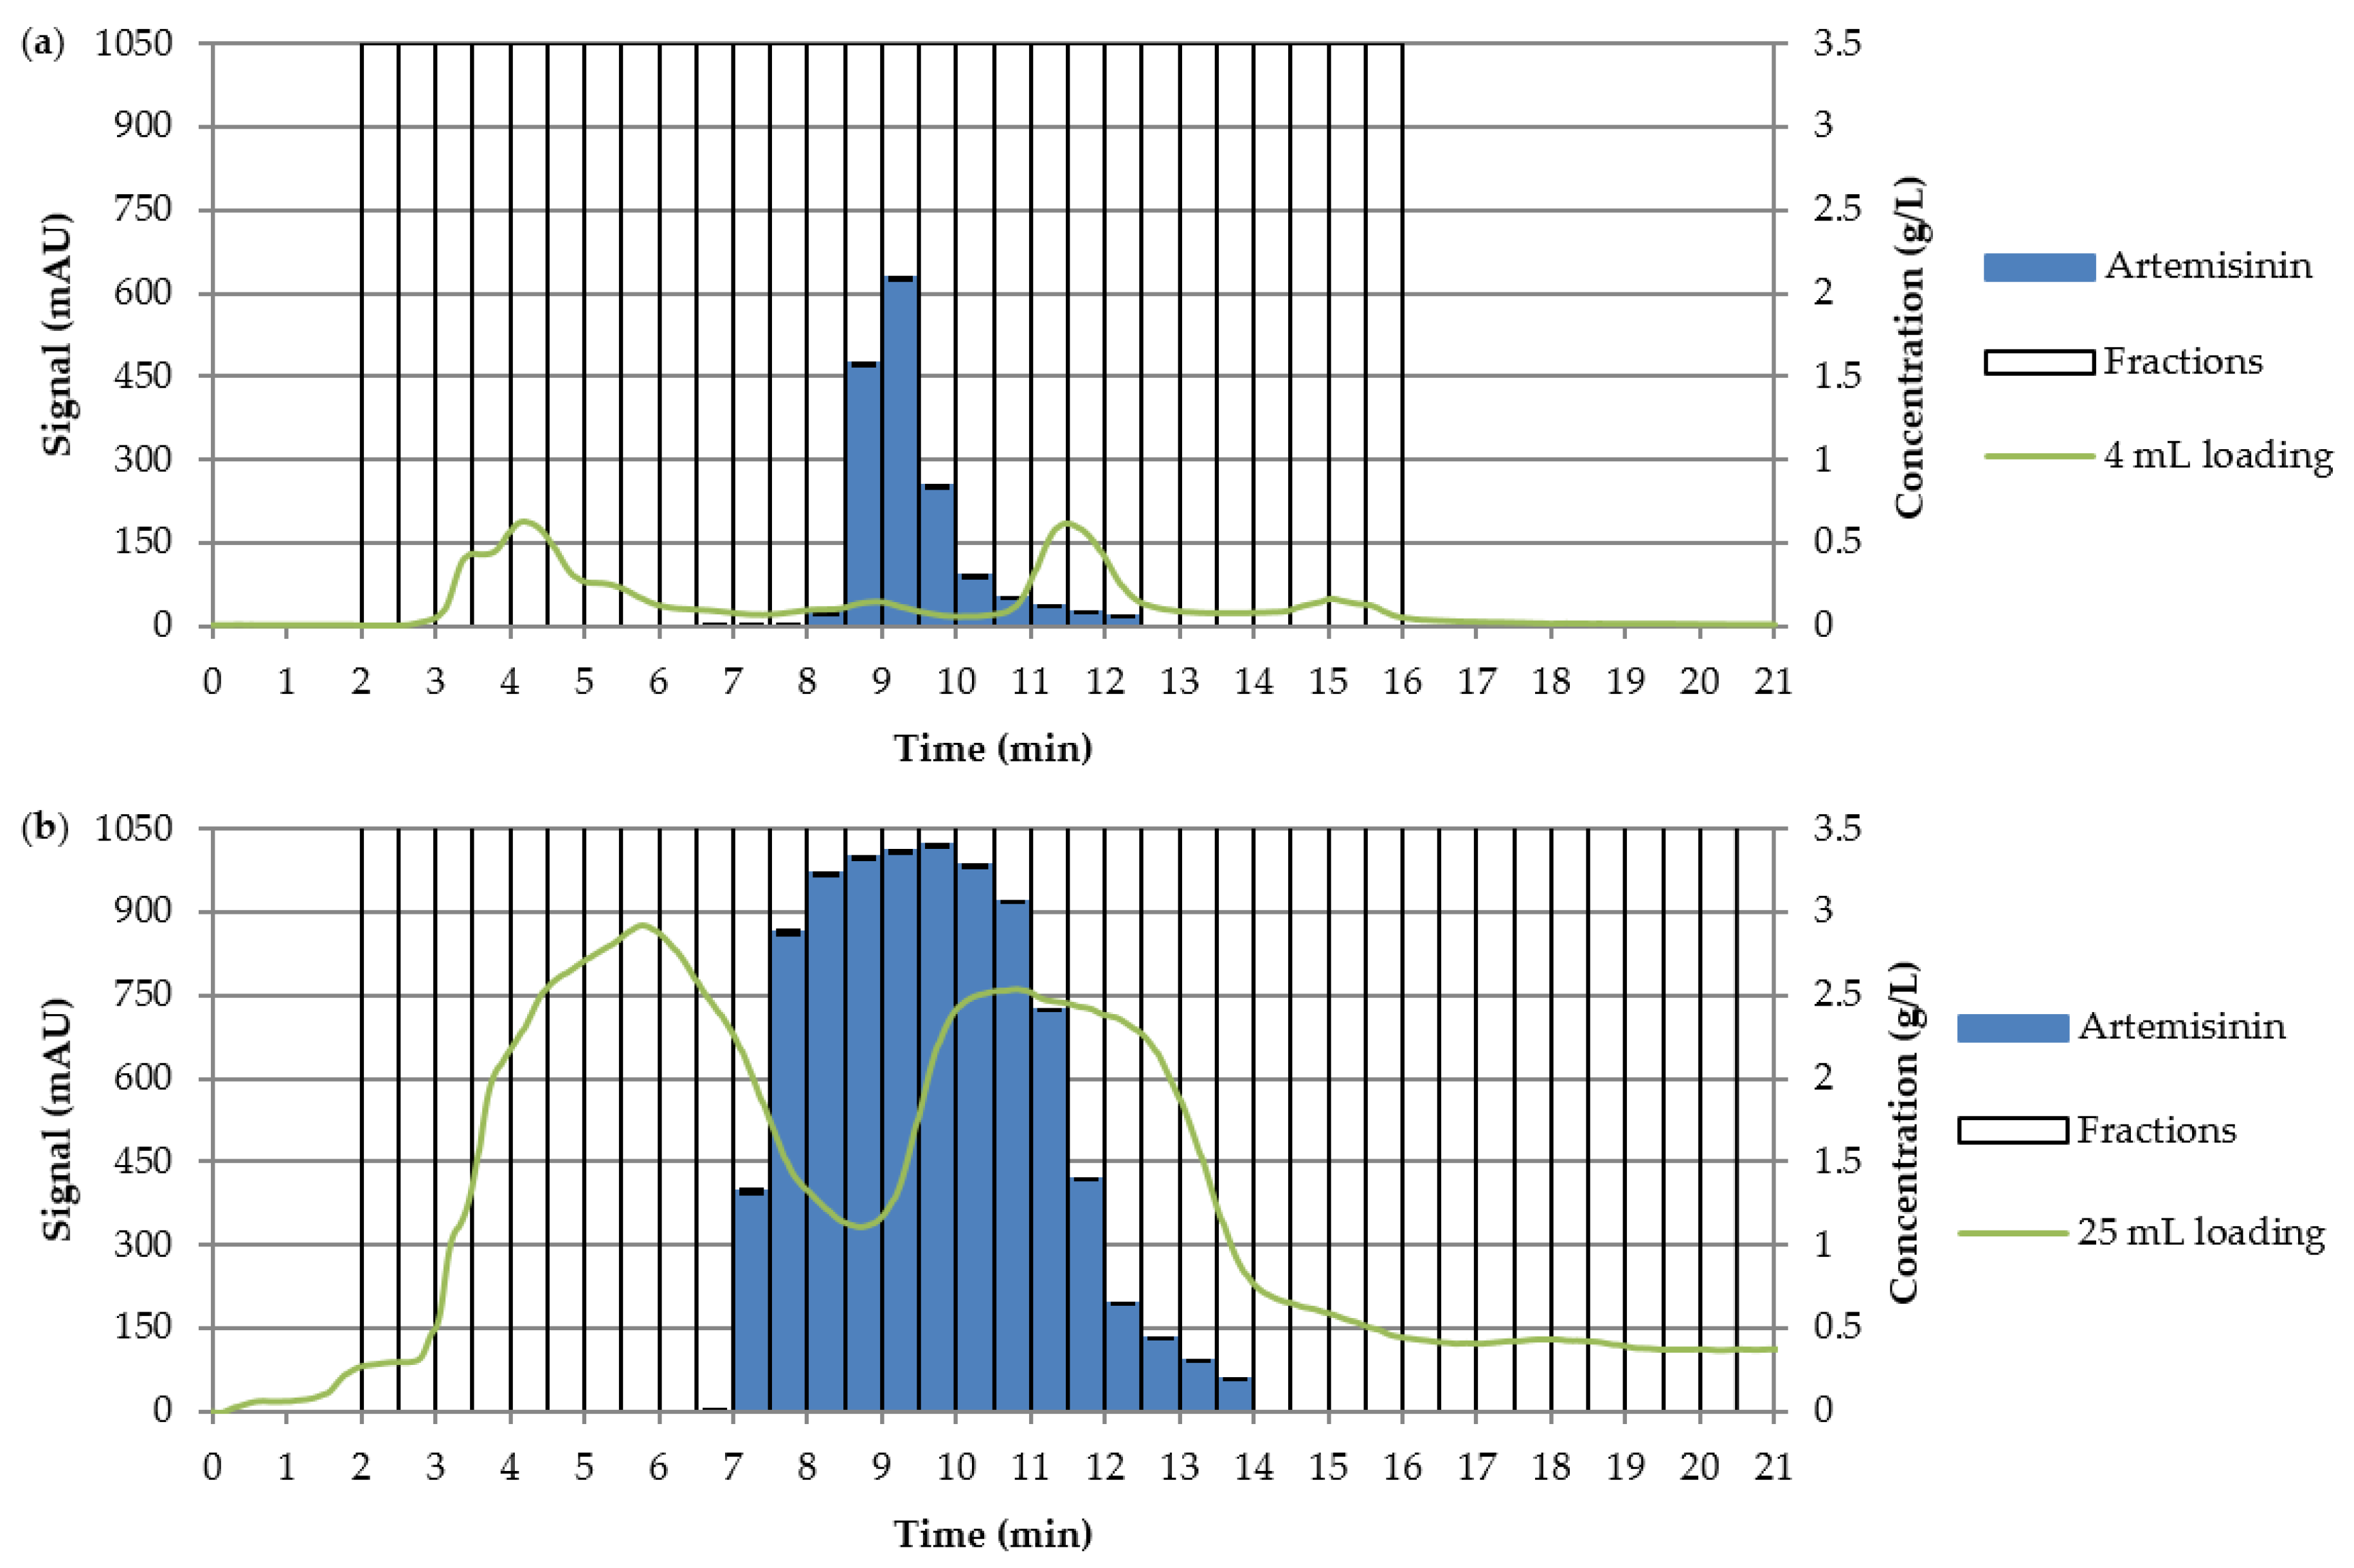
3.3.1. Loading Experiments

The first step of scale-up to the preparative scale involved loading experiments to determine the optimal loading conditions. Therefore, loadings with 1 mL, 5 mL, and 10 mL of the extract were performed, respectively. Additionally, a chromatogram with the reference substance was run for comparison. These chromatograms are described in Figure 10.
An injection of 10 mL was repeated several times and different fraction widths were pooled. After this test, two fractionations, namely, one with 4 mL loading and the second with 25 mL loading, were carried out. The results of these fractionations are shown in Figure 11. In the chromatogram with the 4 mL loading (see Figure 11a), an overlapping of the artemisinin peak and other peaks can be seen. In Figure 11b, it can be seen that the artemisinin is completely overlapped by other components.
The product fractions should have a purity of over 97%. The resulting yield, purity, and the corresponding productivities are shown in Table 5. The fractionations prove that the yield decreased from 97.8% at a loading of 4 mL to 93.8% at an injection volume of 25 mL, but that at the same time the productivity increased from 44.9 g·Lads−1·d−1 to 161.4 g·Lads−1·d−1.
An injection volume of 10 mL was chosen for the following experiments. A yield of over 96% with a purity of nearly 98% was reached with this loading. At the given parameters, a productivity of 110.8 g·L−1·d−1 was achieved.

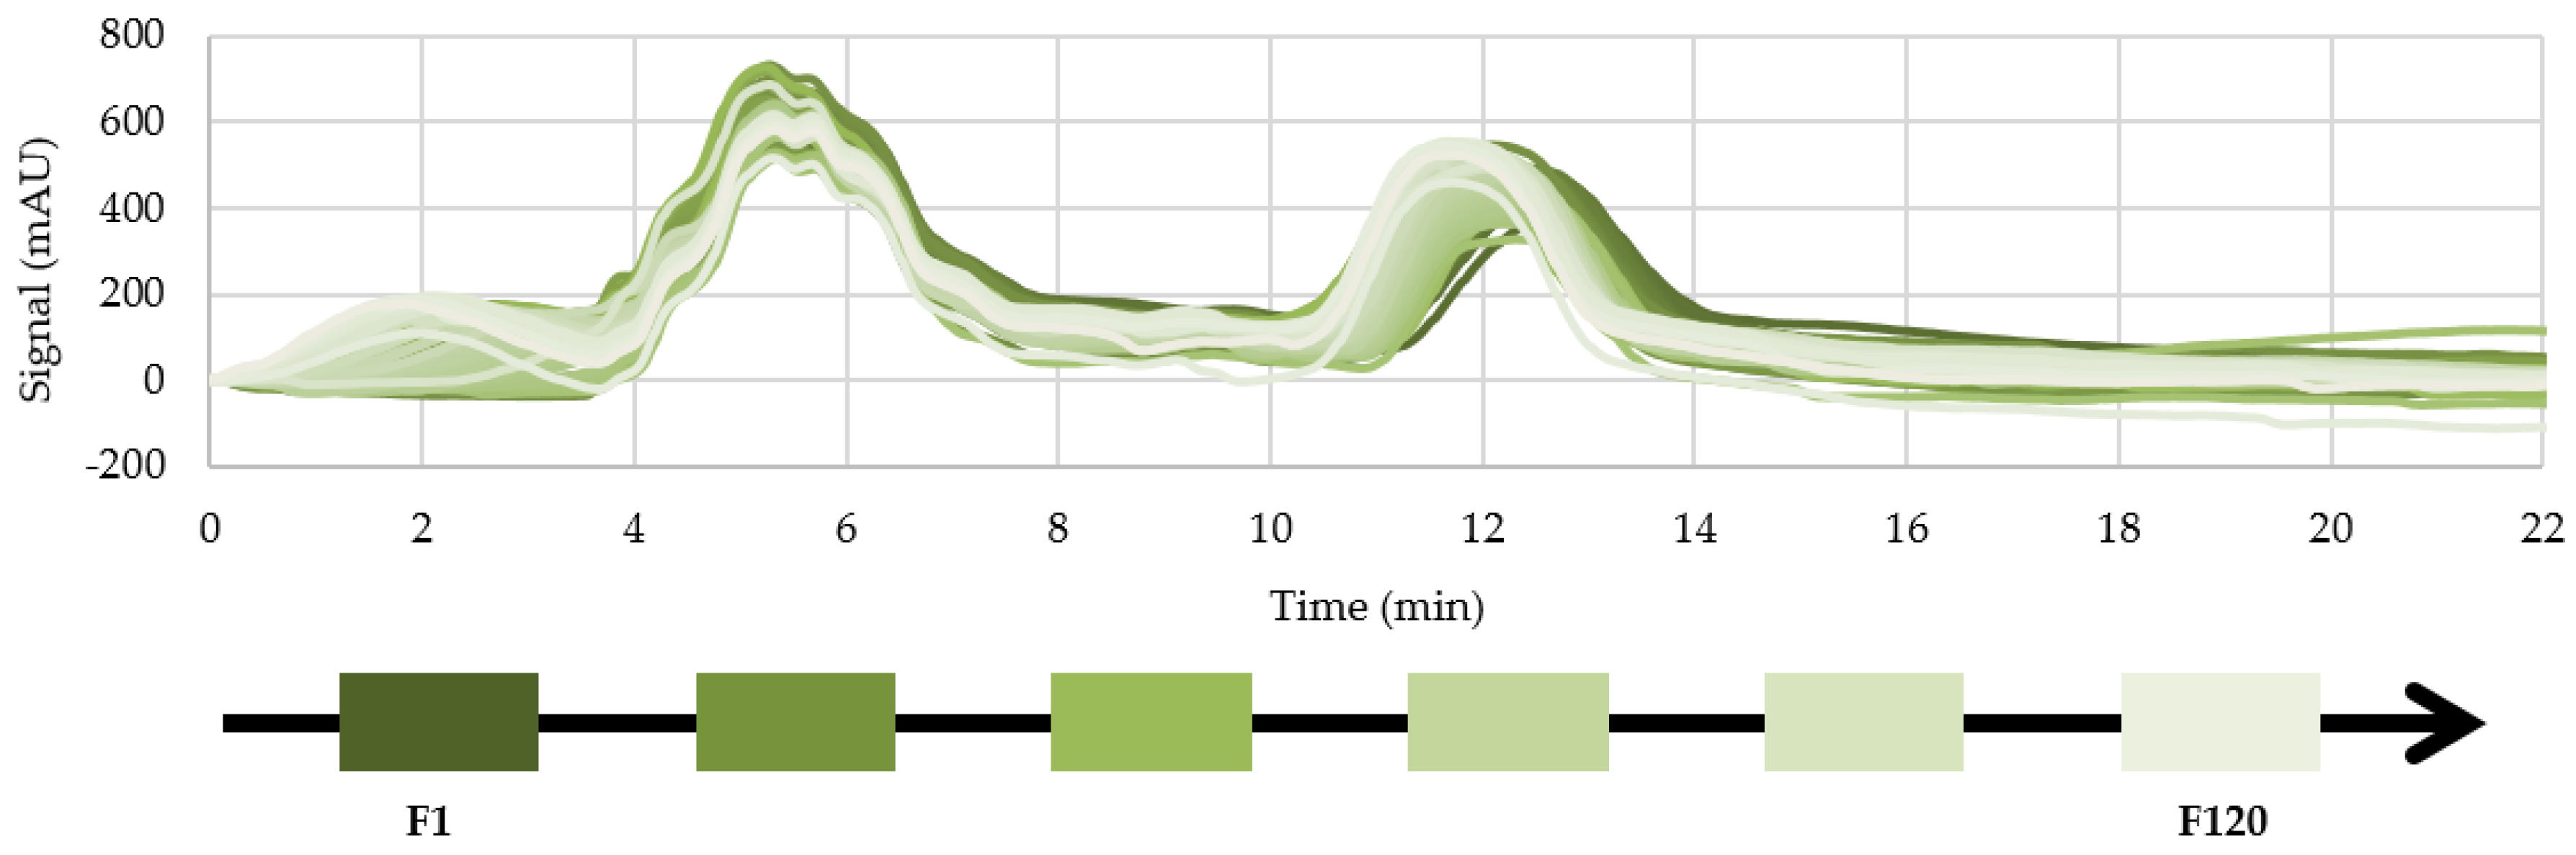
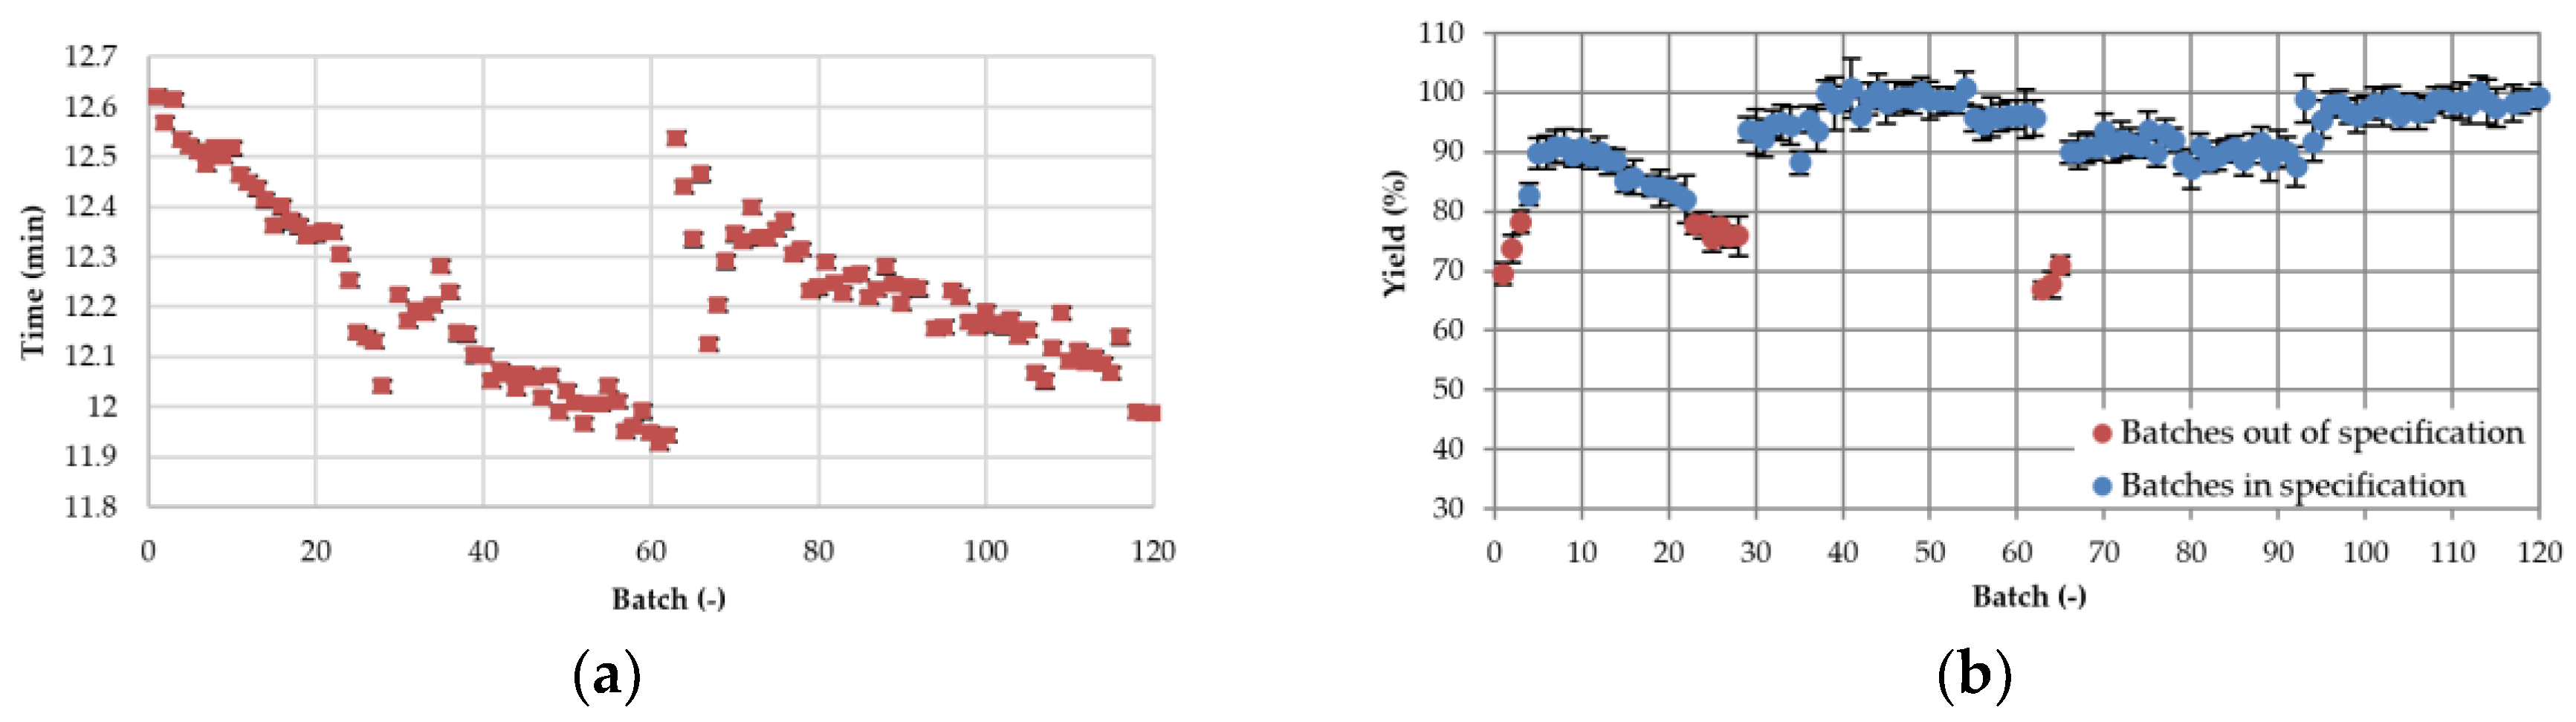
3.3.2. Process Stability
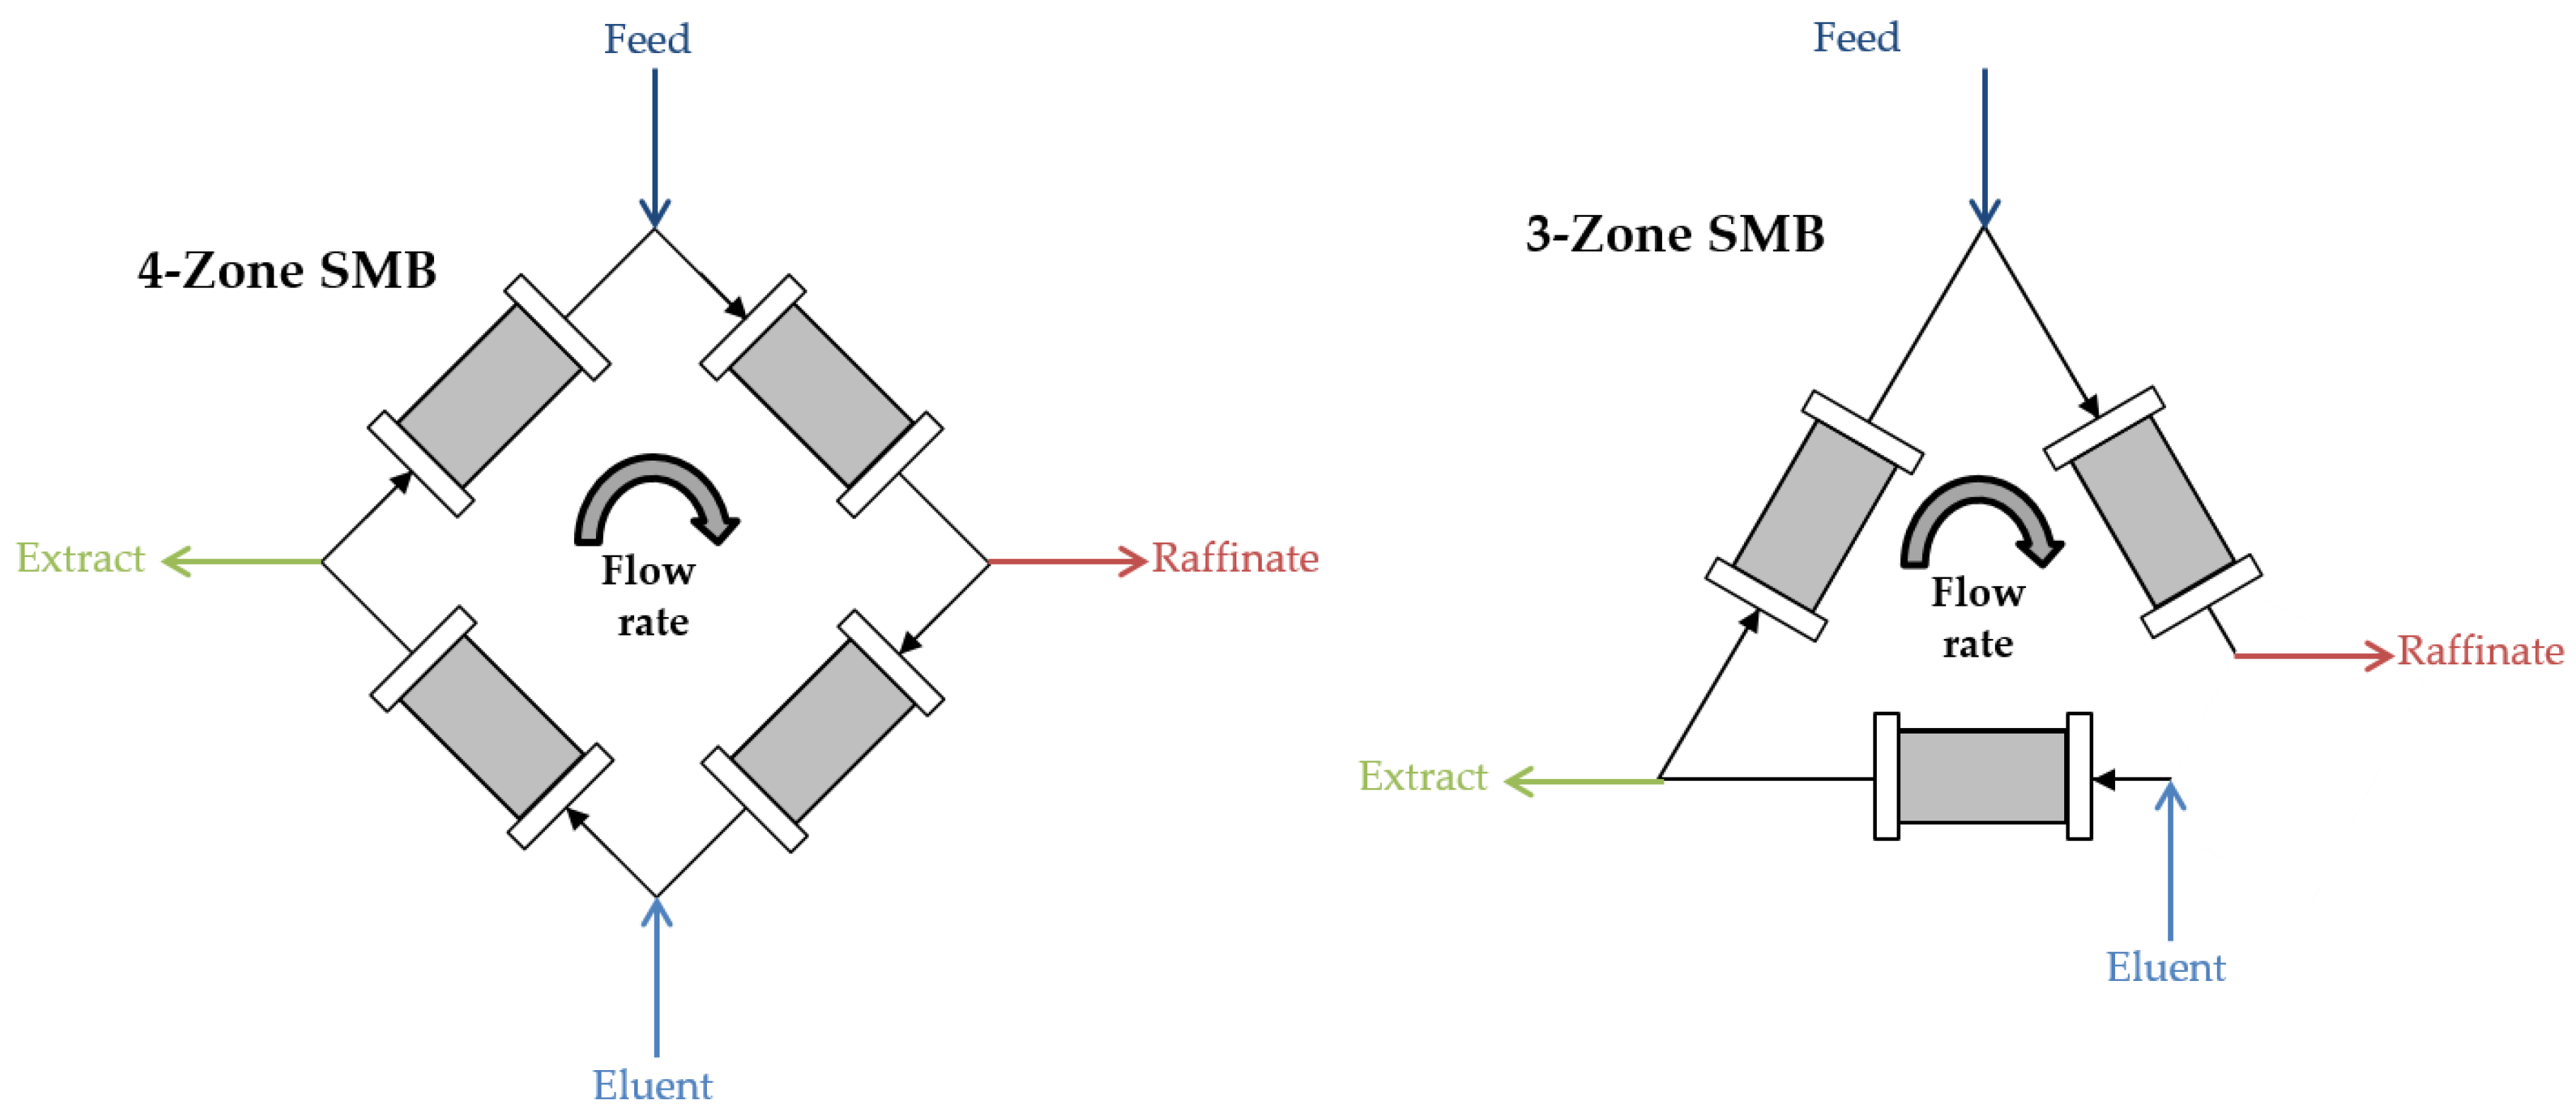
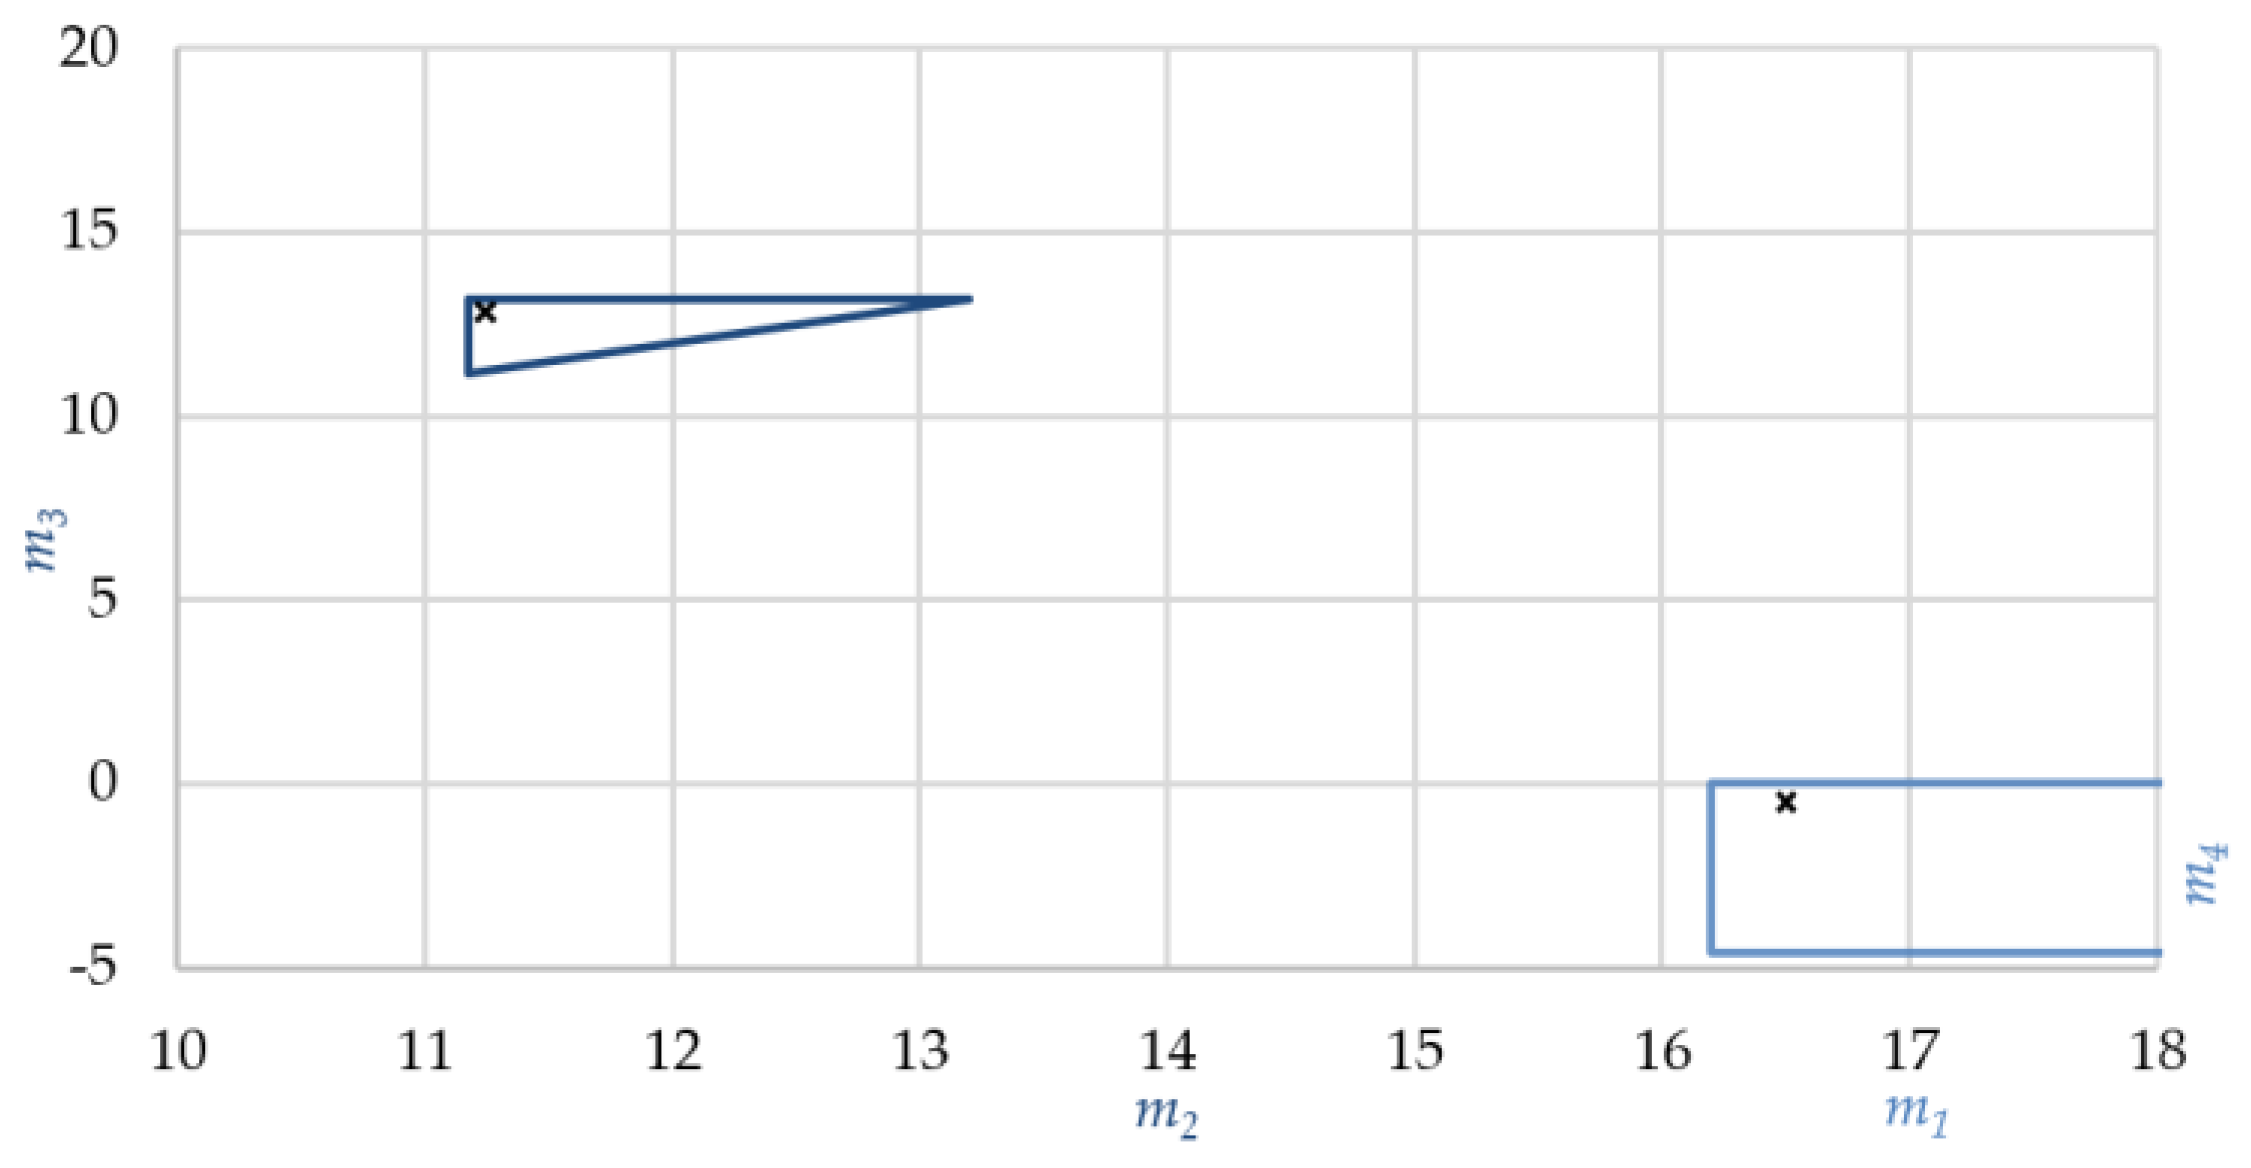
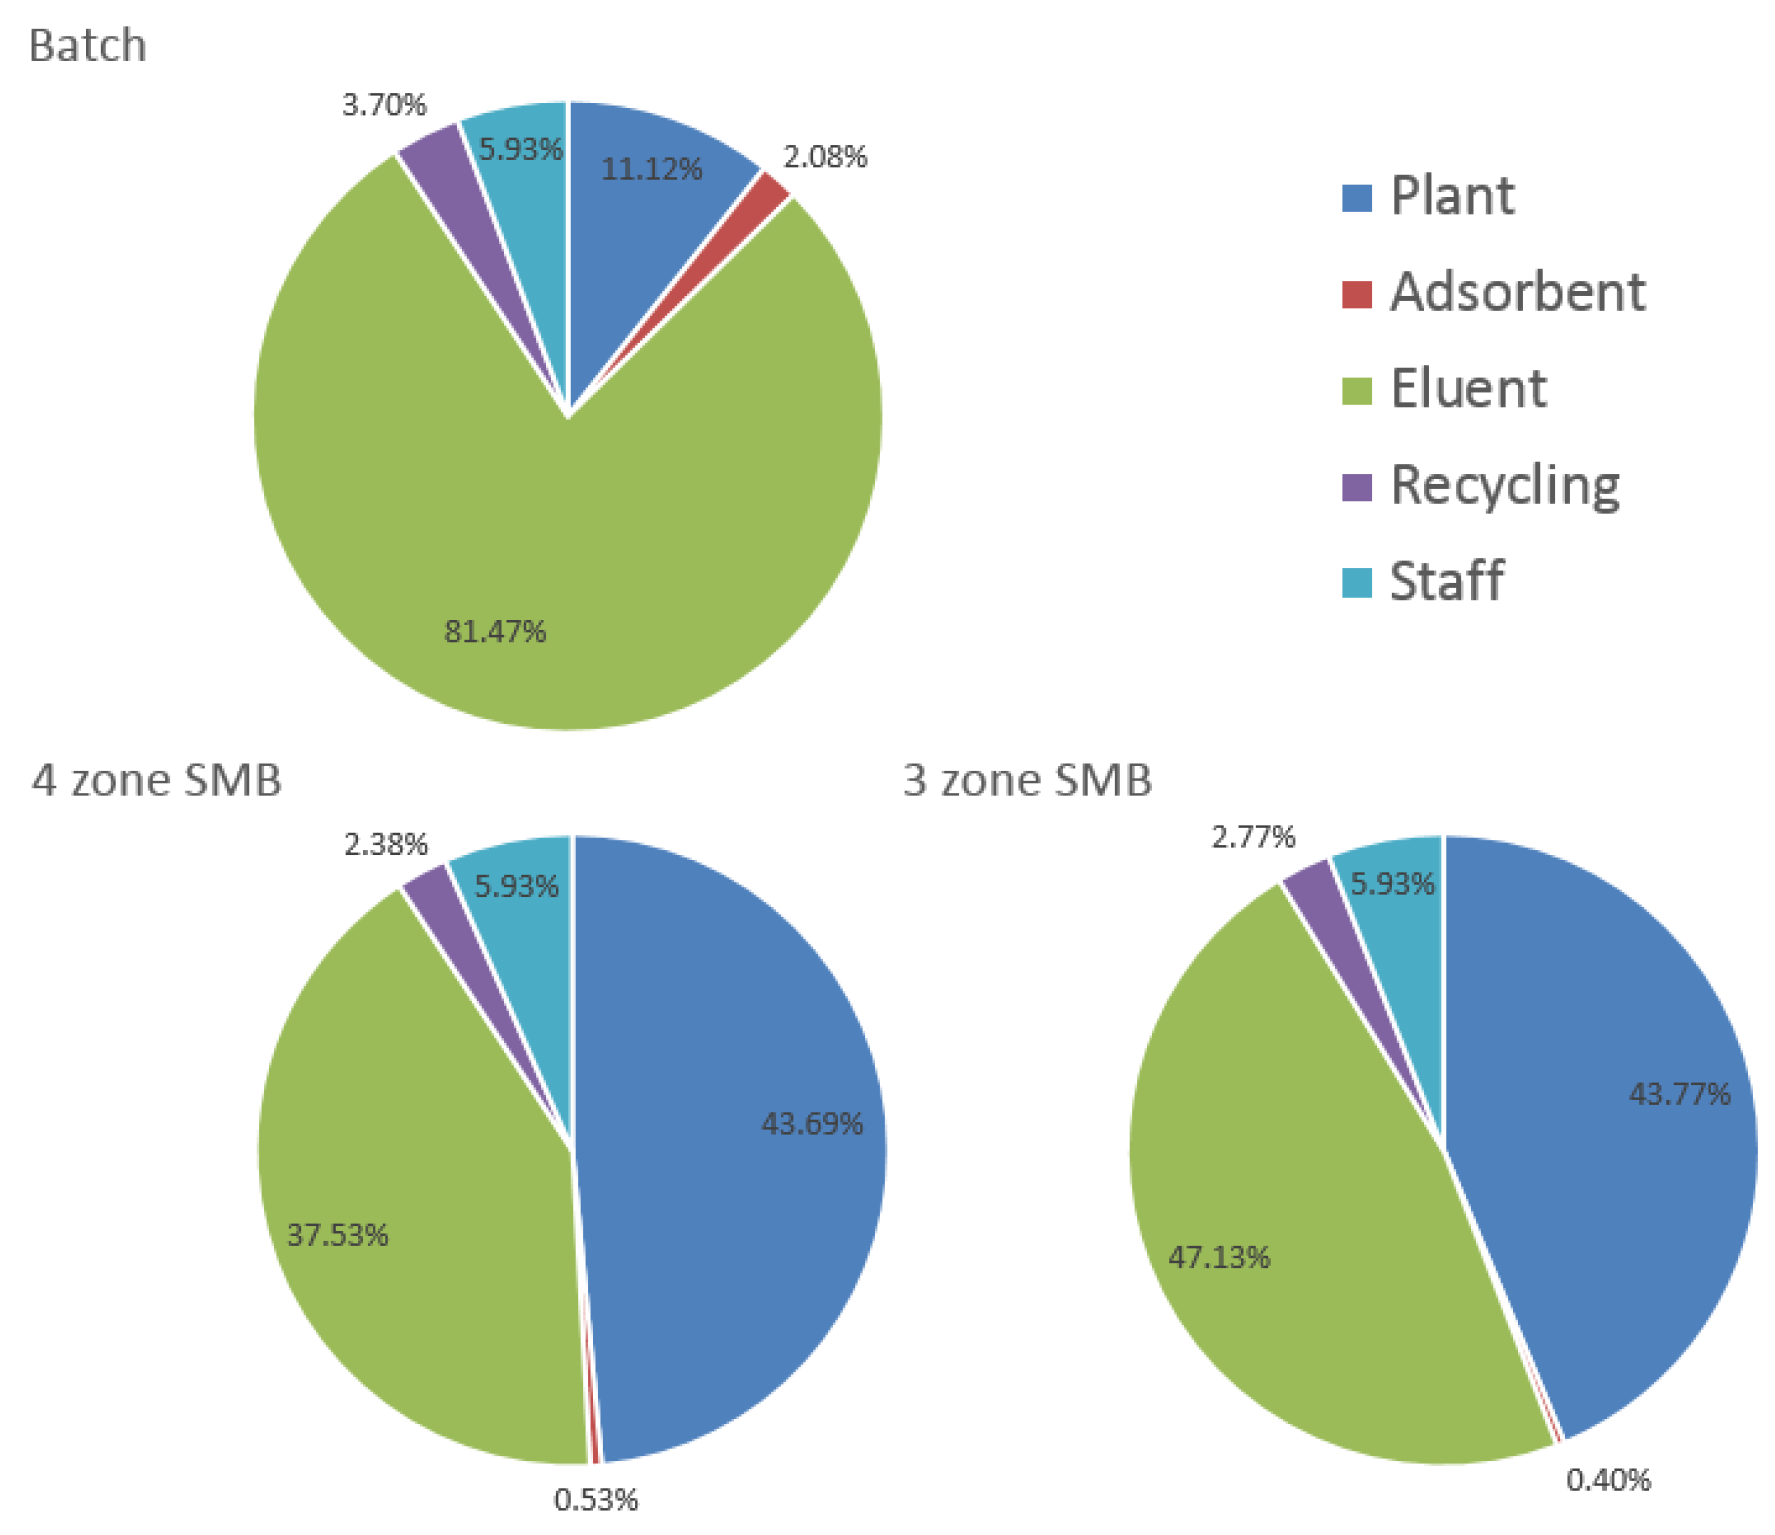
In a next step, process stability was investigated, an aspect which is important for the manufacturing operation in the pharmaceutical industry. Therefore, 120 runs were carried out. For the product fraction, the cut points from fractionation studies were chosen, which had been determined earlier. The product fraction should have a purity >97% and a yield >80%. In Figure 12, all 120 runs are shown as chromatograms. In this figure, a displacement of the SC2 peak (side component peak no. 2 at approximately 12 min retention time) can be seen. To specify this displacement, the first moment from 10 to 15 min is shown in Figure 13a. When the deviation of the first moments of the chromatograms exceed 5% compared to the starting run, the column should be replaced, or cleaned and regenerated. In this experiment, this point was reached after 61 runs. At run 62, a new column was used. The cut points for the product fractions had to be adapted because of this replacement. The yield of each fraction can be seen in Figure 13b. Between some runs (e.g., between run 28 und 29), the cut points were adapted, which resulted in a significantly increased yield.
In Figure 13b, the runs which were out of the specification are highlighted as red dots. The runs which were within specification have an average yield of 93.9% at a purity of >99%. All the runs, which were out of specification, had a yield of under 80% because of the displacement of the components. Because of the high purity, the red dotted runs could be used although the yield was under the 80% threshold. With this, an overall yield of 91.9% from all 120 runs was achieved.

3.4. SMB Design

To increase productivity and lower purification costs, a continuous separation of the artemisinin should be developed [40]. This process will be designed based on the developed batch process [41]. The SMB separation requires a binary split of the components, which was chosen in front of the artemisinin peak (see Figure 14). For the separation, some key components were defined. The first key component was the component which eluted first (SC0). The second key component eluted in front of the target component (SC1). The next component was the artemisinin. Finally, the SC2 component had the highest interaction with the stationary phase. In SMB chromatography separation, the raffinate should contain the impurities between SC0 and SC1 [30,42]. The extract should contain artemisinin and SC2. Despite the significant peak of SC2, the extract fractions provided a purity of over 99%. This could also be shown in a hydrogen-nuclear magnetic resonance (H-NMR) analysis of the SC2 peak. From these observations, it can be concluded that the SC2 component had a very high extinction coefficient but a low concentration. Because of this, the extract which contained all the artemisinin and the complete mass of SC2 achieved a purity higher than 99%.
Established isotherm determination methods like frontal analysis or the perturbation method are not feasible for this feed composition because of the high number of different components [43]. To design SMB chromatography processes and operation points, the Henry coefficients are determined first experimentally. Therefore, a low concentrated injection was carried out. This approach should lead to linear isotherms for the SMB chromatography step that was used.
The split of the SMB separation was between SC1 and the artemisinin. Because of this, the Henry coefficients of SC1 and artemisinin were used to calculate the triangle operation region of the maximal feed flow. Normally, the same coefficients are used for the regeneration area, however in this case there were more than two components relevant for the process design. For the regeneration of the eluent (the fourth zone), none of the fastest moving components should be allowed to leave this zone. In our case, this was the SC0 impurity, which eluted with the dead volume, so the m4 had to be less than zero. The lower boundary was −4.6 due to the zero volumetric flow in zone 4.
For the regeneration of the stationary phase, which was the first zone, all the bound components had to elute out of this zone. The component with the greatest interaction, which was SC2, was selected. The flow ratio of the first zone (m1) had to be more than 16.2. The upper limit was given by the maximum linear flow rate. The measured Henry coefficients with the resulting separation triangle, including the regeneration area for the 4-zone SMB, are shown in Figure 15. At the left side, there is the separation triangle (dark blue) and in the bottom right corner is the regeneration area (light blue).
The resulting process parameters are shown in Table 6. For the batch process, overall yield and purity of the 120 runs performed were considered.
In this table, it can be seen that the purity of all three separation processes is the same. In contradiction to the purity, the yields of the different SMB processes are higher compared to the batch process. At the same time, productivity can be increased. Because of the reduction of the fourth zone, productivity can be further increased. Due to the use of the SMB process, the eluent consumption can be reduced. In comparison between the 4- and the 3-zone SMB, no regeneration of eluent was carried out and the entire recycle flux was moved out of the system with the raffinate stream. Because of this, the eluent consumption was higher than in a 4-zone SMB process.
Due to the increase of productivity, column dimensions can be reduced. To produce about three tons of artemisinin per year, the column dimensions for batch processes are approximately 70 cm for the inner diameter. In case of the SMB process, the same product was purified with 3 or 4 columns with 20 cm i.d., respectively. The heights of the columns were equal. Based on the process parameters of the three processes investigated, the best purification step cannot be identified a priori. In the case of a process, where the adsorbent media costs dominate the overall costs, the 3-zone SMB would be the best choice. In case of high eluent costs, 4-zone SMB would be more efficient, because of the eluent regeneration. For a final analysis, the production costs of the three processes was compared.
The cost distribution is shown in Figure 16. In the diagram of the batch process, it can be seen that the eluent consumption dominates the purification costs. Cost distribution of the SMB processes is dominated by about half of the costs generated by the amortization of the plant equipment investment cost. Approximately the other half results from the eluent consumption. Due to the high percentage of the plant investment amortization, there is a potential to lower the purification costs through the economy of scale effect. In conclusion, a purification using the batch process results in specific costs of 0.47 €/gartemisinin compared to 0.45 €/gartemisinin in the 3-zone SMB and 0.40 €/gartemisinin in the 4-zone SMB process. In the stage of process development and design which is used in this article, no significant difference is shwon.

4. Conclusions

The purification of artemisinin by chromatography is possible with a batch process as well as an SMB process. The artemisinin used for the chromatography purification was pre-purified by precipitation followed by liquid-liquid extraction. A detailed description of the LLE method development is given in (Part II). The application of SMB technology is also possible either in a classical 4-zone SMB or the modified 3-zone SMB. In all three cases, an isocratic separation using a mixture of 85 vol % n-hexane and 15 vol % ethyl acetate on a normal phase column packing was used.
Compared to the batch process, the productivity could be increased by a factor of 1.7 and the eluent consumption could be reduced by a factor of 1.5 in the case of the 4-zone SMB. A 3-zone SMB setup increases productivity by a factor of 2.3 but reduces eluent consumption only by a factor of 1.3. By all three chromatography process alternatives designed, the artemisinin purity could be enriched from 84% initially to over 99%. The cost estimation analysis shows that the purification costs of SMB and the batch process are very similar. If higher production amounts would be needed for the marketing of anti-malaria drugs, an SMB chromatography process operation has the highest potential because the purification costs are dominated by the investment costs, which decrease relatively with economy of scale. In the next part (Part IV), a formulation as well as a purification using crystallization will be discussed.

Author Contributions

F.M. conceived and designed the chromatographic experiments as well as wrote the paper. M.S. designed the solid-liquid extraction experiments. A.S. designed the liquid-liquid extraction experiments and M.H. designed the crystallization experiments. J.S. substantively revised the work and contributed the materials. J.S. is responsible for conception and supervision.

Funding

The authors would like to thank the Bundesministerium für Wirtschaft und Energie (BMWi), especially M. Gahr (Projektträger FZ Jülich), for funding this scientific work. We also acknowledge the financial support obtained from the Deutsche Forschungsgemeinschaft (DFG) in Bonn, Germany (project Str 586/4-2).

Acknowledgments

The authors gratefully acknowledge the support of the ITVP lab-team. In addition, they would like to thank J. Namyslo from the IOC for performing the H-NMR analysis. Special thanks are also addressed to Helena Sach for excellent laboratory work and fruitful discussions.

Conflicts of Interest

The authors declare no conflict of interest.

Symbols and Abbreviations

εVoidage
EMigration distance of the eluent, cm
k i Capacity factor of component I
miVolumetric phase ratio
RMigration distance of the reference, cm
RfRetention factor
RstRetention factor for standard substance
SMigration distance of the substance, cm
t0Dead time of the column, min
tR,IRetention time of component I, min
tTCycle time, min
V j ˙ Volumetric flow in zone j, mL/min
VcolumnVolume of the column, mL
CVColumn volume
ELSDEvaporation light scattering detector
HPLCHigh performance liquid chromatography
i.d.Inner diameter
IPAIsopropyl alcohol
LLELiquid-liquid extraction
n.a.Not applicable
NMRNuclear magnetic resonance
NPNormal phase
PHWEPressurized hot water extraction
RPReversed phase
SCSide component
TLCThin-layer chromatography
UVUltra violet
VISVisible
SLESolid-liquid extraction
SMBSimulated moving bed

References

  1. Kassing, M.; Jenelten, U.; Schenk, J.; Hänsch, R.; Strube, J. Combination of rigorous and statistical modeling for process development of plant-based extractions based on mass balances and biological aspects. Chem. Eng. Technol. 2012, 35, 109–132. [Google Scholar] [CrossRef]
  2. Ditz, R.; Gerard, D.; Hagels, H.; Igl, N.; Schäffler, M.; Schulz, H.; Stürtz, M.; Tegtmeier, M.; Treutwein, J.; Strube, J.; et al. Phytoextracts-Proposal towards a New Comprehensive Research Focus; DECHEMA: Frankfurt, Germany, 2017. [Google Scholar]
  3. Sixt, M.; Strube, J. Systematic and model-assisted evaluation of solvent based- or pressurized hot water extraction for the extraction of Artemisinin from Artemisia annua L. Processes 2017, 5, 86. [Google Scholar] [CrossRef]
  4. Sixt, M.; Koudous, I.; Strube, J. Process design for integration of extraction, purification and formulation with alternative solvent concepts. C. R. Chim. 2016, 19, 733–748. [Google Scholar] [CrossRef]
  5. Koudous, I.; Both, S.; Gudi, G.; Schulz, H.; Strube, J. Process design based on physicochemical properties for the example of obtaining valuable products from plant-based extracts. C. R. Chim. 2014, 17, 218–231. [Google Scholar] [CrossRef]
  6. Koudous, I. Stoffdatenbasierte Verfahrensentwicklung zur Isolierung von Wertstoffen aus Pflanzenextrakten; Shaker: Aachen, Germany, 2017; ISBN 978-3-8440-5271-8. [Google Scholar]
  7. Both, S. Systematische Verfahrensentwicklung für pflanzlich basierte Produkte im regulatorischen Umfeld; Shaker: Aachen, Germany, 2015; ISBN 978-3-8440-3727-2. [Google Scholar]
  8. Chemat, F.; Strube, J. Green Extraction of Natural Products—Theory and Practice; Wiley VCH: Weinheim, Germany, 2015; ISBN 978-3-527-67682-8. [Google Scholar]
  9. Josch, J.P.; Both, S.; Strube, J. Characterization of feed properties for conceptual process design involving complex mixtures. Chem. Ing. Tech. 2012, 84, 918–931. [Google Scholar] [CrossRef]
  10. Sixt, M.; Schmidt, A.; Mestmäcker, F.; Huter, M.J.; Uhlenbrock, L.; Strube, J. Systematic and model-assisted process design for the extraction and purification of Artemisinin from Artemisia annua L.—Part I: Conceptual process design and cost estimation. Processes 2018, 6, 161. [Google Scholar] [CrossRef]
  11. Schmidt, A.; Sixt, M.; Huter, M.; Mestmäcker, F.; Strube, J. Systematic and model-assisted process design for the extraction and purification of Artemisinin from Artemisia annua L.—Part II: Model-based design of agitated and packed columns for multistage extraction and scrubbing. Processes 2018, 6, 179. [Google Scholar] [CrossRef]
  12. Huter, M.; Schmidt, A.; Mestmäcker, F.; Sixt, M.; Strube, J. Systematic and model-assisted process design for the extraction and purification of Artemisinin from Artemisia annua L.—Part IV: Crystallization. Processes 2018, 6, 181. [Google Scholar] [CrossRef]
  13. Poole, C. Instrumental Thin-Layer Chromatography; Elsevier Science: Burlington, MA, USA, 2014; ISBN 978-0-12-417223-4. [Google Scholar]
  14. Zlatkis, A.; Kaiser, R.E. HPTLC-High Performance Thin-Layer Chromatography; Elsevier Scientific Pub. Co.: New York, NY, USA, 1977. [Google Scholar]
  15. Horváth, Z.; Horosanskaia, E.; Lee, J.W.; Lorenz, H.; Gilmore, K.; Seeberger, P.H.; Seidel-Morgenstern, A. Recovery of Artemisinin from a complex reaction mixture using continuous chromatography and crystallization. Org. Process Res. Dev. 2015, 19, 624–634. [Google Scholar] [CrossRef]
  16. O’Brien, A.G.; Horváth, Z.; Lévesque, F.; Lee, J.W.; Seidel-Morgenstern, A.; Seeberger, P.H. Continuous synthesis and purification by direct coupling of a flow reactor with simulated moving-bed chromatography. Angew. Chem. Int. Ed. 2012, 51, 7028–7030. [Google Scholar] [CrossRef] [PubMed]
  17. Malwade, C.R.; Qu, H.; Rong, B.-G.; Christensen, L.P. Conceptual process synthesis for recovery of natural products from plants: A case study of Artemisinin from Artemisia annua. Ind. Eng. Chem. Res. 2013, 52, 7157–7169. [Google Scholar] [CrossRef]
  18. Qu, H.; Christensen, K.B.; Fretté, X.C.; Tian, F.; Rantanen, J.; Christensen, L.P. Chromatography-crystallization hybrid process for Artemisinin purification from Artemisia annua. Chem. Eng. Technol. 2010, 33, 791–796. [Google Scholar] [CrossRef]
  19. Malwade, C.R.; Buchholz, H.; Rong, B.-G.; Qu, H.; Christensen, L.P.; Lorenz, H.; Seidel-Morgenstern, A. Crystallization of Artemisinin from chromatography fractions of Artemisia annua extract. Org. Process Res. Dev. 2016, 20, 646–652. [Google Scholar] [CrossRef] [Green Version]
  20. Ndocko Ndocko, E.; Bäcker, W.; Strube, J. Process design method for manufacturing of natural compounds and related molecules. Sep. Sci. Technol. 2008, 43, 642–670. [Google Scholar] [CrossRef]
  21. Lapkin, A.A.; Plucinski, P.K.; Cutler, M. Comparative assessment of technologies for extraction of artemisinin. J. Nat. Prod. 2006, 69, 1653–1664. [Google Scholar] [CrossRef] [PubMed]
  22. ElSohly, H.N.; Croom, E.M.; El-Feraly, F.S.; El-Sherei, M.M. A large-scale extraction technique of Artemisinin from Artemisia annua. J. Nat. Prod. 1990, 53, 1560–1564. [Google Scholar] [CrossRef]
  23. Juza, M. Development of a high-performance liquid chromatographic simulated moving bed separation from an industrial perspective. J. Chromatogr. A 1999, 865, 35–49. [Google Scholar] [CrossRef]
  24. Juza, M.; Mazzotti, M.; Morbidelli, M. Simulated moving-bed chromatography and its application to chirotechnology. Trends Biotechnol. 2000, 18, 108–118. [Google Scholar] [CrossRef]
  25. Mazzotti, M. Equilibrium theory based design of simulated moving bed processes for a generalized Langmuir isotherm. J. Chromatogr. A 2006, 1126, 311–322. [Google Scholar] [CrossRef] [PubMed]
  26. Rodrigues, A.E. Simulated Moving Bed Technology—Principles, Design and Process Applications; Butterworth-Heinemann: Oxford, UK, 2015; ISBN 978-0-12-802024-1. [Google Scholar]
  27. Storti, G.; Masi, M.; Carrà, S.; Morbidelli, M. Optimal design of multicomponent countercurrent adsorption separation processes involving nonlinear equilibria. Chem. Eng. Sci. 1989, 44, 1329–1345. [Google Scholar] [CrossRef]
  28. Zobel, S.; Helling, C.; Ditz, R.; Strube, J. Design and operation of continuous countercurrent chromatography in biotechnological production. Ind. Eng. Chem. Res. 2014, 53, 9169–9185. [Google Scholar] [CrossRef]
  29. Mazzotti, M.; Storti, G.; Morbidelli, M. Optimal operation of simulated moving bed units for nonlinear chromatographic separations. J. Chromatogr. A 1997, 769, 3–24. [Google Scholar] [CrossRef]
  30. Jermann, S.; Mazzotti, M. Three column intermittent simulated moving bed chromatography: 1. Process description and comparative assessment. J. Chromatogr. A 2014, 1361, 125–138. [Google Scholar] [CrossRef] [PubMed]
  31. Jermann, S.; Alberti, A.; Mazzotti, M. Three-column intermittent simulated moving bed chromatography: 2. Experimental implementation for the separation of Tröger’s Base. J. Chromatogr. A 2014, 1364, 107–116. [Google Scholar] [CrossRef] [PubMed]
  32. Jermann, S.; Meijssen, M.; Mazzotti, M. Three column intermittent simulated moving bed chromatography: 3. Cascade operation for center-cut separations. J. Chromatogr. A 2015, 1378, 37–49. [Google Scholar] [CrossRef] [PubMed]
  33. Jork, H.; Funk, W.; Fischer, W.; Wimmer, H. Dünnschicht-Chromatographie. Reagenzien und Nachweismethoden, 1st ed.; Wiley-VCH: Weinheim, Germany, 1990. [Google Scholar]
  34. Lapkin, A.A.; Walker, A.; Sullivan, N.; Khambay, B.; Mlambo, B.; Chemat, S. Development of HPLC analytical protocols for quantification of artemisinin in biomass and extracts. J. Pharm. Biomed. Anal. 2009, 49, 908–915. [Google Scholar] [CrossRef] [PubMed]
  35. Liu, Y.; lü, H.; Pang, F. Solubility of Artemisinin in seven different pure solvents from (283.15 to 323.15) K. J. Chem. Eng. Data 2009, 54, 762–764. [Google Scholar] [CrossRef]
  36. Nti-Gyabaah, J.; Gbewonyo, K.; Chiew, Y.C. Solubility of Artemisinin in different single and binary solvent mixtures between (284.15 and 323.15) K and NRTL interaction parameters. J. Chem. Eng. Data 2010, 55, 3356–3363. [Google Scholar] [CrossRef]
  37. Lapkin, A.A.; Peters, M.; Greiner, L.; Chemat, S.; Leonhard, K.; Liauw, M.A.; Leitner, W. Screening of new solvents for artemisinin extraction process using ab initio methodology. Green Chem. 2010, 12, 241–251. [Google Scholar] [CrossRef]
  38. Wang, L.-H.; Song, Y.-T.; Chen, Y.; Cheng, Y.-Y. Solubility of Artemisinin in Ethanol + Water from (278.2 to 343.2) K. J. Chem. Eng. Data 2007, 52, 757–758. [Google Scholar] [CrossRef]
  39. Haynes, R.K.; Fugmann, B.; Stetter, J.; Rieckmann, K.; Heilmann, H.-D.; Chan, H.-W.; Cheung, M.-K.; Lam, W.-L.; Wong, H.-N.; Croft, S.L.; et al. Artemisone—A Highly Active Antimalarial Drug of the Artemisinin Class. Angew. Chem. 2006, 118, 2136–2142. [Google Scholar] [CrossRef]
  40. Strube, J.; Altenhöner, U.; Meurer, M.; Schmidt-Traub, H. Optimierung kontinuierlicher Simulated-Moving-Bed-Chromatographie-Prozesse durch dynamische Simulation. Chem. Ing. Tech. 1997, 69, 328–331. [Google Scholar] [CrossRef]
  41. Subramanian, G. Biopharmaceutical Production Technology, 1st ed.; Wiley-VCH: Weinheim, Germany, 2012; ISBN 978-3-527-33029-4. [Google Scholar]
  42. Seidel-Morgenstern, A.; Keßler, L.C.; Kaspereit, M. New Developments in Simulated Moving Bed Chromatography. Chem. Eng. Technol. 2008, 31, 826–837. [Google Scholar] [CrossRef]
  43. Strube, J. Technische Chromatographie. Auslegung, Optimierung, Betrieb und Wirtschaftlichkeit; Shaker: Aachen, Germany, 2000. [Google Scholar]
Figure 1. Basic process design for plant-based substances (LLE, liquid-liquid extraction) [10].
Processes 06 00180 g001
Figure 2. Structure of artemisinin [10].
Processes 06 00180 g002
Figure 3. Chromatogram of a thin-layer chromatography (TLC) plate.
Processes 06 00180 g003
Figure 4. Schematic process setup for the 4-zone simulated moving bed (SMB) and the reduced 3-zone SMB (acc. to [30,31,32]).
Processes 06 00180 g004
Figure 5. Evaluation of the TLC plates using the example of methanol/isopropyl alcohol (30/70). On the left side of the plate is a standard artemisinin solution; on the right side is the extract sample. In part (a) is the normal chromatogram, in part (b) is the chromatogram under ultra violet (UV) light (at 254 nm), in part (c) under 366 nm, and part (d) after treatment with vanillin–phosphoric acid reagent.
Processes 06 00180 g005
Figure 6. TLC chromatograms of the Nano-Sil CN/UV plate with solvents (a) ethanol/water (70/30 vol %), (b) acetonitrile/water (50/50 vol %), and (c) acetone/water (70/30 vol %).
Processes 06 00180 g006
Figure 7. Comparison of three different reference solutions (at 190 nm) on LiChrospher 300 CN column in RP-Mode, elution from 100 vol % buffer in gradient mode (10 column volume (CV)) to acetonitrile/methanol (95/5 vol %).
Processes 06 00180 g007
Figure 8. Comparison of isocratic runs with n-hexane/ethyl acetate on LiChrospher Si60 (a) 85/15 vol % and (b) 90/10 vol %, detection at 254 nm.
Processes 06 00180 g008
Figure 9. Retention time of artemisinin and SC2 over the ethyl acetate content. On the secondary axis is the corresponding solubility of the artemisinin.
Processes 06 00180 g009
Figure 10. Artemisinin reference and different loading volumes of the extraction sample on the LiChroPrep self-packed column at 254 nm.
Processes 06 00180 g010
Figure 11. Fractionation of the artemisinin with different loadings: (a) 4 mL and (b) 25 mL.
Processes 06 00180 g011
Figure 12. Chromatograms of the 120 runs with an injection volume of 10 mL at 254 nm.
Processes 06 00180 g012
Figure 13. (a) Mean residence time of side component 2 from 10 to 15 min and (b) yield of the 120 runs.
Processes 06 00180 g013
Figure 14. Binary split for the SMB separation and declaration of the key components.
Processes 06 00180 g014
Figure 15. Working diagram for the 4-zone SMB separation where x represents the working point. The separation triangle is in dark blue and the regeneration area is in light blue.
Processes 06 00180 g015
Figure 16. Break down of costs for the batch and the two SMB processes.
Processes 06 00180 g016
Table 1. Solvents used for the thin-layer chromatography (TLC) screening.
PlateSolvents
Nano-Sil CN/UVAcetone, acetonitrile, butyl acetate, ethanol, ethyl acetate, isopropyl alcohol, methanol, methyl-tert-butyl ether, n-heptane, n-hexane, tetrahydrofurane, toluene, water
Silica gel 60 RP-18 F254SAcetone, acetonitrile, butyl acetate, ethanol, ethyl acetate, n-heptane, n-hexane, water
Silica gel 60 F254SAcetone, acetonitrile, butyl acetate, ethanol, ethyl acetate, isopropyl alcohol, methanol, n-hexane
Table 2. Solvents used for the high performance liquid chromatography (HPLC) Screening.
ColumnSolvents
LiChrospher 300 CNAcetone, acetonitrile, ethanol, methanol, water, phosphate buffer
PharmaPrep P100 RP-18eAcetone, acetonitrile, butyl acetate, ethanol, n-hexane, water
LiChrospher Si60Butyl acetate, ethyl acetate, ethanol, isopropyl alcohol, n-hexane, n-heptane, toluene
Table 3. Comparison of the solubility of artemisinin in some selected solvents.
SolventTemperature (K)Solubility (g/L)Reference
AcetoneAmbient temperature a242.2[18]
298.1532.1[35]
298.1531.6[36]
AcetonitrileAmbient temperature a267.7[18]
293.15157.7[37]
298.152.8[35]
298.159.7[36]
EthanolAmbient temperature a31.6[18]
303.1514.0[38]
298.1522.3[36]
Ethyl acetateAmbient temperature a153.2[18]
298.1542.3[35]
298.1539.4[36]
HexaneAmbient temperature a2.5[18]
293.151.8[37]
298.150.28[36]
Heptane298.150.25[36]
Isopropyl alcoholAmbient temperature a20.1[18]
MethanolAmbient temperature a46.8[18]
298.159.9[35]
298.159.7[36]
Toluene293.1590.7[37]
298.15141.6[35]
298.1590.7[36]
Water (pH 7.2)n.a.0.063[39]
a Ambient temperature not defined in the original paper.
Table 4. Eluent composition for the LiChrospher Si60 column; n.a, not applicable.
Eluent Consumptionk-Value for Artemisinin
n-heptane/butyl acetate (95/5 vol %)<0.01
n-heptane/ethanol (95/5 vol %)n.a.
n-heptane/IPA (10 CV gradient to 30 vol % IPA)4.76
n-hexane9.04
n-hexane/butyl acetate (70/30 vol %)<0.01
n-hexane/butyl acetate (95/5 vol %)n.a.
n-hexane/ethyl acetate (70/30 vol %)0.81
n-hexane/ethyl acetate (80/20 vol %)1.77
n-hexane/ethyl acetate (85/15 vol %)3.28
n-hexane/ethyl acetate (90/10 vol %)6.28
n-hexane/ethyl acetate (95/5 vol %)18.62
n-hexane/ethyl acetate (Gradient 5 vol % to 15 vol % ethyl acetate)n.a.
Table 5. Process parameter for different column loadings and fractions.
Loading (mL)Yield (%)Purity (%)Productivity (g·Lads−1·d−1)
497.8>9944.9
1096.697.9110.8
2593.897.7161.4
Table 6. Comparison of the process parameters for the batch process, the 3-zone SMB as well as the 4-zone SMB.
ParameterBatch Process4-Zone SMB3-Zone SMB
Yield (%)93.9100100
Purity (%)>99>99>99
Productivity (g·Lads−1·d−1)107.4190.6254.1
Eluent consumption (Ldes·gartemisinin−1)4.22.73.4

