Article

Systematic and Model-Assisted Process Design for the Extraction and Purification of Artemisinin from Artemisia annua L.—Part II: Model-Based Design of Agitated and Packed Columns for Multistage Extraction and Scrubbing

Institute for Separation and Process Technology, Clausthal University of Technology, 38678 Clausthal-Zellerfeld, Germany
*
Author to whom correspondence should be addressed.
Processes 2018, 6(10), 179; https://doi.org/10.3390/pr6100179
Submission received: 18 July 2018 / Revised: 19 September 2018 / Accepted: 26 September 2018 / Published: 2 October 2018

Abstract

:
Liquid-liquid extraction (LLE) is an established unit operation in the manufacturing process of many products. However, development and integration of multistage LLE for new products and separation routes is often hindered and is probably more cost intensive due to a lack of robust development strategies and reliable process models. Even today, extraction columns are designed based on pilot plant experiments. For dimensioning, knowledge of phase equilibrium, hydrodynamics and mass transport kinetics are necessary. Usually, those must be determined experimentally for scale-up, at least in scales of DN50-150 (nominal diameter). This experiment-based methodology is time consuming and it requires large amounts of feedstock, especially in the early phase of the project. In this study the development for the integration of LLE in a new manufacturing process for artemisinin as an anti-malaria drug is presented. For this, a combination of miniaturized laboratory and mini-plant experiments supported by mathematical modelling is used. System data on extraction and washing distributions were determined by means of shaking tests and implemented as a multi-stage extraction in a process model. After the determination of model parameters for mass transfer and plant hydrodynamics in a droplet measurement apparatus, a distributed plug-flow model is used for scale-up studies. Operating points are validated in a mini-plant system. The mini-plant runs are executed in a Kühni-column (DN26) for extraction and a packed extraction column (DN26) for the separation of side components with a throughput of up to 3.6 L/h, yield of up to 100%, and purity of 41% in the feed mixture to 91% after washing.

1. Introduction

More than 12,000 plants are currently known to form a active pharmaceutical ingredient. The demand for plant-based active ingredients is expected to increase further in the coming years. There is also an increasing need for natural food supplements and cosmetic products [1,2,3].
A very important plant-based active ingredient is the malaria drug Artemisinin, which is derived from annual mugwort (Artemisia annua L.). Its strengths are its excellent biocompatibility and efficacy against the multi-resistant pathogen of malaria tropica. Malaria is one of the most common and most serious infectious diseases in the tropics, which infects 216 million people each year with around 450,000 deaths each year. Optimized processes are necessary to ensure sufficient demand at affordable prices for all affected people. [1,2,4].
In this study, the purification of the annual mugwort extract after the solid-liquid extraction, which is discussed in detail in [5], and precipitation is shown. Therefore, a solvent screening and model parameter determination is shown. The most promising solvent system is transferred to mini-plant extraction columns to investigate the performance of extraction and scrubbing in multistage and to compare it to model predictions.
In a final step, the pure component is obtained either by preparative chromatography (part III of this series) or crystallization (part IV of this series).
The whole study, containing a conceptual process design, cost estimation, and a detailed investigation of solid-liquid extraction, liquid-liquid extraction, chromatography, and crystallization, has been split into five articles, as follows:
Part 0:
Sixt, M.; Strube, J. Systematic and model-assisted evaluation of solvent based- for pressurized hot water extraction for the extraction of Artemisinin from Artemisia annua L. Processes 2017, 5, 86, doi:10.3390/pr5040086 [5].
Part I:
Sixt, Schmidt et al. Systematic and model-assisted process design for the extraction and purification of Artemisinin from Artemisia annua L.—Part I: Conceptual process design and cost estimation. Processes 2018, 6, 161, doi:10.3390/pr6090161 [6].
Part II:
Schmidt, Sixt et al. Model-based design of agitated and packed columns for multistage extraction and scrubbing (this article);
Part III:
Mestmäcker, Schmidt et al. Systematic and model-assisted process design for the extraction and purification of Artemisinin from Artemisia annua L.—Part III: Chromatographic Purification. Processes 2018, 6, 180, doi:10.3390/pr6100180 [7];
Part IV:
Huter, Schmidt et al. Systematic and model-assisted process design for the extraction and purification of Artemisinin from Artemisia annua L.—Part IV: Crystallization. Processes 2018, 6, 181, doi:10.3390/pr6100181 [8].

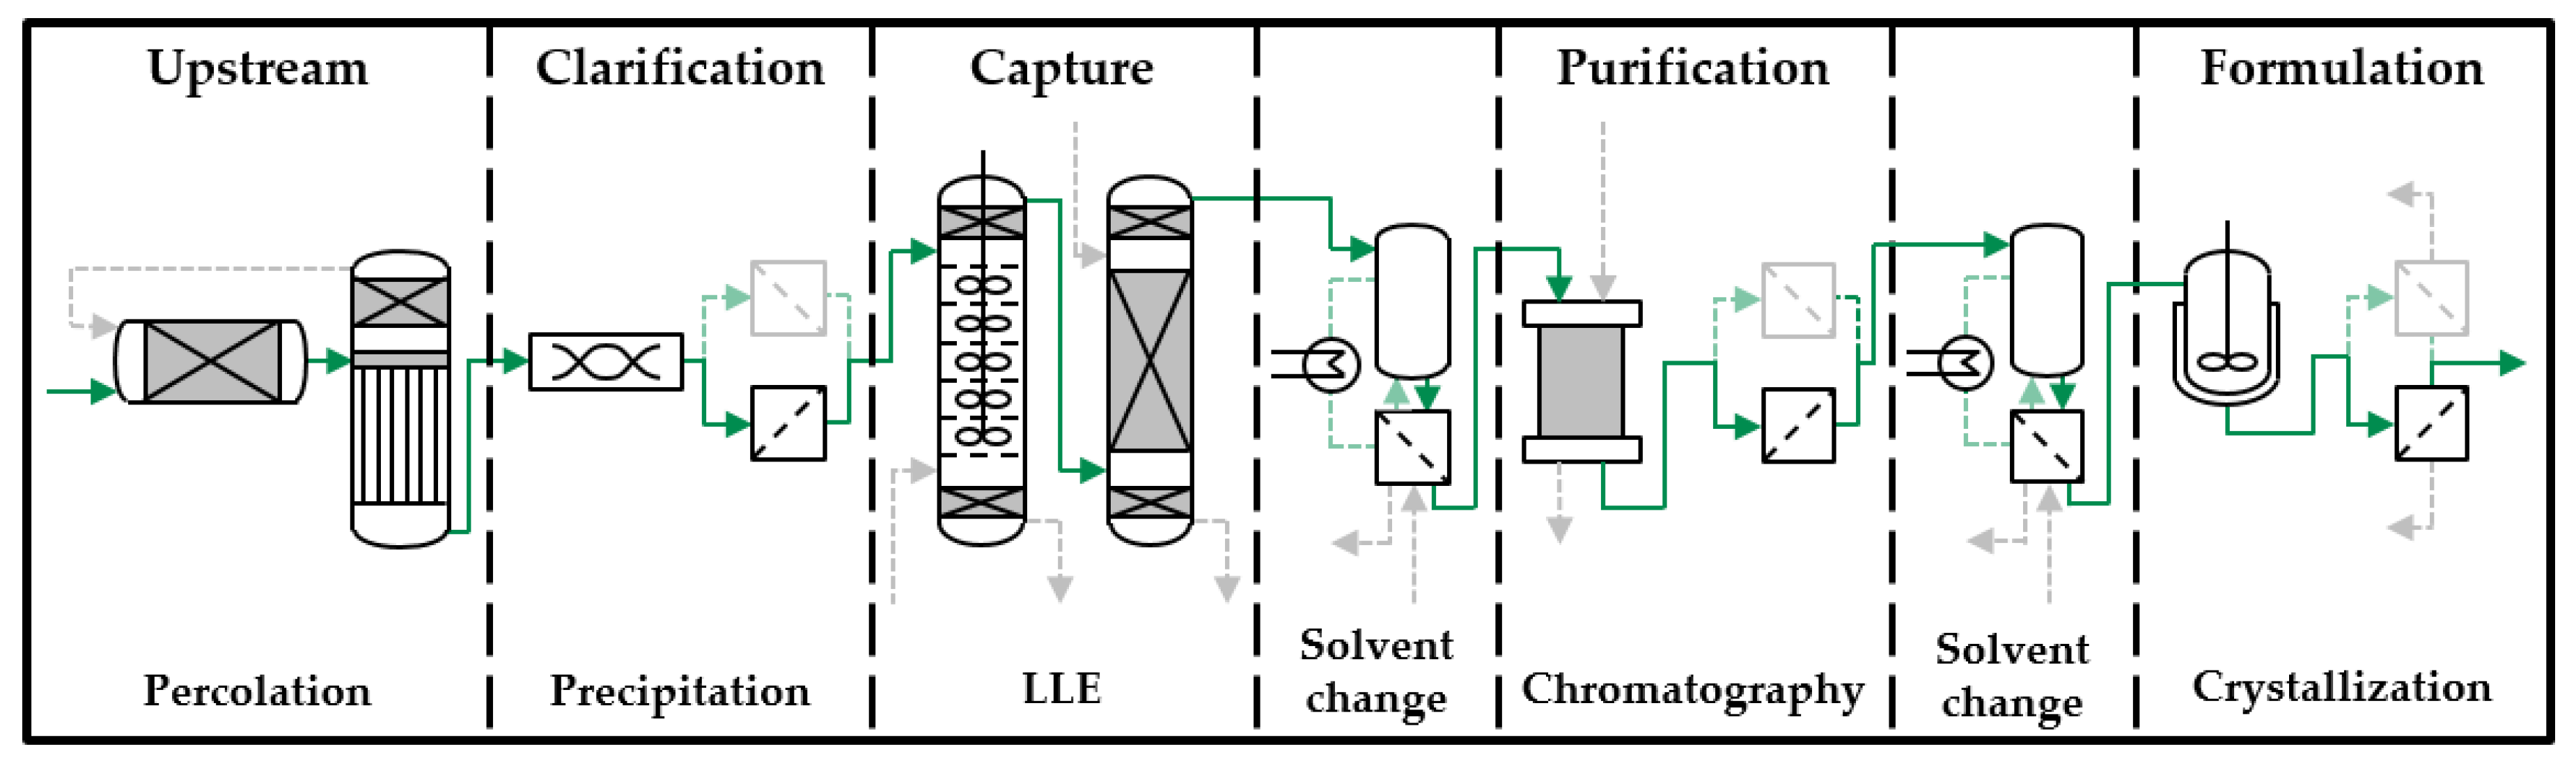
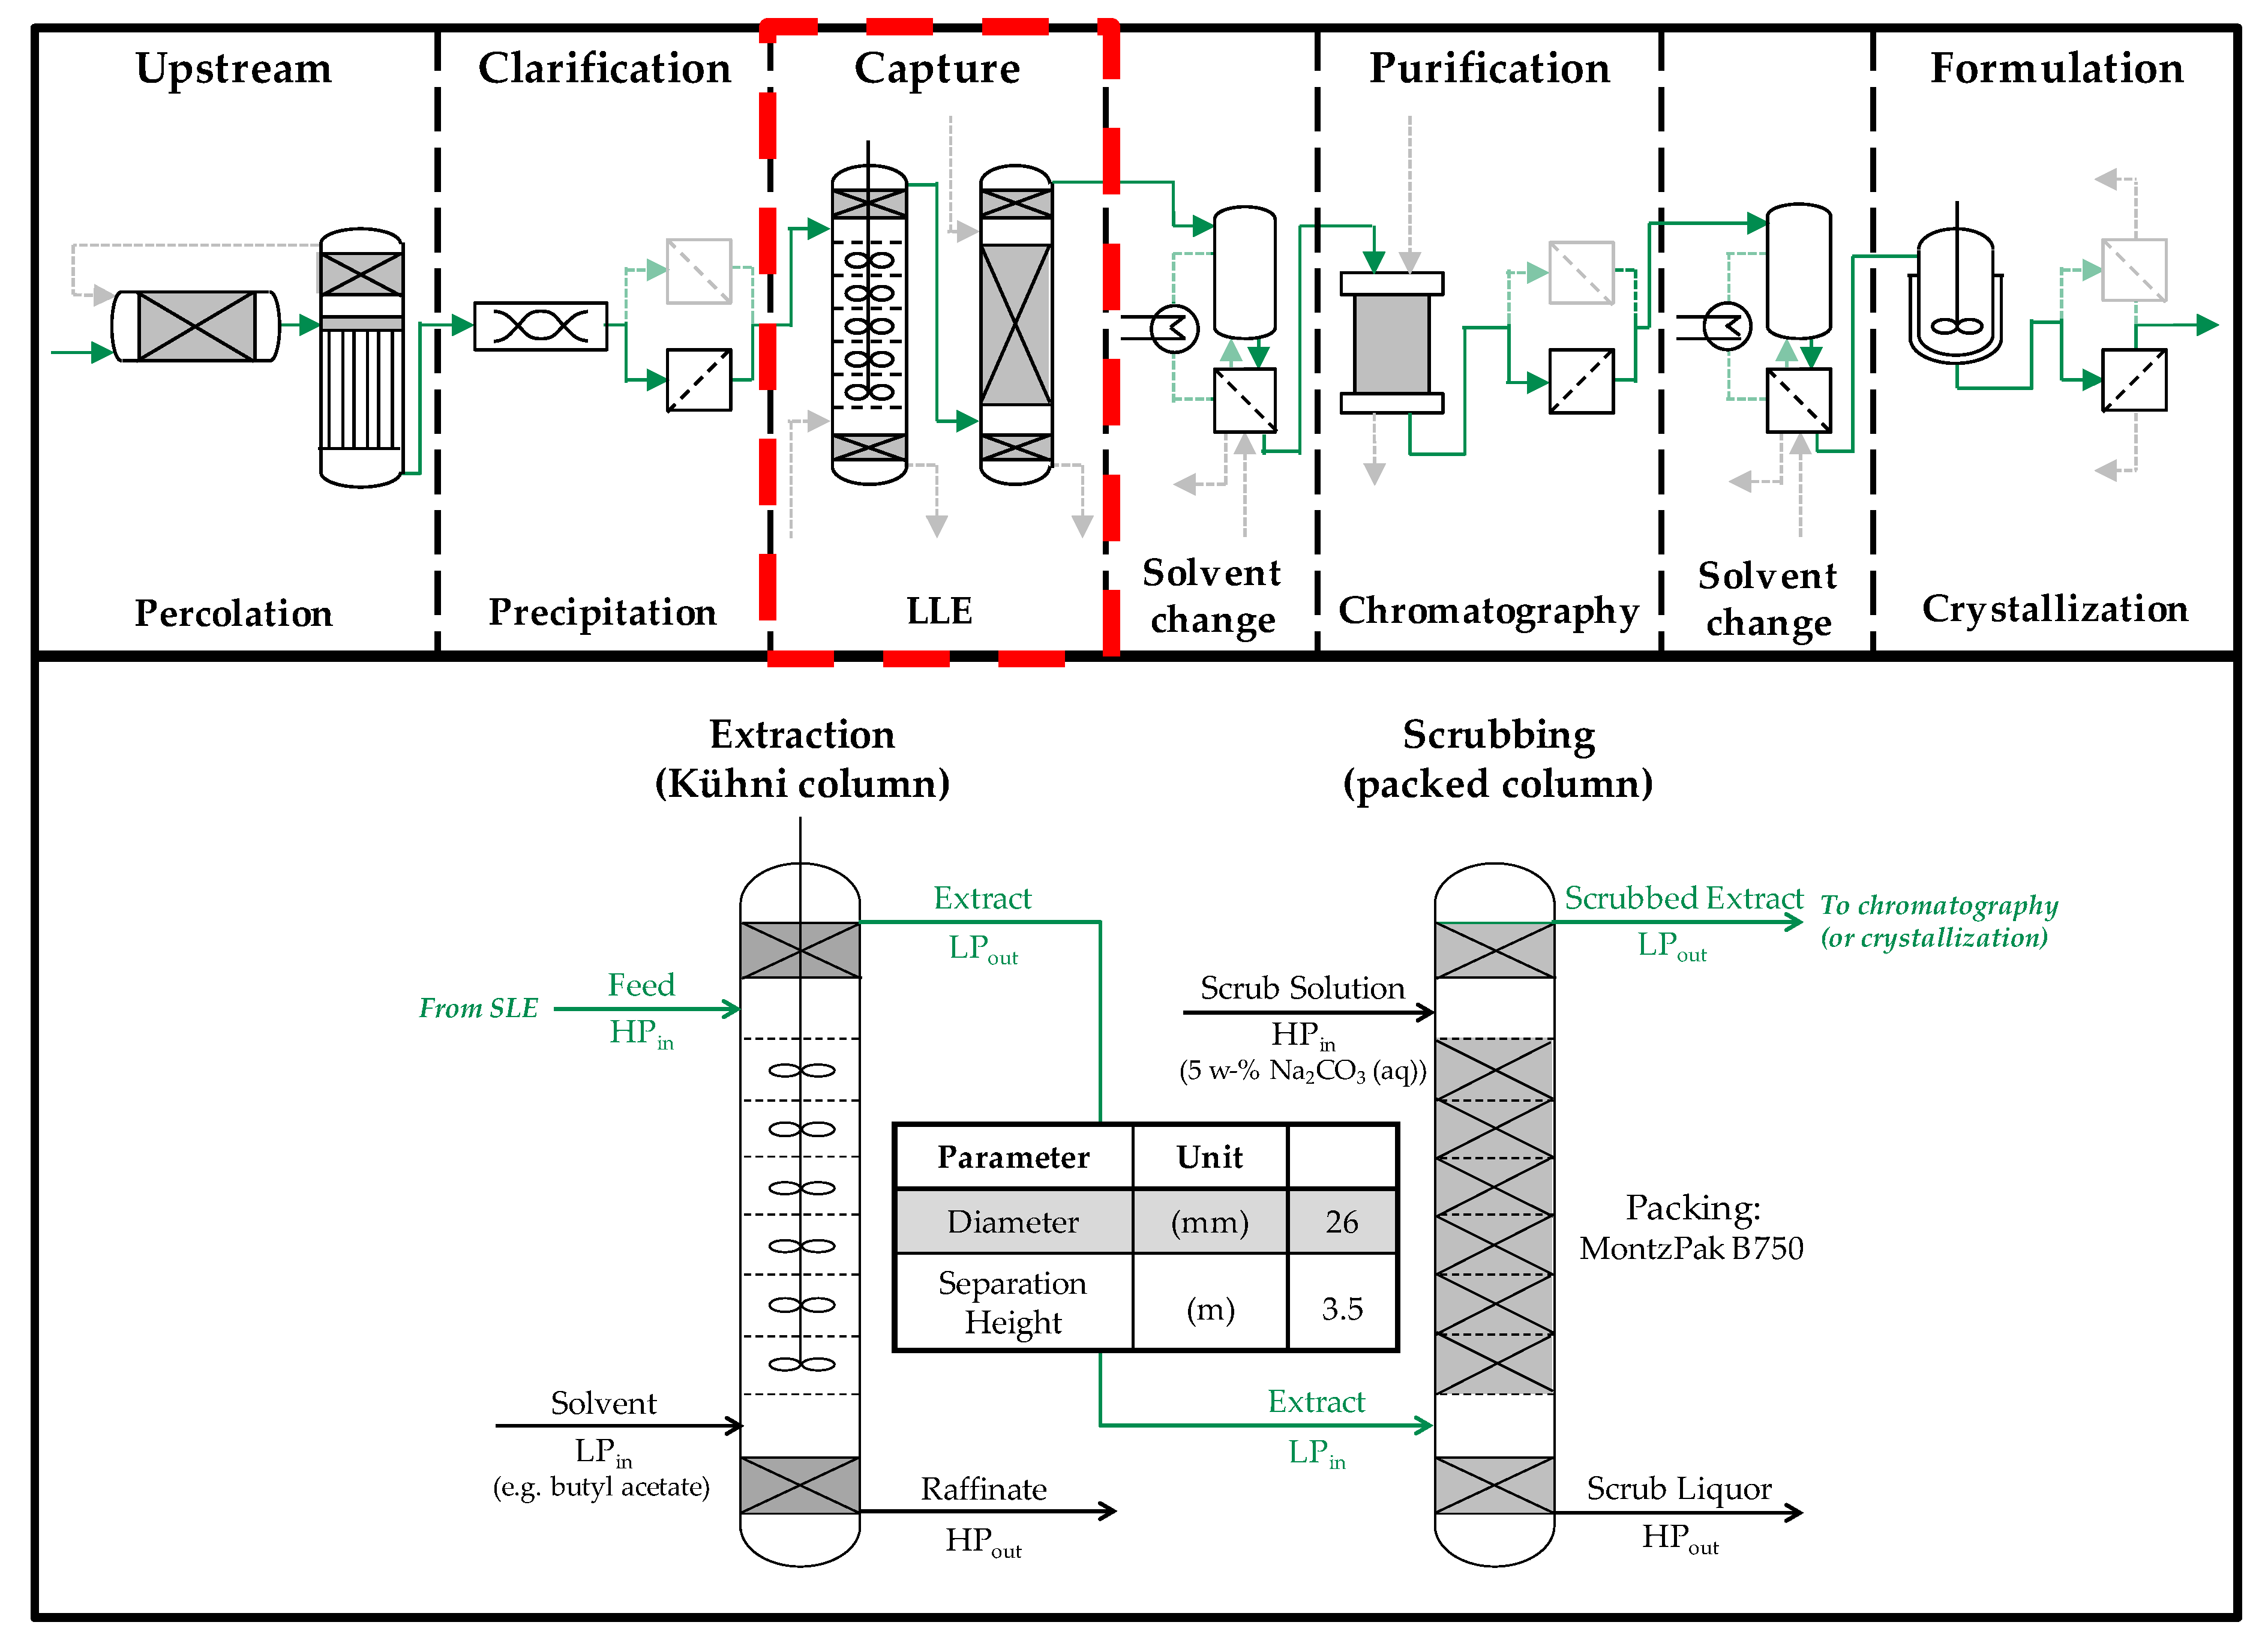
2. Model-Based Process Development Strategy

Time and resource-intensive laboratory and pilot plant experiments are still required for the design of extraction columns. Although the operating data thus obtained make it possible to use predictive process models for upscaling, empirical functions are still used due to the complex interactions of equilibrium, mass transport kinetics, and hydrodynamics. While offering a degree of safety, they only by chance lead to the optimum column [9,10].
To enable the model-based design of Liquid-liquid extraction (LLE) columns for highly non-ideal systems, there is a need for robust process development strategies. To broaden the availability of demonstrators of model-based process developments, a wide variety of substance combinations and solvent systems is continuously investigated, also with different extraction equipment. Examples are the utilization of ATPS (aqueous two-phase systems) for the extraction of botanicals or biologicals, such as monoclonal antibodies (mabs) in single or multi stage mixer-settlers and columns [11,12,13,14], the development and characterization of highly innovative prototypes, like membrane-supported liquid-liquid extractors [15,16] or model-based identification of the most efficient and sustainable purification strategy for strategic metals, like rare earth elements, by LLE-chromatography hybrid separation [17].

Distributed-Plug-Flow Model

In the axial dispersion model, mass transport at each element is overlapped by convection with dispersive backmixing. Mixing is regarded as a stationary process. This approach was first developed by Danckwerts to describe the adsorption of substances in chromatography columns. The approach of the axial dispersion model was taken up by many working groups and it was adapted or optimized for different column types [18,19,20,21]. With the increase in computing capacity at the end of the 1990s, computer-aided process simulation in the field of LLE developed reference to the work of Leistner [22,23,24] and Kolb [25] as examples.
The fundamental equations of the axial dispersion model consist of the transport equations for the continuous (see Equation (1)) and the dispersed phase (see Equation (2)):
c ˙ i c t = u c × c i c z + D a x , i   c × 2 c i c z 2 + k e f f × Φ ( 1 Φ ) × 6 d × ( c i d c i , E q   d )  
  c ˙ i d t = + u d × c i d z + D a x , i   d × 2 c i d z 2 + k e f f × 6 d × ( c i d c i , E q   d )  
In extraction columns, not only the flow velocity, but also the flow profile, has a significant influence on the separation performance. For several reasons, there is a deviation from the ideal plug flow due to back-mixing, which is also called dispersion. This leads to a broadening of the residence time distribution and thus to different contact times between the disperse and continuous phase [12,14]. The axial dispersion coefficient can be determined experimentally for the continuous and the disperse phase by tracer tests or by corresponding empirical correlations. For the continuous phase, various authors provide the approach in Equation (3):
  D a x c = u c × H c × ( C 1 + C 2 × ( D R × N u c ) × C 3 )  
In addition to the stirrer diameter (DR) and the stirrer speed (N), the equation also contains the constants (C1, C2 and C3). The corresponding coefficients can be selected according to the column type and its diameter.
  D a x d = 1 B o = 0.056 + 1.19 × 10 2 × ( d R × N u d ) 3.45  
The Steinmetz correlation, as can be seen in Equation (4), can be used for the axial dispersion coefficient of the disperse phase for Kühni columns [26].
An important aspect in the design of an extraction column is the cross-sectional load (L). This can be defined as follows while using the column cross-sectional area (AC) and the volume flows of the continuous (VC) and the disperse phase (VD):
  L = V D + V C A C  
By the simplified assumption that the dispersed phase consists of spherical drops, the volume-specific area (AS) can be expressed as follows in Equation (6):
  A S = 6 d  
To solve the corresponding differential equations, one initial value and two boundary conditions per equation are required. The boundary conditions of the closed or open vessel can be used here. The definition of these boundary conditions goes back to Danckwerts [27], therefore they are also called Danckwerts boundary conditions. With the closed vessel condition, it is assumed that an axial dispersion only takes place within the balance area. Only convective mass transport takes place beyond the boundaries of the discrete under consideration. It can be concluded from this that the concentration shortly before leaving the discrete corresponds to the concentration shortly after leaving the discrete [28]. The change in concentration at the end of the balance sheet area can therefore be formulated, as shown in Equation (7):
  c ( z = 0 ) z = 0  
With open-vessel boundary conditions, both convective mass transport and mass transport through dispersion take place. The dispersion does not end at the limit of the balance volume. Mathematically, this condition can be represented, as follows in Equation (8):
D a x × c ( z = 0 ) z = u × ( c ( z = 0 ) c i n )  

3. Materials and Methods

The solvents that are used for screening are butyl acetate, toluene, and MTBE (methyl tert-butyl ether). These three solvents are purchased from Merck KGaA (Darmstadt, Germany) with a purity (GC grade) of over 99.5%. For dilution, pure acetone (≥99% purity (GC grade) from Merck KGaA (Darmstadt, Germany) is used.
Butyl acetate for the column tests is purchased from ThermoFisher (Waltham, MA, USA) in technical grade purity of 99% (by GC).
The water for Na2CO3 scrubbing has been demineralised. The sodium carbonate that is used is purchased from Merck KGaA (Darmstadt, Germany) and has a purity of 99.9%.

3.1. Solid-Liquid Extraction and Precipitation

The annual mugwort is first crushed and then filled into a steel tube of 300 mm height and a diameter of 200 mm. In addition, it has two outlets and two frits, which serve as retainer for the extraction material. 5 kg of plant material is processed per batch.
The solvent selected for Solid-liquid extraction (SLE) is acetone from VWR (Darmstadt, Germany) and is pumped through the pipe with a LaPrep P130 from VWR. The volume flow rate is 2.5 L/h. Approx. 25 L acetone per batch are used for the extraction, which are collected in a container.
Concentration is carried out under vacuum by aid of a rotary evaporator from VWR. The water bath temperature is set to 45 °C. A pressure of 300 mbar is selected for the evaporation of the acetone.
This is followed by an anti-solvent precipitation. For this purpose, 5 mL/min water is added to the extract containing acetone with a LaPrep P130 from VWR (Darmstadt, Germany) while stirring, by which the chlorophyll aggregates are formed. The addition of high purity water (Sartorius arium) is carried out until a balanced mass ratio of 1:1 is achieved. Finally, the precipitated chlorophyll is separated from the SLE extract by filtration with GE Healthcare Life Science Whatman 2V Folded Filters (400 mm diameter).
High performance liquid chromatography (HPLC) analysis is used to determine the mass and concentration of the artemisinin extract that is produced. The position of these steps in the overall production chain can be seen in Figure 1.

3.2. Shaking Experiments

To determine the optimum solvent, shaking tests are carried out with the extract of the solid-liquid extraction and the possible solvents (butyl acetate, toluene, and MTBE) at different solvent ratios. The solvent ratio is defined, as follows:
  S o l v e n t   r a t i o =   m o r g . m a q .  
and is shown as fraction (e.g., a ratio of 0.25 as 1:4). 40 g of each mixture in different phase ratios are filled into 50 mL centrifugal vials followed by shaking for 15 min on a GFL (Burgwedel, Germany) orbital shaker at 100 rpm. After shaking, the samples rest for several hours until both phases have completely separated, and two clear liquid phases have formed. These are removed with a syringe and transferred into 1 mL HPLC vials. All samples, including those of the experiments that are described below, may have to be diluted with acetone before they can be analyzed by HPLC.

3.3. Droplet Measurement

The droplet measuring cell is controlled via a Labview user interface. It is possible to set the size of the droplets to be dispensed and the volume to be dispensed. These values are passed on to the respective syringe. Furthermore, the countercurrent can be adjusted via the pump speed. The times for droplet injection and collection, as well as the duration and start time of the countercurrent, is also set via the computer control.
For the evaluation of the rising velocity two marks are fixed on the glass cylinder of the rising section in a distance of 10 cm. The residence time of the droplet between the entry and exit of this area is measured manually and the corresponding speed is determined.
The droplet size is determined by taking a photo of a suspended droplet with a known volume and then evaluating it on the PC using ImageJ (Version 1.52e, 2018, National Institute of Mental Health, Bethesda, MD, USA).
For the investigation of mass transfer, droplets are repeatedly kept in suspension for the same time. These are then transferred into an HPLC vial, which requires approx. 150 µL per sample.

3.4. Batch-Settling Experiments

The settling experiments are used to determine the settling behavior and the time that is required for complete phase separation. For this purpose, 90 g of each mixture are prepared with a solvent ratio of 1:2. This mixture is filled into a 250 mL beaker and then mixed for two minutes with a four-blade stirrer at 400 rpm.
The phase separation after switching off the stirrer is recorded on video and then evaluated while using image software. Additional marks are attached to the beaker for different filling levels, between which the filling level can then be interpolated.

3.5. Column Experiments

The column experiments are carried out in two mini-plant columns; a stirred Kühni column and a pulsed, packed column. Both columns have a total volume of approx. 5 L with an effective separation height of 3.5 m. The diameter of the separating area is 26 mm. This results in an effective separation volume of about 2 L, slightly reduced by 8 vol% by the installations.
In the two settling areas at the bottom and top of the column there are fillers that accelerate coalescence and thus prevent the phases leaving the column through the wrong exit.
The stirrer of the Kühni column has 30 stirring units per meter in the separation area. There are six agitator blades each with a square area of 4 × 4 mm per segment. Sieve trays are placed between the stirrers to reduce the axial back-mixing of the column. The speed of the agitator is adjustable via the agitator at the top of the column.
The packed pulsed column has Montz B750 internals (Julius Montz GmbH, Hilden, Germany), the time distance between the pulses can be set between 0.5 and 10 s. The intensity of the pulsation piston can also be varied. In the experiments in this work, no pulsation is applied, since a sufficiently good mass exchange is achieved, even without pulsation.
Both columns can be controlled and measured via a Labview surface. The flow rate of the phases is adjusted by GALA type diaphragm pumps from ProMinent (Pittsburgh, PA, USA). The pressure surges caused by the pumps are absorbed by air tanks, so that a uniform volume flow is delivered to the column. Flow is measured by Proline Promass 80A Coriolis flowmeters from Endress+Hauser (Reinach, Switzerland).
The first column of the first liquid-liquid extraction is filled with the SLE extract before the test, as this is the continuous phase. In the subsequent Na2CO3 scrubbing, the salt solution is the heavy continuous phase. The flowsheet of the described procedure and the position of the extraction and scrubbing stages in the overall production chain are shown in Figure 2.

3.6. Determination of the Concentration Profile

Both extraction columns each have nine locations for taking samples that are distributed over the column height. The first one is below the inlet of the light phases, the next seven between the inlets of the two phases at an even distance of approx. 0.5 m.
Samples can be taken with syringes via valves consisting of a seal, tubes, and a tube clamp. The average volume drawn is 3 mL.
The tests are carried out until a stationary state is reached. However, the duration of the test should be at least one hour. This time ensures that the concentration profile can be measured four times per experiment. The samples that are taken are diluted if necessary and artemisinin concentration is evaluated by HPLC analysis.

3.7. Determination of the Disperse Phase Hold-Up

Two different methods are available for the hold-up measurements of the experiments. The first is a disruptive method that can only be performed at the end of a series of experiments. The other is a theoretically continuous method that can record the hold-up in the column at any time.
In the disruptive method, the height of the phase boundary is marked at the end of the experiment. The inlets of the two phases are then closed and further outflow of the dispersed phase is prevented immediately. Then, the entire disperse phase is collected at the top of the column.
The volume of the light phase after switching off is measured. The continuous phase is pumped into the column until the phase boundary has reached its original height. The volume discharged in relation to the effective separation volume corresponds to the hold-up.
Another method applied allows for a continuous recording of the hold-up. It is assumed that the volume difference, from the dispersed phase received so far and the dispersed phase in the product tank, must be in the column. The volume accumulated at the top of the column during the experiment must be subtracted from this result.
V L P , H U = V L P , i n V L P , o u t V L P , T o p  
This measurement is carried out until a stationary state is reached. After that, the hold-up in the column does not change any more.

3.8. Analytics

The analysis of artemisinin by HPLC is perfomed on an Elite LaChrom® device equipped with an Evaporation Light Scatting Detector (ELSD) Alltech® 3300 (Grace®, Columbia, SC, USA). The analytical column is a PharmPrep® RP18 250 mm × 4 mm i.d. by Merck® (Merck KGaA, Darmstadt, Germany) operated at 25 °C. The eluents are acetonitrile (VWR®, Darmstadt, Germany) and water (Sartorius® arium® pro, Göttingen, Germany) 60/40 in isocratic mode at 1 mL/min flow. The injection volume is 10 μL and all the samples are passed through a 0.2 μm syringe filter. The evaporator temperature of the ELSD is set to 36 °C and the air flow is 1.6 mL/min. Calibration is performed with an external standard ordered from CfM Oskar Tropitzsch (Marktredwitz, Germany) over a range from 1 g/L to 0.001 g/L. The basis of the HPLC analysis protocol can be found in Lapkin et al. [29].
Acetone that is used for dilution is weighed on a microbalance of the type LA 310S from Sartorius. Mass-related dilution can be converted into a volumetric dilution via the densities.
The samples are evaluated for concentration, purity, distribution coefficient, and separation factor. The purity P is defined in all experiments as the area of the artemisinin peak in the ELSD chromatogram divided by the total area of the chromatogram minus the dead time signal.
P = A A r t A t o t a l A d e a d t i m e  
Fourier-transform infrared (FTIR) spectrometer type Equinox 55 from FTIR Bruker® alpha (Billerica, MA, USA) is used to determine the phase composition after column extraction. The infrared spectra from 750 to 4000 nm are recorded and evaluated with the OPUS software. (Version 6.5, Bruker, Billerica, MA, USA, 2017) Calibrations must be made for the three substances to be analyzed. For this purpose, solutions with known concentrations are prepared. Between sample measurements, both the lens and slide must be cleaned with ethanol and then wiped dry to avoid possible interference.
The results in the model parameter section are all obtained in triplicates. The results of the column experiments are obtained in duplicates. Deviations are based on standard deviations that were obtained by the triplicate and duplicate runs.

4. Results and Discussion

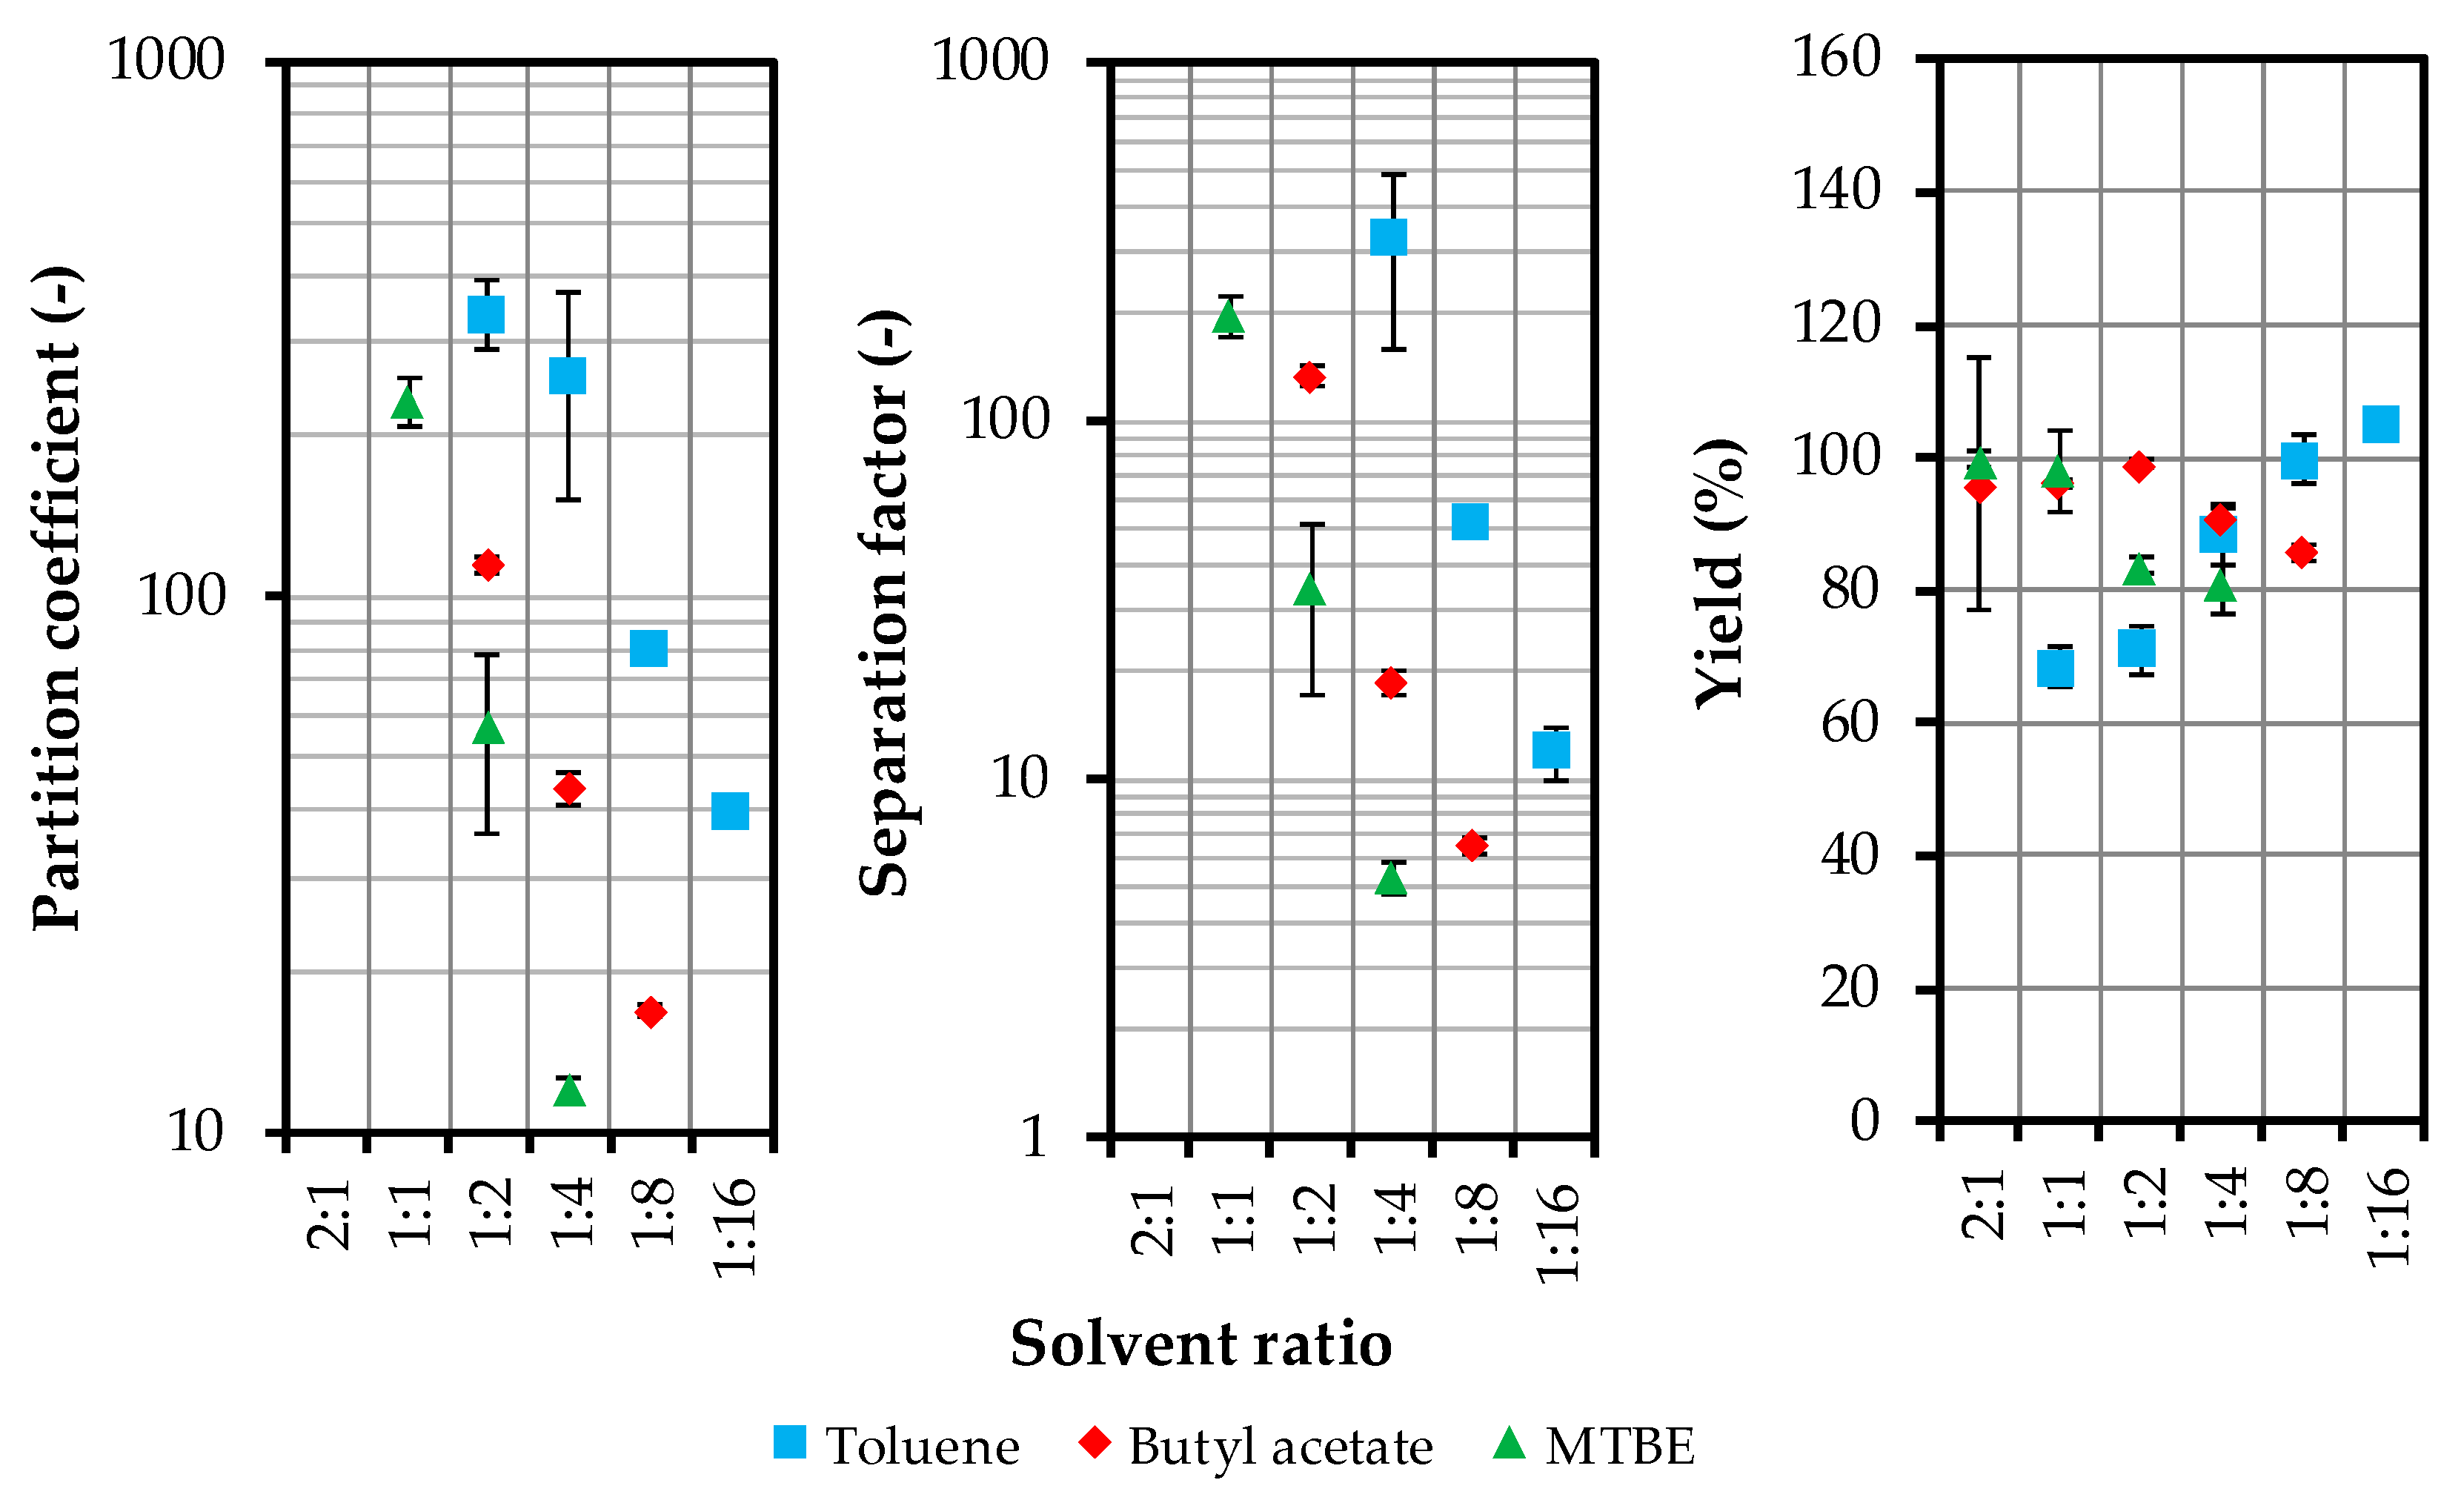
4.1. Solvent Selection and Model Parameter Determination

Three solvents that were suitable for liquid-liquid extraction with the extract of solid-liquid extraction (SLE extract) were initially considered. These are toluene, ethyl acetate, and dichloromethane. Ethyl acetate was excluded due to the small mixing gap with water and acetone. This small mixing gap allows for only a low phase ratio and thus hardly any concentration of artemisinin. Furthermore, dichloromethane was excluded as a solvent due to its toxicity in combination with its very low boiling point at 42 °C. Toluene was therefore the solvent of choice due to the large mixing gap with water and acetone and the high boiling point.
For solvent screening in this work, alternatives in the form of n-butyl acetate (hereinafter referred to as BAC) and MTBE (methyl tert-butyl ether) were picked to replace the two excluded solvents. Butyl acetate has a larger mixing gap with water and acetone when compared to ethyl acetate (EtOAc) and thus enables a lower solvent ratio. MTBE is less volatile and it has a higher boiling point than dichloromethane.
For scrubbing with an aqueous saline solution following the initial extraction column, a scrubbing solution containing 5 wt.-% Na2CO3 has been found, which meets all the requirements. Here, investigations are carried out with regard to the solvent ratio and multistage operation of the process.

4.1.1. Distribution and Separation Factor

The lowest solvent ratios for this process can be achieved with toluene. A significantly higher proportion of water and acetone can be dissolved in MTBE. With toluene a minimum solvent ratio of 1:16 is possible, with butyl acetate 1:8 and with MTBE only 1:4.
In the following shaking tests, the solvent ratios of 2:1, 1:1, 1:2, 1:4, and as far as possible 1:8 and 1:16 were examined. A low solvent ratio allows for a higher concentration, assuming that artemisinin is completely transferred to the solvent phase. Furthermore, for this assumption, the slope of the tie-lines must be similar in all systems, which is the case here.
In all experiments, the volume of the solvent phase increases, as acetone in particular transitions into the solvent phase. The SLE extract, which consists of equal amounts of acetone and water, has the lowest solubility in toluene. This is the reason for the high partition coefficients with toluene. The distribution coefficients are shown in Figure 3 in logarithmic representation for the individual solvent ratios.
All distribution coefficients have values >10, since artemisinin is very poorly soluble in the water/acetone phase, as compared to the solvent phase. The solubility in the raffinate phase is further reduced by the extraction of acetone. Furthermore, the mass transfer of artemisinin can be accelerated by the extraction of acetone.
The major errors in the high solvent ratios of toluene and MTBE are due to the very low concentrations of artemisinin in the heavy phase, which has a direct effect on the distribution coefficient and the separation factor.
MTBE is excluded as a possible solvent based on the results of the shaking tests. It offers the lowest separation factors and distribution coefficients and the mixing gap with water and acetone is very small when compared to toluene and butyl acetate. Finally, MTBE is a volatile substance with a comparatively low boiling point that is close to 55 °C. Thus, only toluene and butyl acetate remain as suitable solvents for the next investigations.
The continuous phase of the second liquid-liquid extraction step is a 5 wt.-% aqueous Na2CO3 solution. Shaking tests with a solvent ratio of 2:1 and 1:2 were carried out and results are described below.
The purity of the extract after scrubbing with a solvent ratio of 2:1 is very high with over 60%. This is due to the already high purity of the SLE extract. The purity can be increased to over 91% with a higher ratio of the scrubbing solution. At a solvent ratio of 1:2, a slightly lower purity of 89% is achieved. The artemisinin concentration in the scrubbed extract is however significantly higher at over 3 g/L in the case of the smaller solvent ratio.
In a second stage with fresh Na2CO3 solution the purity cannot be significantly increased. In all experiments, no loss of artemisinin occured. Furthermore, no artemisinin is detectable in the heavy product phase, because the non-polar artemisinin is not soluble in the polar Na2CO3 solution.

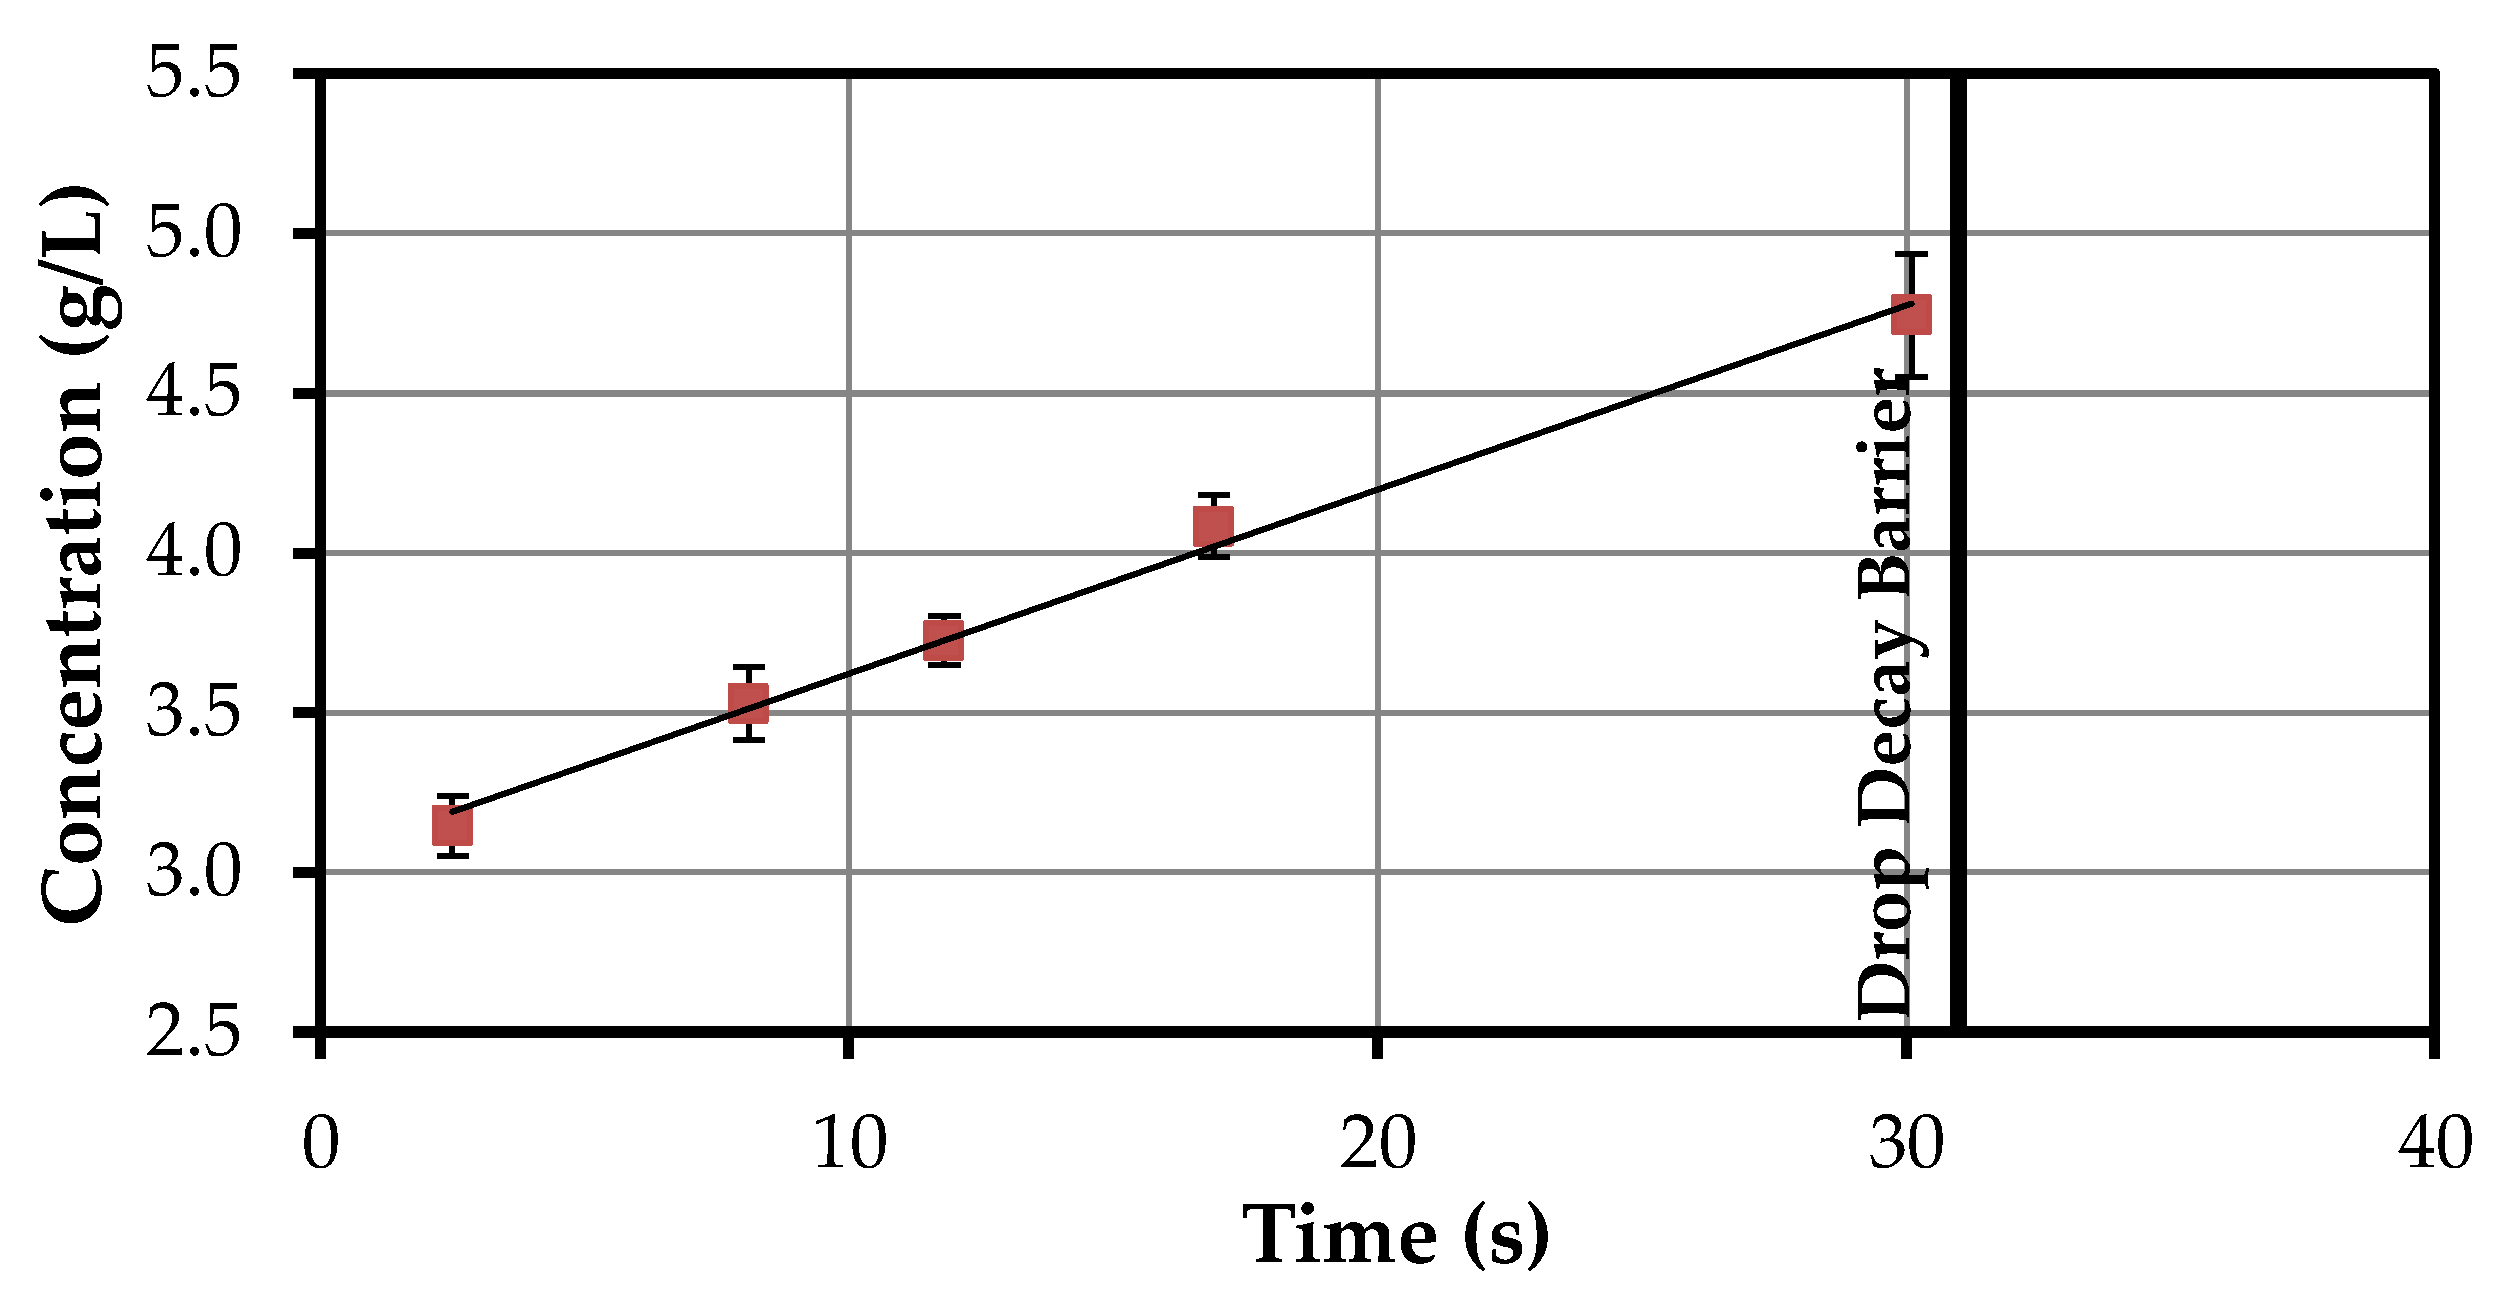
4.1.2. Volumetric Mass Transfer Coefficient

The equilibrium concentration is required to determine the volumetric mass transfer coefficient. This is determined by measuring a constant concentration with a sufficiently long residence time in the droplet measuring cell.
  k L · a = 1 τ × c I   c 0 c I c 0  
The disperse phase of these experiments is butyl acetate, the continuous phase is the extract from the SLE. The results from the experiments to determine the kL·a value are shown in Figure 4.
Droplets with a volume of 8 µL are added. This volume increases with increasing residence time due to the extraction of acetone. From a critical size onwards, the droplets disintegrate. The concentration increases linearly until the time of decay. However, the increase in the first two and a half seconds is much stronger. The time of decay in this experiment is about 35 s.
As the amount of acetone in the droplet increases over time, the solubility of artemisinin in acetone is assumed as the maximum value and thus the equilibrium concentration, which is 242 g/L [30]. The time difference (residence time) and concentration difference that is required to calculate the kL·a value is determined between the individual measuring points and calculated for the part of linear increase. This allows for the volume-related mass transfer coefficient to be determined four times for the five measuring points (Table 1).

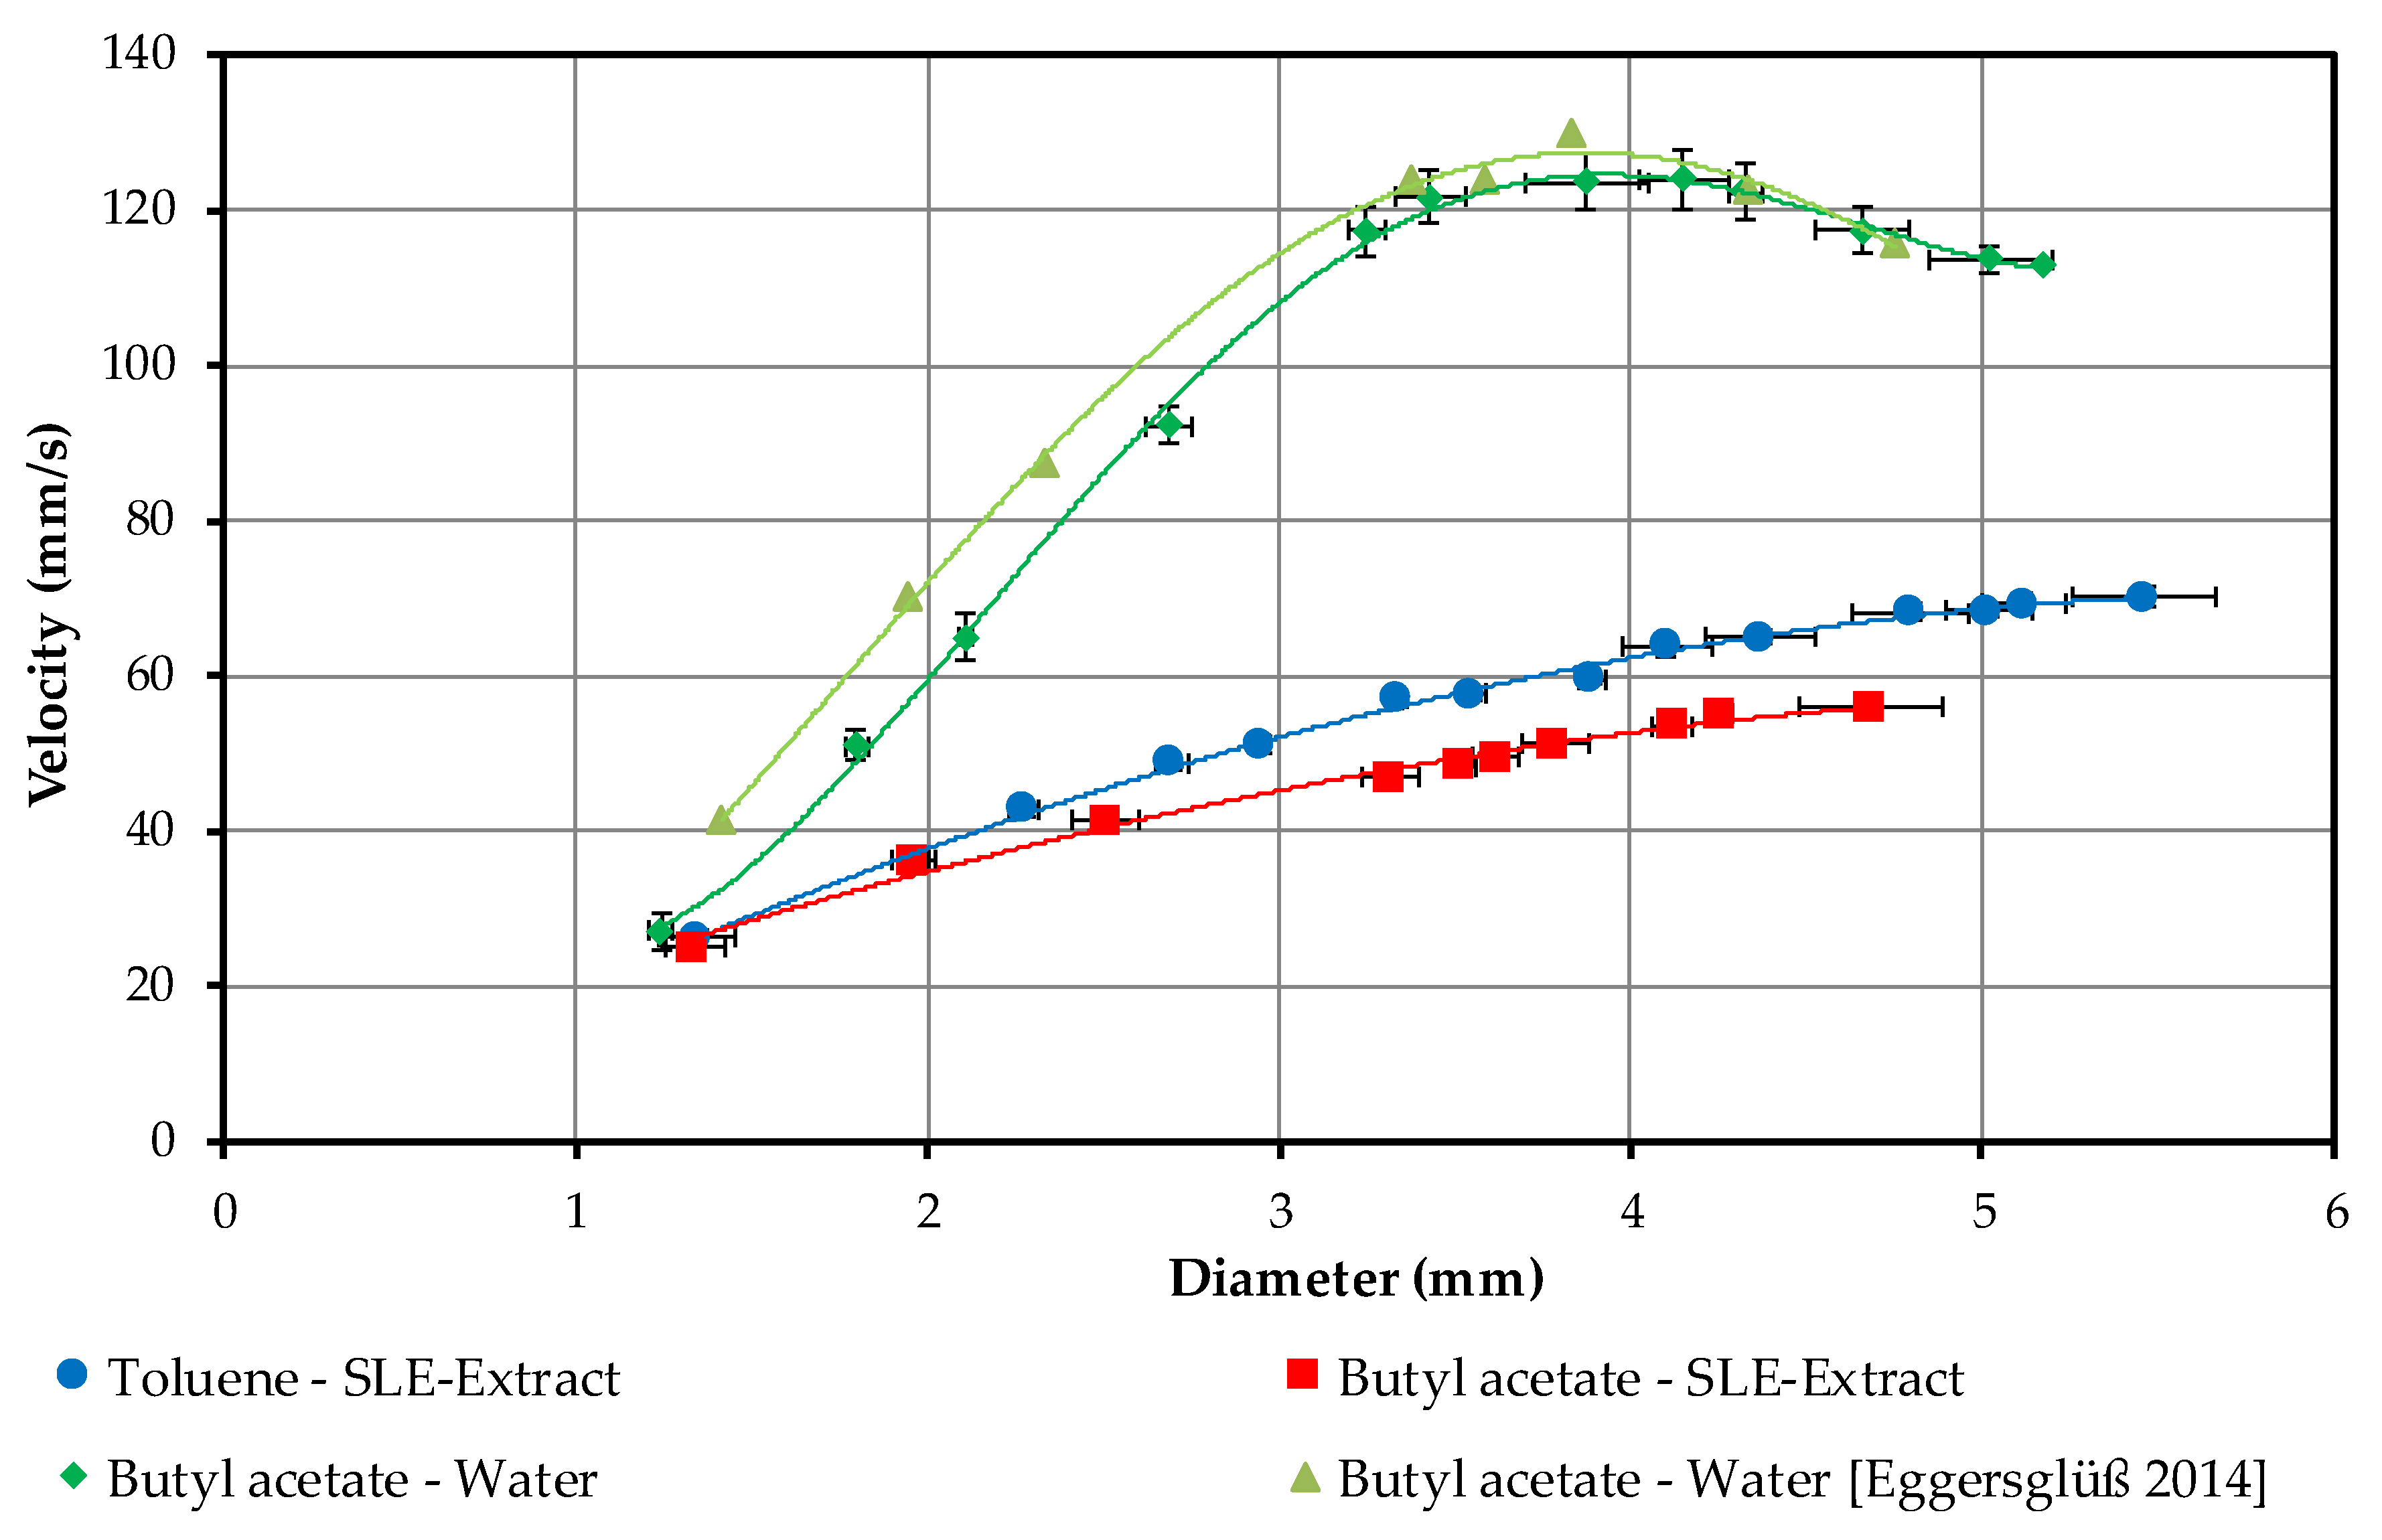
4.1.3. Droplet Sedimentation Velocity

A higher velocity of the disperse phase would allow a higher countercurrent flow in the column experiments and thus higher throughputs. The rising velocity is shown in the following Figure 5 depending on the drop diameter.
The two curves used to validate the tests are shown in green. Initially, the measured curve is slightly below the curve found in the literature [10]. At large droplets and high speeds, the difference becomes smaller and lies within the error tolerances. With both, the maximum speed is reached at approx. 130 mm/s and a diameter of 3.8 mm. This corresponds to a drop volume of approximately 22 µL.
In the curves for the two systems with the solvent and the SLE extract, there is no maximum speed. For butyl acetate, the maximum droplet volume is 35 µL, the corresponding droplet diameter 4.7 mm, and for toluene 50 µL and 5.6 mm. The toluene droplets always have a faster rate of rise due to the greater difference in density between the solvent and the SLE extract.

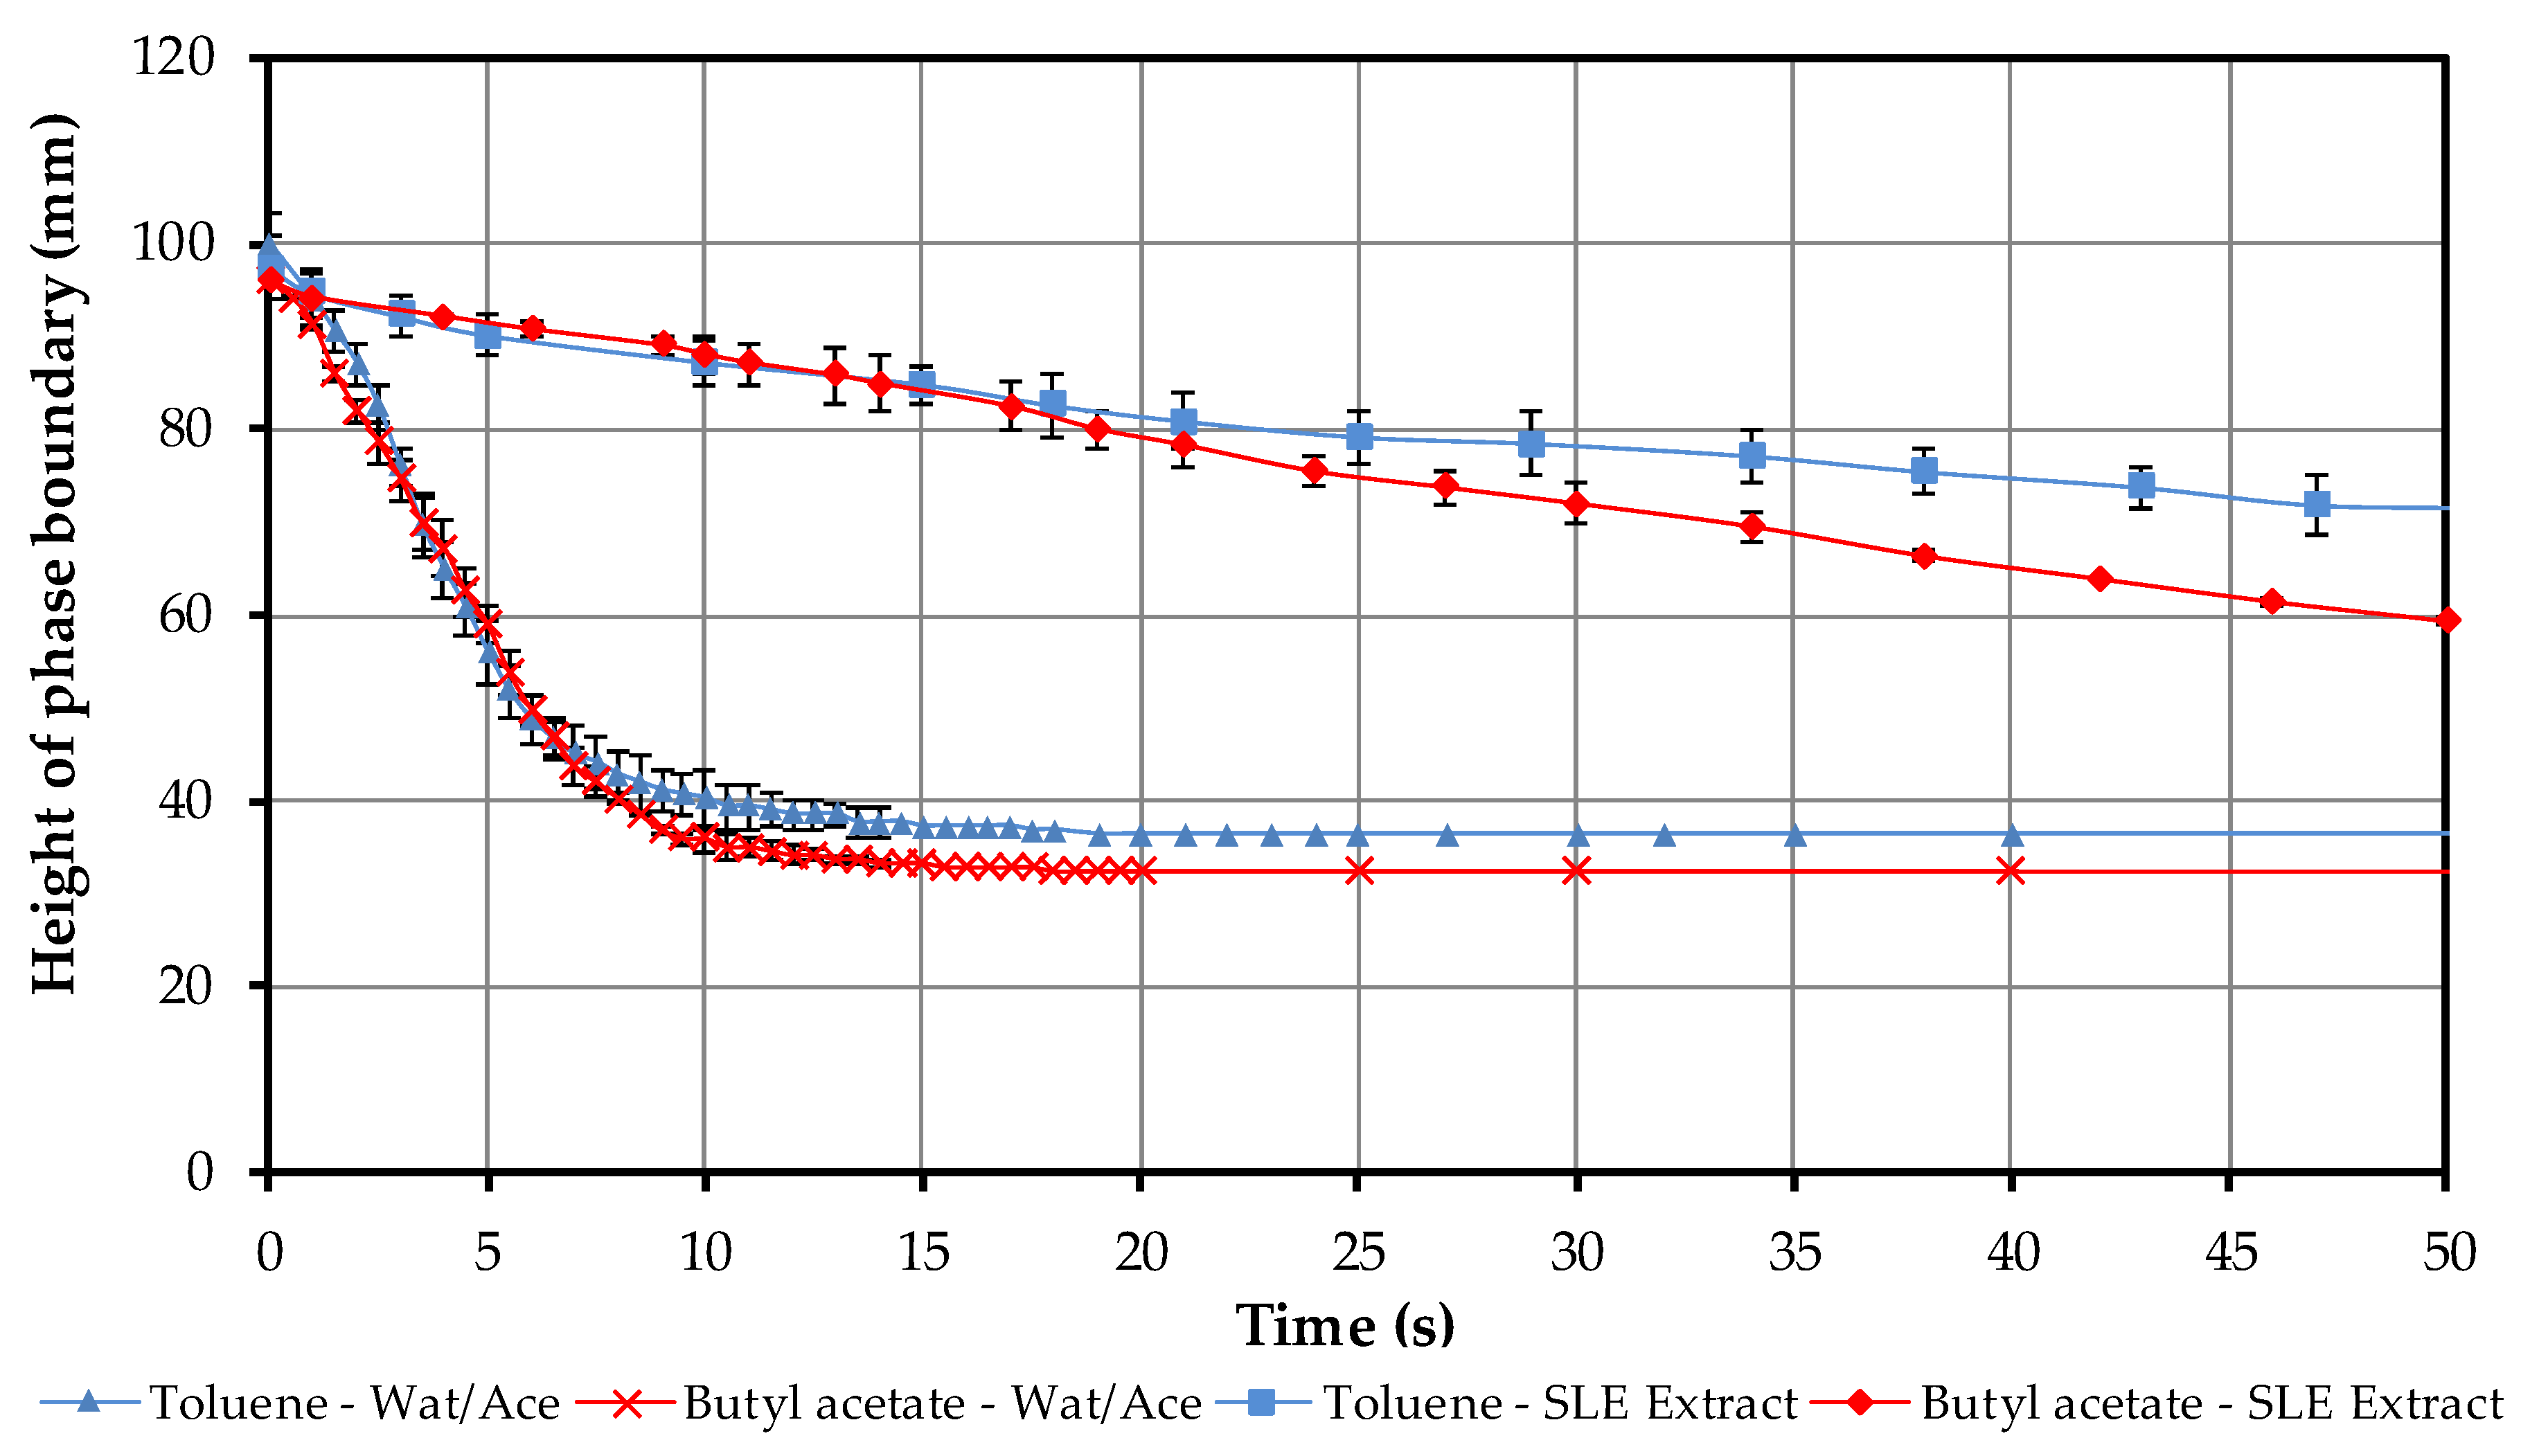
4.1.4. Batch-Settling Behavior

Since the extraction is executed in a stirred Kühni column, additional experiments are carried out to characterize the settling behavior. First, the sedimentation behavior between toluene or butyl acetate with water/acetone in a ratio of 50/50 wt.-% is considered.
There are no significant differences between the sedimentation curves of butyl acetate (in red) and toluene (in blue) (Figure 6). The height of the phase boundary at the start corresponds to the filling level. This is slightly higher for toluene than for butyl acetate due to its lower density. The light phase is always continuous. While the light phase immediately begins to sediment, the heavy phase starts to coalesce after 8 s.
In the next step, the settling behavior of toluene and butyl acetate is investigated with the SLE extract. The results of these studies are shown in Figure 6. First of all, it can be observed that the settling time is many times longer than in the first tests (see Figure 6). After approximately 100 s sedimentation with butyl acetate, the SLE extract is complete and a clear light phase has been formed. The settling time for toluene is 250 s. This corresponds to an increase by a factor 5 for butyl acetate and factor 7 for toluene as compared to the settling time with the water/acetone mixture.
Furthermore, no coalescence curve is shown for the heavy phase, as the heavy phase becomes a stable, emulsion-like mixture due to the energy input of the stirrer.
The extraction process in the stirred Kühni column can be operated at significantly lower speeds in order to reduce the risk of formation of a stable emulsion.
The results from the settling behavior clearly indicate butyl acetate as solvent for the subsequent column experiments. The faster settling time would allow for more theoretical separation stages and thus outweigh the disadvantages in separation factor and partition coefficient.

4.1.5. Model Calculations

The parameters used for the studies are presented in the Section 4.1.1, Section 4.1.2, Section 4.1.3 and Section 4.1.4. As can be seen in the experimental section, the first operating point operates at a smaller solvent ratio of 1:3, and therefore dilutes the artemisinin in the solvent phase (red line, left) to around 1.2 g/L. The second operating point utilizes a solvent ratio of 1:5.3. Since the volume of the extract phase is correspondingly low, the resulting artemisinin concentration in the extract phase is predicted to be in the range of 1.9 g/L.

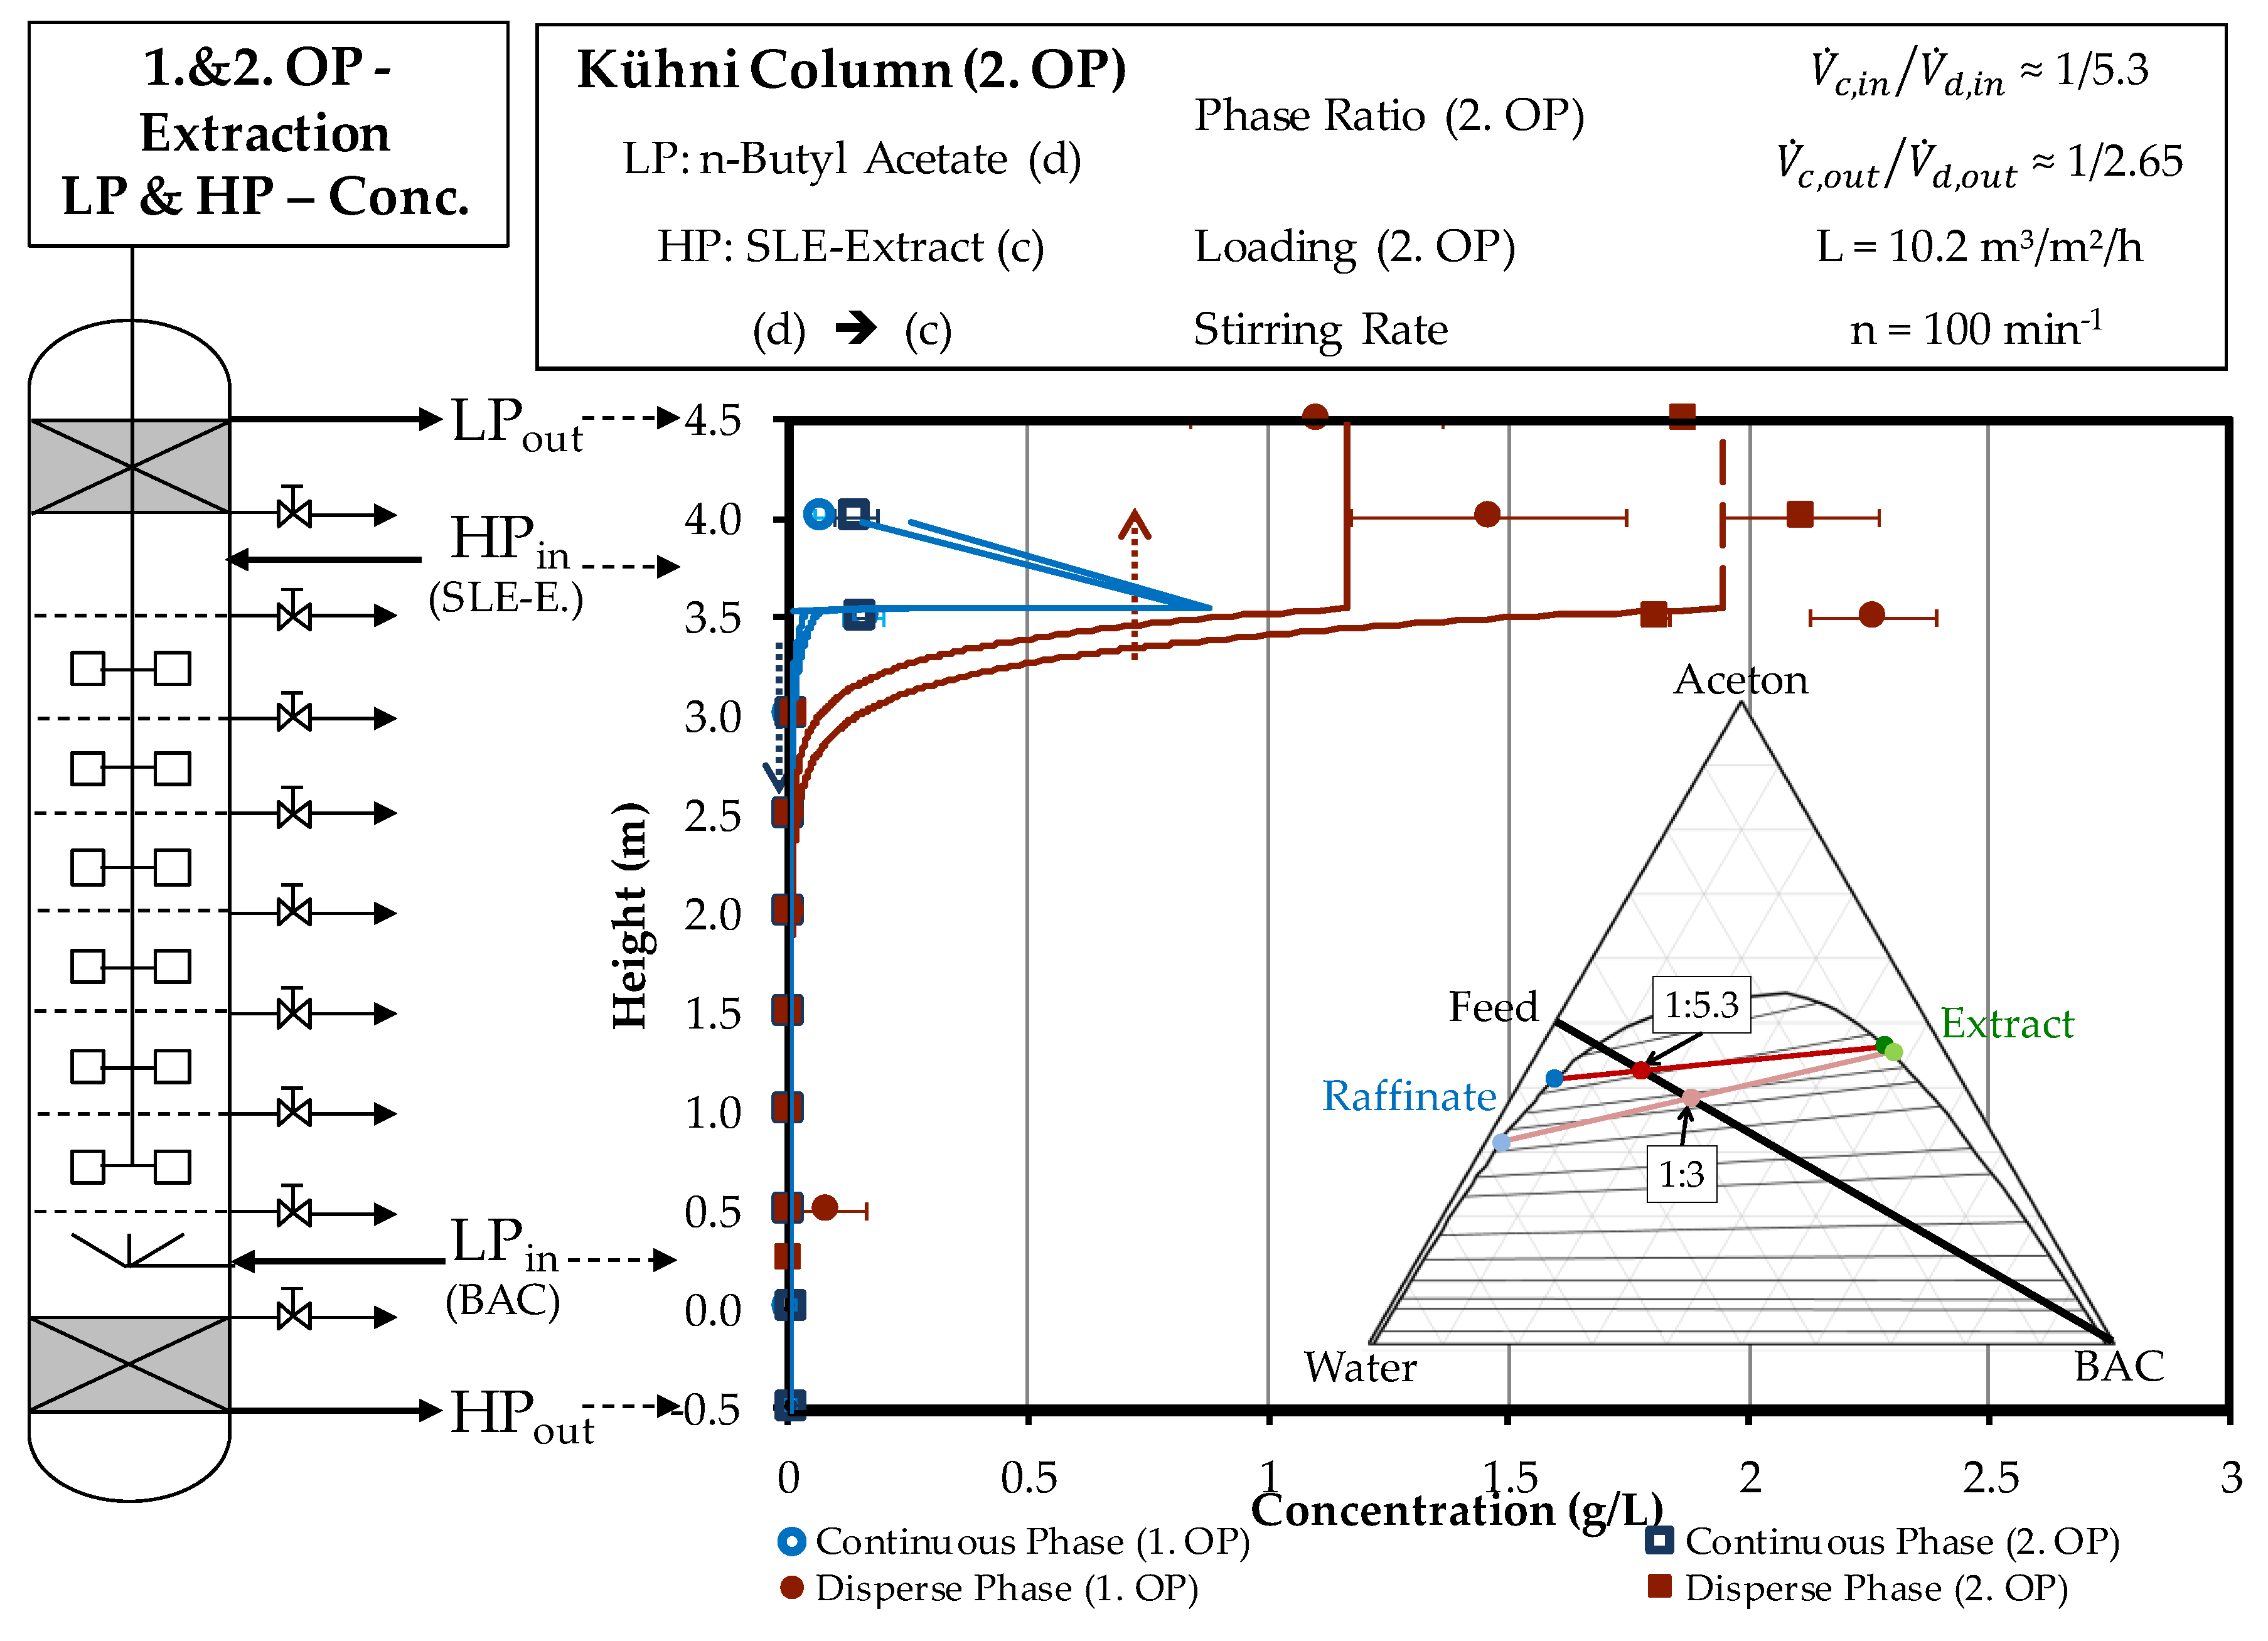
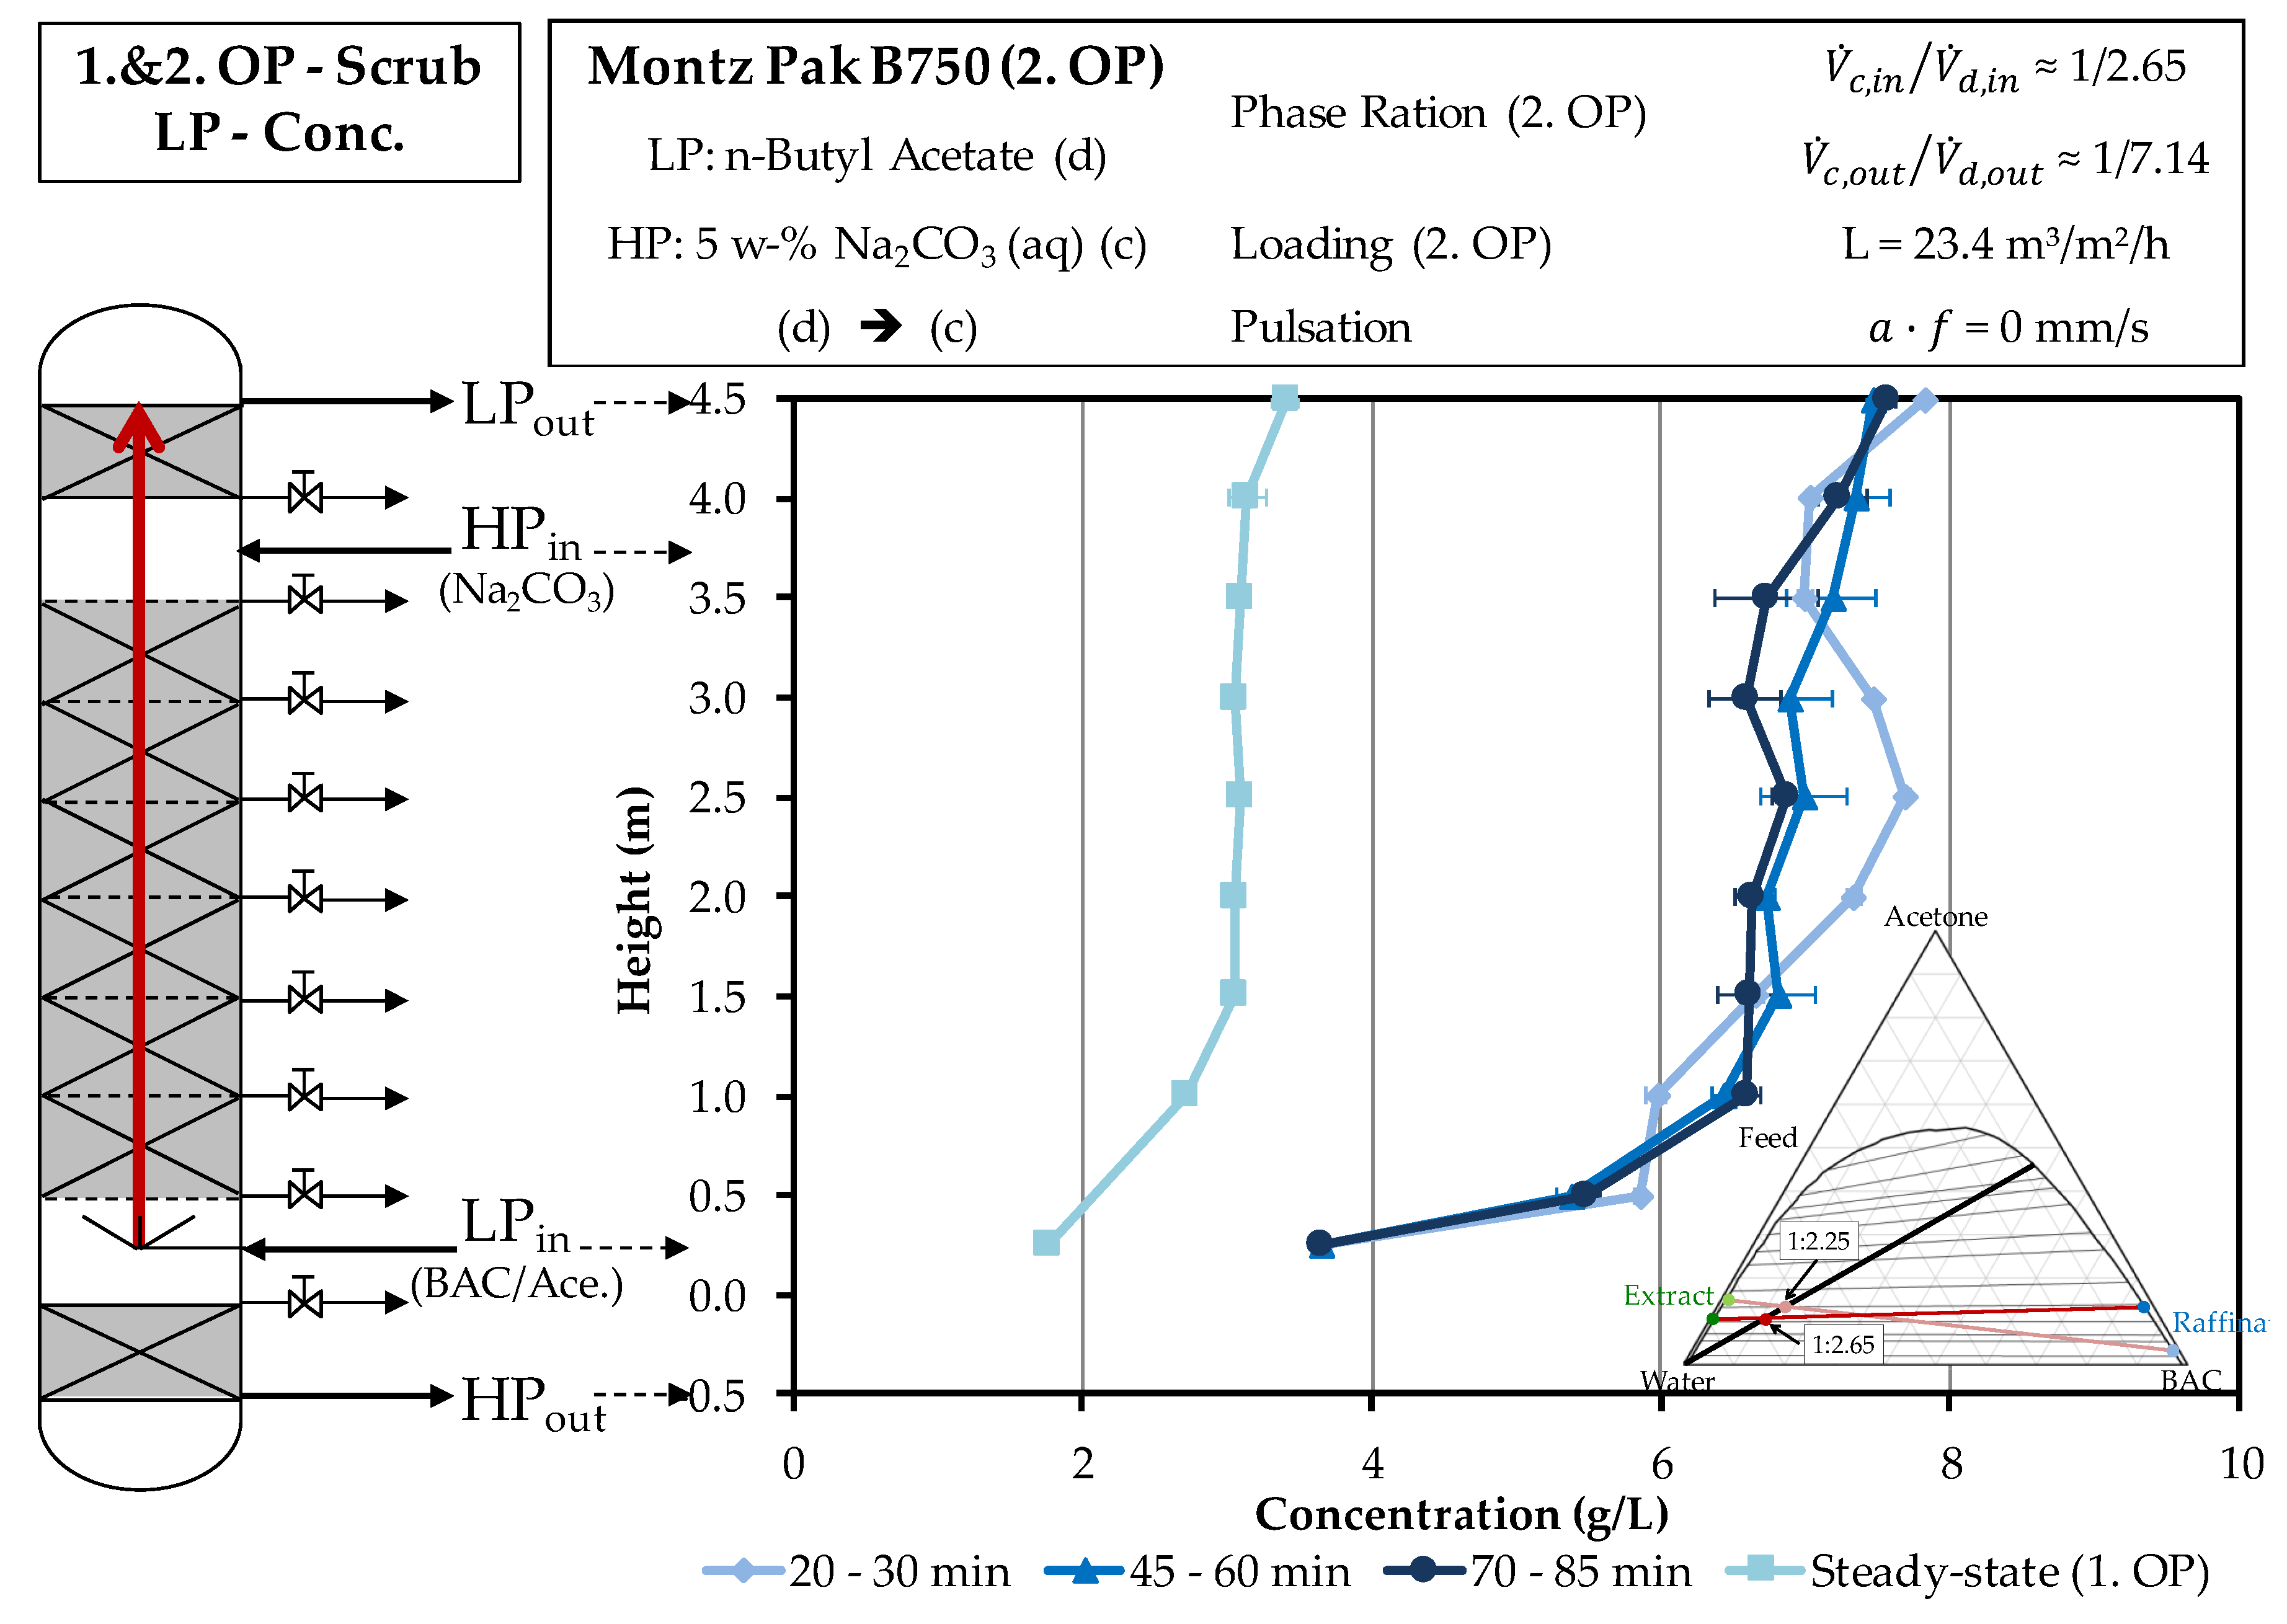
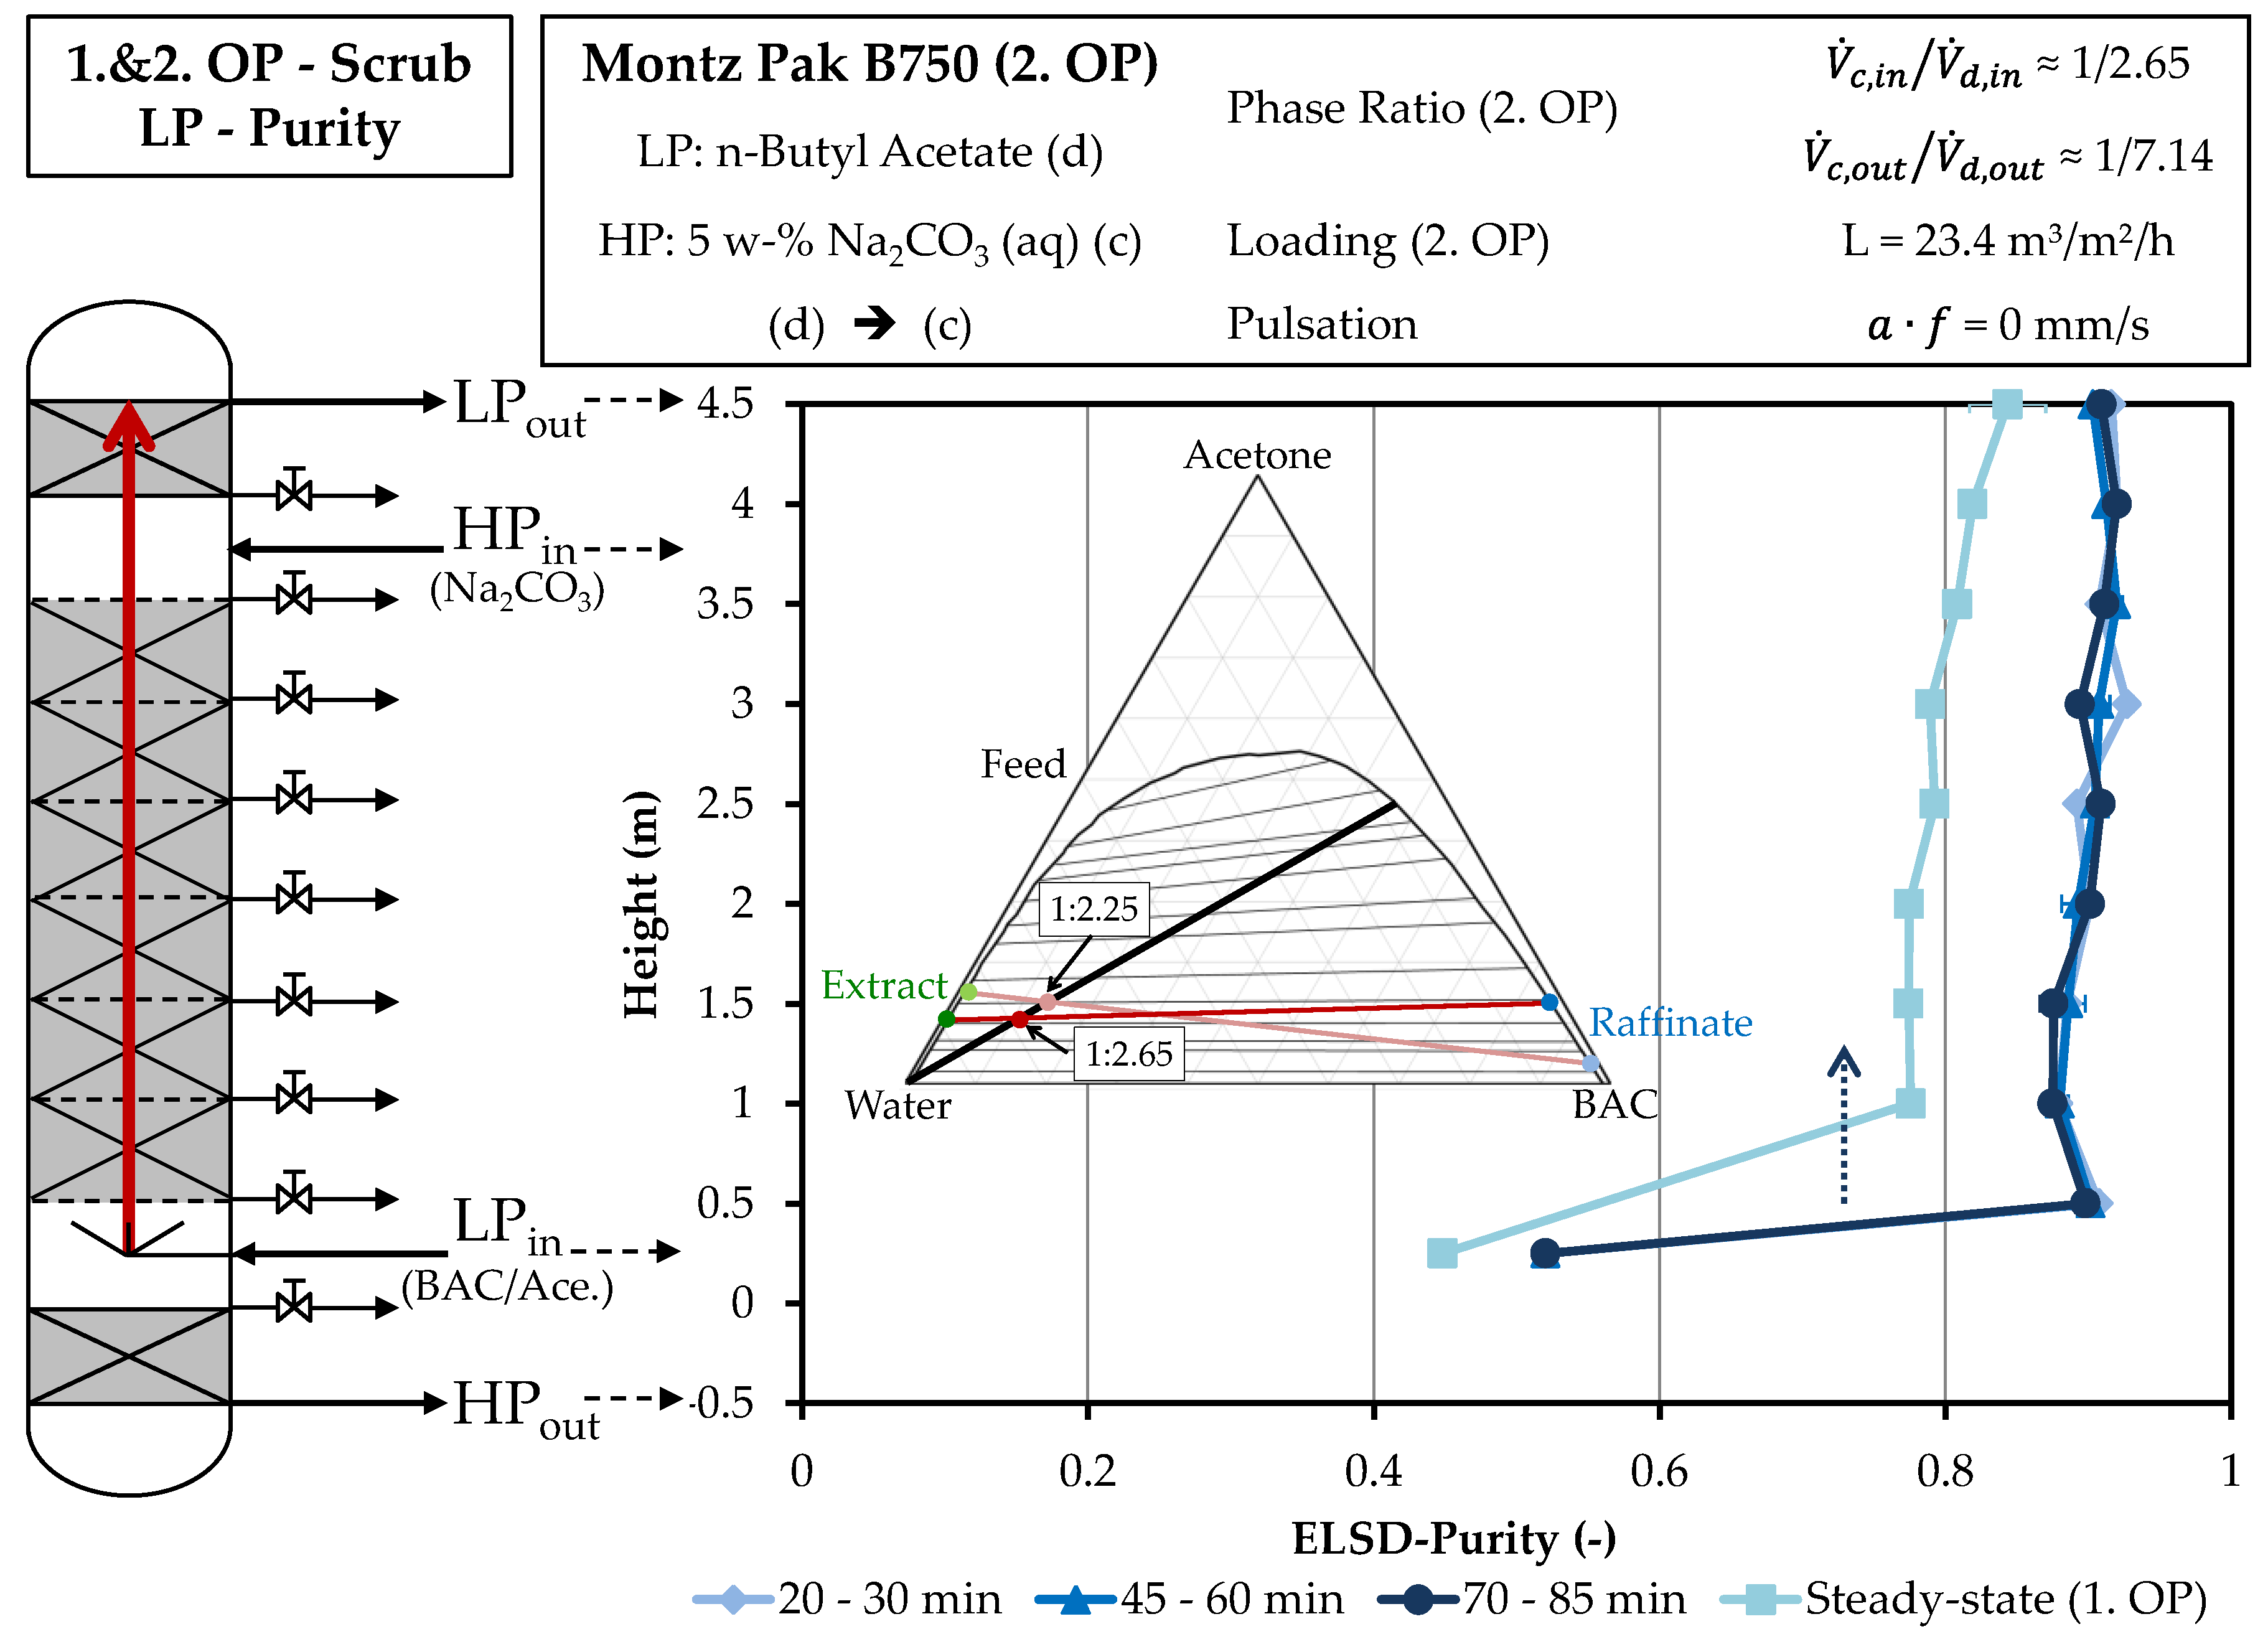
4.2. Column Experiments

The next step in the process development is to run the experiments on the mini-plant columns to verify the model-based predictions. The first extraction with butyl acetate and the SLE extract is run on the Kühni column. The aim is to extract artemisinin into the butyl acetate phase and to concentrate it. Furthermore, secondary components are to be separated in order to increase purity.
The second extraction is the scrubbing with the salt solution, which consists of 5 wt.-% Na2CO3. This extracts all the polar substances from the mixture and thus further increases the purity. In addition, the concentration is also to be increased here. This is carried out in the packed column. Two tests are performed for two operating points (OP) for extraction and scrubbing. Data for inlet and outlet parameters for all column experiments are summarized in Table 2.

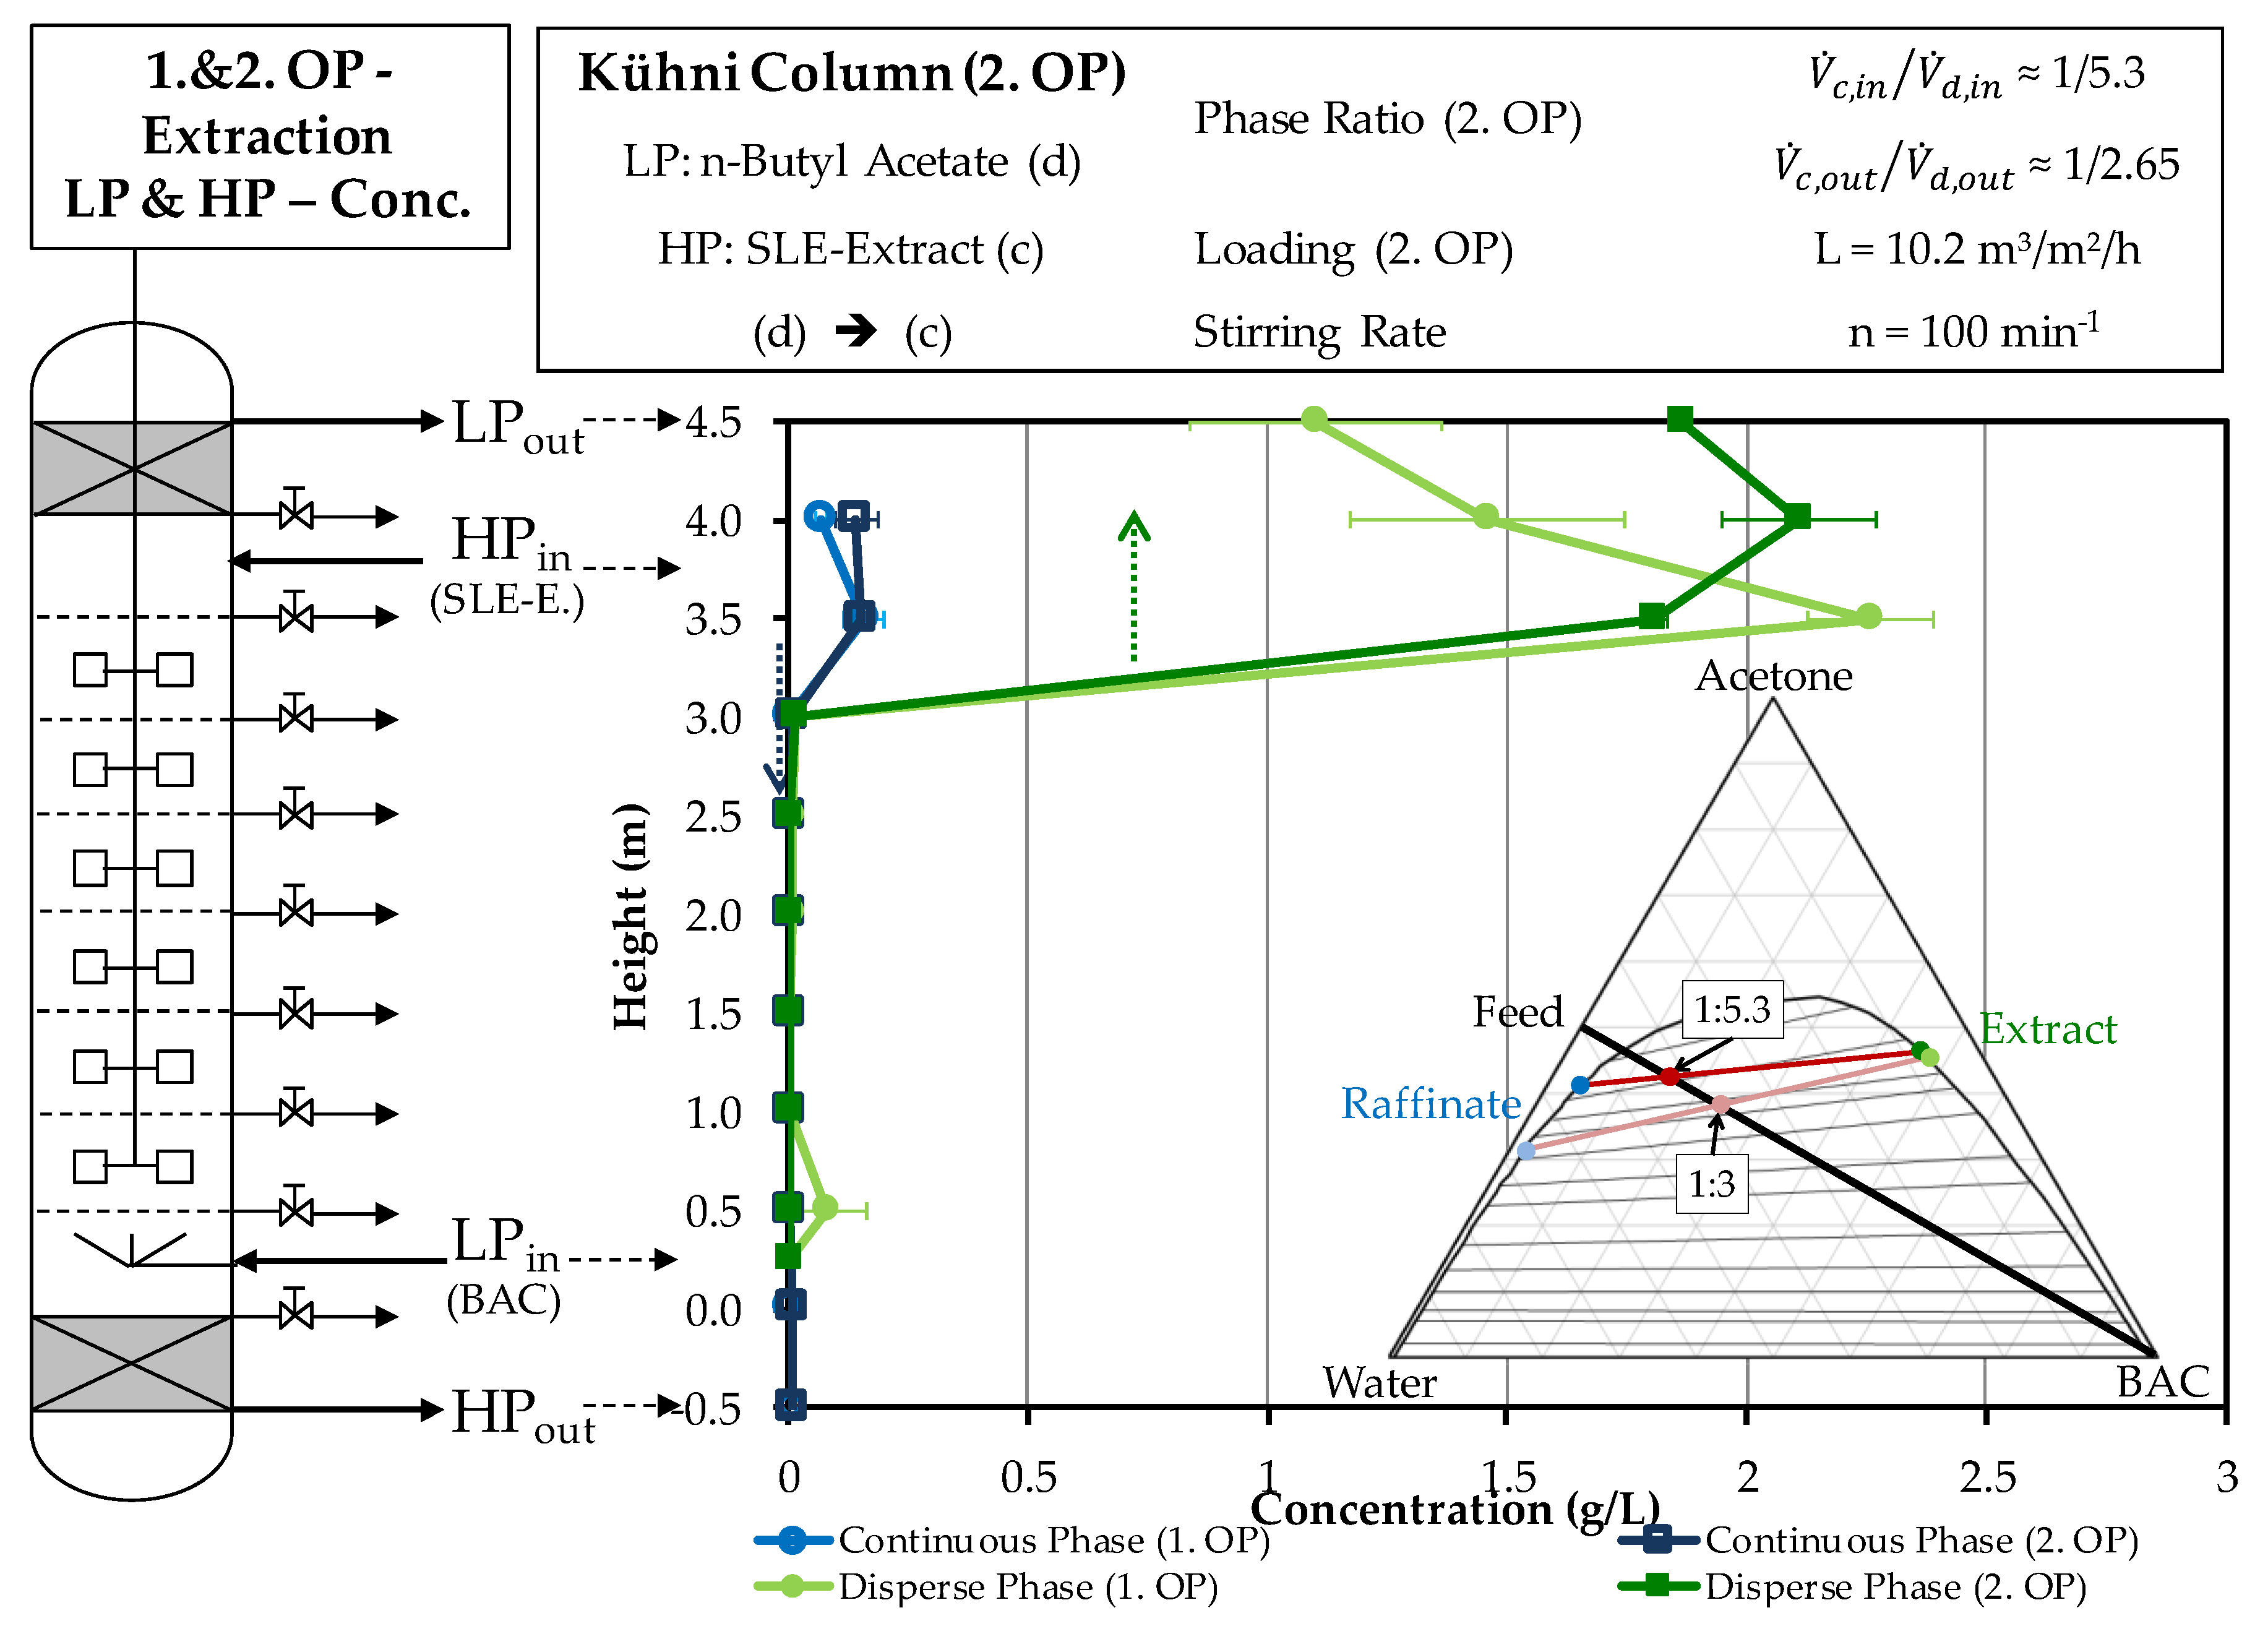
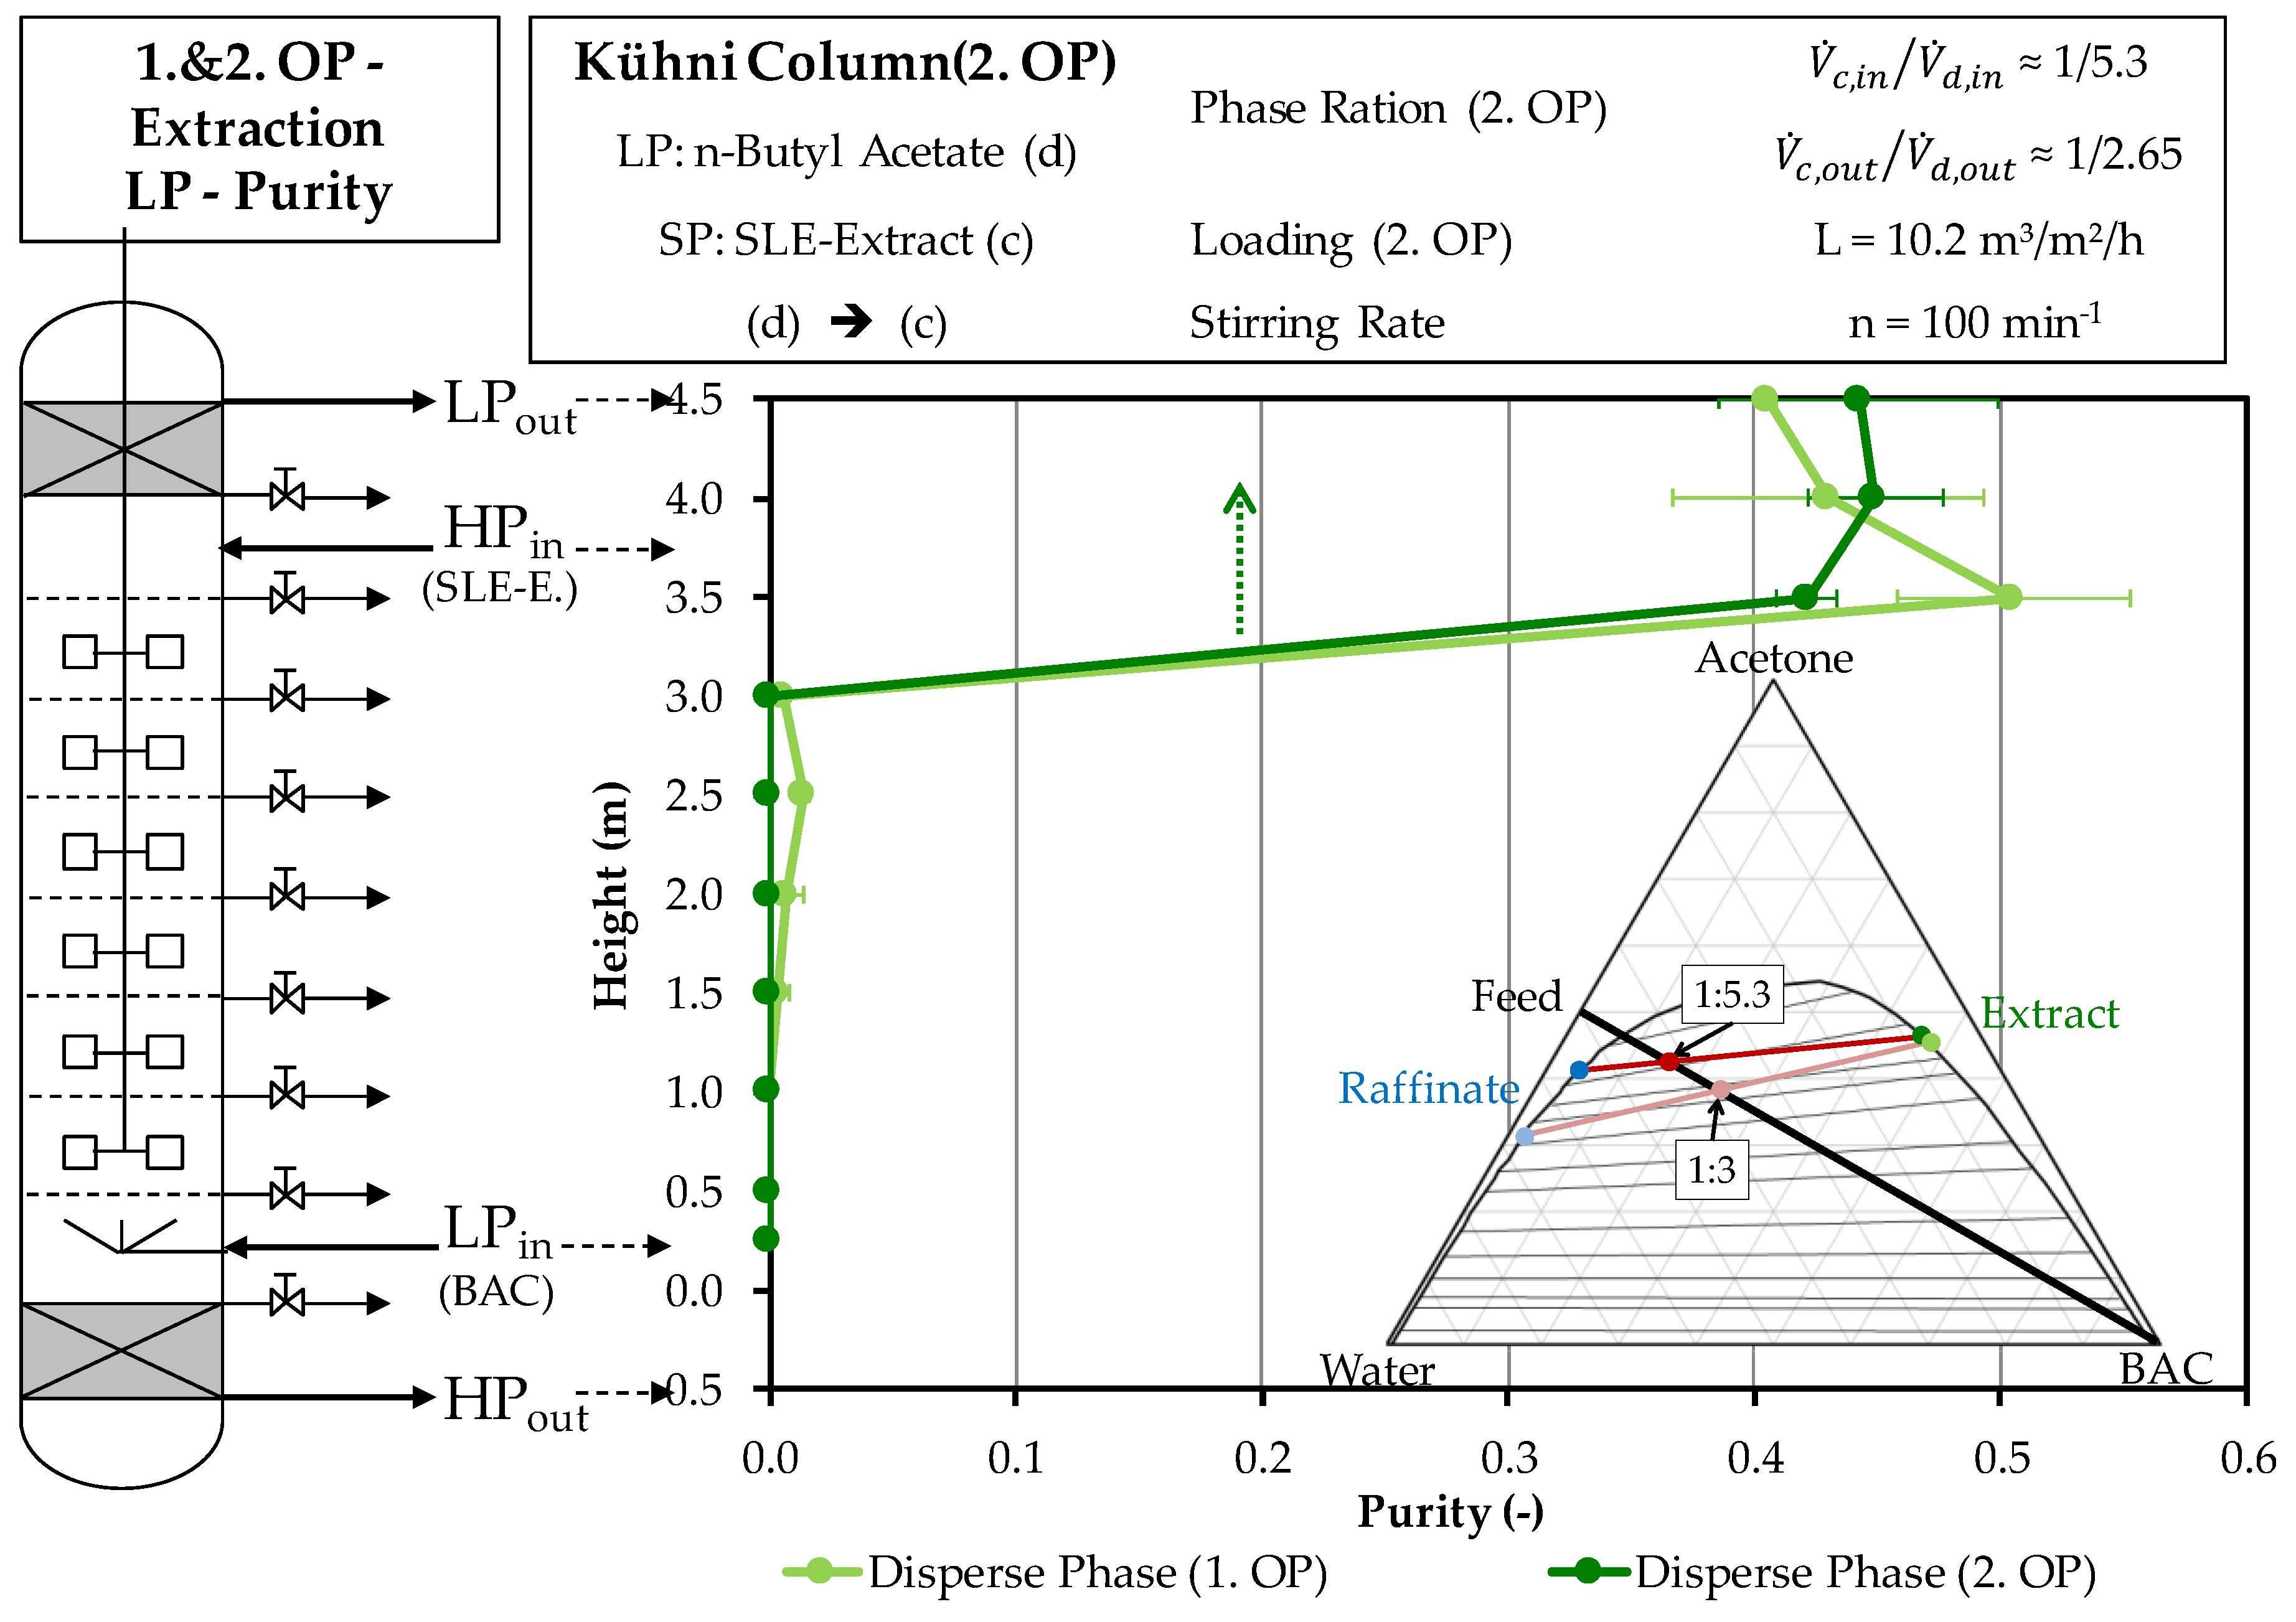
4.2.1. Extraction Column

The selected phase ratio between the solvent phase and aqueous SLE extract phase for the first operating point is 1:3, which should allow for safe operation of the column. If a higher solvent content was used, the risk of phase inversion would increase. This is because the solvent phase extracts the acetone from the aqueous, heavy SLE phase. Losses may occur if the solvent volume is too low. The single-stage shaking tests show a yield of over 90% at this solvent ratio. This should be significantly increased by the multi-stage extraction column, as predicted by the simulation. Furthermore, this ratio promises very high separation factors and partition coefficients.
The liquid load is chosen comparatively low, at approx. 11 m³/m²/h, as the difference in density of the two phases is small, otherwise there is a risk of column flooding.
After 45 min, hardly any changes in purity are visible. Below three meters no artemisinin can be detected and therefore the purity here is 0%. Around the onset of the heavy phase, the highest purity can be measured at around 50%. At the outlet of the light phase, the purity in the stationary area is just over 40%. Although a solvent ratio of 1:3 is set, the ratio of the output currents is almost 1:1, the light phase has doubled in volume, and the heavy phase is accordingly reduced by one-third. This change in volume is due to the fact that acetone is extracted from the heavy to the light phase. The density of the light phase is reduced by the extracted acetone, since acetone has a lower density than butyl acetate. At the same time, the heavy phase becomes denser as the weight fraction of water in it increases. The artemisinin is extracted alongside the acetone into the solvent phase. This accelerates the mass transfer of artemisinin. Since almost the entire artemisinin transitions into the light phase, a concentration of 1.25 g/L occurs in the stationary state.
The objectives of concentration and purity increase are achieved with this operating point, as predicted by simulation. A higher concentration of the extract phase is mainly prevented by the increasing volume of the disperse phase. In the stationary state a purity of over 43% is achieved. However, only the uppermost part of the column is used for the mass transfer related to artemisinin. Below 3 m, mass transfer is already completed.
The results of the first operating point of the extraction column indicate that the volume flow of butyl acetate into the column should be reduced in order to achieve a higher concentration of the extract phase. The solvent ratio is reduced to 1:6 without changing the flow rate of the continuous phase. There should be no loss of yield, since the distribution coefficient determined in the shaking experiments is large enough for artemisinin with a value of 25. Furthermore, the risk of flooding and thus the formation of phase inversion is decreased by reducing the dispersed phase. The purity of the SLE extract in these tests is 42%. The column load is 10 m³/m²/h. The results of this operating point are presented below and are compared with the results of the first one.
Figure 7 shows the comparison of the concentration curves of the dispersed and continuous phase across the column height in the stationary area of the first and second operating points.
The outlet of the light phase shows the already mentioned higher concentration when compared to the first operating point. Overall, the concentration is always slightly higher than in the first experiment. The reason for this is the lower solvent ratio, which results in a lower number of theoretical separation stages. The hardly measureable residual concentration at the exit of the heavy phase is caused by back-mixing in the lower settling area.
Figure 8 shows the comparison of changes in purity across the column height of both operating points. The progressions of purity do not differ significantly from those of the first operating point. The higher purity in the stationary area in the exiting extract phase is only caused by the already higher purity of the SLE extract that is used at the second operating point.
In this experiment, the volume of the dispersed phase doubles across the column height. As before, the reason for this is that acetone has been extracted into the solvent phase. The comparison of the model-based prediction and experimental finding for the two investigated operating points is shown in Figure 9. As can be seen, the complete separation of artemisinin in the raffinate phase, as well as the two resulting product concentrations in the extract phase and the shape of the concentration profile are in good accordance of experiment when compared to model.

4.2.2. Scrubbing Column
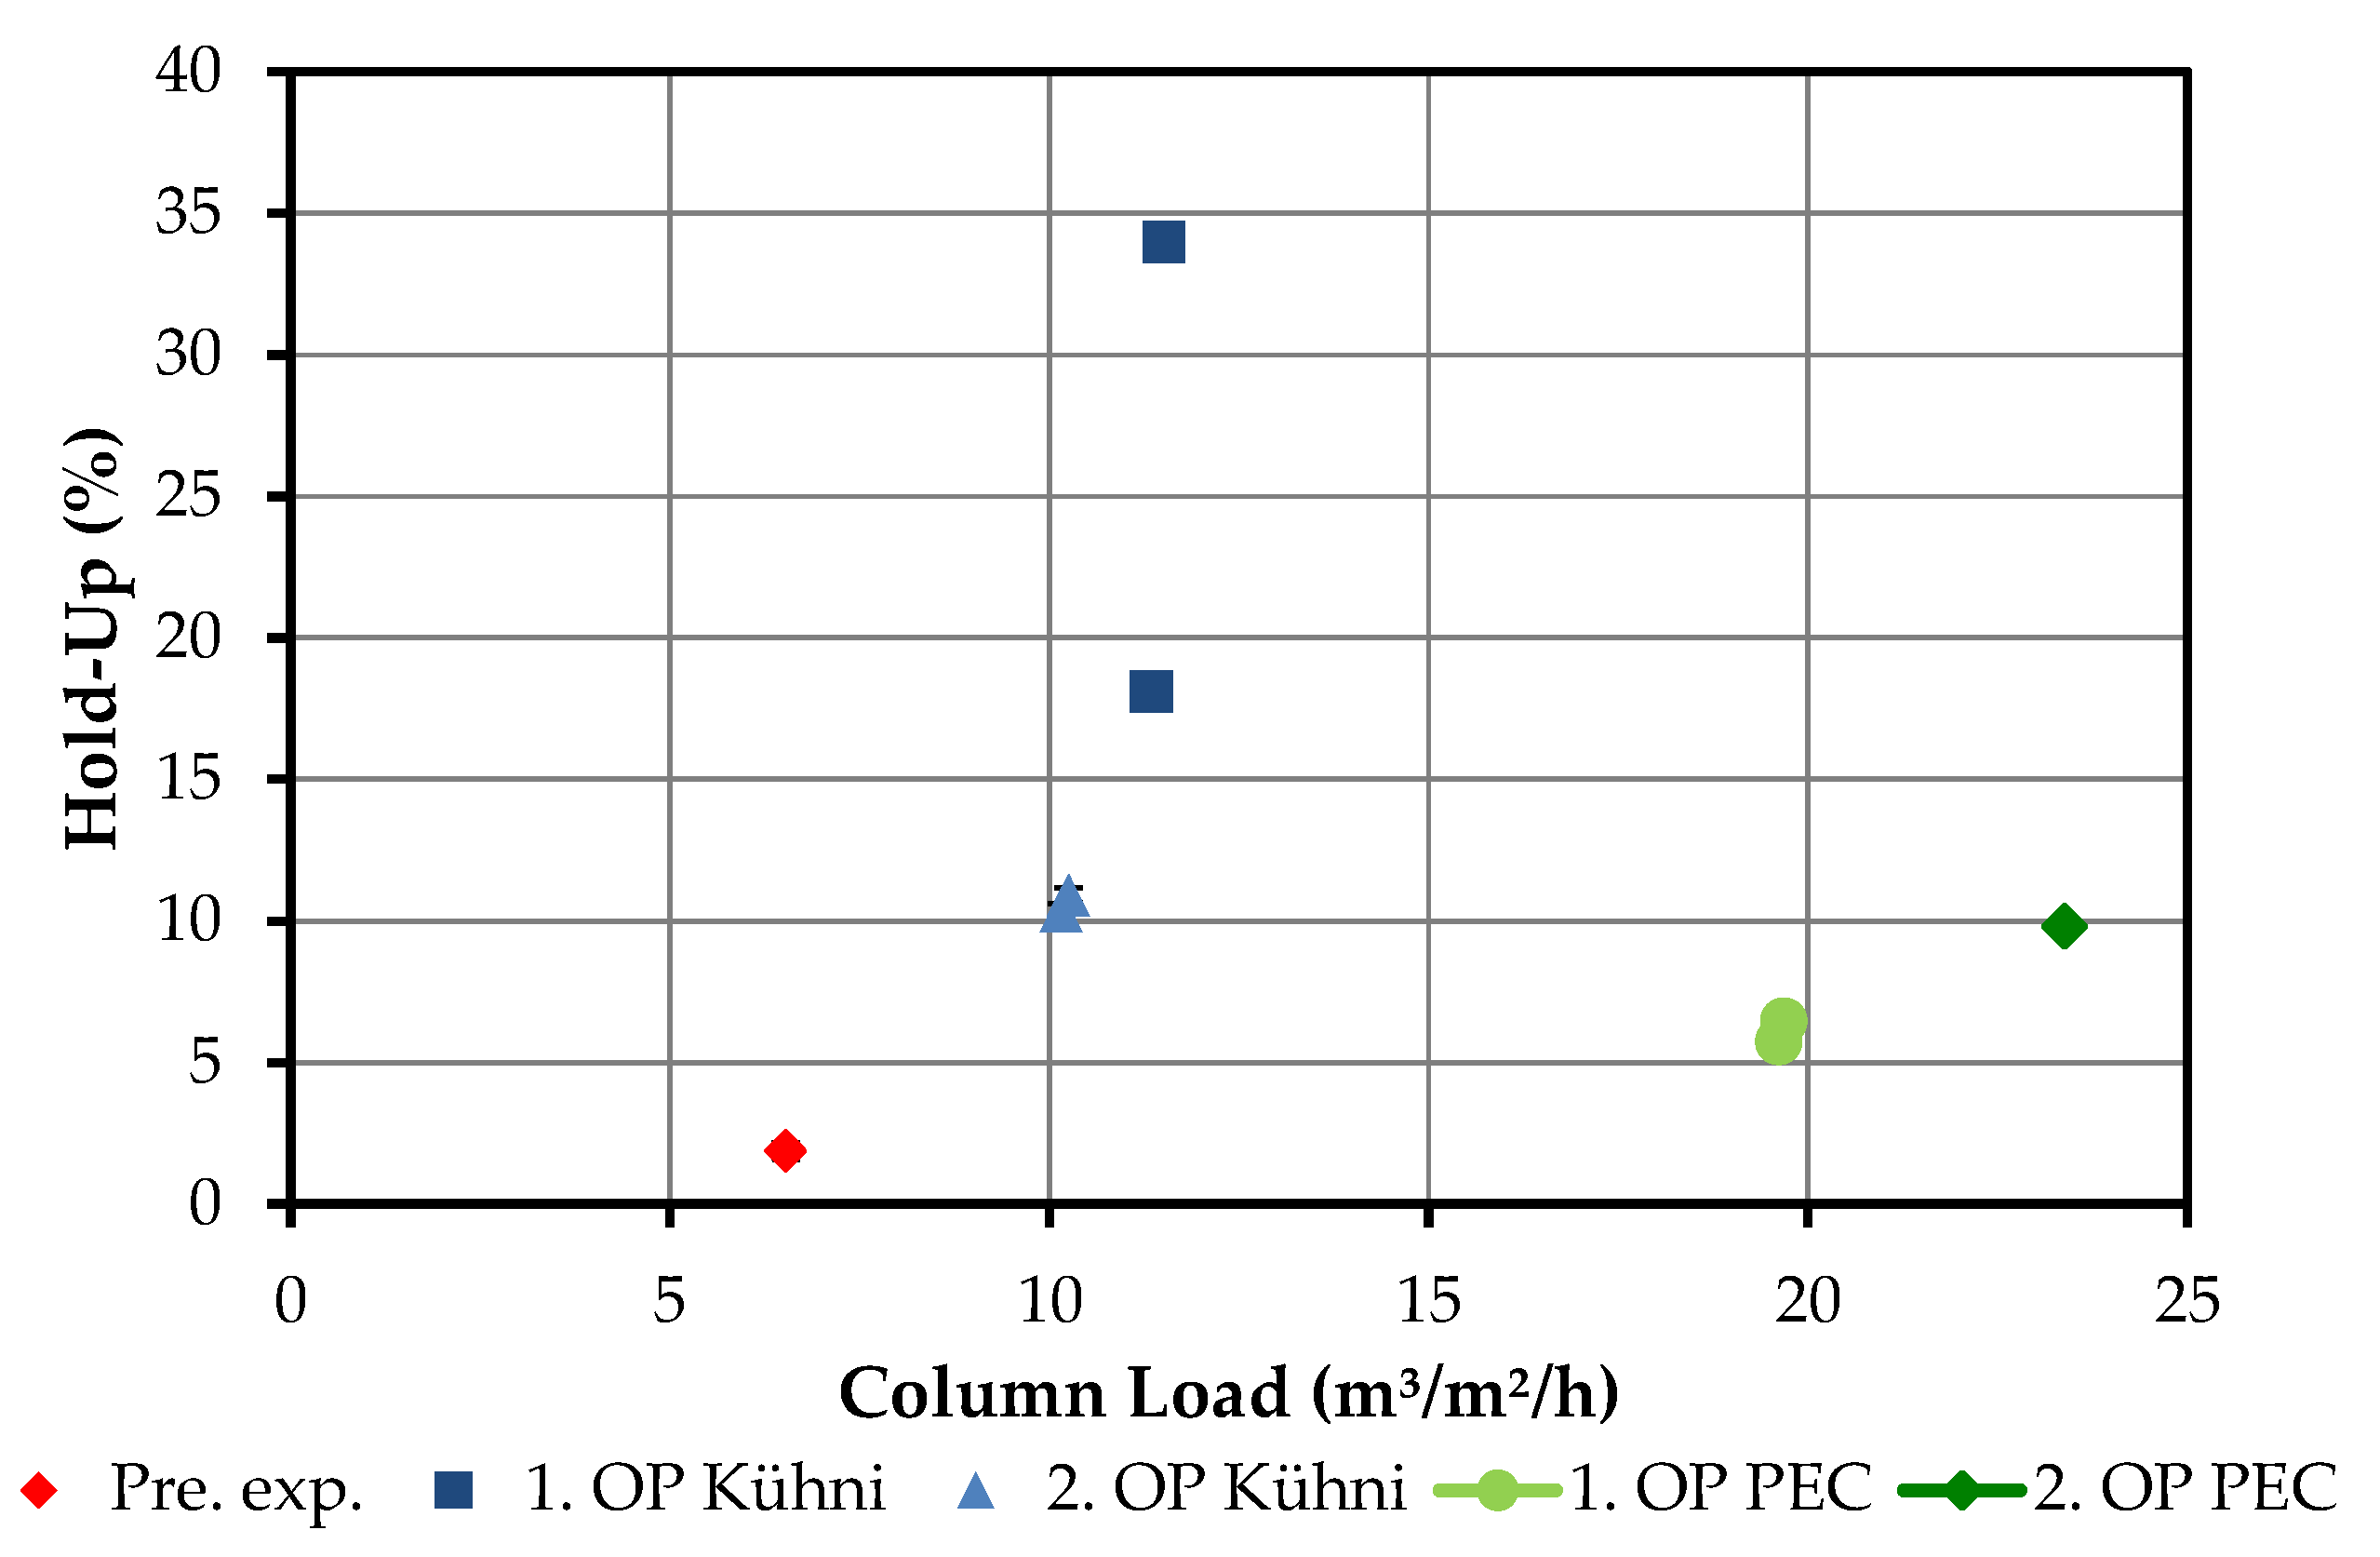
The shaking tests for Na2CO3 scrubbing showed the best results with a higher proportion of the salt phase. The light phase in the scrubbing column is the total extract produced at the first operating point of the extraction column.
Since artemisinin is not extracted during scrubbing and only secondary components enter the heavy phase, the artemisinin-containing phase is the scrubbed extract. The loading of the column in this test is higher and amounts to 19.7 m³/m²/h. The higher liquid load is made possible by the greater differences in the density of the phases.
The stationary state is already reached after 30 min, since the greater difference in density ensures a higher rise velocity of the disperse phase. The concentration doubles to nearly 3.5 g/L. This is due to the reduction in volume of the light phase by half. At the same time, the volume reduction reduces the risk of the column flooding.
The stationary state is reached after one hour when purity is considered. Across the column height, there is an increase in purity. This indicates that secondary components pass over the entire column height into the salt phase. The multi-stage nature of the column thus has a positive influence on the purity as compared to single-stage tests. The purity increases to over 80% from just under 45%. The density of the heavy phase is reduced due to the extraction of acetone from the solvent phase. This is also the reason for the increase in density of the light phase, which almost corresponds to the density of pure butyl acetate (882 kg/m³). From this it can be concluded that the scrubbed extract phase consists to a very large extent of butyl acetate. The results of the purity tests of the first operating point of the scrub indicate that the purity can be further increased by a higher throughput of the continuous phase. This increased countercurrent flow causes the disperse phase, with artemisinin and secondary components, to rise more slowly and the residence time in the column increases. Furthermore, more secondary components should be able to pass into the heavy phase, as this has a larger capacity due to the higher volume flow.
The extract phase of the second operating point from the extraction column represents the input light phase of the scrubbing column in the second operating point. Therefore, the concentration is increased when compared to the first operating point. Figure 10 shows the concentration curves of the light phase above the column height during the test.
The concentration at the entry of the light phase is twice as high due to the reduced solvent ratio of the second operating point in the scrubbing. At the outlet, the light phase of this operating point reaches a concentration of more than 7.5 g/L. This corresponds to a doubling of the concentration, which also occurs at the first operating point, when acetone is extracted from the light phase to the heavy phase.
The density of the scrubbed extract phase is 885 kg/m³ and that of pure butyl acetate is 882 kg/m³. The density of the heavy phase is reduced by the increased proportion of acetone. Since the increase in concentration is only related to the reduction in volume, the increase in flow of the continuous phase has no influence on the concentration, since, even at the first operating point, almost all acetone and water is extracted into the continuous phase. In addition to density measurements, the aqueous HP (heavy phase) raffinate (extraction column) and aqueous HP scrub liquor (scrubbing column) are measured by FTIR (see Section 3.8). To avoid disturbing effects of the highly concentrated artemisinin and secondary components, the compositions of the organic LP (light phase) extract (extraction column) and the scrubbed LP extract (scrubbing column) are determined by closing the mass balance. As can be seen in the observed increase in volume of the extract phase from approx. 12 to 21 mL/min, which is caused by the extraction of acetone, are supported by the decrease in density (Table 2) and measurements by FTIR (Table 3). The reextraction of acetone in the scrubbing column, which leads to the observed increase in density and decrease of volume flow from approx. 46 to 21 mL/min, is also supported by FTIR measurements.
Figure 11 shows the purity curves during the experiment across the column height. The higher starting purity of the second operating point of the scrubbing can be seen at the entry of the light phase. At a height of one meter and above, the purity of the raffinate phase in the new measurements is approx. 90% and it rises to 92% at the end of the light phase. The increase of the flow rate of the continuous phase seems to have a positive influence and thus enables a purity of more than 90%. The purity above the column height is constant, therefore a further increase of the volume flow of the continuous phase would have no further positive influence.

4.2.3. Hold-Up

Figure 12 shows the measured hold-ups of the combined liquid load of both phases.
If the results of the Kühni column are examined, the characteristic progression of the hold-up with respect to the liquid load can be seen. The proximity to the flooding point, which is also observed in the experiment, explains this strong increase. The reduction of the volume flow of the light phase by half only results in a relative reduction of the liquid load of 13%, but it results in a reduction of the hold-up by 50%. This is due on the one hand to the fact that less light phase is transported into the column, but on the other hand also to the fact that it experiences a lower countercurrent flow due to the smaller narrowing of the cross-section.
For the operating points of the scrubbing column, only a moderate increase can be seen. The flooding point is therefore not reached. Increasing the flow rate of the continuous phase results in a relative increase in hold-up of up to 22%.

5. Conclusions

In this study, a screening with toluene, butyl acetate and MTBE for extraction of artemisinin is conducted. In the shaking tests toluene has the highest partition coefficients and separation factors, followed by butyl acetate. MTBE is excluded as a solvent for LLE because it has a low boiling point and the smallest mixing gap with water/acetone. Therefore, only a low concentration of artemisinin extract would be possible with MTBE. Batch-settling tests in combination with ideal water/acetone mixtures show no significant difference between toluene and butyl acetate, therefore additional settling tests using the solid-liquid extract phase are carried out. Butyl acetate has a significantly shorter settling time, which reduces the risk of emulsion formation in the column tests. For this reason, butyl acetate is used in the following experiments. In the next step, the kL·a value for artemisinin is determined by the drop measuring cell. The model-based predictions of two operating points in the extraction column are in good agreement with the experimental mini plant studies.
In the first operating point of the extraction, a phase ratio of 1:3 is set. Because of the acetone, which transitions from the SLE extract into the solvent phase, only a moderate concentration can be achieved. By reducing the solvent ratio to 1:5.3, the concentration of the extract phase increases with a lower risk of flooding the Kühni column.
The Na2CO3 scrubbing step removes a major number of polar secondary components, as well as the previously extracted acetone. By increasing the volume flow rate of the salt phase, the purity can be significantly increased when compared to the first operating point. Over both columns a purity of 90% of initial 40% and a concentration of over 6 g/L of initial 0.9 g/L can be achieved. Both higher concentration and purity are beneficial for the further purification steps.
The presented study illustrates a straight forward procecude for the process development of LLE in extraction columns for multicomponent feed mixtures that are based on lab-scale studies to quickly select ideal solvent and process parameters, which can then be used for scale-up and optimization simulation studies. This enables a faster product release with less material effort and thus more economic processes.

Author Contributions

A.S. conceived and designed the experiment as well as wrote the paper. M.S. designed the solid-liquid extraction experiments. M.J.H. conceived and designed the crystallization experiments and F.M. designed the chromatographic experiments. J.S. substantively revised the work and contributed the materials. J.S. is responsible for conception and supervision.

Funding

The authors want to thank the Bundesministerium für Wirtschaft und Energie (BMWi), especially M. Gahr (Projektträger FZ Jülich), for funding this scientific work.

Acknowledgments

The authors thank the ITVP lab team, especially Frank Steinhäuser and Volker Strohmeyer, for their effort and support. Special thanks are also addressed to Andrè Moser and Daniel Niehaus for excellent laboratory work and discussions. The authors want to thank the Bundesministerium für Wirtschaft und Energie (BMWi), especially M. Gahr (Projektträger FZ Jülich), for funding this scientific work. We also acknowledge the financial support obtained from the Deutsche Forschungsgemeinschaft (DFG) in Bonn, Germany (project Str 586/4-2).

Conflicts of Interest

The authors declare no conflict of interest.

References

  1. Litscher, D. Artemisinin. Traditionellen C hinesischen Medizin. Akupunktur Aurikulomedizin 2016, 28–31. [Google Scholar] [CrossRef]
  2. Dhingra, V.; Vishweshwar Rao, K.; Lakshmi Narasu, M. Artemisinin: Present status and perspectives. Biochem. Educ. 1999, 27, 105–109. [Google Scholar] [CrossRef]
  3. Bart, H.J.; Bäcker, W.; Bischoff, F.; Godecke, R.; Johannisbau, W.; Jordan, V.; Stockfleth, R.; Strube, J.; Wiesmet, V. Phytoextrakte–Produkte und Prozesse: Vorschlag für einen neuen, fachübergreifenden Forschungsschwerpunkt. Available online: https://dechema.de/dechema_media/Downloads/Positionspapiere/PP+Phytoextrakte+Okt_+2012-called_by-dechema-original_page-124930-original_site-dechema_eV-view_image-1-p-4254.pdf (accessed on 1 July 2018).
  4. WHO. World Malaria Report 2017; WHO: Geneva, Switzerland, 2017. [Google Scholar]
  5. Sixt, M.; Strube, J. Systematic and model-assisted evaluation of solvent based- or pressurized hot water extraction for the extraction of Artemisinin from Artemisia annua L. Processes 2017, 5, 86. [Google Scholar] [CrossRef]
  6. Sixt, M.; Schmidt, A.; Mestmäcker, F.; Huter, M.J.; Uhlenbrock, L.; Strube, J. Systematic and model-assisted process design for the extraction and purification of Artemisinin from Artemisia annua L.—Part I: Conceptual process design and cost estimation. Processes 2018, 6, 161. [Google Scholar] [CrossRef]
  7. Huter, M.J.; Schmidi, A.; Mestmäcker, F.; Sixt, M.; Strube, J. Systematic and model-assisted process design for the extraction and purification of Artemisinin from Artemisia annua L.—Part III: Chromatographic Purification. Processes 2018, 6, 180. [Google Scholar] [CrossRef]
  8. Mestmäcker, F; Schmidi, A.; Huter, M.J.; Sixt, M.; Strube, J. Systematic and model-assisted process design for the extraction and purification of Artemisinin from Artemisia annua L.—Part IV: Crystallization. Processes 2018, 6, 181. [Google Scholar] [CrossRef]
  9. Bart, H.-J.; Garthe, D.; Grömping, T.; Pfennig, A.; Schmidt, S.; Stichlmair, J. Vom Einzeltropfen zur Extraktionskolonne. Chem. Ing. Tech. 2006, 78, 543–547. [Google Scholar] [CrossRef]
  10. Buchbender, F.; Schmidt, M.; Steinmetz, T.; Pfennig, A. Simulation von Extraktionskolonnen in der industriellen Praxis. Chem. Ing. Tech. 2012, 84, 540–546. [Google Scholar] [CrossRef]
  11. Schmidt, A.; Richter, M.; Rudolph, F.; Strube, J. Integration of aqueous two-phase extraction as cell harvest and capture operation in the manufacturing process of monoclonal antibodies. Antibodies 2017, 6, 21. [Google Scholar] [CrossRef]
  12. Eggersgluess, J.; Wellsandt, T.; Strube, J. Integration of aqueous two-phase extraction into downstream processing. Chem. Eng. Technol. 2014, 37, 1686–1696. [Google Scholar] [CrossRef]
  13. Eggersgluess, J.K.; Both, S.; Strube, J. Process development for the extraction of biomolecules application for downstream processing of proteins in aqueous two-phase systems. Chim. Oggi-Chem. Today 2012, 30, 32–36. [Google Scholar]
  14. Eggersgluess, J.K.; Richter, M.; Dieterle, M.; Strube, J. Multi-stage aqueous two-phase extraction for the purification of monoclonal antibodies. Chem. Eng. Technol. 2014, 37, 675–682. [Google Scholar] [CrossRef]
  15. Wellsandt, T.; Stanisch, B.; Strube, J. Efficient liquid/liquid extraction by a milli device based on hydrophobic membranes. Chem. Ing. Tech. 2015, 87, 1053. [Google Scholar] [CrossRef]
  16. Wellsandt, T.; Stanisch, B.; Strube, J. Characterization Method for Separation Devices Based on Micro Technology. Chem. Ing. Tech. 2015, 87, 150–158. [Google Scholar] [CrossRef]
  17. Helling, C.; Strube, J. Future processing and recycling strategies for rare earths. Chem. Ing. Tech. 2013, 85, 1272–1281. [Google Scholar] [CrossRef]
  18. Chartes, R.H.; Korchinsky, W.J. Modelling of liquid-liquid extraction columns predicting the influence of drop size distribution. Trans. Inst. Chem. Eng. 1975, 53, 247–254. [Google Scholar]
  19. Casamatta, G.; Vogelpohl, A. Modellierung der Fluiddynamik und des Stoffübergangs in Extraktionskolonnen. Chem. Ing. Tech. 1984, 56, 230–231. [Google Scholar] [CrossRef]
  20. Steiner, L. Rechnerische Erfassung der Arbeitsweise von FlüSsig-FlüSsig Extraktionskolonnen; Fortschritt-Berichte VDI: Düsseldorf, Germany, 1988. [Google Scholar]
  21. Houghton, P.A.; Madurawe, R.U.; Hatton, T.A. Convective and dispersion models for dispersed phase axial mixing—The significance of polydispersity effects in liquid-liquid contactors. Chem. Eng. Sci. 1988, 43, 617–639. [Google Scholar] [CrossRef]
  22. Leistner, J. Modellierung und Simulation Physikalischer, Dissoziativer und Reaktiver Extraktionsprozesse; Zugl.: Dortmund, Univ., Diss., 2004; Shaker: Aachen, Germany, 2005. [Google Scholar]
  23. Leistner, J.; Górak, A.; Bäcker, W.; Strube, J. Extraktion als mittel zur abwasseraufarbeitung. Chem. Ing. Tech. 2002, 74, 606. [Google Scholar] [CrossRef]
  24. Leistner, J.; Goerge, A.; Baecker, W.; Górak, A.; Strube, J. Modelling methodology for the simulation of solvent extraction processes–cobalt/nickel. In Proceedings of the International Solvent Extraction Conference, South Africa, 17–21 March 2002; pp. 958–963. [Google Scholar]
  25. Kolb, P. Hydrodynamik und Stoffaustausch in Einem Gerührten Miniplantextraktor der Bauart Kühni; Technische Universität Kaiserslautern: Kaiserslautern, Germany, 2004. [Google Scholar]
  26. Steinmetz, T. Tropfenpopulationsbilanzgestütztes Auslegungsverfahren zur Skalierung einer gerührten Miniplant-Extraktionskolonne; VDI-Verl.: Düsseldorf, Germany, 2007. [Google Scholar]
  27. Danckwerts, P.V. Continuous flow systems. Chem. Eng. Sci. 1953, 2, 1–13. [Google Scholar] [CrossRef]
  28. Levenspiel, O. Chemical Reaction Engineering; Wiley: New York, NY, USA, 1999. [Google Scholar]
  29. Lapkin, A.A.; Walker, A.; Sullivan, N.; Khambay, B.; Mlambo, B.; Chemat, S. Development of HPLC analytical protocol for artemisinin quantification in plant materials and extracts. J. Pharm. Biomed. Anal. 2009, 49, 908–915. [Google Scholar] [CrossRef] [PubMed]
  30. Qu, H.; Christensen, K.B.; Fretté, X.C.; Tian, F.; Rantanen, J.; Christensen, L.P. Chromatography-Crystallization Hybrid Process for Artemisinin Purification from Artemisia annua. Chem. Eng. Tech. 2010, 33, 791–796. [Google Scholar] [CrossRef]
  31. Eggersglüß, J. Entwicklung und Auslegung von Flüssig-Flüssig Bioextraktionsprozessen. Antikörperaufreinigung mit wässrigen Zweiphasensystemen. 2013 u.d.T.: Prozessentwicklung und Auslegung von Flüssig-Flüssig Bioextraktionsprozessen: Antikörperaufreinigung mit wässrigen Zweiphasensystemen; Shaker: Aachen, Germany, 2014. [Google Scholar]
Figure 1. Basic process design for plant based substances (LLE, liquid-liquid extraction) [6].
Processes 06 00179 g001
Figure 2. Overview of the investigated extraction columns and their position in the overall production chain. SLE (solid-liquid extraction), LLE (liquid-liquid extraction), LPin (light phase inlet), HPin (heavy phase inlet) LPout (light phase outlet), HPout (heavy phase outlet).
Processes 06 00179 g002
Figure 3. Distribution coefficient, separation factor and yield as a function of solvent ratio. MTBE (methyl tert-butyl ether).
Processes 06 00179 g003
Figure 4. Drop concentration at varying residence times (butyl acetate (d)–solid-liquid extraction (SLE) extract (c)).
Processes 06 00179 g004
Figure 5. Droplet rise velocities of the investigated systems in relation to the droplet diameter including data from [31].
Processes 06 00179 g005
Figure 6. Comparison of settling behavior between toluene–water/acetone (blue) and butyl acetate–water/acetone (red) as well as toluene–SLE extract (blue)and butyl acetate–SLE extract (red) at 1 min stirring time and a speed of 400 rpm. The top phase is continuous and it starts to sediment more quickly than the dispersed bottom phases.
Processes 06 00179 g006
Figure 7. Comparison of the concentration profiles of artemisinin across the column height of the light and heavy phase in the experimental progression of the first and second operating points of extraction obtained by HPLC. OP (operating point), BAC (butyl acetate), Conc. (concentration).
Processes 06 00179 g007
Figure 8. Comparison of the purity profiles across the column height of the light phase in the experimental progression of the first and second operating points of extraction. Purities are obtained by HPLC method described in Section 3.2. OP (operating point), BAC (butyl acetate), HPLC (high performance liquid chromatography).
Processes 06 00179 g008
Figure 9. Comparison of model-based prediction of the steady-state concentration profile of artemisinin for the first and second operating point and the corresponding experiments. OP (operating point), BAC (butyl acetate), Conc. (concentration).
Processes 06 00179 g009
Figure 10. Comparison of the concentration profiles of artemisinin across the column height of the light phase in the experimental progression of the first and second operating points of scrubbing. Concentrations are obtained by HPLC. OP (operating point), BAC (butyl acetate), Conc. (concentration).
Processes 06 00179 g010
Figure 11. Comparison of the purity profiles across the column height of the light phase in the experimental progression of the first and second operating points of scrubbing. Purities are obtained by HPLC method described in Section 3.2.
Processes 06 00179 g011
Figure 12. Overview of investigated hold-ups in Kühni and packed extraction columns. OP (operating point), Pre. Exp. (preliminary experiment), PEC (packed extraction column).
Processes 06 00179 g012
Table 1. Determination of the kL·a value for artemisinin from Solid-liquid extraction (SLE) extract (c) in butyl acetate (d).
Time IntervalTime DiffereceConcentration DifferencekL·a
(s)(s)(g/L)(1/s)
2.5–8.15.60.3820.000285
8.1–11.83.70.1980.000265
11.8–16.95.10.3580.000233
16.9–30.113.20.6600.000210
Ø0.000248
Table 2. Inlet and outlet parameters for the first and second operating point in the extraction column. Concentration and purity of artemisinin are obtained by High performance liquid chromatography (HPLC). BAC (butyl acetate), SLE (solid-liquid extraction), ELSD (evaporative light scattering detector).
ParameterDimensionBAC (d)SLE-Extract (c)
Inlet parameters first extraction operating point.
Mass Flow(g/min)18.86 ± 0.9159.65 ± 0.42
Volume Flow(mL/min)21.65 ± 1.0664.14 ± 0.73
Density(kg/m³)871 ± 0.5931 ± 0.5
Concentration(g/L)---0.84 ± 0.02
ELSD-Purity(%)---35.39 ± 1.41
Outlet parameters first extraction operating point.
Mass Flow(g/min)38.09 ± 3.9340.99 ± 3.55
Volume Flow(mL/min)44.50 ± 4.7442.30 ± 3.82
Density(kg/m³)856 ± 0.5969 ± 0.5
Concentration(g/L)1.26 ± 0.070.01 ± 0.01
ELSD-Purity(%)43.40 ± 2.520.045 ± 0.045
Inlet parameters second extraction operating point.
Mass Flow(g/min)10.64 ± 0.2860.01 ± 0.01
Volume Flow(mL/min)12.21 ± 0.3264.53 ± 0.02
Density(kg/m³)871 ± 0.5931 ± 0.5
Concentration(g/L)---0.87 ± 0.01
ELSD-Purity(%)---41.84 ± 0.51
Outlet parameters second extraction operating point.
Mass Flow(g/min)18.60 ± 2.3052.01 ± 2.63
Volume Flow(mL/min)21.35 ± 2.7255.93 ± 3.03
Density(kg/m³)856 ± 0.5969 ± 0.5
Concentration(g/L)1.67 ± 0.170.01 ± 0.01
ELSD-Purity(%)49.88 ± 0.400.08 ± 0.08
Table 3. Composition of LP (light phase) and HP (heavy phase) according to Fourier-transform infrared (FTIR) after extraction and scrubbing (second operating point). Composition for BAC (butyl acetate), SLE (solid-liquid extraction) extract and HP scrub solution are based on the weighed in mass.
Extraction
ComponentDimensionBACSLE-ExtractLP ExtractHP Raffinate
Acetone(wt.-%)05046 ± 242 ± 2
Water(wt.-%)05011 ± 356 ± 3
Butylacetat(wt.-%)100043 ± 12 ± 1
Scrubbing
ComponentDimensionLP ExtractHP Scrub SolutionLP ScrubbedHP Scrub Liqour
Acetone(wt.-%)46 ± 204 ± 212 ± 2
Water(wt.-%)11 ± 3952 ± 288 ± 2
Butyl Acetate(wt.-%)43 ± 1094 ± 11 ± 1

