Systematic and Model-Assisted Process Design for the Extraction and Purification of Artemisinin from Artemisia annua L.—Part IV: Crystallization


Abstract
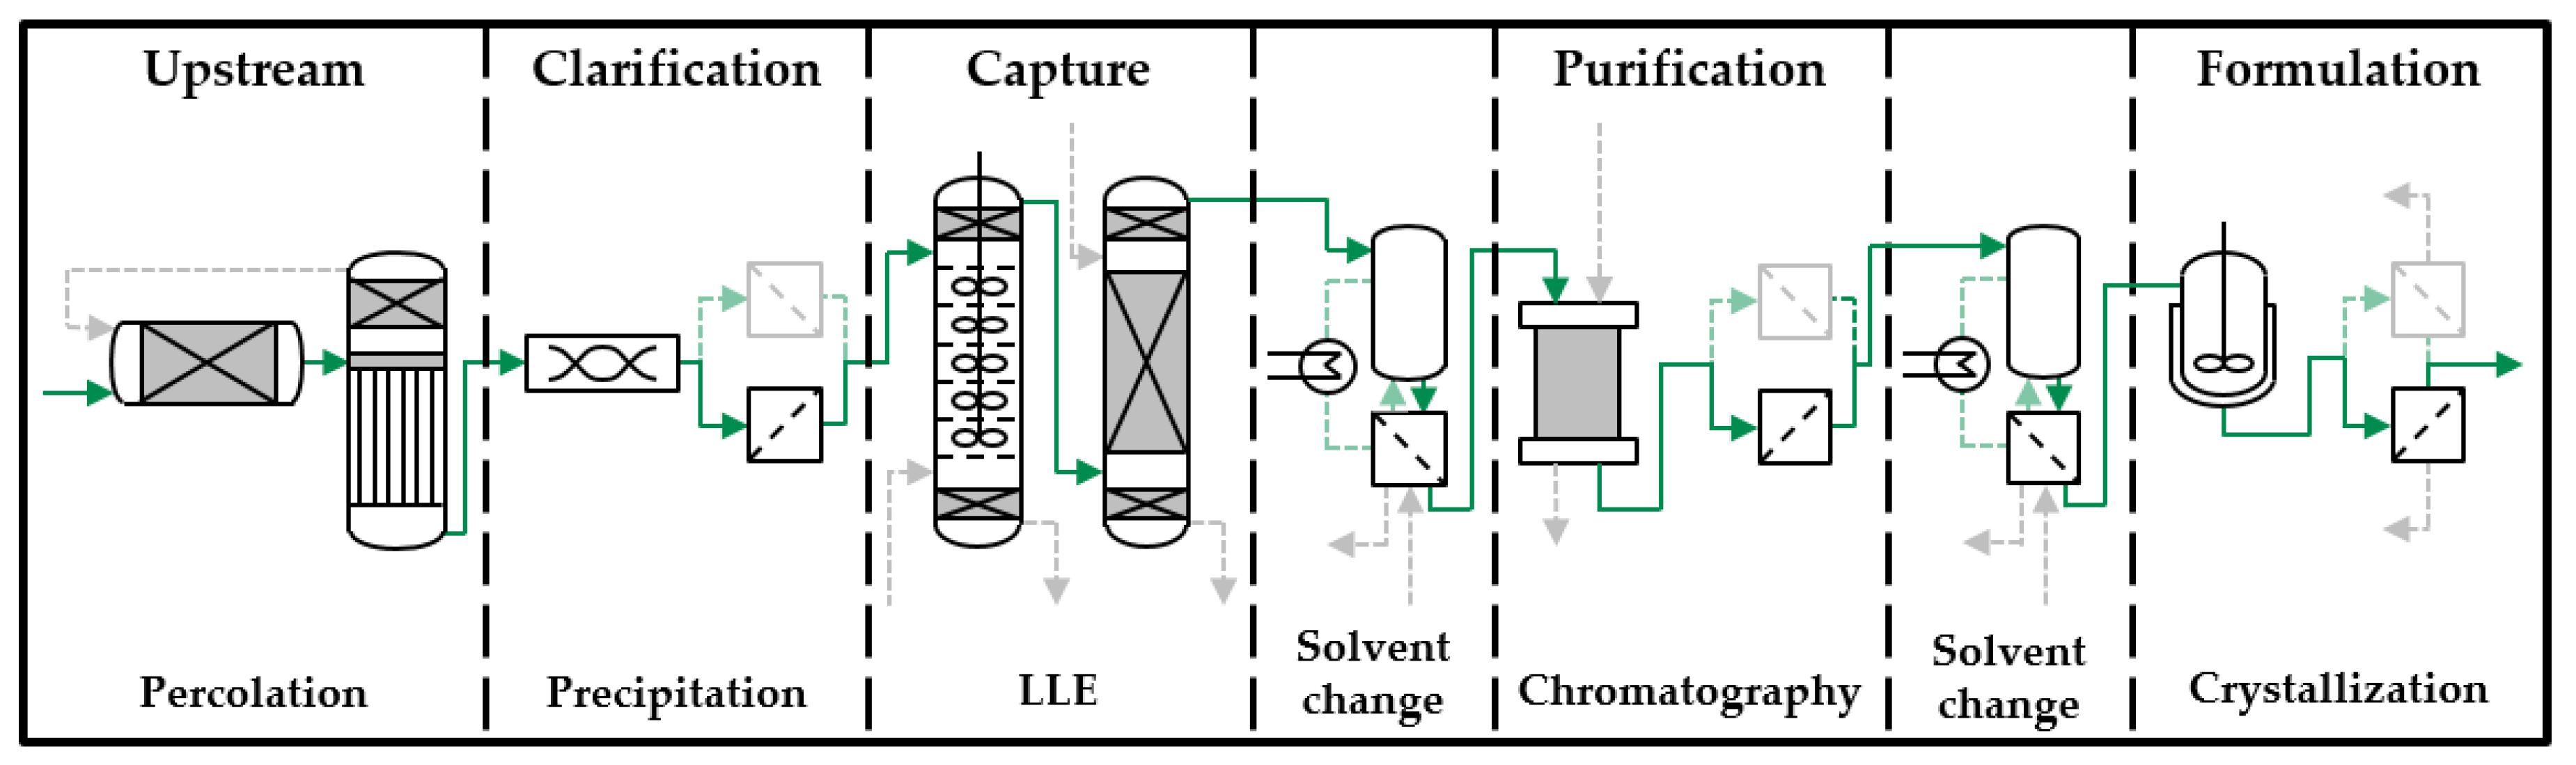
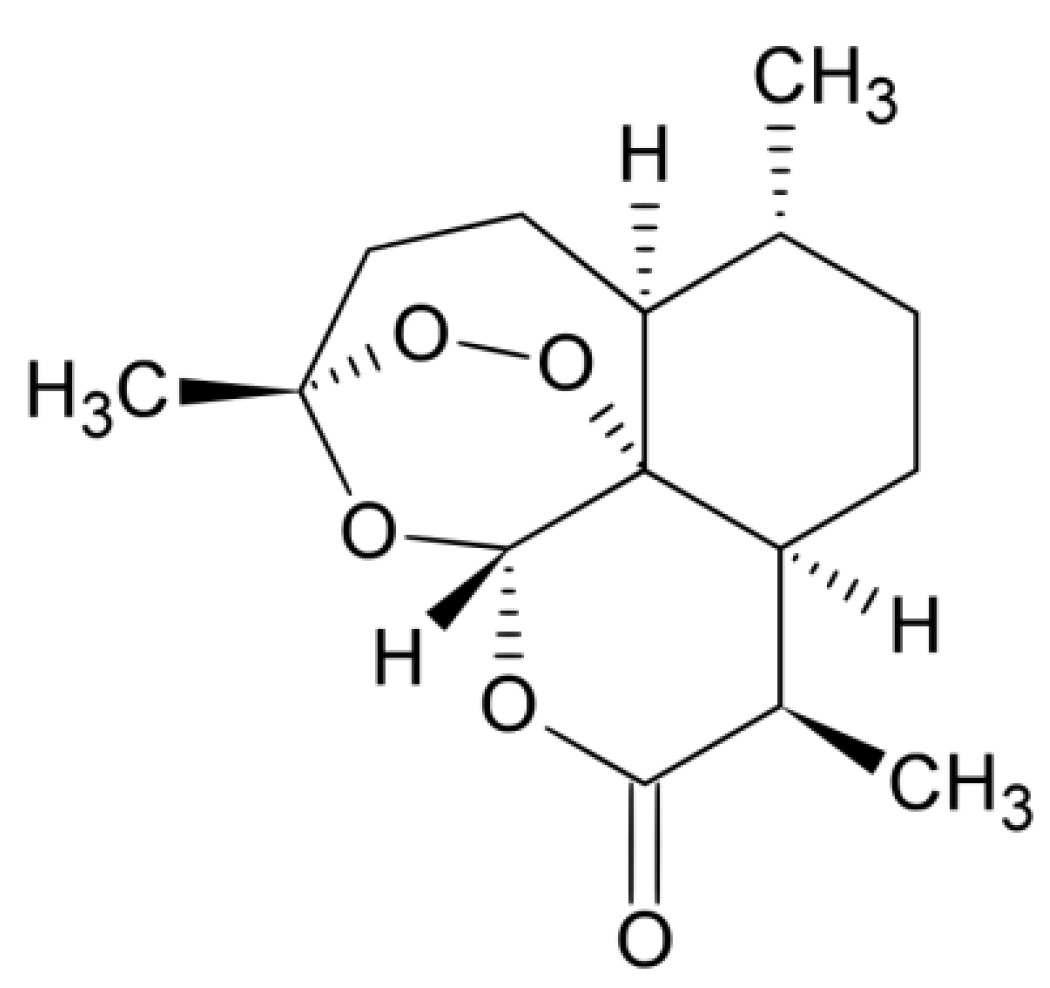
:1. Introduction
- Part 0:
- Sixt, M.; Strube, J. Systematic and model-assisted evaluation of solvent based- for pressurized hot water extraction for the extraction of Artemisinin from Artemisia annua L. Processes 2017, 5, 86, doi:10.3390/pr5040086 [7].
- Part I:
- Sixt, Schmidt et al. Systematic and model-assisted process design for the extraction and purification of Artemisinin from Artemisia annua L.—Part I: Conceptual process design and cost estimation. Processes 2018, 6, 161, doi:10.3390/pr6090161 [8].
- Part II:
- Schmidt, Sixt et al. Systematic and model-assisted process design for the extraction and purification of Artemisinin from Artemisia annua L.—Part II: Model-based design of agitated and packed columns for multistage extraction and scrubbing. Processes 2018, 6, 179, doi:10.3390/pr6100179 [9].
- Part III:
- Mestmäcker, Schmidt et al. Systematic and model-assisted process design for the extraction and purification of Artemisinin from Artemisia annua L.—Part III: Chromatographic Purification. Processes 2018, 6, 180, doi:10.3390/pr6100180 [10].
- Part IV:
- Huter, Schmidt et al. Systematic and model-assisted process design for the extraction and purification of Artemisinin from Artemisia annua L.—Part IV: Crystallization. (this article).
2. Material and Methods
2.1. Raw and Purified Material
2.2. Chemicals
2.3. Crystallization System Screening
2.4. Seed Crystals
2.5. Metastable Zone Width and Crystallization Experiments
2.6. Analytics
3. Results and Discussion
3.1. Crystallization of Artemisinin
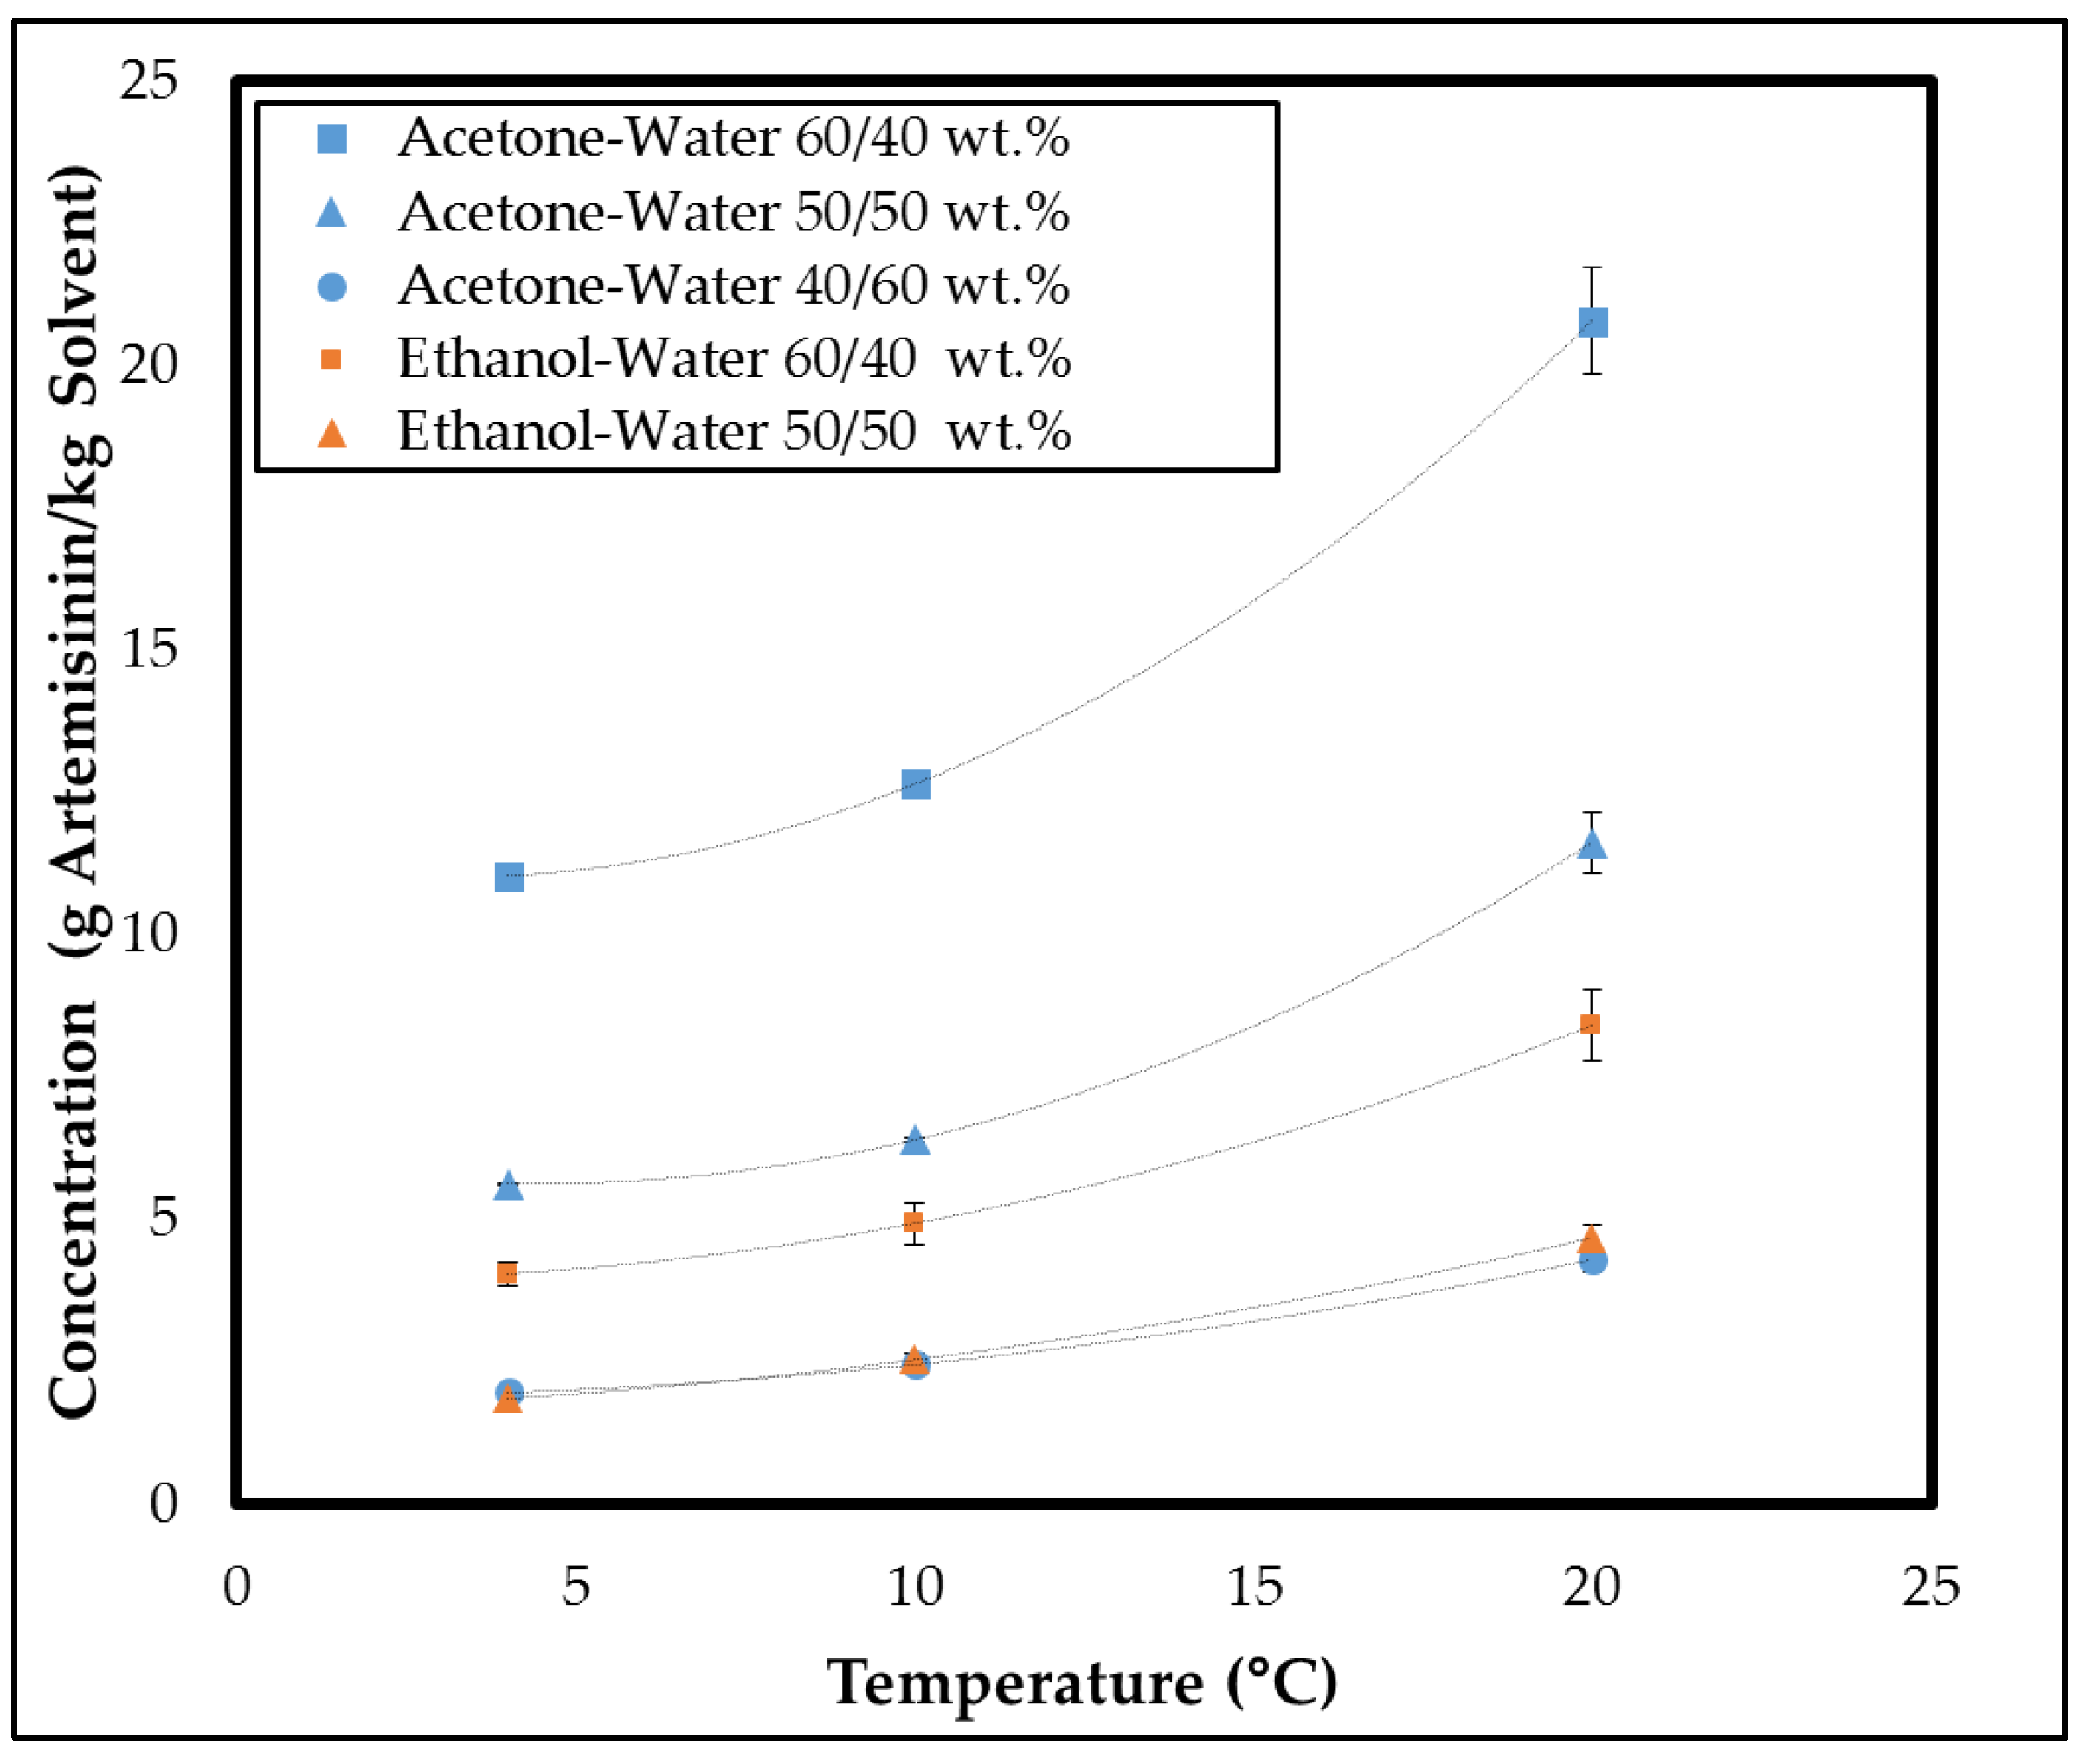
3.1.1. System Selection
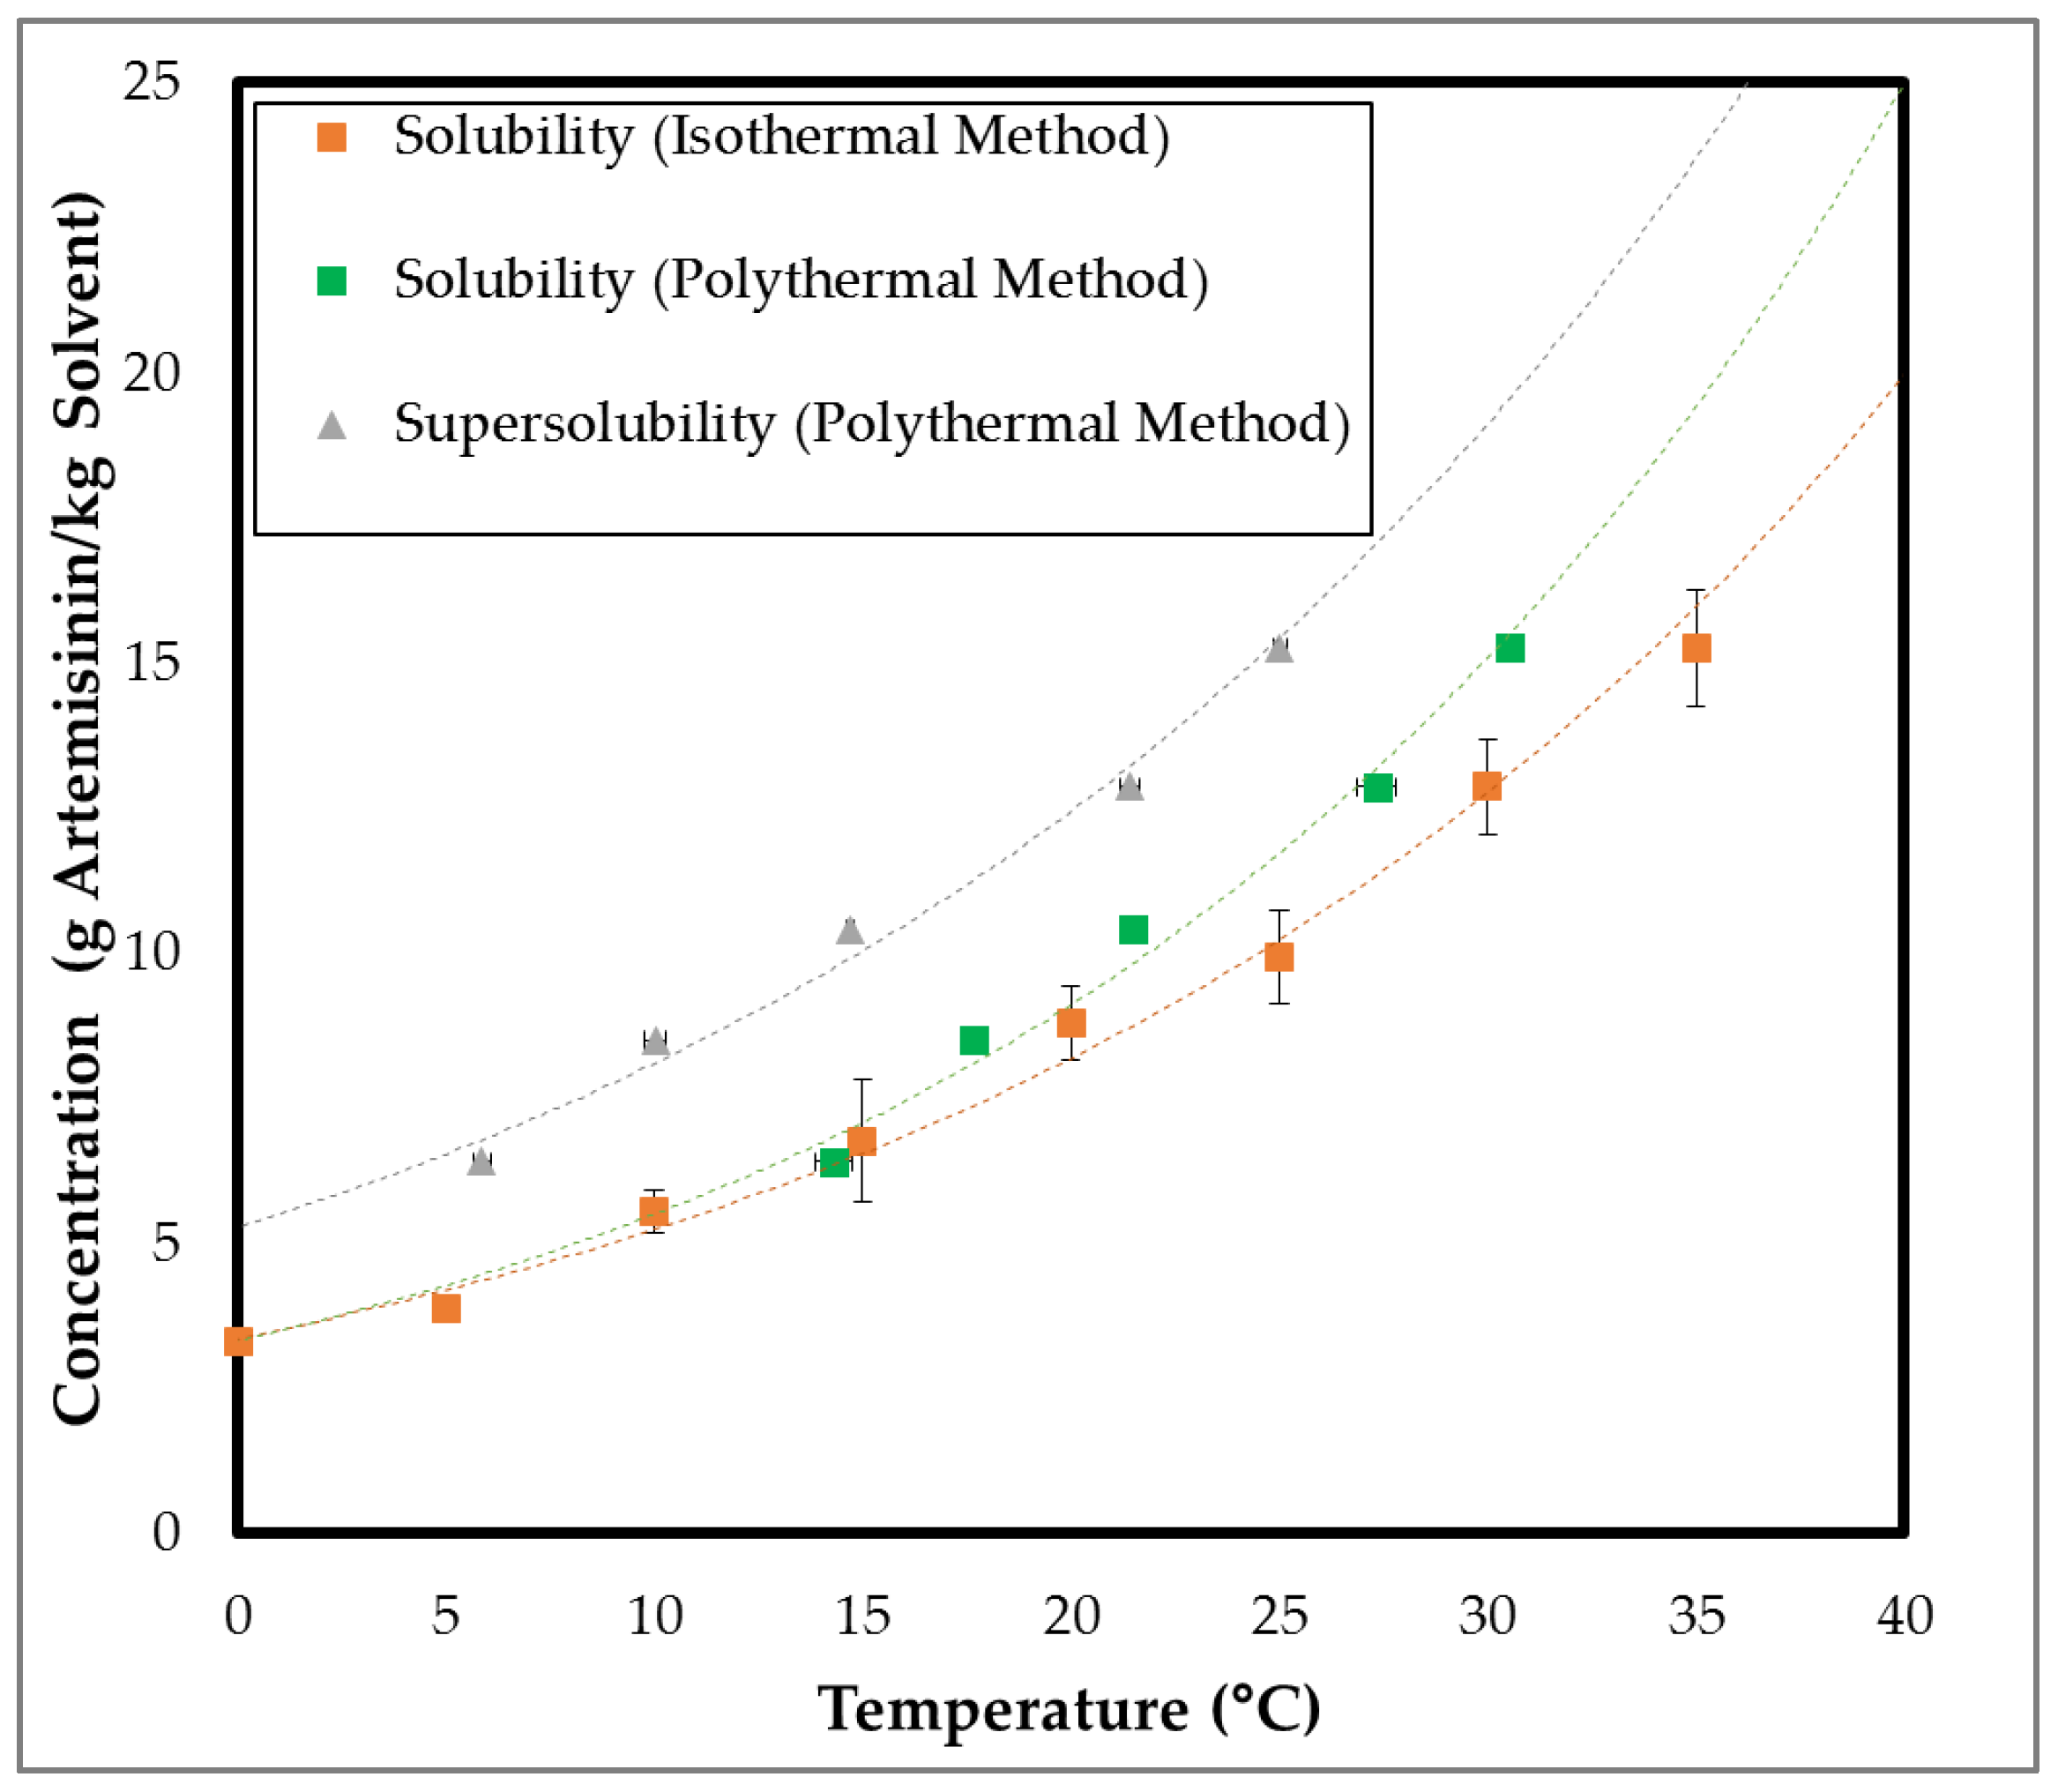
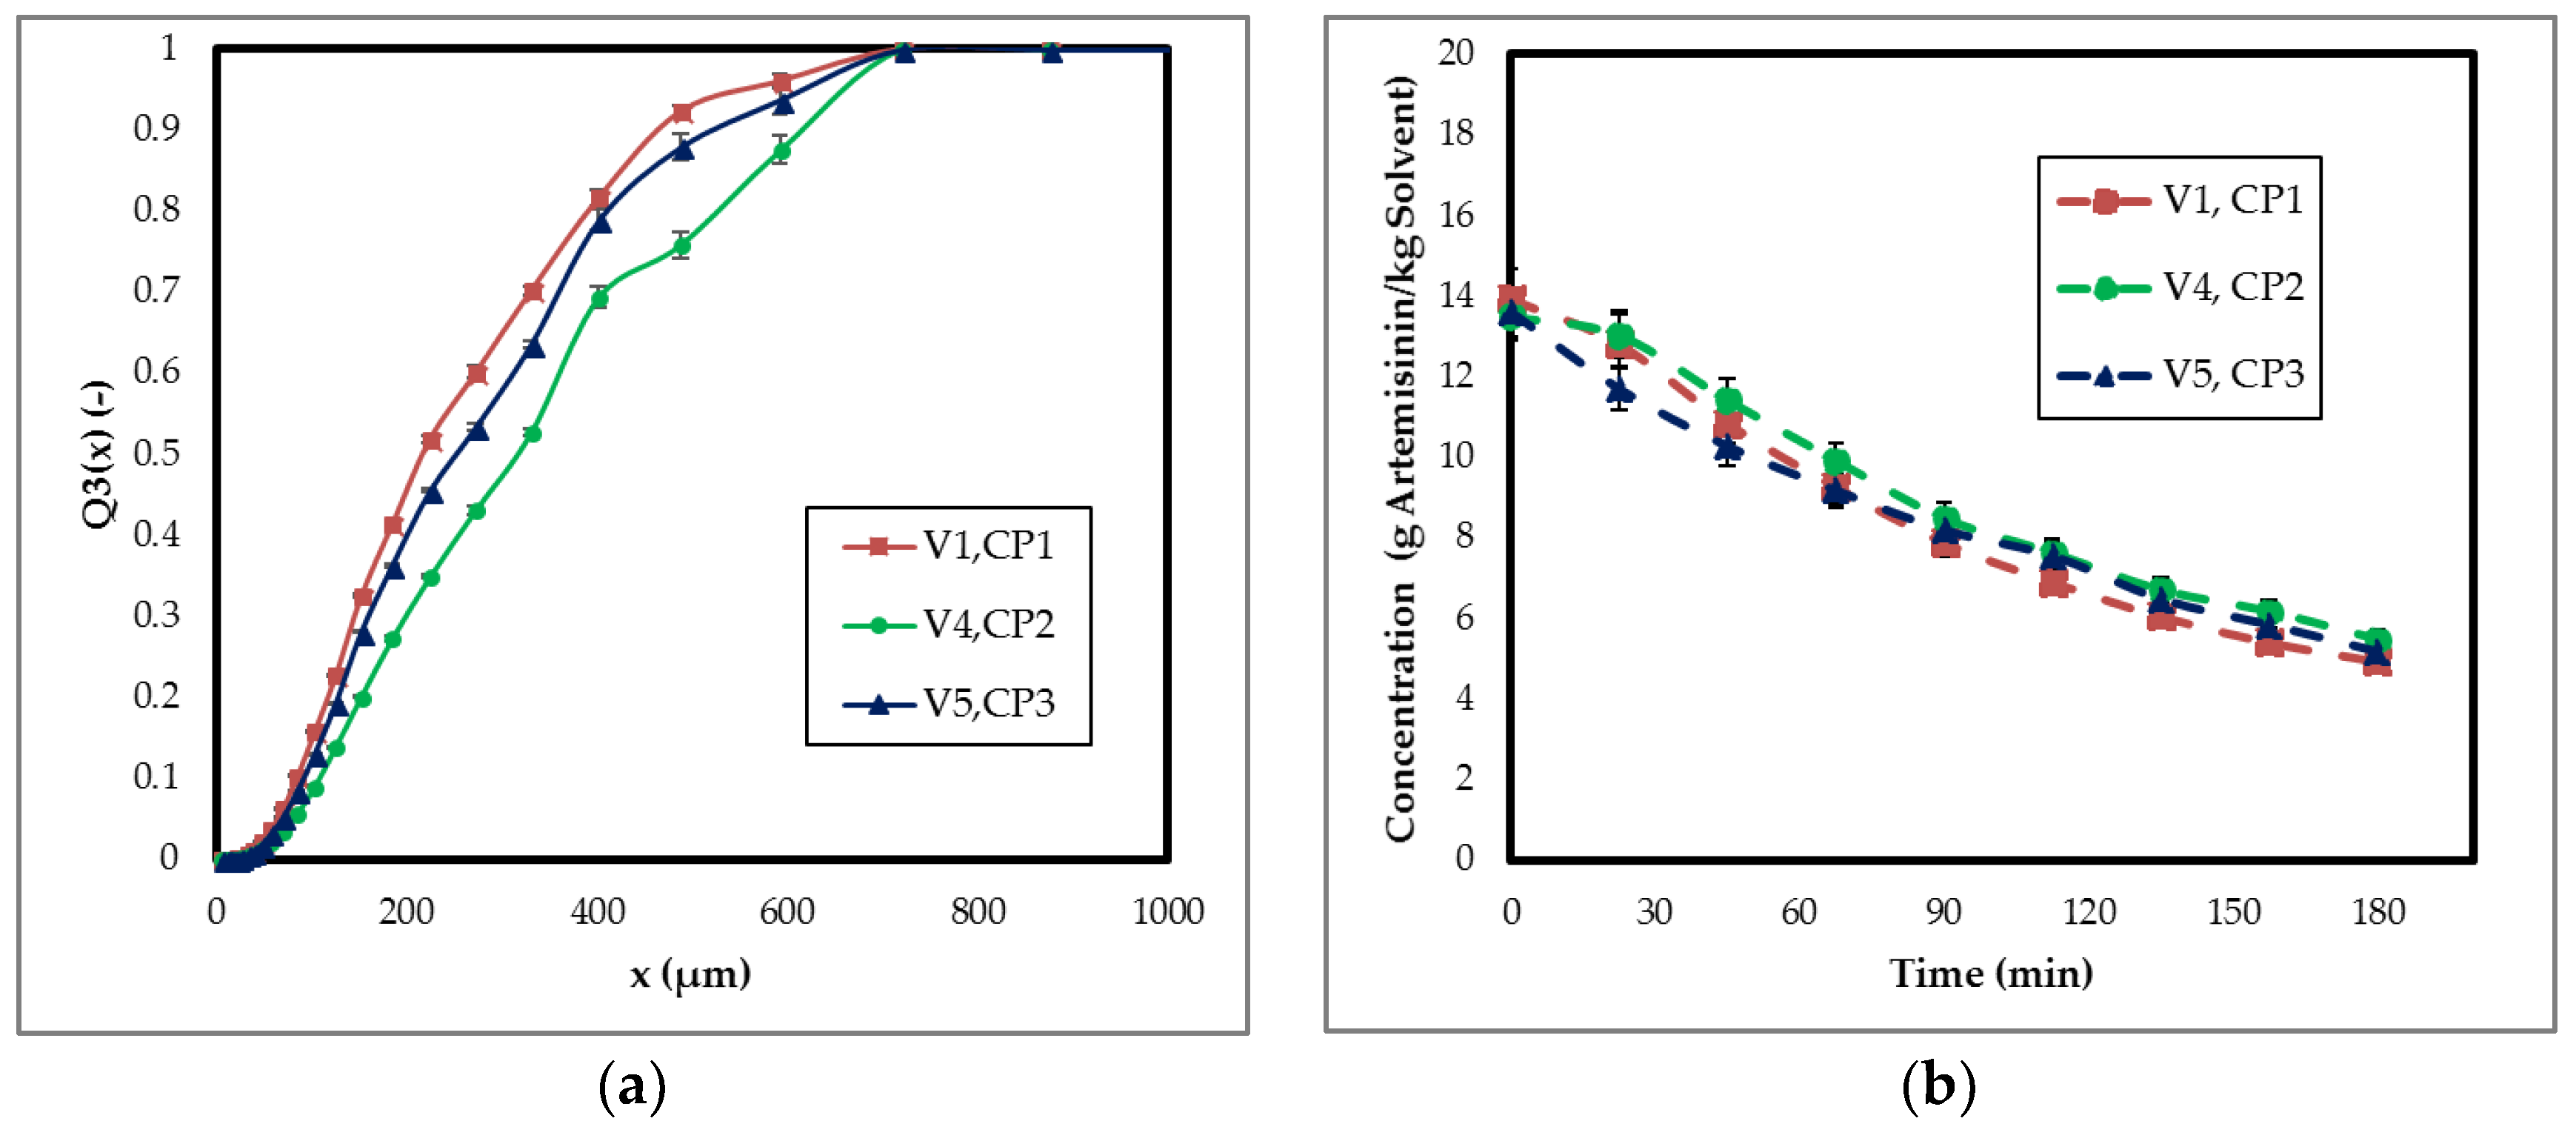
3.1.2. Metastable Zone Width
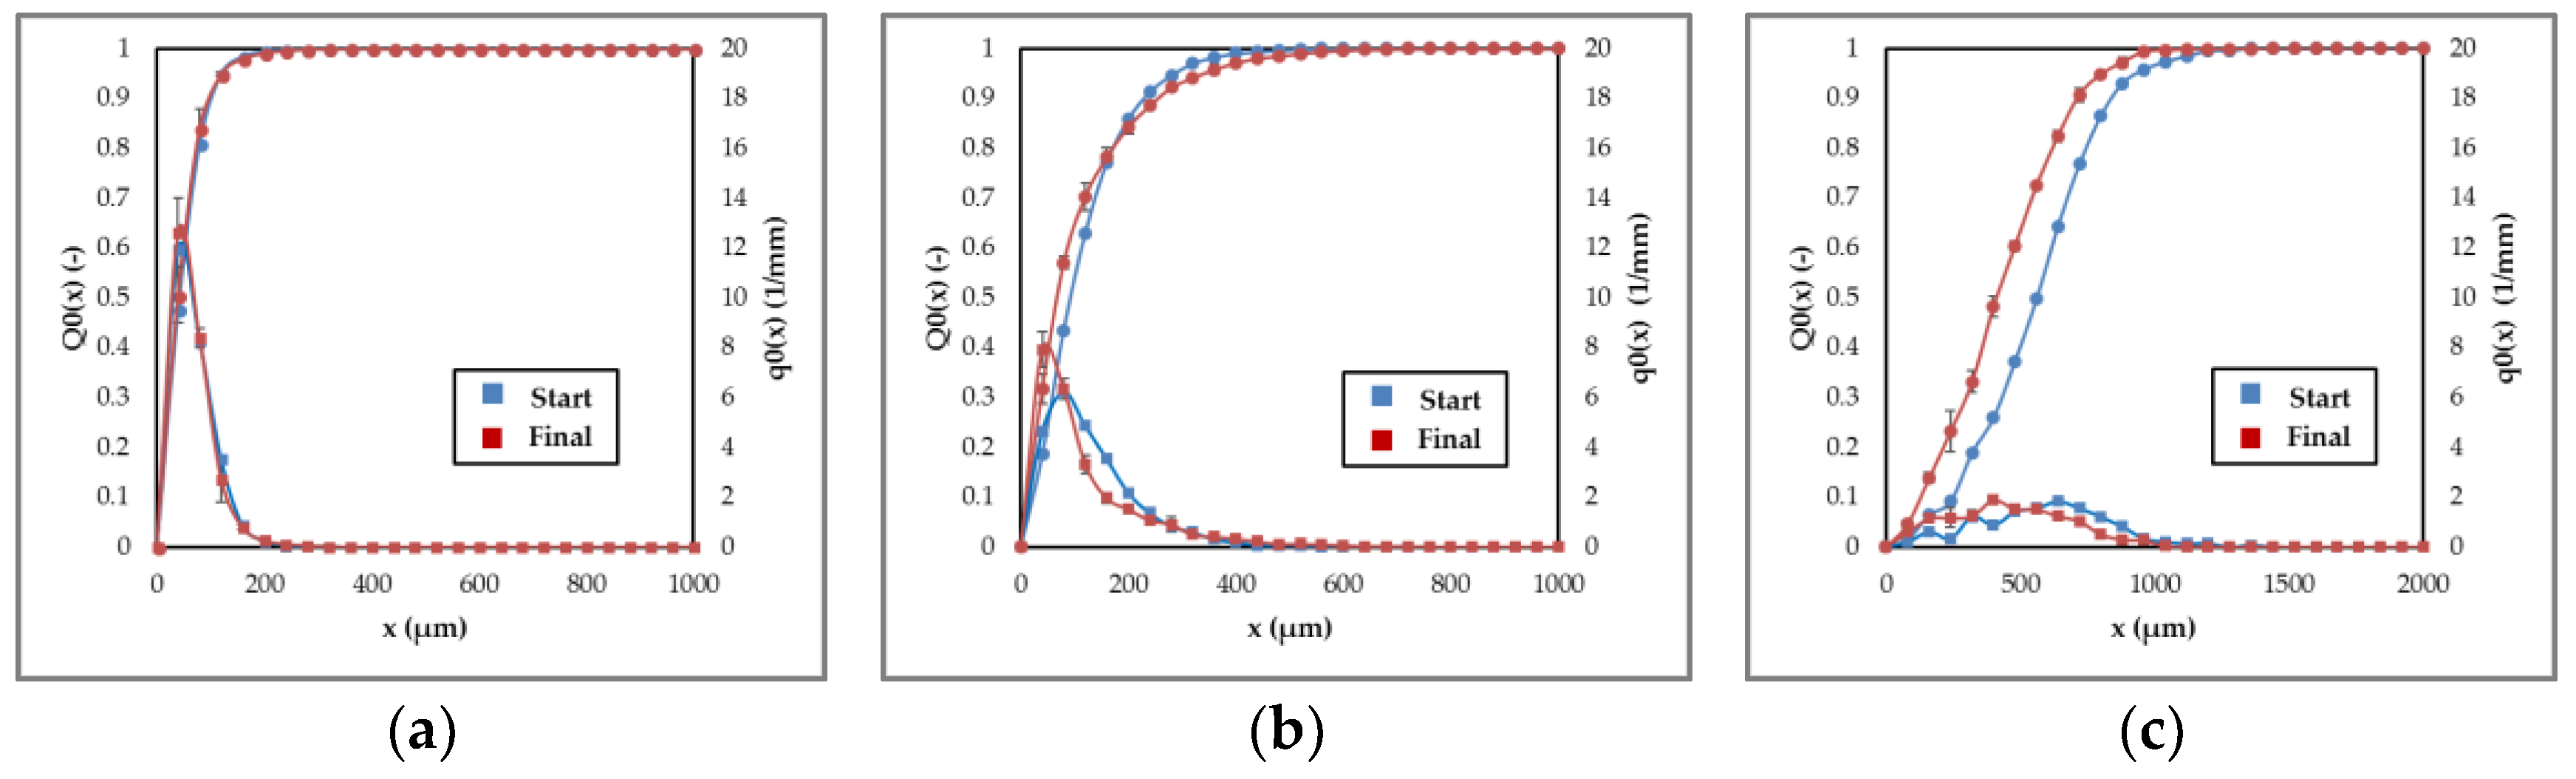
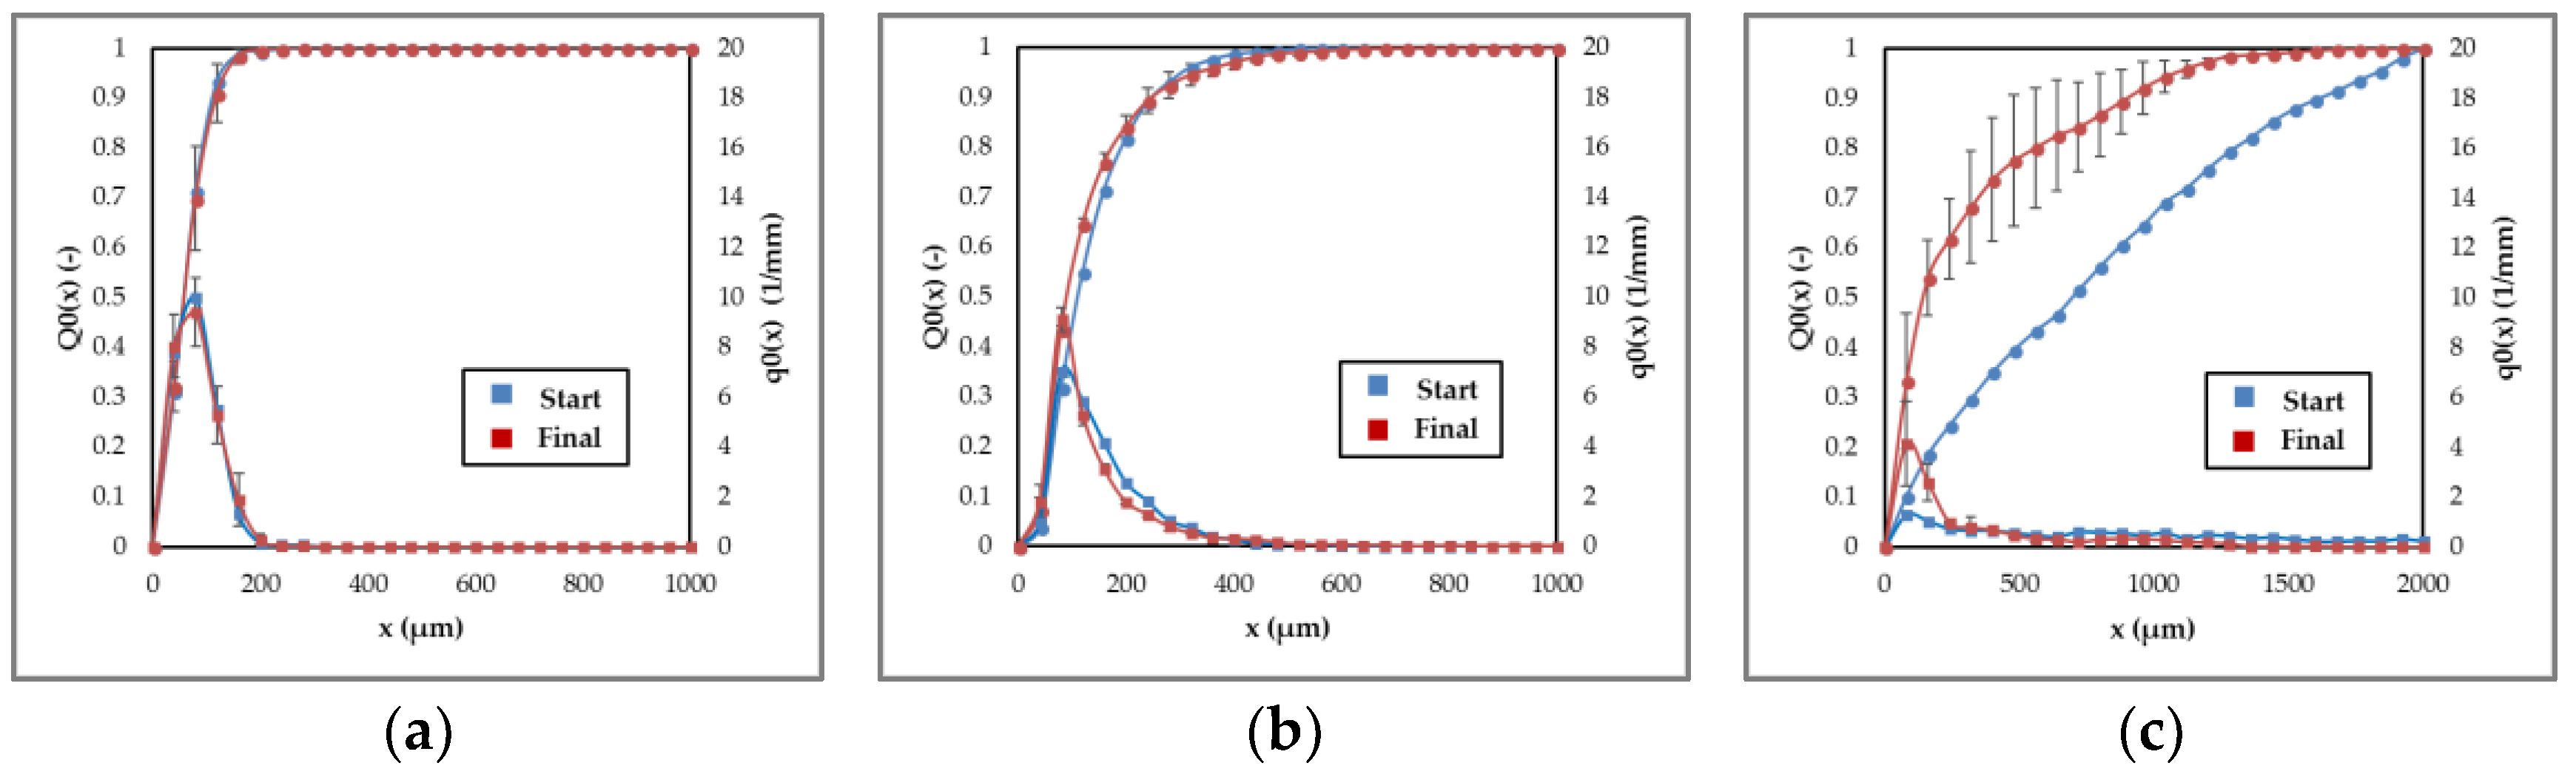
3.1.3. Agglomeration and Breakage
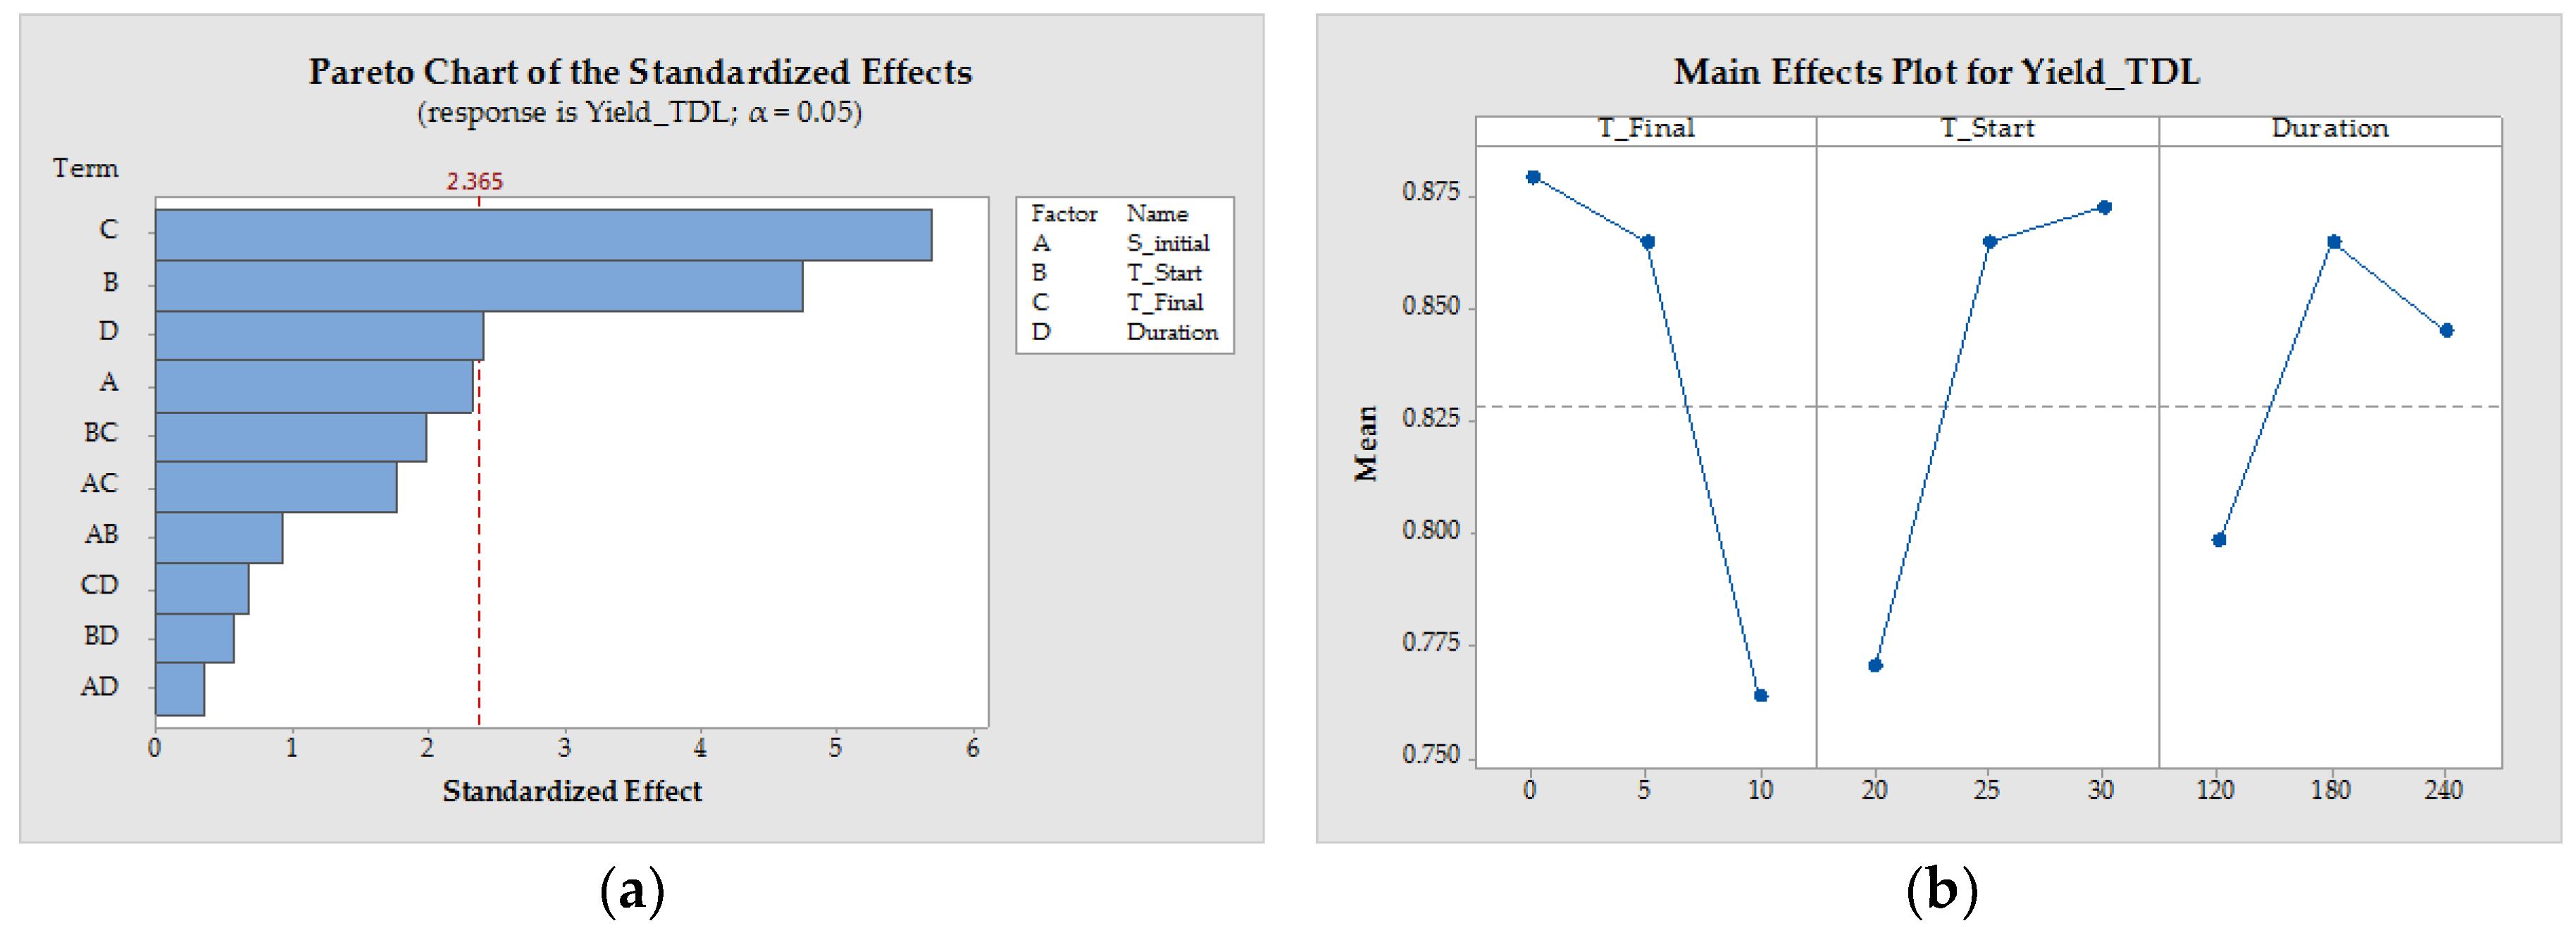
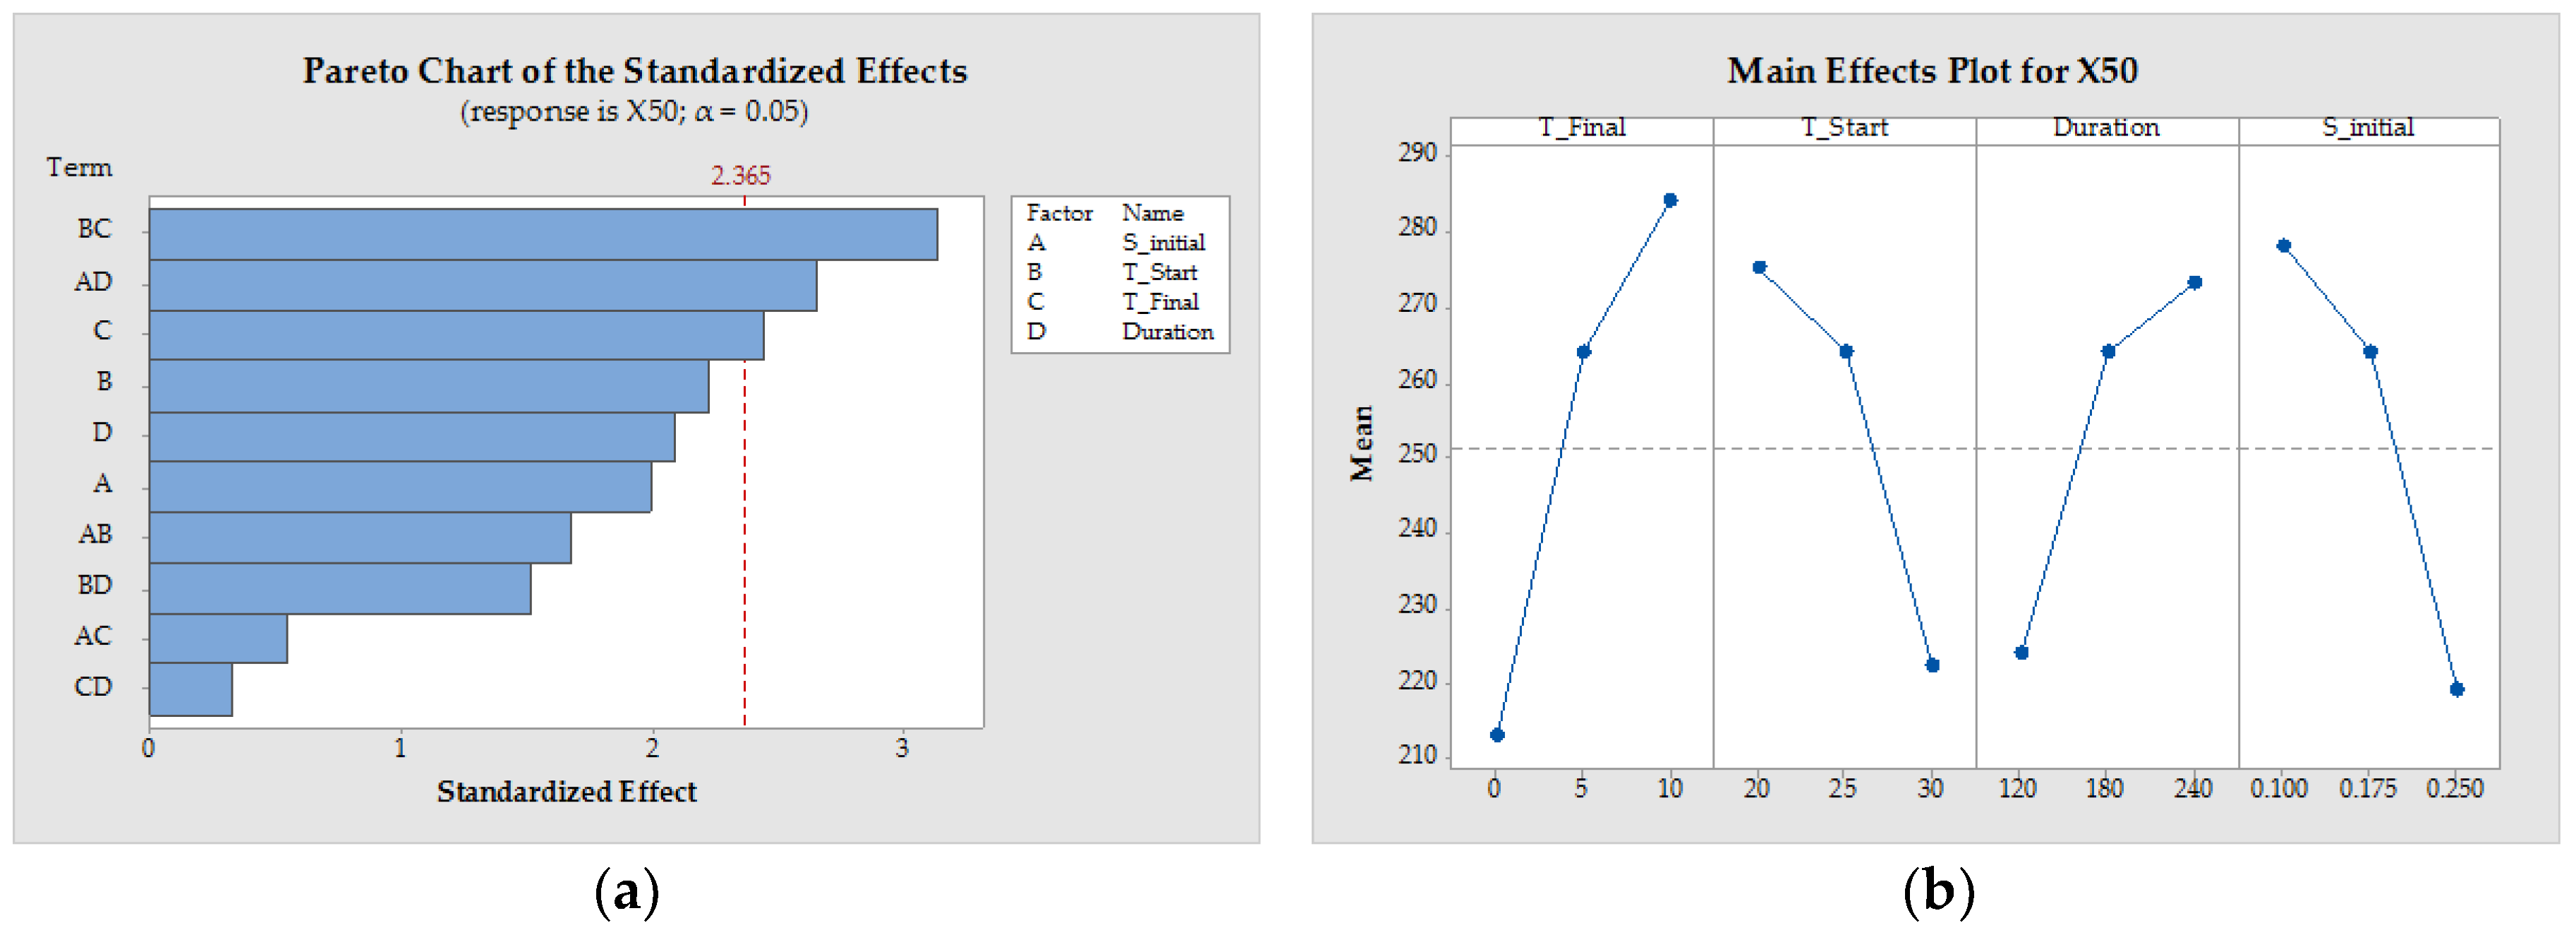
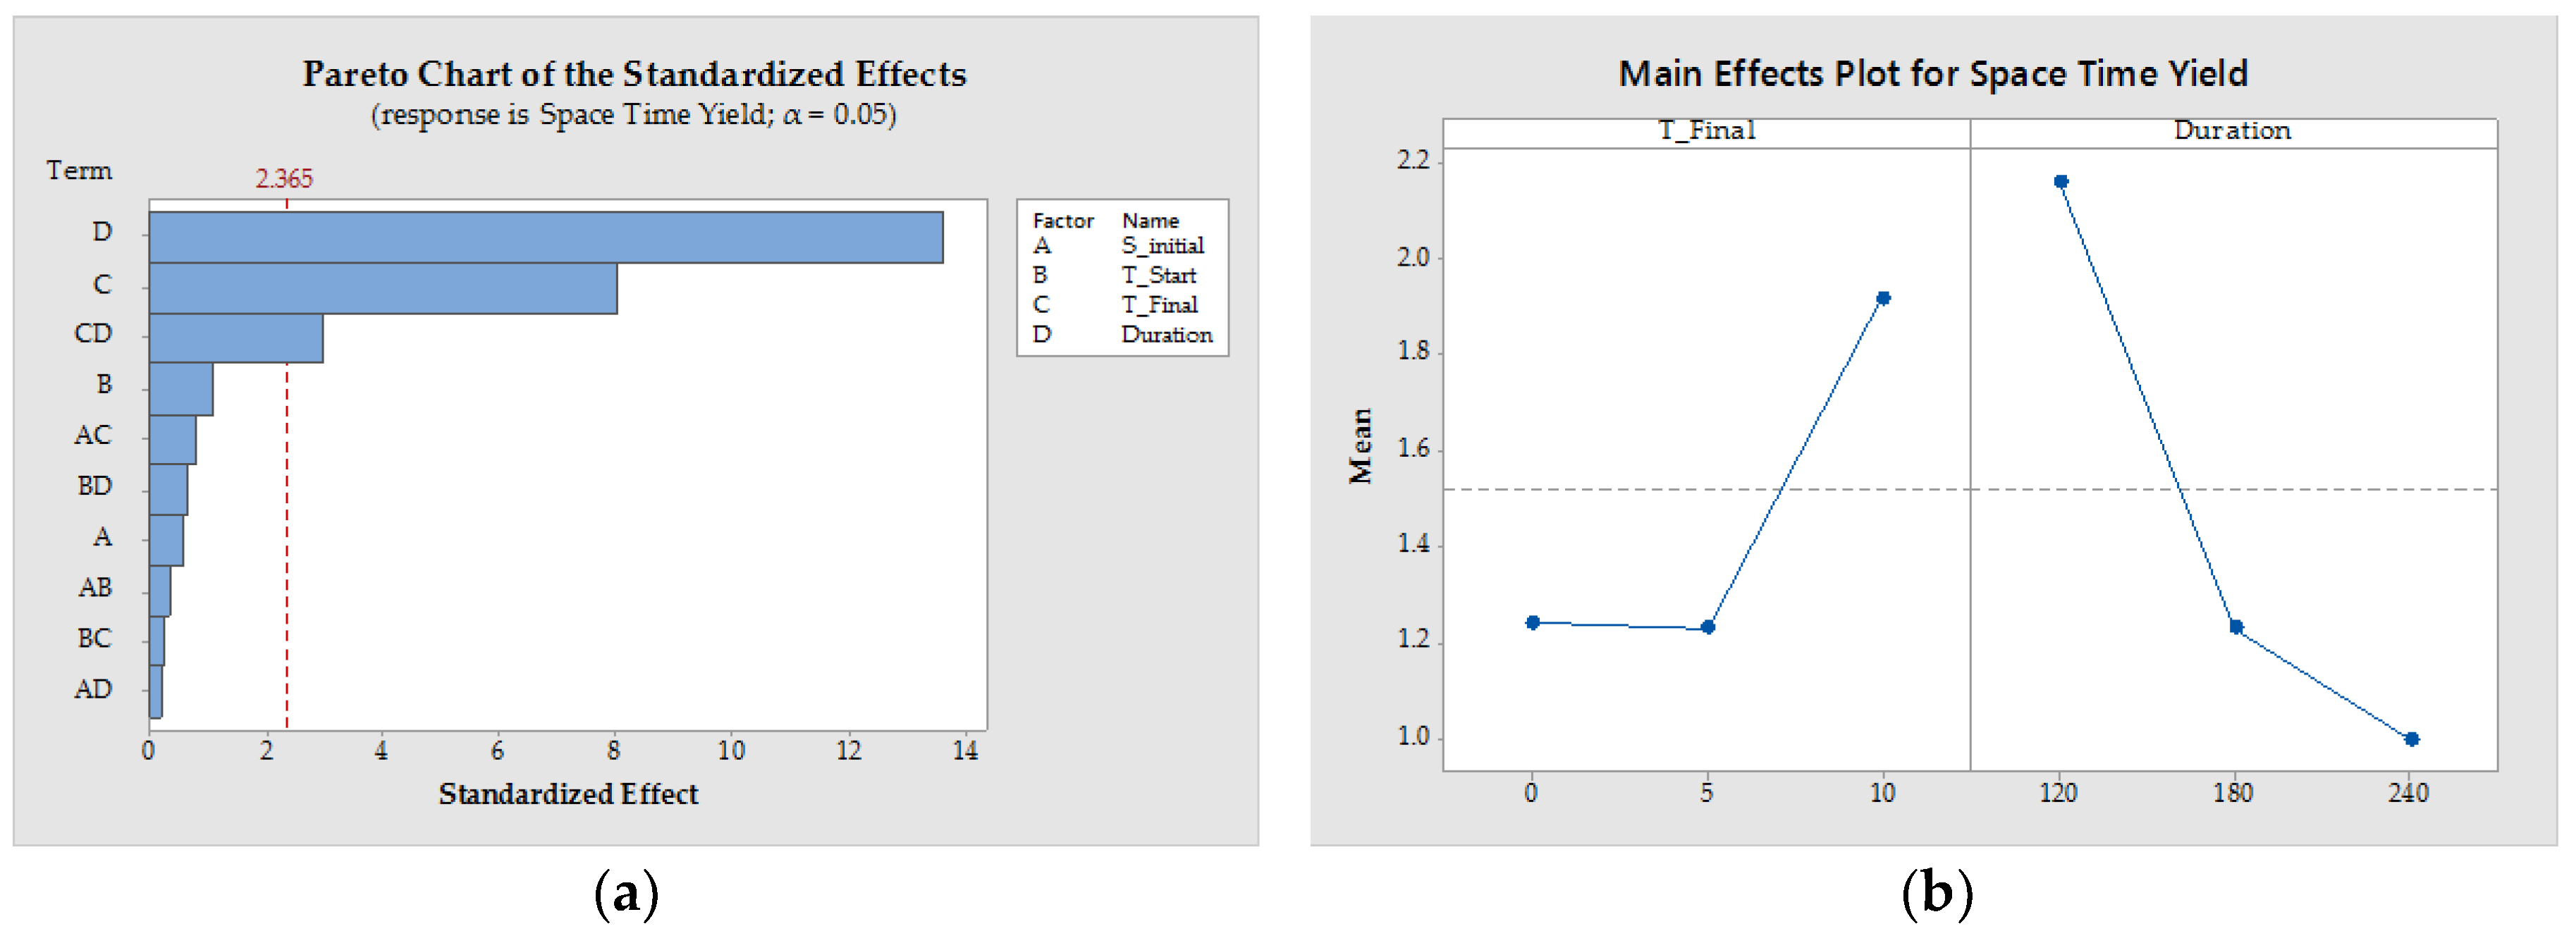
3.1.4. Process Design
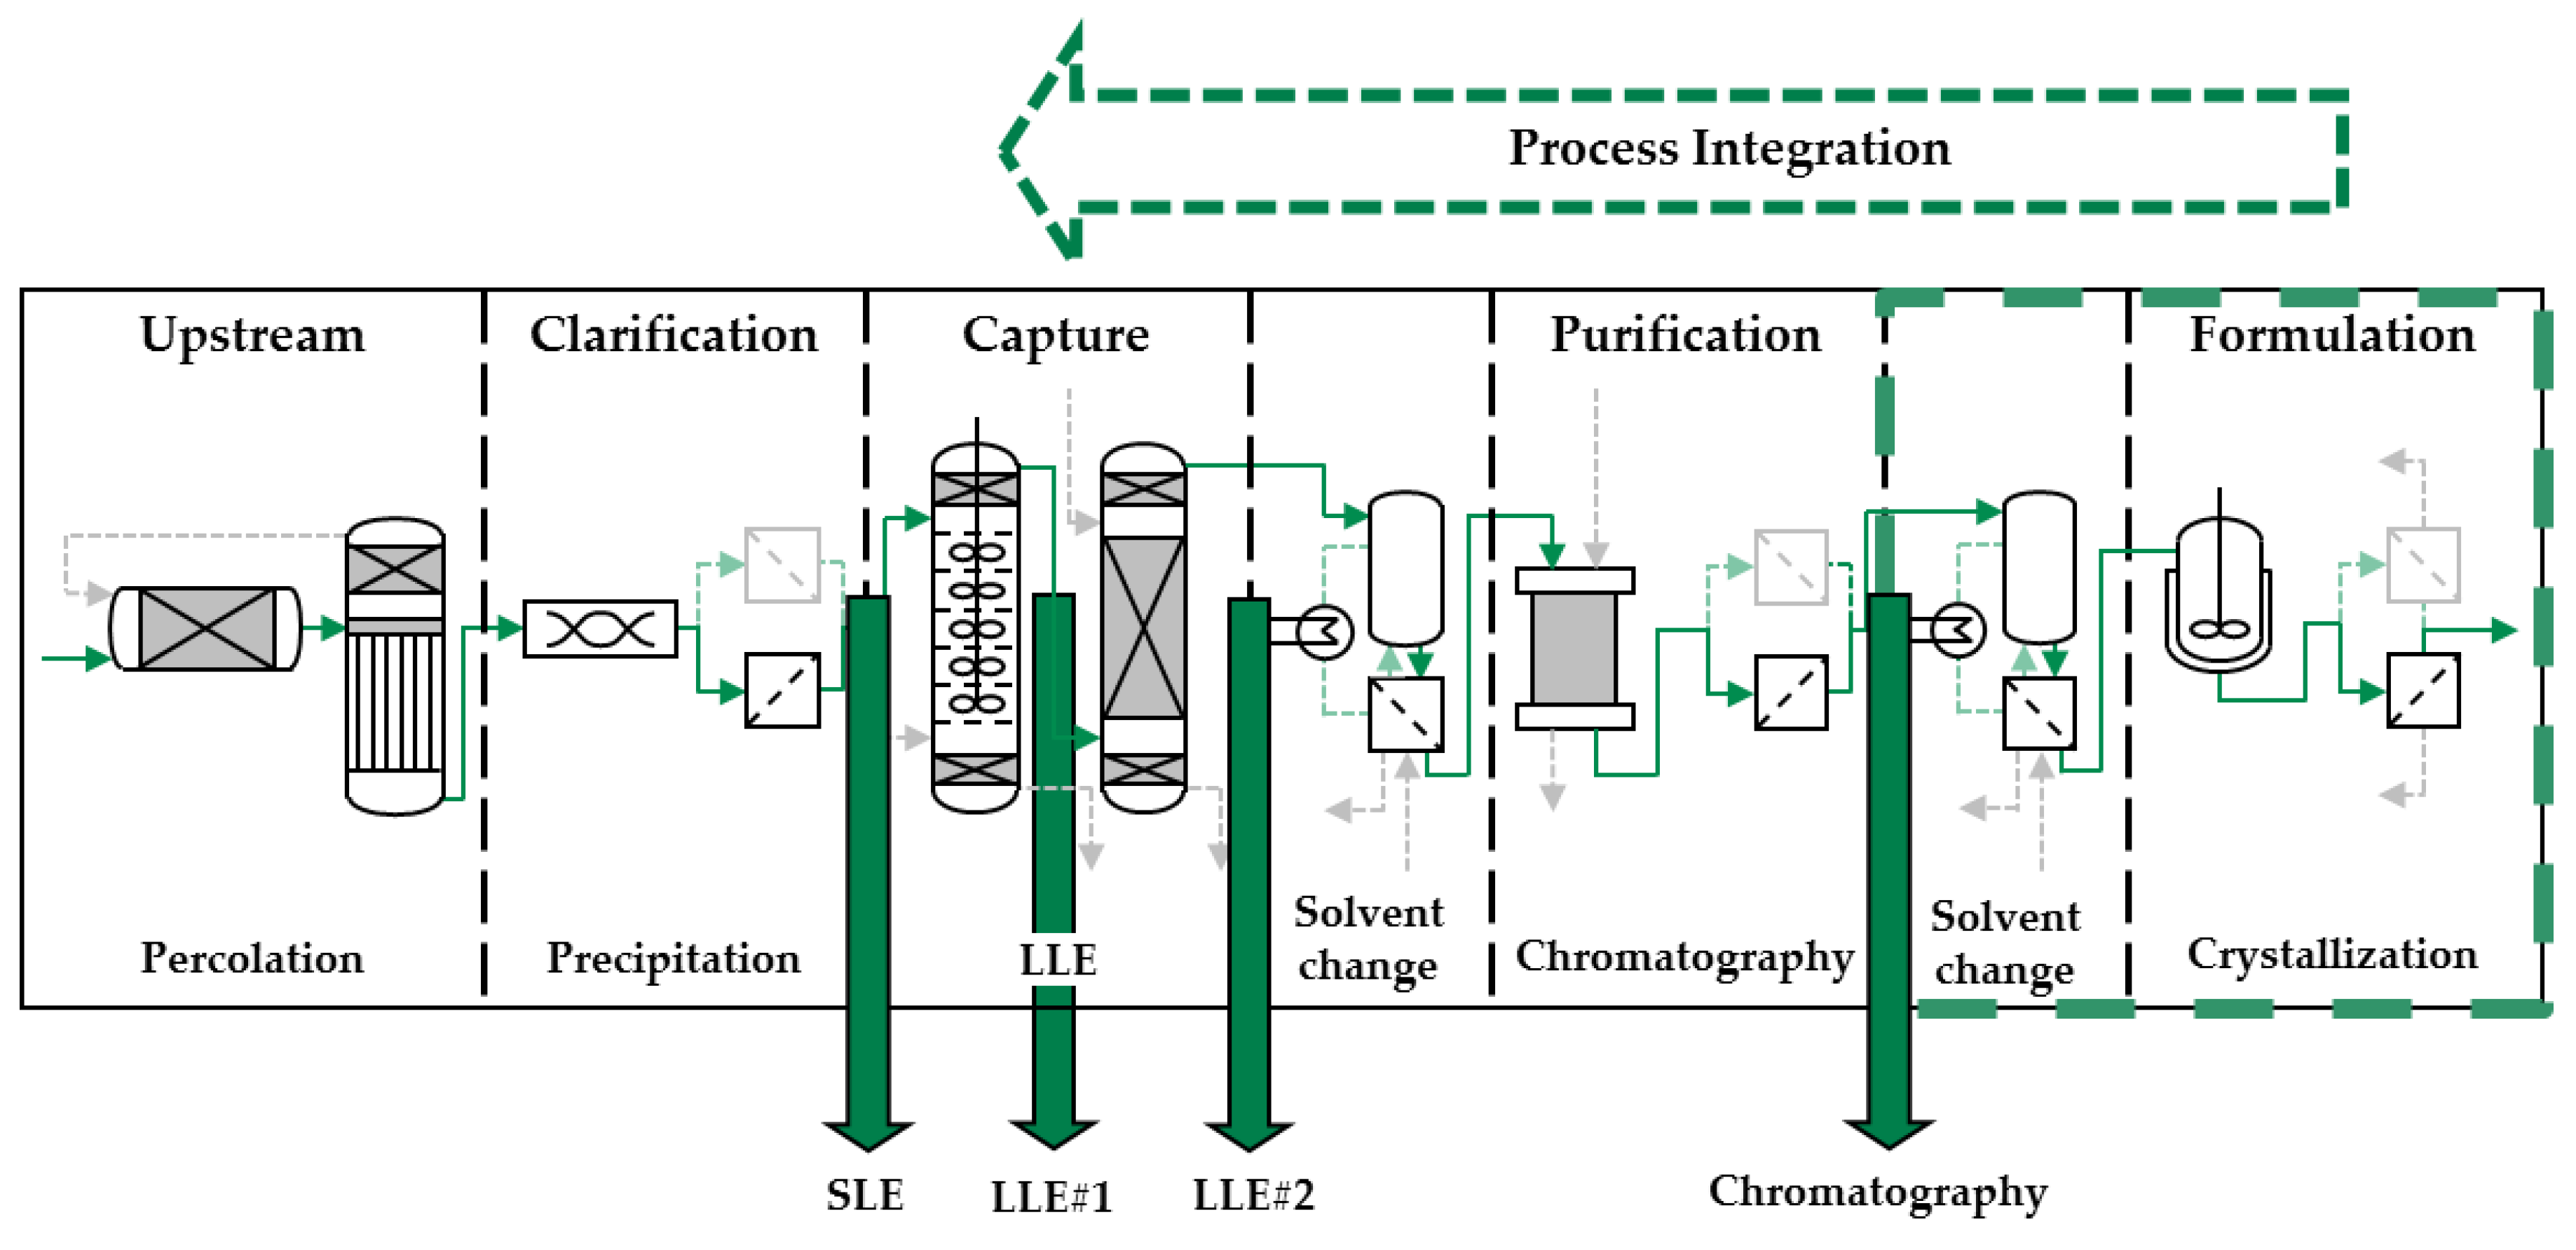
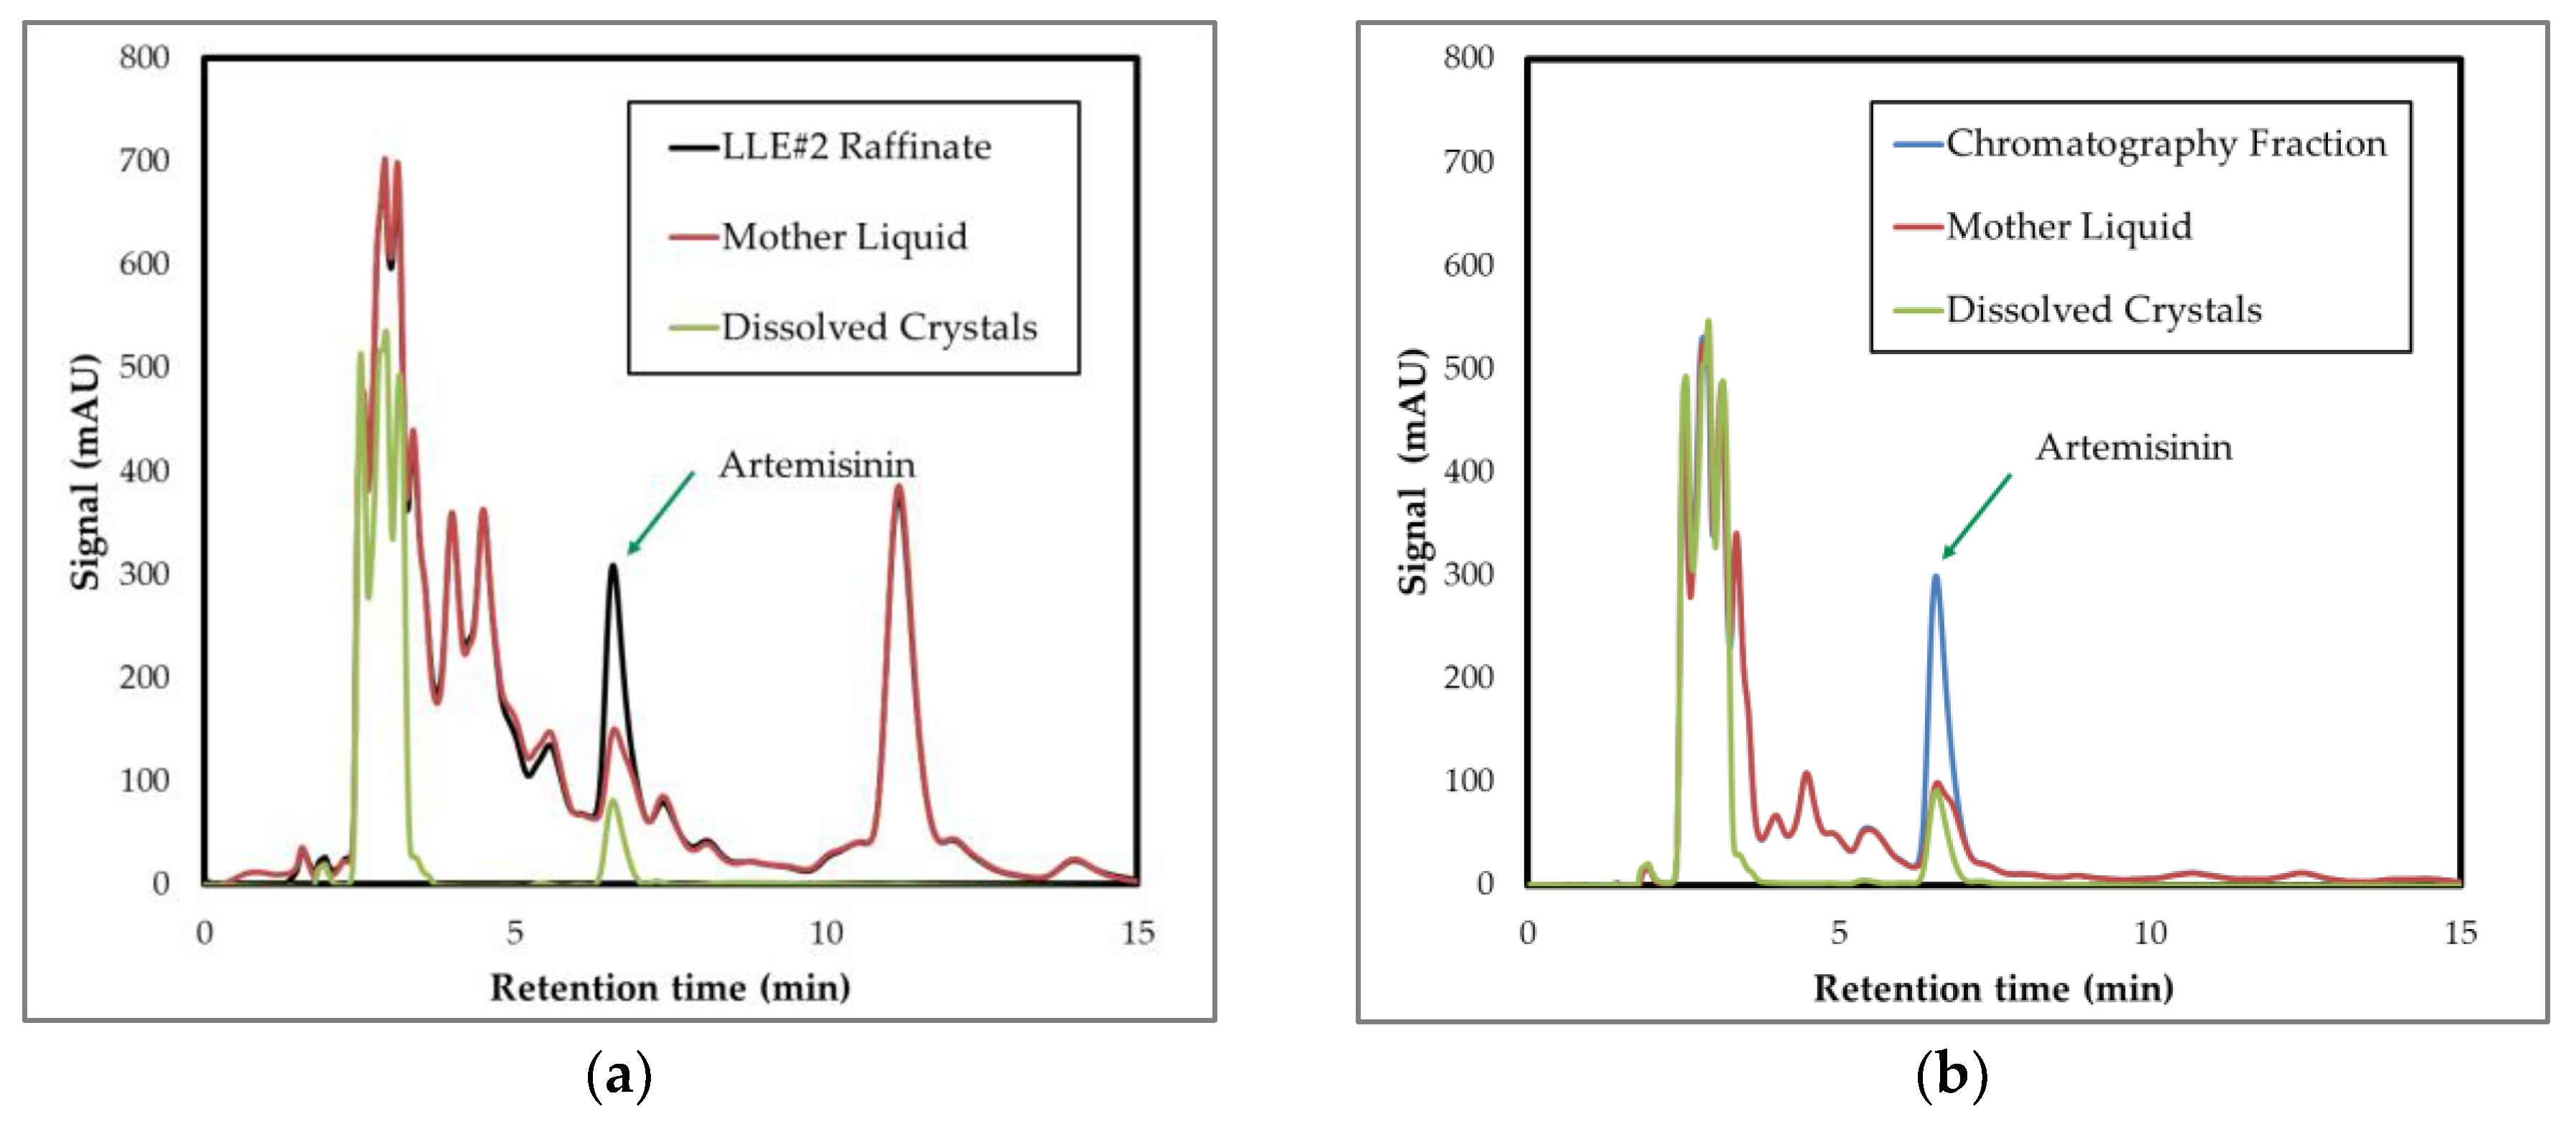
3.2. Process Integration of Crystallization Step
4. Conclusions
Author Contributions
Funding
Acknowledgments
Conflicts of Interest
Abbreviations
| c | Concentration in the liquid phase, g/kg |
| q0 | Number-based particle size density distribution, 1/mm |
| Q0 | Number-based particle size sum distribution, - |
| q3 | Volume-based particle size density distribution, 1/mm |
| Q3 | Volume-based particle size sum distribution, - |
| S | Supersaturation, - |
| T | Temperature, °C |
| x | Particle length, µm |
| x50 | Median value of particle size distribution |
| Y | Yield, - |
| ELSD | Evaporation Light Scattering Detector |
| HPLC | High performance liquid chromatography |
| H-NMR | Hydrogen Nuclear magnetic resonance |
| MSZW | Metastable zone width |
| RPM | Rounds per minute |
| STY | Space-Time-Yield |
References
- Kassing, M.; Jenelten, U.; Schenk, J.; Hänsch, R.; Strube, J. Combination of rigorous and statistical modeling for process development of plant-based extractions based on mass balances and biological aspects. Chem. Eng. Technol. 2012, 35, 109–132. [Google Scholar] [CrossRef]
- Ditz, R.; Gerard, D.; Hagels, H.; Igl, N.; Schäffler, M.; Schulz, H.; Stürtz, M.; Tegtmeier, M.; Treutwein, J.; Strube, J.; et al. Phytoextracts. Proposal Towards a New Comprehensive Research Focus; ProcessNet-Subject Division Plant Based Extracts—Products and Processes: Frankfurt, Germany, 2017. [Google Scholar]
- Both, S. Systematische Verfahrensentwicklung Für Pflanzlich Basierte Produkte im Regulatorischen Umfeld; Shaker: Aachen, Germany, 2015; ISBN 978-3-8440-3727-2. [Google Scholar]
- Koudous, I. Stoffdatenbasierte Verfahrensentwicklung zur Isolierung von Wertstoffen aus Pflanzenextrakten, 1st ed.; Shaker: Herzogenrath, Germany, 2017; ISBN 978-3-8440-5271-8. [Google Scholar]
- Koudous, I.; Both, S.; Gudi, G.; Schulz, H.; Strube, J. Process design based on physicochemical properties for the example of obtaining valuable products from plant-based extracts. C. R. Chim. 2014, 17, 218–231. [Google Scholar] [CrossRef]
- Sixt, M.; Koudous, I.; Strube, J. Process design for integration of extraction, purification and formulation with alternative solvent concepts. C. R. Chim. 2016, 19, 733–748. [Google Scholar] [CrossRef]
- Sixt, M.; Strube, J. Systematic and model-assisted evaluation of solvent based- or pressurized hot water extraction for the extraction of artemisinin from Artemisia annua L. Processes 2017, 5, 86. [Google Scholar] [CrossRef]
- Sixt, M.; Schmidt, A.; Mestmäcker, F.; Huter, M.J.; Uhlenbrock, L.; Strube, J. Systematic and model-assisted process design for the extraction and purification of Artemisinin from Artemisia annua L.—Part I: Conceptual process design and cost estimation. Processes 2018, 6, 161. [Google Scholar] [CrossRef]
- Schmidt, A.; Sixt, M.; Huter, M.; Mestmäcker, F.; Strube, J. Systematic and model-assisted process design for the extraction and purification of Artemisinin from Artemisia annua L.—Part II: Model-based design of agitated and packed columns for multistage extraction and scrubbing. Processes 2018, 6, 179. [Google Scholar] [CrossRef]
- Mestmäcker, F.; Schmidt, A.; Huter, M.; Sixt, M.; Strube, J. Systematic and model-assisted process design for the extraction and purification of Artemisinin from Artemisia annua L.—Part III: Chromatographic Purification. Processes 2018, 6, 180. [Google Scholar] [CrossRef]
- Kumar, S.; Gupta, S.K.; Singh, D.; Gupta, M.M.; Jain, D.C.; Kahol, A.P.; Kahuja, S.P.S.; Ram, G. Process for Isolating Artemisinin from Artemisia annua. U.S. Patent 6,685,972, 3 March 2004. [Google Scholar]
- Liu, N.Q.; Schuehly, W.; Von Freyhold, M.; Van der Kooy, F. A novel purification method of artemisinin from Artemisia annua. Ind. Crops Prod. 2011, 34, 1084–1088. [Google Scholar] [CrossRef]
- Harjo, B.; Wibowo, C.; Ng, K.M. Development of natural product manufacturing processes. Chem. Eng. Res. Des. 2004, 82, 1010–1028. [Google Scholar] [CrossRef]
- ElFeraly, F.; Elsohly, H.N. Method for the Isolation of Artemisinin from Artemisa annua. U.S. Patent 4,952,603, 28 August 1990. [Google Scholar]
- Malwade, C.R.; Qu, H.; Rong, B.-G.; Christensen, L.P. Conceptual process synthesis for recovery of natural products from plants: A case study of artemisinin from Artemisia annua. Ind. Eng. Chem. Res. 2013, 52, 7157–7169. [Google Scholar] [CrossRef]
- Malwade, C.R.; Qu, H.; Rong, B.-G.; Christensen, L.P. Purification of artemisinin from quercetin by anti-solvent crystallization. Front. Chem. Sci. Eng. 2013, 7, 72–78. [Google Scholar] [CrossRef]
- Malwade, C.R.; Buchholz, H.; Rong, B.-G.; Qu, H.; Christensen, L.P.; Lorenz, H.; Seidel-Morgenstern, A. Crystallization of artemisinin from chromatography fractions of Artemisia annua extract. Org. Process Res. Dev. 2016, 20, 646–652. [Google Scholar] [CrossRef] [Green Version]
- Lévesque, F.; Seeberger, P.H. Continuous-flow synthesis of the anti-malaria drug artemisinin. Angew. Chem. Int. Ed. 2012, 51, 1706–1709. [Google Scholar] [CrossRef] [PubMed]
- Turconi, J.; Griolet, F.; Guevel, R.; Oddon, G.; Villa, R.; Geatti, A.; Hvala, M.; Rossen, K.; Göller, R.; Burgard, A. Semisynthetic artemisinin, the chemical path to industrial production. Org. Process Res. Dev. 2014, 18, 417–422. [Google Scholar] [CrossRef]
- Tu, Y. From Artemisia annua L. to Artemisinins: The Discovery and Development of Artemisinins and Antimalarial Agents; Elsevier Science: San Diego, CA, USA, 2017; ISBN 978-0-12-811655-5. [Google Scholar]
- Lorenz, H. Purification by crystallization. In Crystallization: Basic Concepts and Industrial Applications; Beckmann, W., Ed.; Wiley-VCH Verlag GmbH & Co. KGaA: Weinheim, Germany, 2013; pp. 127–148. ISBN 978-3-527-32762-1. [Google Scholar]
- Chemat, F.; Strube, J. Green Extraction of Natural Products: Theory and Practice, 1st ed.; Wiley-VCH: Weinheim, Germany, 2015. [Google Scholar]
- Strube, J.; Grote, F.; Josch, J.P.; Ditz, R. Process development and design of downstream processes. Chem. Ing. Tech. 2011, 83, 1044–1065. [Google Scholar] [CrossRef]
- Lucke, M.; Koudous, I.; Sixt, M.; Huter, M.J.; Strube, J. Integrating crystallization with experimental model parameter determination and modeling into conceptual process design for the purification of complex feed mixtures. Chem. Eng. Res. Des. 2018, 133, 264–280. [Google Scholar] [CrossRef]
- Beckmann, W. Crystallization. Basic Concepts and Industrial Applications; Wiley-VCH Verlag GmbH & Co. KGaA: Weinheim, Germany, 2013; ISBN 978-3-527-32762-1. [Google Scholar]
- Qu, H. Chromatography-crystallization hybrid process for artemisinin purification from Artemisia annua. Chem. Eng. Technol. 2010, 33, 791–796. [Google Scholar] [CrossRef]
- Lapkin, A.A.; Peters, M.; Greiner, L.; Chemat, S.; Leonhard, K.; Liauw, M.A.; Leitner, W. Screening of new solvents for artemisininextraction process using ab initio methodology. Green Chem. 2010, 12, 241–251. [Google Scholar] [CrossRef]
- Liu, Y.; Lü, H.; Pang, F. Solubility of artemisinin in seven different pure solvents from (283.15 to 323.15) K. J. Chem. Eng. Data 2009, 54, 762–764. [Google Scholar] [CrossRef]
- Wang, L.-H.; Song, Y.-T.; Chen, Y.; Cheng, Y.-Y. Solubility of artemisinin in ethanol + water from (278.2 to 343.2) K. J. Chem. Eng. Data 2007, 52, 757–758. [Google Scholar] [CrossRef]
- Hofmann, G.; Beckmann, W. Kristallisation in der Industriellen Praxis; Wiley-VCH: Weinheim, Germany, 2004; ISBN 978-352-760-273-5. [Google Scholar]
- Wieckhusen, D. Development of batch crystallizations. In Crystallization: Basic Concepts and Industrial Applications; Beckmann, W., Ed.; Wiley-VCH Verlag GmbH & Co. KGaA: Weinheim, Germany, 2013; pp. 187–202. ISBN 978-3-527-32762-1. [Google Scholar]
- Myerson, A.S. Handbook of Industrial Crystallization, 2nd ed.; Butterworth-Heinemann: Boston, MA, USA, 2002; ISBN 978-008-053-351-3. [Google Scholar]
- Mullin, J.W. Crystallization, 4th ed.; Butterworth-Heinemann: Oxford, UK, 2001; ISBN 978-075-064-833-2. [Google Scholar]
- Kim, K.-J.; Mersmann, A. Estimation of metastable zone width in different nucleation processes. Chem. Eng. Sci. 2001, 56, 2315–2324. [Google Scholar] [CrossRef]
- Liu, J.; Svärd, M.; Rasmuson, Å.C. Influence of agitation on primary nucleation in stirred tank crystallizers. Cryst. Growth Des. 2015, 15, 4177–4184. [Google Scholar] [CrossRef]
- Bogacz, W.; Wójcik, J. The metastable zone of aqueous solutions. Chemik 2014, 68, 198–201. [Google Scholar]
- Mohan, R.; Lorenz, H.; Myerson, A.S. Solubility measurement using differential scanning calorimetry. Ind. Eng. Chem. Res. 2002, 41, 4854–4862. [Google Scholar] [CrossRef]
- Chan, K.-L.; Yuen, K.-H.; Takayanagi, H. Polymorphism of artemisinin from Artemisia annua. Phytochemistry 1997, 46, 1209–1214. [Google Scholar] [CrossRef]
- Glade, H.; Ilyaskarov, A.M.; Ulrich, J. Determination of crystal growth kinetics using ultrasonic technique. Chem. Eng. Technol. 2004, 27, 736–740. [Google Scholar] [CrossRef]
- Mohan, R.; Boateng, K.A.; Myerson, A.S. Estimation of crystal growth kinetics using differential scanning calorimetry. J. Cryst. Growth 2000, 212, 489–499. [Google Scholar] [CrossRef]
- Variankaval, N.; Cote, A.S.; Doherty, M.F. From form to function: Crystallization of active pharmaceutical ingredients. AIChE J. 2008, 54, 1682–1688. [Google Scholar] [CrossRef] [Green Version]
- Josch, J.P.; Both, S.; Strube, J. Characterization of feed properties for conceptual process design involving complex mixtures, such as natural extracts. FNS 2012, 3, 836–850. [Google Scholar] [CrossRef]
- Suberu, J.O.; Yamin, P.; Leonhard, K.; Song, L.; Chemat, S.; Sullivan, N.; Barker, G.; Lapkin, A.A. The effect of O-methylated flavonoids and other co-metabolites on the crystallization and purification of artemisinin. J. Biotechnol. 2014, 171, 25–33. [Google Scholar] [CrossRef] [PubMed]
- Sixt, M.; Strube, J. Systematic design and evaluation of an extraction process for traditionally used herbal medicine on the example of hawthorn (Crataegus monogyna Jacq.). Processes 2018, 6, 73. [Google Scholar] [CrossRef]
- Lapkin, A.A.; Walker, A.; Sullivan, N.; Khambay, B.; Mlambo, B.; Chemat, S. Development of HPLC analytical protocols for quantification of artemisinin in biomass and extracts. J. Pharm. Biomed. Anal. 2009, 49, 908–915. [Google Scholar] [CrossRef] [PubMed]


| Variation | Nucleation Temperature (°C) | ||
|---|---|---|---|
| Stirring speed | 100 RPM | 14.4 | ±0.4 |
| (at 1 °C/min) | 200 RPM | 15.8 | ±0.7 |
| 400 RPM | 16.4 | ±0.2 | |
| Temperature gradient | 0.1 °C/min | 20.8 | ±1.1 |
| (at 400 RPM) | 0.5 °C/min | 20.6 | ±0.0 |
| 1.0 °C/min | 16.4 | ±0.2 | |
| Concentration (gArtemisinin/kgSolvent) | MSZW (°C) | |
|---|---|---|
| 6.4 | 8.4 | ±0.7 |
| 8.5 | 7.6 | ±0.4 |
| 10.4 | 6.8 | ±0.2 |
| 12.9 | 6.1 | ±0.7 |
| 15.3 | 5.5 | ±0.3 |
| Particle Class | Sieving Fraction |
|---|---|
| Small | x < 100 µm |
| Seed | 100 µm < x < 150 µm |
| Large | 150 µm < x |
| Pattern | SInitial (−) | TStart (°C) | TFinal (°C) | Duration (min) | x50 (µm) | YieldTDL (−) | STY (g/(L·h)) | ||
|---|---|---|---|---|---|---|---|---|---|
| 1 | 0000 | 0.175 | 25 | 5 | 180 | 221.19 | ±33.23 | 0.89 | 1.17 |
| 2 | −−−+ | 0.1 | 30 | 10 | 120 | 233.14 | ±4.16 | 0.80 | 2.66 |
| 3 | −+−− | 0.1 | 20 | 10 | 240 | 558.85 | ±9.46 | 0.65 | 1.26 |
| 4 | 0000 | 0.175 | 25 | 5 | 180 | 313.04 | ±27.12 | 0.83 | 1.30 |
| 5 | 0000 | 0.175 | 25 | 5 | 180 | 258.15 | ±21.90 | 0.87 | 1.22 |
| 6 | +−++ | 0.25 | 30 | 0 | 120 | 226.17 | ±15.17 | 0.90 | 1.77 |
| 7 | −+−+ | 0.1 | 20 | 10 | 120 | 279.55 | ±10.63 | 0.61 | 2.62 |
| 8 | +−+− | 0.25 | 30 | 0 | 240 | 201.55 | ±5.36 | 0.93 | 0.78 |
| 9 | +−−− | 0.25 | 30 | 10 | 240 | 207.27 | ±27.87 | 0.86 | 1.26 |
| 10 | −++− | 0.1 | 20 | 0 | 240 | 294.79 | ±45.22 | 0.85 | 0.77 |
| 11 | −−+− | 0.1 | 30 | 0 | 240 | 261.51 | ±39.31 | 0.92 | 0.79 |
| 12 | −+++ | 0.1 | 20 | 0 | 120 | 161.75 | ±2.00 | 0.84 | 1.58 |
| 13 | −−++ | 0.1 | 30 | 0 | 120 | 211.70 | ±14.06 | 0.88 | 1.79 |
| 14 | +−−+ | 0.25 | 30 | 10 | 120 | 212.82 | ±30.67 | 0.85 | 2.61 |
| 15 | ++−+ | 0.25 | 20 | 10 | 120 | 308.01 | ±36.33 | 0.68 | 2.56 |
| 16 | ++−− | 0.25 | 20 | 10 | 240 | 249.53 | ±47.18 | 0.82 | 1.12 |
| 17 | +++− | 0.25 | 20 | 0 | 240 | 188.54 | ±4.04 | 0.88 | 0.78 |
| 18 | −−−− | 0.1 | 30 | 10 | 240 | 224.40 | ±16.11 | 0.84 | 1.24 |
| 19 | ++++ | 0.25 | 20 | 0 | 120 | 160.28 | ±5.93 | 0.83 | 1.69 |
© 2018 by the authors. Licensee MDPI, Basel, Switzerland. This article is an open access article distributed under the terms and conditions of the Creative Commons Attribution (CC BY) license (http://creativecommons.org/licenses/by/4.0/).
Share and Cite
Huter, M.J.; Schmidt, A.; Mestmäcker, F.; Sixt, M.; Strube, J. Systematic and Model-Assisted Process Design for the Extraction and Purification of Artemisinin from Artemisia annua L.—Part IV: Crystallization. Processes 2018, 6, 181. https://doi.org/10.3390/pr6100181
Huter MJ, Schmidt A, Mestmäcker F, Sixt M, Strube J. Systematic and Model-Assisted Process Design for the Extraction and Purification of Artemisinin from Artemisia annua L.—Part IV: Crystallization. Processes. 2018; 6(10):181. https://doi.org/10.3390/pr6100181
Chicago/Turabian StyleHuter, Maximilian Johannes, Axel Schmidt, Fabian Mestmäcker, Maximilian Sixt, and Jochen Strube. 2018. "Systematic and Model-Assisted Process Design for the Extraction and Purification of Artemisinin from Artemisia annua L.—Part IV: Crystallization" Processes 6, no. 10: 181. https://doi.org/10.3390/pr6100181