

Synergetic Adsorption of Dyes in Water by Three-Dimensional Graphene and Manganese Dioxide (PU@RGO@MnO2) Structures for Efficient Wastewater Purification

Abstract
:1. Introduction
2. Research Methods
2.1. Preparation of MnO2
2.2. Preparation of PU@RGO@MnO2
2.2.1. Experimental Materials and Equipment
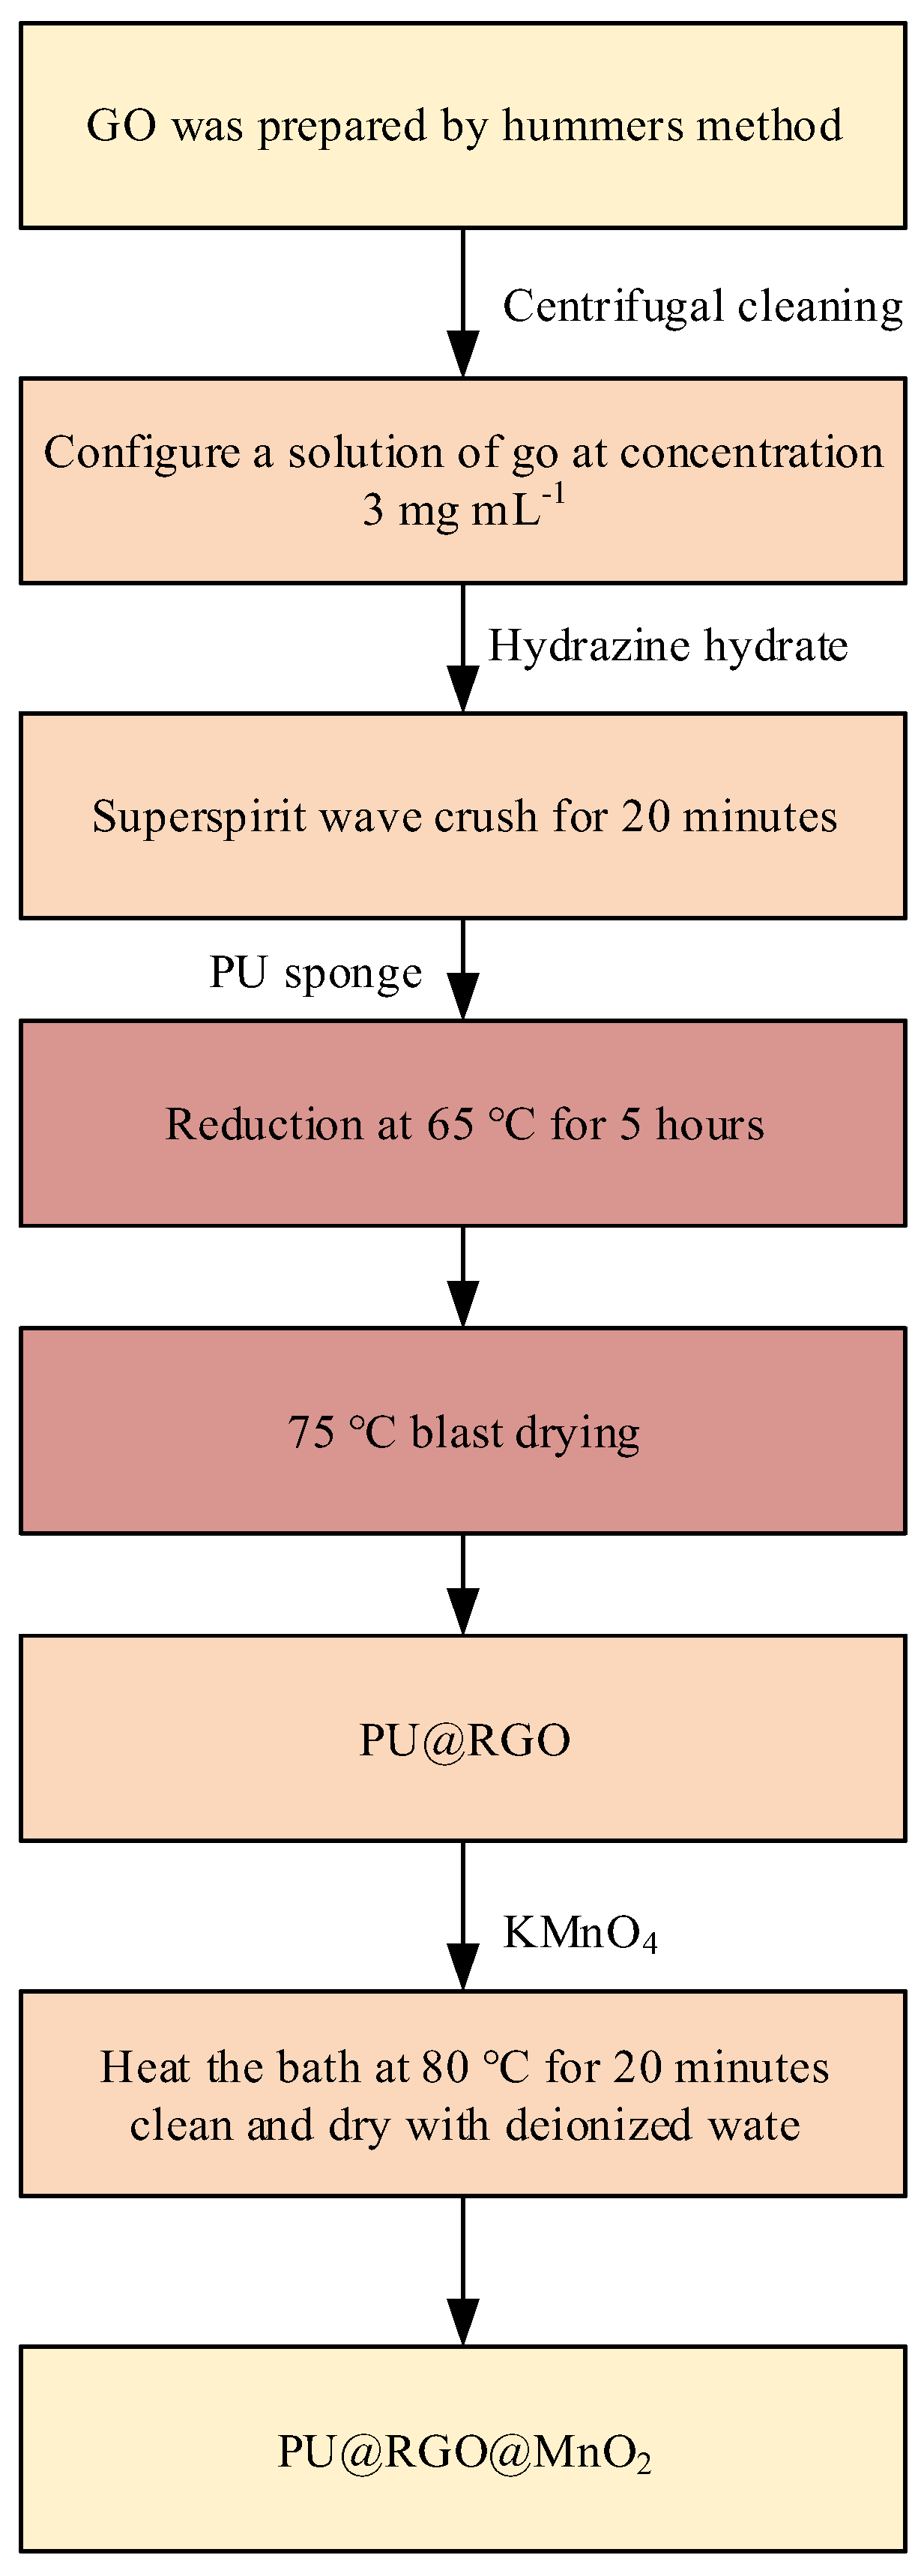
2.2.2. Flowchart of the Experiment
2.2.3. Preparation Method of PU@RGO@MnO2
- The graphene oxide (GO) was prepared by the water bath method. Then, the prepared GO was centrifugally washed with a centrifugal pump and then prepared into a GO solution with a concentration of 3 mg mL−1. (RGO stands for reduced graphene oxide, which is a material obtained from GO after reduction treatment).
- The reducing agent in the experiment was hydrazine hydrate (HHA), which was mixed with the above-prepared GO in a ratio of 1:1, and ultrasonically cleaned for 20 min. The cleaned samples were ultrasonically pulverized with an ultrasonic cell pulverizer for 20 min, and the reducing agent and GO were mixed uniformly for later use.
- A PU sponge was added to the mixed solution in step 2 to make it completely submerged, putting it in a blast drying oven for 5 h at 65 °C, and drying the product at 75 °C in a blast drying oven to obtain a composite material PU@ RGO.
- A KMnO4 solution with a concentration of 10 mg mL−1 was prepared and the PU@RGO obtained above was added to the solution and placed in a vacuum environment to completely immerse the PU@RGO in KMnO4. Then, it was heated and reacted in a water bath at 80 °C for 20 min, and the reacted product was washed with deionized water. After washing, it was placed in a blast drying oven and dried at 75 °C to obtain the final composites PU@RGO@ MnO2.
2.3. Analysis Methods
2.4. Reaction Mechanism of Water Treatment of PU@RGO@MnO2
3. Results and Discussion
3.1. Microstructure Characterization
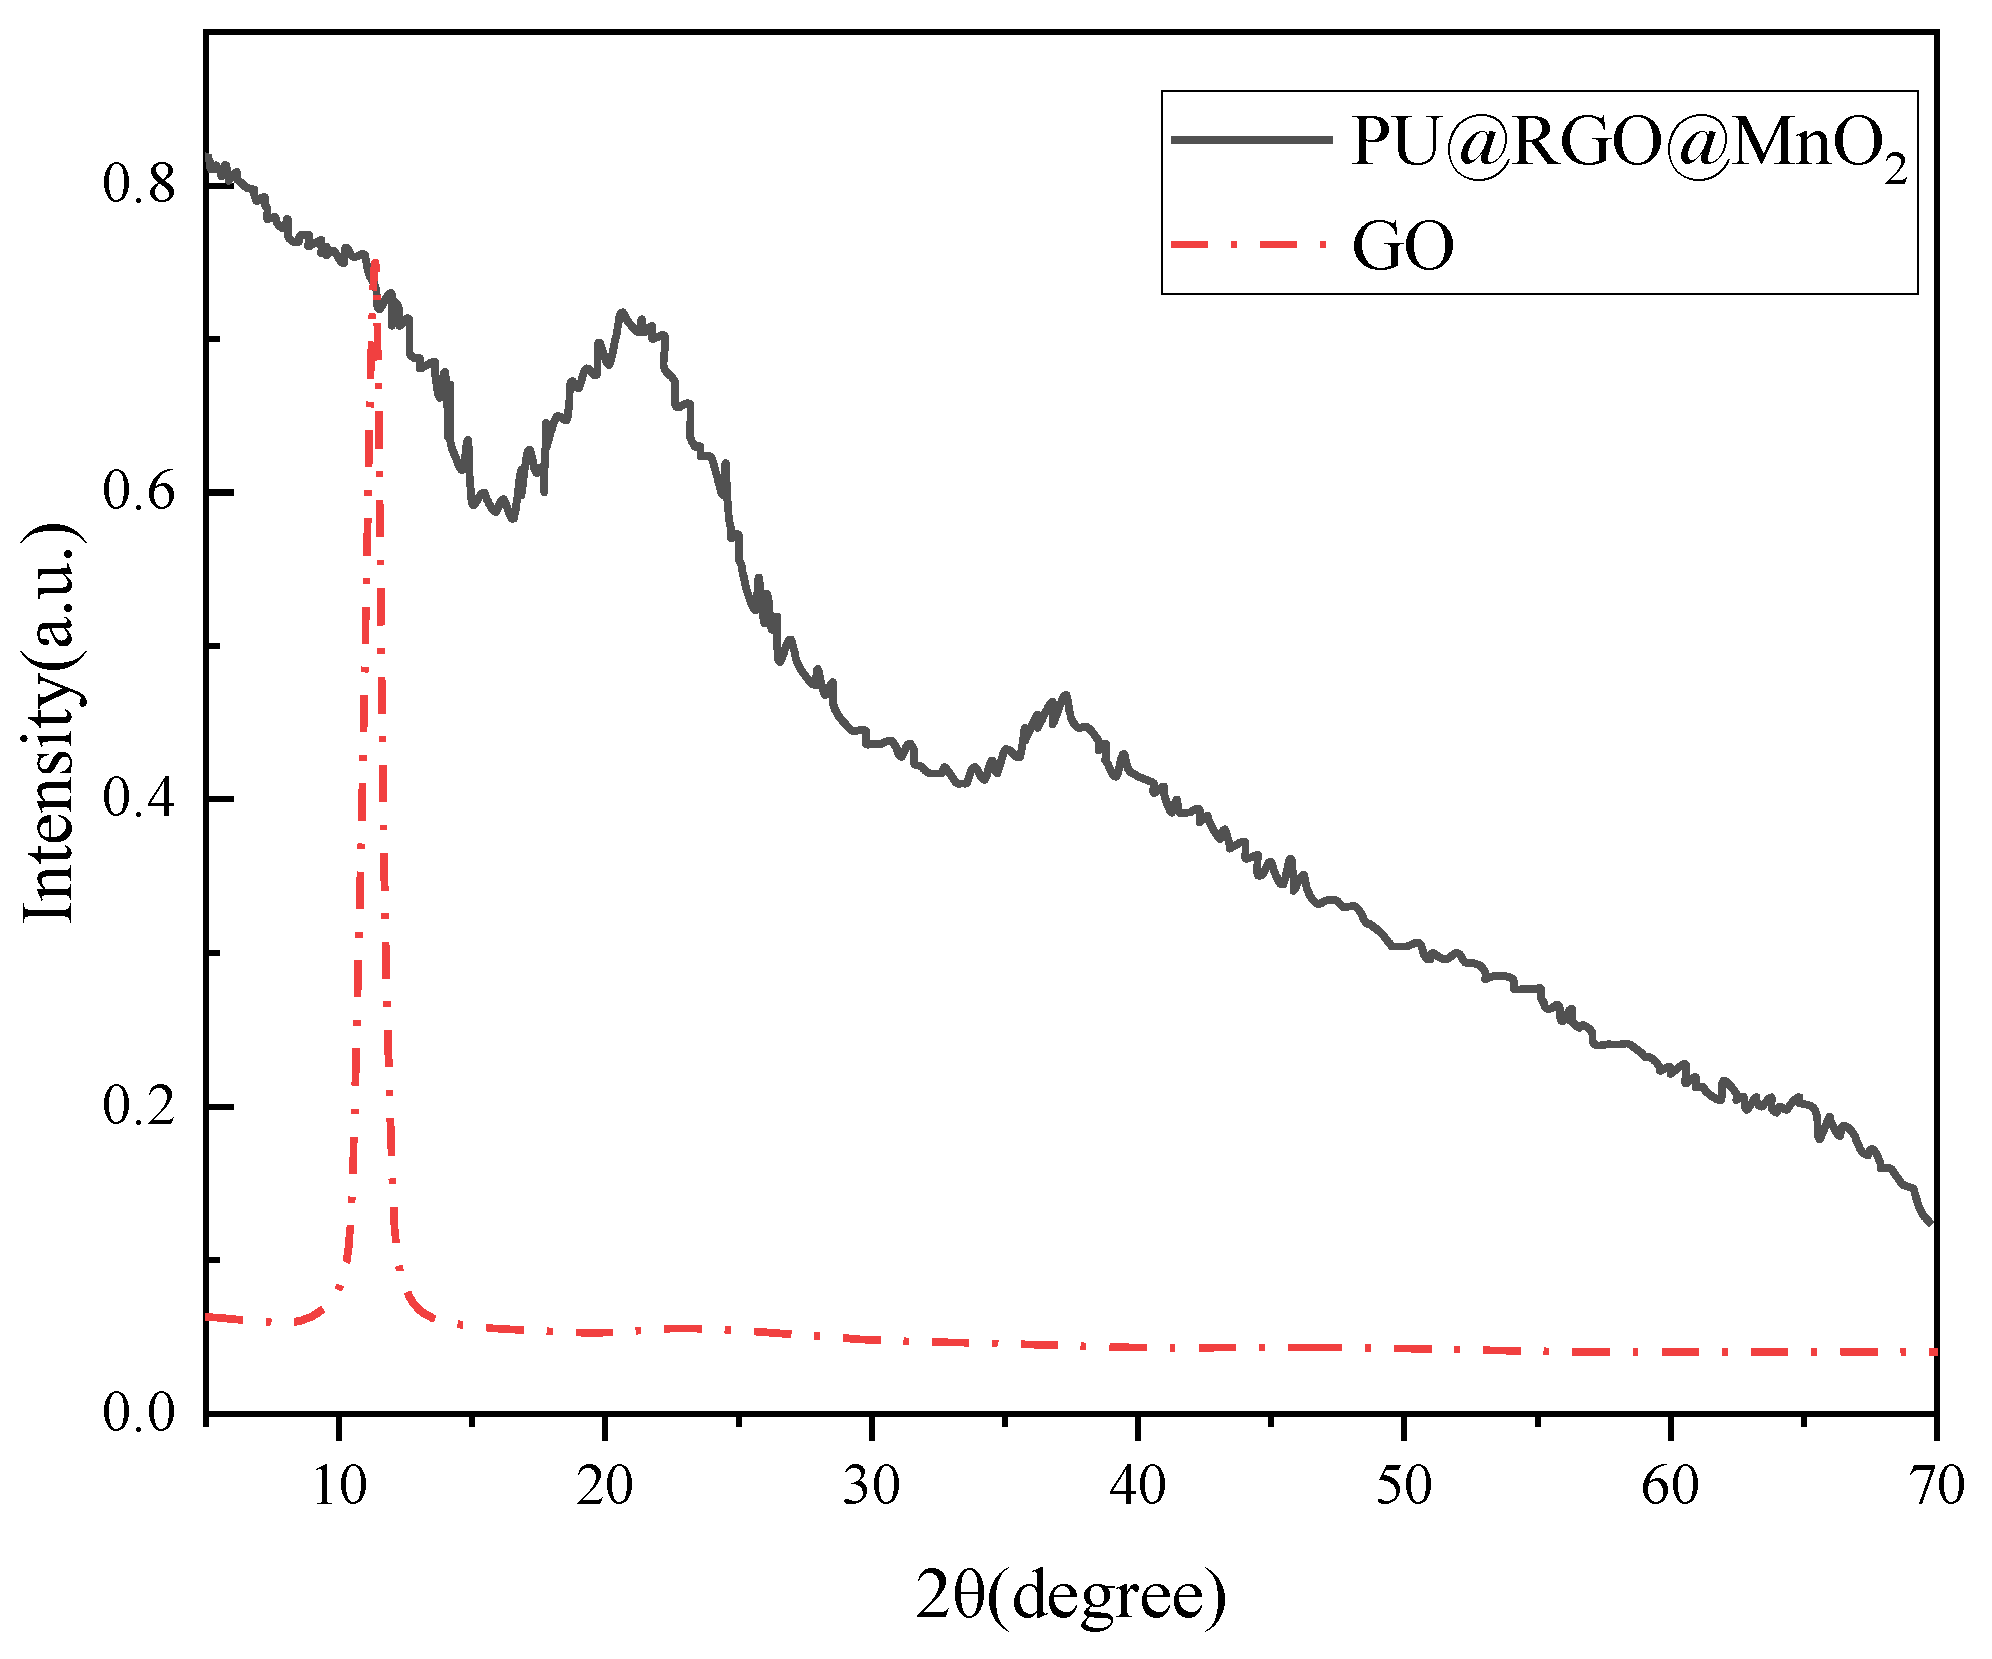
3.1.1. XRD Analysis
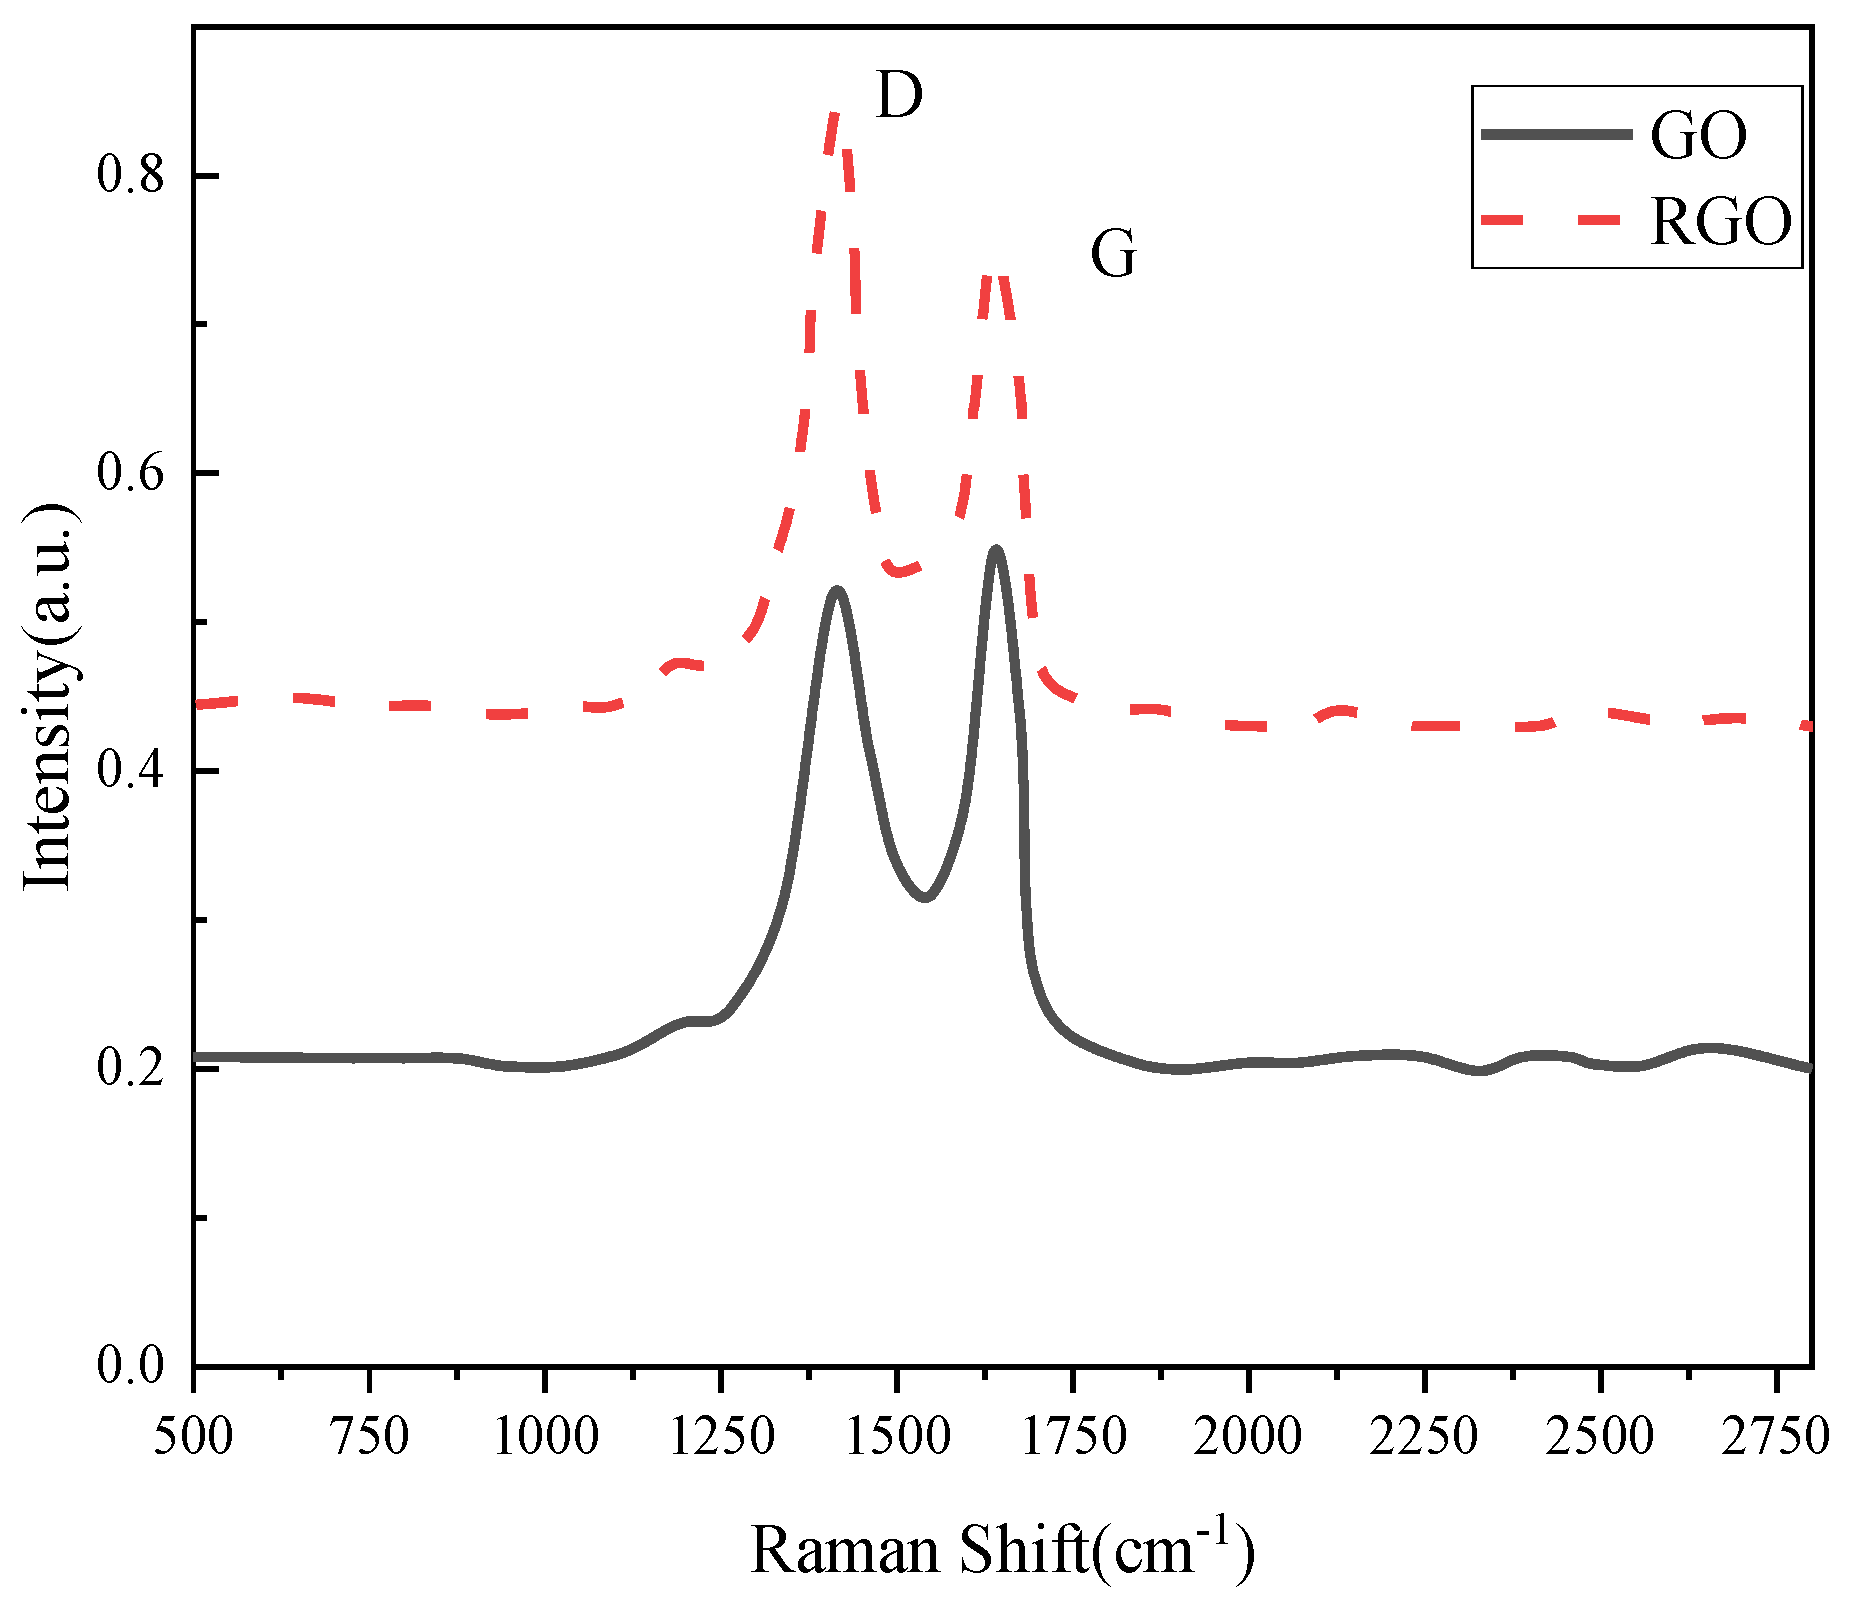
3.1.2. Raman Spectra
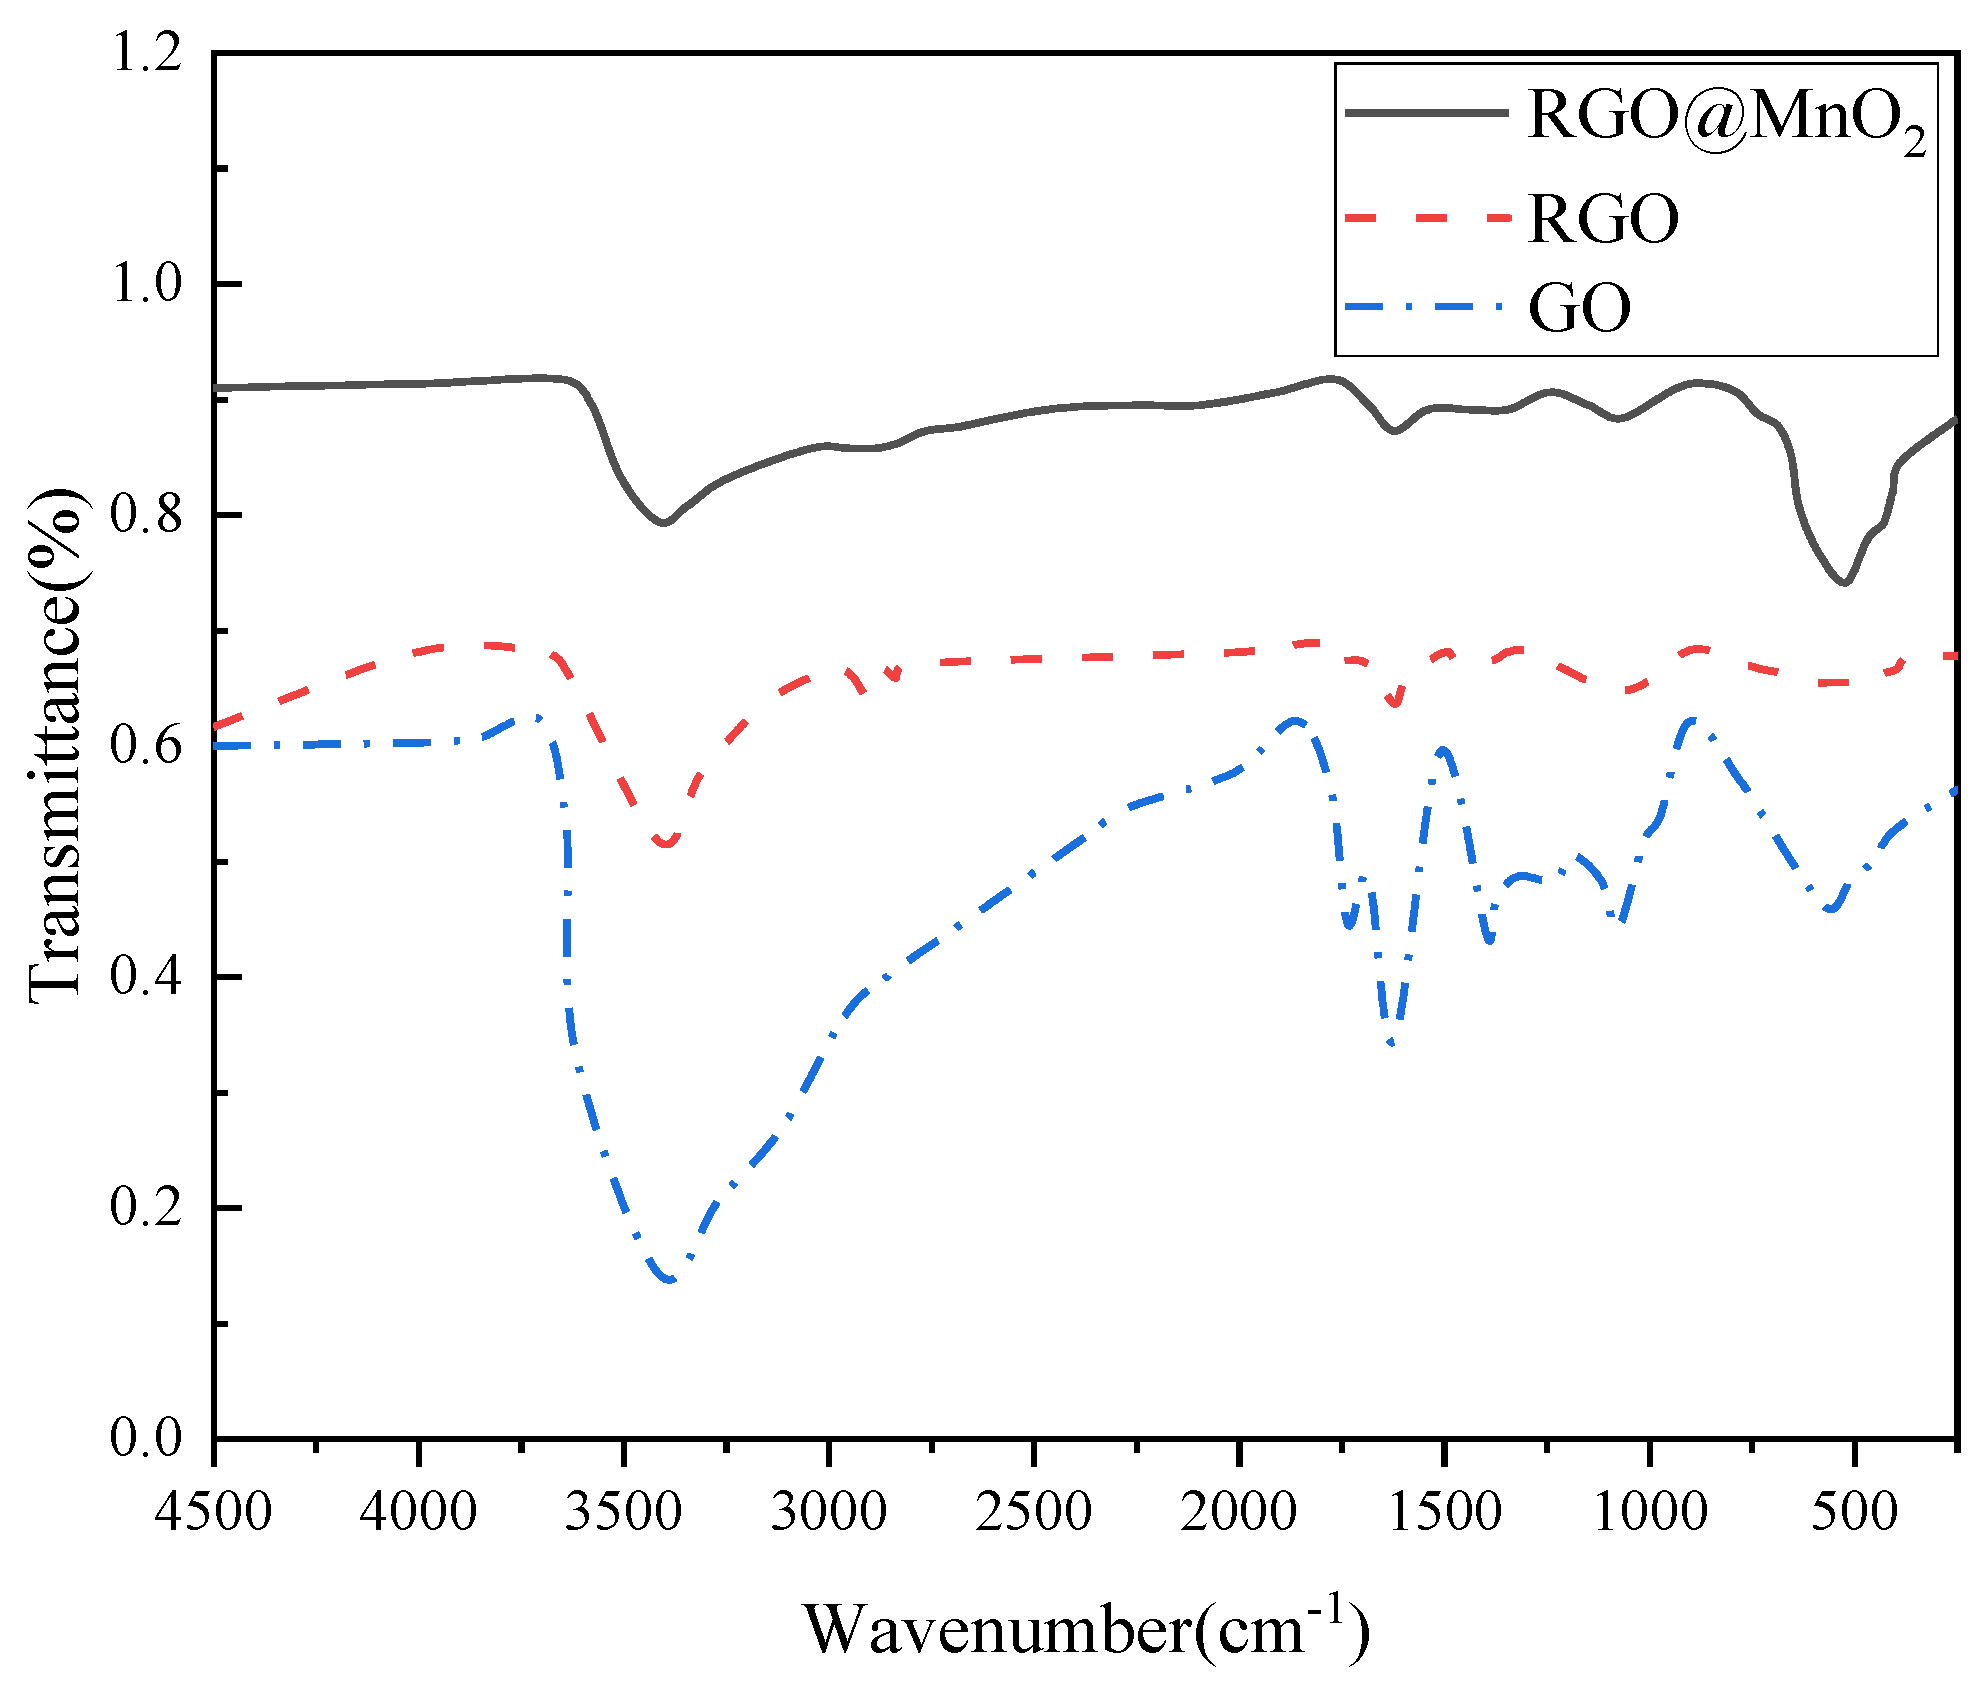
3.1.3. Infrared Spectra Analysis
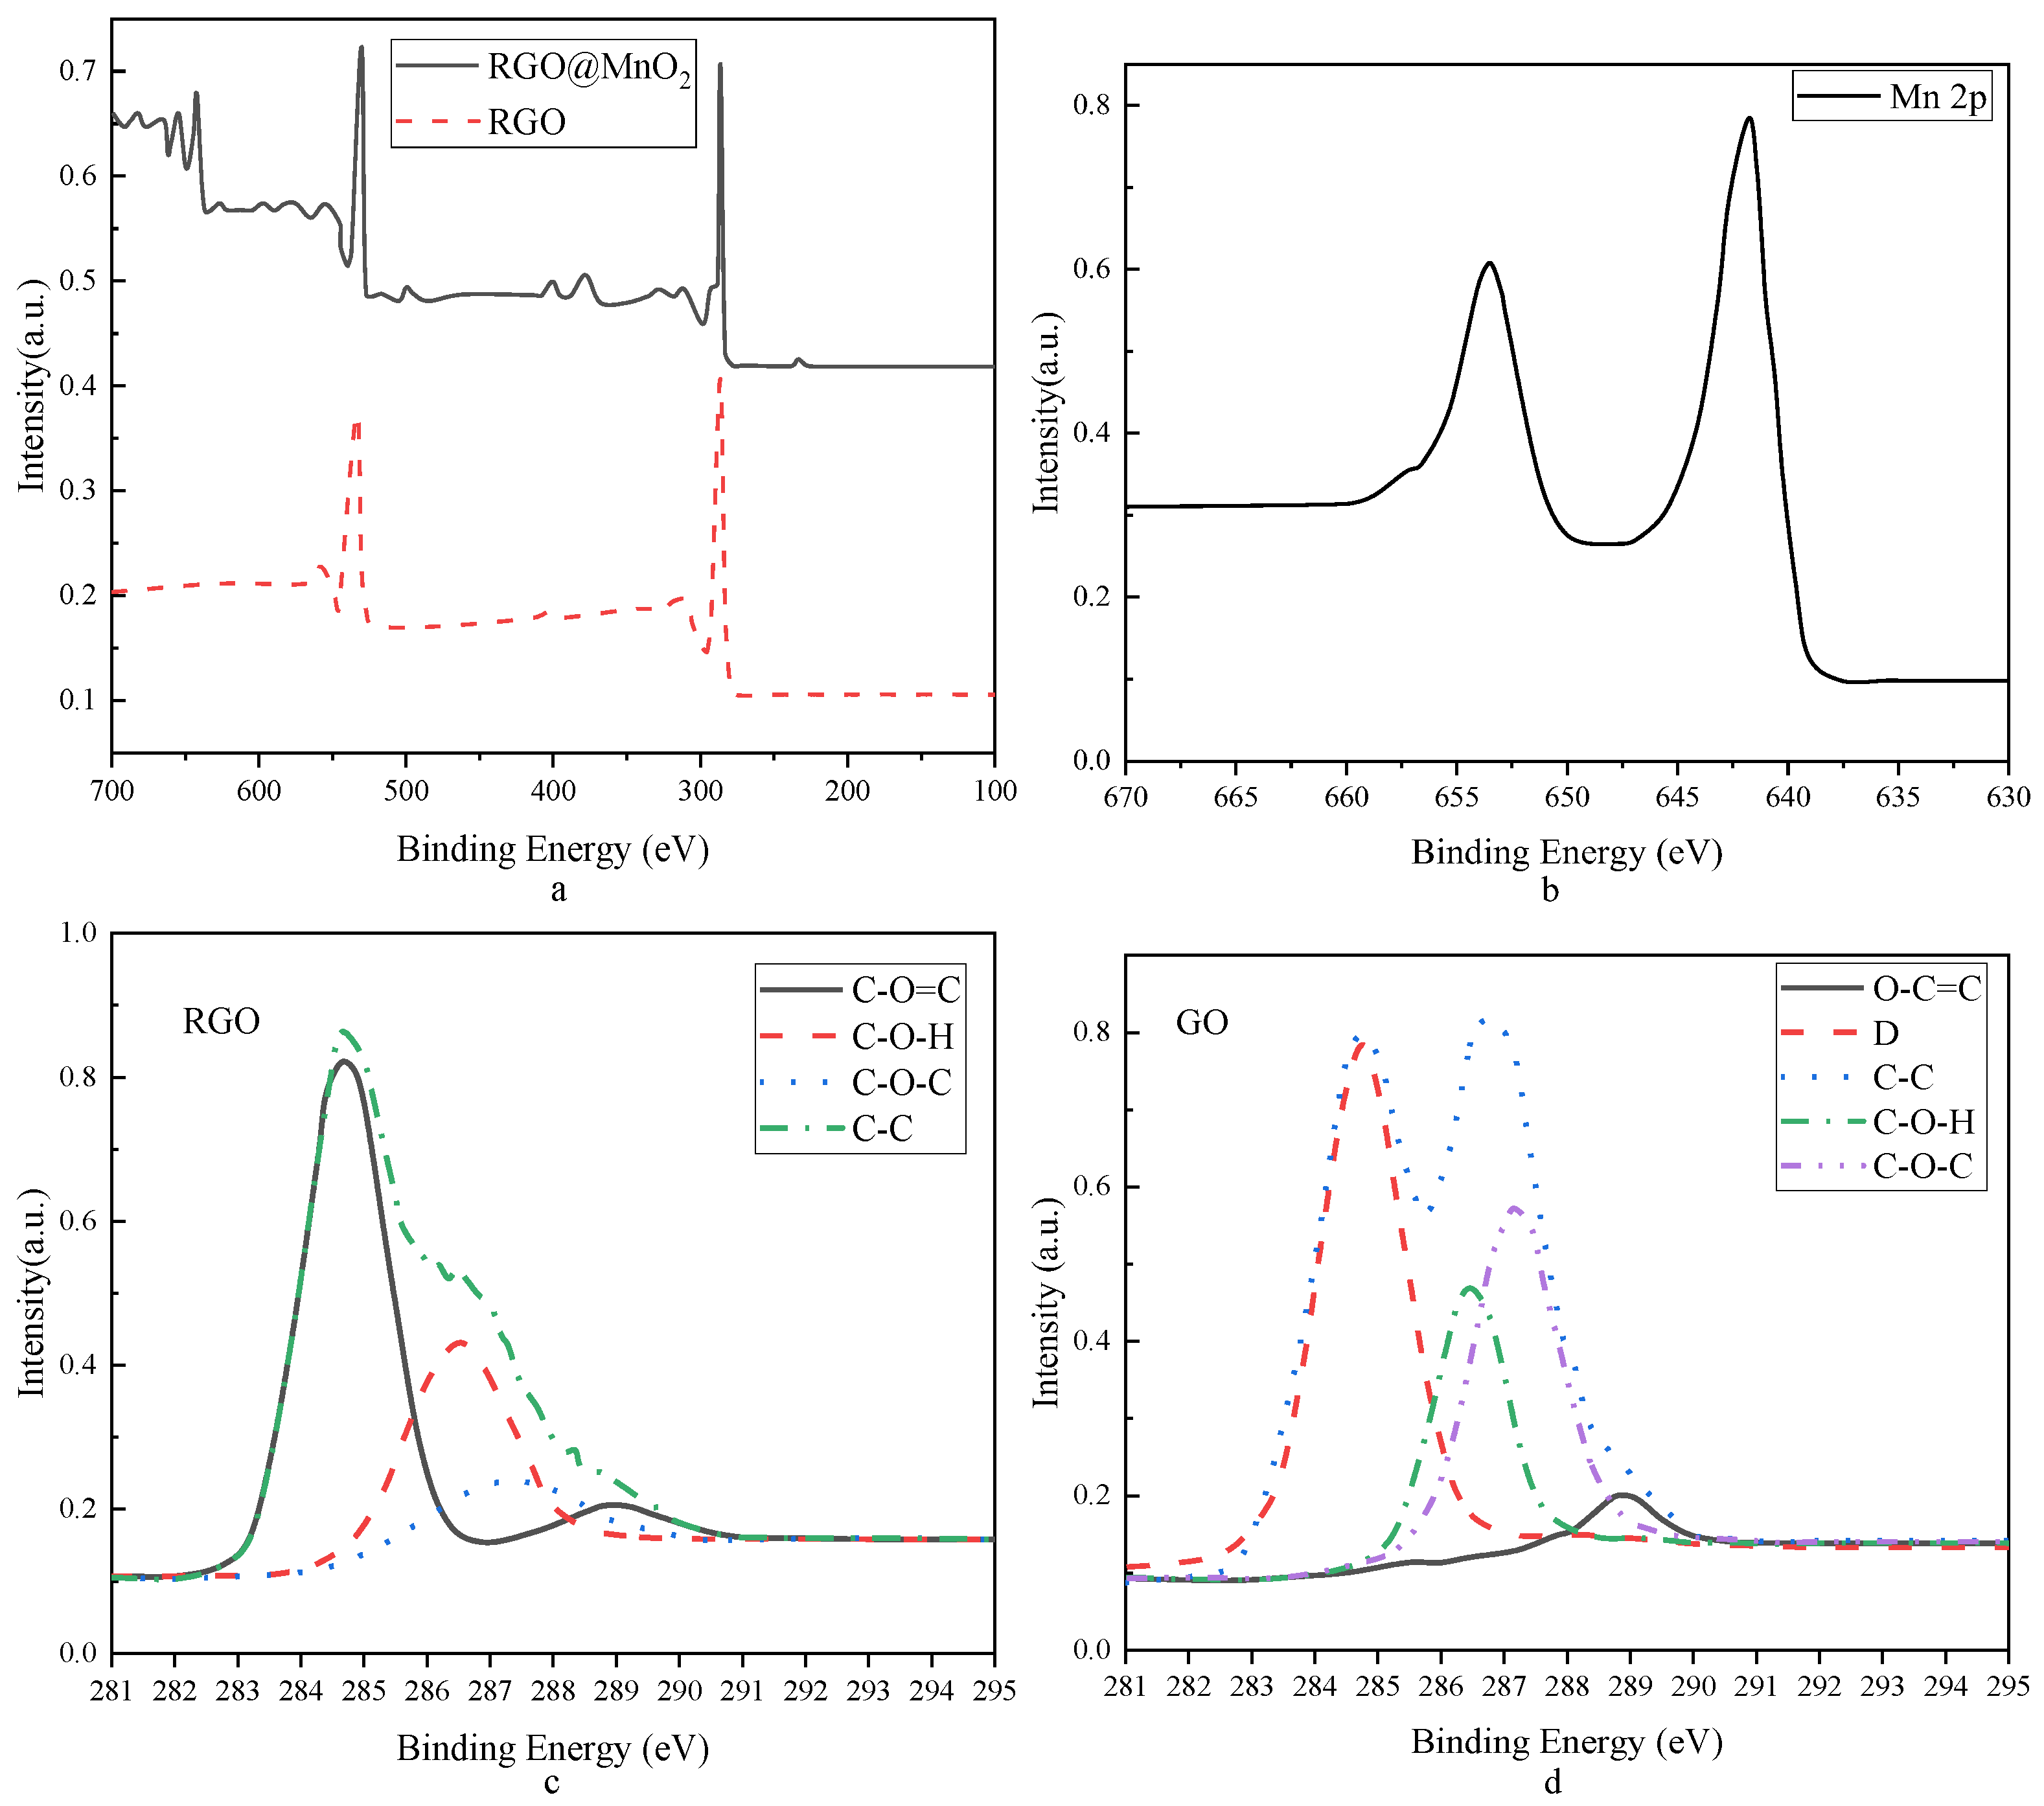
3.1.4. XPS Analysis
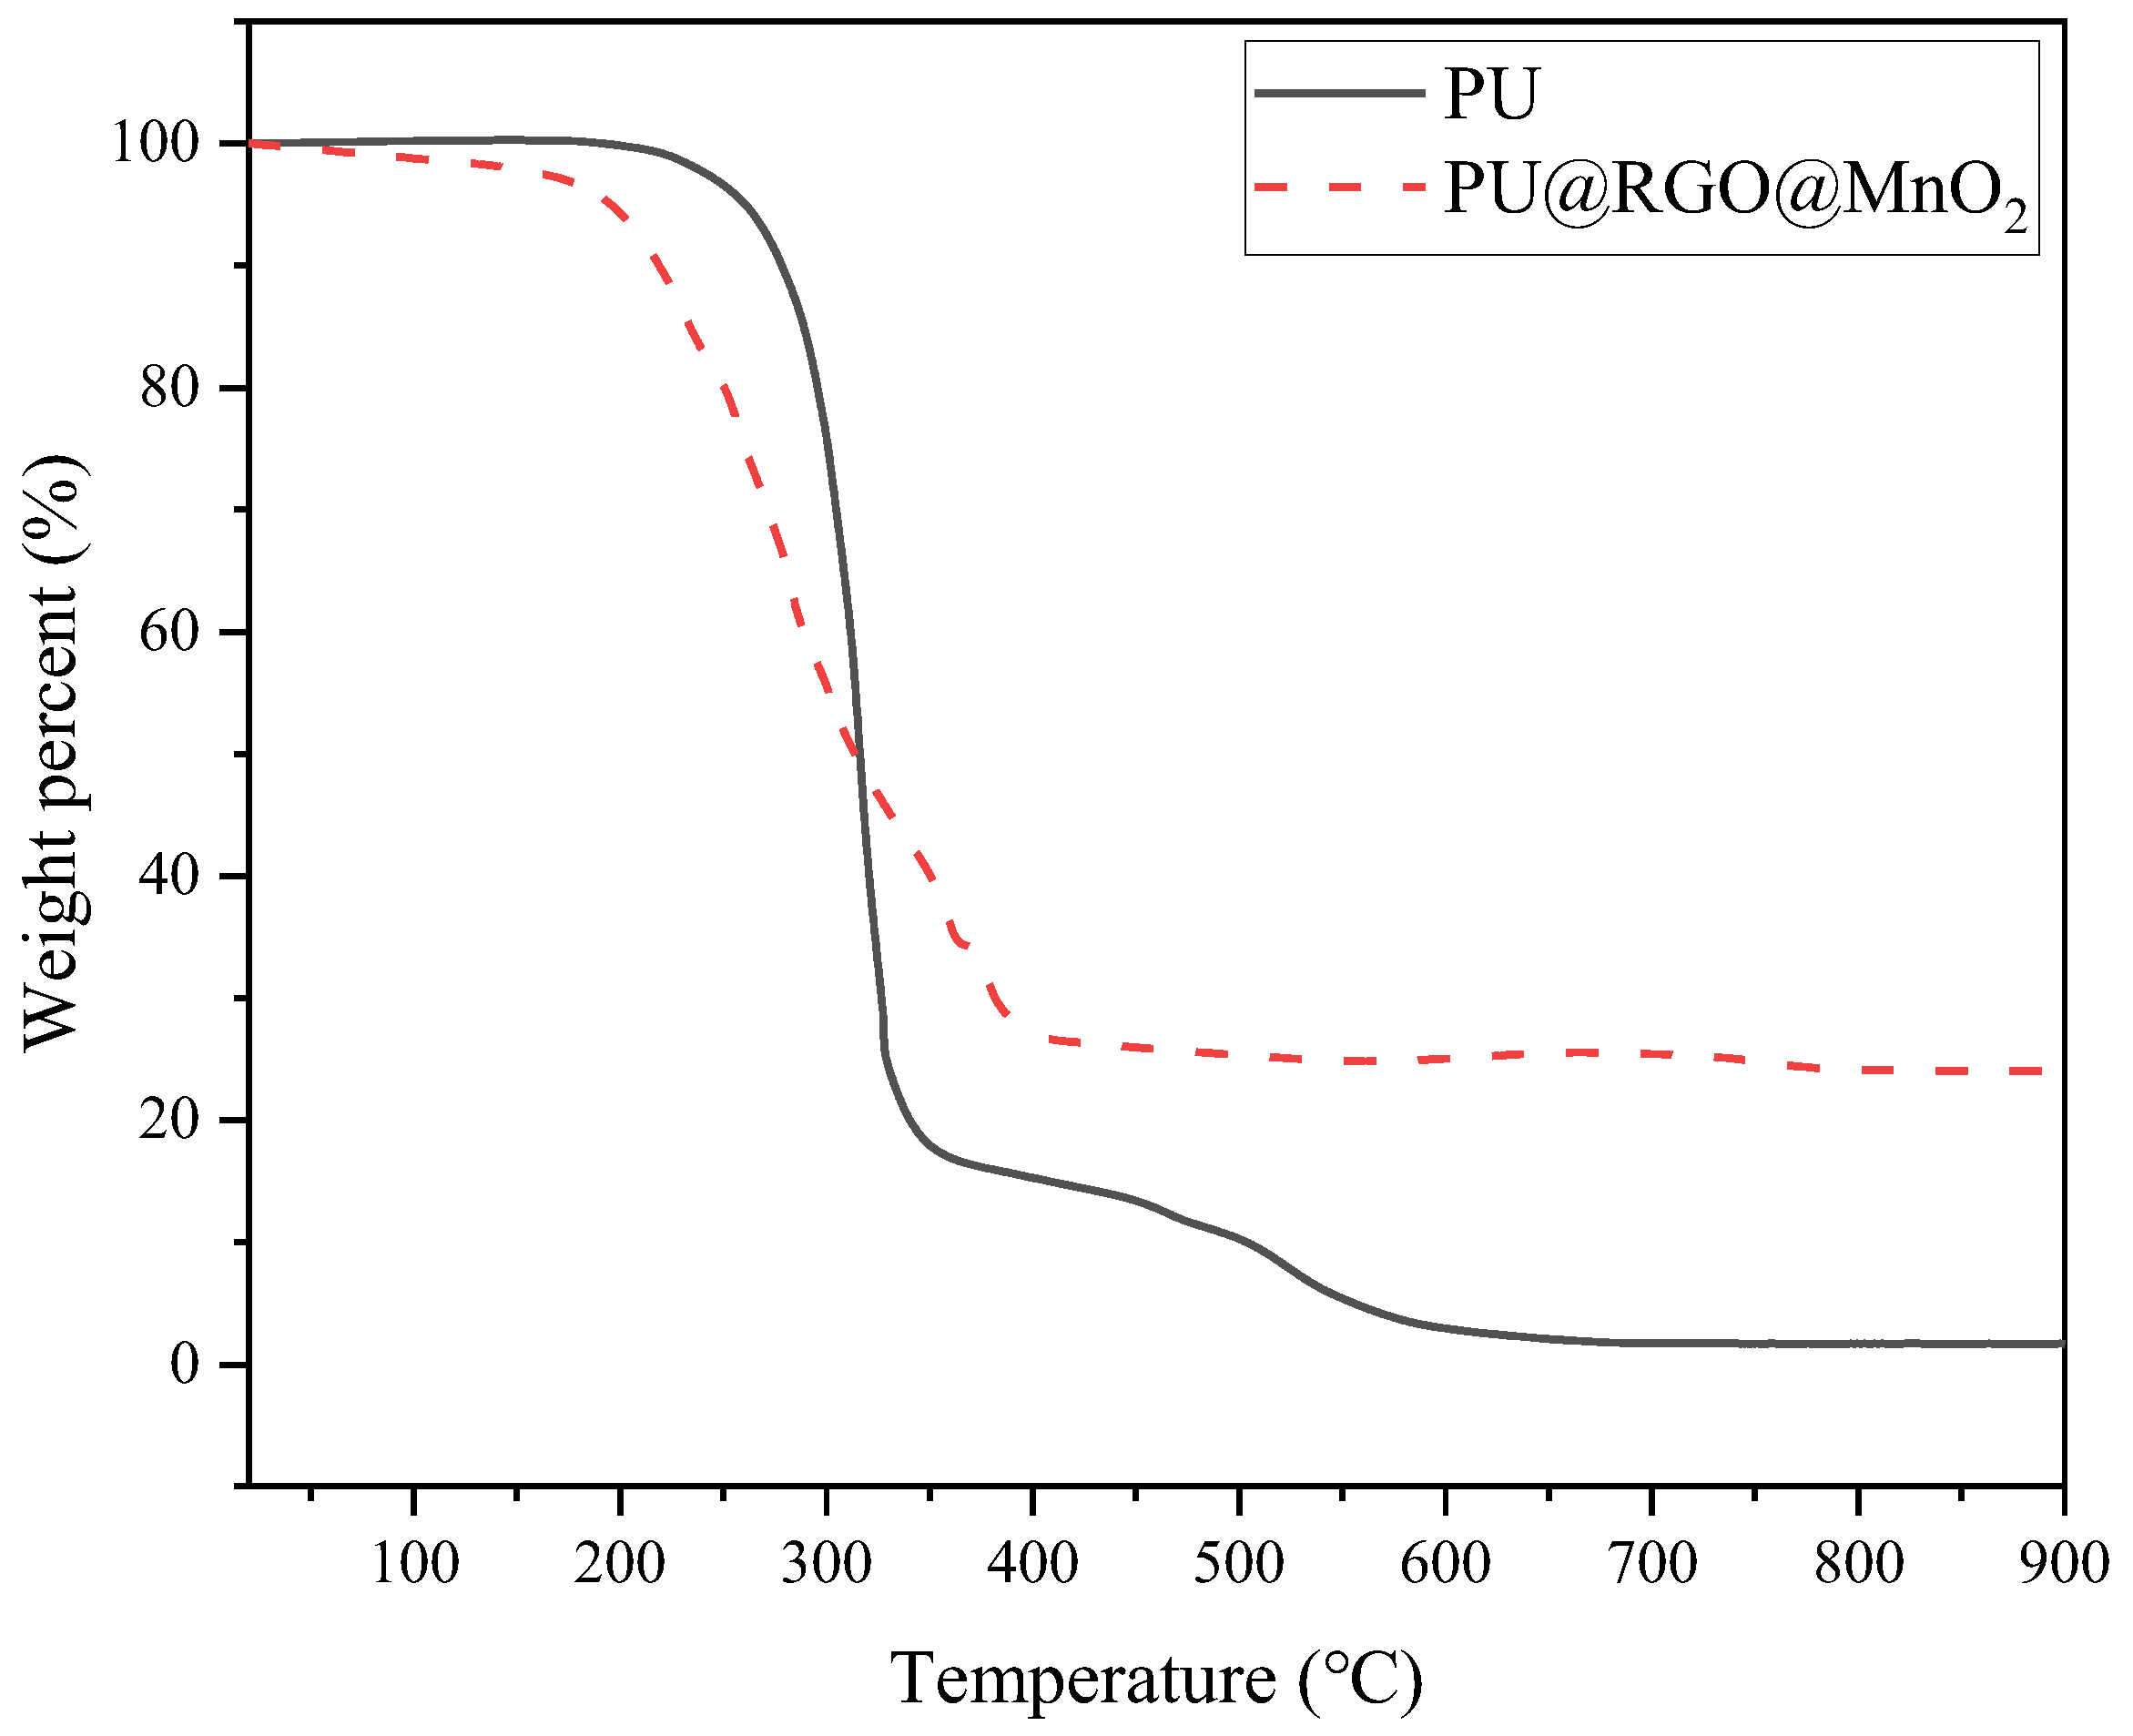
3.1.5. TGA
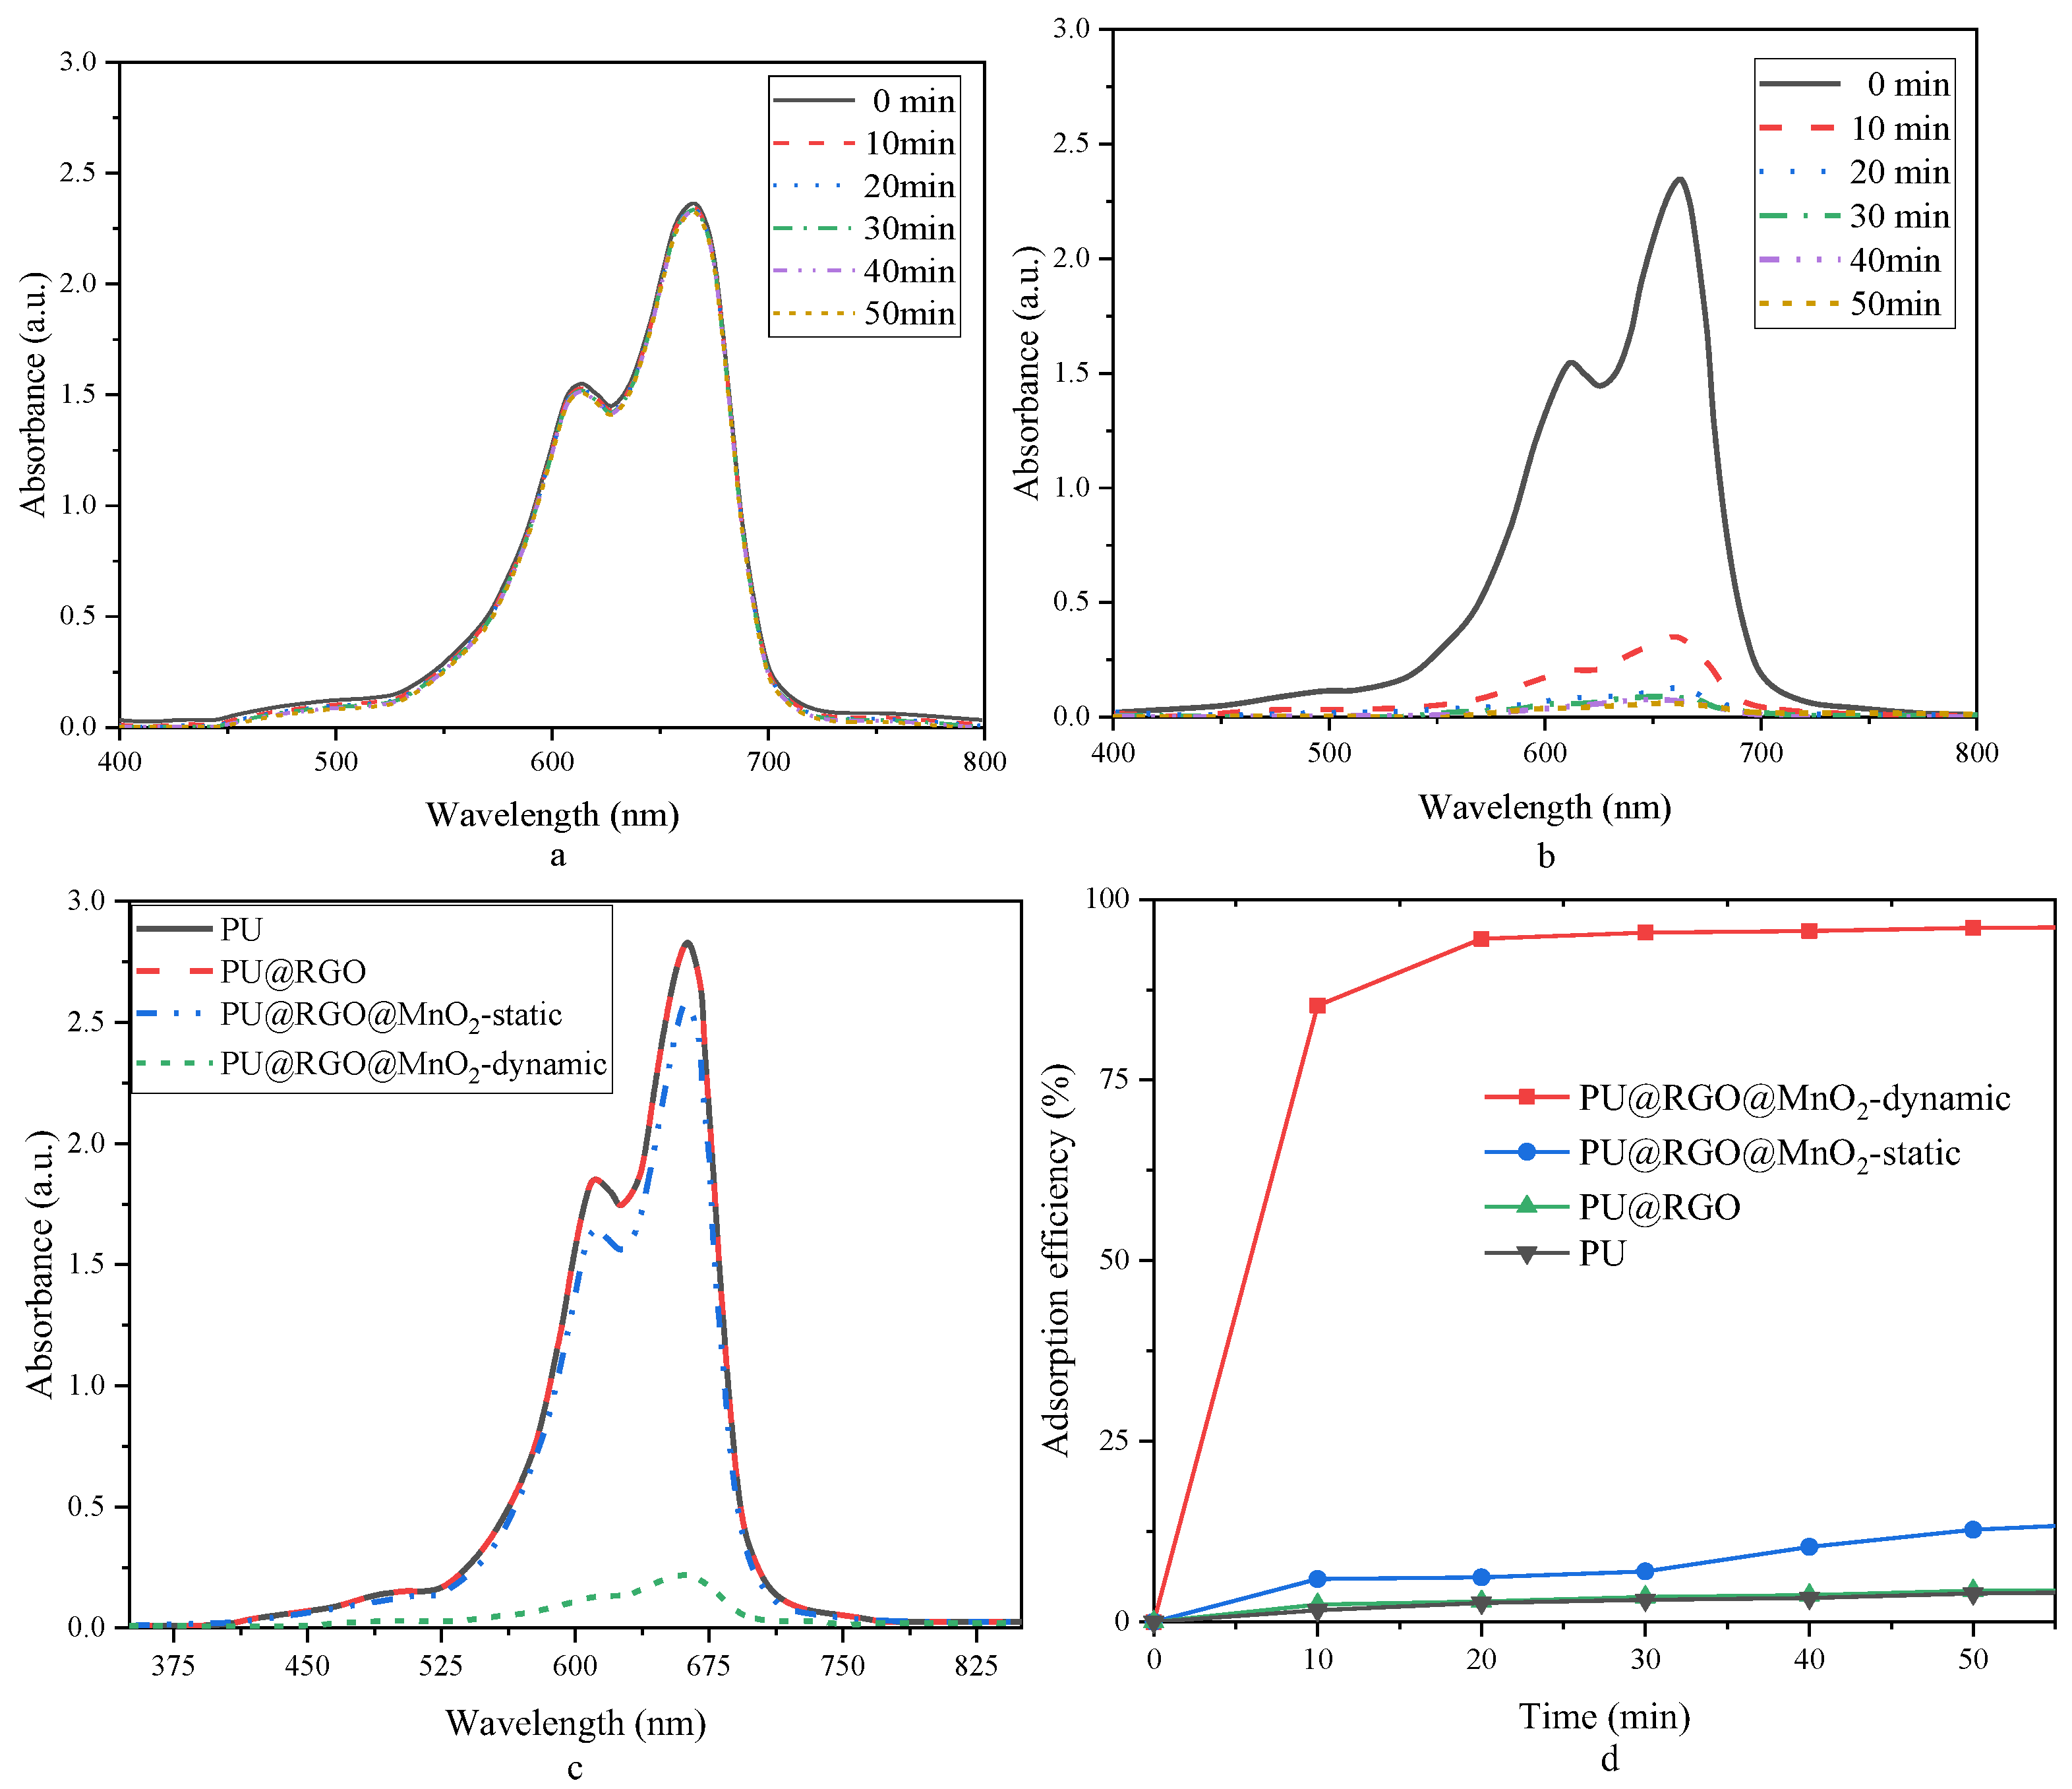
3.2. Adsorption of MB by PU@RGO@MnO2
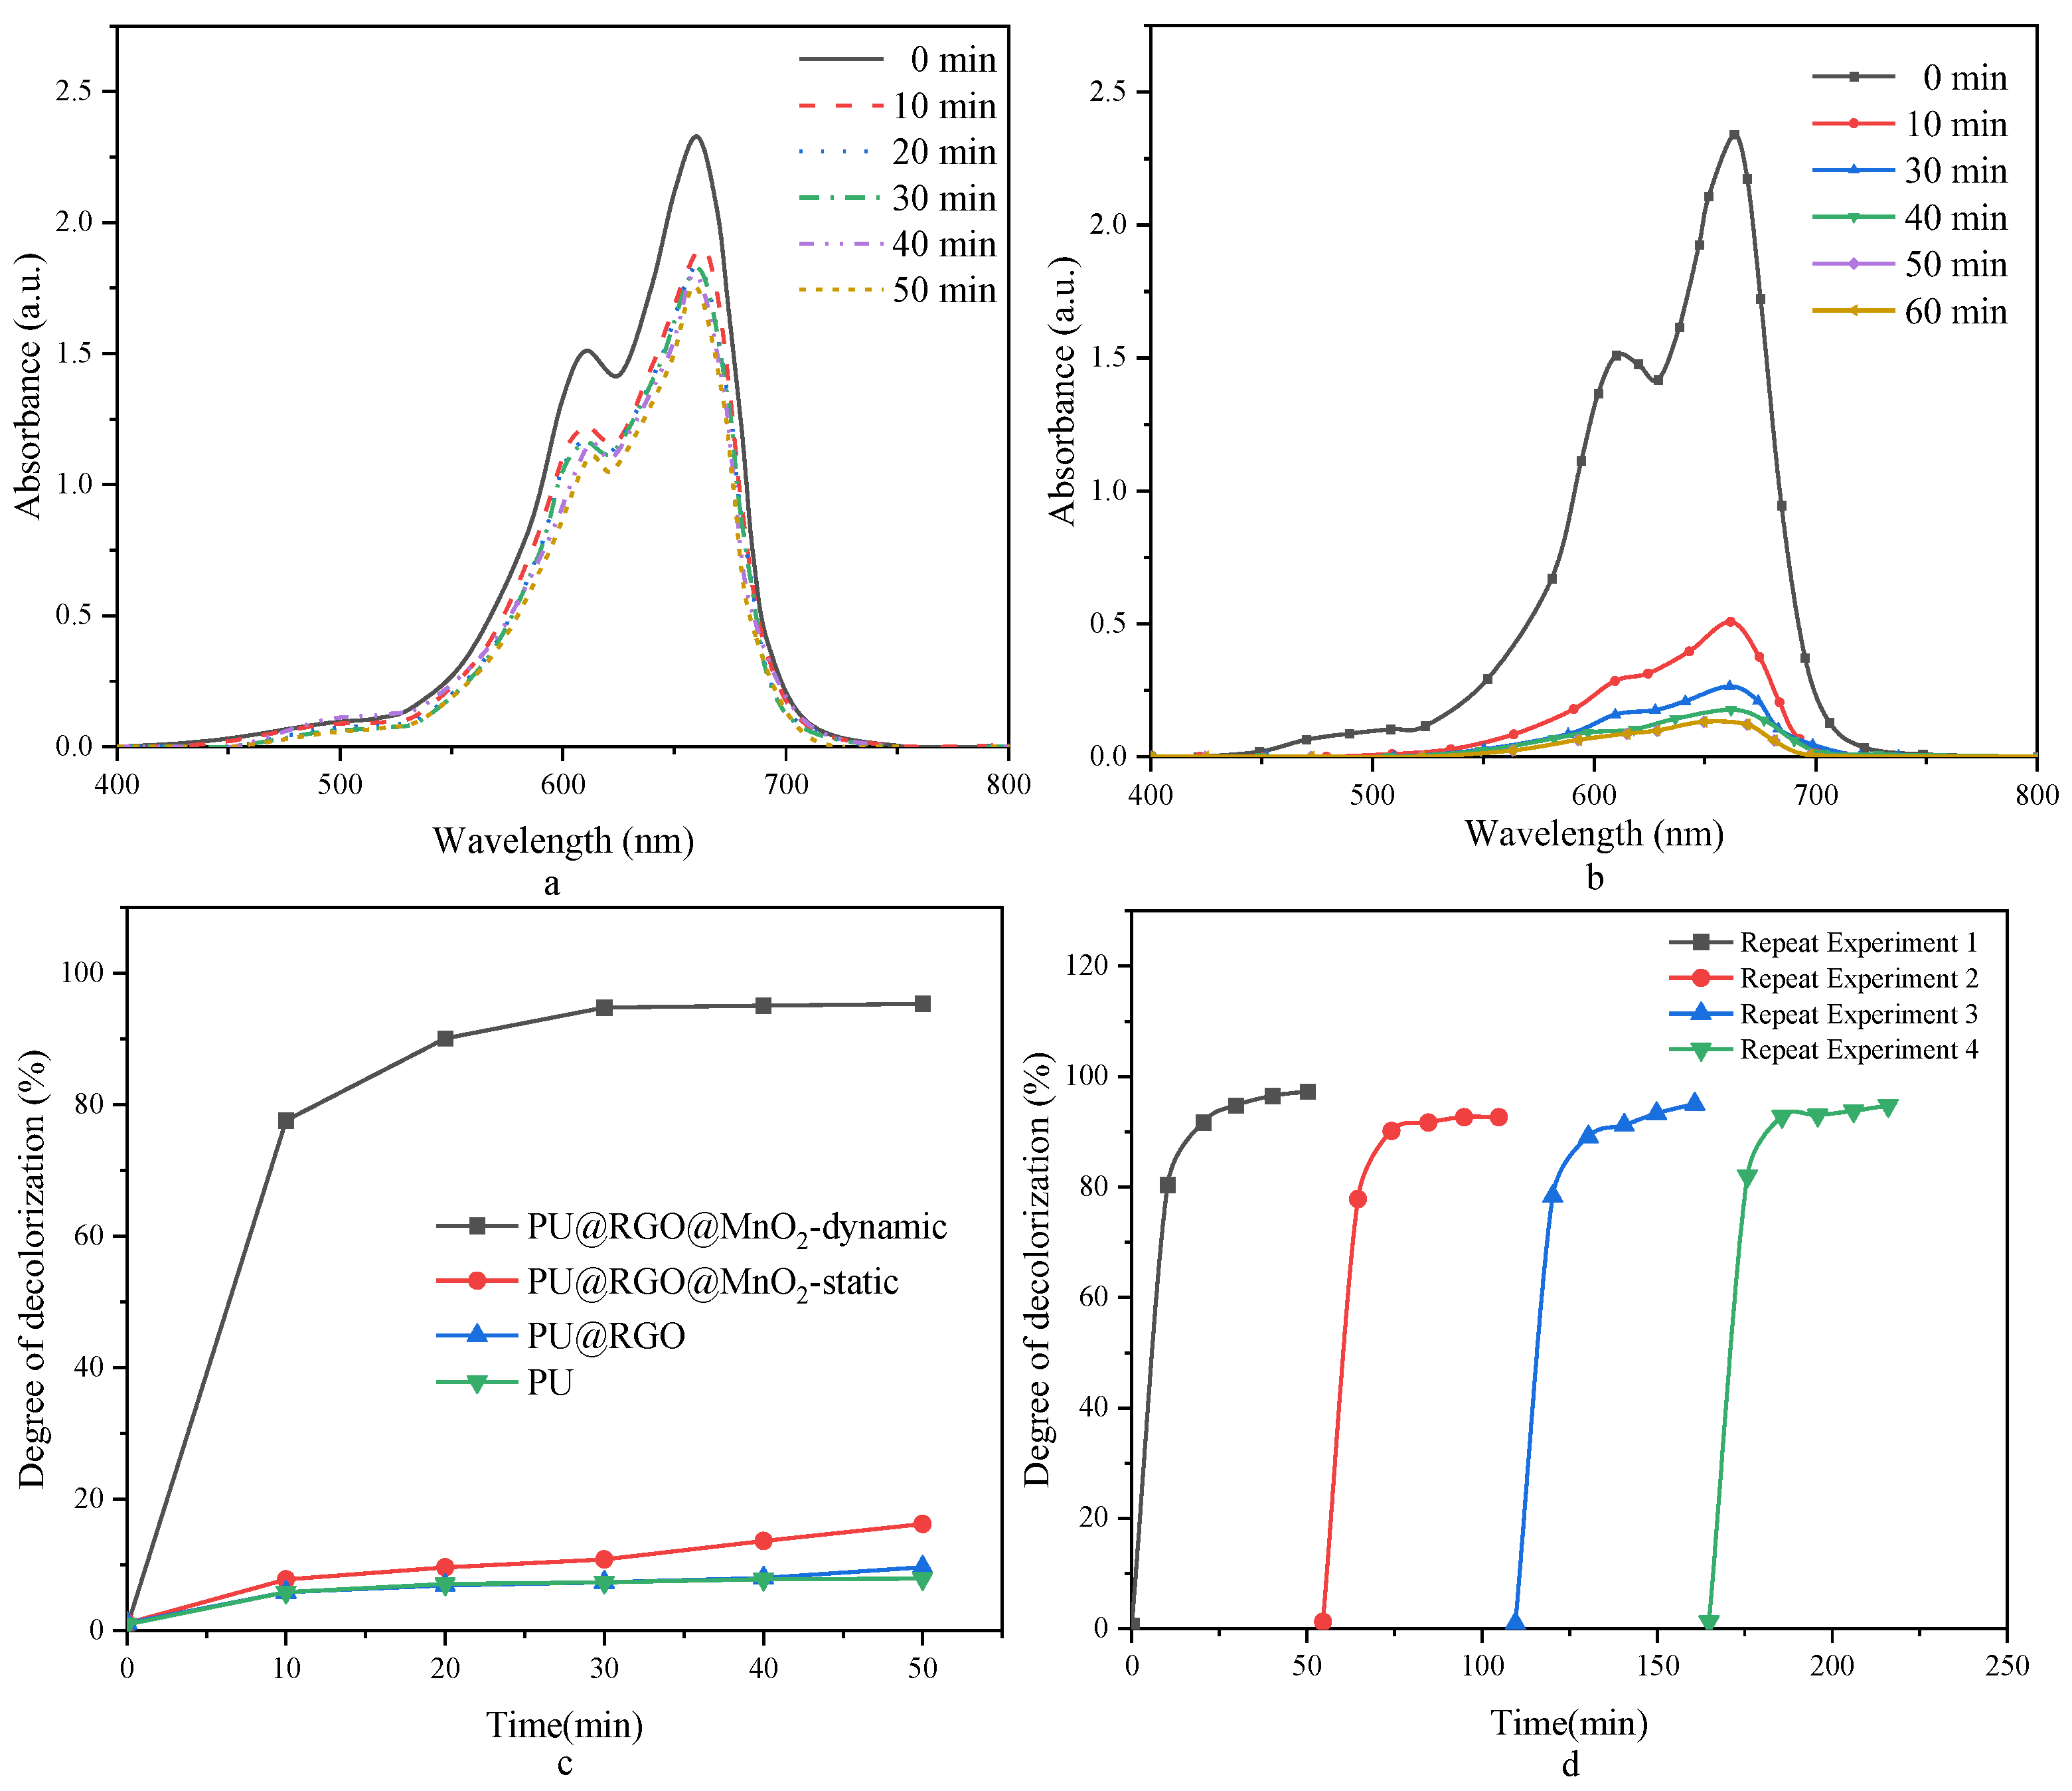
3.3. Removal of MBs Based on PU@RGO@MnO2
3.4. Isothermal Adsorption Experiments
4. Discussion
5. Conclusions
Author Contributions
Funding
Data Availability Statement
Conflicts of Interest
References
- Karaman, C.; Karaman, O.; Show, P.-L.; Orooji, Y.; Karimi-Maleh, H. Utilization of a double-cross-linked amino-functionalized three-dimensional graphene networks as a monolithic adsorbent for methyl orange removal: Equilibrium, kinetics, thermodynamics and artificial neural network modeling. Environ. Res. 2022, 207, 112156. [Google Scholar] [CrossRef]
- Buu, T.T.; Son, V.H.; Nam, N.T.H.; Hai, N.D.; Vuong, H.T.; Dat, N.M.; Hieu, N.H. Three-dimensional ZnO–TiO2/graphene aerogel for water remediation: The screening studies of adsorption and photodegradation. Ceram. Int. 2023, 49, 9868–9882. [Google Scholar] [CrossRef]
- Ali, I.; Wan, P.; Raza, S.; Peng, C.; Tan, X.; Sun, H.; Li, J. Development of novel MOF-mixed matrix three-dimensional membrane capsules for eradicating potentially toxic metals from water and real electroplating wastewater. Environ. Res. 2022, 215, 113945. [Google Scholar] [CrossRef] [PubMed]
- Fan, M.; Zhang, P.; Wang, C.; Tang, J.; Sun, H. Tailored design of three-dimensional rGOA-nZVI catalyst as an activator of persulfate for degradation of organophosphorus pesticides. J. Hazard. Mater. 2022, 428, 128254. [Google Scholar] [CrossRef] [PubMed]
- Gupta, A.D.; Kirti, N.; Katiyar, P.; Singh, H. A critical review on three-dimensional cellulose-based aerogels: Synthesis, physico-chemical characterizations and applications as adsorbents for heavy metals removal from water. Cellulose 2023, 30, 3397–3427. [Google Scholar] [CrossRef]
- Abdelhamid, H.N.; Sultan, S.; Mathew, A.P. Binder-free Three-dimensional (3D) printing of Cellulose-ZIF8 (CelloZIF-8) for water treatment and carbon dioxide (CO2) adsorption. Chem. Eng. J. 2023, 468, 143567. [Google Scholar] [CrossRef]
- Anjum, M.; Liu, W.; Qadeer, S.; Khalid, A. Photocatalytic treatment of wastewater using nanoporous aerogels: Opportunities and challenges. Emerg. Tech. Treat. Toxic Met. Wastewater 2023, 2023, 495–523. [Google Scholar]
- Solukluei, F.H.; Hassani, A.H.; Moniri, E.; Panahi, H.A.; Shirazi, R.H.S.M. Novel three-dimensional graphene oxide modified with hyper-branched dendrimer for removal of cephalexin from aqueous solutions by applying Taguchi statistical method. Inorg. Chem. Commun. 2023, 148, 110308. [Google Scholar] [CrossRef]
- Gildernew, E.; Tareq, S.; Yang, S. Three-Dimensional Graphene with Preserved Channeling as a Binder Additive for Zeolite 13X for Enhanced Thermal Conductivity, Vapor Transport, and Vapor Adsorption Loading Kinetics. Catalysts 2022, 12, 292. [Google Scholar] [CrossRef]
- Singh, R.; Ullah, S.; Rao, N.; Singh, M.; Patra, I.; Darko, D.A.; Issac, C.P.J.; Esmaeilzadeh-Salestani, K.; Kanaoujiya, R.; Vijayan, V. Synthesis of three-dimensional reduced-graphene oxide from graphene oxide. J. Nanomater. 2022, 2022, 8731429. [Google Scholar] [CrossRef]
- Sereshti, H.; Amirafshar, A.; Kadi, A.; Nodeh, H.R.; Rezania, S.; Hoang, H.Y.; Barghi, A.; Vasseghian, Y. Isolation of organophosphate pesticides from water using gold nanoparticles doped magnetic three-dimensional graphene oxide. Chemosphere 2023, 320, 138065. [Google Scholar] [CrossRef]
- Liu, T.; Li, D.; Huang, K.; Tan, S.; Huang, L. Preparation and water/oil separation of super-hydrophobic biomass adsorbent based on three-dimensional graphene aerogel. J. Chem. Technol. Biotechnol. 2023, 98, 744–755. [Google Scholar] [CrossRef]
- Pan, D.; Ge, S.; Tian, J.; Shao, Q.; Guo, L.; Liu, H.; Wu, S.; Ding, T.; Guo, Z. Research progress in the field of adsorption and catalytic degradation of sewage by hydrotalcite-derived materials. Chem. Rec. 2020, 20, 355–369. [Google Scholar] [CrossRef] [PubMed]
- Keerthi, M.; Manavalan, S.; Chen, S.M.; Shen, P.-W. A facile hydrothermal synthesis and electrochemical properties of manganese dioxide@ graphitic carbon nitride nanocomposite toward highly sensitive detection of nitrite. J. Electrochem. Soc. 2019, 166, B1245. [Google Scholar] [CrossRef]
- Zheng, X.; Zhang, C.; Mao, D.; Mao, H.; Yu, J. Fabrication of MnCoO x composite oxides for catalytic CO oxidation via a solid-phase synthesis: The significant effect of the manganese precursor. New J. Chem. 2022, 46, 4343–4352. [Google Scholar] [CrossRef]
- Tariq, H.A.; Abraham, J.J.; Shakoor, R.A.; Al-Qaradawi, S.; Karim, M.R.A.; Chaudhry, U. Synthesis of lithium manganese oxide nanocomposites using microwave-assisted chemical precipitation technique and their performance evaluation in lithium-ion batteries. Energy Storage 2020, 2, e202. [Google Scholar] [CrossRef]
- Pandey, A.; Dalal, S.; Dutta, S.; Dixit, A. Structural characterization of polycrystalline thin films by X-ray diffraction techniques. J. Mater. Sci. Mater. Electron. 2021, 32, 1341–1368. [Google Scholar] [CrossRef]
- Brundle, C.R.; Crist, B.V. X-ray photoelectron spectroscopy: A perspective on quantitation accuracy for composition analysis of homogeneous materials. J. Vac. Sci. Technol. 2020, 38, 041001. [Google Scholar] [CrossRef]
- Han, X.X.; Rodriguez, R.S.; Haynes, C.L.; Ozaki, Y.; Zhao, B. Surface-enhanced Raman spectroscopy. Nat. Rev. Methods Primers 2022, 1, 87. [Google Scholar] [CrossRef]
- Saadatkhah, N.; Carillo Garcia, A.; Ackermann, S.; Leclerc, P.; Latifi, M.; Samih, S.; Patience, G.S.; Chaouki, J. Experimental methods in chemical engineering: Thermogravimetric analysis—TGA. Can. J. Chem. Eng. 2020, 98, 34–43. [Google Scholar] [CrossRef]
- Feng, D.; Guo, D.; Zhang, Y.; Sun, S.; Zhao, Y.; Shang, Q.; Tan, H. Functionalized construction of biochar with hierarchical pore structures and surface O-/N-containing groups for phenol adsorption. Chem. Eng. J. 2021, 410, 127707. [Google Scholar] [CrossRef]
- Brand, C.; Kiałka, F.; Troyer, S.; Knobloch, C.; Simonović, K.; Stickler, B.A.; Hornberger, K.; Arndt, M. Bragg diffraction of large organic molecules. Phys. Rev. Lett. 2020, 125, 033604. [Google Scholar] [CrossRef]
- Hou, X.; Zheng, Y.; Lv, S.; Ma, Z.; Ma, X. Effective removal of hexamethyldisiloxane using a citric acid modified three-dimensional graphene aerogel. Renew. Energy 2022, 199, 62–70. [Google Scholar] [CrossRef]
- Yang, R.; Zhang, Q.; Li, C.; Zhang, J.; Xin, Y.; Ju, X.; Wang, D.; Shi, J.; Zheng, Y. Macroscopic liquid-like three-dimensional graphene oxide-based derivatives for efficient copper ion adsorption in water treatment. J. Mater. Sci. 2022, 57, 19756–19768. [Google Scholar] [CrossRef]
- Hong, C.; Chen, K.; Zheng, X.; Wan, Y.; Li, Z.; Lin, L. Hierarchical porous structure of urushiol mediated Fe3O4/three-dimensional graphene composites towards enhanced Fenton degradation of tetracycline. Chem. Eng. Sci. 2023, 281, 119111. [Google Scholar] [CrossRef]
- Ma, X.; Xu, Y. Three-dimensional porous nitrogen-doped carbon aerogels derived from cellulose@ mof for efficient removal of dye in water. J. Environ. Chem. Eng. 2022, 10, 108385. [Google Scholar] [CrossRef]
- Motaghi, H.; Arabkhani, P.; Parvinnia, M.; Javadian, H.; Asfaram, A. Synthesis of a highly porous three-dimensional PVA/GO/ZIF-67 cryogel for the simultaneous treatment of water contaminated with cadmium (ii) and lead (ii) heavy metal ions. New J. Chem. 2022, 46, 4449–4461. [Google Scholar] [CrossRef]
- Selvakumar, R.; Guhananthan, A.; Palanisami, T. Recent advances in micropollutant removal and mitigation from water using three dimensional adsorbent materials. Curr. Opin. Environ. Sci. Health 2023, 2023, 100475. [Google Scholar] [CrossRef]
- Yang, F.; Zhang, J.; Lin, T.; Ke, L.; Huang, L.; Deng, S.-P.; Zhang, J.; Tan, S.; Xiong, Y.; Lu, M. Fabrication of waste paper/graphene oxide three-dimensional aerogel with dual adsorption capacity toward methylene blue and ciprofloxacin. J. Iran. Chem. Soc. 2023, 20, 801–816. [Google Scholar] [CrossRef]
- Qu, H.; Xiao, X.; Han, Z.; Hu, M.; Shen, S.; Yang, L.; Jia, F.; Wang, T.; Ye, Z.; Sun, W.; et al. Graphene oxide nanofiltration membrane based on three-dimensional size-controllable metal–organic frameworks for water treatment. ACS Appl. Nano Mater. 2022, 5, 5196–5207. [Google Scholar] [CrossRef]
- Zheng, A.L.T.; Ohno, T.; Andou, Y. Recent progress in photocatalytic efficiency of hybrid three-dimensional (3D) graphene architectures for pollution remediation. Top. Catal. 2022, 65, 1634–1647. [Google Scholar] [CrossRef]


| Raw Materials and Reagents | Specification | Manufacturers |
|---|---|---|
| KMnO4 | Analytically pure | Beijing Chemical Works, Beijing, China |
| Oil of vitriol | Analytically pure | Beijing Chemical Works, Beijing, China |
| Sodium nitrate | Analytically pure | Xilong Chemical Company, Guangdong, China |
| Concentrated hydrochloric acid | Analytically pure | Beijing Chemical Works, Beijing, China |
| PU Sponge | 0.5 m × 0.5 m | Hebei Warner Bros, Hebei, China |
| Flake natural graphite | 300 Mesh | East China Graphite Factory, Guangdong, China |
| Hydrogen peroxide | 30% | Beijing Chemical Works, Beijing, China |
| Instrument | Specification | Manufacturers |
|---|---|---|
| Analytical balance | AP135W | Shimadzu, Tokyo, Japan |
| IKA stirring hot stand | RET | Germany IKA, Staufen, Germany |
| Ultrasonic cell crusher | JY92-IIDN | Njinbo Scientc Biotechnology Co., Ltd., Zhejiang, China |
| Blast drying oven | DHG-9050A | Beijing Luxi Technology Co., Beijing, China |
| Desk centrifuge | TG16-WS | Hunan Xiangyi Laboratory Instrument Company, Xiangtan, China |
| Magnetic stirring apparatus | RO-10POWER | Shanghai Zhenrong Instrument Company, Shanghai, China |
| Vacuum drying chamber | DZF-6050 | Beijing Luxi Technology Co., Beijing, China |
| The Experimental Content | Adsorption Capacity (mg/g) | |
|---|---|---|
| pH value | 3 | 25.6 |
| 5 | 31.2 | |
| 7 | 35.8 | |
| 9 | 29.7 | |
| Salinity (mS/cm) | 2 | 28.5 |
| 5 | 24.7 | |
| 10 | 21.3 | |
| 15 | 18.9 | |
| DO (mg/L) | 1 | 24.6 |
| 5 | 29.3 | |
| 10 | 33.1 | |
| 15 | 38.7 | |
Disclaimer/Publisher’s Note: The statements, opinions and data contained in all publications are solely those of the individual author(s) and contributor(s) and not of MDPI and/or the editor(s). MDPI and/or the editor(s) disclaim responsibility for any injury to people or property resulting from any ideas, methods, instructions or products referred to in the content. |
© 2024 by the authors. Licensee MDPI, Basel, Switzerland. This article is an open access article distributed under the terms and conditions of the Creative Commons Attribution (CC BY) license (https://creativecommons.org/licenses/by/4.0/).
Share and Cite
Zong, S.; Jiang, J.; Wang, G.; Zhong, J.; Tang, C.; Zhou, L.; Yang, F.; Yan, W. Synergetic Adsorption of Dyes in Water by Three-Dimensional Graphene and Manganese Dioxide (PU@RGO@MnO2) Structures for Efficient Wastewater Purification. Processes 2024, 12, 169. https://doi.org/10.3390/pr12010169
Zong S, Jiang J, Wang G, Zhong J, Tang C, Zhou L, Yang F, Yan W. Synergetic Adsorption of Dyes in Water by Three-Dimensional Graphene and Manganese Dioxide (PU@RGO@MnO2) Structures for Efficient Wastewater Purification. Processes. 2024; 12(1):169. https://doi.org/10.3390/pr12010169
Chicago/Turabian StyleZong, Shirong, Jijun Jiang, Guodong Wang, Jin Zhong, Chunlan Tang, Lingxiang Zhou, Fan Yang, and Wei Yan. 2024. "Synergetic Adsorption of Dyes in Water by Three-Dimensional Graphene and Manganese Dioxide (PU@RGO@MnO2) Structures for Efficient Wastewater Purification" Processes 12, no. 1: 169. https://doi.org/10.3390/pr12010169