Article

An Experimental Investigation of Hydrogen Production through Biomass Electrolysis

1
Centre for Sustainable Technologies, School of Architecture and the Built Environment, Ulster University, Belfast BT15 1ED, UK
2
Nanotechnology and Integrated Bioengineering Centre (NIBEC), School of Engineering, Ulster University, Belfast BT15 1ED, UK
3
School of Energy Power and Mechanical Engineering, North China Electric Power University, Beijing 102206, China
*
Author to whom correspondence should be addressed.
Processes 2024, 12(1), 112; https://doi.org/10.3390/pr12010112
Submission received: 10 November 2023 / Revised: 18 December 2023 / Accepted: 28 December 2023 / Published: 2 January 2024
(This article belongs to the Special Issue Sustainability Use of Wood/Wood Residues and Other Bioenergy Sources)

Abstract

:
This work investigated hydrogen production from biomass feedstocks (i.e., glucose, starch, lignin and cellulose) using a 100 mL h-type proton exchange membrane electrolysis cell. Biomass electrolysis is a promising process for hydrogen production, although low in technology readiness level, but with a series of recognised advantages: (i) lower-temperature conditions (compared to thermochemical processes), (ii) minimal energy consumption and low-cost post-production, (iii) potential to synthesise high-volume H2 and (iv) smaller carbon footprint compared to thermochemical processes. A Lewis acid (FeCl3) was employed as a charge carrier and redox medium to aid in the depolymerisation/oxidation of biomass components. A comprehensive analysis was conducted, measuring the H2 and CO2 emission volume and performing electrochemical analysis (i.e., linear sweep voltammetry and chronoamperometry) to better understand the process. For the first time, the influence of temperature on current density and H2 evolution was studied at temperatures ranging from ambient temperature (i.e., 19 °C) to 80 °C. The highest H2 volume was 12.1 mL, which was produced by FeCl3-mediated electrolysis of glucose at ambient temperature, which was up to two times higher than starch, lignin and cellulose at 1.20 V. Of the substrates examined, glucose also showed a maximum power-to-H2-yield ratio of 30.99 kWh/kg. The results showed that hydrogen can be produced from biomass feedstock at ambient temperature when a Lewis acid (FeCl3) is employed and with a higher yield rate and a lower electricity consumption compared to water electrolysis.

Graphical Abstract

1. Introduction

Currently, global energy is produced by conventional fossil fuel-based approaches that cause significant environmental degradation due to the release of greenhouse gases (GHGs) [1]. Burning fossil fuels promotes the emission of harmful gases, such as SOx, NOx and CO2, into the atmosphere, which cause global warming and other health-related issues [2]. Studies have shown that in 2020, 35.5 billion metric tons of carbon dioxide (CO2) was produced, which is expected to rise to nearly 45 billion metric tons in 2040 if current policies persist [3,4]. Furthermore, reserves of conventional fossil are limited, and diversification is required to maintain energy supply at an affordable cost.
Considering the current scenarios, researchers are working to explore alternate energy sources that are sustainable and can meet future globally dispersed energy demands [5]. Alternative energy sources have been effectively used to generate power for many years, including wind, solar, hydropower and biomass [6]. Energy recovery from biomass is considered one of the most promising pathways with advantages including low CO2 emissions, the potential to reduce waste production, the local availability of material with local power production and, when compared to fossil fuel-based technologies, lower capital and operational costs [7]. Biomass refers to naturally occurring organic material from animals and plants that contain energy in several forms [8]. In general, most plant-based biomass comprises 10–25 wt.% lignin, 20–40 wt.% hemicellulose and 40–60 wt.% cellulose [9]. Biomass can be categorised as (i) woody biomass (i.e., wood pellets, wood chips, firewood); (ii) biogenic materials in solid municipal waste—wool, cotton, paper, etc.; (iii) agriculture crops—woody plants, sugar cane, algae, switch grass, corn, etc.; and (iv) human and animal waste [10]. Plant-based biomass waste such as fruit (banana, orange, grapes, apples) and vegetables (potatoes, beets, carrots) contain significant quantities of glucose and starch, which are more readily converted to hydrogen than complex carbohydrates.
Hydrogen (H2) is considered a clean and green energy source, emitting only H2O vapours as a by-product when burnt to release energy [11]. H2 has a high gravimetric energy density (141.9 MJ/kg); therefore, 1 kg of H2 gas can produce as much energy as 2.63 kg of gasoline [12]. However, most of the H2 generated for energy applications uses fossil fuels via the processes of steam reforming of natural gas and coal gasification [13]. Therefore, there is a need to investigate sustainable and economically viable approaches to produce clean and sustainable H2. Biomass is a clean energy source for H2 production because of its carbon neutrality and reduced greenhouse gas emissions. In addition, biomass contains a certain amount of the element hydrogen, so it is an excellent source for hydrogen production [14]. Various techniques have been employed to convert biomass to H2, including thermochemical, biochemical and electrochemical processes [15]. Thermochemical conversion technologies include pyrolysis and gasification techniques [16], while biochemical techniques widely use fermentation and anaerobic digestion processes. However, thermo-based and bio-based approaches have several limitations. Hydrogen generation via the thermochemical pathway requires a high reaction temperature, is energy-intensive and needs a better catalyst durability due to coke formation, resulting in a relatively low process efficiency of the H2 generation [17]. Biochemical biomass conversion methods typically require mild reaction conditions for H2 production but need long hydraulic retention times, complexity in operation and a stable supply of microorganisms, which can prevent a widespread uptake within distributed power supply networks [18].
Recently, researchers have developed a novel technology known as aqueous-phase reforming for hydrogen production [19]. Pipitone et al. [20] investigated the influence of temperature and carbon concentration on hydrogen production via an aqueous-phase reforming route using a Pt-based catalyst. They reported that a low percentage of carbon and high temperature, i.e., 270 °C, are required to obtain the maximum hydrogen yield. Similarly, Godina et al. [21] investigated hydrogen production from sucrose via aqueous-phase reforming using a Pt-based catalyst. They demonstrated that a maximum hydrogen yield of 62% can be obtained at an elevated temperature of around 225 °C and high pressure.
Recently, the electrochemical conversion of biomass to H2 has gained interest where low-energy-intensive systems can effectively utilise biomass for H2 generation [14,22,23]. Biomass electrolysis presents several advantages in comparison to existing H2-generating technologies, including (i) biomass material valorisation at lower-temperature conditions (compared to gasification and pyrolysis); (ii) minimal energy consumption and low-cost post-production (no requirement of purification and separation process because pure H2 is produced); (iii) the potential to synthesise more H2 at low voltages (between 0.1 and 1.2 V), therefore reducing electricity consumption (40% less electricity consumption than water electrolysis) [24]; and (iv) the small carbon footprint compared to gasification and pyrolysis.
Currently, biomass electrolysis is carried out using microbial electrolysis cells (MECs) and proton exchange membrane electrolysis cells (PEMECs) [14,25]. Gautam et al. [26] investigated hydrogen production in a microbial electrolysis cell reactor using bagasse as feedstock. They reported that the microbial electrolysis cell (MEC) resulted in 0.25 m3 of H2/m3/day at an applied potential of 0.80 V and an electrical energy efficiency of 97.47 with an error of 2%. Within an MEC, a broad range of biomass feedstock/substrates can be utilised, but the major drawback is that biogenic microbes cannot process biomass material directly, and a pre-treatment or fermentation is required to produce low-molecular-weight substances like alcohols and organic acids [27,28]. In addition, the expense of electrode materials, the sluggish electroactivity of microorganisms and low hydrogen yield provide a significant challenge to scaling up the MEC technology [29,30]. The PEMEC is considered a promising method for pure hydrogen generation; it offers the possibility of biomass degradation without the high temperatures and pressures needed for the thermal conversion of biomass [31,32]. In a PEMEC, a proton exchange membrane (PEM) facilitates the fast transportation of protons (H+) to the cathode. This process results in the production of high-purity hydrogen (H2). One of the key advantages of this method is that it eliminates the need for an additional separation process to purify the hydrogen [33].
The costs for PEMECs are considered viable at large scale, with the technology employed for water electrolysis generating H2. To perform the water electrolysis, an electric potential of 1.23 V vs. an SHE (standard hydrogen electrode) must be applied in the presence of noble metal catalysts (for example, platinum or iridium) for both the anode and cathode side. But in actual conditions, this potential reaches 1.8–2.0 V because of the slow kinetics of the anodic oxygen evolution reaction (OER) [34]. To enhance the efficiency of the PEMEC and reduce the required electric potential, various catalysts and alcoholic substrates have been explored. Substances such as ethanol, methanol, formic acid and 5-hydroxymethyl-2-furoic acid have been utilised to replace the oxygen evolution reaction (OER) at the anode [35,36,37,38] Additionally, specific catalysts like Pt-modified ruthenium/iridium oxide [39] and Pt-Ni-coated graphene nanoplatelets [40] have been employed at the anode to boost the performance of PEMECs, particularly in enhancing hydrogen (H2) generation. However, these noble metal-based catalysts are only efficient for the electro-oxidation of alcohols, but for raw biomass, they are ineffective and cannot be employed in PEMECs [41]. Compared to water electrolysis, biomass electrolysis generates hydrogen by substituting the oxygen evolution reaction with the oxidation of biomass-derived fuels at the anode, allowing the use of non-noble metal catalysts. In this case, to valorise the native biomass materials, a highly active catalyst (electrolyte) or mediator is required to degrade biomass into smaller molecules and enable it to be utilised directly in a PEMEC for efficient H2 generation [41,42].
In this context, iron (III) chloride (FeCl3) (Lewis acid) has gained much attention from researchers due to its low cost, wide availability and reasonable performance for PEM-based H2 generation through biomass [14]. FeCl3 is highly reactive due to its good solubility and acidity and, given multiple oxidation states, can also easily undergo redox reactions. The overall conversion of biomass to H2 yield can be accomplished in two phases. In the first step, the biomass and Fe+3 (from FeCl3) undergo an oxidation–reduction reaction during the pre-treatment process, the biomass components are converted into oxidised products and CO2 upon their oxidation, and Fe+3 is reduced to Fe+2 under heat [43]. In the second step of the process, electrolysis is performed on a solution that has been pre-treated with FeCl3 and biomass. During this process, the reduced form of iron (Fe+2) is reoxidised back to its original form, iron (Fe+3). This reoxidation process simultaneously releases electrons and protons (H+) from the biomass. The H+ travels across the proton exchange membrane and is reduced at the cathode to produce H2 gas molecules [44]. Herein, it is essential to note that the H+ protons produced during electrolysis are converted to H2 gas and depend on the H2 content of the biomass feedstocks, not on the water molecules, since the oxygen evolution reaction (OER) of the water electrolysis is replaced by the oxidation reaction of biomass [45]. Therefore, the reactions that take place during the pretreatment stage and electrolysis stage are given in Equations (1)–(3) [24].
Pre-treatment stage:
B i o m a s s + w a t e r + F e + 3 C O 2 + O x i d i s e d   p r o d u c t s + F e + 2 + H +
Electrochemical reactions during the electrolysis stage:
At the anode:
F e + 2 F e + 3 + e
At the cathode:
e + H + 1 2 H 2
In a recent study [24], lignin was degraded using Lewis acids (such as FeCl3 and ZnCl2), resulting in a higher depolymerisation efficiency, which demonstrates the potential for FeCl3 to be used for the degradation of lignocellulosic biomass. Wang et al. [44] employed cornstalk as an agricultural waste, generating a constant hydrogen yield of 6 mL/h via FeCl3-mediated electrolysis in a 100 mL h-type proton exchange electrolysis cell at 80 °C with an applied potential of, ca., 0.8 V. Their work confirmed that FeCl3 enhanced the degradation of cornstalk through several redox pathways. Similarly, Du et al. [24] used FeCl3 in a PEMEC for the decomposition of lignin (a central component of lignocellulose biomass), reporting a production of 25.89 mL of hydrogen at a constant current density of 100 mA/cm2 at 0.9 V after 40 min. Yang et al. [46] demonstrated comparable hydrogen production using an FeCl3-mediated PEMEC with glucose as a substrate (24 mL after 37 min at a constant current density of 100 mA/cm2 at a voltage of 0.62 V).
This paper presents the optimal operating conditions, such as temperature, for hydrogen production using a low-cost catalyst, namely FeCl3, from various biomass components, including glucose, starch, lignin and cellulose. For the first time, the results demonstrate the feasibility of biomass electrolysis at ambient temperature, employing a Lewis acid as a cost-effective catalyst to maximise hydrogen production with minimal energy input. This study is beneficial for identifying the role of each biomass component in H2 production during biomass electrolysis, ultimately assisting in the selection of the most suitable biomass for electrocatalysis applications. Furthermore, this study provides valuable benchmarking data for the research community, contributing to the development of low-carbon-emission hydrogen production from biomass resources.

2. Experiment

2.1. Materials

Phosphoric acid (H3PO4, 85%) and iron III chloride (FeCl3, anhydrous, 98.0%) obtained from Alfa Aesar (Ward Hill, MA, USA) were used for this experimental study. Hydrogen peroxide (H2O2, 30%) and sulphuric acid (H2SO4, 95.0–98.0%) were obtained from Alfa Aesar and used to clean the Nafion 117 membrane (183 µm thickness, Dupont (Wilmington, DE, USA). Several biomass components, i.e., glucose (C6H12O6, 99%), starch ((C6H10O5)n, from potato) and microcrystalline cellulose ((C6H10O5)n, bulk density: 0.25–0.36 g/cc), were obtained from Alfa Aesar, and lignin (alkali) was obtained from Sigma Aldrich (St. Louis, MO, USA). All the commercial chemicals were utilised without any further purification.

2.2. Selection of Feedstocks

The feedstocks chosen were lignin, starch, glucose and cellulose, which are promising biomass components in biomass feedstocks. These components were selected based on the composition of various biomass feedstocks and the percentage of H2 content which ranges 6 wt.% to 7 wt.% approximately, as shown in Table 1. Multiple research studies have reported different percentages of glucose, starch, lignin and cellulose in biomass; for example, bread residue, an example of food waste, contains 52 wt.% of starch [47]; sugarcane bagasse contains 19–24 wt.% cellulose and 23–34 wt.% lignin [9]; and willow contains 49 wt.% cellulose and 20 wt.% lignin [48]. Also, a significant amount of poultry waste is produced across Northern Ireland, UK, that contains nearly 17.31 wt.% cellulose and 15.74 wt.% of lignin [49]; this study will serve as a baseline to investigate the roles of each biomass component on H2 production in biomasses through the electrolysis process. The ultimate analysis of these biomass components is shown in Table 1 [50]. The dry properties of these feedstocks are similar. The hydrogen content is around 6.5 wt.% and the carbon and oxygen contents range from 40 wt.% to 65 wt.% respectively.

2.3. Chemical Pre-Treatment of Biomass Components

Acidic pre-treatment is a well-known approach aiding in the hydrolysis and solubilisation of biomass feedstocks and is commonly employed before electrolysis. In this work, pre-treatment involved the mixing of glucose, starch, lignin or cellulose (10 g/L) in a round-bottom flask with 1 mol L−1 FeCl3 solution (total volume: 100 mL), prior to heating under reflux at 100 °C for 6 h, as illustrated in Figure 1. As explained above, during the pre-treatment phase, biomass components and Fe+3 (from FeCl3) undergo an oxidation–reduction reaction and the biomass components are converted into chemicals upon their oxidation, and Fe+3 is reduced to Fe+2 under heat. During this phase, the CO2 produced was measured.

2.4. Hydrogen Generation through Biomass Components via Electrolysis

A 100 mL h-type PEMEC was used with a graphite anode (6 mm diameter), proton exchange Nafion 117 membrane (PEM) and platinum mesh cathode electrode (1 cm2), as schematically shown in Figure 2. Before assembly, the Nafion 117 PEM was boiled in a mixed solution of 3 wt.% hydrogen peroxide (H2O2) and 1 mol L−1 of sulphuric acid (H2SO4) for 1 h at 100 °C, washed with distilled water and soaked for 20 min [17]. According to experimental requirements, following pre-treatment, the FeCl3-biomass solution (volume: 100 mL) was fed to the anode chamber. The cathode chamber was fed with the same volume of H3PO4 (1 mol L−1). The PEMEC was operated by application of a fixed potential of 1.20 V via a potentiometer (PalmSens4 (Houten, The Netherlands)). Cell heating was provided via a thermal oil bath. The hydrogen generated was collected from the cathode chamber through water displacement, as shown in Figure 2. Since the proton exchange membrane was employed, the only gas produced at the cathode was hydrogen [51]. Electrochemical analysis was conducted in situ within the filled H-PEMEC by application of a potential ranging from 0 V to 1.20 V at a scan speed of 0.005 V/s. Blank experiments demonstrated that FeCl3 alone could not produce H2 gas without any biomass components within the applied voltage range of 0 V to 1.20 V during the H-PEMEC electrolysis process. Moreover, char material as an alternative to biomass material was also studied at the anode side with FeCl3 solution to determine whether carbon alone can produce H2 during the electrolysis process. As expected, no current density and H2 were observed during the char-Fecl3 electrolysis process, which means that carbon plays no role in the H2 production during the overall biomass electrolysis process. The hydrogen produced derives from the hydrogen in biomass. Each experiment was repeated two times to ensure the reproducibility and repeatability of the results. The error was less than 2% for each experiment performed.

3. Results and Discussion

3.1. Analysis of the Electrochemical Properties of FeCl3-Mediated Biomass Components during Electrolysis

Figure 3a–d show that a significant current was detected when the applied electric potential ranged from 0.7 to 1.20 V. Figure 3a depicts that at the same scanning speed of 0.005 V/s, different currents were recorded with different biomass components at an applied voltage between 0 V and 1.20 V, under the same experimental conditions. The mixed solutions of FeCl3-biomass components, such as glucose, starch, lignin and cellulose (1 mol L−1 FeCl3, 10 g L−1 biomass components, volume of solution 100 mL, pre-treated for 6 h at 100 °C), were fed to the anode, and the cathode was provided with 1 mol L−1 of H3PO4 solution (volume of solution, 100 mL). The baseline experiments were performed at an ambient temperature of 19 °C and a significant current enhancement was recorded at an applied potential range of 0 V–1.20 V. As shown in Figure 3a, the electrolytic polarisation curve (I vs. V) shows that the electrolytic current significantly increased when the electric potential reached over 0.8 V because the redox potential of Fe+3/Fe+2 was 0.77 V vs. a standard hydrogen electrode (SHE) [52]. The maximum current density was 12.97 mA cm−2 at 1.20 V, and hydrogen bubbles were seen on the platinum net electrode at the cathode side. The results indicated that the electro-oxidation reaction occurred at the anode over the graphite electrode due to the Fe+3/Fe+2 redox couple and that the reduced Fe+2 was reoxidised to Fe+3, releasing electrons and protons [44]. During the pre-treatment of FeCl3 and glucose solution, Fe+3 was reduced to Fe+2 and glucose was oxidised [53].
Furthermore, the FeCl3-glucose solution changed from dark brown to dark red, confirming the degradation or oxidation of glucose. The results show that the presence of the Fe+3/Fe+2 redox pair in a pre-heated glucose solution impacts the electrolytic current because the electrolytic polarisation curve shows no notable electrolytic current in the case of a blank experiment under the same experimental conditions. The pre-heated biomass component solution with a redox couple of Fe+3/Fe+2 is, in fact, considerably more straightforward to oxidise at a lower input voltage. Furthermore, the electrolytic polarisation curves of several other biomass components, besides glucose, were also examined at the ambient electrolysis temperature and voltage range (0 V–1.20 V). Figure 3a also shows the electrolytic polarisation curves of other biomass components such as lignin, starch and cellulose as fuels. The maximum current densities obtained with cellulose, lignin and starch were 7.37 mA cm−2, 11.44 mA cm−2 and 12.48 mA cm−2, respectively, 1 to 2 times lower in magnitude than the electrolysis test with glucose as biomass fuel. Moreover, the electrolytic polarisation curves (I vs. V) also depend on the degree of depolymerisation; the higher the degree of depolymerisation, the more electrolytic current will be generated during the electrolysis [17,41,44]. Table 2 shows the current densities of all four biomass components at ambient-temperature electrolysis operation.
All four biomass components were pre-treated for 6 h using FeCl3 solvent before performing electrolysis. According to the literature, no valuable current will be achieved if biomass components are directly utilised in the electrolysis cell without pretreatment [51], and this was confirmed by performing a blank experiment without pretreatment under the same experimental conditions, as shown in Figure 3a. However, it was observed from the results that glucose exhibited a higher current density than other biomass fuels, indicating that glucose was easier to degrade into their intermediate compounds and released electrons faster to reduce Fe+3 to Fe+2 and enhance the concentration of Fe+2 in the glucose-FeCl3 solvent during pre-treatment. As a result, a higher current density was achieved during the electro-oxidation of the pre-treated glucose-FeCl3 solvent at the anode during electrolysis. It was demonstrated that the higher the biomass components degradation or depolymerisation, the greater the current density during electrolysis, as discussed in the literature [54]. In addition, the molecular structure of the biomass components would also be an essential factor. For example, glucose is a monosaccharide containing carbon, oxygen and hydrogen atoms (C6H12O6), and it exists in linear or cyclic form. It has a 6-carbon backbone in linear form with no branching. The hydroxyl group is on the other five carbon atoms except for C-1, which carries the aldehyde group. Glucose is of a crystalline and white powder form highly soluble in water. As a result, glucose is efficiently degraded during pre-treatment with FeCl3 solvent compared to other biomass components.
Moreover, starch, lignin and cellulose have more complex structures than glucose. Starch and cellulose are polysaccharides made up of repeating glucose monomers. In starch, the glucose molecules are joined together by α-(1-4) glycosidic bonds, which can be easily degraded and oxidised with FeCl3 during pre-treatment because of its linear and branched chain structure, while in the case of cellulose, the glucose molecules are joined by β-(1-4) glycosidic bonds to form long linear molecular chains of glucose units. The linear chains of glucose are arranged parallel to each other and are linked together by hydrogen bonds (H-bonds) in the form of bundles called micro-fibrils. These H-bonds that form among the glucose molecules provide tremendous strength and stiffness to the microfibril structure, improving its rigidity and resistance to deformation. As a result, the cellulose showed a much more rigid structure than other biomass components. In this context, the lower depolymerisation/oxidation of cellulose occurred during pre-treatment with FeCl3 because of the complex and compact structure of cellulose, which led to the difficulty of degrading completely, which can also be confirmed by the electrolytic polymerisation curve (I vs. V), i.e., lower current density compared to other biomass components.
Similarly, lignin also has a complex structure, and it is a hetero-polymer of the phenyl-propane units derived from hydroxyl- and methoxy-substituted phenylpropane units. The structure of lignin is also diverse and complex, containing both contents of aliphatic and aromatic moieties. It is hydrophobic, amorphous, insoluble in most solvents and challenging to degrade to monomeric units. However, lignin can be depolymerised into various alcohols and sugar components with a strongly acidic solvent as reported in the literature [24,52,55]. It can be compared with the polarisation curve results (I vs. V) depicted in Figure 3a–d. Therefore, it can be observed from the polarisation curves that each component of biomass has a different onset potential (the point at which there is a sudden increase in electrolysis current). For example, glucose and starch have lower onset potentials due to their better degradation and oxidation in FeCl3 solution in comparison to lignin and cellulose, which are not easy to degrade, due to their structural composition (lignin: aromatic rings in structure; cellulose: complex and rigid crystalline structure).

3.2. Effect of Electrolysis Operating Temperature on the Electrochemical Conductivity during FeCl3-Mediated Biomass Electrolysis

To understand the influence of temperature on the FeCl3-mediated electrolysis process, experiments were conducted at various electrolysis operating temperatures: 30 °C, 50 °C and 80 °C. As shown in the electrolytic polarisation curves in Figure 3b–d, it is evident that the current densities of glucose, starch, lignin and cellulose increase with rising temperature. The highest current densities were attained at 80 °C, followed by 50 °C and 30 °C, respectively, within the same applied potential range of 0 V to 1.20 V. It is important to note that achieving a high current density at ambient temperature requires a higher potential compared to electrolysis at higher temperatures, specifically 30 °C, 50 °C and 80 °C. The lowest potential required for achieving higher current densities is observed at 80 °C. Table 3 presents the maximum current densities registered for the four different biomass components at the different electrolysis operating temperatures such as 30 °C, 50 °C and 80 °C. However, at all the studied temperature ranges, after 0.8 V, the electric current density increased significantly, with maximum current densities at 1.20 V, which is below the electric potential of water electrolysis, i.e., 1.23 V vs. a standard electrode potential of water decomposition [44].
Table 3 shows that the value of the current density increases with increasing temperature during electrolysis. This increase in current densities with rising temperature was attributed to the ionic conductivity of the electrolyte (i.e., greater mobility of Fe+3/Fe+2 ions pair) and fundamental electrochemical reaction kinetics [56]. It has been reported that higher temperatures during electrolysis can increase the degradation of a range of biomass feedstocks, which undergoes unwanted side reactions [57,58]. In addition, the graphite material conductivity increases with increasing temperature, because as the temperature rises, the thermal motion of the graphite lattice improves, which promotes the mobility of electrons present in the graphite atoms and results in higher conductivity during the electrolysis process [59,60].
Further, chronoamperometry tests were conducted for glucose as a model biomass component at different electrolysis operating temperatures to analyse the current profile regarding the time at an applied voltage of 1.20 V, as depicted in Figure 4. At an electrolysis operating temperature of 80 °C, the glucose electrolysis showed a higher current rate during the chronoamperometric operation. Figure 4 shows that a high current was observed at the beginning of the chronoamperometry test but gradually decreased with time. This attenuation in current is due to a lower concentration of biomass since the process is operated in batch mode. When the reaction progresses, the amount of biomass feedstock in the electrolyte decreases, leading to a current reduction [61,62]. Figure 4 also shows that this attenuation in current reduced with lower operating temperature, and the current moved towards the constant current flow state when baseline experimental conditions were employed.
The results from chronoamperometry show that with the increase in temperature, the current density increases. Briefly, temperature has a direct relation with reaction rate. As the temperature rises during electrolysis, the collisions between the reactant molecules will improve, therefore breaching the activation energy barrier, but there is a possibility of other side reactions with the electrolyte and electrode [63]. Contrarily, at low operating temperatures, the chances of secondary reactions are limited, but the rate of reaction is slowed down because fewer reactant molecules will acquire the activation energy required to participate in a chemical reaction. That is why the current density was lower at ambient electrolysis operating temperature. Therefore, control temperature conditions are particularly important for effective chemical reactions during biomass electrolysis. For this purpose, we performed experiments at various temperature conditions.

3.3. Hydrogen Production via PEMEC following FeCl3 Pretreatment

The hydrogen production volume for glucose, starch, lignin and cellulose FeCl3 pre-treated samples at different electrolysis operating temperatures is shown in Figure 5. As seen from Figure 5, glucose shows a higher value of H2 in comparison to other components of biomass after 2 h of electrolysis. The maximum amount of H2 generated was 12.1 mL through glucose at ambient temperature electrolysis. As previously explained, this result derives from the lower complexity of the glucose molecule to be degraded by the Lewis acid. It was evident that at the pretreatment-stage temperature of 100 °C, glucose oxidation was highest, while cellulose, starch and lignin required a higher temperature for complete oxidation because of their structural composition as discussed earlier. This trend of dissolution and degradation is in line with the results reported by various researchers [64,65].
Table 4 shows the comparison of all the biomass components towards the H2 yield and power-to-H2 yield ratio at different electrolysis operating temperatures. The results demonstrated that the maximum amount of H2 was observed when the FeCl3-mediated biomass electrolysis system operated at ambient temperature. For glucose, which is the best-performing feedstock in terms of hydrogen production, the maximum current density obtained over glucose was 15.78 mA cm−2 at 80 °C, and the rate of H2 was 10 mL, while 12.1 mL of H2 yield and 12.97 mA cm−2 of current density were achieved at ambient-temperature conditions. Although the current density increases with increasing temperature, there is a reduction in H2 generation. According to Li et al. [63], the possible reason for the declining trend of H2 generation is the participation of electrons and ions in unwanted side reactions in the electrodes and/or electrolytes. Also, Ito et al. [66] investigated the influence of temperature on lignin electrolysis and showed that lignin is relatively stable in acid at high operating temperatures because of the acid pretreatment which, therefore, results in a large polarisation resistance.
Concerning the sustainability of the process, the ratio of energy input to the volume of H2 produced during electrolysis (i.e., power to H2 yield ratio) was also calculated (i.e., Table 4). For all biomass components, a significant reduction compared to PEM water electrolysis (55–58 kWh/kg) was attained [67], which offers significant potential for further work. Hydrogen production through biomass electrolysis technology looks more effective with a limited amount of electricity consumption than water electrolysis, thanks to the weaker bond of the H2 contained in biomass, as already discussed in the literature [68].
With the idea of providing benchmarking data of the biomass electrolysis process, the energy for pre-treatment was not considered in the calculation. Such energy depends on the typology of pre-treatment performed (e.g., heating, microwaves), and it may not be required for some types of biomasses [17].
During electrolysis, the oxidised biomass fuels release H+ protons, which transfer through the PEM and reduce at the cathode of the H-PEMEC to generate H2. Overall, the H-PEMEC electrolysis method using biomass-FeCl3 solvent effectively decomposed biomass and produced H2 at ambient-temperature conditions. The results showed that biomass electrolysis can be operated at ambient temperature. The maximum hydrogen rate was 12.1 mL after 2 h of electrolysis at an applied voltage of 1.20 V at ambient-temperature electrolysis operation. Compared to the results obtained in the literature, cornstalk was tested with FeCl3 and the electrolysis was performed at 80 °C, and the maximum amount of H2 was 6 mL after 1 h of electrolysis at a current density of 15 mA cm−2 [44]. In another study, lignin electrolysis was carried out at 80 °C after pre-treatment with FeCl3, and the obtained H2 was, ca., 25.85 mL after 1 h of electrolysis at a constant current density of 0.1 A cm−2 under the continuous operation [24,34]. The results obtained in this research study are comparable with the literature as we conducted all experiments in batch mode, so the results will be improved in the continuous electrolysis operation. Moreover, a summary of literature studies based on the biomass electrolysis hydrogen production is presented in Table 5.
The amount of CO2 was also calculated to analyse the biomass electrolysis process in terms of the conversion and utilisation of biomass. In the FeCl3-biomass system, FeCl3 works as a charge carrier during pretreatment, biomass components are oxidised by Fe+3and Fe+3 is reduced to Fe+2 and produces protons (H+) and CO2. The maximum volume of CO2 was observed with glucose at, ca., 51 mL, while starch, lignin and cellulose produced CO2 at, ca., 36 mL, 34 mL and 13.5 mL, respectively, after 6 h of pretreatment at 100 °C with FeCl3, as shown in Table 6. The protons released from biomass during pretreatment was further utilised in the electrolysis stage to produce H2. The higher volume of CO2 production from glucose further evidences the high degree of biomass degradation with FeCl3 because of its straight and cyclic chain structure. The weight of biomass-FeCl3 solution was calculated using the mass balance equation to estimate the carbon utilisation during the overall electrolysis process. For example, out of 40.01 wt.% of carbon in glucose, only 13 wt.% was utilised for CO2 production and the remaining energy content could reside in the FeCl3 solution in residue form or could be converted into liquid hydrocarbons and alcohols [24], which means that there is still a large portion of energy content in the FeCl3 solution, which can be recovered by recycling or incorporating a continuous processing approach and varying specific process parameters such as optimisation of the molarity of FeCl3.

4. Conclusions

In conclusion, the four biomass components, i.e., glucose, starch, lignin and cellulose, were investigated in the h-type proton exchange electrolysis cell (H-PEMEC) for hydrogen generation using FeCl3. Fe+3 from FeCl3 oxidised the biomass components during pretreatment, while the reduced Fe+2 was regenerated to Fe+3 during electrolysis at the anode side and H2 was produced at the platinum mesh cathode (1 cm2).
The key findings can be summarised below:
  • Replacing the noble metal catalyst at the anode with the low-cost Lewis acid as a liquid catalyst in the H-PEMEC for the catalytic reaction demonstrates the low-cost potential of the biomass electrolysis process.
  • The use of the non-noble metal Fe+3/Fe+2 redox couple or ion pair for the conversion of biomass components towards sustainable H2 through the H-PEMEC shows the feasibility of the decomposition of biomass and hydrogen production at low-voltage and low-temperature conditions, suggesting an advantage of H2 production from biomass electrolysis compared to high-temperature processes like gasification and pyrolysis.
  • The blank and char experiments confirm that there is no hydrogen produced when the biomass feedstock itself contains little to no hydrogen content. Therefore, when choosing a feedstock for biomass electrolysis, one of important factors should be the hydrogen content of the feedstock.
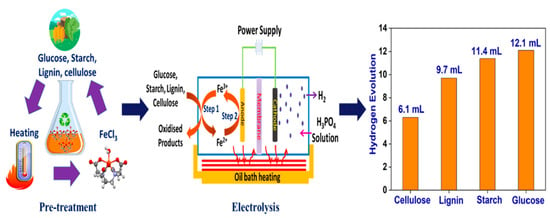
  • The maximum H2 yields with the biomass electrolysis process vary from 6.3 to 12.1 mL when using cellulose, lignin, starch and glucose, although they all have similar H2 contents. This indicates that the feedstock structure is another factor influencing H2 generating rates.
  • The power-to-H2 yield ratio in biomass electrolysis at ambient conditions for selected biomass components ranges from 30.99 to 33.83 kWh/kg of H2. In comparison with conventional water electrolysis (55–58 kWh/kg), the biomass electrolysis process is more energy-efficient for hydrogen production.
  • CO2 emissions are also investigated during the FeCl3-mediated biomass electrolysis process for estimating the conversion of biomass feedstocks during the process. The results indicate that CO2 emissions during the process are low because the maximum carbon consumption rate is around 13%. Therefore, the carbon content in the residues is still more than 87% that can potentially be used for energy purposes.
It is expected that a linear behaviour will be observed when a mixture of biomass components is tested. Future steps of the research on biomass electrolysis will focus on using biowaste and developing a continuous process that integrates pre-treatment and biomass electrolysis within a single PEMEC, thereby streamlining the overall process and improving its efficiency.
Our research on hydrogen production through biomass electrolysis offers significant implications for renewable energy. By utilising biomass, a sustainable and widely available resource, this method presents an eco-friendly alternative to traditional fossil fuel-based hydrogen production, thereby reducing greenhouse gas emissions. Importantly, the process leverages existing biowaste, contributing to waste reduction and promoting a circular economy. Its integration with other renewable energy systems, such as solar or wind power, could enhance overall energy efficiency and sustainability. Economically, this method holds the potential for cost-effective hydrogen production, which is crucial for the wider adoption of hydrogen as a clean energy carrier. Furthermore, our research opens up new avenues for policy development and market expansion in renewable energy sectors, emphasising the role of hydrogen in future energy systems. The technological advancements demonstrated in our study, particularly in terms of operational efficiency and the use of cost-effective catalysts, mark a significant step forward in biomass-to-hydrogen conversion technologies. This work not only contributes to the advancement of renewable energy technologies but also aligns with global efforts towards achieving carbon neutrality and sustainable energy solutions.

Author Contributions

M.U.: Writing—Original Draft Preparation, Investigation. C.B.: Supervision, Writing—Review and Editing. M.J.: Writing—Review and Editing. N.J.H.: Supervision, Conceptualisation. P.D.: Writing—Review and Editing. K.Z.: Conceptualisation. Y.H.: Supervision, Writing—Review and Editing. All authors have read and agreed to the published version of the manuscript.

Funding

This study was funded by the Department for the Economy (DfE). This research work was also carried out as part of the Royal Society and National Natural Science Foundation of China (IEC\NSFC\201070).

Data Availability Statement

Data are contained within the article.

Acknowledgments

Muhammad Umer is a Doctoral Scholar at the Faculty of Computing, Engineering and the Built Environment at Ulster University, Belfast (Northern Ireland, United Kingdom).

Conflicts of Interest

The authors declare no conflict of interest.

References

  1. Islam, A.K.; Dunlop, P.S.; Bhattacharya, G.; Mokim, M.; Hewitt, N.J.; Huang, Y.; Gogulancea, V.; Zhang, K.; Brandoni, C. Comparative performance of sustainable anode materials in microbial fuel cells (MFCs) for electricity generation from wastewater. Results Eng. 2023, 20, 101385. [Google Scholar] [CrossRef]
  2. Hossen, M.A.; Solayman, H.; Leong, K.H.; Sim, L.C.; Nurashikin, Y.; Abd Aziz, A.; Wu, L.; Monir, M.U. Recent progress in TiO2-Based photocatalysts for conversion of CO2 to hydrocarbon fuels: A systematic review. Results Eng. 2022, 16, 100795. [Google Scholar] [CrossRef]
  3. World Energy Outlook. Available online: https://www.iea.org/reports/world-energy-outlook-2021 (accessed on 10 October 2023).
  4. Afrouzi, H.N.; Ahmed, J.; Siddique, B.M.; Khairuddin, N.; Hassan, A. A comprehensive review on carbon footprint of regular diet and ways to improving lowered emissions. Results Eng. 2023, 18, 101054. [Google Scholar] [CrossRef]
  5. Wood, G.; Baker, K. The Palgrave Handbook of Managing Fossil Fuels and Energy Transitions; Springer: Berlin/Heidelberg, Germany, 2020. [Google Scholar]
  6. Klemeš, J.J.; Varbanov, P.S.; Ocłoń, P.; Chin, H.H. Towards efficient and clean process integration: Utilisation of renewable resources and energy-saving technologies. Energies 2019, 12, 4092. [Google Scholar] [CrossRef]
  7. Kaydouh, M.-N.; El Hassan, N. Thermodynamic simulation of the co-gasification of biomass and plastic waste for hydrogen-rich syngas production. Results Eng. 2022, 16, 100771. [Google Scholar] [CrossRef]
  8. Acharya, S.; Gupta, D.S.; Kishore, N. In-situ catalytic hydro-liquefaction of Delonix regia lignocellulosic biomass waste in hydrogen-donor solvent. Results Eng. 2022, 16, 100734. [Google Scholar] [CrossRef]
  9. Jaffar, M.M.; Nahil, M.A.; Williams, P.T. Pyrolysis-catalytic hydrogenation of cellulose-hemicellulose-lignin and biomass agricultural wastes for synthetic natural gas production. J. Anal. Appl. Pyrolysis 2020, 145, 104753. [Google Scholar] [CrossRef]
  10. Nunes, L.J. Biomass gasification as an industrial process with effective proof-of-concept: A comprehensive review on technologies, processes and future developments. Results Eng. 2022, 14, 100408. [Google Scholar] [CrossRef]
  11. Aravindan, M.; Kumar, P. Hydrogen towards sustainable transition: A review of production, economic, environmental impact and scaling factors. Results Eng. 2023, 20, 101456. [Google Scholar]
  12. Parthasarathy, P.; Narayanan, K.S. Hydrogen production from steam gasification of biomass: Influence of process parameters on hydrogen yield–a review. Renew. Energy 2014, 66, 570–579. [Google Scholar] [CrossRef]
  13. Reyes-Bozo, L.; Salazar, J.L.; Valdés-González, H.; Sandoval-Yáñez, C.; Vivanco-Soffia, M.E.; Bilartello, L.; Poblete, V.; Soto, A.; Urrea, M.J. Viability analysis for use of methane obtained from green hydrogen as a reducing agent in copper smelters. Results Eng. 2021, 12, 100286. [Google Scholar] [CrossRef]
  14. Liu, W.; Liu, C.; Gogoi, P.; Deng, Y. Overview of biomass conversion to electricity and hydrogen and recent developments in low-temperature electrochemical approaches. Engineering 2020, 6, 1351–1363. [Google Scholar] [CrossRef]
  15. Kumar, G.; Dharmaraja, J.; Arvindnarayan, S.; Shoban, S.; Bakonyi, P.; Saratale, G.D.; Nemestóthy, N.; Bélafi-Bakó, K.; Yoon, J.J.; Kim, S.H. A comprehensive review on thermochemical, biological, biochemical and hybrid conversion methods of bio-derived lignocellulosic molecules into renewable fuels. Fuel 2019, 251, 352–367. [Google Scholar] [CrossRef]
  16. Aziz, M.; Darmawan, A.; Juangsa, F.B. Hydrogen production from biomasses and wastes: A technological review. Int. J. Hydrogen Energy 2021, 46, 33756–33781. [Google Scholar] [CrossRef]
  17. Li, M.; Wang, T.; Zhao, M.; Wang, Y. Research on hydrogen production and degradation of corn straw by circular electrolysis with polyoxometalate (POM) catalyst. Int. J. Hydrogen Energy 2022, 47, 15357–15369. [Google Scholar] [CrossRef]
  18. Lepage, T.; Kammoun, M.; Schmetz, Q.; Richel, A. Biomass-to-hydrogen: A review of main routes production, processes evaluation and techno-economical assessment. Biomass Bioenergy 2021, 144, 105920. [Google Scholar] [CrossRef]
  19. Zoppi, G.; Pipitone, G.; Pirone, R.; Bensaid, S. Aqueous phase reforming process for the valorization of wastewater streams: Application to different industrial scenarios. Catal. Today 2022, 387, 224–236. [Google Scholar] [CrossRef]
  20. Pipitone, G.; Zoppi, G.; Frattini, A.; Bocchini, S.; Pirone, R.; Bensaid, S. Aqueous phase reforming of sugar-based biorefinery streams: From the simplicity of model compounds to the complexity of real feeds. Catal. Today 2020, 345, 267–279. [Google Scholar] [CrossRef]
  21. Godina, L.I.; Heeres, H.; Garcia, S.; Bennett, S.; Poulston, S.; Murzin, D.Y. Hydrogen production from sucrose via aqueous-phase reforming. Int. J. Hydrogen Energy 2019, 44, 14605–14623. [Google Scholar] [CrossRef]
  22. Luo, H.; Barrio, J.; Sunny, N.; Li, A.; Steier, L.; Shah, N.; Stephens, I.E.; Titirici, M.M. Progress and perspectives in photo-and electrochemical-oxidation of biomass for sustainable chemicals and hydrogen production. Adv. Energy Mater. 2021, 11, 2101180. [Google Scholar] [CrossRef]
  23. Dolle, C.; Neha, N.; Coutanceau, C. Electrochemical hydrogen production from biomass. Curr. Opin. Electrochem. 2022, 31, 100841. [Google Scholar] [CrossRef]
  24. Du, X.; Liu, W.; Zhang, Z.; Mulyadi, A.; Brittain, A.; Gong, J.; Deng, Y. Low-energy catalytic electrolysis for simultaneous hydrogen evolution and lignin depolymerization. ChemSusChem 2017, 10, 847–854. [Google Scholar] [CrossRef] [PubMed]
  25. Sahu, O. Sustainable and clean treatment of industrial wastewater with microbial fuel cell. Results Eng. 2019, 4, 100053. [Google Scholar] [CrossRef]
  26. Gautam, R.; Ress, N.V.; Wilckens, R.S.; Ghosh, U.K. Hydrogen production in microbial electrolysis cell and reactor digestate valorization for biochar–a noble attempt towards circular economy. Int. J. Hydrogen Energy 2023, 52, 649–668. [Google Scholar] [CrossRef]
  27. Lu, L.; Xing, D.; Xie, T.; Ren, N.; Logan, B.E. Hydrogen production from proteins via electrohydrogenesis in microbial electrolysis cells. Biosens. Bioelectron. 2010, 25, 2690–2695. [Google Scholar] [CrossRef] [PubMed]
  28. Shen, R.; Liu, Z.; He, Y.; Zhang, Y.; Lu, J.; Zhu, Z.; Si, B.; Zhang, C.; Xing, X.-H. Microbial electrolysis cell to treat hydrothermal liquefied wastewater from cornstalk and recover hydrogen: Degradation of organic compounds and characterization of microbial community. Int. J. Hydrogen Energy 2016, 41, 4132–4142. [Google Scholar] [CrossRef]
  29. Kadier, A.; Al-Shorgani, N.K.; Jadhav, D.A.; Sonawane, J.M.; Mathuriya, A.S.; Kalil, M.S.; Hasan, H.A.; Alabbosh, K.F.S. Microbial Electrolysis Cell (MEC) An Innovative Waste to Bioenergy and Value-Added By-product Technology. In Bioelectrosynthesis: Principles and Technologies for Value-Added Products; Wiley-VCH Verlag GmbH & Co. KGaA: Hoboken, NJ, USA, 2020; pp. 95–128. [Google Scholar]
  30. Islam, A.K.; Dunlop, P.S.; Hewitt, N.J.; Lenihan, R.; Brandoni, C. Bio-hydrogen production from wastewater: A comparative study of low energy intensive production processes. Clean Technol. 2021, 3, 156–182. [Google Scholar] [CrossRef]
  31. Kumar, S.S.; Himabindu, V. Hydrogen production by PEM water electrolysis–A review. Mater. Sci. Energy Technol. 2019, 2, 442–454. [Google Scholar]
  32. Xie, Z.; Yu, S.; Ma, X.; Li, K.; Ding, L.; Wang, W.; Cullen, D.A.; Meyer, H.M., III; Yu, H.; Tong, J.; et al. MoS2 nanosheet integrated electrodes with engineered 1T-2H phases and defects for efficient hydrogen production in practical PEM electrolysis. Appl. Catal. B Environ. 2022, 313, 121458. [Google Scholar] [CrossRef]
  33. Ayers, K. High efficiency PEM water electrolysis: Enabled by advanced catalysts, membranes, and processes. Curr. Opin. Chem. Eng. 2021, 33, 100719. [Google Scholar] [CrossRef]
  34. Carmo, M.; Fritz, D.L.; Mergel, J.; Stolten, D. A comprehensive review on PEM water electrolysis. Int. J. Hydrogen Energy 2013, 38, 4901–4934. [Google Scholar] [CrossRef]
  35. Guenot, B.; Cretin, M.; Lamy, C. Electrochemical reforming of dimethoxymethane in a Proton Exchange Membrane Electrolysis Cell: A way to generate clean hydrogen for low temperature fuel cells. Int. J. Hydrogen Energy 2017, 42, 28128–28139. [Google Scholar] [CrossRef]
  36. Coutanceau, C.; Baranton, S. Electrochemical conversion of alcohols for hydrogen production: A short overview. WIREs Energy Environ. 2016, 5, 388–400. [Google Scholar] [CrossRef]
  37. Guenot, B.; Cretin, M.; Lamy, C. Clean hydrogen generation from the electrocatalytic oxidation of methanol inside a proton exchange membrane electrolysis cell (PEMEC): Effect of methanol concentration and working temperature. J. Appl. Electrochem. 2015, 45, 973–981. [Google Scholar] [CrossRef]
  38. Lamy, C.; Devadas, A.; Simoes, M.; Coutanceau, C. Clean hydrogen generation through the electrocatalytic oxidation of formic acid in a Proton Exchange Membrane Electrolysis Cell (PEMEC). Electrochim. Acta 2012, 60, 112–120. [Google Scholar] [CrossRef]
  39. Marshall, A.; Haverkamp, R. Production of hydrogen by the electrochemical reforming of glycerol–water solutions in a PEM electrolysis cell. Int. J. Hydrogen Energy 2008, 33, 4649–4654. [Google Scholar] [CrossRef]
  40. Serrano-Jiménez, J.; de la Osa, A.; Rodríguez-Gómez, A.; Sánchez, P.; Romero, A.; de Lucas-Consuegra, A. Electro-reforming of bioethanol produced by sugar fermentation on a Pt-Ni anodic catalyst supported on graphene nanoplatelets. J. Environ. Chem. Eng. 2023, 11, 109703. [Google Scholar] [CrossRef]
  41. Liu, W.; Cui, Y.; Du, X.; Zhang, Z.; Chao, Z.; Deng, Y. High efficiency hydrogen evolution from native biomass electrolysis. Energy Environ. Sci. 2016, 9, 467–472. [Google Scholar] [CrossRef]
  42. Liu, W.; Mu, W.; Liu, M.; Zhang, X.; Cai, H.; Deng, Y. Solar-induced direct biomass-to-electricity hybrid fuel cell using polyoxometalates as photocatalyst and charge carrier. Nat. Commun. 2014, 5, 3208. [Google Scholar] [CrossRef]
  43. Rosa, L.; Mazzotti, M. Potential for hydrogen production from sustainable biomass with carbon capture and storage. Renew. Sustain. Energy Rev. 2022, 157, 112123. [Google Scholar] [CrossRef]
  44. Wang, Y.; Zhao, M.; Wang, T.; Li, M.; Lu, X.; Li, B. Study on hydrogen generation and cornstalk degradation by redox coupling of non-noble metal Fe3+/Fe2+. Int. J. Hydrogen Energy 2021, 46, 27409–27421. [Google Scholar] [CrossRef]
  45. Li, J.; Zhou, W.; Huang, Y.; Gao, J. Lignin-assisted water electrolysis for energy-saving hydrogen production with Ti/PbO2 as the anode. Front. Energy Res. 2021, 9, 762346. [Google Scholar] [CrossRef]
  46. Yang, L.; Liu, W.; Zhang, Z.; Du, X.; Gong, J.; Dong, L.; Deng, Y. Hydrogen evolution from native biomass with Fe3+/Fe2+ redox couple catalyzed electrolysis. Electrochim. Acta 2017, 246, 1163–1173. [Google Scholar] [CrossRef]
  47. Svensson, S.E.; Bucuricova, L.; Ferreira, J.A.; Souza Filho, P.F.; Taherzadeh, M.J.; Zamani, A. Valorization of bread waste to a fiber- and protein-rich fungal biomass. Fermentation 2021, 7, 91. [Google Scholar] [CrossRef]
  48. Bridgeman, T.; Jones, J.; Shield, I.; Williams, P.T. Torrefaction of reed canary grass, wheat straw and willow to enhance solid fuel qualities and combustion properties. Fuel 2008, 87, 844–856. [Google Scholar] [CrossRef]
  49. Ghanim, B.M.; Kwapinski, W.; Leahy, J.J. Hydrothermal carbonisation of poultry litter: Effects of initial pH on yields and chemical properties of hydrochars. Bioresour. Technol. 2017, 238, 78–85. [Google Scholar] [CrossRef]
  50. Phyllis2. Available online: https://phyllis.nl/ (accessed on 10 October 2023).
  51. Li, M.; Wang, T.; Chen, X.; Ma, X. Conversion study from lignocellulosic biomass and electric energy to H2 and chemicals. Int. J. Hydrogen Energy 2023, 48, 21004–21017. [Google Scholar] [CrossRef]
  52. Mao, L.; Zhang, L.; Gao, N.; Li, A. FeCl3 and acetic acid co-catalyzed hydrolysis of corncob for improving furfural production and lignin removal from residue. Bioresour. Technol. 2012, 123, 324–331. [Google Scholar] [CrossRef]
  53. Xu, W.; Zhou, B.; Wang, Q.; Xu, G.; Li, N.; Liu, W.; Zhang, Z.C. Energy-efficient Electrochemical Hydrogen Production Combined with Biomass Oxidation Using Polyoxometalate and Metal Salts. ChemCatChem 2023, 15, e202300522. [Google Scholar] [CrossRef]
  54. Zhang, Z.; Liu, C.; Liu, W.; Du, X.; Cui, Y.; Gong, J.; Guo, H.; Deng, Y. Direct conversion of sewage sludge to electricity using polyoxomatelate catalyzed flow fuel cell. Energy 2017, 141, 1019–1026. [Google Scholar] [CrossRef]
  55. Gaspar, A.R.; Gamelas, J.A.; Evtuguin, D.V.; Neto, C.P. Alternatives for lignocellulosic pulp delignification using polyoxometalates and oxygen: A review. Green Chem. 2007, 9, 717–730. [Google Scholar] [CrossRef]
  56. Zhang, W.; Chen, X.; Wang, Y.; Wu, L.; Hu, Y. Experimental and modeling of conductivity for electrolyte solution systems. ACS Omega 2020, 5, 22465–22474. [Google Scholar] [CrossRef] [PubMed]
  57. Chio, C.; Sain, M.; Qin, W. Lignin utilization: A review of lignin depolymerization from various aspects. Renew. Sustain. Energy Rev. 2019, 107, 232–249. [Google Scholar] [CrossRef]
  58. Kozliak, E.I.; Kubátová, A.; Artemyeva, A.A.; Nagel, E.; Zhang, C.; Rajappagowda, R.B.; Smirnova, A.L. Thermal liquefaction of lignin to aromatics: Efficiency, selectivity, and product analysis. ACS Sustain. Chem. Eng. 2016, 4, 5106–5122. [Google Scholar] [CrossRef]
  59. Serrano-Jiménez, J.; de la Osa, A.; Rodríguez-Gómez, A.; Sánchez, P.; Romero, A.; de Lucas-Consuegra, A. Graphene-like materials as an alternative to carbon Vulcan support for the electrochemical reforming of ethanol: Towards a complete optimization of the anodic catalyst. J. Electroanal. Chem. 2022, 921, 116680. [Google Scholar] [CrossRef]
  60. Caravaca, A.; de Lucas-Consuegra, A.; Calcerrada, A.; Lobato, J.; Valverde, J.; Dorado, F. From biomass to pure hydrogen: Electrochemical reforming of bio-ethanol in a PEM electrolyser. Appl. Catal. B Environ. 2013, 134, 302–309. [Google Scholar] [CrossRef]
  61. Khalid, M.; De, B.S.; Singh, A.; Shahgaldi, S. Lignin Electrolysis at Room Temperature on Nickel Foam for Hydrogen Generation: Performance Evaluation and Effect of Flow Rate. Catalysts 2022, 12, 1646. [Google Scholar] [CrossRef]
  62. Caravaca, A.; Garcia-Lorefice, W.E.; Gil, S.; de Lucas-Consuegra, A.; Vernoux, P. Towards a sustainable technology for H2 production: Direct lignin electrolysis in a continuous-flow Polymer Electrolyte Membrane reactor. Electrochem. Commun. 2019, 100, 43–47. [Google Scholar] [CrossRef]
  63. Li, W.; Tian, H.; Ma, L.; Wang, Y.; Liu, X.; Gao, X. Low-temperature water electrolysis: Fundamentals, progress, and new strategies. Mater. Adv. 2022, 3, 5598–5644. [Google Scholar] [CrossRef]
  64. Jiang, Z.; Ding, W.; Xu, S.; Remón, J.; Shi, B.; Hu, C.; Clark, J.H. A ‘Trojan horse strategy’for the development of a renewable leather tanning agent produced via an AlCl 3-catalyzed cellulose depolymerization. Green Chem. 2020, 22, 316–321. [Google Scholar] [CrossRef]
  65. Deng, W.; Feng, Y.; Fu, J.; Guo, H.; Guo, Y.; Han, B.; Jiang, Z.; Kong, L.; Li, C.; Liu, H.; et al. Catalytic conversion of lignocellulosic biomass into chemicals and fuels. Green Energy Environ. 2023, 8, 10–114. [Google Scholar] [CrossRef]
  66. Ito, M.; Hori, T.; Teranishi, S.; Nagao, M.; Hibino, T. Intermediate-temperature electrolysis of energy grass Miscanthus sinensis for sustainable hydrogen production. Sci. Rep. 2018, 8, 16186. [Google Scholar] [CrossRef] [PubMed]
  67. Kakoulaki, G.; Kougias, I.; Taylor, N.; Dolci, F.; Moya, J.; Jäger-Waldau, A. Green hydrogen in Europe–A regional assessment: Substituting existing production with electrolysis powered by renewables. Energy Convers. Manag. 2021, 228, 113649. [Google Scholar] [CrossRef]
  68. Tang, W.; Zhang, L.; Qiu, T.; Tan, H.; Wang, Y.; Liu, W.; Li, Y. Efficient Conversion of Biomass to Formic Acid Coupled with Low Energy Consumption Hydrogen Production from Water Electrolysis. Angew. Chem. 2023, 135, e202305843. [Google Scholar] [CrossRef]
Figure 1. Illustration of the pre-treatment process of FeCl3-mediated-biomass component system.
Processes 12 00112 g001
Figure 2. Diagram of H-type proton exchange membrane electrolysis (H-PEMEC) for hydrogen generation.
Processes 12 00112 g002
Figure 3. Polarisation curves (I vs. V) of glucose, starch, lignin and cellulose at different electrolysis operating temperatures: (a) ambient (19 °C), (b) 30 °C, (c) 50 °C and (d) 80 °C.
Processes 12 00112 g003
Figure 4. Chronoamperometry curves of glucose at different electrolysis operating temperatures: ambient (19 °C), 30 °C and 80 °C at a constant applied potential of 1.20 V.
Processes 12 00112 g004
Figure 5. Hydrogen production yield at different electrolysis operating temperatures.
Processes 12 00112 g005
Table 1. Ultimate analysis of various biomass components.
MaterialsUltimate Analysis (daf Basis)
Carbon
(wt.%)
Hydrogen
(wt.%)
Oxygen
(wt.%)
Nitrogen
(wt.%)
Ref.
Glucose40.016.7153.28-
Starch44.266.8248.93-[50]
Lignin64.505.8027.700.20
Cellulose44.026.4049.520.03
Table 2. Current densities of biomass components at baseline ambient-temperature electrolysis conditions.
Biomass ComponentsApplied Voltage (V)Electrolysis Operating TemperatureCurrent Density
(mA cm−2)
Glucose1.2Ambient (19 °C)12.97
Starch12.48
Lignin11.44
Cellulose7.37
Table 3. Summary of maximum current densities of different biomass components at electrolysis operating temperatures of 30 °C, 50 °C and 80 °C.
Biomass ComponentsApplied Voltage (V)Electrolysis Operating Temperature (°C)Current Density
(mA cm−2)
Glucose1.23014.93
5015.71
8015.78
Starch1.23012.77
5013.09
8014.36
Lignin1.23012.48
5012.84
8013.82
Cellulose1.23010.15
5010.28
8012.78
Table 4. Energy efficiency and H2 yield following 2 h of electrolysis at a range of operating temperatures.
FeedstocksElectrolysis Operating Temperature (°C)H2 Yield
(mL)
H2 Yield
(mL/gram of Biomass) *
Ratio of Power to H2 Yield
kWhkWh/kg
GlucoseAmbient (19 °C)12.112.13.1128 × 10−530.99
3011.811.83.5832 × 10−537.96
5011.211.23.7704 × 10−544.89
8010103.7872 × 10−554.89
StarchAmbient (19 °C)11.411.42.9952 × 10−531.66
3010.210.23.0648 × 10−537.56
509.39.33.1416 × 10−545.04
807.67.63.4464 × 10−565.72
LigninAmbient (19 °C)9.79.72.7456 × 10−531.70
309.29.22.9952 × 10−540.70
508.68.63.0816 × 10−547.78
80663.3168 × 10−580.12
CelluloseAmbient (19 °C)6.36.31.7688 × 10−533.83
305.95.92.436 × 10−551.61
503.93.92.4672 × 10−584.35
802.32.33.0672 × 10−5151.54
* Since the duration of biomass electrolysis was set to 2 h, the rate of H2 production per gram of sample would be a minimum value. In addition, the spent biomass sample (i.e., it contains high carbon content) in the reactor was not recovered.
Table 5. Literature comparison of biomass electrolysis for hydrogen production derived through h-type PEMEC.
ElectrolyserFeedstockCatalystCurrent Density
(mAcm−2)
Voltage
(V)
Temp
(°C)
H2 Yield
(mL/h)
Ref.
H-type PEMECCorn strawPoly-oxometalate
(PMo12)
200–1.20807.86[17]
H-type PEMECCorn-stalkFeCl3100–1.20804.10[44]
H-type PEMECLigninPoly-oxometalate
(PMo12)
200–1.20807.92[51]
H-type PEMECGlucose, Starch, lignin and CelluloseFeCl312.97, 11.4, 9.7, 6.300–1.20Ambient (19 °C)6.05, 5.7, 4.85, 3.15This work
Table 6. CO2 formation rate of different biomass components during pretreatment.
Biomass FuelPretreatmentCO2 Generation
(mL)
Carbon Utilised
(wt.%)
Initial Weight of Biomass Solution
(g)
Final Weight of Biomass Solution (g)
Temperature
(°C)
Time
(h)
Glucose1006511357.5557.45
Starch368.257.5157.44
Lignin345.357.5657.50
Cellulose13.53.357.4957.46
Disclaimer/Publisher’s Note: The statements, opinions and data contained in all publications are solely those of the individual author(s) and contributor(s) and not of MDPI and/or the editor(s). MDPI and/or the editor(s) disclaim responsibility for any injury to people or property resulting from any ideas, methods, instructions or products referred to in the content.

