Article

Phosphorus Recovery from Wastewater Aiming Fertilizer Production: Struvite Precipitation Optimization Using a Sequential Plackett–Burman and Doehlert Design

by
Paulo Victor Campos
1,*,
Rômulo Simões Angélica
1,
Lênio José Guerreiro de Faria
2 and
Simone Patrícia Aranha Da Paz
1,2
1
Programa de Pós-Graduação em Geologia e Geoquímica, Laboratório de Caracterização Mineral, Universidade Federal do Pará, Belém 66075-110, PA, Brazil
2
Faculdade de Engenharia Química, Universidade Federal do Pará, Belém 66075-110, PA, Brazil
*
Author to whom correspondence should be addressed.
Processes 2023, 11(9), 2664; https://doi.org/10.3390/pr11092664
Submission received: 20 June 2023 / Revised: 15 July 2023 / Accepted: 18 July 2023 / Published: 6 September 2023
(This article belongs to the Special Issue Green Separation and Purification Processes)

Abstract

:
The precipitation of struvite from wastewater is a potential alternative for the recovery of nutrients, especially phosphorus, which is an essential macronutrient for agriculture but can be harmful to the environment when improperly disposed of in water bodies. In addition, struvite has elements of great added value for agricultural activity (P, N, and Mg) and is, therefore, considered a sustainable alternative fertilizer. In its formation process, several intervening physicochemical factors may be responsible for the production yield levels. Optimization processes can help to define and direct the factors that truly matter for precipitation. In this context, a sequential design of experiments (DOE) methodology was applied to select and optimize the main struvite precipitation factors in wastewater. Initially, a screening was performed with eight factors with the aid of Plackett–Burman design, and the factors with a real influence on the process were identified. Then, a Doehlert design was used for optimization by applying the response surface methodology and the desirability function. The results were used to identify the optimal points of the pH (10.2), N/P ratio (≥4), and initial phosphorus concentration (183.5 mg/L); these values had a greater effect on phosphorus recovery and the production of struvite, which was confirmed through thermochemical analysis of the decomposition of its structure by differential scanning calorimeter—glass transition temperature (DSC-TG) and phase identification by X-ray diffraction (XRD). The determination of the best synthesis conditions is an enormous contribution to the control of the process because these conditions lead to better yields and higher levels of phosphorus recovery.

1. Introduction

Phosphorus is a nutrient of great relevance and one of the most essential elements, if not the most essential, for all living organisms on planet Earth [1,2,3,4]. Due to its high reactivity, phosphorus is available on Earth’s crust in the ionic form of orthophosphate ( PO 4 3 ) , which is characteristically distributed as phosphate minerals. Its biological importance is based on the constitution of genetic material in the form of monoesters or diesters (C-O-P bonds) that exist in the molecules of adenosine triphosphate (ATP), DNA, and RNA as well as its role in the production of chemical energy that ensures the development of living beings, especially plants. Plants fundamentally depend on phosphorus for the vital functions of growth, flowering, and fruit production, and they transform inorganic phosphorus from minerals present in the soil into organic phosphorus [2,4].
During the phosphorus cycle, phosphate ions are leached from phosphate rocks, released into the soil, and then absorbed through the roots of plants. This activity constitutes one of the final stages of the geochemical phosphorus subcycle. In the biological subcycle, plants synthesize phosphate by transforming it into an energetic and structural component [5]. Phosphorus, now in the form of a molecular constituent of living beings, follows the trophic chain as it is consumed and transferred among organisms, which in turn release phosphorus through excrement and/or death. Thus, phosphorus returns to the soil by the action of decomposers and can participate in several reactions that make it available again to plants or that immobilize it in microbial biomass [4,5,6].
In the biological subcycle, phosphorus naturally follows its course; some of it is kept in the soil solution and some of it is transported to water bodies. However, the excessive human consumption of phosphate resources and the large deposition of urban and industrial wastes negatively drive the accumulation of this element in water bodies [6,7,8,9]. Phosphorus bioaccumulation poses a certain threat to the ecological environment and can cause several environmental problems, such as the eutrophication of rivers and lakes [6,7,8,10,11,12].
Sustainable actions to address the phosphorus cycle have been debated for decades because in addition to the numerous losses and immobilizations during its cycle, its main source, which has a geological origin, is a finite and nonrenewable resource [13,14]. Temporal estimates show that existing phosphate reserves will be depleted in the next 50–100 years [13,15]; more optimistic forecasts estimate that these sources will last for approximately 100–400 years, given technological advances and the possible exploitation of new stocks [16,17]. This impact is due to the increasingly exponential growth of the world population and increasing demands for food. Food production is in turn conditioned by the global agricultural market, which depends on fertile soils, pesticides, and favorable edaphoclimatic conditions [13,14,18,19]. In this global context, strategies for using phosphate resources are required, and the search for alternative and sustainable sources is necessary. Strategies for the recovery and/or recycling of phosphorus from wastewater (domestic and industrial sewage) have been shown to be viable and promising, with the reclaimed phosphorus being used for fertilizer.
Different wastewater technologies for phosphorus recovery have been developed and researched [20,21,22]. Many of these technologies are based on the physicochemical process of precipitation [23,24] and produce calcium and magnesium inorganic phosphates [21]. Among the precipitation products, magnesium ammonium phosphate hexahydrate, or struvite (MgNH4PO4·6H2O), is notable, which is a mineral that has a large added value. Its orthorhombic crystal structure consists of equimolar chemical proportions of the ions P O 4 3 ,   N H 4 +   a n d   M g 2 + [25,26,27], all of which are plant nutrients. Struvite is characterized as a qualitatively slow-release fertilizer with low solubility and a low metal content [28]. The physicochemical properties that permeate the crystallization of struvite are conditioned mainly by the pH, the concentration and proportion of ionic components, and the presence of impurities [26,29]. Several other compounds tend to coprecipitate with struvite, and the formation of calcium phosphates (brushite, amorphous calcium phosphate) and other magnesium phosphates (bobierrite and brucite), in addition to similar struvites, which are generated through different isomorphic substitutions in the structure of the solid solution, is possible [25,30,31].
Many methods to develop and/or optimize the struvite precipitation process have been proposed. Certain statistical tools and methodologies are key to this goal. Kumar and Pal (2013) [32] studied the optimal concentrations of ammonium, phosphate, and magnesium ions during the precipitation and recovery of struvite from raw wastewater from a coke plant and developed a hybrid process by proposing a regression model considering the removal of NH4-N as a response. Optimal parameters of struvite synthesis were also stipulated by Capdevielle et al. (2013) [33], who investigated the effects of the mixing rate, temperature and Ca, Mg, and N concentrations on the precipitation of struvite from synthetic wastewater. Daneshgar et al. (2019) [34] investigated the effects of the pH, the presence of calcium, and the concentration of nitrogen on the efficiency of phosphorus recovery through struvite precipitation by applying chemical modeling together with the response surface methodology (RSM). The RSM was also used by Thant Zin and Kim (2019) [35], who promoted the optimization of struvite production from food processing wastewater and sewage sludge ash as a function of variations in the pH and N and Mg concentrations.
Statistical methods can be used to investigate the effects of the variables that affect a process and quantitatively determine the efficiency factors to thereby optimize the process to make it economically feasible. Multivariate experimental designs are tools that have high efficacy for optimization and enable the simultaneous evaluation of several factors by using reduced amounts of experiments. The applicability of these designs is conditioned by the process responses, which enable the detection of significant effects, the determination of optimal regions, the generation of adjusted optimization models and the analysis of optimal points with combined responses if the process has more than one response variable [34]. In addition, experimental designs are the basis for the application of the RSM, which can be used to determine the impact of variations in the degrees of freedom of the factors at the optimal points [34,36].
Experimental designs are widely disseminated and commonly used for the optimization of various processes. The precipitation of struvite from wastewater has been a recent target in experimental designs aiming to identify the best production conditions given the various physicochemical reaction factors that can affect the process and its purpose of use [34,37]. Some studies have used Box–Behnken or central composite designs to evaluate the impact of some reduced variables and to optimize the synthesis process through responses such as phosphorus recovery [34], the mean particle size of precipitated struvite [38], and the removal of ammonium [32].
Screening designs such as the Plackett–Burman and second-order designs in a Doehlert matrix are rare in studies on the optimization of struvite synthesis. The principle of the Plackett–Burman experimental design is the investigation of factors influencing the process, which can be fixed or eliminated when used in other designs [36,39]. The Doehlert matrix consists of a multivariate design that is highly effective in generating second-order models. This design shows a uniform distribution of points within an experimental interval, with several unequal levels proportional to the importance of each variable. In addition, the Doehlert design requires a smaller number of experiments compared to other types of design, such as the central composite design and the Box–Behnken design, which also have a high degree of efficiency [40,41,42].
In this context, this study aimed to identify the best conditions for struvite precipitation through the recovery and recycling of nutrients from wastewater. Thus, the differential proposal of the work consisting of the application of a sequential experimental design methodology was applied to determine the factors affecting the process through a Plackett–Burman design and to optimize the synthesis through a Doehlert matrix design together with the RSM and the desirability function, which enabled the establishment of an optimized experimental area, regression models for the synthesis, and identification of the optimal points for struvite precipitation with combined responses. Both experimental designs were never used to optimize struvite precipitation. In addition to using designs that are uncommon in studies on struvite production, this study also aimed to investigate the structure of the precipitated material, the details of the phases formed, and the combination of phosphorus recovery and the thermo-chemical results of the degradation of the struvite structure from enthalpy variations as second-order design responses.

2. Materials and Methods

2.1. Synthetic Wastewater Preparation and Synthesis of Struvite

The synthesis of artificial wastewater was conducted in a simple reaction system following the methodology tested by Meira (2020) [43]. Solutions of K2HPO4, NH4Cl, MgCl2·6H2O, KCl, and CaCl2 with deionized water were used to prepare the synthetic wastewater in 2.5 L reactors at room temperature (26 °C ± 1 °C). Sodium hydroxide (NaOH) 1 M was used during the synthesis to adjust the pH. The input stoichiometry of the solutions was established according to each experimental design applied, and the pH of the reaction medium, the agitation rate, and the reaction time were also defined.
After the precipitation reaction, the solution was filtered in a vacuum separation process with quantitative filters (150 mm). The material obtained was dried in an oven at 40 °C for 48 h. After drying, the material was deagglomerated, homogenized, and subjected to phase analysis by powder X-ray Diffractometry (XRD).

2.2. Analytical Methods

2.2.1. Phosphorus Recovery

The phosphorus content in the supernatant solutions was analyzed using the molybdenum blue spectrophotometric method [44]. The phosphorus content was determined by calculating the phosphorus recovery rate (Prec) of the experimental runs. The calculation of Prec using the P concentration data was performed using Equation (1):
P r e c = C P 0 C P r C P 0 × 100
where C P 0 is the initial PO4-P concentration of the synthetic wastewater, and C P r is the PO4-P concentration of the solution after synthesis.

2.2.2. Phases Analysis

The phase analysis of the products obtained by precipitation was performed in a Malvern PANalytical Empyrean diffractometer with a Co anode (Kα1 = 1.789010 Å), with 1800 W long fine focus, an Fe Kβ filter, a PIXcel3D-Medpix3 area detector 1 × 1 in scanning mode with a voltage of 40 kV and a current of 35 mA, a step size of 0.0065652° in 2θ, with scanning from 2° to 110°, a divergent slit at 1/4°, and antiscattering at 1/2°, a 10 mm mask, and a time step of 19.266 s. The results were interpreted using X’Pert HighScore Plus software version 4.9, from PANalytical, using the COD database (Crystallography Open Database) [45]. A profile fit (pseudo-Voigt function) was performed on the diffractograms to standardize the diffractometric profile of the products with struvite.

2.2.3. Elementary Chemical Analysis

The elemental chemical analysis of the synthesis products was performed in a Malvern PANalytical Zetium X-ray fluorescence spectrometer in the STD-1 calibration (Standardless) relative to the nonstandard analysis of the chemical elements between fluoride and uranium. The samples were prepared in the form of pressed pellets, and the values were normalized to 100%.

2.2.4. Thermal Analysis

The differential scanning calorimeter—glass transition temperature (DSC-TG) measurements were performed in a NETZSCH thermal analyzer model STA 449F3 Jupiter with a simultaneous thermal analyzer from Stanton Redcroft and a platinum vertical cylindrical oven. A temperature range between 25 °C and 1000 °C was used in a nitrogen atmosphere with a flow rate of 50 mL/min. The heating rate was 5 °C/min, with a platinum crucible as a reference. Approximately 10 mg of sample were used. The enthalpies of product degradation were measured by using the DSC with heat flux. This technique enables the area of a peak and the enthalpy variation to be proportionally related through a temperature-dependent calibration factor. The calibration factor was determined using the following substances and respective melting points: In (156.6 °C), Sn (231.9 °C), Bi (271.4 °C), Zn (416.6 °C), Al (660.6 °C), and Au (1064.4 °C). The enthalpy variation at the peaks (ΔH) was determined by Equation (2), and the responses are presented in J·g−1.
H = ± A m K = 1 m K t i n i t i a l t f i n a l h e a t   f l u x   t i n t e r p o l a t e d   b a s e l i n e   t d t
where A is the peak area, m (g) is the sample mass, and K is an empirical constant relative to the sensor sensitivity.

2.2.5. Particle Size Distribution

The particle size distribution analyses were performed in a granulometer using an ANALYSETTE 22 MicroTec Plus laser diffraction instrument. The samples were dispersed in water, the measurements were taken with 100 scans, a beam obscuration of 15%, and size intervals between 0.08 and 2000.00 μm, and the responses were calculated using the Mie model.

2.2.6. Fourier Transform Infrared Spectroscopy

The Fourier transform infrared spectroscopy (FTIR) measurements were performed in an infrared spectrometer with Thermo Scientific Fourier transform, model Nicolet iS50 FTIR. The spectral data were in the mid-infrared (MIR) region, with an IR source, a KBr beam splitter, and a DTGS KBr detector. All measurements were performed under the transmission mode with KBr pellets (ratio: 2 mg of sample/150 mg of KBr), and 100 scans were taken with a spectral resolution of 4 cm−1.

2.2.7. Scanning Electron Microscopy

Morphological analyses were performed to identify the structures and textures of the synthesis products. Micrographs were obtained using a Thermo Fisher Scientific Quanta 650 FEG scanning electron microscope (Waltham, MA, USA). The analyses were performed using backscattered and secondary electrons, with a constant acceleration voltage of 15.0 kV and a working distance of ~14 mm.

2.3. Experimental Design and Statistical Modeling

This study was based on a sequential experimental design methodology. In the first stage, a Plackett–Burman design was applied to identify and estimate the significant factors within the synthesis process. In the second stage, after establishing the values of the factors that did not show significance, a second-order design with a Doehlert matrix was performed to determine the optimal points of the factors from the regression models using the RSM and the desirability function.
All experiments were performed randomly. The residuals of the experimental values and the values obtained by the multiple regression models (which obeyed the assumptions of independence, randomness, homoscedasticity, and normality of the residuals) were compared, and analysis of variance (ANOVA) tests were performed with a confidence level of 95%. Statistical analysis of the data was performed using the outputs generated by Statistica® software version 13.1.

2.3.1. Plackett–Burman Design

The Plackett–Burman experimental design was used to screen the variables studied in this synthesis process. This type of design is used to screen a large number of factors, which can affect the responses in the analysis of a process of interest [36]. The design consisted of a PB-12 with eight independent factors tested at two levels, which resulted in 12 experimental runs (see Section 3.1). The factors evaluated in this design, as well as their levels, were selected from process data reported by several authors. The choice of factors was based on the theoretical and methodological framework, which highlighted important physicochemical aspects of the struvite synthesis process. The process factors studied, with their respective units and codes, were the initial phosphorus concentration (mg·L−1, X1), the pH of the synthetic wastewater (X2), the initial molar ratios (NH4/PO4, X3; Mg/PO4, X4 and K/PO4, X5), the presence of Ca (X6), the time (min, X7), and the agitation rate (rpm, X8).
The screening of the parameters through the PB-12 design was established based on the phosphorus recovery rate “Prec (%)”, which was considered to be the design response variable, and the qualitative analysis of the phases formed in the synthesis products. The XRD analysis of the phases was performed to evaluate the formation of struvite as a positive response compared to the formation of other phases or the nonformation of crystalline material.

2.3.2. Doehlert Matrix Design

By considering the selection of significant factors for the phosphorus recovery rate response, it was possible to establish a second-order design for the optimization of the synthesis based on the first-order experimental design. Thus, a Doehlert design for three factors was used, and the response variables were the phosphorus recovery rate “Prec (%)” and the enthalpy of the endothermic peak of struvite decomposition “ΔH (J·g−1)” response methodology adapted from Meira (2020) [43].
In this design, the total experimental domain was determined through a minimum number of experiments, which was related to the number of factors considered in the study. As a simplified representation, k factors determine the number of experiments based on the formula k2 + k + 1 by economically planning the ideal number of experimental runs.
In this step, the effects of three factors were investigated: the pH (U1), the N/P ratio (U2), and the P concentration (U3), which were related to the variables coded according to Equation (3).
X i = U i U i ¯ Δ U i
where Xi is the coded value of the variable; Ui is the actual value of the variable; U i ¯ is the center point value within the experimental range (Equation (4)) and ΔUi is the range of variation of factor i (Equation (5)).
U i ¯ = U p p e r   l i m i t   o f   U i + L o w e r   l i m i t   o f   ( U i ) 2
Δ U i = U p p e r   l i m i t   o f   U i L o w e r   l i m i t   o f   ( U i ) 2 α i
where αi is the coded limit value for each factor.
The experimental domain is shown in Table 1. The design matrix is detailed in Section 3.2.

3. Results and Discussion

3.1. Plackett–Burman Design

A PB-12 design was performed to determine the factors affecting the synthesis of struvite. The experimental matrix with coded and actual factors for the response (Prec) is detailed in Table 2.

3.1.1. Product Characterization

Figure 1 shows the phase characterization of the products obtained through the Plackett–Burman design experiments. Six experimental runs showed struvite formation (Figure 1a). Among them, race numbers 8 and 12 stand out because they presented better yields regarding the intensity of the main peak of struvite (d111 = 4.25 Å) in the refined (Fit Profile) diffractometric pattern (Table 3). In runs 1, 3, 8, and 12, the peaks related to the crystalline planes (002), (012), and (004) of the struvite structure showed a high relative intensity, which can be explained by the preferred orientation of the crystals. The material obtained in experiment no. 3, in addition to containing struvite as the main phase, also showed the formation of its isomorphic potassium analog (K-struvite), which is corroborated by the slight displacements in the struvite peaks (Figure 1a). These displacements occur as a function of the unit cell contraction due to the replacement of NH4+ ions (1.40 Å) with K+ (1.33 Å) [46,47]. The presence of a struvite analog in sample no. 3 is related to the concentration of K+ ions in the wastewater, which was slightly higher than the proportion of the ammonium concentration (Table 2); this result is consistent with the substitutions in the unit cell. In addition, the radius of the cation affects the stability of the structure, which consequently increases with larger cations [48]. Therefore, more struvite than K-struvite was formed due to the structural stability provided by the NH4+ ion compared to the stability provided by K+.
The synthesis products obtained in experiments 4 and 10 also formed struvite as a single phase (Figure 1a); however, the phase in both experiments showed low-intensity peaks (Table 3), indicating a low conversion. This low conversion into struvite was due to the presence of Ca2+ in the wastewater from these runs, which “competes” with Mg2+ and is responsible for the formation of amorphous calcium phosphate (ACP) as a coprecipitated material. In supersaturated and alkaline media with high pH values and in the presence of Ca, P, and Mg, the coprecipitation of ACP with other calcium phosphate compounds may be common [30,49,50].
The diffractograms of the other experiments (Figure 1b) show the formation of undesired phases in the process, such as brucite (Runs 2, 5, and 7) and bobierrite (Runs 2 and 5), as well as the formation of amorphous material (Runs 6, 9, and 11). The precipitation of the brucite and bobierrite phases had a direct correlation with the high Mg/P ratio and the more alkaline medium (pH 11). In the experiments in which there was an absence of crystalline phases, the formation of ACP was assumed to be due to the presence of calcium in solution with a lower supersaturation ratio, given the proportions of Mg (Runs 6 and 11) and/or ammonium (Run 9) at the lower levels. The presence of other competitive ions strongly affects the struvite formation process.

3.1.2. Analysis of the Main Effects and Interactions

In conjunction with the phase analysis from the diffractograms of the PB-12 design experiments, a statistical analysis using the phosphorus recovery rate (Prec) was performed. The phosphorus recovery values obtained after the synthesis process using PB-12 are shown in Table 2.
Most tests showed phosphorus recovery rates above 70%, which indicates a high efficiency in the synthesis process. However, according to the analysis of the phases in the products, not all experiments were efficient for the formation of struvite. From the runs with phosphorus recovery rates higher than 90% (Runs 2, 4, 6, 7, 9, and 11), only experiment 4 showed struvite formation, but the peak intensity was reduced (Figure 1). The product of experimental run 10 showed similar behavior, with a low conversion into struvite even with a high phosphorus recovery rate (89.2%). Only in experiment 12 was a high conversion into struvite with a high phosphorus recovery rate observed (71.1%). The products with a high phosphorus recovery rate and without the presence of struvite correspond to those with the formation of amorphous calcium phosphate, which is more favorable than struvite when calcium is present in the reaction medium.
Table 4 shows the statistical analysis of the main effects of the operational factors evaluated in the PB-12 design for the phosphorus recovery rate response. The response data were subjected to regression analysis to evaluate the p-value with a confidence level of 95%. The analysis of the results showed that only the initial phosphorus concentration (X1), the pH (X2), the molar ratio N/P (X3), and the presence of Ca (X6) were statistically significant for the response. The greatest effect of the X6 factor in Table 4 is because calcium reacts in the formation of calcium phosphate, which in this context is established as ACP. In this sense, this factor is comparatively the most significant and positive factor, but it is undesirable because it unfavorably affects the formation of struvite.
The analysis of the values of the p descriptive level and the F statistics contained in Table 4 allows us to conclude that the factors X4, X5, X7, and X8 were not statistically significant in the phosphorus recovery.

3.2. Doehlert Design

Based on the results obtained from the Plackett–Burman design, a second-order experimental design (Doehlert design) was performed with statistically significant factors. The other factors that were not influential had their values fixed, considering the economic constraints of the synthesis: Mg/P ratio = 1/1, K/P ratio = 2/1, absence of calcium, time = 30 min, and mixing rate = 200 rpm. Table 5 shows the matrix of experiments used.

3.2.1. Analysis of the Response: Phosphorus Recovery

The phosphorus recovery results for each test of the Doehlert matrix are shown in Table 5. The variation in the recovery rate was established in a range of values between 30 and 75%. Similar recovery rates have been found in other studies on the production of struvite from wastewater. Crutchick and Garrido (2011) [51] obtained struvite crystallization with a phosphorus recovery efficacy of 64% for industrial wastewater and 60% for synthetic wastewater. In the present study, it is noteworthy that all research was conducted using synthetic wastewater.
Experimental runs 2 and 3 showed the best Prec responses: 74.8 and 74.7%, respectively. These results can be explained by the relationship between the relatively higher pH value and the higher N/P ratios [3]. The lowest phosphorus recovery rates were observed in experiments 5, 6, and 8, with values close to 30%. These lower recoveries may have been related to the low concentrations of NH4 and P (Table 5).

3.2.2. Product Characterization

The diffractograms in 
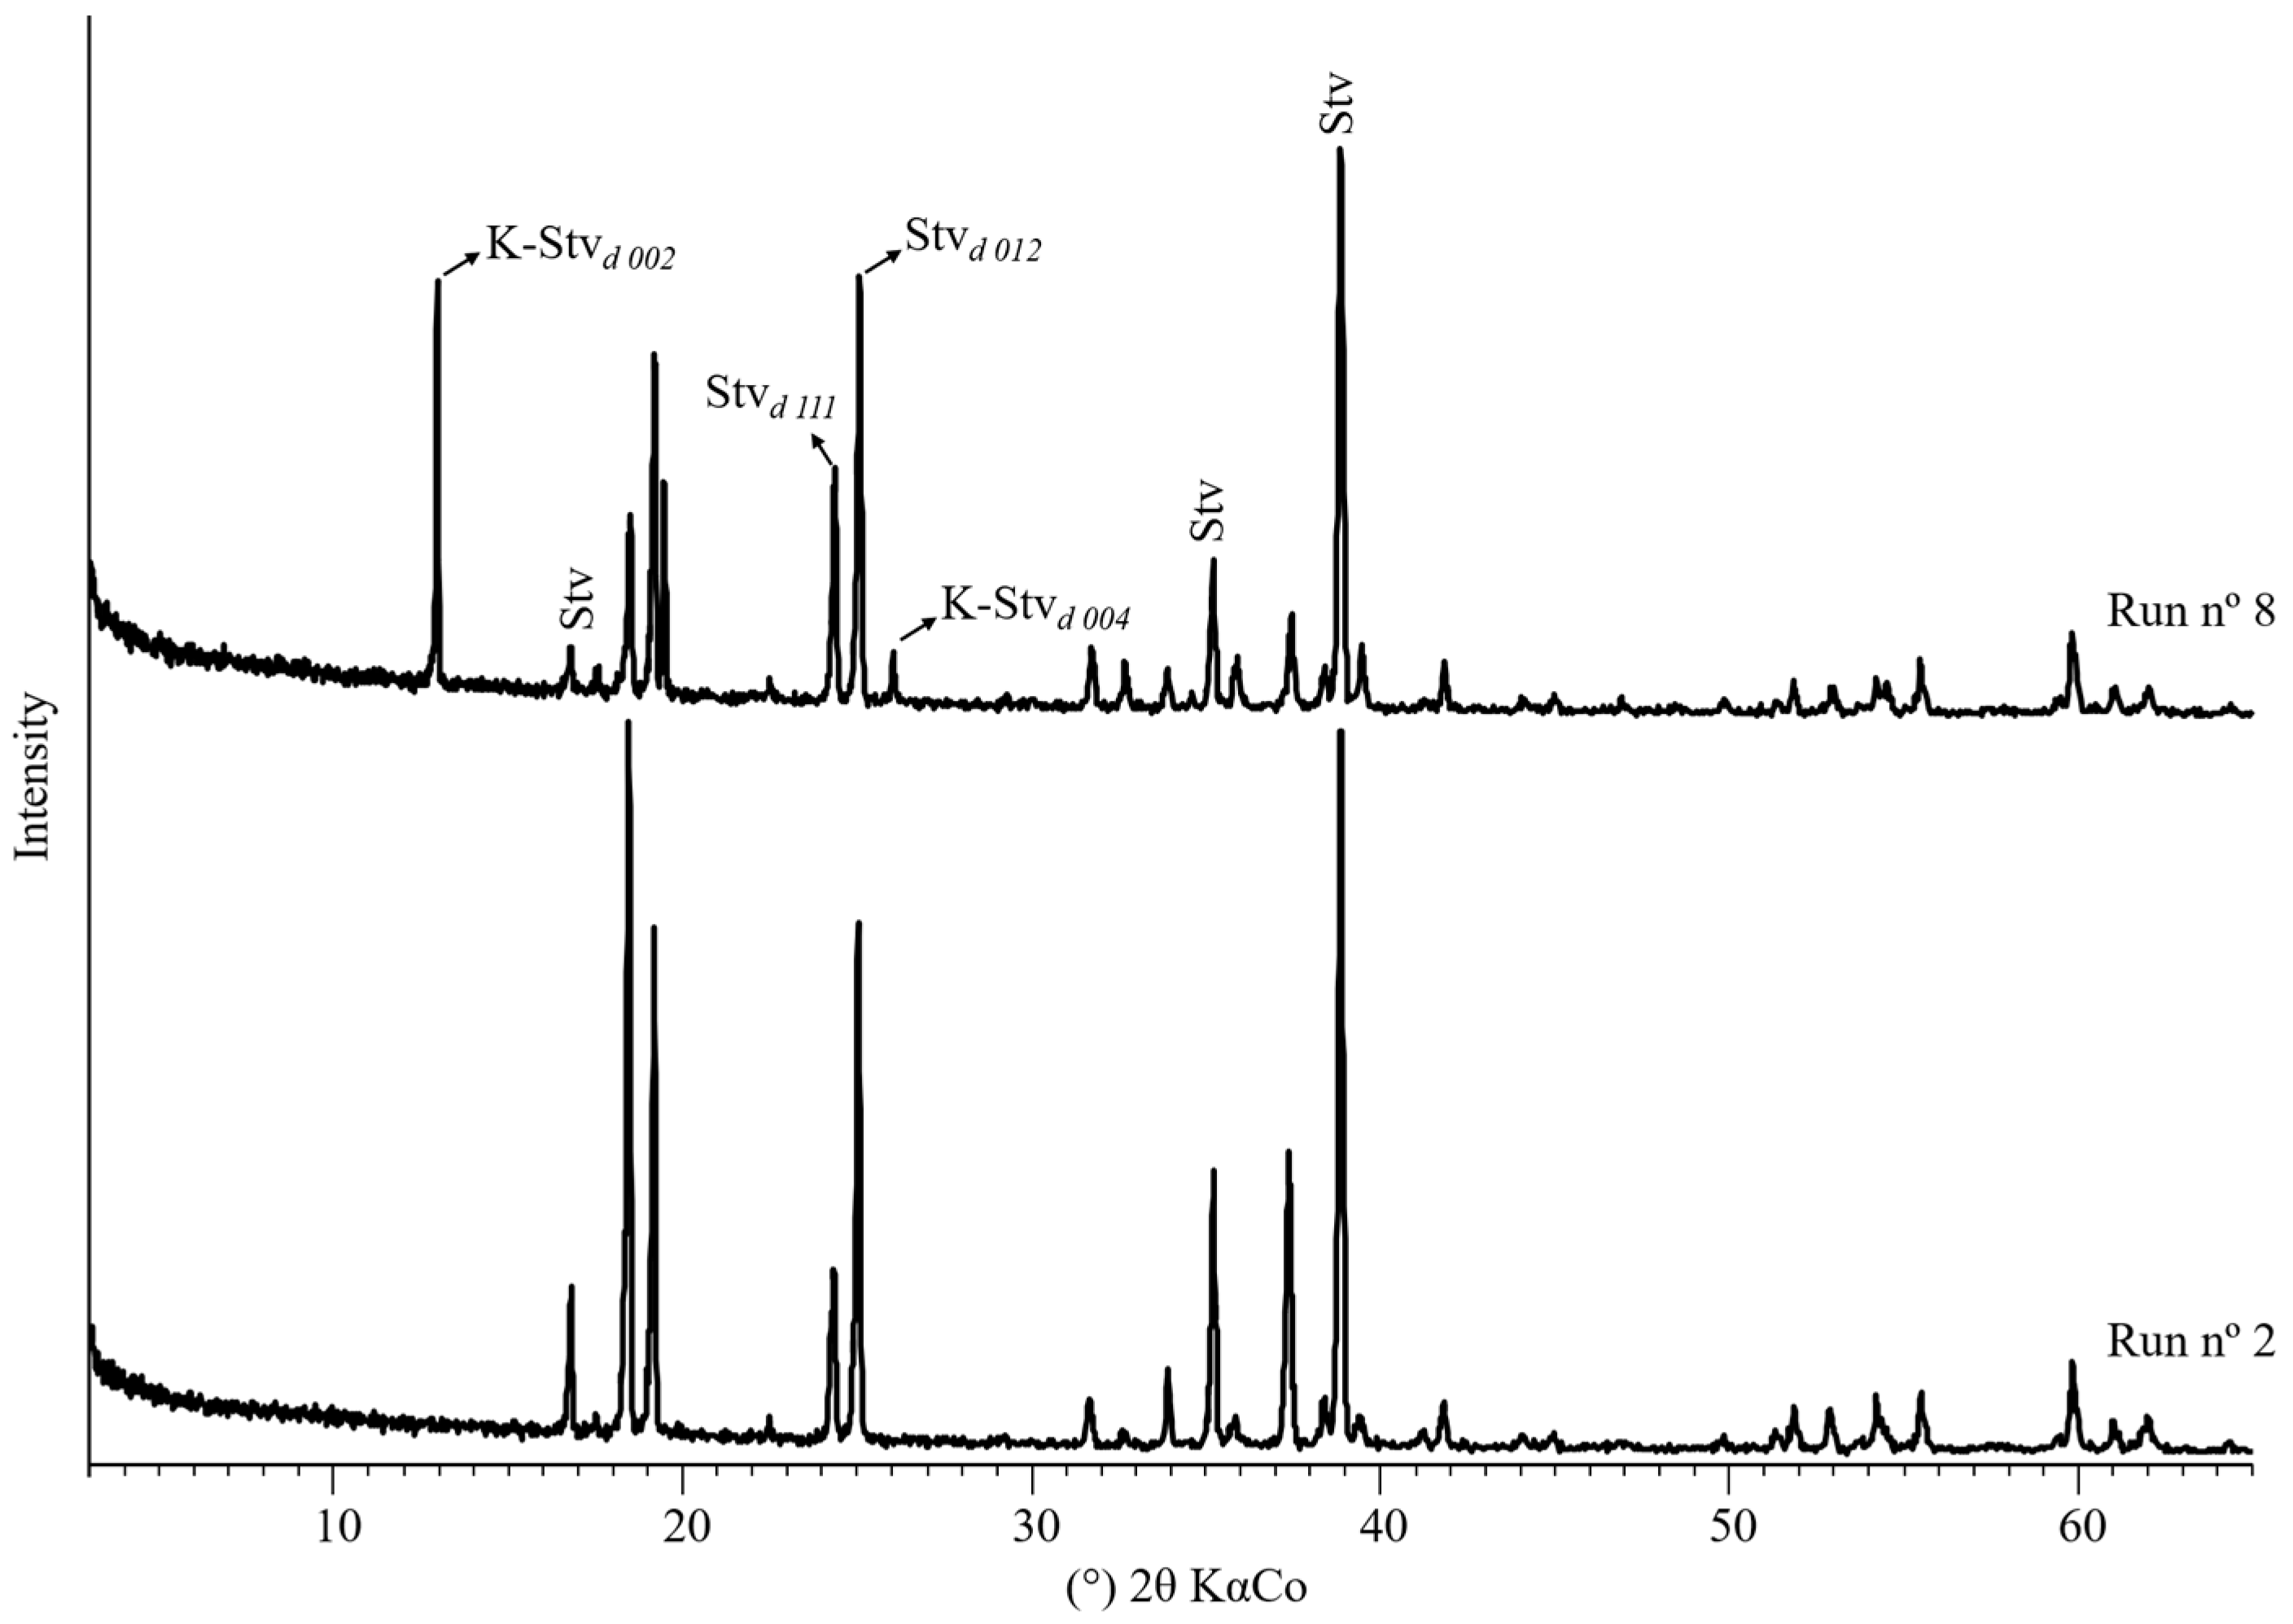
Figure 2 show the phase analysis of some of the products obtained through the Doehlert design. All experiments presented struvite as the main phase. In some cases, struvite analogs were also formed (Runs 1, 7, and 8). The formed struvite analog acts as a compensatory phase and is not detrimental to the synthesis objective because it has K in its composition, which is a highly valuable nutrient [52], and it contributes to the recovery of phosphorus from wastewater for use as a slow-release fertilizer.
Due to the formation of struvite as the main phase in all the samples, the adopted experimental region constituted the optimal synthesis region (thermodynamically stable region for struvite). This fact is corroborated by the elemental chemical analysis of the products, which quantitatively shows the presence of the elements that make up the struvite (Table 6). The high values of P in the products expressed by P2O5 varied between 46 and 51%, while the values of Mg expressed by MgO were between 25.4 and 30.2%, and the values of ammonium + hydroxyls expressed by the loss on ignition were between 5.2 and 19.1%. The variations in the loss on ignition levels were mainly due to the formation of K-struvite in some experimental runs, which is confirmed both by the phase analysis and by the K2O values, which increased at the expense of the loss on ignition values in runs 1, 7, and 8. This increase was due to the isomorphic substitutions between K+ and NH4+ that occur in the struvite structure.
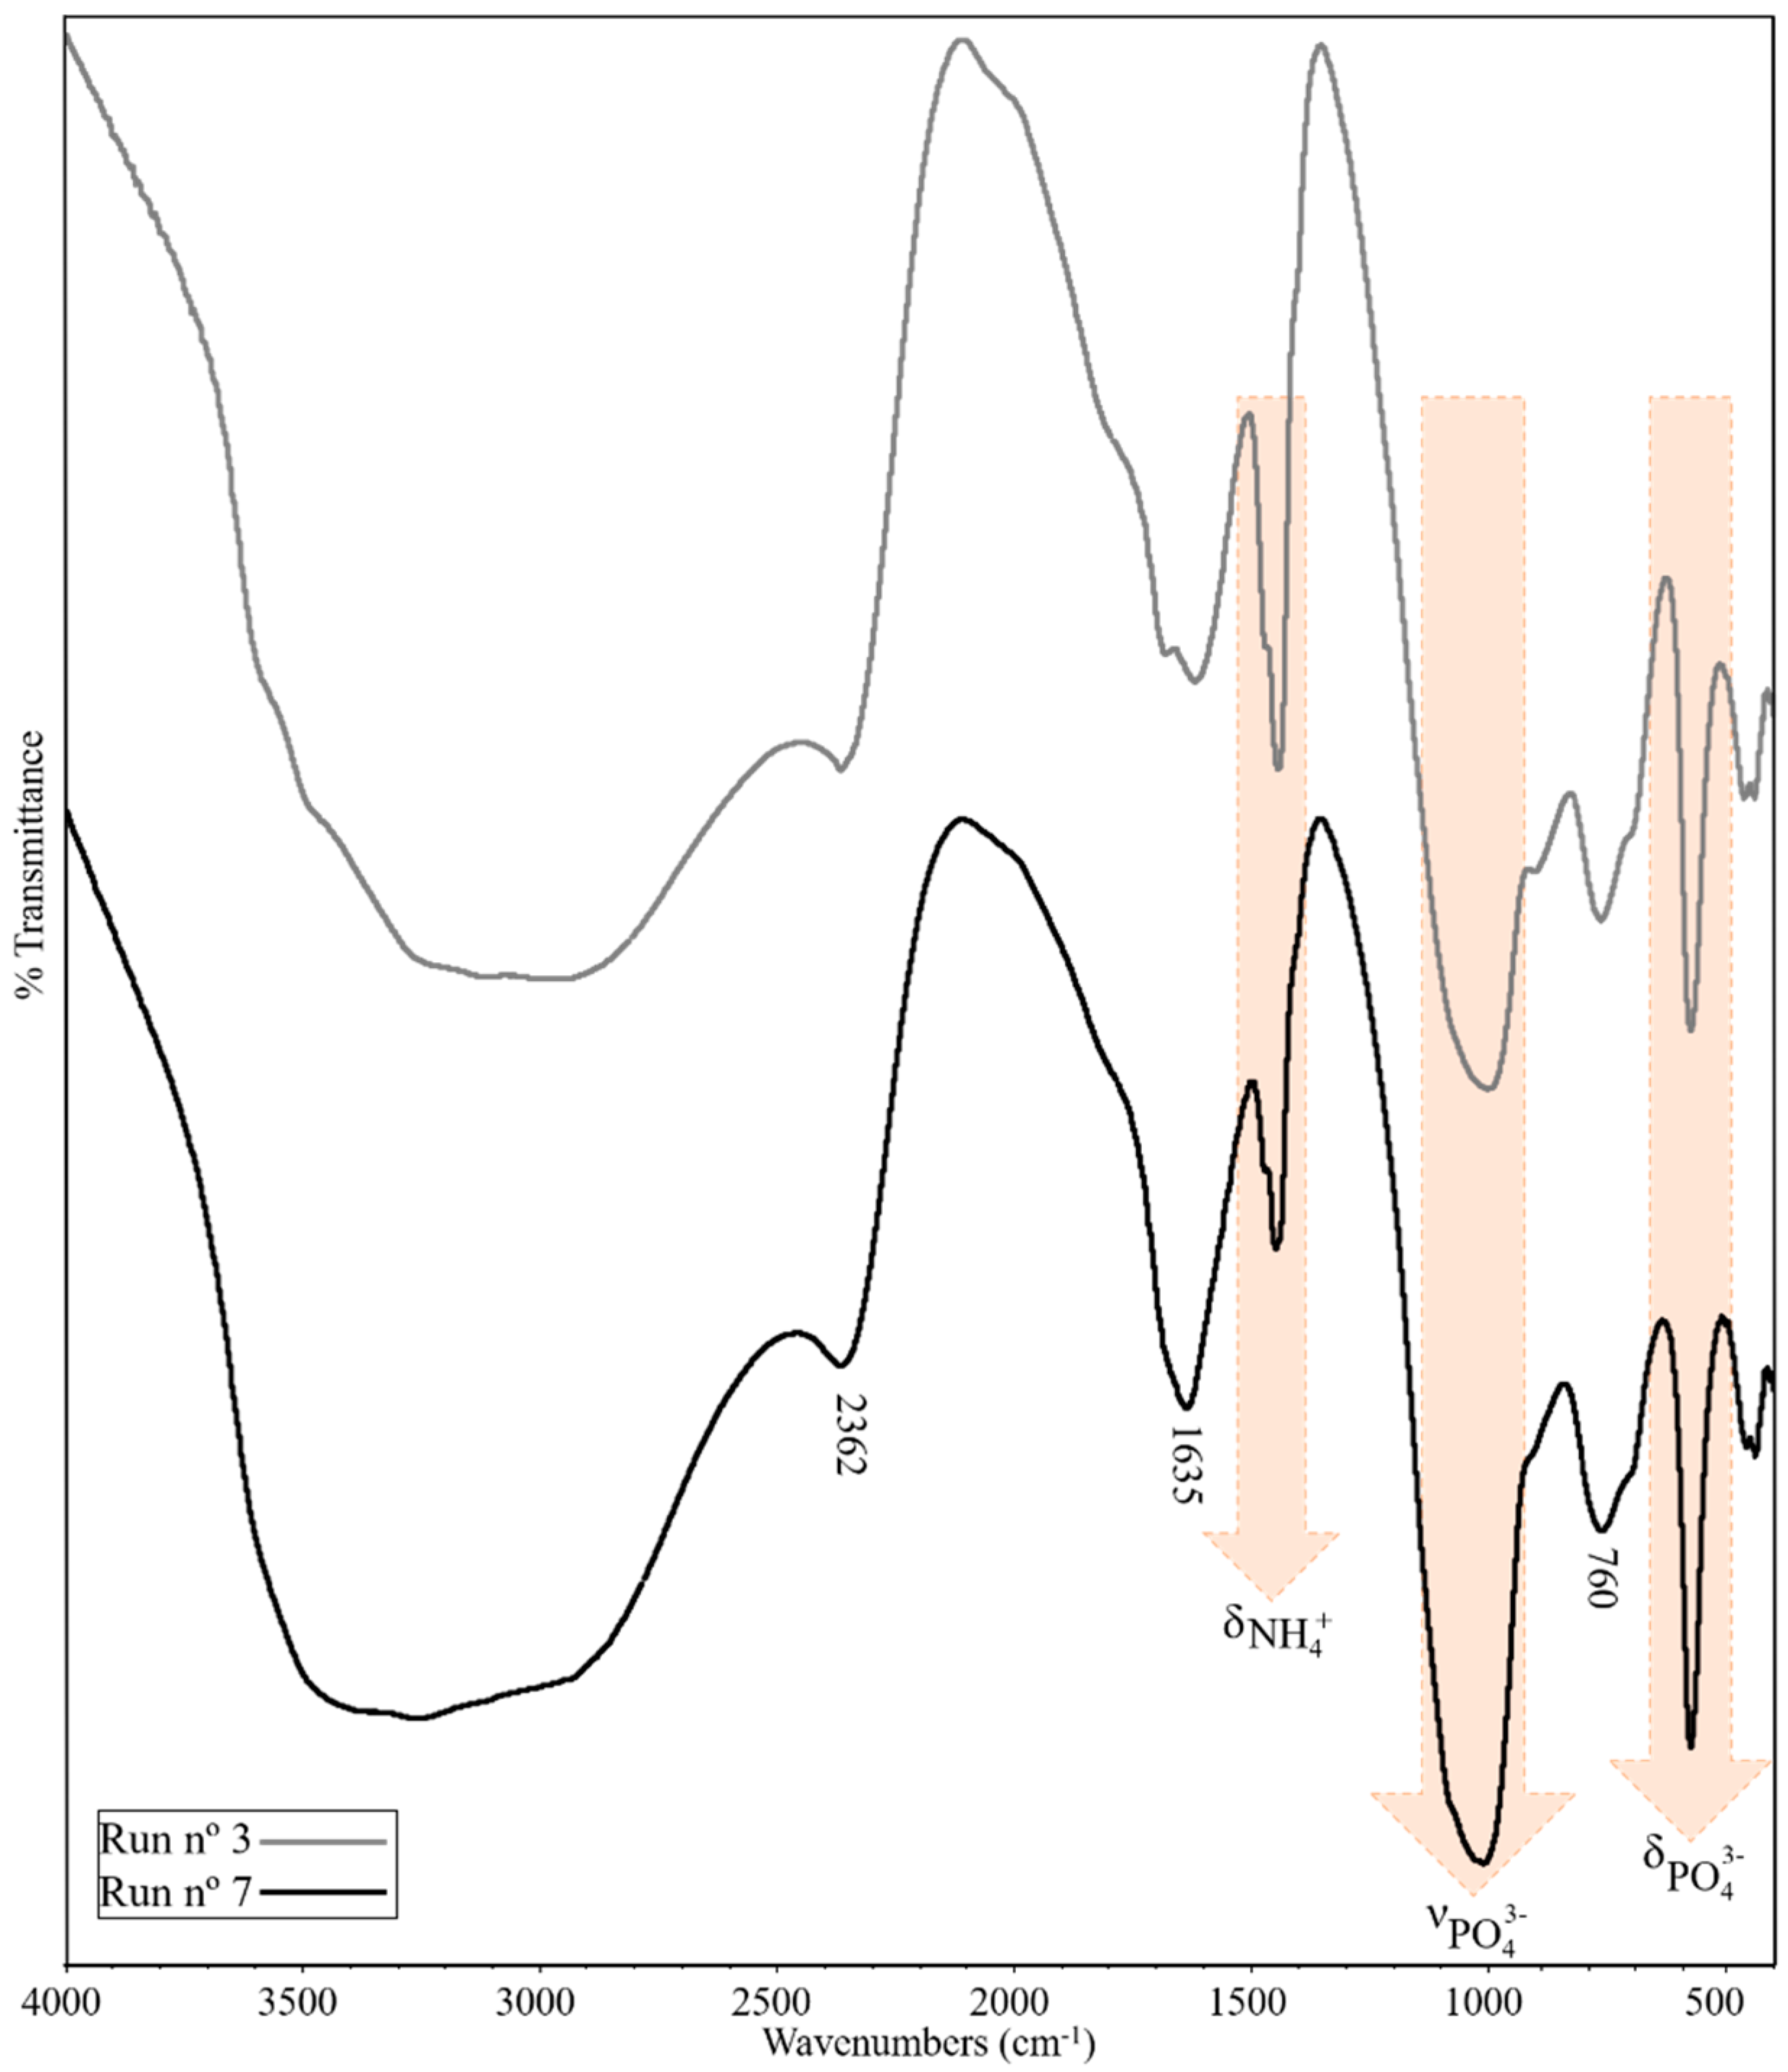
The FTIR chemical analysis of the functional groups showed great similarity in the responses of the products obtained. Figure 3 shows the results of experimental runs 3 and 7, and the bands characteristic of struvite are exposed.
Wide, asymmetric, and well-structured bands were observed in the region between 3500 and 2300 cm−1. These bands are attributed to the vibrations of asymmetric stretching of the OH group and vibrations of symmetric and asymmetric stretching of the N–H bond of the NH4+ group (Figure 3) [47,53]. These bands have wide and asymmetric shapes due to the forces of the hydrogen bonds in the struvite structure, mainly those attributed to water molecules, and the possible overlapping of bands caused by the presence of various functional groups [53]. The bands located in the ranges of 3500 to 3000 cm−1 are characteristic of the stretching vibrations of the H-O-H molecules of crystallization water, while the bands observed at the wavelength ~2360 cm−1 are attributed to the stretching vibrations of the H-O-H of the crystallization water molecules cluster [53,54,55]. Deformational vibrations of the flexion mode of the H-O-H molecule refer to the bands present between 1680 and 1600 cm−1 [53,56]. A band positioned at ~760 cm−1 indicates vibrations related to weak H bonds between water molecules.
The infrared spectra also show two bands characteristic of the NH4+ functional group. The band close to 1475 cm−1 is attributed to the deformation vibrations in the plane of the H–N–H bond, while the band located in the region between 905 and 895 cm−1 can be attributed to the H bond of the ammonium-water interaction [57] and/or the deformation vibration of the O–H fragment bound to Mg2+ [54]. The ionic group (PO4)3− was identified through the bands that are attributed to the strong asymmetric stretching vibrations of the P-O bond (~1005 cm−1), the symmetrical deformation vibrations in the plane of the O–P–O bond (~570 cm−1), and the asymmetric strain vibrations in the plane of the O–P–O bond (~460 cm−1) [53,56,57,58]. The formation of small bands at positions ~436 cm−1 and ~690 cm−1 can be attributed to the vibrations of metal-oxygen (Mg–O ) bonds [54,58,59].
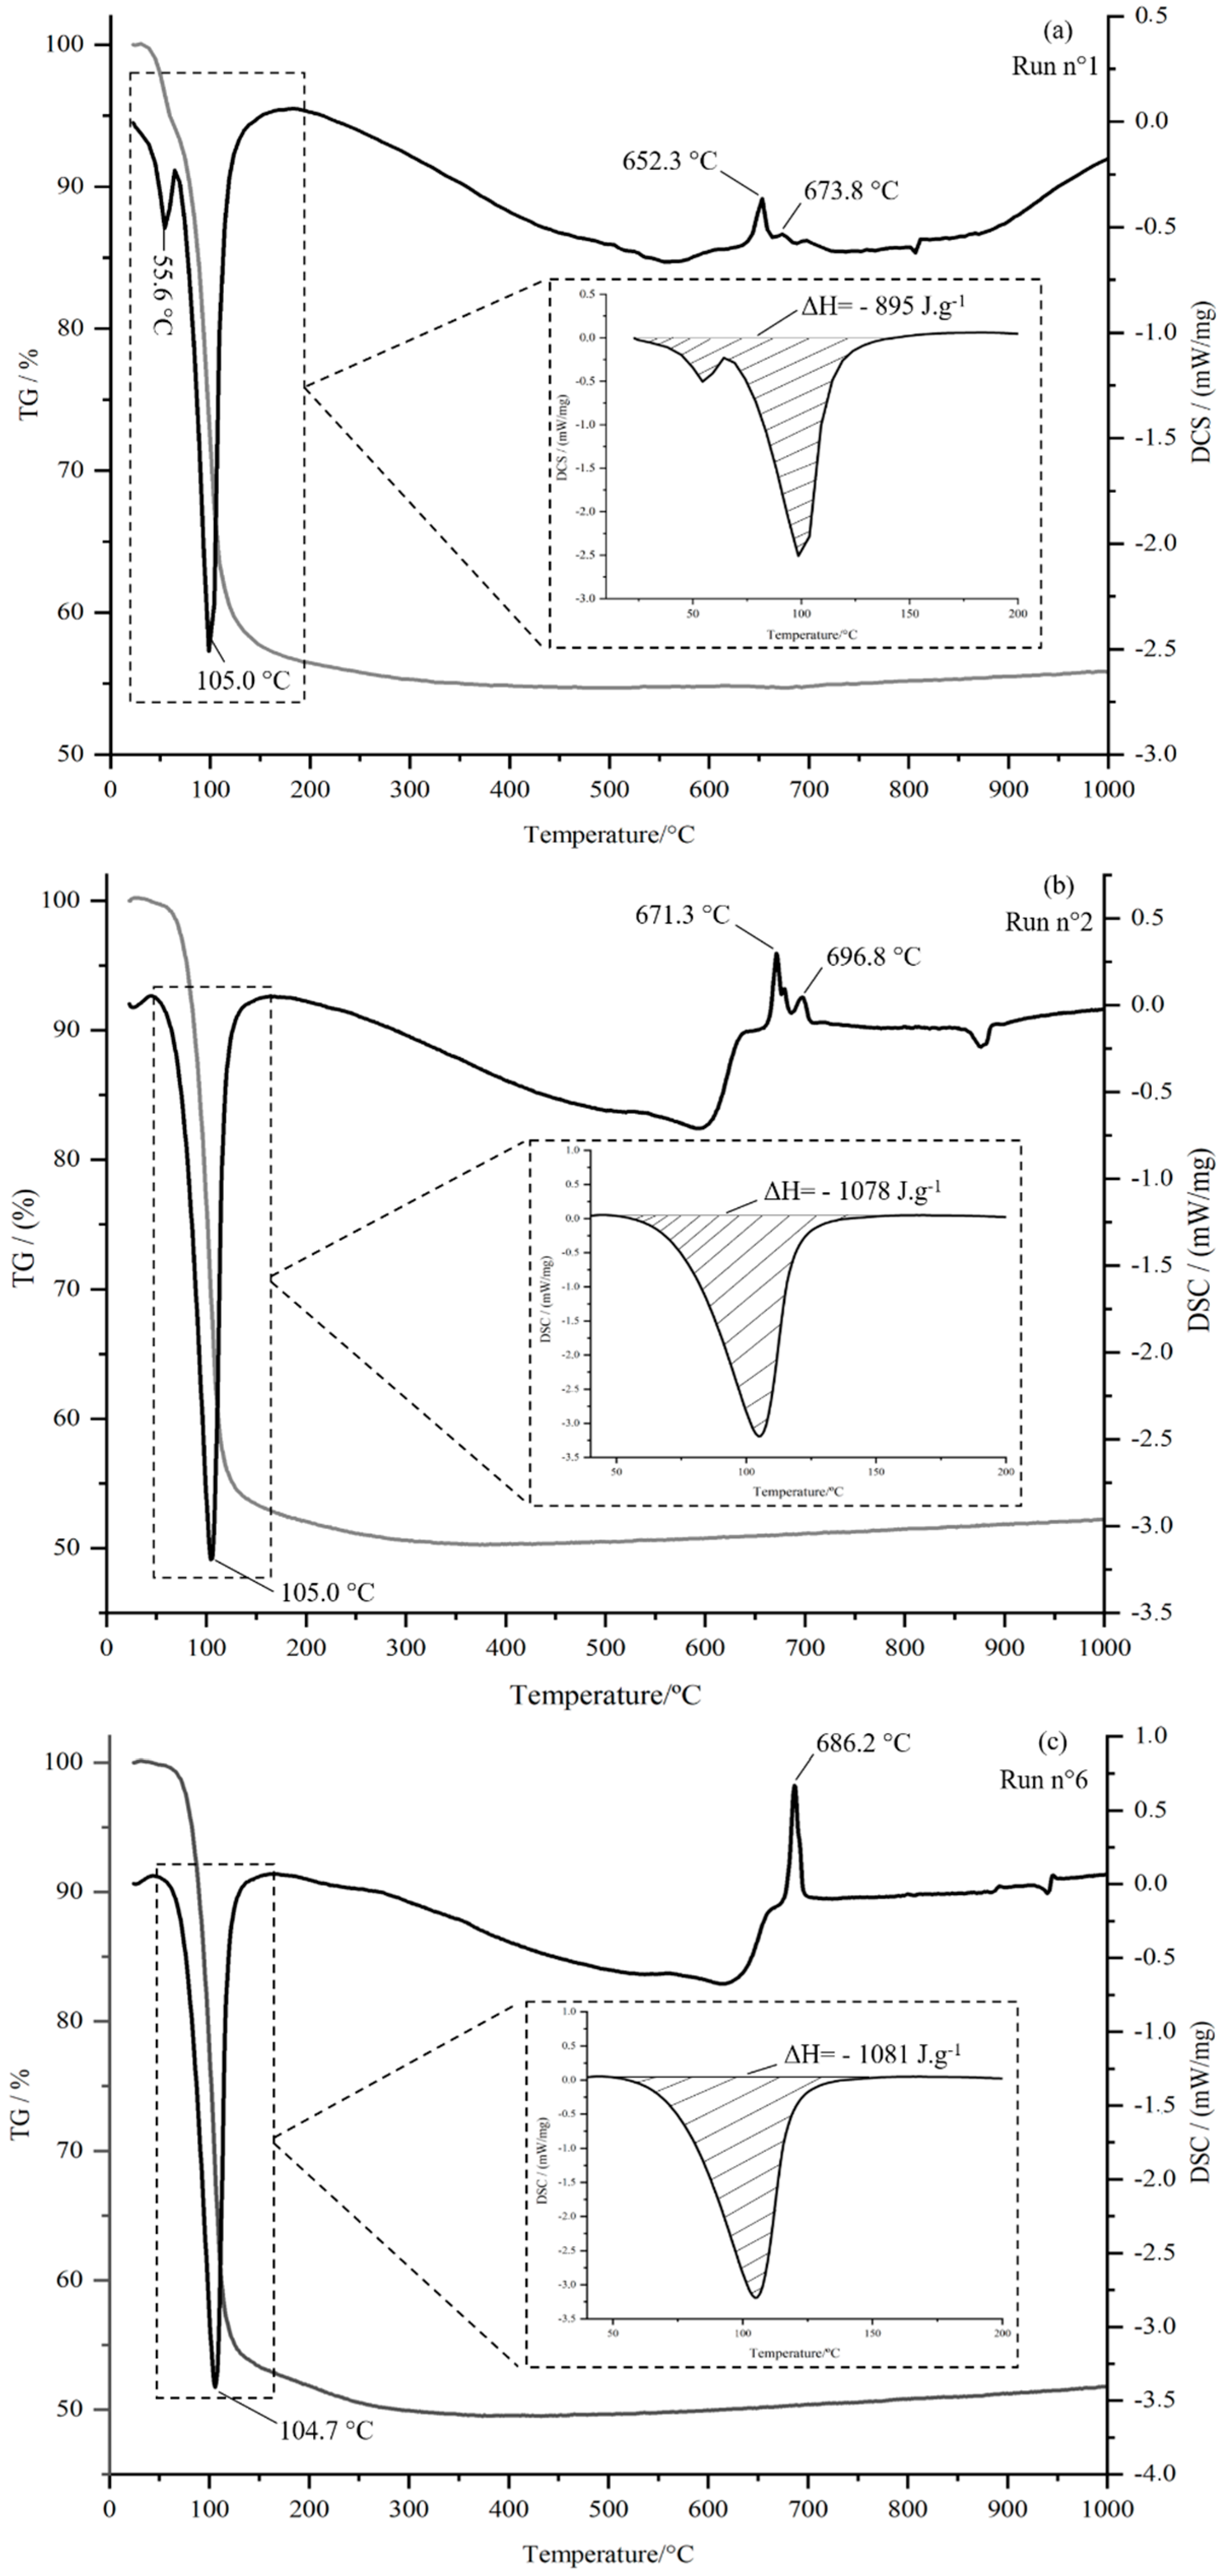
The products obtained in the Doehlert experiments also showed very similar thermal behaviors and were divided into three thermal response groups. Figure 4 shows the DSC-TG representative curves of the three groups: group 1, which corresponds to runs 1, 7, and 8 and contains struvite and the struvite analog, as represented by run 1 in Figure 4a; group 2, which corresponds to runs 2, 5, 12, 13, and 15 and contains struvite alone, as represented by run 2 in Figure 4b and group 3, which corresponds to runs 3, 4, 6, 9, 10, 11, and 14 and contains struvite alone, but with a difference in the content of the events in relation to group 2, as represented by run 6 in Figure 4c.
Struvite undergoes decomposition at low temperatures (above 40 °C) and is affected by the heating rate [60]. Thus, by using a heating rate of 5 °C/min, the first decomposition events in the DSC curves appeared between 55.6 and 105 °C. The endothermic peaks at ~60 °C were observed only in the samples of group 1, which correspond to the presence of the struvite analog, while the endothermic event at ~100 °C occurred markedly in all samples because it corresponds to the presence of struvite in all products. This event (single, double, or even multiple) corresponds to the collapse of the struvite family structure, and the simultaneous loss of ammonia with the loss of structural water [61,62]. When the water loss precedes the loss of ammonia, an intermediate monohydrate crystalline phase called dittmarite (MgNH4PO4·H2O) is formed, as shown in Equation (6).
M g N H 4 P O 4 · 6 H 2 O s   M g N H 4 P O 4 · H 2 O s + 5 H 2 O g
The TG curves (Figure 4) show that the main mass loss occurred between 50 and 110 °C. However, the curves are constant only at ~300 °C, because struvite shows significant water loss above 60 °C and is completely transformed into dittmarite at approximately 100 °C. Thus, the dittmarite is then thermally stable between 90 °C and 230 °C and completely dehydrated at ~300 °C. Heating above 300 °C transforms the dittmarite into an amorphous phase, Equation (7) [62,63]. The mass loss values were between 40 and 51.5% (Table 7), thus corroborating the consecutive losses of water and ammonia. Similar values were observed by Frost et al. (2004) [60], who found mass losses of ~42% during struvite decomposition. For those products considered to have a high conversion into struvite (Runs no. 2 and no. 3), the values obtained can be considered equal to the theoretically predicted value of 51.42%; 44.08% corresponds to water loss, while 7.34% represents the loss of NH4 [60].
M g N H 4 P O 4 · H 2 O s M g H P O 4 s + N H 4 g + H 2 O g
Exothermic peaks at ~650–720 °C were also observed in the DSC curves. Group 1 (Figure 4a) is marked by the presence of a multiple event with a low formation energy; group 2 (Figure 4b) also presented a multiple event in this region but with higher energies and group 3 (Figure 4c) presented a simple event with a higher formation energy. These exothermic events represent the phase transformation of the material structure, in which the amorphous phase is transformed into the crystalline form of magnesium pyrophosphate (Mg2P2O7) (Equation (8)) [47,62,63,64].
2 M g H P O 4 s M g 2 P 2 O 7 s + H 2 O g  
The reaction heat values involved in the endothermic reactions between 55.6 and 105 °C are highlighted in Figure 4H = −A·m−1·K−1, see also Equation (2)), for the representatives of the three groups observed, and Table 7 shows the values for all products. The products of group 1 had the lowest enthalpy values (823–918 J·g−1), which can be explained by the fact that the corresponding precipitates consist of both struvite and the struvite analog so that the amount of ammonia is lower when compared to the amount of ammonia in “true” struvites; this is due to the replacement of NH4+ with K+ in the solid solution. Thus, the other two groups of products with similar thermal profiles, with only “true” struvite, presented enthalpies of decomposition higher than 1015 J·g−1.
The particle size distribution was similar for most products, i.e., a very fine material but with well-developed particles. Product no. 2 (Figure 5a) had a D90 of 22 μm; it was the finest product and had two modes, the smallest of which represented the population of ultrafines (D10 of 5 μm). The other products had D90 values between 80 and 130 μm, as can be observed for product no. 7 in Figure 5b, a result similar to that of the other products.
The mean diameter was 16.3 μm for product no. 2, and it was between 48.7 and 53.8 μm for the other products. Similar results for particle sizes were found by Kozik et al. (2013) [65], who noted mean particle diameter values between 12.6 and 50.2 μm. The aforementioned authors attributed the particle size variations to variations in the pH and mixing time. Thus, by establishing a fixed mixing time, there were no major changes in the particle diameter of the products obtained in the design.
The morphology of the products is shown in the micrographs of Figure 6a–c (run 2) and d-f (run 7). In the analyzed products, crystals characteristic of the struvite orthorhombic structure were formed, which confirms the analysis of the obtained phases. Most crystals had simple needle-shaped morphologies. Some crystals presented their morphology as X-shaped twin crystals with dendritic growth (Figure 6b) and as larger crystals with faceted structures (Figure 6f). These changes in morphology may be due to the structural remnants caused by transitions during synthesis [3]. The crystals formed in the product of run 7, which has struvite and K-struvite, did not show large differences when compared to the crystals formed in run 2, in which only struvite was found. This finding explains why there is no structural change between the phases, with only an ionic change occurring at the NH4+ site [66].

3.2.3. Statistical Modeling and Analysis

The recovery of phosphorus from wastewater through precipitation processes and struvite crystallization is sometimes a joint process that depends on the physicochemical conditions. Thus, a statistical analysis involving the factors screened in the PB-12 design was performed with a second-order design. The pH (X1), the molar ratio N/P (X2), and the initial P concentration (X3) were then analyzed in a three-factor Doehlert matrix (Table 5), and the responses were the recovery rate of P (Prec) and the enthalpy of the endothermic peak of struvite decomposition (ΔH). Investigations of the individual and combined effects of the factors were performed using Statistica software (version 9.0). The coefficients of the second-order regression models for both responses were determined, and the response surfaces and contour lines were obtained to analyze the functional relationships between the levels and the responses and to perform a simultaneous optimization by applying the desirability function within the stipulated experimental domain.
Table 8 shows the ANOVA of the Doehlert design for the two responses.
The phosphorus recovery results indicate that all the factors studied in the linear forms, together with the quadratic forms of the terms X1 (pH) and X3 (P concentration), were significant (p < 0.05) and should, therefore, be considered in the elaboration of the model. In addition, none of the interactions between the factors were significant, indicating that, for the high phosphorus recovery rates, the factors act in isolation, without the dependence of one in relation to the others, however, each factor is individually important for obtaining better yields in the process as a whole. Regarding the thermal decomposition of struvite, the pH (X1), the N/P ratio (X2), their respective second-order effects (X12 and X22), and the interactions between the pH and the ratio N/P (X1 X2) and between the N/P ratio and the initial P concentration (X2 X3) were significant. The P concentration was a noninfluential factor in its independent (X3) and quadratic (X32) forms; in addition, its interaction with pH (X1 X3) was also not statistically significant.
Table 8 shows that the regression models proposed for both the phosphorus recovery and enthalpy variation responses did not lack fit and that their respective coefficients of multiple determination, R2 = 0.985 and R2 = 0.968, were able to explain more than 96% of the experimental variabilities. Thus, the fitted models obtained for Prec (Equation (9)) and ΔH (Equation (10)) can predict the formation of struvite with the desired quality because, as indicated by the values of the coefficients of determination, the correlation between the experimental values and those predicted by the models is significant for both responses.
P r e c = 64.94 + 7.76 X 1 8.17 X 1 2 + 26.23 X 2 + 31.60 X 3 15.56 X 3 2
Δ H = ( 32.65 1.56 X 1 0.54 X 1 2 + 1.76 X 2 1.46 X 2 2 + 2.04 X 1 X 2 1.65 X 2 X 3 ) 2
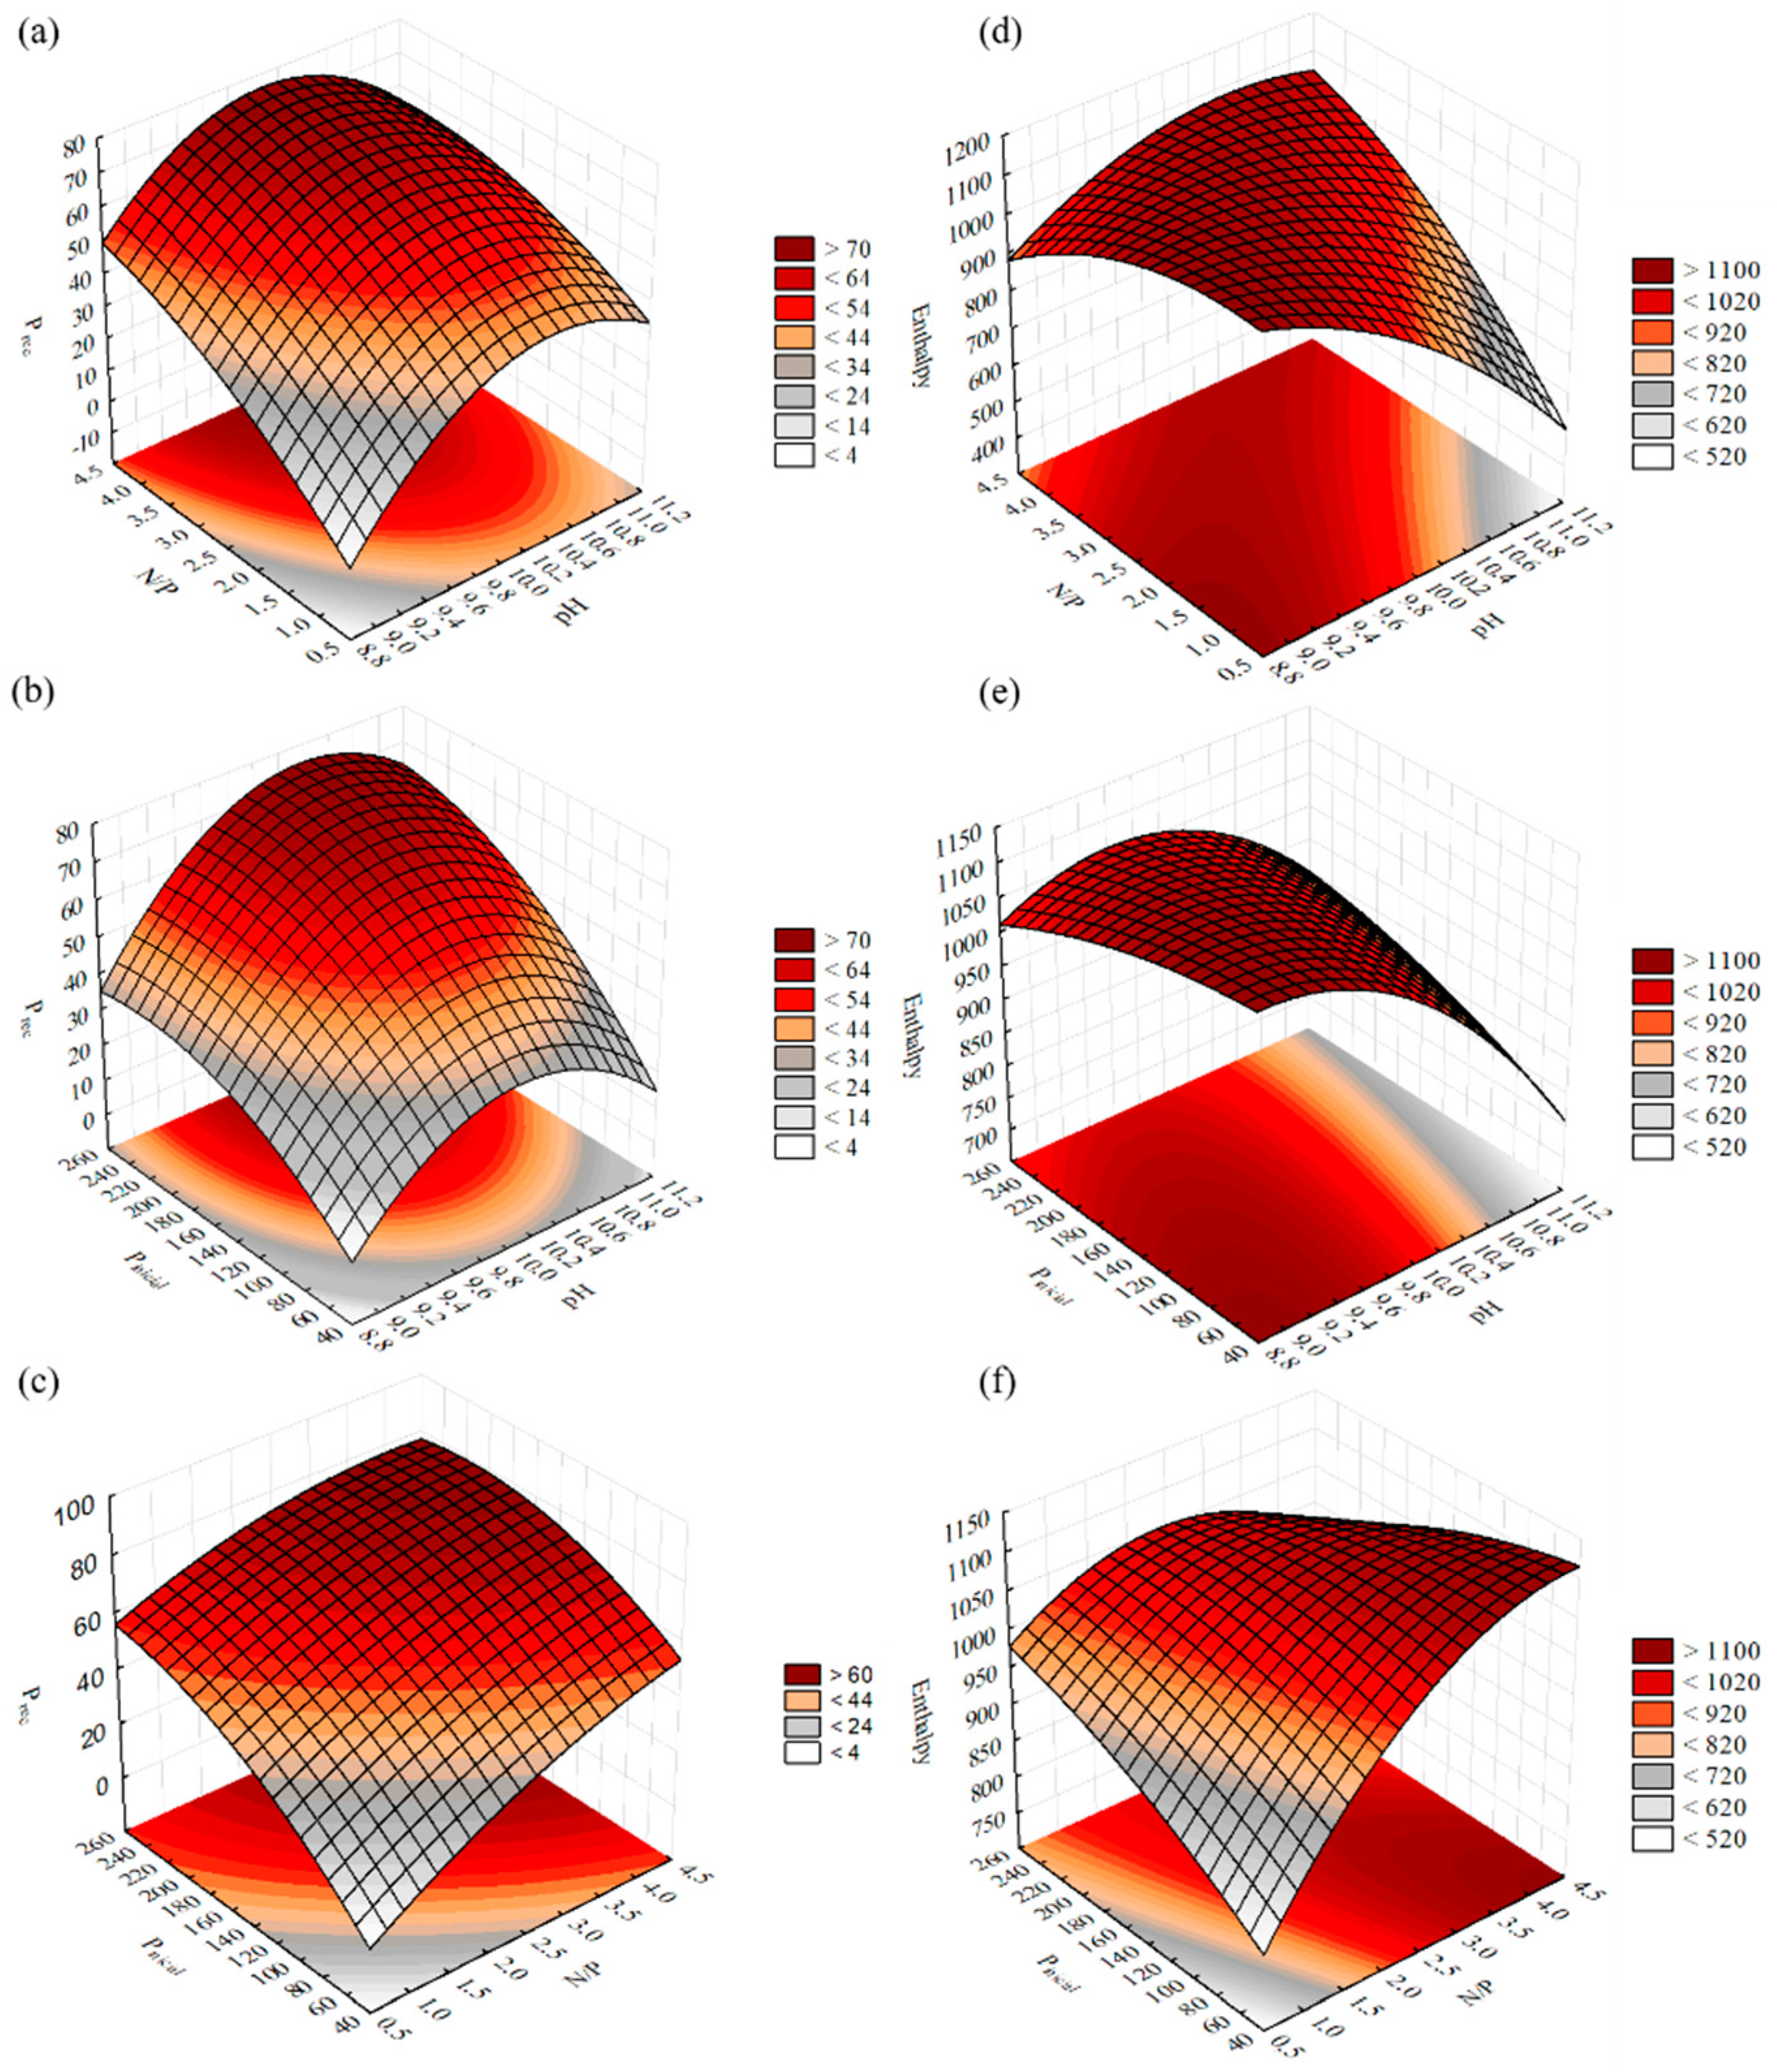
The response surfaces of the effects of the pH (X1), the N/P ratio (X2), and the initial P concentration (X3) on phosphorus recovery and the enthalpy of decomposition are shown in Figure 7. Greater phosphorus recoveries were obtained for a pH close to 10, N/P ratios equal to or greater than 4, and a P concentration equal to 250 mg/L, as shown in Figure 7a–c. The values determined for the pH and the N/P ratio are consistent with the results of other optimization studies on phosphorus recovery, which have shown that the pH should be higher than 9.5, and the N/P ratio should be above 2 [33,34]. The response surface graphs in Figure 7d–f show that for greater enthalpies of the endothermic peak indicative of struvite decomposition, the synthesis conditions should include pH values between 9 and 10, N/P ratios greater than 2.5, and phosphorus concentrations greater than 60 mg/L.

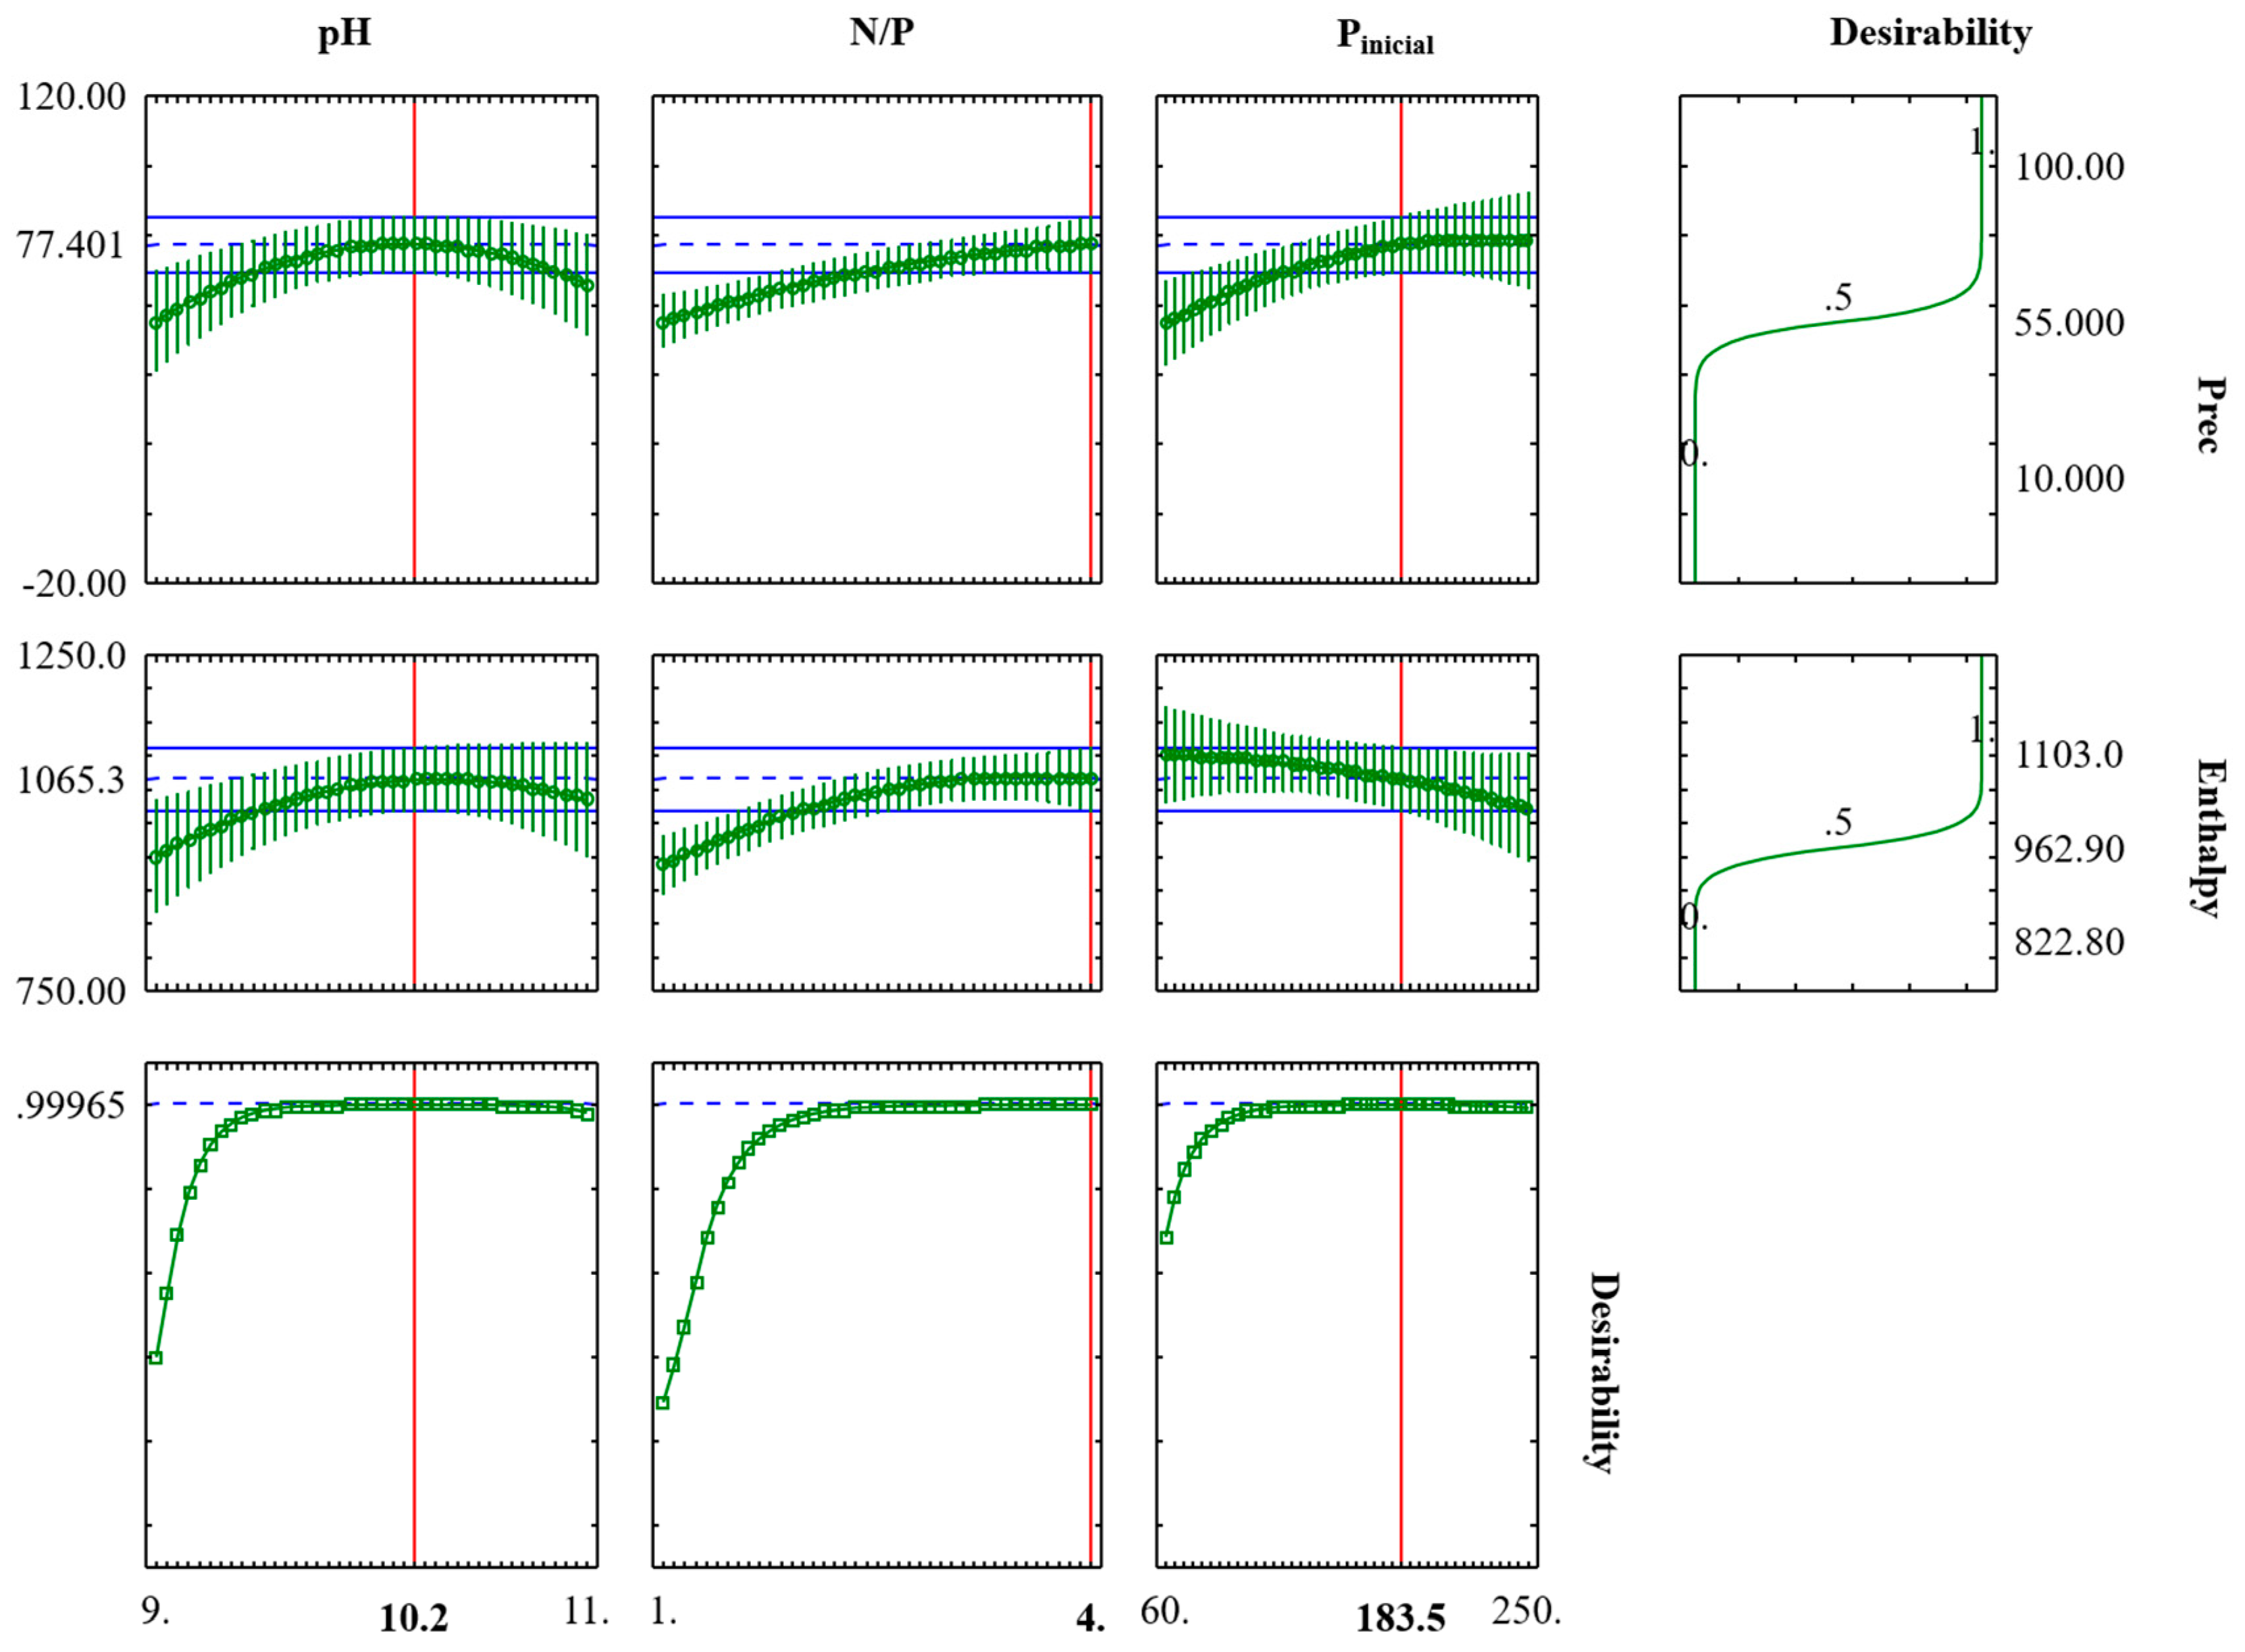
Simultaneous Optimization

Table 9 shows the parameters used in the global desirability function for a better struvite yield, considering phosphorus recovery and the enthalpy variation of the endothermic peak, which represents the decomposition of the formed structure.
The analysis of the global desirability function in Figure 8 allowed us to determine the operational conditions to maximize the precipitation of struvite from wastewater. Thus, the pH should be 10.2, the molar ratio N/P should be equal to or greater than 4, and the initial phosphorus concentration should be 183.5 mg/L. The results indicate a global desirability coefficient of 0.99965, which is considered excellent [67].

4. Conclusions

A sequential experimental design methodology was applied to determine the main factors affecting the struvite precipitation process and to determine the optimal points of struvite synthesis for the recovery of nutrients in wastewater, especially phosphorus.
The Plackett–Burman screening plan showed that the most influential factors in the synthesis were the pH, the molar ratio N/P, and the initial phosphorus concentration. In addition, the presence of calcium was shown to be closely related to the formation of the amorphous phase, which makes it detrimental to the expected yield of struvite. The Mg/P and K/P ratios, together with the reaction time and the mixing rate, were not statistically significant; therefore, they did not affect the phosphorus recovery and the associated struvite precipitation.
The second-order design in the Doehlert matrix, in which only the positive significant factors were used, was used to determine an optimized experimental area and to generate regression models with a good fit for the two response variables studied (Prec and ΔH). The RSM results show that the optimal points for a good phosphorus recovery yield are pH = 10, N/P ratio ≥ 4, and Pinitial = 250 mg/L; for the formation of struvite, as described by the enthalpy variation of the endothermic peak of degradation of its structure, the optimal points of the variables are pH = 9–10, N/P ratio > 2.5, and Pinitial > 60 mg/L. In an optimization involving the two responses simultaneously, the analysis of the desirability function data indicated pH = 10.2, N/P ratio ≥ 4, and Pinitial = 183.5 mg/L as optimal points.
The crystalochemical analyses of the synthesis product also demonstrated the efficiency in the formation of struvite within the optimal experimental region. The XRD results show that struvite and its potassium analog were the only phases formed under the synthesis conditions, corroborated by the FTIR and DSC-TG analyses, which showed bands and peaks characteristic of these phases.
The establishment of the main intervening factors and the optimal synthesis values and intervals can be used to determine the best yield ranges for struvite production and phosphorus recovery. Thus, this research has great importance within the global context of the environmental impacts caused by the phosphorus in wastewater and the search for alternative solutions for obtaining fertilizers.

Author Contributions

Conceptualization, P.V.C. and S.P.A.D.P.; methodology, P.V.C.; validation, P.V.C., R.S.A. and S.P.A.D.P.; formal analysis, P.V.C., L.J.G.d.F., R.S.A. and S.P.A.D.P.; investigation, P.V.C.; resources, R.S.A. and S.P.A.D.P.; data curation, P.V.C., L.J.G.d.F. and S.P.A.D.P.; writing—original draft preparation, P.V.C.; writing—review and editing, P.V.C., R.S.A. and S.P.A.D.P.; visualization, L.J.G.d.F., R.S.A. and S.P.A.D.P.; supervision, S.P.A.D.P.; project administration, P.V.C. and S.P.A.D.P.; funding acquisition, P.V.C., R.S.A. and S.P.A.D.P. All authors have read and agreed to the published version of the manuscript.

Funding

This research was funded by CNPq (Conselho Nacional de Desenvolvimento Científico e Tecnológico) with the following grants: master’s scholarship to the first author (131133/2019-5), Research Grand to the second author (RSA, 309176/2019-0) and funding support (MCT/CNPq/Universal No. 28/2018, 429756/2018-6). This study was also financed in part by the Coordenação de Aperfeiçoamento de Pessoal de Nível Superior—Brasil (CAPES)—Finance Code 001.

Data Availability Statement

Data available in a publicly accessible repository.

Acknowledgments

The authors thank the Pró-Reitoria de Pesquisa e Pós-Graduação—Universidade Federal do Pará (PROPESP/UFPA) for funding support (EDITAL PAPQ No. 06/2021). We also thank the Graduate Program in Geology and Geochemistry of UFPA (PPGG/UFPA) for the use of its laboratories and the staff of the Laboratory of Mineral Characterization (LCM/UFPA).

Conflicts of Interest

The authors declare no conflict of interest.

References

  1. Angert, A.; Weiner, T.; Mazeh, S.; Tamburini, F.; Frossard, E.; Bernasconi, S.M.; Sternberg, M. Seasonal variability of soil phosphate stable oxygen isotopes in rainfall manipulation experiments. Geochim. Cosmochim. Acta 2011, 75, 4216–4227. [Google Scholar] [CrossRef]
  2. Zimdahl, R.L. Phosphorus Six Chemicals That Changed Agriculture; Elsevier: Amsterdam, The Netherlands, 2015; pp. 73–88. Available online: https://linkinghub.elsevier.com/retrieve/pii/B9780128005613000055 (accessed on 22 June 2021).
  3. Shaddel, S.; Ucar, S.; Andreassen, J.P.; Østerhus, S.W. Engineering of struvite crystals by regulating supersaturation—Correlation with phosphorus recovery, crystal morphology and process efficiency. J. Environ. Chem. Eng. 2019, 7, 102918. [Google Scholar] [CrossRef]
  4. Filippelli, G.M. Phosphorus and Life on a Water World. Geophys. Res. Lett. 2022, 49, e2021GL097346. [Google Scholar] [CrossRef]
  5. Mullen, M.D. Phosphorus in Soils—Biological Interactions. Reference Module in Earth Systems and Environmental Sciences, 2nd ed.; Elsevier: Amsterdam, The Netherlands, 2019. [Google Scholar] [CrossRef]
  6. Veneklaas, E.J. Phosphorus resorption and tissue longevity of roots and leaves—Importance for phosphorus use efficiency and ecosystem phosphorus cycles. Plant Soil 2022, 476, 627–637. [Google Scholar] [CrossRef]
  7. Ruttenberg, K.C. Phosphorus Cycle. Encycl. Ocean. Sci. 2001, 4, 2149–2162. [Google Scholar]
  8. Peng, L.; Dai, H.; Wu, Y.; Peng, Y.; Lu, X. A comprehensive review of phosphorus recovery from wastewater by crystallization processes. Chemosphere 2018, 197, 768–781. [Google Scholar] [CrossRef]
  9. Hanhoun, M.; Montastruc, L.; Azzaro-Pantel, C.; Frèche, M.; Pibouleau, L. Temperature impact assessment on struvite solubility product: A thermodynamic modeling approach. Chem. Eng. J. 2011, 167, 50–58. [Google Scholar] [CrossRef]
  10. Lang, M.; Li, P.; Yan, X. Runoff concentration and load of nitrogen and phosphorus from a residential area in an intensive agricultural watershed. Sci. Total Environ. 2013, 458–460, 238–245. [Google Scholar] [CrossRef]
  11. Capodaglio, A.G.; Muraca, A.; Becchi, G. Accounting for water quality effects of future urbanization: Diffuse pollution loads estimates and control in Mantua’s Lakes (Italy). Water Sci. Technol. 2003, 47, 291–298. [Google Scholar] [CrossRef]
  12. Antonini, S.; Arias, M.A.; Eichert, T.; Clemens, J. Greenhouse evaluation and environmental impact assessment of different urine-derived struvite fertilizers as phosphorus sources for plants. Chemosphere 2012, 89, 1202–1210. [Google Scholar] [CrossRef]
  13. Cordell, D.; Drangert, J.O.; White, S. The story of phosphorus: Global food security and food for thought. Glob. Environ. Change 2009, 19, 292–305. [Google Scholar] [CrossRef]
  14. Lun, F.; Sardans, J.; Sun, D.; Xiao, X.; Liu, M.; Li, Z.; Wang, C.; Hu, Q.; Tang, J.; Ciais, P.; et al. Influences of international agricultural trade on the global phosphorus cycle and its associated issues. Glob. Environ. Change 2021, 69, 102282. [Google Scholar] [CrossRef]
  15. Smil, V. Phosphorus in the Environment: Natural Flows and Human Interferences. Annu. Rev. Energy Environ. 2000, 25, 53–88. [Google Scholar] [CrossRef]
  16. van der Kooij, S.; van Vliet, B.J.M.; Stomph, T.J.; Sutton, N.B.; Anten, N.P.; Hoffland, E. Phosphorus recovered from human excreta: A socio-ecological-technical approach to phosphorus recycling. Resour. Conserv. Recycl. 2020, 157, 104744. [Google Scholar] [CrossRef]
  17. Dawson, C.J.; Hilton, J. Fertiliser availability in a resource-limited world: Production and recycling of nitrogen and phosphorus. Food Policy 2011, 36, S14–S22. [Google Scholar] [CrossRef]
  18. Cordell, D.; Rosemarin, A.; Schröder, J.J.; Smit, A. Towards global phosphorus security: A systems framework for phosphorus recovery and reuse options. Chemosphere 2011, 84, 747–758. [Google Scholar] [CrossRef]
  19. Scholz, R.W.; Ulrich, A.E.; Eilittä, M.; Roy, A. Sustainable use of phosphorus: A finite resource. Sci. Total Environ. 2013, 461–462, 799–803. [Google Scholar] [CrossRef]
  20. Desmidt, E.; Ghyselbrecht, K.; Zhang, Y.; Pinoy, L.; Van der Bruggen, B.; Verstraete, W.; Rabaey, K.; Meesschaert, B. Global phosphorus scarcity and full-scale P-recovery techniques: A review. Crit. Rev. Environ. Sci. Technol. 2015, 45, 336–384. [Google Scholar] [CrossRef]
  21. Muster, T.H.; Douglas, G.B.; Sherman, N.; Seeber, A.; Wright, N.; Güzükara, Y. Towards effective phosphorus recycling from wastewater: Quantity and quality. Chemosphere 2013, 91, 676–684. [Google Scholar] [CrossRef]
  22. Saerens, B.; Geerts, S.; Weemaes, M. Phosphorus recovery as struvite from digested sludge—Experience from the full scale. J. Environ. Manag. 2021, 280, 111743. [Google Scholar] [CrossRef]
  23. Daneshgar, S.; Buttafava, A.; Callegari, A.; Capodaglio, A.G. Simulations and laboratory tests for assessing phosphorus recovery efficiency from sewage sludge. Resources 2018, 7, 54. [Google Scholar] [CrossRef]
  24. Wang, H.; Tian, Z.; Wang, H.; Yan, Q. Optimization and reaction kinetics analysis for phosphorus removal in struvite precipitation process. Water Environ. Res. 2020, 92, 1162–1172. [Google Scholar] [CrossRef] [PubMed]
  25. Tansel, B.; Lunn, G.; Monje, O. Struvite formation and decomposition characteristics for ammonia and phosphorus recovery: A review of magnesium-ammonia-phosphate interactions. Chemosphere 2018, 194, 504–514. [Google Scholar] [CrossRef]
  26. Le Corre, K.S.; Valsami-Jones, E.; Hobbs, P.; Parsons, S.A. Phosphorus recovery from wastewater by struvite crystallization: A review. Crit. Rev. Environ. Sci. Technol. 2009, 39, 433–477. [Google Scholar] [CrossRef]
  27. Ferraris, G.; Fuess, H.; Joswig, W. Neutron diffraction study of MgNH4PO4.6H2O (struvite) and survey of water molecules donating short hydrogen bonds. Acta Crystallogr. Sect. B 1986, 42, 253–258. [Google Scholar] [CrossRef]
  28. Talboys, P.J.; Heppell, J.; Roose, T.; Healey, J.R.; Jones, D.L.; Withers, P.J. Struvite: A slow-release fertiliser for sustainable phosphorus management? Plant Soil 2016, 401, 109–123. [Google Scholar] [CrossRef]
  29. Morita, D.M.; Avila, R.D.L.; Aidar, F.N. Nucleation in the formation of struvite: State of art. Eng. Sanit. E Ambient. 2019, 24, 637–654. [Google Scholar] [CrossRef]
  30. Daneshgar, S.; Buttafava, A.; Capsoni, D.; Callegari, A.; Capodaglio, A.G. Impact of pH and ionic molar ratios on phosphorous forms precipitation and recovery from different wastewater sludges. Resources 2018, 7, 71. [Google Scholar] [CrossRef]
  31. Ravikumar, R.V.S.S.N.; Chandrasekhar, A.V.; Ramakrishna, C.; Reddy, Y. X-ray powder diffraction, thermal analysis and IR studies of zinc ammonium phosphate hexahydrate. Optoelectron. Adv. Mater. Rapid Commun. 2010, 4, 215–219. [Google Scholar]
  32. Kumar, R.; Pal, P. Turning hazardous waste into value-added products: Production and characterization of struvite from ammoniacal waste with new approaches. J. Clean. Prod. 2013, 43, 59–70. [Google Scholar] [CrossRef]
  33. Capdevielle, A.; Sýkorová, E.; Biscans, B.; Béline, F.; Daumer, M.-L. Optimization of struvite precipitation in synthetic biologically treated swine wastewater-Determination of the optimal process parameters. J. Hazard. Mater. 2013, 244–245, 357–369. [Google Scholar] [CrossRef] [PubMed]
  34. Daneshgar, S.; Vanrolleghem, P.A.; Vaneeckhaute, C.; Buttafava, A.; Capodaglio, A.G. Optimization of P compounds recovery from aerobic sludge by chemical modeling and response surface methodology combination. Sci. Total Environ. 2019, 668, 668–677. [Google Scholar] [CrossRef] [PubMed]
  35. Thant Zin, M.M.; Kim, D.J. Struvite production from food processing wastewater and incinerated sewage sludge ash as an alternative N and P source: Optimization of multiple resources recovery by response surface methodology. Process Saf. Environ. Prot. 2019, 126, 242–249. [Google Scholar] [CrossRef]
  36. Box George, E.P.; Hunter, J.S.; Hunter, W.G. Statistics for Experimenters: Design, Innovation, and Discovery, 2nd ed.; Wiley: New York, NY, USA, 2005. [Google Scholar]
  37. Li, B.; Boiarkina, I.; Yu, W.; Huang, H.M.; Munir, T.; Wang, G.Q.; Young, B.R. Phosphorous recovery through struvite crystallization: Challenges for future design. Sci. Total Environ. 2019, 648, 1244–1256. [Google Scholar] [CrossRef]
  38. Polat, S.; Sayan, P. Application of response surface methodology with a Box–Behnken design for struvite precipitation. Adv. Powder Technol. 2019, 30, 2396–2407. [Google Scholar] [CrossRef]
  39. Ebrahimi-Najafabadi, H.; Leardi, R.; Jalali-Heravi, M. Experimental design in analytical chemistry-Part I: Theory. J. AOAC Int. 2014, 97, 3–11. [Google Scholar] [CrossRef] [PubMed]
  40. Ferreira, S.L.C.; Dos Santos, W.N.L.; Quintella, C.M.; Neto, B.B.; Bosque-Sendra, J.M. Doehlert matrix: A chemometric tool for analytical chemistry—Review. Talanta 2004, 63, 1061–1067. [Google Scholar] [CrossRef]
  41. Ouejhani, A.; Hellal, F.; Dachraoui, M.; Lallevé, G.; Fauvarque, J. Application of Doehlert matrix to the study of electrochemical oxidation of Cr(III) to Cr(VI) in order to recover chromium from wastewater tanning baths. J. Hazard. Mater. 2008, 157, 423–431. [Google Scholar] [CrossRef]
  42. Bagal, M.; Patil, S.; Shinde, K.; Singh, S.; Mohod, A. Influence of reaction parameters on oxalic acid crystallization using conventional and ultrasonication: Doehlert matrix. J. Cryst. Growth. 2022, 591, 126717. [Google Scholar] [CrossRef]
  43. Meira, R.C.d.S. Otimização da síntese de estruvita e seus análogos visando a recuperação de fósforo, magnésio, nitrogênio e potássio de águas residuais. PhD. Thesis, Universidade Federal do Pará, Belém, Brazil, 2020. [Google Scholar]
  44. 4500-P PHOSPHORUS; Standard Methods For the Examination of Water and Wastewater. American Public Health Association: Washington, DC, USA, 2018. [CrossRef]
  45. Gražulis, S.; Chateigner, D.; Downs, R.T.; Yokochi, A.F.T.; Quirós, M.; Lutterotti, L.; Manakova, E.; Butkus, J.; Moeck, P.; Le Bail, A. Crystallography Open Database—An open-access collection of crystal structures. J. Appl. Crystallogr. 2009, 42, 726–729. [Google Scholar] [CrossRef]
  46. Mathew, M.; Schroeder, L.W. Crystal structure of a struvite analogue, MgKPO4.6H2O. Acta Crystallogr. B 1979, 35, 11–13. [Google Scholar] [CrossRef]
  47. Meira, R.C.d.S.; Paz, S.P.A.d.; Corrêa, J.A.M. XRD-Rietveld analysis as a tool for monitoring struvite analog precipitation from wastewater: P, Mg, N and K recovery for fertilizer production. J. Mater. Res. Technol. 2020, 9, 15202–15213. [Google Scholar] [CrossRef]
  48. Huang, H.; Xiao, D.; Liu, J.; Hou, L.; Ding, L. Recovery and removal of nutrients from swine wastewater by using a novel integrated reactor for struvite decomposition and recycling. Sci. Rep. 2015, 5, srep10183. [Google Scholar] [CrossRef] [PubMed]
  49. Abbona, F.; Madsen, H.E.L.; Boistelle, R. The initial phases of calcium and magnesium phosphates precipitated from solutions of high to medium concentrations. J. Cryst. Growth 1986, 74, 581–590. [Google Scholar] [CrossRef]
  50. Musvoto, E.V.; Wentzel, M.C.M.; Ekama, G.A.M. Integrated chemical-physica process modelling-II. Simulating Aeration Treat. Anaerob. Dig. Supernatants 2000, 34, 1868–1880. [Google Scholar]
  51. Crutchik, D.; Garrido, J.M. Struvite crystallization versus amorphous magnesium and calcium phosphate precipitation during the treatment of a saline industrial wastewater. Water Sci. Technol. 2011, 64, 2460–2467. [Google Scholar] [CrossRef]
  52. Hu, L.; Yu, J.; Luo, H.; Wang, H.; Xu, P.; Zhang, Y. Simultaneous recovery of ammonium, potassium and magnesium from produced water by struvite precipitation. Chem. Eng. J. 2020, 382, 123001. [Google Scholar] [CrossRef]
  53. Stefov, V.; Šoptrajanov, B.; Kuzmanovski, I.; Lutz, H.; Engelen, B. Infrared and Raman spectra of magnesium ammonium phosphate hexahydrate (struvite) and its isomorphous analogues. III. Spectra of protiated and partially deuterated magnesium ammonium phosphate hexahydrate. J. Mol. Struct. 2005, 752, 60–67. [Google Scholar] [CrossRef]
  54. Chauhan, C.K.; Joshi, M.J. In vitro crystallization, characterization and growth-inhibition study of urinary type struvite crystals. J. Cryst. Growth. 2013, 362, 330–337. [Google Scholar] [CrossRef]
  55. Suryawanshi, V.B.; Chaudhari, R.T. Synthesis and Characterization of Struvite-k Crystals by Agar Gel. J. Cryst. Process Technol. 2014, 4, 212–224. [Google Scholar] [CrossRef]
  56. Cahil, A.; Najdoski, M.; Stefov, V. Infrared and Raman spectra of magnesium ammonium phosphate hexahydrate (struvite) and its isomorphous analogues. IV. FTIR spectra of protiated and partially deuterated nickel ammonium phosphate hexahydrate and nickel potassium phosphate hexahydrate. J. Mol. Struct. 2007, 834–836, 408–413. [Google Scholar] [CrossRef]
  57. Wei, L.; Hong, T.; Hu, Z.; Luo, L.; Zhang, Q.; Chen, T. Modeling surface acid-base properties of struvite crystals synthesized in aqueous solution. Colloids Surf. A Physicochem. Eng. Asp. 2018, 553, 237–243. [Google Scholar] [CrossRef]
  58. Campos, P.V.; Albuquerque, A.R.L.; Angélica, R.S.; Paz, S. FTIR spectral signatures of amazon inorganic phosphates: Igneous, weathering, and biogenetic origin. Spectrochim. Acta A Mol. Biomol. Spectrosc. 2021, 251, 119476. [Google Scholar] [CrossRef] [PubMed]
  59. Zhang, S.; Shi, H.S.; Huang, S.W.; Zhang, P. Dehydration characteristics of struvite-K pertaining to magnesium potassium phosphate cement system in non-isothermal condition. J. Therm. Anal. Calorim. 2013, 111, 35–40. [Google Scholar] [CrossRef]
  60. Frost, R.; Weier, M.; Erickson, K. Thermal decomposition of struvite. J. Therm. Anal. Calorim. 2004, 76, 1025–1033. [Google Scholar] [CrossRef]
  61. Bhuiyan, M.I.H.; Mavinic, D.S.; Koch, F.A. Thermal decomposition of struvite and its phase transition. Chemosphere 2008, 70, 1347–1356. [Google Scholar] [CrossRef]
  62. Farhana, S. Thermal decomposition of Struvite: A Novel Approach to Recover. Ammonia from Wastewater Using. Struvite Decomposition Products. Ph.D. Thesis, The University of British Columbia, Vancouver, BC, Canada, 2015. [Google Scholar]
  63. Abdelrazig, B.E.I.; Sharp, J.H. Phase changes on heating ammonium magnesium phosphate hydrates. Thermochim. Acta 1988, 129, 197–215. [Google Scholar] [CrossRef]
  64. Hövelmann, J.; Stawski, T.M.; Besselink, R.; Freeman, H.M.; Dietmann, K.M.; Mayanna, S.; Pauw, B.R.; Benning, L.G. A template-free and low temperature method for the synthesis of mesoporous magnesium phosphate with uniform pore structure and high surface area. Nanoscale 2019, 11, 6939–6951. [Google Scholar] [CrossRef]
  65. Kozik, A.; Hutnik, N.; Piotrowski, K.; Mazienczuk, A.; Matynia, A. Precipitation and Crystallization of Struvite from Synthetic Wastewater under Stoichiometric Conditions. Adv. Chem. Eng. Sci. 2013, 3, 20–26. [Google Scholar] [CrossRef]
  66. Bayuseno, A.P.; Perwitasari, D.S.; Muryanto, S.; Tauviqirrahman, M.; Jamari, J. Kinetics and morphological characteristics of struvite (MgNH4PO4.6H2O) under the influence of maleic acid. Heliyon 2020, 6, e03533. [Google Scholar] [CrossRef]
  67. Lazic, Z. Design of Experiments in Chemical Engineering: A Practical Guide; John Wiley & Sons: New York, NY, USA, 2004. [Google Scholar]
Figure 1. Diffractometric patterns of the precipitates obtained according to the experimental Plackett–Burman design. (a) Runs 1, 3, 4, 8, 10, and 12. (b) Runs 2, 5, 6, 7, 9, and 11. Abbreviations: Stv: struvite; K-Stv: K-struvite; Bob: Bobierrite; Bru: brucite.
Processes 11 02664 g001
Figure 2. XRD patterns of the products obtained in experiments 2 and 8 according to the Doehlert Matrix design. Abbreviations: Stv: struvite; K-Stv: K-struvite.
Processes 11 02664 g002
Figure 3. Infrared spectra obtained for experiments 3 and 7 according to the Doehlert Matrix design.
Processes 11 02664 g003
Figure 4. DSC-TG curves of the products obtained in runs (a) no. 1—group 1, (b) no. 2—group 2, and (c) no. 6—group 3.
Processes 11 02664 g004
Figure 5. Particle size distributions: (a) Run 2, (b) Run 7.
Processes 11 02664 g005
Figure 6. Micrographs of the products obtained by precipitation. (ac): Run 2; (df): Run 7.
Processes 11 02664 g006
Figure 7. 3D response surfaces indicating the effects of the input parameters (pH, N/P, and Pinitial) on phosphorus recovery (ac) and the enthalpy of the endothermic peak of struvite degradation (df).
Processes 11 02664 g007
Figure 8. Profiles of the desirability function for the simultaneous optimization of responses.
Processes 11 02664 g008
Table 1. Factors and experimental domain.
Coded Factor (Xi)FactorExperimental Field U i ¯ ΔUi
Lower LimitUpper Limit
X1U1: pH911100.5
X2U2: N/P142.50.5
X3U3: Pinitial (mg/L)6025015595
Table 2. PB-12 design matrix.
Run *Natural UnitsCoded UnitsResponse
X1X2X3X4X5X6X7X8X1X2X3X4X5X6X7X8Prec (%)
1(6)3109311no503001−11−1−1−11156.8
2(1)3101112.51no1530011−11−1−1−1190.3
3(4)7811312no15100−111−11−1−1−163.3
4(12)310932.51yes151001−111−11−1−198.2
5(10)3101112.52no5010011−111−11−186.1
6(3)31011312yes15300111−111−1199.4
7(7)781132.51yes50100−1111−111−198.3
8(11)78932.52no50300−1−1111−11142.8
9(9)78912.52yes15300−1−1−1111−1195.3
10(5)3109112yes501001−1−1−1111−189.2
11(2)7811111yes50300−11−1−1−111196.9
12(8)789111no15100−1−1−1−1−1−1−1−171.1
* The numbers in parentheses indicate the order of the experiments.
Table 3. Diffractometric data of struvite: d111 (4.25 Å).
RunFWHM *Intensity (cts)Area (cts.°2θ)
10.094747.8977.1
30.107940.62104.4
40.095485.2241.3
80.0981668.9174.6
100.0867248.0215.9
120.1311740.5200.2
* Full width at half maximum.
Table 4. Analysis of the main effects of the PB-12 design variables.
FactorEffectStd. Errorp-ValueF-Value
P concentration (X1)8.67682.5907490.044087 *11.2168
pH (X2)13.49282.5907490.013760 *27.1239
N/P (X3)−11.66352.5907490.020466 *20.2679
Mg/P (X4)5.73612.5907490.1136704.9021
K/P (X5)−5.92522.5907490.1062445.2306
Ca (X6)27.84292.5907490.001723 *115.4989
Time (X7)−7.91252.5907490.0552489.3277
Mixing rate (X8)−4.13632.5907490.2086422.5490
* p < 0.05 (Statistically significant values).
Table 5. Doehlert experiment matrix and response Prec (%).
Run *Natural UnitsCoded UnitsResponse
pHN/PPinitialX1X2X3Prec (%)
1(4)112.515510055.9
2(2)10.541550.50.866074.8
3(9)10.532500.50.2890.81774.7
4(5)92.5155−10041.5
5(8)9.51155−0.5−0.866035.8
6(10)9.5260−0.5−0.289−0.81730.2
7(7)10.511550.5−0.866052.3
8(12)10.52600.5−0.289−0.81731.6
9(11)9.54155−0.50.866065.8
10(15)103.56000.577−0.81751.5
11(3)9.53250−0.50.2890.81767.9
12(1)101.52500−0.5770.81765.6
13(6)102.515500064.1
14(14)102.515500067.4
15(13)102.515500063.2
* The numbers in parentheses indicate the order of the experiments.
Table 6. Chemical composition of the Doehlert design products by XRF (mass%).
ComponentsRuns
12345678910111213
P2O546.348.248.051.050.249.749.048.351.049.850.747.849.9
MgO30.125.525.426.826.226.130.227.227.126.427.025.626.1
K2O12.89.489.213.4910.25.7915.312.42.636.053.4510.68.53
LOI10.416.817.018.613.318.35.211.719.117.618.815.915.4
(LOI) loss on ignition at 1000 °C.
Table 7. Losses of mass and enthalpies of decomposition of the products obtained in the Doehlert design.
RunΔm (%)ΔH (J·g−1)
144.07895
247.981078
348.601029
449.941103
544.961057
648.201081
741.07823
843.66918
949.651061
1048.811076
1149.291015
1247.871054
1347.211076
1450.701051
1551.461071
Table 8. ANOVA results for the of operational variables in each response variable.
Phosphorus RecoveryEnthalpy Variation
SourcedfSSMSFpSSMSFp
X11240.816240.81624.24380.004383 *9.775449.775444237.45970.004185 *
X121320.330320.33032.24880.002358 *1.404601.40459834.11970.028080 *
X21917.223917.22392.34000.000207 *4.121604.121599100.11960.009841 *
X22129.14929.1492.93450.1473791.131501.13149727.48570.034510 *
X311497.5891497.589150.76740.000063 *0.029760.0297600.72290.484741
X321181.562181.56218.27850.007899 *0.177690.1776914.31640.173343
X1 X2114.00014.0001.40940.2884754.175814.175813101.43650.009715 *
X1 X3114.13014.1301.42250.2865010.464360.46436311.28010.078372
X2 X3125.57325.5732.57450.1695020.821890.82189019.96490.046614 *
Lack of fit339.40613.1352.56060.2932570.688410.2294715.57420.155876
Pure error210.259 0.082330.041167
Total143190.441 23.96243
(df) degree of freedom, (SS) sum of square, (MS) mean square, (F) Fischer test, (p) significance probability. * p < 0.05 (Statistically significant values).
Table 9. Parameters assumed in the global desirability function.
Response VariablesParameters Assumed in Optimization
LowMediumHighst
Prec (%)105510025
ΔH (J·g−1)822.8962.9110325
s and t = exponents inserted for determining the importance of the function.
Disclaimer/Publisher’s Note: The statements, opinions and data contained in all publications are solely those of the individual author(s) and contributor(s) and not of MDPI and/or the editor(s). MDPI and/or the editor(s) disclaim responsibility for any injury to people or property resulting from any ideas, methods, instructions or products referred to in the content.

