Article

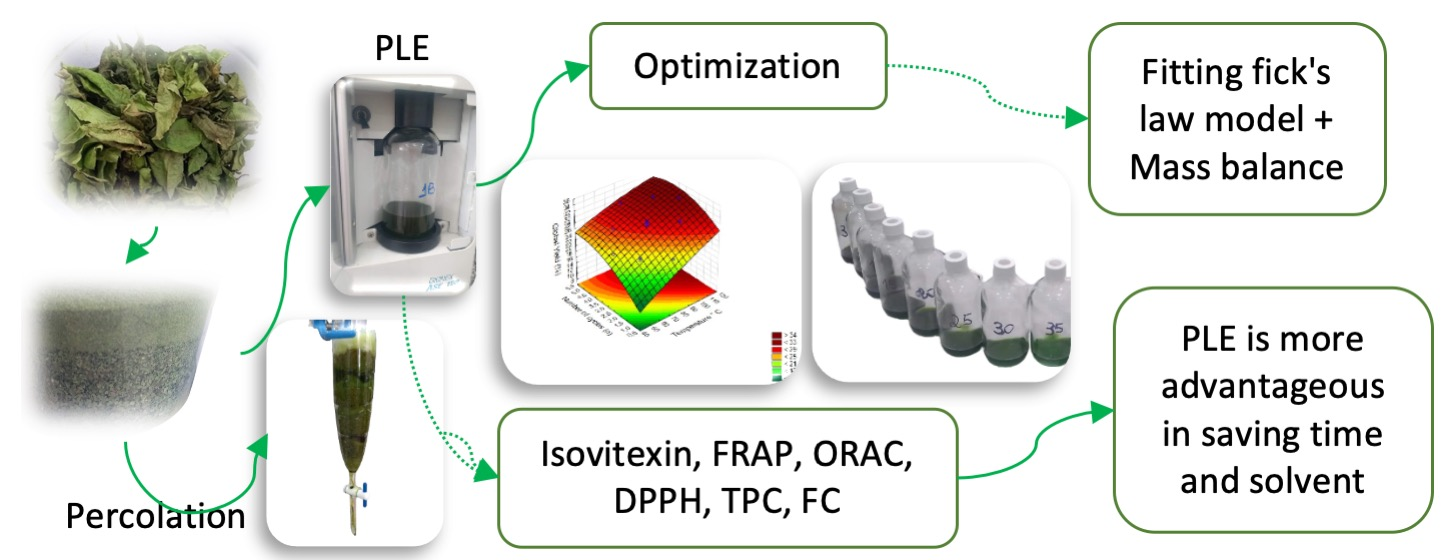
Pressurized Liquid Extraction (PLE) in an Intermittent Process as an Alternative for Obtaining Passion Fruit (Passiflora edulis) Leaf Hydroalcoholic Extract (Tincture)

by
Larissa da Cunha Rodrigues
1,
Renata Barbosa Bodini
1,
Fernando de Lima Caneppele
2,
Gustavo César Dacanal
3,
Eduardo José Crevelin
4,
Luiz Alberto Beraldo de Moraes
4 and
Alessandra Lopes de Oliveira
1,*
1
Laboratory of High Pressure Technology and Natural Products, University of São Paulo (USP), Av. Duque de Caxias Norte, 225, Pirassununga 13635-900, Brazil
2
Energy and Simulation in Biosystems Engineering and Agribusiness, University of São Paulo (USP), Av. Duque de Caxias Norte, 225, Pirassununga 13635-900, Brazil
3
Laboratory of Fluid Dynamics and Characterization of Particulate Systems, Faculty of Animal Science and Food Engineering, University of São Paulo (USP), Av. Duque de Caxias Norte, 225, Pirassununga 13635-900, Brazil
4
Mass Spectrometry Laboratory, Department of Chemistry, Faculty of Philosophy, Sciences and Languages of Ribeirão Preto, University of São Paulo (USP), Av. Bandeirantes, 3900 Monte Alegre, Ribeirão Preto 14015-130, Brazil
*
Author to whom correspondence should be addressed.
Processes 2023, 11(8), 2308; https://doi.org/10.3390/pr11082308
Submission received: 10 March 2023 / Revised: 25 April 2023 / Accepted: 26 April 2023 / Published: 1 August 2023
(This article belongs to the Special Issue Green Separation and Purification Processes)

Abstract

:
Tinctures are medicinal plant extracts obtained by extraction with a hydroalcoholic solution (70%) by percolation (PER). This process takes about 26 h to prepare, in addition to using a large amount of solvent. In our research, passion fruit leaf tinctures were obtained using extract with the same pressurized hydroalcoholic solution as in an intermittent process. The objective was to demonstrate that this emerging technology can be economical and profitable. An optimization using Central Composite Rotatable Design (CCRD) was performed to evaluate the influence of process variables on the yields and compositions of the extracts. The temperature (T) was the factor that most influenced the responses. Extraction with pressurized liquid (PLE) provided total yields and total phenolic and flavonoid contents in greater amounts than PER. The optimized conditions of the process variables studied in the CCRD for the highest content of total phenolics (43.2 mg GAE/g) and flavonoids (58.8 mg QE/g) were at 100 °C with a rinse volume of 120% of the divided extractor volume in four cycles of the intermittent process. When adjusting the PLE in an intermittent process, and according to the one-dimensional mass transfer by the continuous diffusion of the Fick model, the effective diffusion coefficient (1.28 × 10⁻¹² m2/s) was not affected by T. The kinetic curve of PLE extraction indicates that the adjusted intermittent process occurred in the period of the constant extraction rate when compared to the kinetics of the semi-continuous process. The yielded extracts were rich in isovitexin, and the highest levels were identified in the extracts obtained via PLE, indicating that this intermittent process can bring a product to market with the same quality but with a much shorter production time and the use of fewer solvents. Antioxidant activity, determined by DPPH, FRAP and ORAC, was also higher in extracts obtained via PLE.

Graphical Abstract

1. Introduction

Pressurized Liquid Extraction (PLE), also known as accelerated solvent extraction, consists of an extraction method that applies high pressures and temperatures to extract organic compounds. This technique has the advantage of not degrading thermally sensitive compounds since the extraction time is much shorter than that of conventional methods, such as percolation (PER) or Soxhlet extractions [1]. Several studies have shown that the PLE technique is more efficient due to the reduced solvent consumption and extraction time [2,3,4,5,6].
This technology is widely applied for obtaining extracts enriched with bioactive compounds [7,8,9,10,11,12,13,14,15,16,17]. PLE has been shown to be better than Supercritical Fluid Extraction for removing the lipid portion of Passiflora ligularis seeds [9].
The World Health Organization (WHO) values the use of plants for medicinal and therapeutic purposes [18]. In this context, the PLE of passion fruit (Passiflora edulis Sims) leaves has become a topic of interest because the tincture obtained from this plant has significant relevance in phytotherapy due to its anxiolytic and sedative activity [19,20,21,22] and anti-inflammatory properties [23,24,25].
The main flavonoid in the ethanolic and aqueous extract responsible for anxiolytic and sedative activity is isovitexin [22,26,27]. In the aqueous extract of P. edulis leaves, da Silva et al. [27] obtained a concentration of 0.50 ± 0.04 mg/g of isovitexin. The flavonoid isovitexin from Passiflora leaves extract has been studied for its anti-inflammatory activity [28] and its ability to reduce blood glucose levels [22,29]. It can also be used to treat colorectal cancer [30] and type II diabetes [31,32]. This tincture is generally obtained by percolation, an extraction process that requires more than 24 h to perform [18]. There have been few applications for the PLE of passion fruit leaves [33,34], although its use is an innovative technological method for obtaining greater yields and promoting solvent and energy savings in the industry. In addition, the scaling-up of this process to an industrial level may be useful for extracting other plant sources.
Several parameters, such as the static contact time (sT) between the solid and the solvent in the fixed bed extractor, the temperature (T), the pressure, the solvent volume and the number of cycles used [35], can directly affect the extract yield of the PLE operating intermittently. The solvent rinse volume (SV) is the percentage of the cell extraction volume/number of cycles (N) during which the equipment rinses the sample. The optimization and choice of the best parameters for the passion fruit leaf extract production process by PLE can be performed according to the Central Composite Rotatable Design (CCRD), which is a highly efficient planning method that allows for adaptation to a second-order model [36] that can be used to obtain the best experimental conditions.
Concomitantly with the use of extractions to optimize specific processes, studies on process modeling have also arisen. Rosa et al. [37] modeled a semi-continuous extraction process using pressurized liquid, while Colivet, Oliveira and Carvalho [38] designed an intermittent process for cycles of the PLE process. The modeling of this process is crucial for its development and scale-up because it enables the determination of highly important parameters, such as the effective diffusivity coefficient [39]. Colivet, Oliveira and Carvalho [38] also demonstrated that variations in the size of the extraction cell (34, 66 and 100 mL) did not influence the overall yield when the sample mass/volume of the solvent (S/F) stored in the extraction cell ratio was maintained constant. The extraction kinetic curves allow for the application of mathematical models to unravel thermodynamic limitations of the process. Generally, the highest amount of the extract is obtained in the constant extraction rate (CER) period, which makes such extraction processes advantageous due to the reduced extraction time [39,40].
According to the Brazilian Pharmacopoeia Herbal Medicine Form [18], the conventional process of extracting tinctures from plant leaves (percolation) is slow and may exceed 24 h, a fact that renders it industrially unfeasible. In addition, the lengthy time of exposure to the solvent and/or light can degrade some compounds [5]. Conventional methods include maceration, decoction, percolation, infusion and soxhlet, and these methods always use large amounts of solvent and take a long time despite being easy techniques to apply [41]. Long extraction times reduce the annual number of batches produced, which reduces industrial productivity, in addition to generating higher costs for the final product [16]. Given this, the present study aimed to demonstrate that PLE with intermittent extract purging can be a much more efficient industrial process for obtaining passion fruit leaf tinctures.
Specifically, the objectives of this study were to determine the optimal conditions of extraction compared to those recommended by the Brazilian Pharmacopoeia and to model the extraction kinetics, which is an essential step for further studies on scaling up for future industrial applications.

2. Material and Methods

2.1. Material

Passion fruit (Passiflora edulis) leaves were obtained by donations and collected at the Sítio Três Palmeiras farm in Analândia, São Paulo, Brazil (22°10′45.9″ South and 47°42′56.9″ West, at around 800 m above sea level). They were harvested on 28 October and 25 November 2019, between 8:00 am and 9:30 am. The leaves were identified by Professor Dr. Andreia Alves Rezende from the Department of Biology and Animal Sciences of the School of Natural Sciences and Engineering of the State University of São Paulo (UNESP), in Ilha Solteira. The witnessed material was deposited in the Institution’s Herbarium (HISA), under registration number 10,921.
According to the passion fruit farmer, the seeds were purchased from Viveiros Flora Brasil, which sells the species P. edulis Sims f. flavicarpa Deg, cultivars FB300 and FB200. After harvesting the branches, the leaves were transported to the High-Pressure Technology and Natural Products Laboratory (LTAPPN) of the Faculty of Animal Sciences and Food Engineering (FZEA) of the University of São Paulo (USP) in Pirassununga. The leaves were separated from the branches and then dried in an air-circulating oven (MARCONI MA035/5, Piracicaba, Brazil) at 45 °C for 48 h. After drying, the leaves were ground and sieved with a No. 10 mesh sieve (Bertel Indústria Metalúrgica Ltda., Caieiras, Brazil) to obtain smaller-sized leaf particles. Next, the leaf particles were stored in a freezer at −18 °C in the absence of light and in water-impervious material.
The solvents used in the extraction process were alcohol (PA ACS, 99.5% purity), obtained from Êxodo Científica (Sumaré, Brazil), and ultrapure water (Milli-Q®). The reagents Folin-Ciocalteu phenol solution (2 M) and anhydrous gallic acid (99% purity) were also acquired from Êxodo Científica (Sumaré, Brazil), while anhydrous sodium carbonate (Na2CO3), sodium nitrite (PA ACS, NaNO2), sodium carbonate (Na2CO3) and sodium hydroxide (NaOH) were purchased from Synth (Diadema, Brazil). Aluminum chloride (AlCl3.6H2O) was obtained from Êxodo Científica (Hortolândia, Brazil), and quercetin (>95% purity) was purchased from Sigma-Aldrich (Cotia, Brazil).

2.2. Characterization of the Raw Material

Bromatological analyses, such as the determination of the lipid fraction (AOAC method 920.39B), protein content (AOAC method 955.04), moisture (AOAC method 934.01), ash (AOAC method 900.02) and simple carbohydrates and crude fiber (AOAC method 931.02 and 930.10, respectively), were carried out according to the methods recommended by the Association of Official Agricultural Chemists (AOAC) [42]. All procedures described in this section were performed in triplicate.
In order to establish the average particle diameter size of the passion fruit leaves, a set of sieves from the Tyler series was used. A known mass of 107.03 g of particles was deposited onto the sieves, which were placed on a vibrating device (Bertel Indústria Metalúrgica Ltda., Caieiras, Brazil) that shook for 10 min until the particles were distributed through the sieves according to the aperture size. The mass retained in each sieve was determined, as was the average particle diameter size, according to Equation (1) (Sauter mean diameter), where Di = (d(N−1) + di)/2, with di representing the aperture diameter of the i-th sieve (mm), d(N−1) corresponding to the nominal aperture of the sieve immediately below di (mm) and xi being the mass fraction of the particles retained in the i-th sieve.
d p s = 1 j = 1 n x i D i
The real density (ρr) was determined at the Chemistry Institute of the State University of Campinas—UNICAMP (São Paulo, Brazil) using a helium gas pycnometer (Ultrapyc 1200e, Quantachrome, Boynton Beach, FL, USA). Meanwhile, the apparent density (ρa) was calculated by the ratio between the mass of the passion fruit leaves and the volume of the extraction cell. The porosity of the fixed bed extractor (34 cm3) (ε) was estimated based on Equation (2), where ρa represents the apparent density and ρr is the real density.
ε = 1 ρ a ρ r
From the preparation and characterization of the raw material, the experiment proceeded to the optimization of the extraction process via PLE, process modeling and extract characterization.

2.3. Experimental Design

A central composite rotational design (CCRD) was selected to evaluate the PLE process variables, with the static time variable (St) set at 6 min, the pressure set at 10.3 MPa, the nitrogen purging time set at 100 s and the extraction cell volume set at 34 cm3. The CCRD included 17 tests, 3 central points and 6 axials, with an alpha value equal to ±1.673. The levels used in the experimental design and their respective values are shown in Table 1. It is noteworthy that, due to equipment-related limitations, the temperatures, the number of cycles and the percentages of rinse volume presenting decimal numbers were replaced by values corresponding to the nearest whole number, i.e., the temperatures 46.6 °C and 113.4 °C were replaced by 47 °C and 113 °C, respectively; the solvent percentages of 66.6% and 133.4% were replaced by 67% and 133%, respectively and the number of cycles 1.33 and 4.57 were replaced by 1 and 5, respectively. The wide range of values used were chosen based on preliminary tests, based on the experiments carried out by Oliveira et al. [35].
The process variables analyzed in the experimental design (Table 1) were the rinse solvent volume in each cycle (% SV), which were presented as a percentage of extractor volume (34 mL), the number of cycles (N) and the temperature (T). The solvent volume (SV) is the percentage of cell extraction volume used by the equipment to rinse the sample, and the number of cycles (N) corresponds to the number of times that the equipment rinses the sample packed in the fixed bed extractor. The selection of these variables was based on previous findings (screening). The independent variables fluctuated from 47 to 113 °C for T, from 67 to 133% of 34 mL for SV and from 1 to 5 for N. In turn, the dependent variables analyzed were the global yield (X0), total phenolic content (TPC) and flavonoid content (FC) in the obtained extracts, as well as the energy consumption (EC). A complete first- and second-order polynomial model was used to fit the responses to the experimental data obtained (Equation (3)).
Y =   β 0 + β 1 x 1 + β 2 x 2 + β 3 x 3 + β 12 x 1 x 2 + β 13 x 1 x 3 + β 23 x 3 x 2 +   β 11 x 1 2 + β 22 x 2 2 + β 33 x 3 2
where Y is the dependent variable (response) (X0, TPC, FC, and EC), β0 is a constant coefficient of the models and x 1 , x 2 and x 3 represent the independent variables. Each β i value indicates a regression coefficient predicted in this model.
The CCRD results were analyzed using the Statistica program (StatSoft, Inc., v.13.0, Tulsa, OK, USA) to identify the effects of process variables on the responses of interest. In order to verify the goodness-of-fit of the statistical model, analysis of variance (ANOVA) was performed with a 95% confidence interval to determine the effect of each variable. For high-quality adjustments, the response surface method was applied to assess the best operating conditions, after which the model was validated.

2.4. Extraction of Passiflora Leaves

2.4.1. Percolation Extraction (PER)

In the production of tincture by the conventional method, approximately 7 g of Passiflora leaves were moistened in a sufficient amount (mL) of 70% ethanol (v/v) and left to rest in a closed container. After 2 h, the mixture was transferred to a percolator, whose bottom was previously lined with cotton in overlapping layers. The surfaces between the layers were covered with cotton, on which glass beads were scattered. The ethanol was slowly poured into the device until the air between the particles was eliminated. After 24 h of rest, ethanol was constantly added until a volume of approximately 70 mL of extract was collected. The extractions were performed in triplicate according to the Brazilian Pharmacopoeia Phytotherapy Form [18].

2.4.2. PLE in the Intermittent Process

The PLE was performed in a Dionex ASE 150 system (Thermo Fisher Scientific, Newington, CT, USA) using 70% ethanol solution (v/v), the recommended concentration specified by the Brazilian Pharmacopoeia Herbal Medicine Form [18]. This solution was chosen because, in addition to being a mixture of biocompatible, renewable and low-cost solvents [43], previous studies have proven that the ideal extraction of polyphenols uses ethanol and water solutions at a percentage between 50 and 70% [33,44,45]. The extraction cell (34 cm3) was filled with ground passion fruit leaves (7 g), and the analyzed process parameters included: solvent volume (SV), number of cycles (N) and temperature (T), whose values are specified in the experimental design (Table 1). Other parameters, such as static time (St = 6 min), pressure (P = 10.3 MPa) and nitrogen purging time (tP = 100 s), were maintained constant throughout the extraction process.
PLE is an exhaustive extraction in which the total solvent volume is composed of the solvent used to fill the empty spaces in the extractor until the process pressure and temperature are reached plus the rinse volume used in each cycle. The total rinse volume is defined as a function of the extractor volume, which is divided by the number of cycles. For example, if 100% of the extractor volume of 2 L is used as the rinse volume (SV) in a process with four cycles (C), then in each cycle, 500 mL of the solvent will be used, which enters the extractor as the extract is purged at the end of each cycle.
The global yields (X0, %) were determined by the ratio between the obtained dry mass and the initial mass of the raw material. Following extraction, the extracts were submitted to evaporation at 50 °C in a roto-evaporator (MARCONI, MA-120, Piracicaba, Brazil) to reduce the solvent volume. Afterward, they were placed in an oven at 105 °C for 24 h to obtain the mass of dry solids extracted.

2.5. Total Phenolic Content (TPC)

The TPC of the tinctures obtained by PLE and PER was evaluated according to the method described by Singleton and Rossi [46]. Aliquots of gallic acid solution were used to construct the standard curve. Initially, 100 μL of plant extract (approximately 33 mg/mL) was diluted in 70% ethanol (v/v) in a 10 mL volumetric flask. In 0.5 mL of the diluted sample, 2.5 mL of Folin-Ciocalteu reagent diluted in distilled water at a proportion of 1/10 (v/v) was added. The mixture was stirred and left to rest for 8 min at room temperature before adding 2 mL of saturated Na2CO3 solution diluted in distilled water at a concentration of 7.5% (w/v). The mixture was vortexed and left to rest in a dark environment for 2 h, after which the absorbance was measured using a spectrophotometer (Thermo Scientific, Genesys 10S UV-VIS) at a wavelength of 765 nm. The 70% ethanol solution was used as a blank. All tests were performed in triplicate and expressed in Gallic Acid Equivalents (GAE) per gram of dry leaves. The standard curve was constructed using concentrations of 4.59, 9.19, 18.37, 36.75, 73.50 and 91.87 µg of gallic acid/mL.

2.6. Flavonoid Content (FC)

The flavonoid’s analysis was carried out according to the methodology described by Zhishen, Mengcheng and Jianming [47] and Kim, Jeong and Lee [48]. One-milliliter aliquots containing diluted quercetin solutions were used to construct the standard curve. Initially, 1 mL of extract (approximately 33 mg/mL) in 70% ethanol (v/v) was added to a test tube containing 4 mL of distilled water. At time zero, 0.3 mL of NaNO2 solution (5% w/v) was added to the tube. After 5 min, 0.3 mL of AlCl3 solution (10% w/v) was added, and after 1 min, 2 mL of NaOH solution (1 M) was also added. After vortexing the mixture, 2.4 mL of distilled water was added, followed by another round of vortexing. The absorbance of the mixture was determined using a spectrophotometer (Thermo Scientific, Genesys 10S UV-VIS) at a wavelength of 510 nm, and the results were expressed in quercetin equivalents (QE) per gram of dry leaves. For the standard curve, concentrations of 50, 100, 200, 400, 600 and 800 µg of quercetin/mL were used.

2.7. Monitoring Energy Consumption (EC)

The monitoring of energy consumption throughout the extraction process was carried out with an SAGA 4000 analyzer, used to measure electrical quantities and energy quality. This device was connected to the energy network that supplied the equipment, or more precisely, the pump and steam generator. Measurements were taken by means of digital acquisition of electrical parameters and real-time numerical processing. The electrical quantities, monitored non-intrusively, included the voltage, current, frequency, active power, reactive power, apparent power and power factor. These data were collected every 2 s. Since the SAGA 4000 device is incapable of accurately analyzing small amounts of energy, such as those consumed by the laboratory equipment used, it considered all the power measurements collected every 2 s. By integrating all of the measurements (the entirety of the power area over time), it was possible to calculate the energy consumption for each test using the PLAWIN 4500 software.

2.8. Mathematical Modeling of Extraction Kinetics

This work considered two case studies of the mathematical modeling of extraction kinetics. Case study 1 assumed the analytical model of Fick’s Second Law for spheres, which concerns the physics of one-dimensional mass transfer by continuous diffusion. In addition, case study 1 also evaluated the period of the constant extraction rate combined with the diffusion model.
Case study 2 considered the extraction by an intermittent process (extract purge in each cycle). The mathematical model applied in case 2 assumed the sequential batches of the analytical model of Fick’s Second Law. The Levenberg–Marquardt optimization method was chosen to perform the least squares regression analysis by applying Equation (5), using the Mathematica Wolfram Software v.11.2.

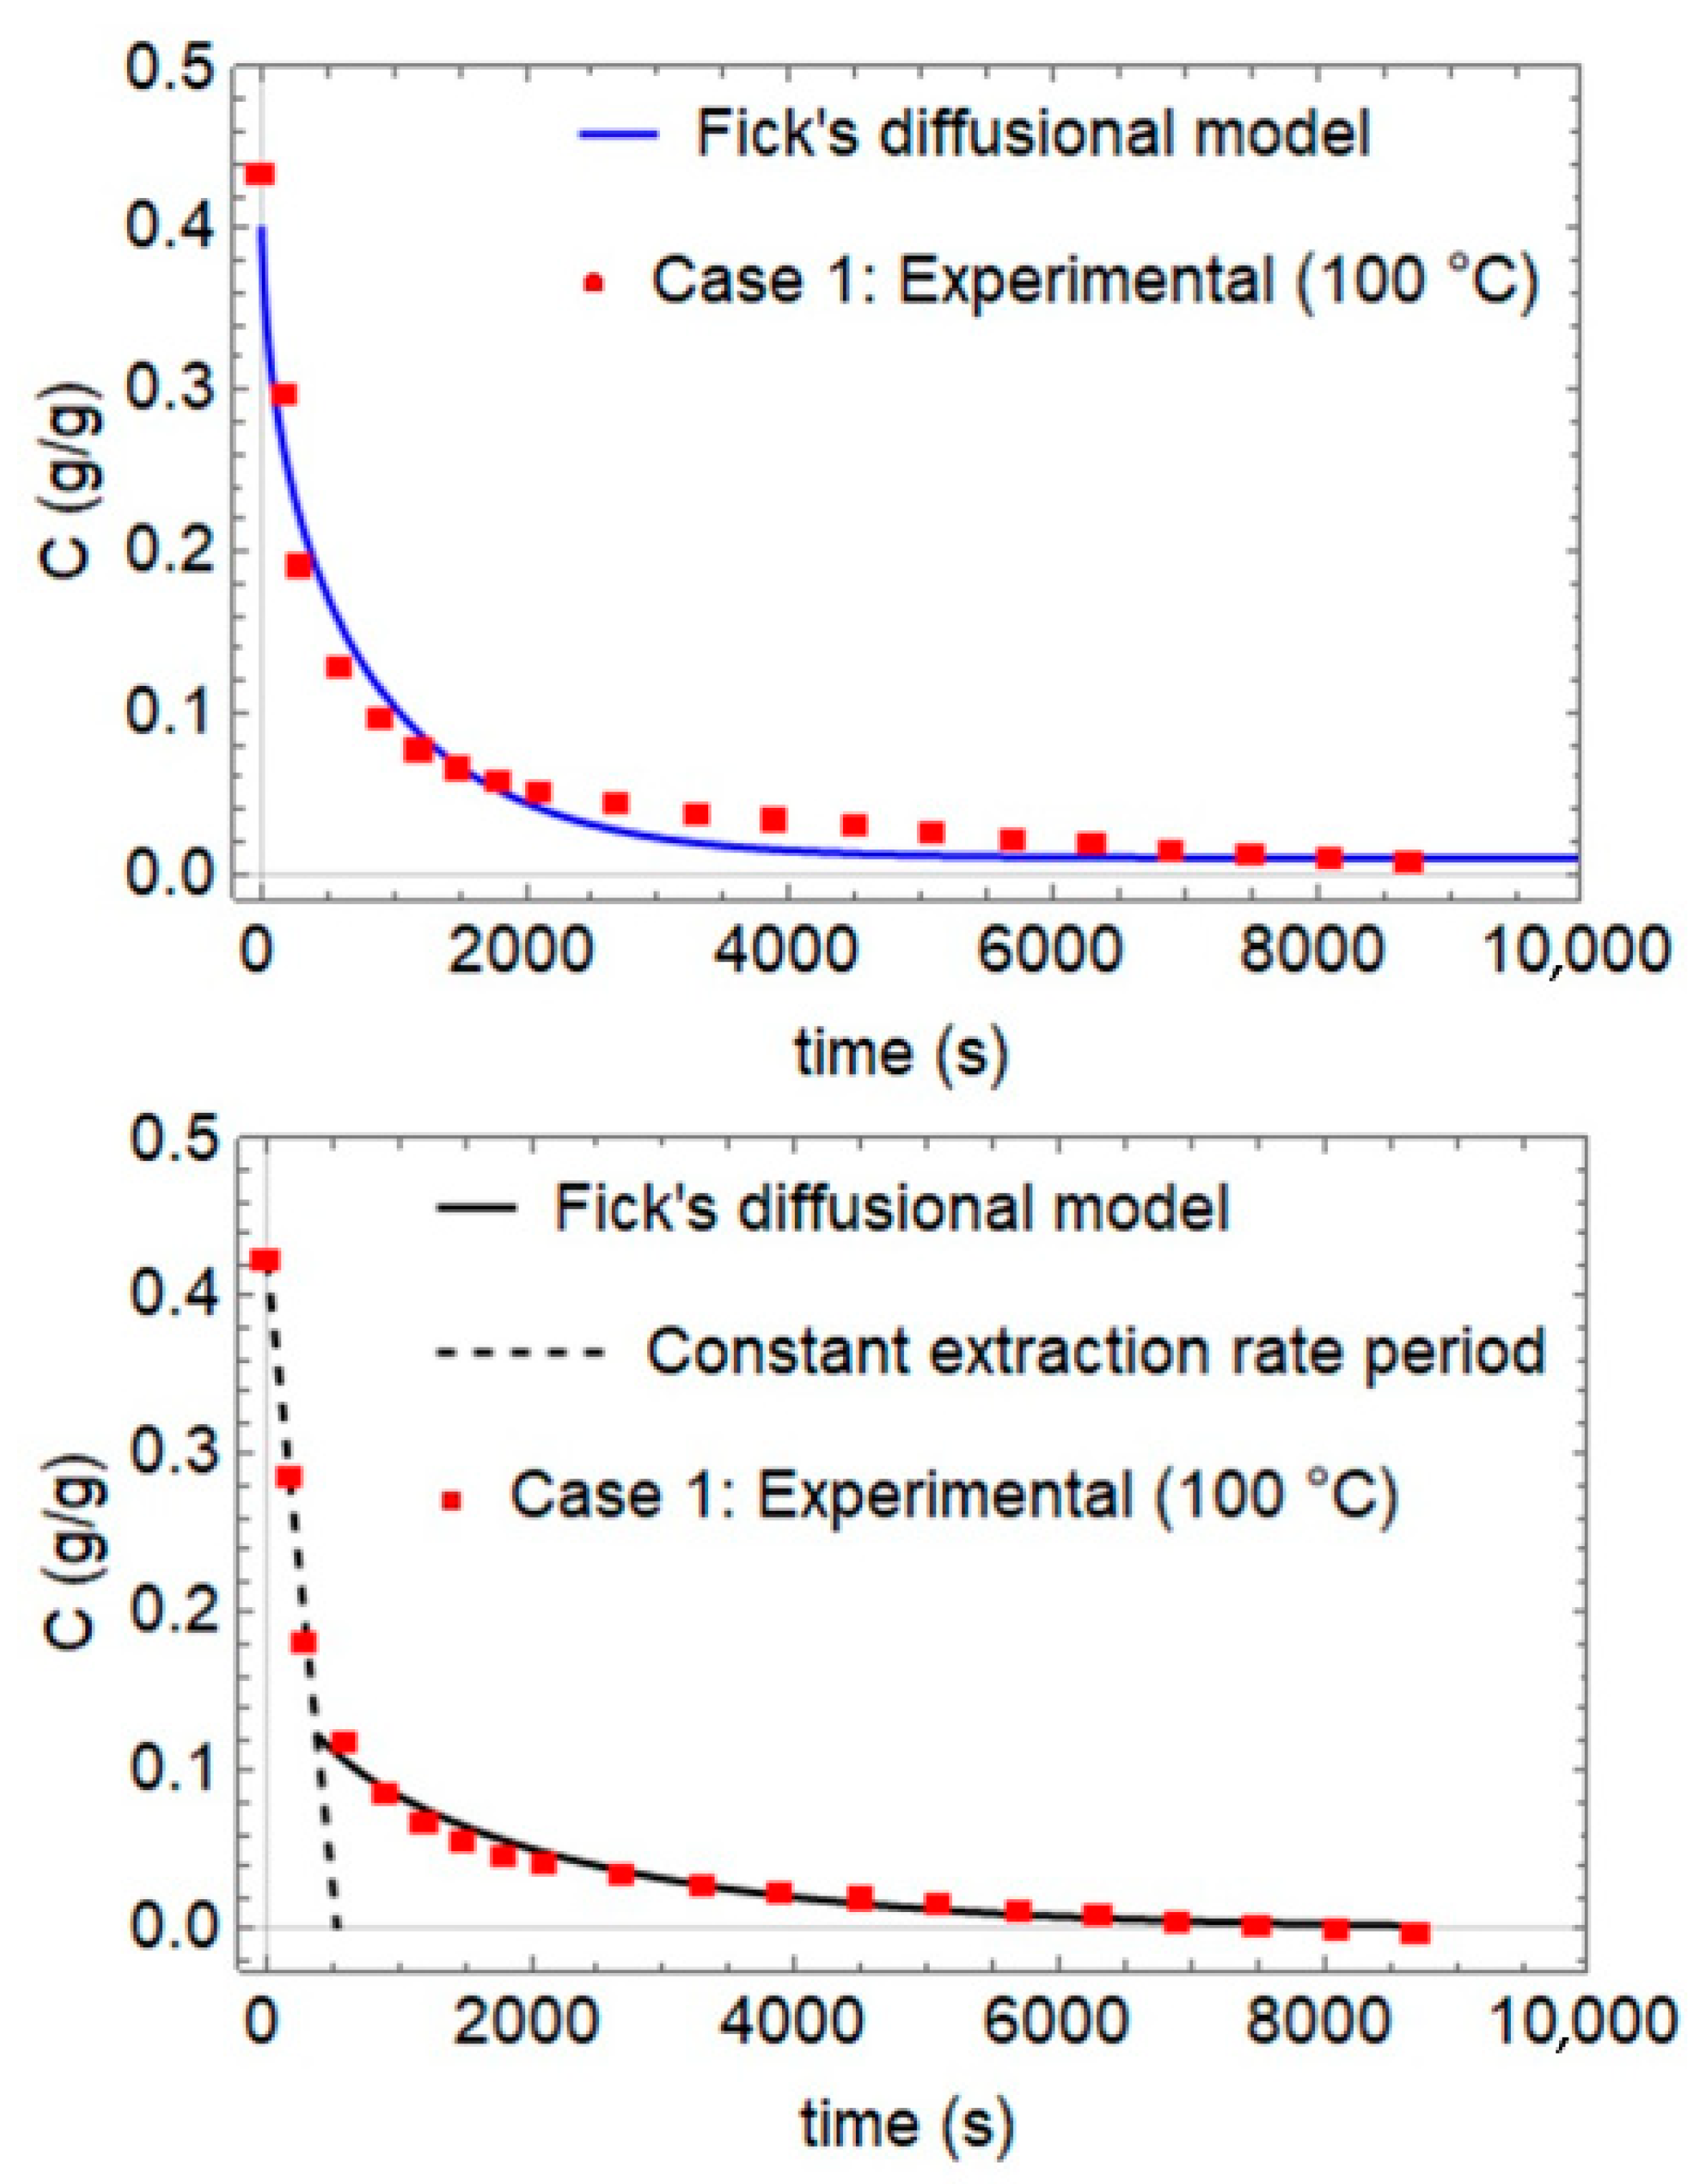
2.8.1. Case Study 1: Semi-Continuous Process or General Extraction Curve

The global extraction curves, or the kinetics of the PLE, were designed for the temperature values that showed the highest extract yields in the optimization of the passion fruit leaf tincture extraction process (80, 90 and 100 °C). As previously mentioned, the extractions were conducted using an accelerated solvent extractor (ASE 150, Dionex, Sunnyvale, CA, USA) at these three different temperatures. For the construction of the extraction kinetics, the collection was carried out at 19 points, with the total solvent renewal at different times (3, 5, 10, 15, 20, 25, 30, 35, 45, 55, 65, 75, 85, 95, 105, 115, 125, 135 and 145 min). This procedure enabled the depletion of the solute fraction. Similar to the optimization process, the selected extraction cell was the one with a capacity of 34 mL, and the used leaf content was approximately 7 g. For each sampling, the obtained extract was roto-evaporated at 50 °C, followed by placement in an air-circulating oven for total drying for 24 h at 105 °C to obtain the overall yield in total extracted solids. The pressure was fixed at 10.35 MPa; the nitrogen purging time was 100 s and the rinse solvent volume was 0%. Weights were taken in order to obtain the mass of solvent remaining in the matrix, the mass of the obtained extract and the mass of total solids obtained after the complete evaporation of the solvent, thus enabling the estimation of the mass balance. The extraction cell used (34 mL) measured 2.8 cm in diameter and 5.2 cm in length.
The solid particles of the passion fruit leaves were considered as being spherical. Fick’s diffusion model was adjusted to the kinetic profile, and the effective mass diffusivity D e f f (m2/s) was obtained for the particulate material, as represented in Equation (4) [49,50,51], where D e f f (m2/s) is the effective mass diffusivity coefficient and c (g/g) is the concentration of dry extract distributed along the particle radius (r, m) at any time (t, s).
c t = D e f f ² c r ² + 2 r c r
The analytical solution was obtained by using the boundary conditions of the dry extracts’ equilibrium concentration on the surface of the particles ( c 1 e q ) and the total amount of dry extract ( c 1 ) that migrated from the microparticles to the solvent, as shown in Equation (5) [49], where r represents the dimension, in cylindrical coordinates, of the passion fruit leaf spherical particles. The radius of the particle ( R s ) was half the diameter, ( d ¯ ) , determined by the peak of the particle size distribution, i.e., d ¯ = 2 R s . The term c (g/g) corresponds to the concentration of dry extract at time t; the term c 1 i n (g/g) is the initial concentration of the dry extract in the solid domain and the term c 1 e q (g/g) represents the equilibrium concentration for the solvent phase, which, in this study, was considered as equal to zero.
c r = 6 π 2 n = 1 1 n 2 e x p n 2 π 2 D e f f t R s 2
The dimensionless concentration term c r is defined by Equation (6).
c r = c 1 c 1 e q c 1 i n c 1 e q
The initial concentration ( c 1 i n ) of the dry extract in the passion fruit leaf particles was calculated by the ratio between the dry mass of the leaves at the beginning of the extraction process ( m i n ) and the dry mass after 145 min of extraction ( m o u t ), as shown in Equation (7).
c 1 i n = m i n m o u t m o u t
The extraction kinetics profiles were plotted based on the solute concentration over the extraction time and Fick’s analytical solution for cylindrical coordinates. This established the effective mass diffusivity for each temperature.
The period of the constant extraction rate (CER) was calculated for the semi-continuous process because this period is the most industrially interesting [39]; therefore, the CER period was adjusted by linear fit, and the coefficient of the constant drying rate ( N 1 ) was obtained from Equation (8), for t < t 1 c r i t . Thus, the period of linear decrease in the concentration varied from 0 s to t 1 c r i t .
c 1 = c 1 i n N 1 · t
After the CER period, a Frick’s model was adjusted with similar conditions to the preceding case, but with some differences: In Equation (6), instead of using c 1 i n , c 1 c r i t (g/g) was considered, which is the concentration of the dry extract in the solid domain at the beginning of diffusion mass transfer for t > t 1 c r i t . The extraction kinetics profiles were plotted based on the solute concentration over the extraction time and Fick’s analytical solution for cylindrical coordinates. Thus, the effective mass diffusivity for each temperature was established.

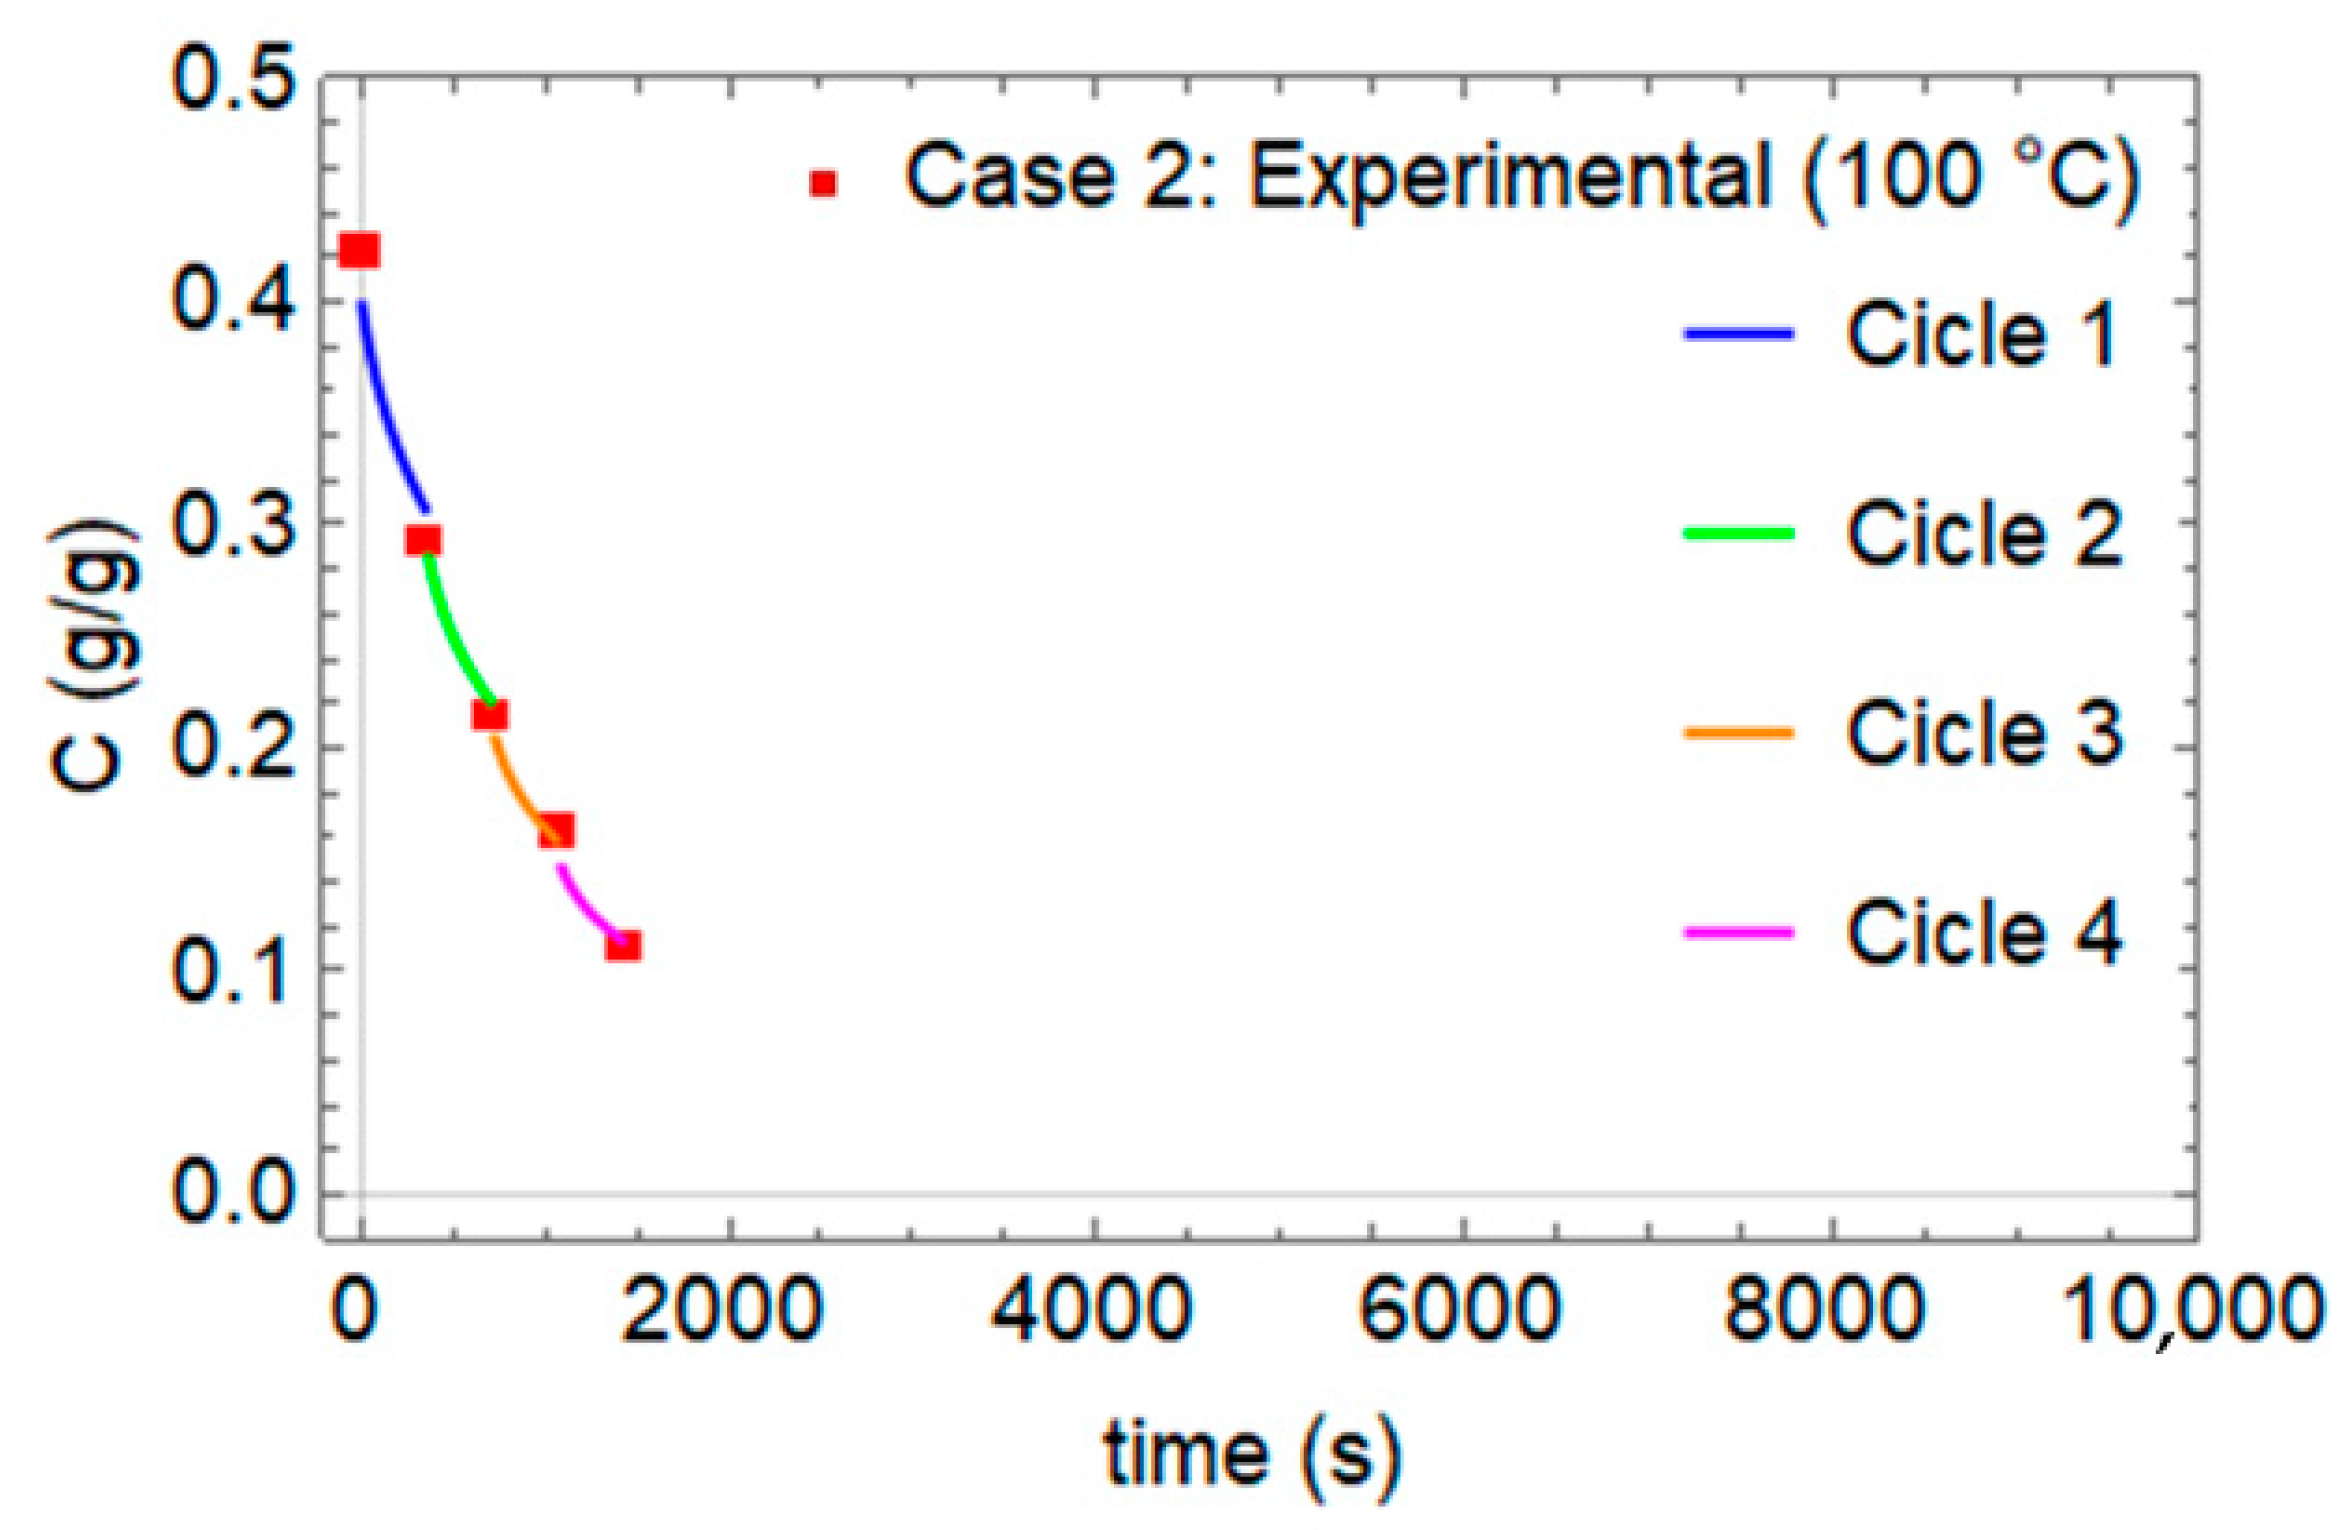
2.8.2. Case Study 2: Extraction with the Intermittent Purge of the Solvent

In order to assess the behavior and evaluate the PLE process with intermittent solvent purging, which was the actual mechanism for obtaining tincture from Passiflora leaves, the optimized extraction conditions were used (CCRD test 9, at 100 °C, 120% SV and 4 cycles), and the extracts obtained in each extraction cycle or purge interval (4) were collected. The extracts were roto-evaporated at 50 °C and placed in the air-circulating oven for 24 h at 105 °C to obtain the overall yield. In addition, all the solvent volumes used in each cycle were recorded. The intermittent purging extraction process used a reduced amount of solvent volume and more spaced purge intervals when compared to the semi-continuous process. The extraction cycles were spaced by 6 min (St), totaling four cycles. Additionally, the solvent temperature was 100 °C.
In this case, the extract concentration throughout the intermittent purging process ( c 2 p u r g e ) was estimated using the initial leaf mass ( m i n ), the leaf mass at time i ( m o u t ) and the initial concentration ( c 1 i n ), determined by the complete removal of the extract obtained in case 1.
The concentration of the extract in the particles throughout each cycle or purge interval is equal to the ratio of the difference between the initial mass of extract present in the leaves and the mass of extract that was removed in each purging by the sheet mass at purging time i (Equation (9)).
c 2 p u r g e = m i n · c 1 i n ( m i n m o u t ) m o u t
In this case, Fick’s analytical solution (Equation (5)) was also used, with adaptations in some boundary conditions, as follows:
In the first extraction cycle of the intermediate process, Fick’s solution extraction model of the semi-continuous process was used (Equation (10)).
c r = c 2 c 2 e q c 1 i n c 2 e q
where ( c 2 i n = c 1 i n ) corresponds to the initial concentration of the dry extract, obtained by the total extraction obtained in Section 2.8.1. The equilibrium concentration on the particle surface was considered equal to that in case 1 at 100 °C ( c 2 e q < 0.01 ).
For cycles 2, 3 and 4, it was considered that the solvent limitation produced an incomplete extraction. At the end of each cycle, the residual concentration of the dry extract was represented by the term c 2 r e s (g/g). For example, the initial concentration of the purge interval or cycle 2 was equal to the residual concentration for cycle 1; the generalized expression is given by Equation (11).
c 2 ; ( i ) i n = c 2 ;   ( i 1 ) r e s
Consequently, Fick’s model used for the cycles following the first is presented by Equation (12).
c r = c 2 c 2 e q c 2 ; ( i 1 ) r e s c 2 e q

2.9. Quantification of the Crude Extracts of Passiflora Leaves by UPLC-MS/MS

The quantification experiment from the standard solution of isovitexin was carried out by UPLC-MS/MS in the multiple reaction monitoring (MRM) mode with the crude extract of Passiflora leaves. The referencing standard solution was prepared by appropriate dilutions of the stock solution (1.0 mg/mL), with CH3OH resulting in the following concentrations of isovitexin: 1, 10, 100, 200 and 350 ng/mL.
The crude extract samples were dissolved in 1.0 mL of CH3OH and filtered through a Millipore filter (0.45 μm), and dilutions of volume/volume with CH3OH were performed. Five microliters of the crude extract solutions were injected into an Ascentis Express C18 column (100 × 4.6 mm i.d.; 2.7 µm particle size) from SUPELCO Analytical. The mobile phase used for gradient elution consisted of water with 0.1% formic acid (solvent A) and methanol with 0.1% ammonium hydroxide (solvent B) at a flow rate of 0.4 mL min−1. The gradient elution program started with 30% B, and then B was raised to 95% over the following 4 min, where it remained at 95% for 2 min and was then returned to the initial condition (30% B) over the following 5 min. Triplicate injections were made for the isovitexin standard solution and crude extract samples. The optimum condition of MRM was determined, as shown in Table 2. The calibration curve obtained in MRM mode was used for the quantification of isovitexin, and the concentration in the crude extract samples was expressed in µg/mL. For this purpose, each tested concentration was corrected using a dilution factor (50, 25, 10 and 5 times) from the stock solutions. The data were acquired and processed using TargetLynx™ Application Manager software (Waters Corporation, Milford, MA, USA).

2.10. Antioxidant Activity of the Hydroalcoholic Extract of P. edulis

These analyses were performed for percolation, PLE assay 9 and PLE assay 3.

2.10.1. Scavenging of DPPH Radicals

The antioxidant activity of passion fruit tinctures (percolation and liquid pressurized) was determined by the DPPH radical scavenging method according to Brand-Williams, Cuvelier and Berset [52]. The sequestering activity was measured in a mixture containing 3.9 mL of the DPPH radical (0.06 mmol/L) and 0.1 mL of the passion fruit extract, or 0.1 mL of absolute ethyl alcohol as a control. The solution (DPPH• + extract) was quickly homogenized and kept at rest for a sufficient time at 25 °C in the absence of light. Absorbance readings were performed in a spectrophotometer at the wavelength of 515 nm. The DPPH radical scavenging activity was calculated using Equation (13) and expressed as the percent inhibition.
D P P H % = ( A c o n t r o l A s a m p l e ) A c o n t r o l × 100

2.10.2. Ferric Ion Reduction (FRAP)

The ferric ion reducing capacity (FRAP) was determined according to Benzie & Strain [53]. Phosphate buffer, TPTZ reagent (10 mmol) in HCl (40 mmol/L) and FeCl3 (20 mmol/L) were used. The FRAP reagent consists of 25 mL of phosphate buffer, 2.5 mL of TPTZ solution and 2.5 mL of FeCl3. Samples (10 μL) of extracts or ferrous sulfate (SF) standard, water (30 μL) and FRAP reagent (300 μL) were mixed and kept at 37 °C for 30 min. After reaching room temperature, the samples were read on a spectrophotometer at 595 nm, and the results were expressed in μmol eq. SF/mL of the extract. Dilution of extracts in phosphate buffer: 1:50 (percolation) and 1:80 (PLE).

2.10.3. Oxygen Radical Absorbance Capacity (ORAC)

The analysis of oxygen radical absorption capacity (ORAC) was performed according to Chisté et al. [54]. In a 96-well microplate, 250 μL of the diluted extract, 150 μL of fluorescein and the AAPH solution were added, using a standard trolox reagent. Antioxidant capacity was determined by the loss of fluorescence, with absorbance readings at 493 nm, and the result was expressed in μmol Eq. Trolox/mL of the extract. Extracts were diluted in phosphate buffer: 1:400 (percolation), 1:600 (PLE assay 9) and 1:800 (PLE assay 3).

3. Results and Discussion

3.1. Characterization of the Raw Material

After the samples were dried and ground, they were sent to the FZEA/USP Bromatology Laboratory to determine their composition on a dry matter basis (Table 3). As can be noted, the dry leaves had a low moisture content and presented around 13% crude fiber, composed mostly of cellulose and lignin. In addition, the sample had 12.5% total ash, 18.1% protein and exhibited a low percentage (3.2%) of lipids (ether extract) and a high concentration of non-structural carbohydrates, including starch, sugars and others (52.5%).
The average particle diameter found was 472.15 µm, and the real density obtained from the fixed bed was 1.30 ± 0.01 g/cm3. The apparent density was 0.306 ± 0.003 g/cm3, with a fixed bed porosity of 0.7646.
The porosity of the fixed bed, also called the void fraction, is influenced by several factors, such as the size, shape and roughness of the particles that compose it, in addition to the type of packaging and the ratio between the particle diameter and the size of the extractor [55]. Upon calculating the fixed bed porosity, only the empty spaces between the bed particles were considered; the internal pores of the particles themselves were not computed. This parameter provides information for further studies or future scale-up since it characterizes the fixed bed. Porosity values below 1 allow for good contact between the particle surface and the solvent, thus favoring the migration of the solute from the matrix to the solvent [56,57].

3.2. Extraction Yield

3.2.1. Percolation Extraction (PER)

The extraction of Passiflora edulis Sims leaves via percolation with 70% ethanol (v/v) as the solvent provided a global yield of 21.8 ± 0.4%, a TPC of 22.5 ± 1.1 mg GAE/g and an FC of 27.2 ± 0.6 mg QE/g. This method required the use of 185 ± 15 mL of 70% ethanol for extraction, which involved contact between the dry leaves and the solvent for 24 h. The obtained results in this analysis were considerably lower than those found by PLE using the same solvent. This indicates that, in addition to being a much faster process than percolation (which required 26 h of processing), PLE with intermittent solvent purging also promoted significant solvent savings, as detailed below.
A total phenolic content of 8.3 ± 0.2 mg GAE/g was found in the extraction by the infusion of P. edulis leaves conducted by Da Silva et al. [27]. In addition, Dos Santos et al. [58], who performed the percolation extraction of Passiflora actinia, obtained a total flavonoid content of 6.3 ± 0.0 mg isovitexin equivalent/g of the sample, using 45% ethanol (v/v) as a solvent. These results are much lower than those found herein, evidencing that distinct species, solvents or percentages of ethanol and different extraction processes can generate different yields.
Regarding the overall yield, our results were very similar to those reported by Li et al. [26], who percolated P. edulis leaves in 60% ethanol (v/v), rendering a global yield of approximately 20.1%. Thus, when comparing the two techniques and considering the speed of the extraction process and the relatively low energy consumption (discussed below), it is evident that PLE can be a promising technique in the herbal tincture production industry.

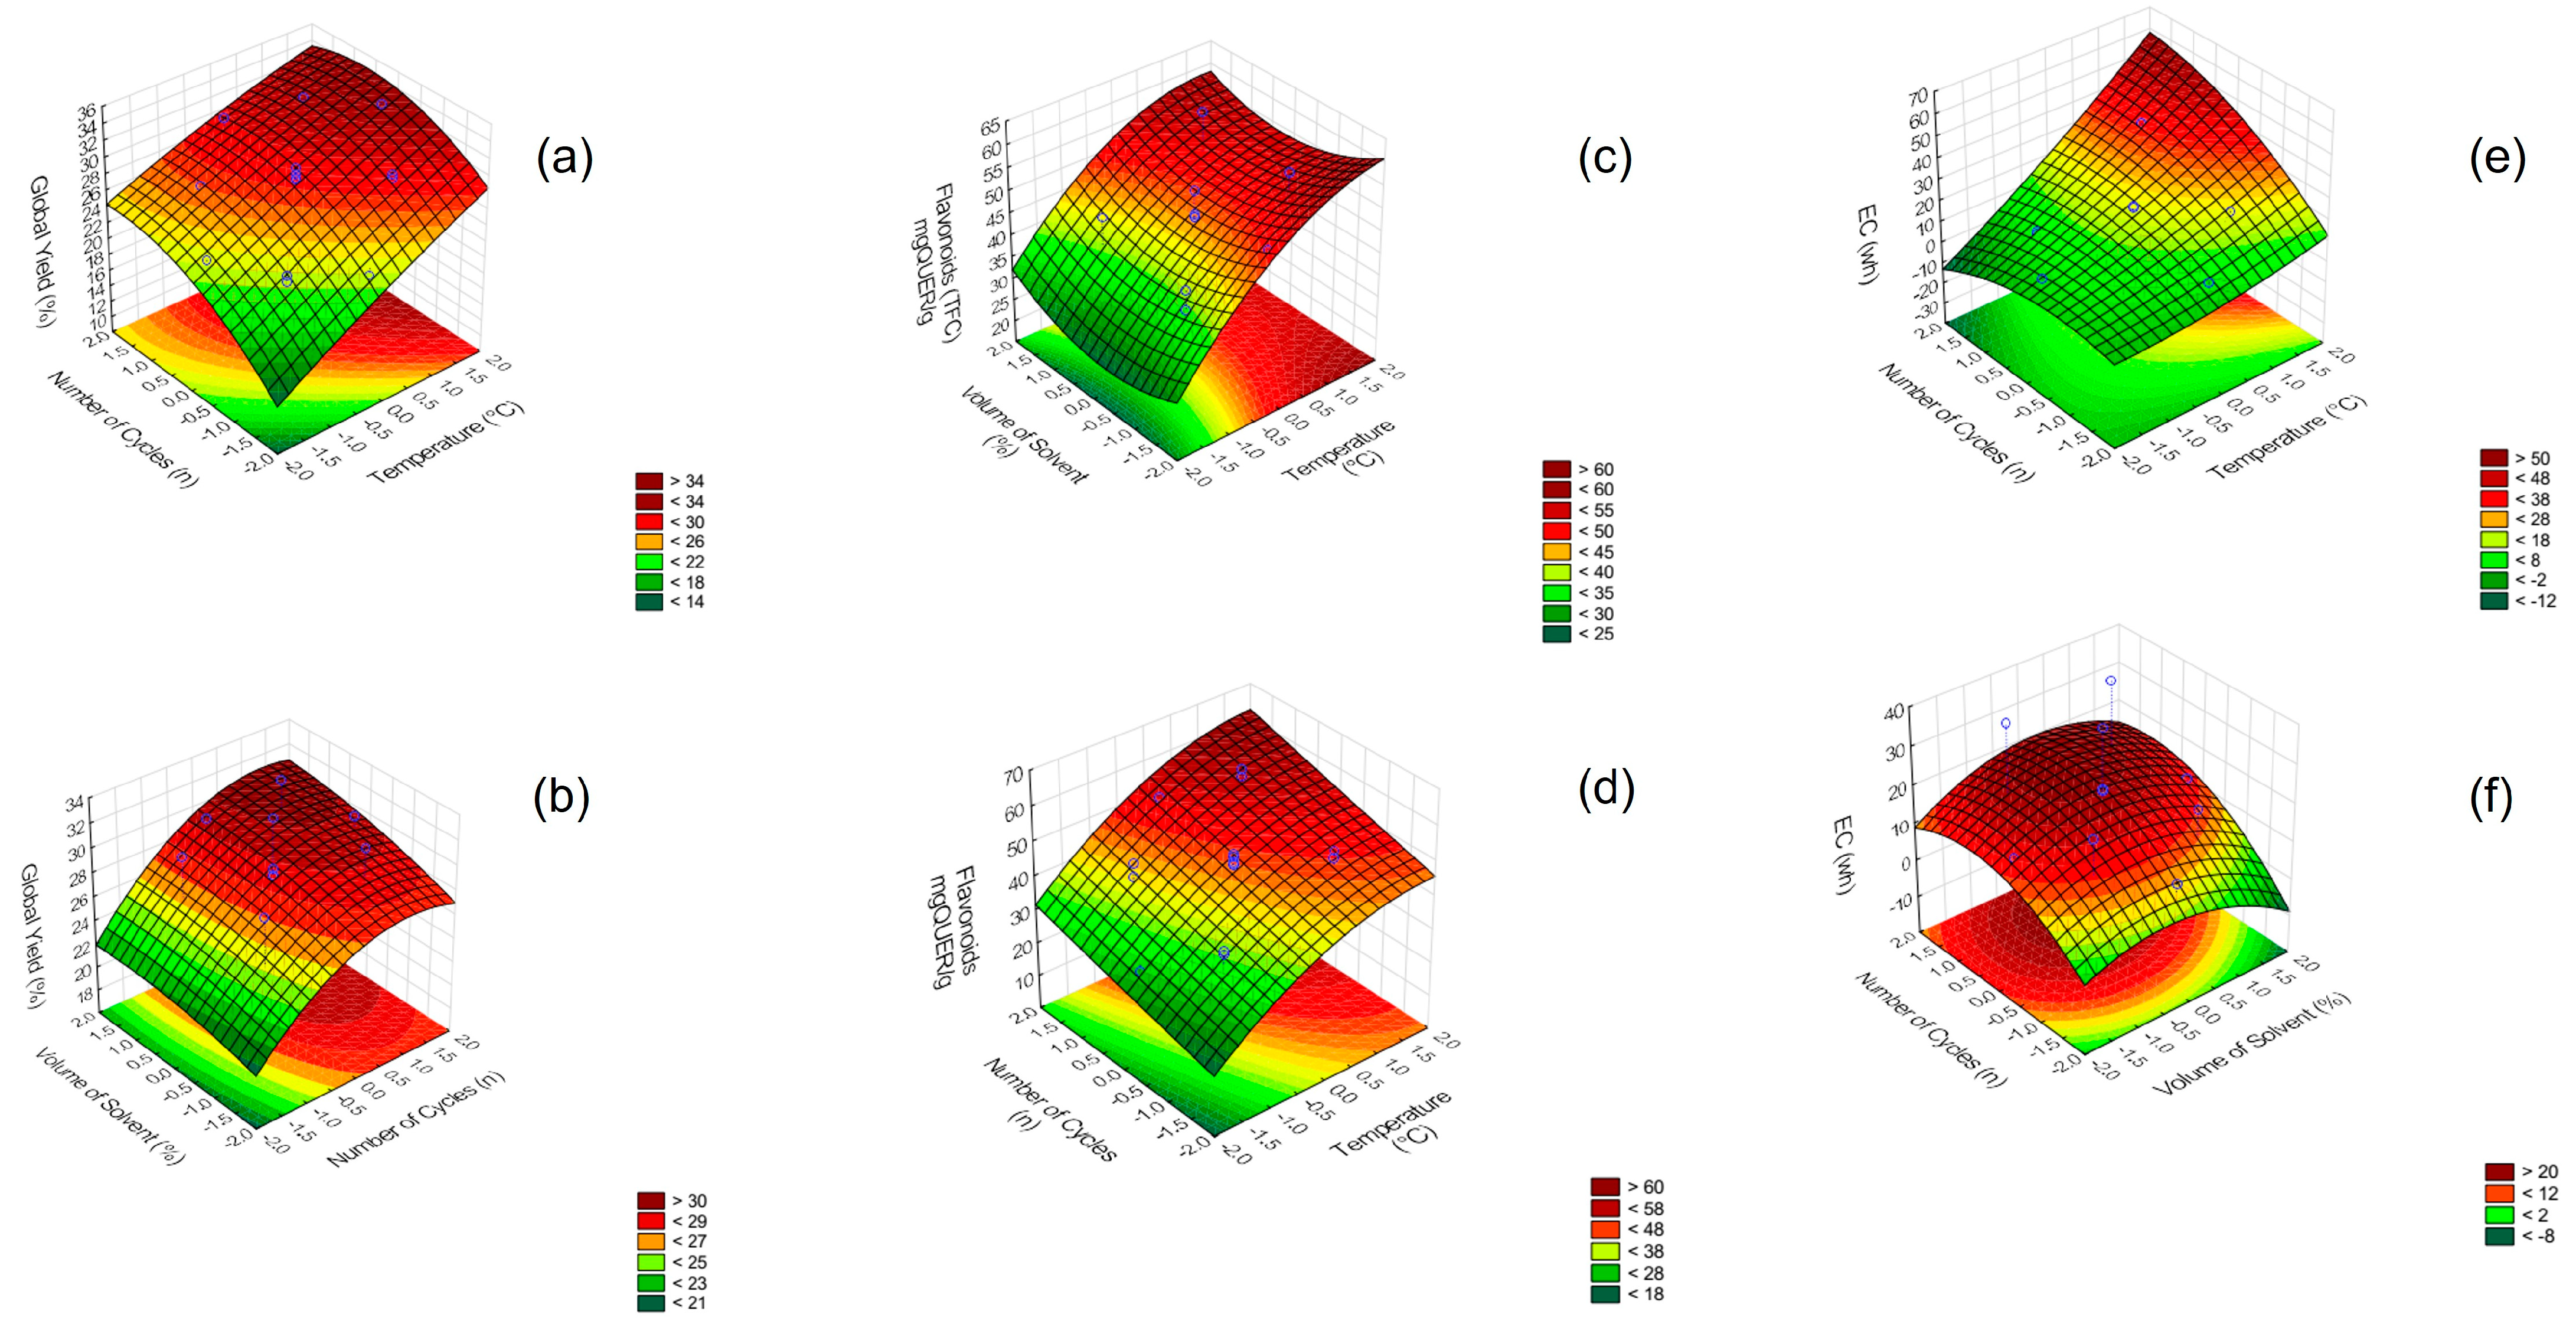
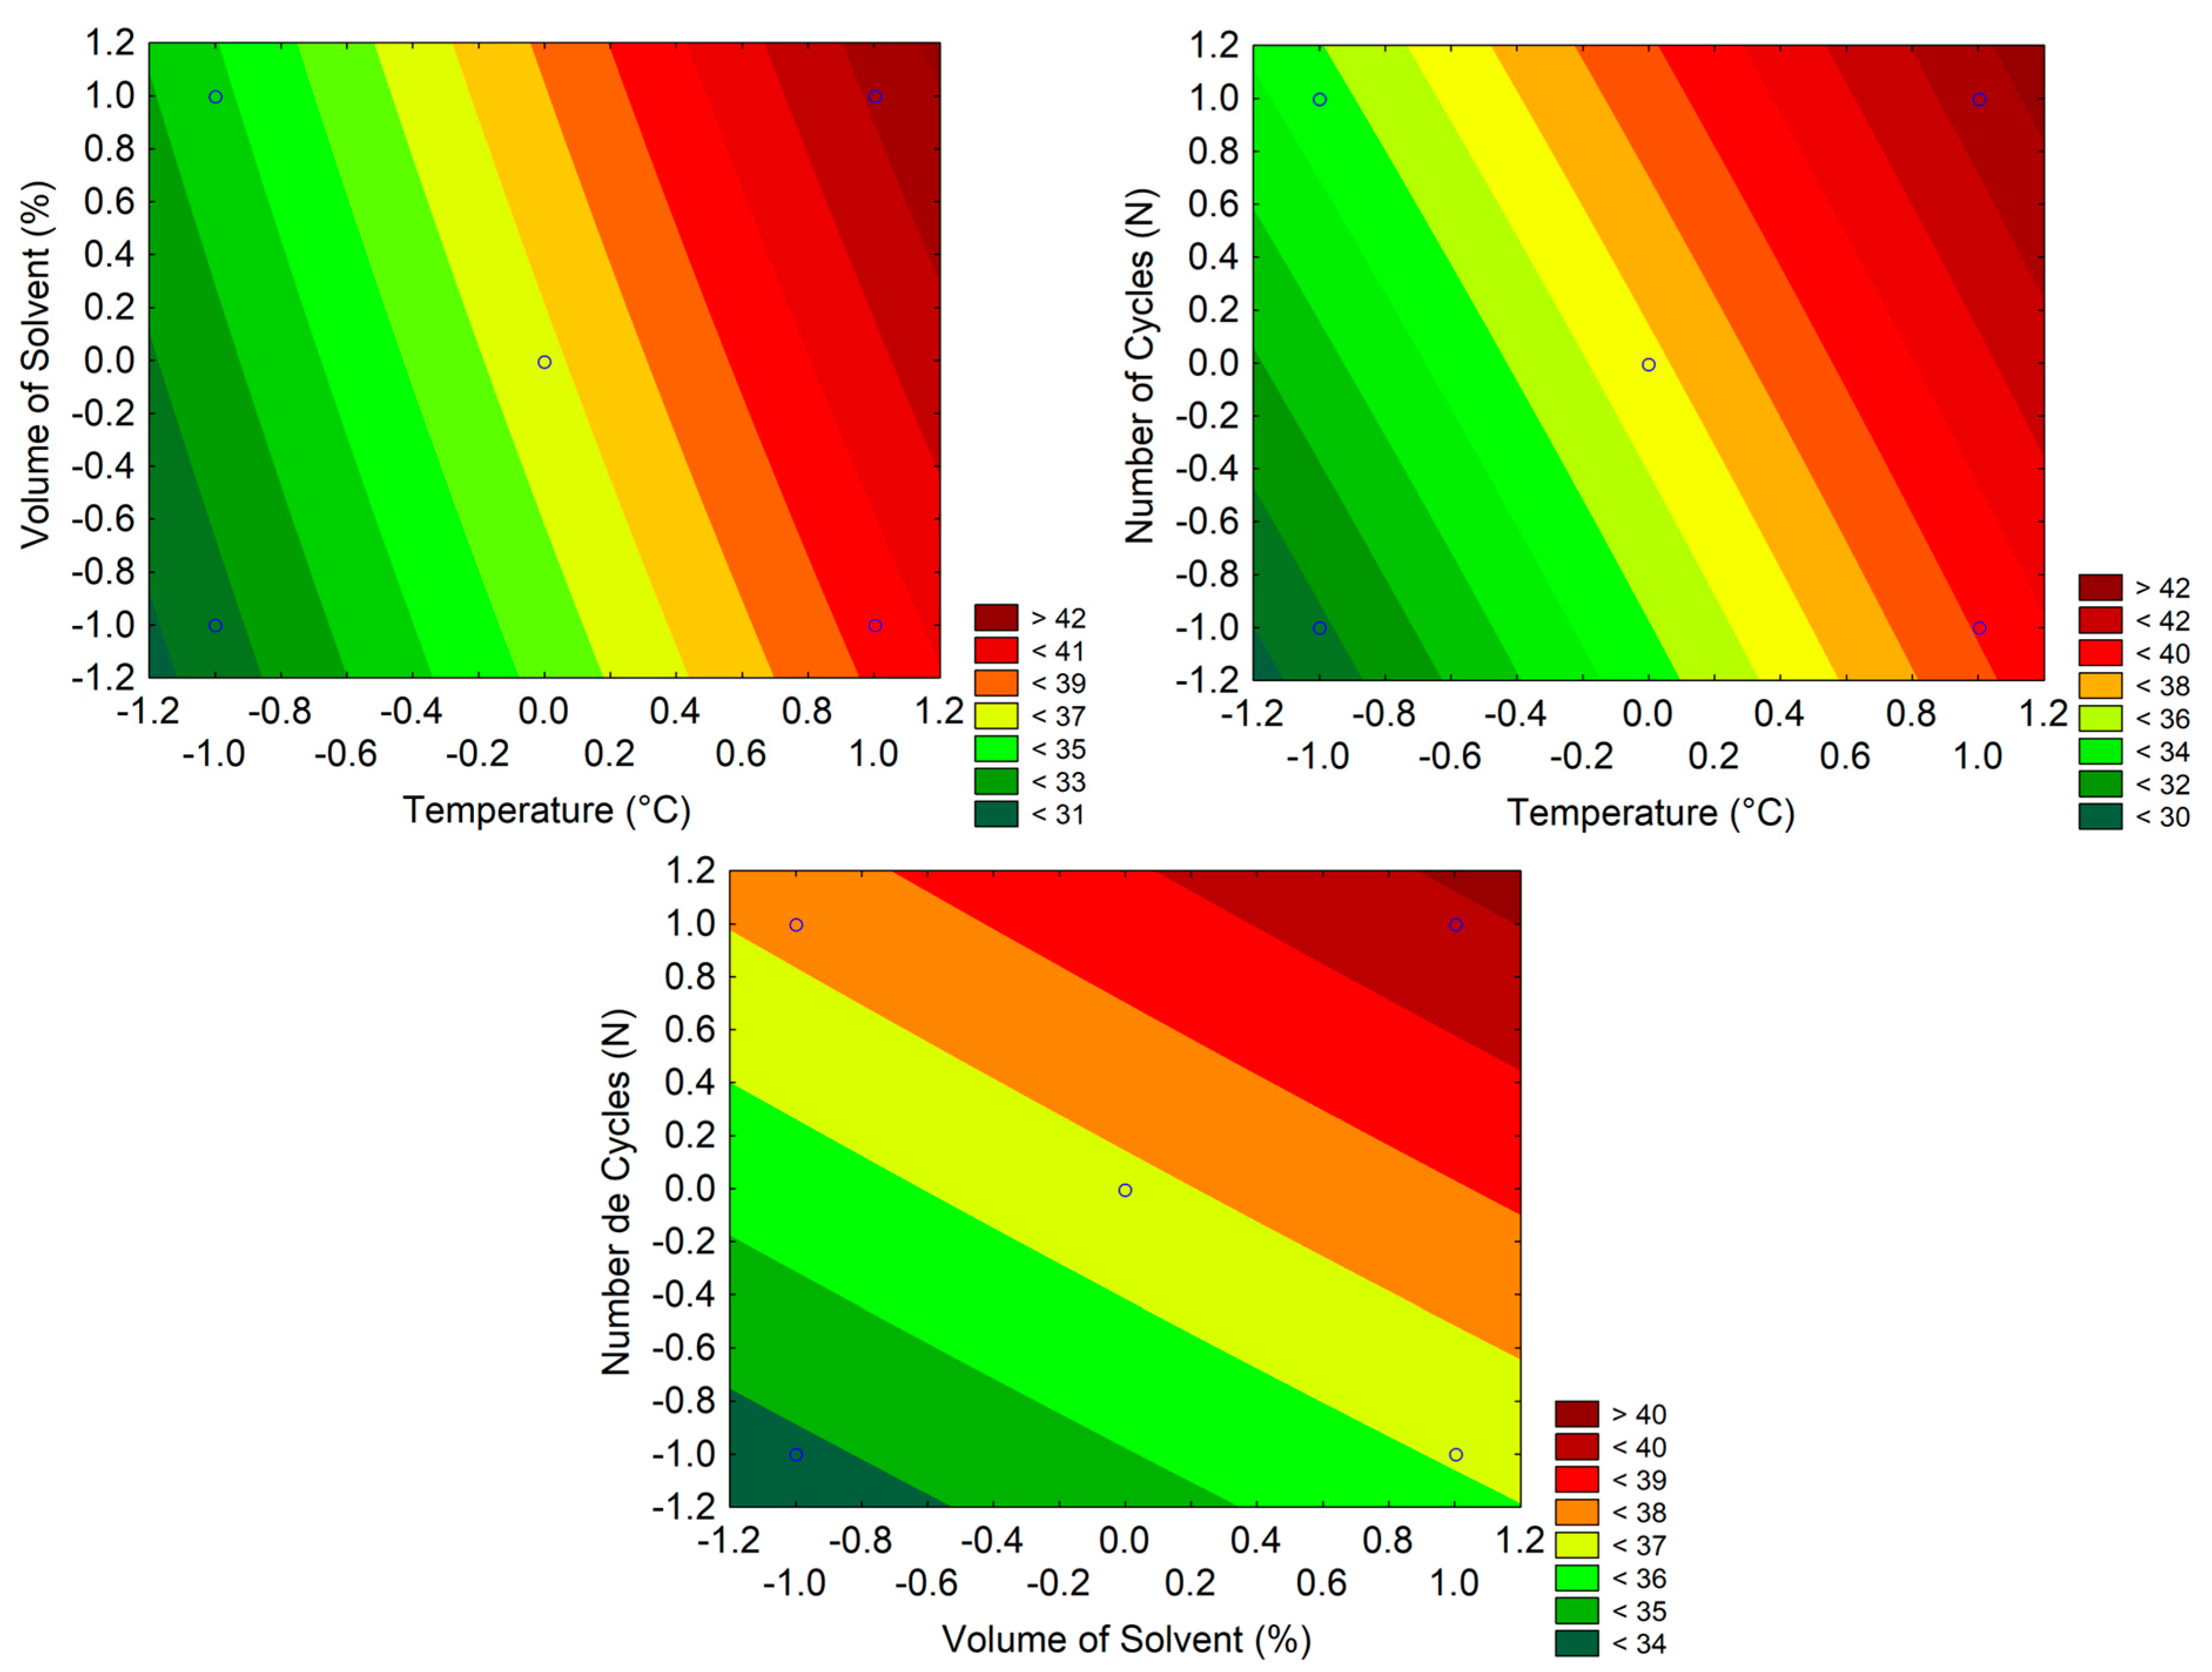
3.2.2. Pressurized Liquid (PLE) in the Intermittent Process

According to the extraction results for Passiflora leaves using pressurized ethanol 70% (Table 4), the global yields (X0) ranged from 22.3 to 33.1%, where the highest values were obtained under the conditions of tests 12 (33.1%) and 9 (32.5%) (Table 4). In the statistical analysis of the main effects (excluding the axial points, Table 1), only the temperature (T) and the number of cycles (N) promoted significant effects on X0; no effects of interactions were observed, as can be noted in the Pareto diagram shown in Figure 1a.
In the statistical treatment of experimental data with respect to responses, linear and quadratic regression models were fitted. The coefficients for the first and second order of the predictive equations (Equation (3)) for each of the responses as a function of the independent variables studied, as well as their significance levels, are shown in Table 5. The significant coefficients are those that presented p < 0.05 and were chosen to compose the models. For the extraction yield (X0), the linear coefficients for the variables T, N and VS were significant, and the quadratic coefficient significance was only for the number of cycles (N). For the content of phenolic compounds (TPC), only the linear coefficients of the three process variables were significant. For the content of flavonoids (FC), the linear T and N and quadratic T and VS variables were significant. The linear variables T and N, the interaction between them (T × N) and the quadratic variables N and VS were significant in terms of electricity consumption (Table 5).
From the quadratic and linear models, it was possible to generate response surfaces (quadratic models) or contour surfaces (linear models) and analyze the influence of process variables on all responses.
In Figure 1a,b, the response surface for the global yield shows the highest X0 obtained at the highest temperatures and the largest number of cycles. The highest solids extraction yields occurred at 113 °C, a 100% extractor volume as the rinse volume (SV) and three cycles. The behavior of the global extraction yield (X0) increased due to the increment in temperature (T). In the study by Mustafa and Turner [59], the authors concluded that extremely high temperatures in PLE contributed to higher yields and faster extraction times since high temperatures facilitate the breakage of intermolecular interactions between the sample and the solute. Consequently, there is a reduction in surface tension between the three components (solute/sample/solvent) and a decrease in viscosity, which favors the penetration of the solvent into the leaf pores [60].
Gomes et al. [33] conducted PLE in Passiflora leaves and obtained a higher overall yield of 54.3% in Passiflora alata extracts at 60 °C, using 40% ethanol and five cycles, with the three studied variables influencing the yield, which corroborated the present data, where the temperature and the number of cycles were also the parameters that most influenced the yield.
The yields of the total phenolic (TPC) and flavonoid contents (FC) from dried leaves ranged from 30.0 ± 0.2 to 43.2 ± 0.6 mg GAE/g and from 30.0 ± 0.2 to 58.8 ± 0.2 mg QE/g, respectively. The highest values were obtained under the conditions used in test nine.
The response surfaces generated by the second-order models (Figure 2c,d) show that there was a direct proportionality between the temperature (T), the number of cycles (N) and the flavonoid content. This result is similar to that obtained by Gomes et al. [33], although the number of cycles did not affect the flavonoid content in their studies with P. alata.
Given that flavonoids are a class of phenolic compounds, it can be stated in this case that high temperatures promoted high levels of phenolic and flavonoid contents in the extracts since temperature together with pressure reduces the surface tension, and this increases the penetration of the solvent into the leaf pores, thereby increasing mass transfer [4,39,60].
The temperature of 47 °C was not efficient in extracting these compounds, which can be explained by the fact that low temperatures are not sufficient to effectively extract antioxidant compounds [61]. The highest temperatures promoted the highest global yields, and temperatures of 100 °C proved to be efficient in the extraction of phenolic and flavonoid compounds. In all the analyzed yields, there was proportionality between the number of cycles and higher yields. Martín- Garcìa et al. [6], in the PLE extraction of phenolics from olive leaves, also found that temperature was the most significant variable in phenolic recovery.
Gomes et al. [33], when performing PLE on P. alata, obtained total phenolic content yields ranging from 241.67 to 611.11 mg GAE/g of the sample and total flavonoid yields of 41.46 to 110.89 mg QE/g of the sample, i.e., they obtained higher yields than those achieved herein. This discrepancy can be explained by the fact that the plant species, cultivation practices, climatic conditions, genetics, harvest season and age of the plant, as well as the part of the plant that was used in the extraction process, can affect the extract yield quality [39]. It is also known that biological matrices are different between species and plant parts and have different mass transfer mechanisms [62].
Considering the energy consumption (EC) (Table 4), the assessed values ranged from 3.4 to 36.9 Wh, in which the highest values were obtained under the conditions of tests 12, 9 and 3 (36.9 Wh). In the response surface generated (Figure 2d,f), the factor that most interfered in energy consumption was temperature, followed by the number of cycles. Higher temperatures led to greater energy consumption, a fact that was due to the greater energy expenditure required for the equipment to reach higher temperatures, and the larger number of cycles refers to the number of times that the solvent was pumped into the cell, i.e., the energy expended by the pump in each cycle.
Test nine was the assay that yielded the most in terms of total phenolic and flavonoid content; however, the conditions applied in that test were the ones that generated the most significant electricity consumption, with an expense of 36.9 w ∗ h due to high temperatures and a greater number of cycles (Table 4). Test four could be considered optimal regarding the total phenolic content, as it presented the shortest extraction time, excellent TPC and also the lowest energy consumption in relation to the tests that presented the highest yields. Nevertheless, the highest energy consumption was still considerably low. The analysis of energy consumption herein was conducted only to demonstrate that the equipment used consumes a low amount of electricity; in the future, it will be used in the economic viability analysis of this process.
The contour lines generated by the first-order model (Figure 3) show that the total phenolic content does not depend on the percentage of solvent volume (SV) used; rather, it depends on the number of cycles (N). Temperature (T) was the most relevant factor in obtaining the phenolic compounds, which demonstrated that the higher the temperature, the higher the TPC. According to Yammine et al. [43], this parameter is directly proportional to the improvement in the extraction of gallic acid. Mariotti-Celis et al. [13] and Castejón, Luna and Señoráns [12] also reported in their studies that high temperatures and larger amounts of ethanol in the water/ethanol mixture increased the recovery of gallic acid.

3.3. Process Kinetics and Modeling

3.3.1. Extraction Kinetics of the Semi-Continuous Process

The extraction curve (Figure 4) shows that the leaf extract concentrations were significantly dependent on time and that the extraction speed was higher in the first 15 min of extraction (approximately 800 s). The extraction speed was reduced until reaching the equilibrium concentration (after 100 min). The constant extraction rate (CER) period (Figure 4) represents the stage where the highest amount of extract is obtained, and, for many applications in the industry, the extraction ends soon after this period because the best operating conditions aim at the highest yield in the smallest possible period of time [39,40]. In this context, and considering industrial applications, the range of 6 min (Table 6 and Figure 4) of extraction would be enough to obtain most of the compounds from the passion fruit leaves. From an industrial viewpoint, this makes the process of obtaining tinctures by PLE much more advantageous than the conventional percolation method.
The Fick’s Law model showed a good fit to the experimental data (R2 = 0.9908, 0.9884 and 0.9814 for temperatures of 80, 90 and 100 °C, respectively), as shown in Table 6. The temperature variation in the ranges applied did not greatly affect the effective diffusivity; there were no differences among the mass diffusivity values (p = 0.258387, α = 0.05). The effective diffusivity coefficients obtained by the model were 6.44 ± 0.416 × 10⁻¹² m2/s for the temperature of 80 °C, 6.07 ± 0.383 × 10⁻¹² m2/s for the temperature of 90 °C and 5.83 ± 0.421 × 10⁻¹² m2/s for the temperature of 100 °C. In general, increasing temperatures promote increments in effective diffusivity [59]; however, in this case, there was a small decline in the diffusivity coefficient with increasing temperatures, which was due to the fact that the initial condition c 1 i n was higher for the temperature at 100 °C. Furthermore, Fick’s model depends more strongly on concentration than on temperature [63]. The total extract concentration was considered as the initial concentration of the leaf extract and was inserted in Fick’s model, a fact that caused the variation in the coefficient. The equilibrium concentration did not vary in the three temperatures and was considered as null due to total solvent renewal.
Fick’s model fit well to the experimental data, but since it is a complex process, it cannot be stated that it occurred only by diffusion. The largest amount of extract was obtained in the first 6 min of processing (Figure 4), demonstrating that during the period of the constant extraction rate, where the process is controlled mainly by convection, the particles are easily accessible on the surface of the solid [39]. The diffusion of solute from the interior of the particle to the surface can also be fast when considering the size of the particle. If the particle is small and the model indicated for diffusion has a good fit, it can also be inferred that the solute migrates more easily to the surface. Fick’s Law model is simple and efficient for calculating the parameters needed to evaluate the equipment’s scale-up. In Table 7, on the Fick’s Law model plus CER, it is observed that the parameter, N 1 , which consists of the slope of the straight line, is greater at the temperature of 100 °C, indicating that the extraction process is faster at this temperature. At the temperatures of 80 and 90 °C, there was no statistical difference between them, and at these temperatures, the extraction speed was lower compared to that at 100 °C. The critical concentration is 0.204 g/g at 100 °C (Table 7), indicating that about 52% of extractable solids are obtained in the CER period.
Mezzomo, Martínez and Ferreira [64] also applied Ficks’s diffusion model by Crank to obtain peach almond oil by supercritical fluid extraction. According to their findings, the particle size ranged from 882 to 3360 µm and presented D e f f values that varied from 0.01 × 10⁻¹⁰ to 9.60 × 10⁻¹⁰ m2/s, which were higher than the values obtained in the passion fruit leaf tincture extraction conducted in this study. This can be explained by the fact that distinct extraction conditions and different raw materials may exhibit different responses to mass transfer.

3.3.2. PLE in the Intermittent Process

The extraction under optimized conditions (test 9, Table 4) was carried out in triplicate, and its effective diffusivity was much lower (1.28 × 10⁻¹² m2/s) compared to that of the semi-continuous process. The initial concentration c 2 i n (g of leaf extract/g of leaves) was 0.425 g/g, and at the end of the four cycles, a concentration of 0.114 g/g remained in the particles, indicating that under the optimized condition, not all the extractable material was extracted. The experimental data exhibited a good fit to the mathematical model of Fick’s Law (R2 = 0.9989), generating the effective mass diffusivity values shown in Table 8.
In the intermittent purging process (Figure 5), Fick’s analytical solution can explain the extract concentration in the leaves. The curves with the most significant decay were those of cycles one and two, indicating that the largest amount of solids is extracted in the first two cycles. The concentration variation was much smaller in cycles three and four. This shows that the extraction profiles simulated by Fick’s analytical solution were very similar to the real data. According to Figure 5, it can be assumed that the initial concentration was 0.425 g/g. After the first cycle, the leaf extract concentration was 0.294 g/g. In cycle two, the variation in the concentration went from 0.294 to 0.216 g/g; in cycle three, it declined from 0.216 to 0.164 g/g. In cycle four, the variation was from 0.164 to 0.114 g/g.
The optimized intermittent purge extraction occurs exactly in the portion of the curve that is next to the constant extraction rate (Figure 5), a fact that is considered optimal for the process regarding industrial applications because a greater amount of solids can be extracted in a shorter period of time [39]. In addition, the semi-continuous process exhibited greater solvent use in relation to the intermittent purging process. In the latter, approximately 90 mL of the solvent was used in 1400 s, whereas in the semi-continuous process, the use of the solvent was roughly 157 mL in a similar extraction time, i.e., with less quantities of the solvent, it is possible to extract most of the extractable content. The high yield in the period of the constant extraction rate suggests that the PLE can be performed in fewer minutes and with remarkable solvent savings [4].

3.4. Quantification of the Crude Extracts of Passiflora Leaves by UPLC-MS/MS

The straight line of the isovitexin curve obtained was y = 4.485x + 7.396 (y = ax + b), where r2 = 0.98. Tests nine and three of the CCRD (Table 4) were chosen for isovitexin quantification. Isovitexin is the main flavonoid responsible for the anxiolytic action [27,65]. These tests are the ones that presented the highest concentration of total flavonoids, and these results were compared with the percolation. In Table 9, it is observed that the results were consistent with Table 2, in which assay nine presented the highest number of flavonoids, but there was no statistical difference between the samples (p = 0.7975) in relation to the concentration of isovitexin. Even with the same isovitexin content as the conventional process, time and solvent savings as well as reduced energy consumption make the PLE process much more advantageous. Gomes et al. [33] also quantified by HPLC and obtained concentrations of 6.17 ± 0.083 mg/g of extract, higher than the average found by this study of 0.1285 ± 0.013 mg/g of extract, but this result obtained was closest to that of Da Silva et al. [27]. In Table 9, assay nine presented the highest total flavonoid content; such results may indicate that the PLE extraction method extracts other flavonoids in addition to isovitexin.

3.5. Antioxidant Activity

Regarding the DPPH radical scavenging activity, the percolation showed the highest antioxidant activity, followed by tests nine and three, which showed the lowest activity (Table 10). Regarding FRAP and ORAC, assay three showed higher antioxidant activity. The percolation showed less reduction capacity for ORAC; however, statistically, there was no significant difference between the three samples for FRAP, and there was no statistical difference between the samples extracted by PLE. Thus, there seems to be no correlation between isovitexin levels and the antioxidant activity of the extract, where a high amount of solids extracted by PLE may have interfered with the results. This result shows the potential for the production of tinctures by PLE, with the extraction of substances capable of inhibiting cellular oxidation. In PLE processes, extractions with the hydroalcoholic solution close to 50% tend to show higher antioxidant activities at lower temperatures [17].
When analyzing P. edulis extracts, Da Silva et al. [27] obtained FRAP values of 205.7 ± 4.12 μmol/g and ORAC 373.0 ± 1.63 μmol/g for aqueous extract, which were values that are much higher than that of this study. Do Carmo et al. [66] also obtained results for FRAP and ORAC of much higher values, being 73.54 ± 1.41 µmol/g and 356.94 ± 14.63 µmol/g. This discrepancy in the results can be explained by the difference between the cultivars, time of year and soil type, among others.

4. Conclusions

In the study of the extraction of bioactive compounds, the use of PLE with a polar solvent showed excellent results. In the optimized extraction condition, it was possible to recover 33.1% of the extractable solids contained in passion fruit leaves using ethanol 70% (v/v), while in the percolation conventional process, it was possible to extract 21.8% using the same solvent. The difference in the soluble solids content between the extracts obtained via PER or PLE influenced only the TPC and the antioxidant activity measured via ORAC.
The study of the influence of the PLE variables on the extraction revealed that the temperature (T) promoted a positive effect, as it was the variable that most influenced all the analyzed responses. The optimized condition used a T of 100 °C, 120% rinse volume and four cycles. The processing time is another advantage associated with this technology, and PLE proved to be much faster, using much less solvent with more efficiency than the percolation method.
The mass transfer process in the PLE is mainly controlled by convection in addition to diffusion, but the Fick model was simple and efficient in fitting the experimental data of the extraction kinetics and in calculating the necessary parameters that will be able to predict the process in the equipment scale-up. Distinct extraction conditions and different raw materials may have different responses to mass transfer, so it is important to find empirical parameters that fit the models for mass transfer prediction.
PLE with optimized intermittent purging occurs exactly in the part of the curve that is close to the constant extraction rate, which is considerably advantageous for the process in relation to its industrial application because greater amounts are extracted in shorter periods of time. In addition, the semi-continuous process required a greater use of the solvent compared to the intermittent process. In PLE, around 90 mL of the solvent was used in 1400 s, while in the semi-continuous process, the use of the solvent was approximately 157 mL in a similar extraction period. In other words, with fewer quantities of the solvent, it is possible to extract most of the extractable content by PLE in a faster and more cost-effective and profitable process than is possible with percolation.
Extraction by both PLE and PER showed statistically similar amounts of isovitexin and demonstrated similar antioxidant activity. Although there are no differences, the similar quality of the extract by the alternative method makes the process PLE more advantageous by saving time and solvent.

Author Contributions

Conceptualization, L.d.C.R.; methodology, L.d.C.R., R.B.B., F.d.L.C., E.J.C. and L.A.B.d.M.; formal analysis, L.d.C.R., R.B.B. and G.C.D.; investigation L.d.C.R. and A.L.d.O.; software, F.d.L.C., G.C.D., E.J.C. and L.A.B.d.M.; resources, F.d.L.C. and A.L.d.O.; writing—original draft preparation, L.d.C.R., A.L.d.O. and G.C.D.; writing—review and editing, L.d.C.R. and A.L.d.O.; supervision, A.L.d.O.; project administration, L.d.C.R. and A.L.d.O. All authors have read and agreed to the published version of the manuscript.

Funding

This research was funded by Brazilian agencies FAPESP (Fundação de Amaparo a Pesquisa do Estado de São Paulo—Process no 2018/18024-70) and CNPq (Conselho Nacional de Desinvolvimento Científico e Tecnológico—Process no 304573/2019-1).

Institutional Review Board Statement

Not applicable.

Informed Consent Statement

Not applicable.

Data Availability Statement

Raw data are not publicly available, although the data may be made available on request from the corresponding author. More details of the work can be found at https://oasisbr.ibict.br/vufind/Record/USP_8aaae605ac4f5e4fecf67d1bbf6d82ce (accessed on 10 January 2023).

Acknowledgments

We would like to thank the Brazilian agencies FAPESP (Fundação de Amaparo a Pesquisa do Estado de São Paulo—Process no 2018/18024-70) and CNPq (Conselho Nacional de Desinvolvimento Científico e Tecnológico—Process no 304573/2019-1) for their financial support. L.C. Rodrigues would also like to thank the Brazilian agency CAPES (Coordenação de Aperfeiçoamento de Pessoal de Nível Superior) for her scholarship (Process no 001) and University of São Paulo (USP).

Conflicts of Interest

The authors declare no conflict of interest.

References

  1. Richter, B.E.; Jones, B.A.; Ezzell, J.L.; Porter, N.L.; Avdalovic, N.; Pohl, C. Accelerated solvent extraction: A technique for sample preparation. Anal. Chem. 1996, 68, 1033–1039. [Google Scholar] [CrossRef]
  2. Conte, E.; Milani, R.; Morali, G.; Abballe, F. Comparison between accelerated solvent extraction and traditional extraction methods for the analysis of the herbicide diflufenican in soil. J. Chromatogr. A 1997, 765, 121–125. [Google Scholar] [CrossRef]
  3. Hu, J.; Guo, Z.; Glasius, M.; Kristensen, K.; Xiao, L.; Xu, X. Pressurized liquid extraction of ginger (Zingiber officinale Roscoe) with bioethanol: An efficient and sustainable approach. J. Chromatogr. A 2011, 1218, 5765–5773. [Google Scholar] [CrossRef] [PubMed]
  4. Barrales, F.M.; Silveira, P.; Barbosa, P.D.P.M.; Ruviaro, A.R.; Paulino, B.N.; Pastore, G.M.; Macedo, G.A.; Martinez, J. Recovery of phenolic compounds from citrus by-products using pressurized liquids—An application to orange peel. Food Bioprod. Process. 2018, 112, 9–21. [Google Scholar] [CrossRef]
  5. Verma, H.N. Extraction of phenolic compounds by conventional and green innovative techniques. In Green Sustainable Process for Chemical and Environmental Engineering and Science; 2023rd ed.; Elsevier Inc.: Amsterdam, The Netherlands, 2023; pp. 355–394. [Google Scholar] [CrossRef]
  6. Martín-garcía, B.; Pimentel-moral, S.; Gómez-caravaca, A.M.; Arráez-román, D.; Segura-carretero, A. Box-Behnken experimental design for a green extraction method of phenolic compounds from olive leaves. Ind. Crop. Prod. 2020, 154, 112741. [Google Scholar] [CrossRef]
  7. Pól, J.; Ostrá, E.V.; Karásek, P.; Roth, M.; Benešová, K.; Kotlaříková, P.; Čáslavský, J. Comparison of two different solvents employed for pressurised fluid extraction of stevioside from Stevia rebaudiana: Methanol versus water. Anal. Bioanal. Chem. 2007, 388, 1847–1857. [Google Scholar] [CrossRef]
  8. Claude, B.; Morin, P.; Lafosse, M.; Belmont, A.S.; Haupt, K. Selective solid-phase extraction of a triterpene acid from a plant extract by molecularly imprinted polymer. Talanta 2008, 75, 344–350. [Google Scholar] [CrossRef] [PubMed]
  9. Vardanega, R.; Fuentes, F.S.; Palma, J.; Bugue, W.; Cerezal-mezquita, P.; Ruiz-domínguez, M.C. Valorization of granadilla waste (Passiflora ligularis, Juss.) by sequential green extraction processes based on pressurized fluids to obtain bioactive compounds. J. Supercrit. Fluids 2023, 194, 105833. [Google Scholar] [CrossRef]
  10. Ongkowijoyo, P.; Luna-Vital, D.A.; de Mejia, E.G. Extraction techniques and analysis of anthocyanins from food sources by mass spectrometry: An update. Food Chem. 2018, 250, 113–126. [Google Scholar] [CrossRef]
  11. Putnik, P.; Barba, F.J.; Španić, I.; Zorić, Z.; Dragović-Uzelac, V.; Kovačević, D.B. Green extraction approach for the recovery of polyphenols from Croatian olive leaves (Olea europea). Food Bioprod. Process. 2017, 106, 19–28. [Google Scholar] [CrossRef]
  12. Castejón, N.; Luna, P.; Señoráns, F.J. Alternative oil extraction methods from Echium plantagineum L. seeds using advanced techniques and green solvents. Food Chem. 2018, 244, 75–82. [Google Scholar] [CrossRef]
  13. Mariotti-Celis, M.S.; Martínez-Cifuentes, M.; Huamán-Castilla, N.; Pedreschi, F.; Iglesias-Rebolledo, N.; Pérez-Correa, J.R. Impact of an integrated process of hot pressurised liquid extraction–macroporous resin purification over the polyphenols, hydroxymethylfurfural and reducing sugars content of Vitis vinifera ‘Carménère’ pomace extracts. Int. J. Food Sci. Technol. 2018, 53, 1072–1078. [Google Scholar] [CrossRef]
  14. Zhang, Y.; He, Y.; Liu, C.; Liu, C.; Li, S. Screening and isolation of potential neuraminidase inhibitors from leaves of Ligustrum lucidum Ait. based on ultrafiltration, LC/MS, and online extraction-separation methods. J. Chromatogr. B Anal. Technol. Biomed. Life Sci. 2018, 1083, 102–109. [Google Scholar] [CrossRef] [PubMed]
  15. Rodríguez-Cabo, T.; Rodríguez, I.; Ramil, M.; Cela, R. Assessment of alcoholic distillates for the extraction of bioactive polyphenols from grapevine canes. Ind. Crops Prod. 2018, 111, 99–106. [Google Scholar] [CrossRef]
  16. Ferreira, W.S.; Viganó, J.; Veggi, P.C. Economic assessment of emerging extraction techniques: Hybridization of high-pressure extraction and low-frequency ultrasound to produce piceatannol-rich extract from passion fruit bagasse. Chem. Eng. Process. Process. Intensif. 2022, 174, 108850. [Google Scholar] [CrossRef]
  17. Herbst, G.; Hamerski, F.; Errico, M.; Corazza, M.L. Pressurized liquid extraction of brewer’s spent grain: Kinetics and crude extracts characterization. J. Ind. Eng. Chem. 2021, 102, 370–383. [Google Scholar] [CrossRef]
  18. Brasil, Formulário de Fitoterápicos Farmacopeia Brasileira—Primeiro Suplemento. 2011. Available online: http://portal.anvisa.gov.br/documents/33832/259456/Suplemento+FFFB.pdf/478d1f83-7a0d-48aa-9815-37dbc6b29f9a (accessed on 2 November 2019).
  19. Petry, R.D.; Reginatto, F.; De-Paris, F.; Gosmann, G.; Salgueiro, J.B.; Quevedo, J.; Kapczinski, F.; Ortega, G.G.; Schenkel, E.P. Comparative pharmacological study of hydroethanol extracts of Passiflora alata and Passiflora edulis leaves. Phyther. Res. 2001, 15, 162–164. [Google Scholar] [CrossRef]
  20. Benincá, J.P.; Montanher, A.B.; Zucolotto, S.M.; Schenkel, E.P.; Fröde, T.S. Evaluation of the anti-inflammatory efficacy of Passiflora edulis. Food Chem. 2007, 104, 1097–1105. [Google Scholar] [CrossRef]
  21. Deng, J.; Zhou, Y.; Bai, M.; Li, H.; Li, L. Anxiolytic and sedative activities of Passiflora edulis f. flavicarpa. J. Ethnopharmacol. 2010, 128, 148–153. [Google Scholar] [CrossRef]
  22. Ożarowski, M.; Karpiński, T.M. Extracts and Flavonoids of Passiflora Species as Promising Anti-inflammatory and Antioxidant Substances. Curr. Pharm. Des. 2021, 27, 2582–2604. [Google Scholar] [CrossRef]
  23. Gomes, C.S.; Campos, A.C.L.; Torres, O.J.M.; De Vasconcelos, P.R.L.; Moreira, A.T.R.; Tenório, S.B.; Tambara, E.M.; Sakata, K.; Júnior, H.M.; Ferrer, A.L.S. Passiflora edulis extract and the healing of abdominal wall of rats: Morphological and tensiometric study. Acta Cir. Bras. 2006, 21, 7–14. [Google Scholar] [CrossRef] [Green Version]
  24. Araújo, C.L.A.; Salles, B.C.C.; Duarte, S.M.D.S.; Rodrigues, M.R.; Paula, F.B.D.A. Passion fruit (Passiflora edulis) leaf extract modulates the oxidative metabolism of rat peritoneal neutrophils in a model of inflammation. Braz. J. Pharm. Sci. 2020, 56. [Google Scholar] [CrossRef]
  25. Soares, R.D.F.; Ribeiro, G.P.; Salles, B.C.C.; Cardoso, N.S.; Ribeiro, J.R.; Souza, R.M.; Leme, K.C.; Soares, C.B.; De Oliveira, C.M.; Elston, L.B.; et al. Development of a chitosan hydrogel containing flavonoids extracted from Passiflora edulis leaves and the evaluation of its antioxidant and wound healing properties for the treatment of skin lesions in diabetic mice. J. Biomed. Mater. Res. Part A 2019, 108, 654–662. [Google Scholar] [CrossRef] [PubMed]
  26. Li, H.; Zhou, P.; Yang, Q.; Shen, Y.; Deng, J.; Li, L.; Zhao, D. Comparative studies on anxiolytic activities and flavonoid compositions of Passiflora edulis “edulis” and Passiflora edulis “flavicarpa”. J. Ethnopharmacol. 2011, 133, 1085–1090. [Google Scholar] [CrossRef]
  27. Da Silva, J.K.; Cazarin, C.B.B.; Colomeu, T.C.; Batista, G.; Meletti, L.M.; Paschoal, J.A.R.; Júnior, S.B.; Furlan, M.F.; Reyes, F.G.R.; Augusto, F.; et al. Antioxidant activity of aqueous extract of passion fruit (Passiflora edulis) leaves: In vitro and in vivo study. Food Res. Int. 2013, 53, 882–890. [Google Scholar] [CrossRef] [Green Version]
  28. Lin, C.M.; Huang, S.T.; Liang, Y.C.; Lin, M.S.; Shih, C.M.; Chang, Y.C.; Chen, T.Y.; Chen, C.T. Isovitexin suppresses lipopolysaccharide-mediated inducible nitric oxide synthase through inhibition of NF-kappa B in mouse macrophages. Planta Med. 2005, 71, 748–753. [Google Scholar] [CrossRef]
  29. Choo, C.Y.; Sulong, N.Y.; Man, F.; Wong, T.W. Vitexin and isovitexin from the Leaves of Ficus deltoidea with in-vivo α-glucosidase inhibition. J. Ethnopharmacol. 2012, 142, 776–781. [Google Scholar] [CrossRef]
  30. Ramirez, V.; Arango, S.S.; Maldonado, M.E.; Uribe, D.; Aguillon, J.; Quintero, J.P.; Loango, N. Biological activity of Passiflora edulis f. Flavicarpa ethanolic leaves extract on human colonic adenocarcinoma cells. J. Appl. Pharm. Sci. 2019, 9, 64–71. [Google Scholar] [CrossRef] [Green Version]
  31. Chandrasekhar, D.; Jose, S.M.; Jomy, A.; Joseph, A.; Pradeep, A.; Geoji, A.S. Antiglycation property of Passiflora edulis f. Flavicarpa deg. foliage in type 2 diabetic patients. Clin. Epidemiol. Glob. Health 2018, 7, 409–412. [Google Scholar] [CrossRef] [Green Version]
  32. Salles, B.C.C.; Silva, M.A.D.; Taniguthi, L.; Ferreira, J.N.; Rocha, C.Q.D.; Vilegas, W.; Dias, P.H.; Pennacchi, P.C.; Duarte, S.M.D.S.; Rodrigues, M.R.; et al. Passiflora edulis Leaf Extract: Evidence of Antidiabetic and Antiplatelet Effects in Rats. Biol. Pharm. Bull. 2020, 43, 169–174. [Google Scholar] [CrossRef] [PubMed] [Green Version]
  33. Gomes, S.V.F.; Portugal, L.A.; Anjos, J.P.D.; Jesus, O.N.D.; Oliveira, E.J.D.; David, J.P.; David, J.M. Accelerated solvent extraction of phenolic compounds exploiting a Box-Behnken design and quantification of five flavonoids by HPLC-DAD in Passiflora species. Microchem. J. 2017, 132, 28–35. [Google Scholar] [CrossRef]
  34. Gadioli, I.L.; Cunha, M.D.S.B.D.; de Carvalho, M.V.O.; Costa, A.M.; Pineli, L.D.L.D.O. A systematic review on phenolic compounds in Passiflora plants: Exploring biodiversity for food, nutrition, and popular medicine. Crit. Rev. Food Sci. Nutr. 2018, 58, 785–807. [Google Scholar] [CrossRef]
  35. Oliveira, A.L.; Destandau, E.; Fougère, L.; Lafosse, M. Isolation by pressurised fluid extraction (PFE) and identification using CPC and HPLC/ESI/MS of phenolic compounds from Brazilian cherry seeds (Eugenia uniflora L.). Food Chem. 2014, 145, 522–529. [Google Scholar] [CrossRef] [PubMed]
  36. Bezerra, M.A.; Santelli, R.E.; Oliveira, E.P.; Villar, L.S.; Escaleira, L.A. Response surface methodology (RSM) as a tool for optimization in analytical chemistry. Talanta 2008, 76, 965–977. [Google Scholar] [CrossRef]
  37. Rosa, R.H.; Von Atzingen, G.V.; Belandria, V.; Oliveira, A.L.; Bostyn, S.; Rabi, J.A. Lattice Boltzmann simulation of cafestol and kahweol extraction from green coffee beans in high-pressure system. J. Food Eng. 2016, 176, 88–96. [Google Scholar] [CrossRef]
  38. Colivet, J.; Oliveira, A.L.; Carvalho, R.A. Influence of the bed height on the kinetics of watermelon seed oil extraction with pressurized ethanol. Sep. Purif. Technol. 2016, 169, 187–195. [Google Scholar] [CrossRef]
  39. Pereira, C.G.; Meireles, M.A.A. Supercritical fluid extraction of bioactive compounds: Fundamentals, applications and economic perspectives. Food Bioprocess Technol. 2010, 3, 340–372. [Google Scholar] [CrossRef]
  40. Secco, M.C.; Cansian, R.L.; Fischer, B.; Paroul, N.; Fernandes, I.A.; Junges, A. Valorization of Blueberry By-Products (Vaccinium spp.): Antioxidants by Pressurized Liquid Extraction (PLE) and Kinetics Models. Biointerface Res. Appl. Chem. 2022, 12, 1692–1704. [Google Scholar]
  41. Alara, O.R.; Abdurahman, N.H.; Ukaegbu, C.I. Extraction of phenolic compounds: A review. Curr. Res. Food Sci. 2021, 4, 200–214. [Google Scholar] [CrossRef]
  42. AOAC. Official Methods of Analysis of AOAC INTERNATIONAL, Aoac. 2005. Available online: https://www.techstreet.com/standards/official-methods-of-analysis-of-aoac-international-20th-edition-2016?product_id=1937367 (accessed on 2 November 2019).
  43. Yammine, S.; Brianceau, S.; Manteau, S.; Turk, M.; Ghidossi, R.; Vorobiev, E.; Mietton-Peuchot, M. Extraction and purification of high added value compounds from by-products of the winemaking chain using alternative/nonconventional processes/technologies. Crit. Rev. Food Sci. Nutr. 2018, 58, 1375–1390. [Google Scholar] [CrossRef]
  44. Spigno, G.; Tramelli, L.; De Faveri, D.M. Effects of extraction time, temperature and solvent on concentration and antioxidant activity of grape marc phenolics. J. Food Eng. 2007, 81, 200–208. [Google Scholar] [CrossRef]
  45. Rajha, H.N.; Ziegler, W.; Louka, N.; Hobaika, Z.; Vorobiev, E.; Boechzelt, H.G.; Maroun, R.G. Effect of the drying process on the intensification of phenolic compounds recovery from grape pomace using accelerated solvent extraction. Int. J. Mol. Sci. 2014, 15, 18640–18658. [Google Scholar] [CrossRef]
  46. Singleton, V.L.; Rossi, J.A. Colorimetry of Total Phenolics with Phosphomolybdic-Phosphotungstic Acid Reagents. Am. J. Enol. Vitic. 1965, 16, 144–158. [Google Scholar] [CrossRef]
  47. Zhishen, J.; Mengcheng, T.; Jianming, W. The determination of flavonoid contents in mulberry and their scavenging effects on superoxide radicals. Food Chem. 1999, 64, 555–559. [Google Scholar] [CrossRef]
  48. Kim, D.O.; Jeong, S.W.; Lee, C.Y. Antioxidant capacity of phenolic phytochemicals from various cultivars of plums. Food Chem. 2003, 81, 321–326. [Google Scholar] [CrossRef]
  49. Crank, J. The Mathematics of Diffusion. J. Am. Chem. Soc. 1957, 79, 1267–1268. [Google Scholar] [CrossRef]
  50. Ramos, P.E.; Cerqueira, M.A.; Cook, M.T.; Bourbon, A.I.; Khutoryanskiy, V.V.; Charalampoulos, D.; Teixeira, J.A.; Vicente, A.A. Development of an immobilization system for in situ micronutrients release. Food Res. Int. 2016, 90, 121–132. [Google Scholar] [CrossRef] [PubMed] [Green Version]
  51. Okamoto-Schalch, N.O.; Pinho, S.G.B.; de Barros-Alexandrino, T.T.; Dacanal, G.C.; Assis, O.B.G.; Martelli-Tosi, M. Production and characterization of chitosan-TPP/cellulose nanocrystal system for encapsulation: A case study using folic acid as active compound. Cellulose 2020, 27, 5855–5869. [Google Scholar] [CrossRef]
  52. Brand-Williams, W.; Cuvelier, M.E.; Berset, C. Use of a free radical method to evaluate antioxidant activity. LWT Food Sci. Technol. 1995, 28, 25–30. [Google Scholar] [CrossRef]
  53. Benzie, I.F.F.; Strain, J.J. The Ferric Reducing Ability of Plasma (FRAP) as a Measure of “Antioxidant Power”: The FRAP Assay. Anal. Biochem. 1996, 73, 366–369. [Google Scholar] [CrossRef] [Green Version]
  54. Chisté, R.C.; Mercadante, A.Z.; Gomes, A.; Fernandes, E.; Lima, J.L.F.D.C.; Bragagnolo, N. In vitro scavenging capacity of annatto seed extracts against reactive oxygen and nitrogen species. Food Chem. 2011, 127, 419–426. [Google Scholar] [CrossRef]
  55. Tadini, C.C.; Telis, V.R.N.; de Almeida Meirelles, A.J. Operações Unitárias na Indústria de Alimentos; LCT-Livros Técnicos e Científicos Editora Ltda.: Rio de Janeiro, Brazil, 2016; pp. 167–208. ISBN 978-85-216-3032-6. [Google Scholar]
  56. Bittencourt, G.M.; Firmiano, D.M.; Fachini, R.P.; Lacaz-Ruiz, R.; Fernandes, A.M.; Oliveira, A.L. Application of Green Technology for the Acquisition of Extracts of Araçá (Psidium grandifolium Mart. ex DC.) Using Supercritical CO2 and Pressurized Ethanol: Characterization and Analysis of Activity. J. Food Sci. 2019, 84, 1297–1307. [Google Scholar] [CrossRef] [PubMed]
  57. De Oliveira, N.A.; Mazzali, M.R.; Fukumasu, H.; Gonçalves, C.B.; de Oliveira, A.L. Composition and physical properties of babassu seed (Orbignya phalerata) oil obtained by supercritical CO2 extraction. J. Supercrit. Fluids 2019, 150, 21–29. [Google Scholar] [CrossRef]
  58. Santos, K.C.D.; Borges, T.V.; Olescowicz, G.; Ludka, F.K.; Santos, C.A.D.M.; Molz, S. Passiflora actinia hydroalcoholic extract and its major constituent, isovitexin, are neuroprotective against glutamate-induced cell damage in mice hippocampal slices. J. Pharm. Pharmacol. 2016, 68, 282–291. [Google Scholar] [CrossRef] [PubMed]
  59. Mustafa, A.; Turner, C. Pressurized liquid extraction as a green approach in food and herbal plants extraction: A review. Anal. Chim. Acta. 2011, 703, 8–18. [Google Scholar] [CrossRef] [PubMed]
  60. Mendiola, J.A.; Jaime, L.; Santoyo, S.; Reglero, G.; Cifuentes, A.; Ibañez, E.; Señoráns, F.J. Screening of functional compounds in supercritical fluid extracts from Spirulina platensis. Food Chem. 2007, 102, 1357–1367. [Google Scholar] [CrossRef]
  61. De Oliveira, N.A.; Cornelio-santiago, H.P.; Fukumasu, H.; de Oliveira, A.L. Green coffee extracts rich in diterpenes e Process optimization of pressurized liquid extraction using ethanol as solvent. J. Food Eng. 2018, 224, 148–155. [Google Scholar] [CrossRef]
  62. Reverchon, E.; Marrone, C. Supercritical extraction of clove bud essential oil: Isolation and mathematical modeling. Chem. Eng. Sci. 1997, 52, 3421–3428. [Google Scholar] [CrossRef]
  63. Wang, S.; Ma, Z.F.; Yao, H.Q. Fractal diffusion model used for diffusion in porous material within limited volume of stiff container. Chem. Eng. Sci. 2009, 64, 1318–1325. [Google Scholar] [CrossRef]
  64. Mezzomo, N.; Martínez, J.; Ferreira, S.R.S. Supercritical fluid extraction of peach (Prunus persica) almond oil: Kinetics, mathematical modeling and scale-up. J. Supercrit. Fluids 2009, 51, 10–16. [Google Scholar] [CrossRef]
  65. Beraldo, J. Estudo farmacognóstico de Passiflora edulis Sims. (Passifloraceae). Master’s Thesis, Departamento de Farmácia, Faculdade de Ciências Farmacêuticas da Universidade de São Paulo, São Paulo, Brazil, 2008. Available online: https://www.teses.usp.br/teses/disponiveis/9/9138/tde-14092017-125247/publico/Josseara_Beraldo_Mestrado.pdf (accessed on 2 November 2019).
  66. Carmo, M.C.L.D.; Martins, I.M.; Magalhães, A.E.R.; Maróstica Júnior, M.R.; Macedo, J.A. Passion fruit (Passiflora edulis) leaf aqueous extract ameliorates intestinal epithelial barrier dysfunction and reverts inflammatory parameters in Caco-2 cells monolayer. Food Res. Int. 2020, 133, 109162. [Google Scholar] [CrossRef] [PubMed]
Figure 1. Pareto chart for the effect of process variables on responses (a) for X0, (b) for TPC, (c) for FC and (d) for (EC).
Processes 11 02308 g001
Figure 2. Response surface generated by the second-order model that describes the influence of independent variables for the overall yield (X0) (a,b), FC (c,d) and energy consumption (e,f).
Processes 11 02308 g002
Figure 3. Contour surfaces generated by the first-order model that describe the influence of process variables on the composition in total phenolics (FC). Influence of T, RV and N.
Processes 11 02308 g003
Figure 4. Semi-continuous PLE profile at 100 °C depending on the concentration (g/g) of the extract in the leaf particles and time and its CER period.
Processes 11 02308 g004
Figure 5. Experimental points obtained at 100 °C through PLE in an intermittent process with the purging of the extract; these are the coupling of the results simulated by Fick’s Law and the experimental data.
Processes 11 02308 g005
Table 1. Range and levels of independent factors, temperature (T), solvent rinse volume (SV) and number of cycles (C).
Range and Levels of the Independent Factors
FactorsSymbol−α−101
Temperature (°C) x 1 46.66080100113.4
Solvent Volume (%) x 2 66.680100120133.4
Cycles (N) x 3 1.332344.67
Where α is ± 1.673, x 1 corresponds to temperature, x 2 is the percentage of solvent rinse volume and x 3 is the number of cycles.
Table 2. Ion transition, instrument settings and retention time for quantified isovitexin.
CompoundPrecursor Ion (m/z)Product Ion (m/z)DP a (V)CE b (eV)Dwell Time (s)RT c (min)
Isovitexin431311 *
283 **
96
96
20
32
0.2
0.2
4.73
a DP = Declustering Potential; b CE = Collision Energy (Ar was used as collision gas); c RT = Retention Time; * Quantification transition; ** Confirmation transition.
Table 3. The composition of Passiflora dried leaves in dry base and characteristics of the fixed beds of extraction.
Moisture5.98% ± 0.02
Gross fiber13.8% ± 0.2
Protein18.1% ± 0.1
Non-nitrogenous extract52.5% ± 0.3
Ethereal extract3.2% ± 0.1
Ash12.5% ± 0.1
Average particle diameter 472.15 µm
Real density (g/cm3)1.30 ± 0.01
Apparent density (g/cm3)0.306 ± 0.003
Fixed bed porosity0.7646
Average ± standard deviation, n = 3.
Table 4. CCRD matrix with the extraction global yield (%), total phenolic content (TPC), flavonoids content (FC) and energy consumption of extracts obtained by PLE using ethanol 70% (v/v), according to real (R) and coded (C) variables.
VariablesResponses
TestT (°C)SV (%)Cycles (N)Global Yield (%)TPC
(mg GAE/g Leaves)
FC
(mg QE/g Leaves)
Energy Consumption (w ∗ h)
RCRCRC
1(60)−1(80)−1(2)−122.330.2 ± 0.4 j36.7 ± 0.5 hi4.3
2(60)−1(120)1(4)127.036.1 ± 0.6 g44.8 ± 0.4 f7.1
3(100)1(80)−1(4)131.041.5 ± 0.3 a56.7 ± 0.3 b36.9
4(100)1(120)1(2)−129.640.8 ± 0.8 a49.1 ± 0.4 d17.1
5 *(80)0(100)0(3)029.036.9 ± 0.2 f46.5 ±0.7 e21.3
6(60)−1(80)−1(4)126.032.8 ± 0.4 h40.8 ± 0.3 g6.2
7(60)−1(120)1(2)−123.031.1 ± 0.7 j35.8 ± 0.4 i3.4
8(100)1(80)−1(2)−129.037.1 ± 0.2 f51.3 ± 0.6 c21.6
9(100)1(120)1(4)132.543.2 ± 0.6 a58.8 ± 0.2 a36.9
10 *(80)0(100)0(3)028.437.5 ± 0.2 d46.0 ± 0.6 ef20.8
11(47)−1.67(100)0(3)023.330.0 ± 0.2 k27.0 ± 0.3 j6.4
12(113)1.67(100)0(3)033.142.3 ± 0.3 a52.2 ± 0.7 c36.9
13(80)0(67)−1.67(3)026.737.8 ± 0.1 d48.8 ± 0.5 d13.6
14(80)0(133)1.67(3)029.738.4 ± 0.3 c48.2 ± 0.6 d14.1
15(80)0(100)0(1)−1.6722.531.4 ± 0.5 i37.5 ± 0.4 h8.9
16(80)0(100)0(5)1.6730.540.3 ± 0.3 b51.8 ± 0.3 c18.1
17 *(80)0(100)0(3)028.437.1 ± 0.9 f46.0 ± 0.5 ef17.9
* Central point; GAE: gallic acid equivalent; QE: quercetin equivalent; Average ± standard deviation, n = 4; St = 6 min; 1.67; P = 10.3 MPa; The extraction cell = 34 cm3; Nitrogen purging time = 100 s. Within each column, lowercase markers indicate significant differences at p < 0.05 using Tukey’s comparisons. Least square difference (LSD) for p = 0.05.
Table 5. Regression coefficients (Equation (3)) estimated for X0, TPC, FC and EC, with the corresponding regression coefficients, R2, and standard deviation.
CoefficientsGlobal Yield (%)TPCFCEC
Coefficient ValuePCoefficient ValuePCoefficient ValuePCoefficient ValueP
b0 (M)28.611.74 × 10−1137.131.48 × 10−1045.961.18 × 10−919.952.91 × 10−6
b1 (T) Linear2.940.003.894.80 × 10−67.352.05 × 10−610.481.39 × 10−6
b2 (SV) Linear0.640.010.770.040.150.78−0.270.71
b3 (N) Linear1.891.32 × 10−52.142.33 × 10−43.831.51 × 10−44.125.92 × 10−4
b11 (T) Quadratic−0.150.46−0.350.34−1.740.020.730.38
b12 (T × SV)0.030.900.150.72−0.400.57−0.560.56
b13 (T × N)−0.340.19−0.090.830.230.753.694.84 × 10−3
b23 (SV × N)0.140.550.040.921.140.140.790.42
b33 (N) Quadratic−0.760.01−0.470.210.052960.93−2.180.02
b22 (VS) Quadratic−0.150.470.320.381.440.04−2.060.03
R20.98 0.97 0.98 0.98
MS Residual0.42 1.32 3.65 6.62
Table 6. Semi-continuous PLE (case study one): Boundary conditions and effective diffusivity coefficient obtained for extraction by Fick’s diffusional model.
PropertyValue
T (°C)8090100
m i n (g)7.067.067.06
m o u t (g)4.374.194.06
c 1 i n (g/g)0.4250.4250.425
c 1 e q (g/g)0.0440.019<0.01
d ¯ (µm)472.2472.2472.2
D e f f (×10−12 m2/s)6.44 ± 0.42 a6.07 ± 0.38 a5.63 ± 0.43 a
R 2 (-)0.99080.98840.9814
Within the row, the lowercase marker (“a”) indicates significant differences at p < 0.05 using Tukey’s comparisons. Least square difference (LSD) for p = 0.05. Equal lowercase letters in the same row did not differ from each other.
Table 7. Semi-continuous PLE (case study one): Boundary conditions and effective diffusivity coefficient obtained by the combined linear period and Fick’s diffusional model.
PropertyValue
T (°C)8090100
m i n (g)7.067.067.06
m o u t (g)4.374.194.06
c 1 i n (g/g)0.4250.4250.425
c 1 e q (g/g)0.0440.019<0.01
N 1 (×10−4 g·g−1·s−1)7.01 ± 0.14 b6.63 ± 0.32 b7.54 ± 0.19 a
c 1 c r i t (g/g)0.166 ± 0.0230.128 ± 0.0230.139 ± 0.014
t 1 c r i t (s)370420390
d ¯ (µm)472.2472.2472.2
D e f f (×10−12 m2/s)4.49 ± 0.4911.79 ± 0.3002.55 ± 0.301
R 2 (-)0.99890.99400.9980
Within the row, the lowercase markers indicate significant differences at p < 0.05 using Tukey’s comparisons. Least square difference (LSD) for N 1 (p = 0.00865). Equal lowercase letters in the same row did not differ from each other.
Table 8. Boundary conditions and effective diffusion coefficient obtained for intermittent purge extraction at 100 °C.
PropertyValue
T (°C)100
m i n (g)7.01
m o u t (g)4.58
c 2 i n (g/g)0.425
c 1 e q (g/g)<0.01
c 2 ; c i c l o   4 r e s (g/g)0.046
d ¯ (µm)472.2
D e f f (×10−12 m2/s)1.28 ± 0.03
R 2 (-)0.9989
Average ± standard deviation, n = 3.
Table 9. Isovitexin quantification by HPLC.
SampleIsovitexin (µg/mL)Isovitexin
(mg/g of Dried Leaves)
Total Flavonoids
(mg QE/g Dried Leaves)
Test three113.9 ± 8.8 a1.45 ± 1.09 a 56.70 ± 028 b
Test nine135.6 ± 16.0 a1.38 ± 0.91 a 58.76 ± 0.21 a
PER 104.35 ± 2.2 a1.04 ± 0.64 a 27.17 ± 0.64 c
Within each column, lowercase markers indicate significant differences at p < 0.05 using Tukey’s comparisons. Least square difference (LSD) for p = 0.05. Equal lowercase letters in the same column did not differ from each other; PER is percolation.
Table 10. Antioxidant activity of extracts expressed through radical inhibition DPPH (%), ferric ion reduction (FRAP) and oxygen radical absorption (ORAC).
SampleDPPH (%Inhibition)FRAP (μmol/mL)ORAC (μmol/mL)
Test three69.8 ± 0.5 b19.5 ± 0.6 a95.0 ± 4.6 a
Test nine71.9 ± 1.9 ab16.7 ± 0.2 a89.8 ± 4.0 a
PER 74.1 ± 1.3 a14.8 ± 0.5 a47.2 ± 2.0 b
Tukey test at the 95% significance level; PER is percolation. Equal lowercase letters in the same column did not differ from each other.
Disclaimer/Publisher’s Note: The statements, opinions and data contained in all publications are solely those of the individual author(s) and contributor(s) and not of MDPI and/or the editor(s). MDPI and/or the editor(s) disclaim responsibility for any injury to people or property resulting from any ideas, methods, instructions or products referred to in the content.

