Article

Modeling and Operating Time Optimization of Layer Melt Crystallization and Sweating Processes

1
School of Chemical Engineering and Technology, Tianjin University, Tianjin 300072, China
2
State Key Laboratory of Catalytic Materials and Reaction Engineering, Research Institute of Petroleum Processing, SINOPEC, Beijing 100083, China
3
National Engineering Research Center of Industrial Crystallization Technology, Tianjin 300072, China
*
Authors to whom correspondence should be addressed.
Processes 2023, 11(4), 1047; https://doi.org/10.3390/pr11041047
Submission received: 17 February 2023 / Revised: 23 March 2023 / Accepted: 29 March 2023 / Published: 30 March 2023
(This article belongs to the Special Issue Green Separation and Purification Processes)

Abstract

:
Improving the separation efficiency of the layer melt crystallization process is a key but difficult task. Herein, a comprehensive model involving both crystallization and sweating was proposed and used to optimize the operating time of crystallization and sweating processes. The crystallization process was modeled based on the relationship between differential and integral distribution coefficients under a constant layer growth rate. For the sweating process, an empirical sweating equation was employed to govern the sweating model, the parameters of which were determined experimentally using P-xylene as the model substance. The separation efficiency was then optimized by minimizing the operating time at a given product purity and yield. A sensitivity analysis showed that the crystallization and sweating times nonlinearly increase with increasing yield. After the yield exceeds 0.65, an increasing crystallization time is the dominant factor in improving the separation efficiency, while the sweating time and ratio even slightly decrease. The total operating time at low yield is U-shaped with the layer growth rate. The optimal layer growth rate decreases with increasing yield. This model provides guidance for determining the optimal operating parameters of layer melt crystallization and sweating processes.

1. Introduction

As an important separation and purification method, melt crystallization is widely used in the separation of congeners, heat-sensitive substances, and electronic-grade chemicals [1,2,3,4]. Melt crystallization has the advantages of no solvents, a low energy consumption, and a high selectivity with high purity [5,6,7,8]. Layer melt crystallization is widely used due to its simple equipment and wide applicability. Layer melt crystallization is extremely temperature sensitive, and important parameters such as operating temperature and time have a great influence on the productivity of the crystallization and sweating processes [9,10,11,12]. However, due to the complexity of the crystallization and sweating processes, especially the sweating process, very few studies have been undertaken to determine the optimal operating parameters.
The purification efficiency of the crystallization process is usually expressed by the distribution coefficient. The value of the distribution coefficient is between 0 and 1, and the smaller the value, the better the purification. K. Wintermantel and G. Wellinghoff [13] introduced a relationship between the integral distribution coefficient and the constant differential distribution coefficient and gave the calculation formula for the differential distribution coefficient. Jovana Micovic et al. [14] showed that the differential distribution coefficient is linearly related to the layer growth rate within a certain concentration range. Beierling et al. [15] considered the effects of a high melt concentration and freezing rate on the differential distribution coefficient, deriving an analytical equation of the integral distribution coefficient. Shiau [16] proposed an empirical equation based on the fundamental mass balance to relate the effective distribution coefficient with the growth rate, mass transfer coefficient and impurity mole fraction in the melt. The model was validated with the xylene system, and it was found that the effective distribution coefficients increased with the increases in the growth rate the impurity mole fraction in the melt.
The sweating process is a post-crystallization treatment in which the layer temperature is raised to the melting point of pure component [1]. Crystals in contact with the impurity (inclusions) will be melted due to the lower melting point of the mixture. The diluted inclusions flow out of the pores and finally drain under the influence of gravity. After a while, the crystal layer is purified. Several sweating models, created experimentally and theoretically, allow simple predictions of sweat mass and concentration. Matsuoka et al. [17] calculated the melt proportion in the crystal layer for a constant temperature sweating process and experimentally determined the relationship between melt proportion and ultimate melt proportion. Kim et al. [18] experimentally determined the relationship between the discharged impurities and molten crystals and developed a sweating model that could be used to predict product purity. Jiang et al. [19,20,21] modeled the sweat flow during sweating from the perspective of fluid flow between porous crystal layers, and introduced fractal models into the study of crystal layer structure for the first time. The model can reflect the structural changes of the crystal layer during sweating and explain the changes in the permeability of the crystal layer and the composition of the sweat. Bai et al. [22] modeled the sweating process from the perspective of heat transfer and achieved an accurate prediction of sweat mass and concentration.
Gilbert et al. [23] used a nonlinear programming algorithm to optimize the crystallization and sweating operations with the linear combination of yield and crystallized mass as the objective function. The process constraints included factors such as product purity, process yield, cost, phase equilibrium and kinetics. The examples in the paper show the dependence of optimal values on distribution coefficients and constraints. Beierling et al. [15] compared and discussed the optimization results of the hybrid distillation/melt crystallization process at different modeling depths. The results showed that the costs of the hybrid process are highly dependent on the exact determination of the crystallization separation efficiency. The positive aspects of the improvement in the crystal purity due to sweating are more significant than the negative aspects of yield loss and prolonged crystallization time. Jiang et al. [24] optimized the operating temperature curve of the layer crystallization and sweating process by maintaining stable layer growth and controlling the migration of the sweating liquid phase and determined the average effective distribution coefficient of key ion impurities. The above optimization model considers less the impact of operating time on the yield. The operating time has a great influence on the separation efficiency of the single-stage batch crystallization process.
P-xylene (PX) is an important chemical raw material widely used in the polyester industry. Mixed xylene separation is an important challenge during PX production. The difference between the boiling points of PX and M-xylene (MX) is only 0.6 °C, and conventional distillation cannot separate them. However, their melting points are quite different (PX: 13.2 °C and MX: −48 °C); thus, PX can be purified by melt crystallization.
In this work, to determine the operating parameters of the layer melt crystallization process, a crystallization sweating model based on impurity distribution coefficients was established. A new constant temperature sweating model is established by combining mass balance and some experimental results. The sweating model focuses on the influence of the layer growth rate and the sweating time on the purification effect, and the model is verified by PX experiments. Combining the sweating model with the existing crystallization model, an optimization model with the minimum total operating time as the objective function is proposed. The minimization problem with constraints is solved by using the method of sequential least squares programming. Finally, using the optimization model, the operating conditions for different target yields are calculated.

2. Theory

2.1. Crystallization Process

In the layer melt crystallization process, crystallization occurs mainly at the solid–liquid (S–L) interface. Due to the phase equilibrium, the crystallized layer and the residual melt can contain different concentrations of impurities. As a rule, the concentration of impurities in the solid phase will decrease, while that in the liquid phase increases [13].
The purification effect of the crystallization process is usually expressed by the integral distribution coefficient, k i n t , which is defined as the impurity concentration in the crystal layer, c c r , divided by the impurity concentration in the initial melt, c m , 0 . k i n t is related to the crystallization ratio, A , and the constant differential distribution coefficient, k d i f f [13]:
k i n t = c c r c m , 0 = 1 ( 1 A ) k d i f f A
For a tube crystallizer, the crystallization ratio, A , can be calculated by Equation (2):
A = ρ c r ρ m ( 1 r t / r 0 2 )
where ρ c r and ρ m are the densities of the crystal layer and the melt, respectively, and r t and r 0 are the radial positions of the S–L interface at times t and 0, respectively.
The relationship between the two is as follows: r t = r 0 v t . v is the constant layer growth rate and t in this section is the crystallization time. The differential distribution coefficient, k d i f f , is defined as:
k d i f f = c c r s l c m = m r s l c m / m c r s l c m = m r s l m c r s l
where c c r s l and c m are the impurity concentrations in the crystal layer at the S–L interface and melt, respectively, and m r s l and m c r s l are the melt mass and the crystal layer mass of the crystal layer at the S–L interface, respectively.
The differential distribution coefficient is related to the layer growth rate. For a crystallization process with a constant layer growth rate, k d i f f is equal to the melt mass fraction in the crystal layer. For small changes in melt phase concentration, k d i f f is linearly related to the layer growth rate, v [14]. For the PX system used in this paper, the relationship between k d i f f and v was determined experimentally as:
k d i f f = 5.54 × 10 4 v + 0.1623

2.2. Sweating Process

The crystal layer includes pure crystals without impurities and inclusions containing impurities. During the sweating process, the molten crystals are mixed with the inclusions and the mixed melt is partially flowed out. Since the impurities in the crystal layer are discharged, the purity of the crystal layer is improved. The relationship of impurity concentration between the crystal layer and inclusions is:
c c r = c i w m o
where w m o and c i are the melt proportion in the crystal layer during the sweating process and the impurity concentration of inclusions, respectively.
The distribution coefficient for the sweating process, k s w , is defined as:
k s w = c c r , t c c r , 0 = c i , t w m o , t c i , 0 w m o , 0
where c c r , t and c c r , 0 are the impurity concentrations of crystal layer at t and 0 during sweating, respectively, and t in this section is the sweating time.
Assuming that the mass of the inclusions in the crystal layer is constant, the molten crystals will continuously dilute the inclusion impurities. Since the contact area of the S–L phases in the porous crystal layer is very large, the mixture can be regarded as complete mixed. A mass balance calculation on impurities in the inclusions can be performed, and then the change in the amount of impurities is equal to the difference between the output and input:
m r d c i = c i + 0 Q d t
where m r and Q are the inclusion mass in the crystal layer and the sweat mass flow rate, respectively. A value of 0 means that the new melt is free of impurities. Solving Equation (7), we obtain
c i , 0 c i , t d c i c i = 0 t Q m r d t
Assuming that m r is constant, then
ln c i , t c i , 0 = m s w m r
where m s w is the sweat mass. The sweating ratio, S , is defined as:
S = m s w m c r , 0
where m c r , 0 is the crystal layer mass before sweating. Substituting Equation (10) into Equation (9):
c i , t c i , 0 = e S / k d i f f
The coefficient B is introduced to represent the effect of the change in crystal layer structure and the non-ideality of the mixing process on the distribution coefficient. The value of B can be obtained through experiments. The distribution coefficient of the sweating process can thus be written as:
k s w = B e S / k d i f f
Through experiments and data fitting, B = 1 k d i f f is obtained, the experimental results are in the Section 4. For a constant temperature sweating process, the sweating ratio is mainly related to the crystallization ratio and sweating time. The relationship can be described as:
S = f ( t , A )

2.3. Process Optimization
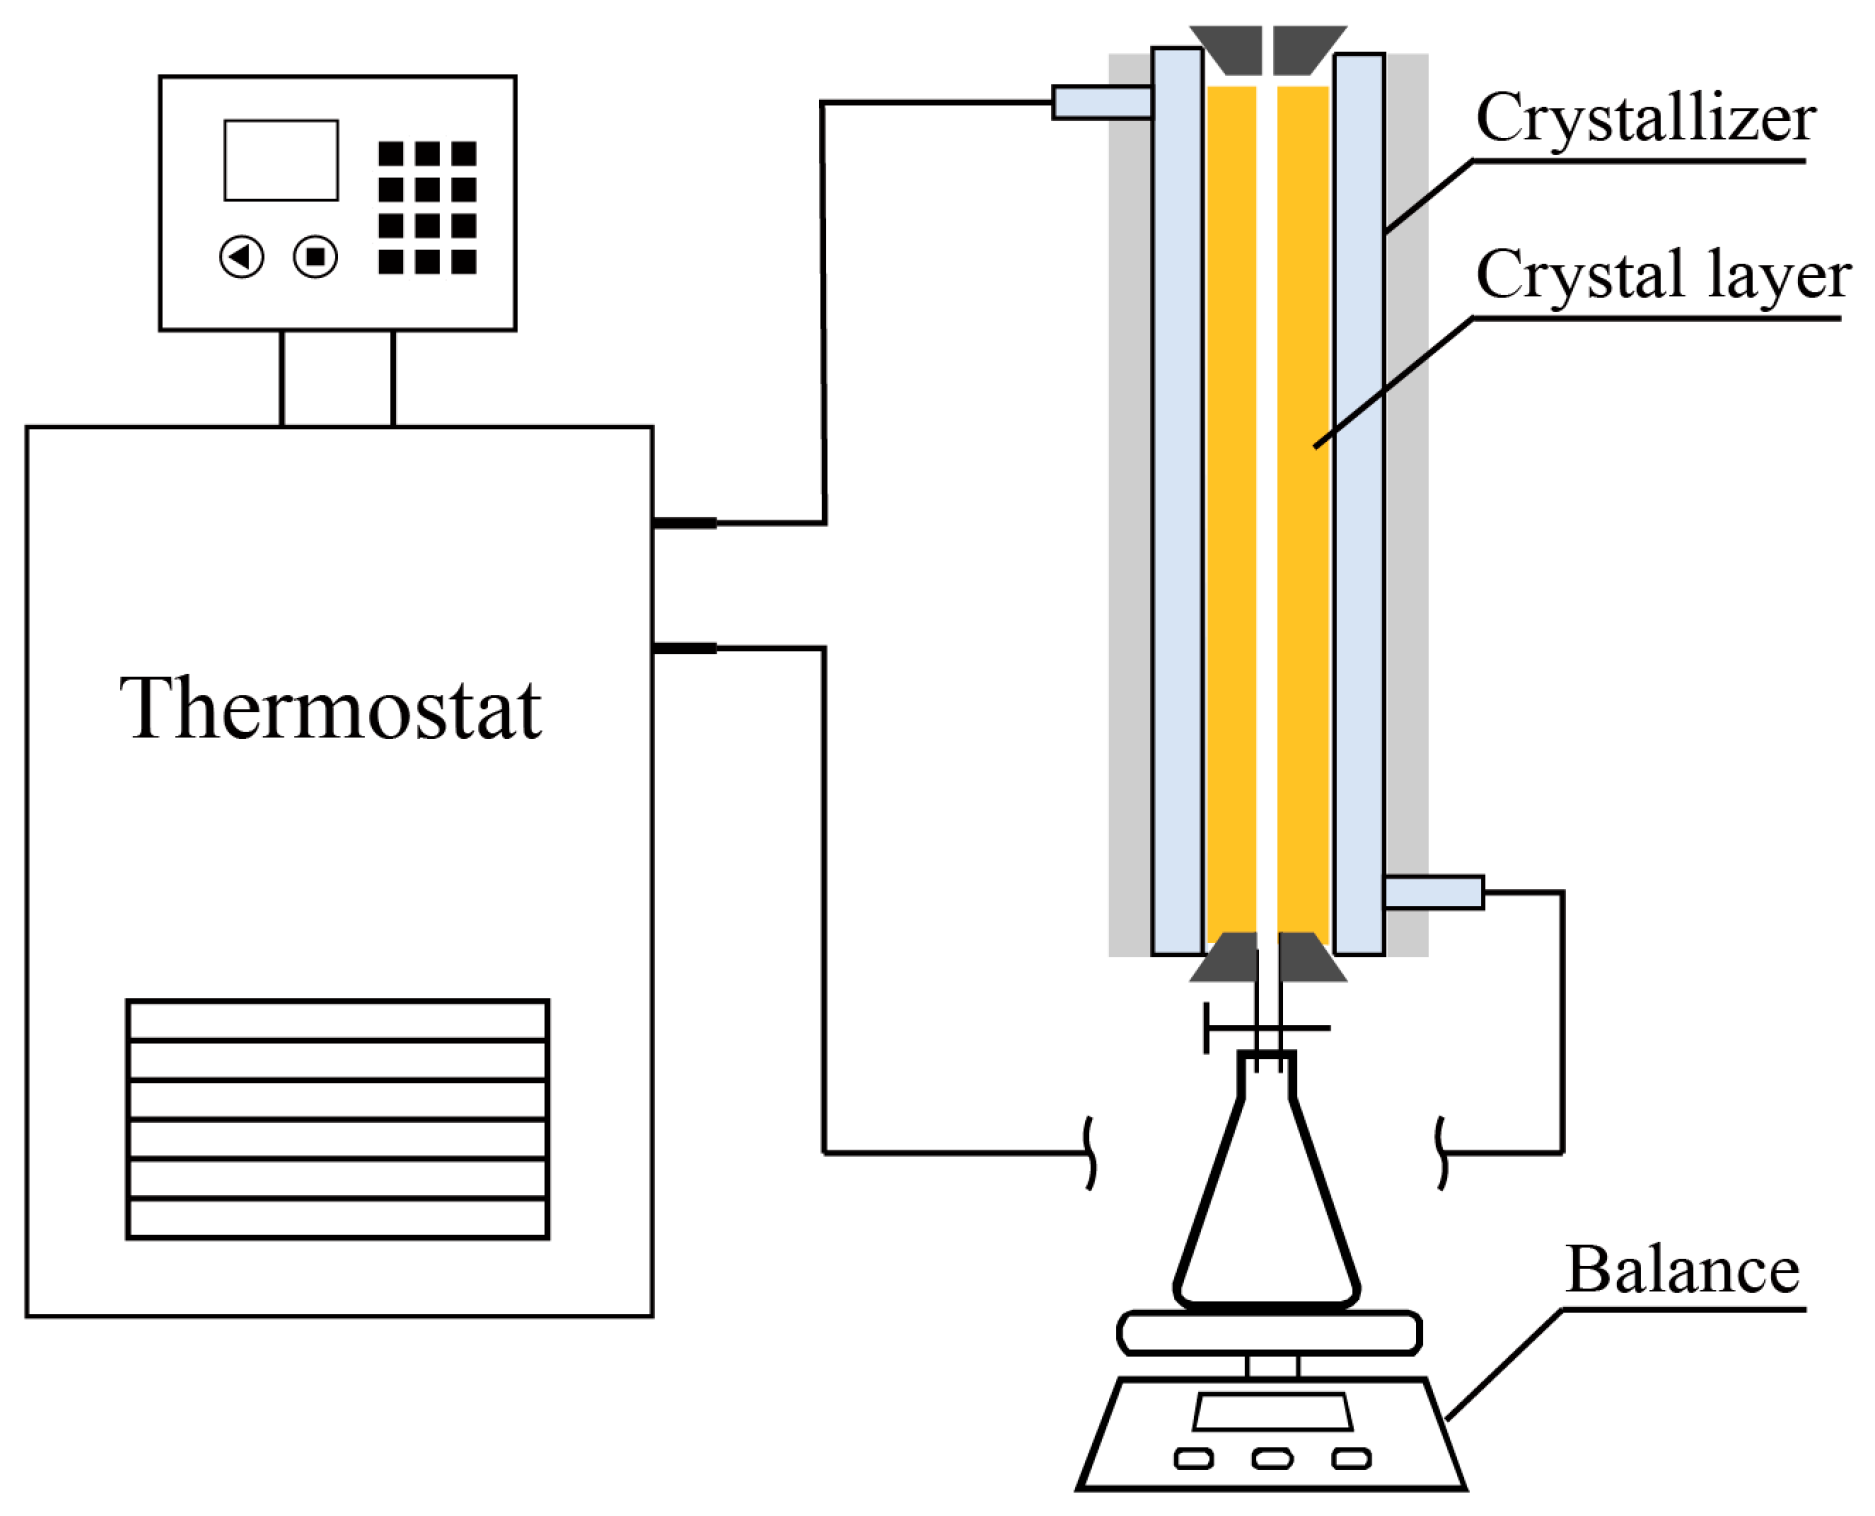
The crystallization and sweating models are combined to optimize the overall process. During optimization, the crystal layer growth rate and sweating temperature are constant. Given the target purity (>99.7%) and yield, the minimum total operating time is required. Let t c r y and t s w be the operating times of the crystallization and the sweating processes, respectively. Auxiliary operating times are equal for different runs. Then, the objective function of the optimization model is min   t c r y + t s w .
The total distribution coefficient, k t o t a l , is used to represent the target product purity. The total distribution coefficient is the product of the integral distribution coefficient, k i n t , and the sweating distribution coefficient, k s w , and its expression is as follows:
k t o t a l = k i n t k s w = 1 ( 1 A ) k d i f f A ( 1 k d i f f ) e S / k d i f f
The product yield, p , is related to the crystallization ratio and sweating ratio by
p = A ( 1 S ) 1 c p 1 c m , 0
where c p is the concentration of impurity of the product.
Substituting Equations (2), (4) and (13) into Equations (14) and (15), the mathematical model obtained for optimization is as follows:
min   t c r y + t s w s . t . k t o t a l ( v , t c r y , t s w ) a p ( v , t c r y , t s w ) b
where a = c P / c m , 0 , b is the product target yield. In this work, c p = 0.3 % .
For the minimization problem with the above constraints, the minimize function in the scipy.optimize package in Python 3.10 was used. The algorithm uses SLSQP [25] (sequential least squares programming). A sensitivity analysis focuses on the effect of layer growth rate and yield on operating time.

3. Experiments

3.1. Chemicals

P-xylene (PX, >99.7 wt%) was obtained from PetroChina Liaoyang Petrochemical Company, Liaoyang, China. M-xylene (MX, >98 wt%) was obtained from Macklin Biochemical Co., Ltd, Shanghai, China. The purity of the raw materials was determined by gas chromatography (FID, DB-WAX).

3.2. Experiments and Parameters

The sweat mass and concentration were monitored by the device shown in Figure 1 in the sweating experiment. The temperature of the tube crystallizer (length: 200 mm, inner diameter: 50 mm, glass thickness: 2.0 mm) was controlled by a circulator bath (Julabo CF41, Seelbach, Germany) with an accuracy of ±0.02 K.
In this paper, the concentration of PX in the initial melt was 95%. By setting different temperature curves, the crystal layer grew at different constant rates. To avoid primary nucleation, crystal seeds were added when the melt temperature was 10.5 °C.
During sweating, the temperature was kept constant at 13 °C. The crystal layer under different crystallization conditions was sweated for different durations, and the mass and concentration of the crystal layer and sweat after sweating were recorded. The collected data were used to analyze the purification efficiency of the sweating process.

4. Results and Discussions
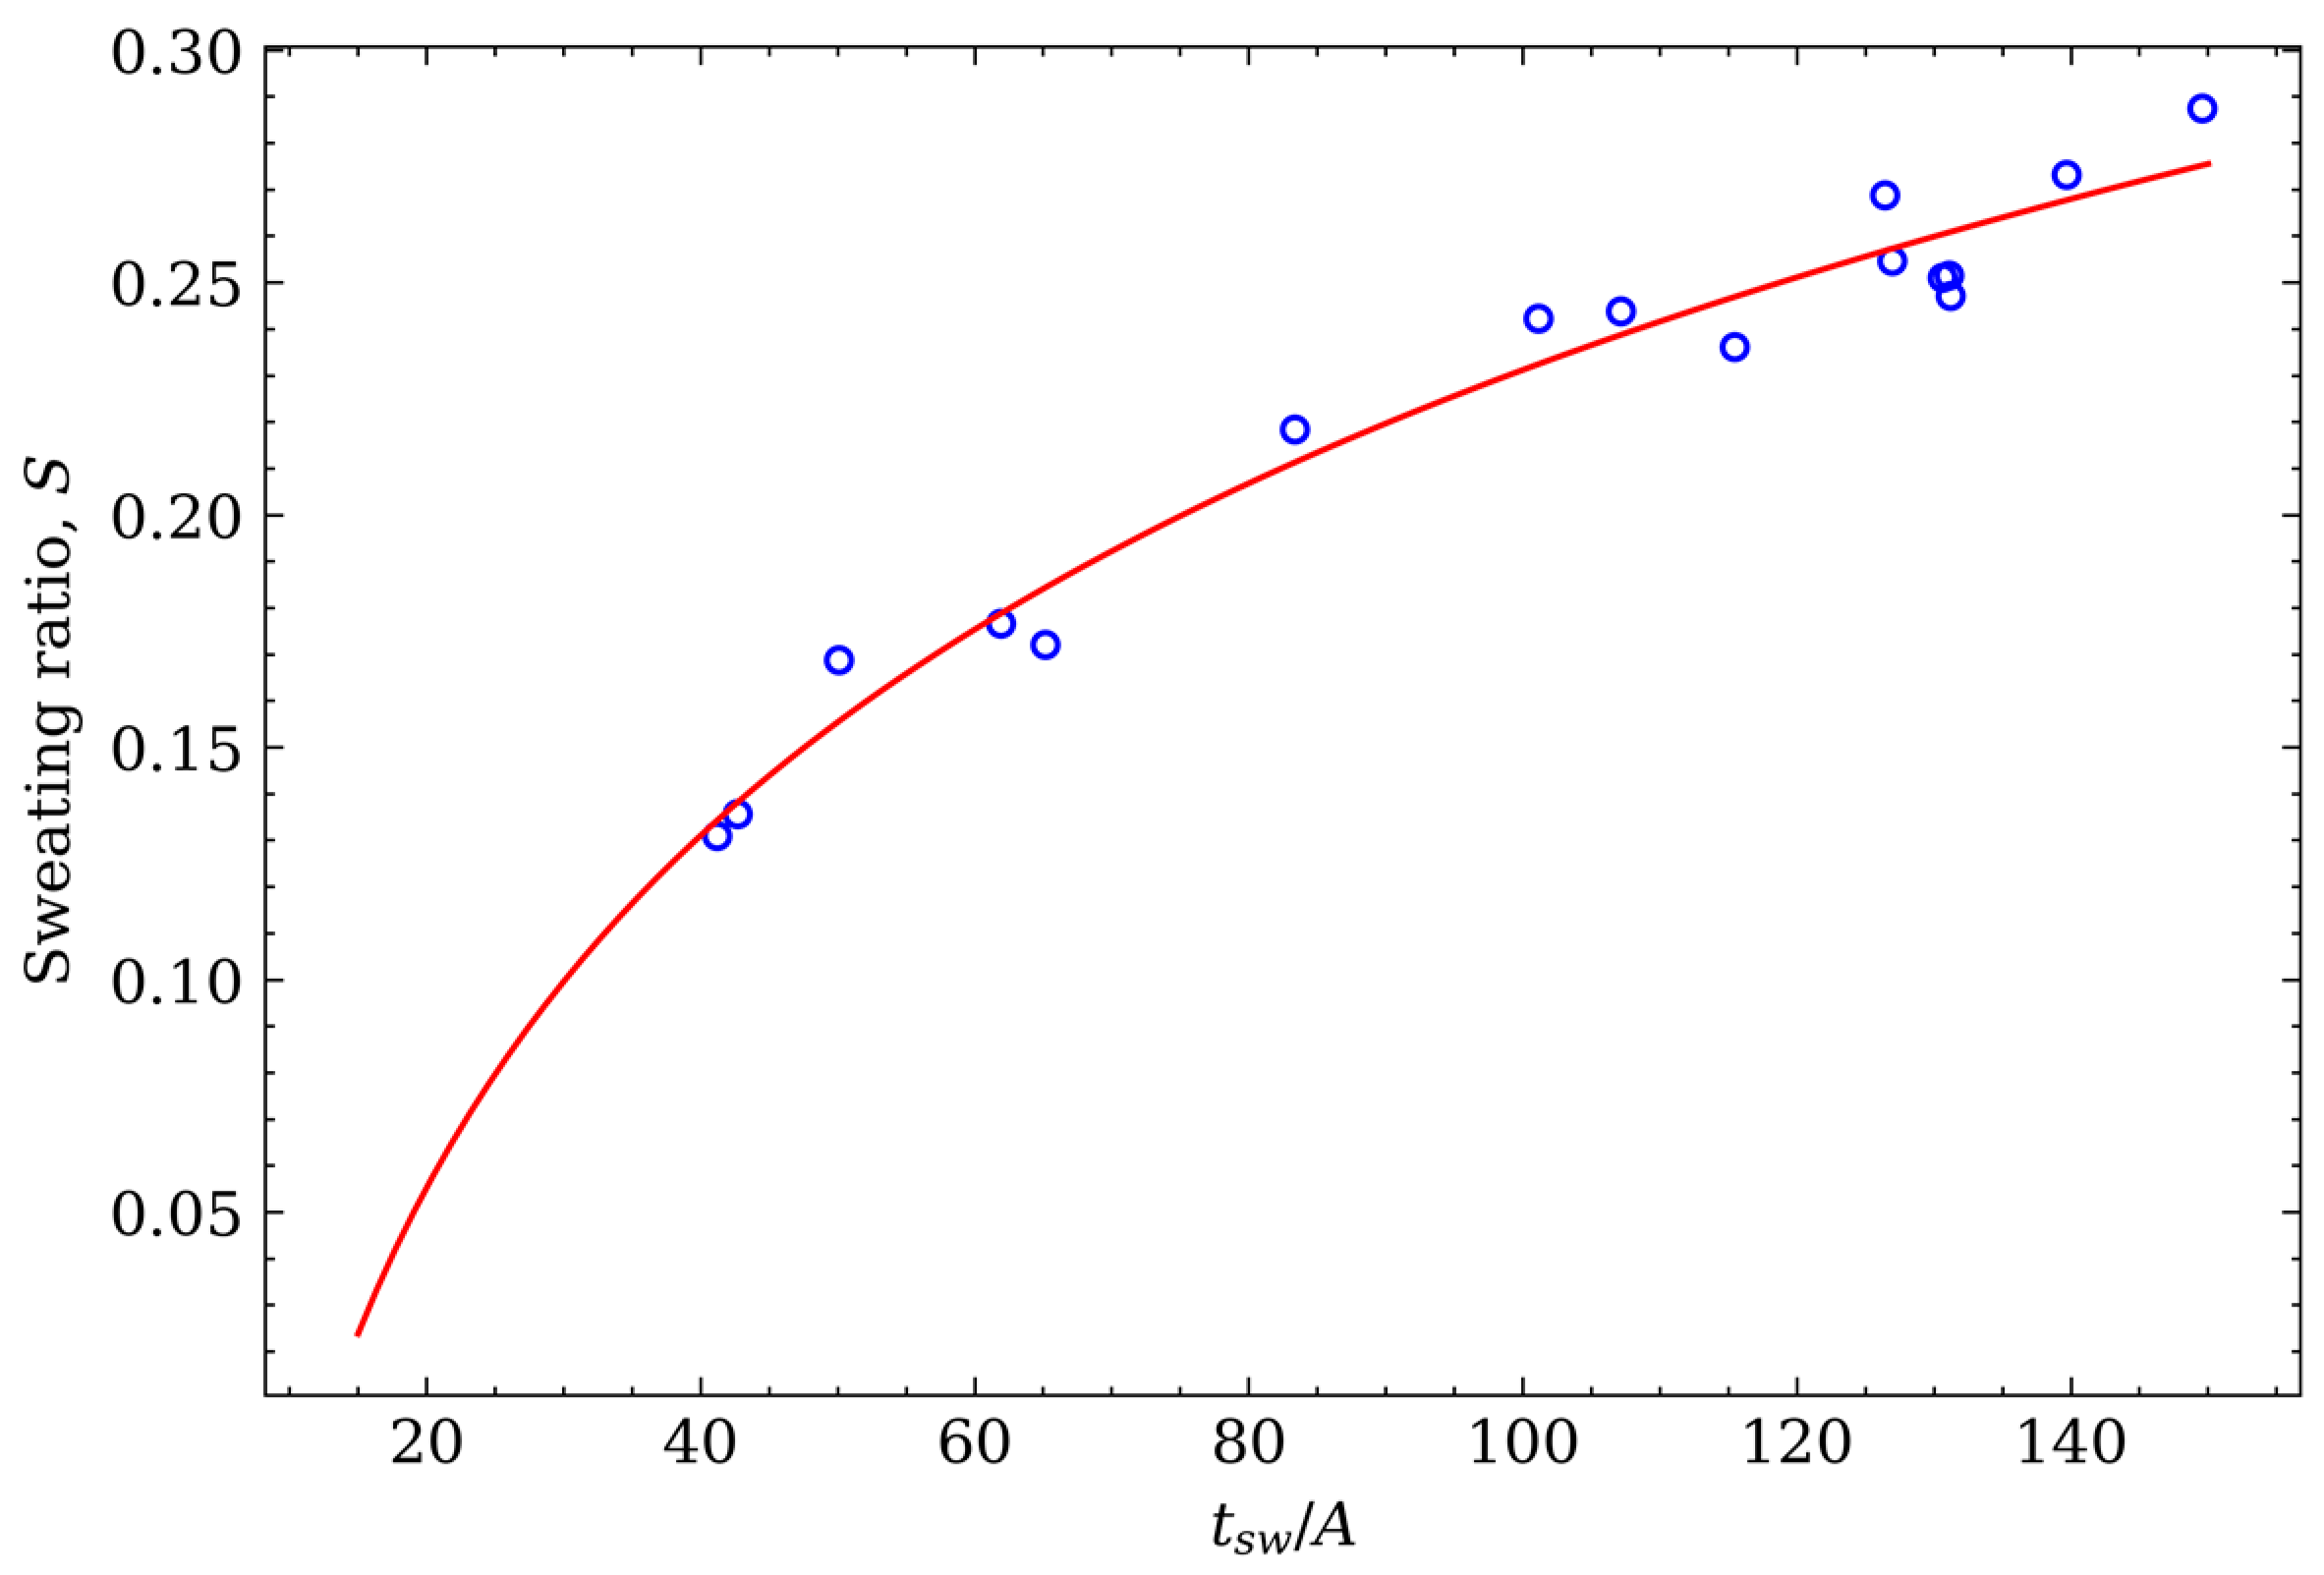
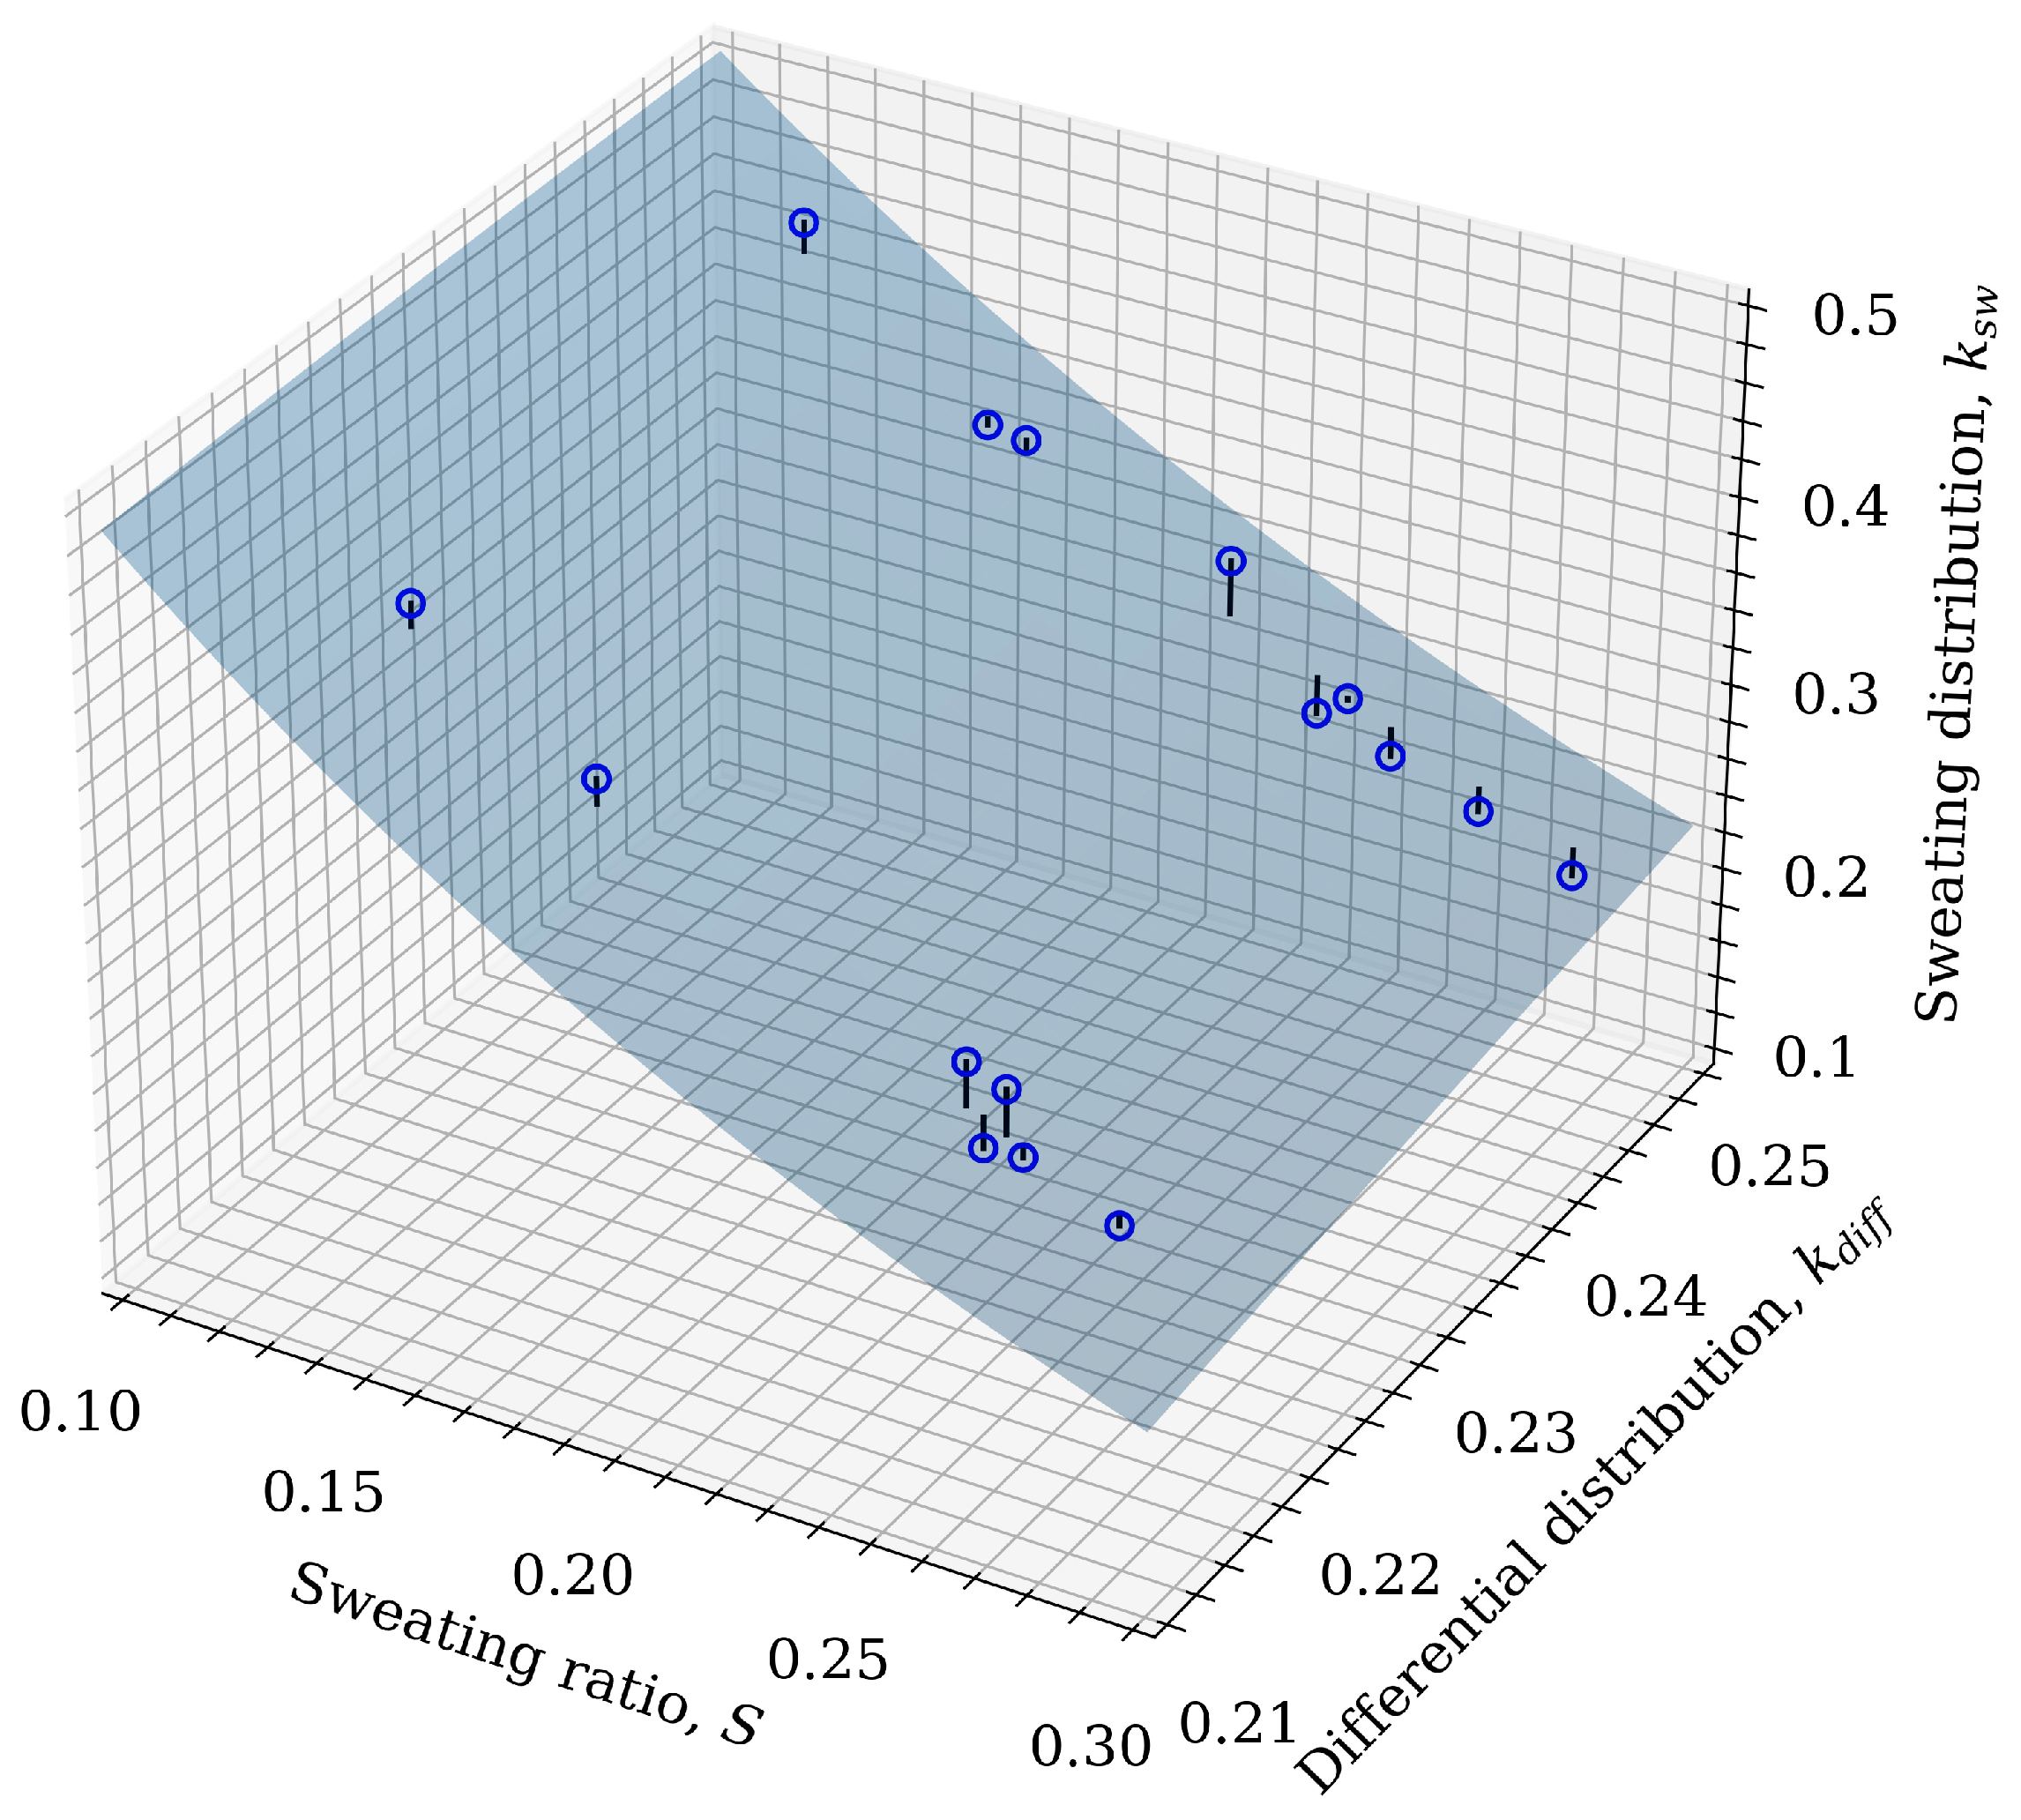
4.1. Sweating Model

In the constant temperature sweating experiment, the sweating ratio was positively correlated with the sweating time, and negatively correlated with the crystallization ratio. It was found that the higher the crystallization ratio, the larger the amount of crystals after the crystallization process. During the sweating process, the contact area between the crystal layer and the cold surface (heat transfer surface) was constant, and the crystallization ratio generally had little effect on the heat transfer temperature difference. This resulted in a small effect of the crystallization ratio on the heat transfer during sweating. However, the amount of sweat in the crystal layer was very sensitive to heat transfer. The sweat ratio is the ratio of the sweat mass to the un-sweated crystal layer mass. Therefore, the sweating ratio decreased with the increasing crystal layer mass (crystallization ratio). It is obvious that the sweating ratio increases with sweating time. A simple combination of the two results in the parameter t s w / A . As can be seen from the data points in Figure 2, the sweating ratio has a logarithmic relationship with t s w / A . The expression in Equation (13) was determined using the nonlinear least squares method, and the result is:
S = 0.109 ln ( t s w / A ) 0.272   ( R 2 = 0.964 )
An R 2 = 0.964 indicates that the fitting results of Equation (17) fit the sweating ratio well. As can be seen from the fitting results (red line) in Figure 2, the longer the sweating time, the slower the change in sweating ratio. For the sweating process at a constant temperature, the temperature of the crystal layer gradually approaches the sweating temperature as the sweating time increases. The amount of heat transfer between the two also decreases with a reduction in the heat transfer temperature difference. Under the same sweating time, the sweating ratio is inversely proportional to the crystallization ratio (crystal amount). The heat exchange area corresponding to the crystal layer per unit volume decreases with the increase in the crystal amount.
At t s w / A = 12 and S = 0 , the amount of sweat is very small in the first few minutes of sweating, which is also consistent with the experimental phenomena. During the process of changing from crystallization to constant temperature sweating, the machine needs some time to heat the heat exchange medium. Additionally, because there are a large number of pores in the crystal layer, the thermal resistance of the crystal layer is also relatively large. The combination of the two results in the low temperature of the crystal layer at the beginning. According to our previous research [22], the temperature of the crystal layer is directly related to the amount of sweating, so the amount of sweating in the early stage is very small.
Substituting the experimental results ( S and k d i f f ) into Equation (12), the calculated value of the sweat distribution coefficient is obtained. The R 2 of the calculated value and the experimental value is 0.958, which indicates that Equation (12) has a good fit to the sweat distribution coefficient. The dots in Figure 3 (experimental values) are near the surface (calculated values). The black line below the center of the dot indicates that the experimental value is larger than the calculated value, and vice versa. From the surface results, the sweating distribution coefficient decreases rapidly with the increase in the sweating ratio, while the differential distribution coefficient of the crystallization process has little effect. This shows that sweating is an effective post-crystallization treatment method, and it can achieve better purification effects on crystal layers under different crystallization conditions.

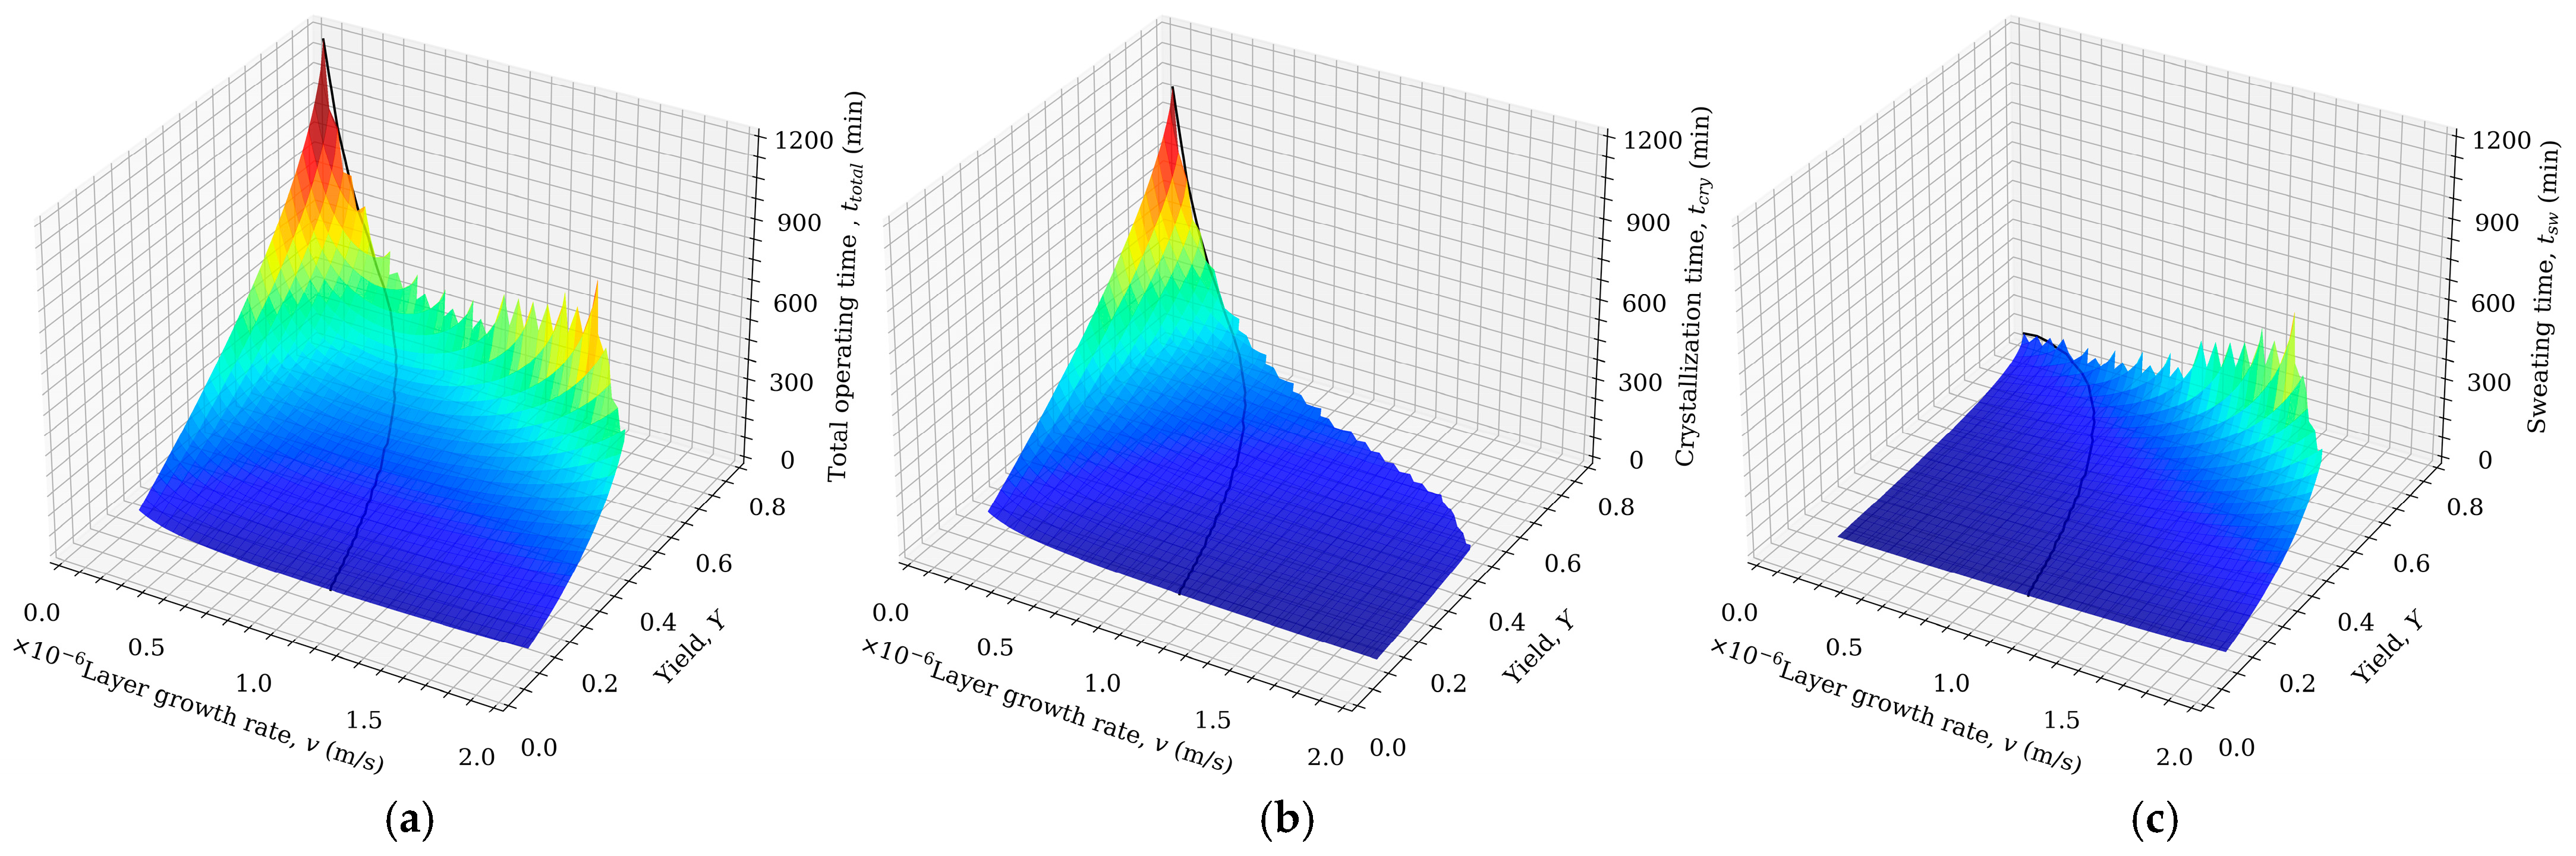
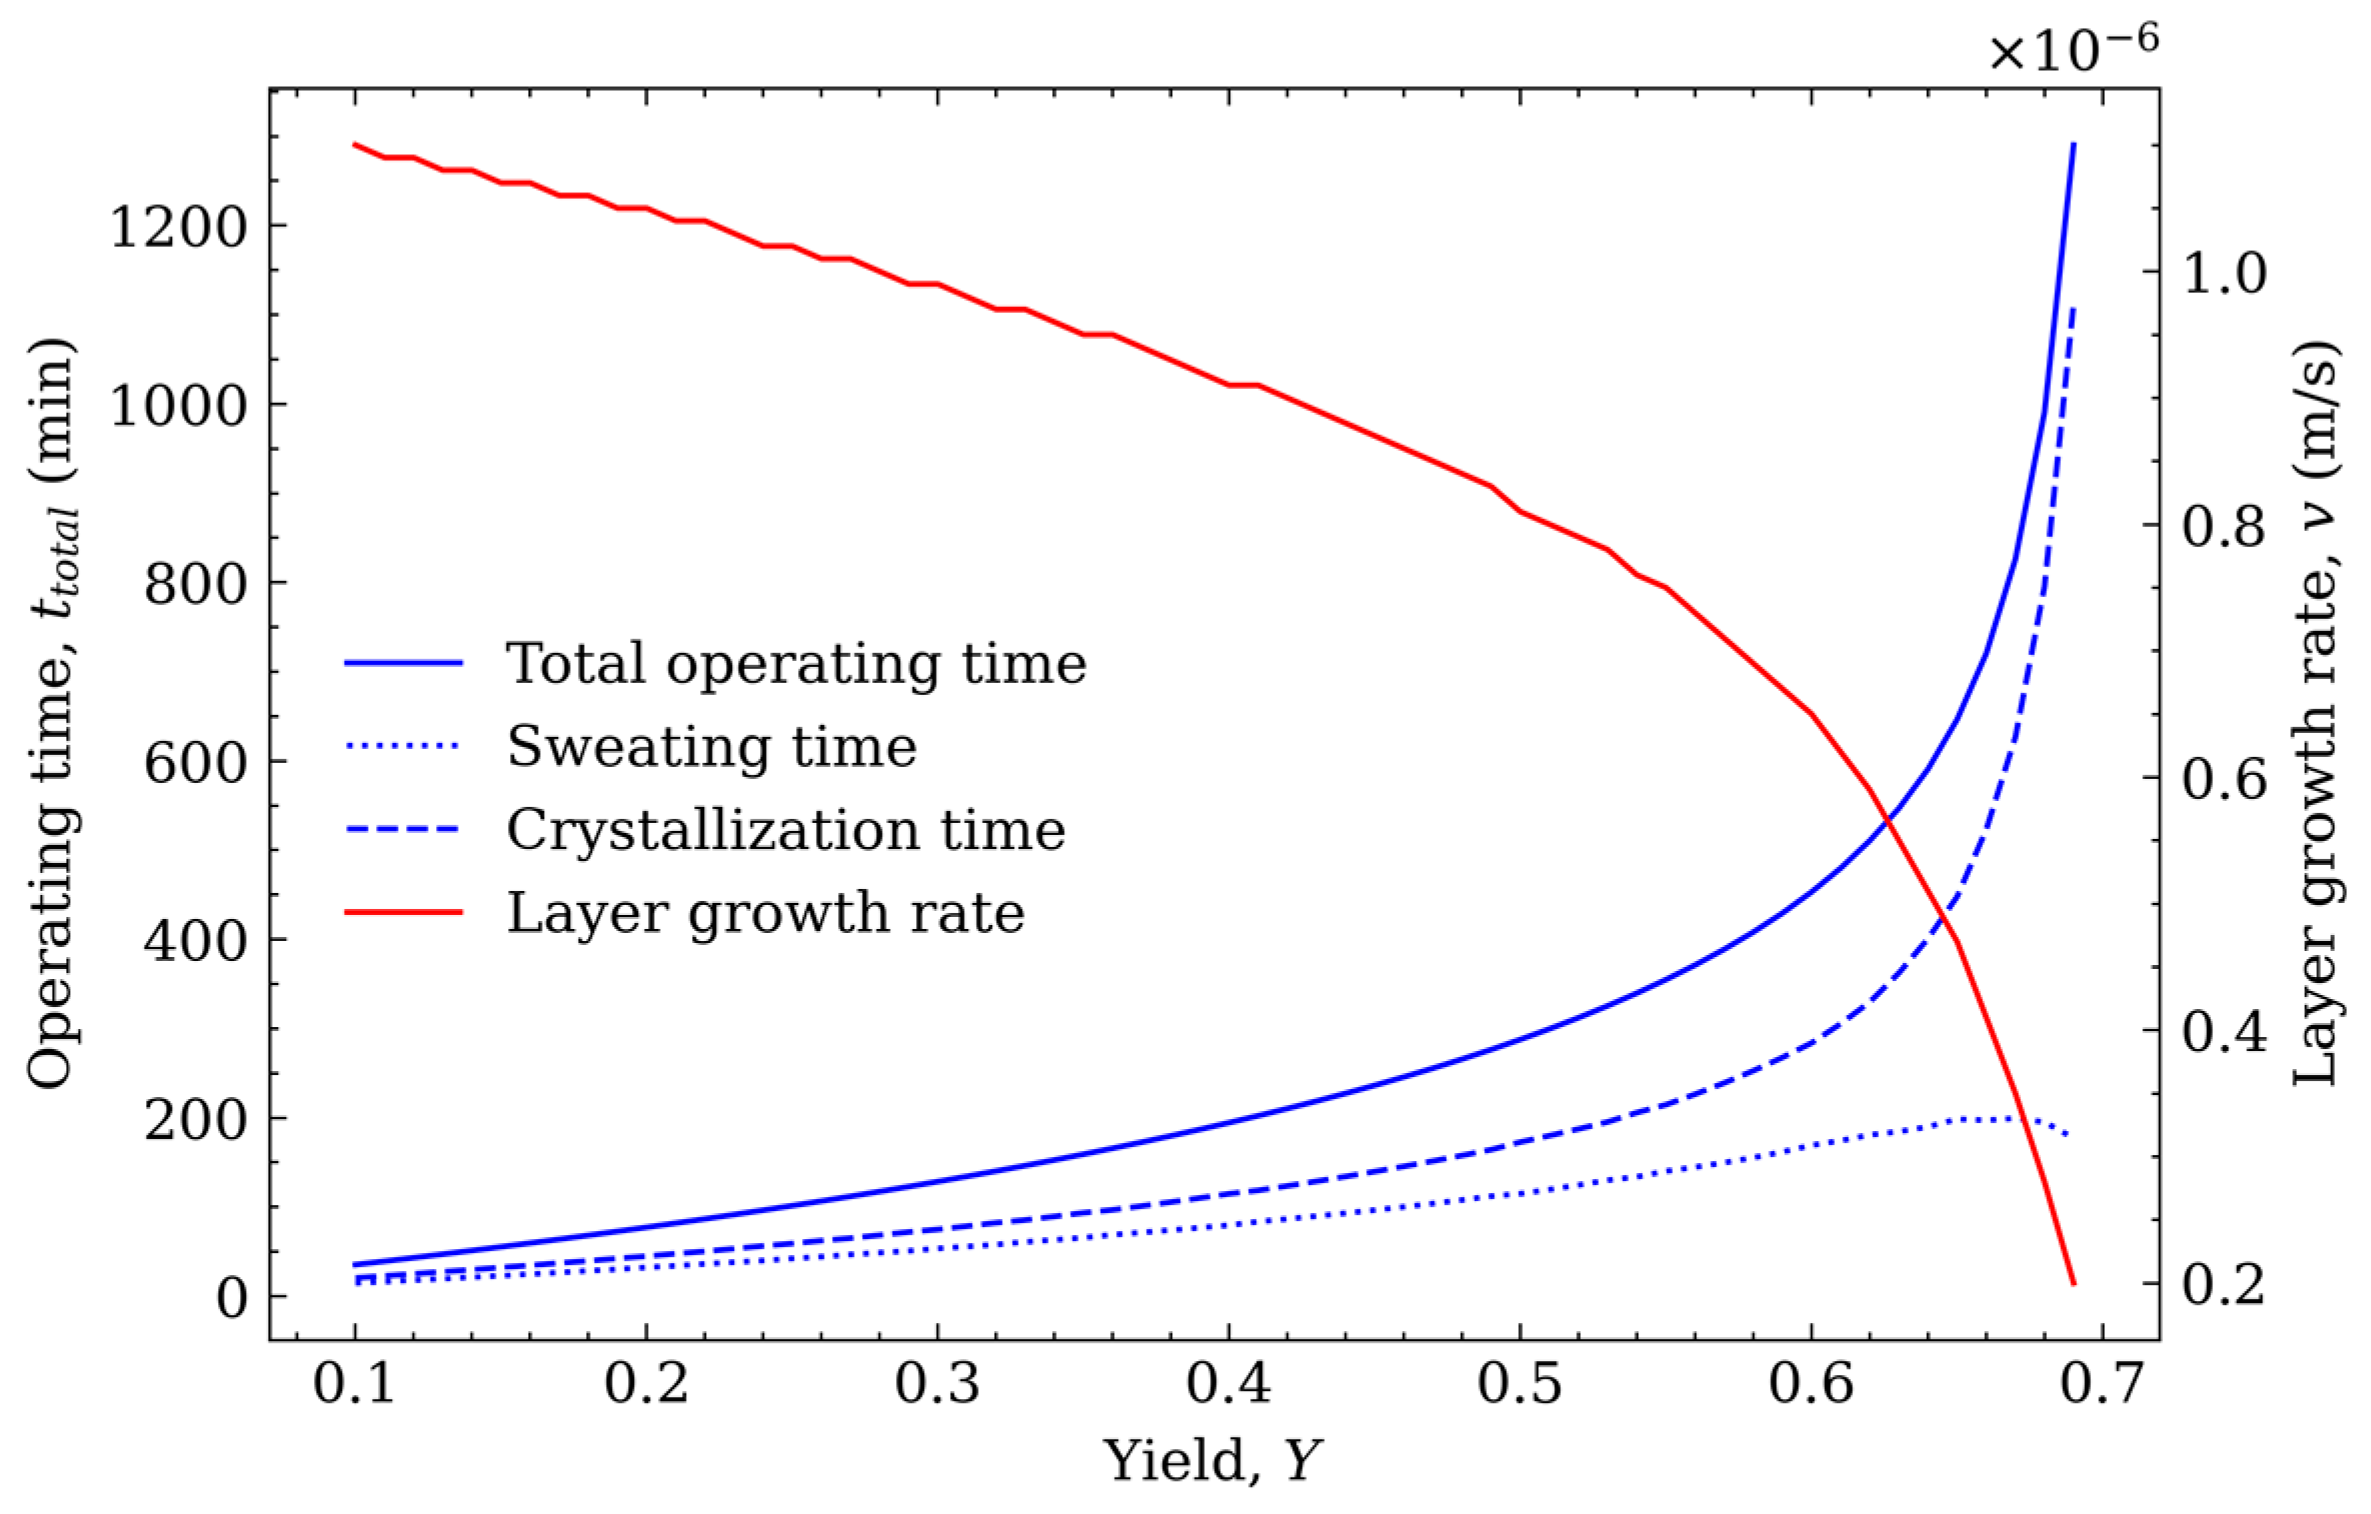
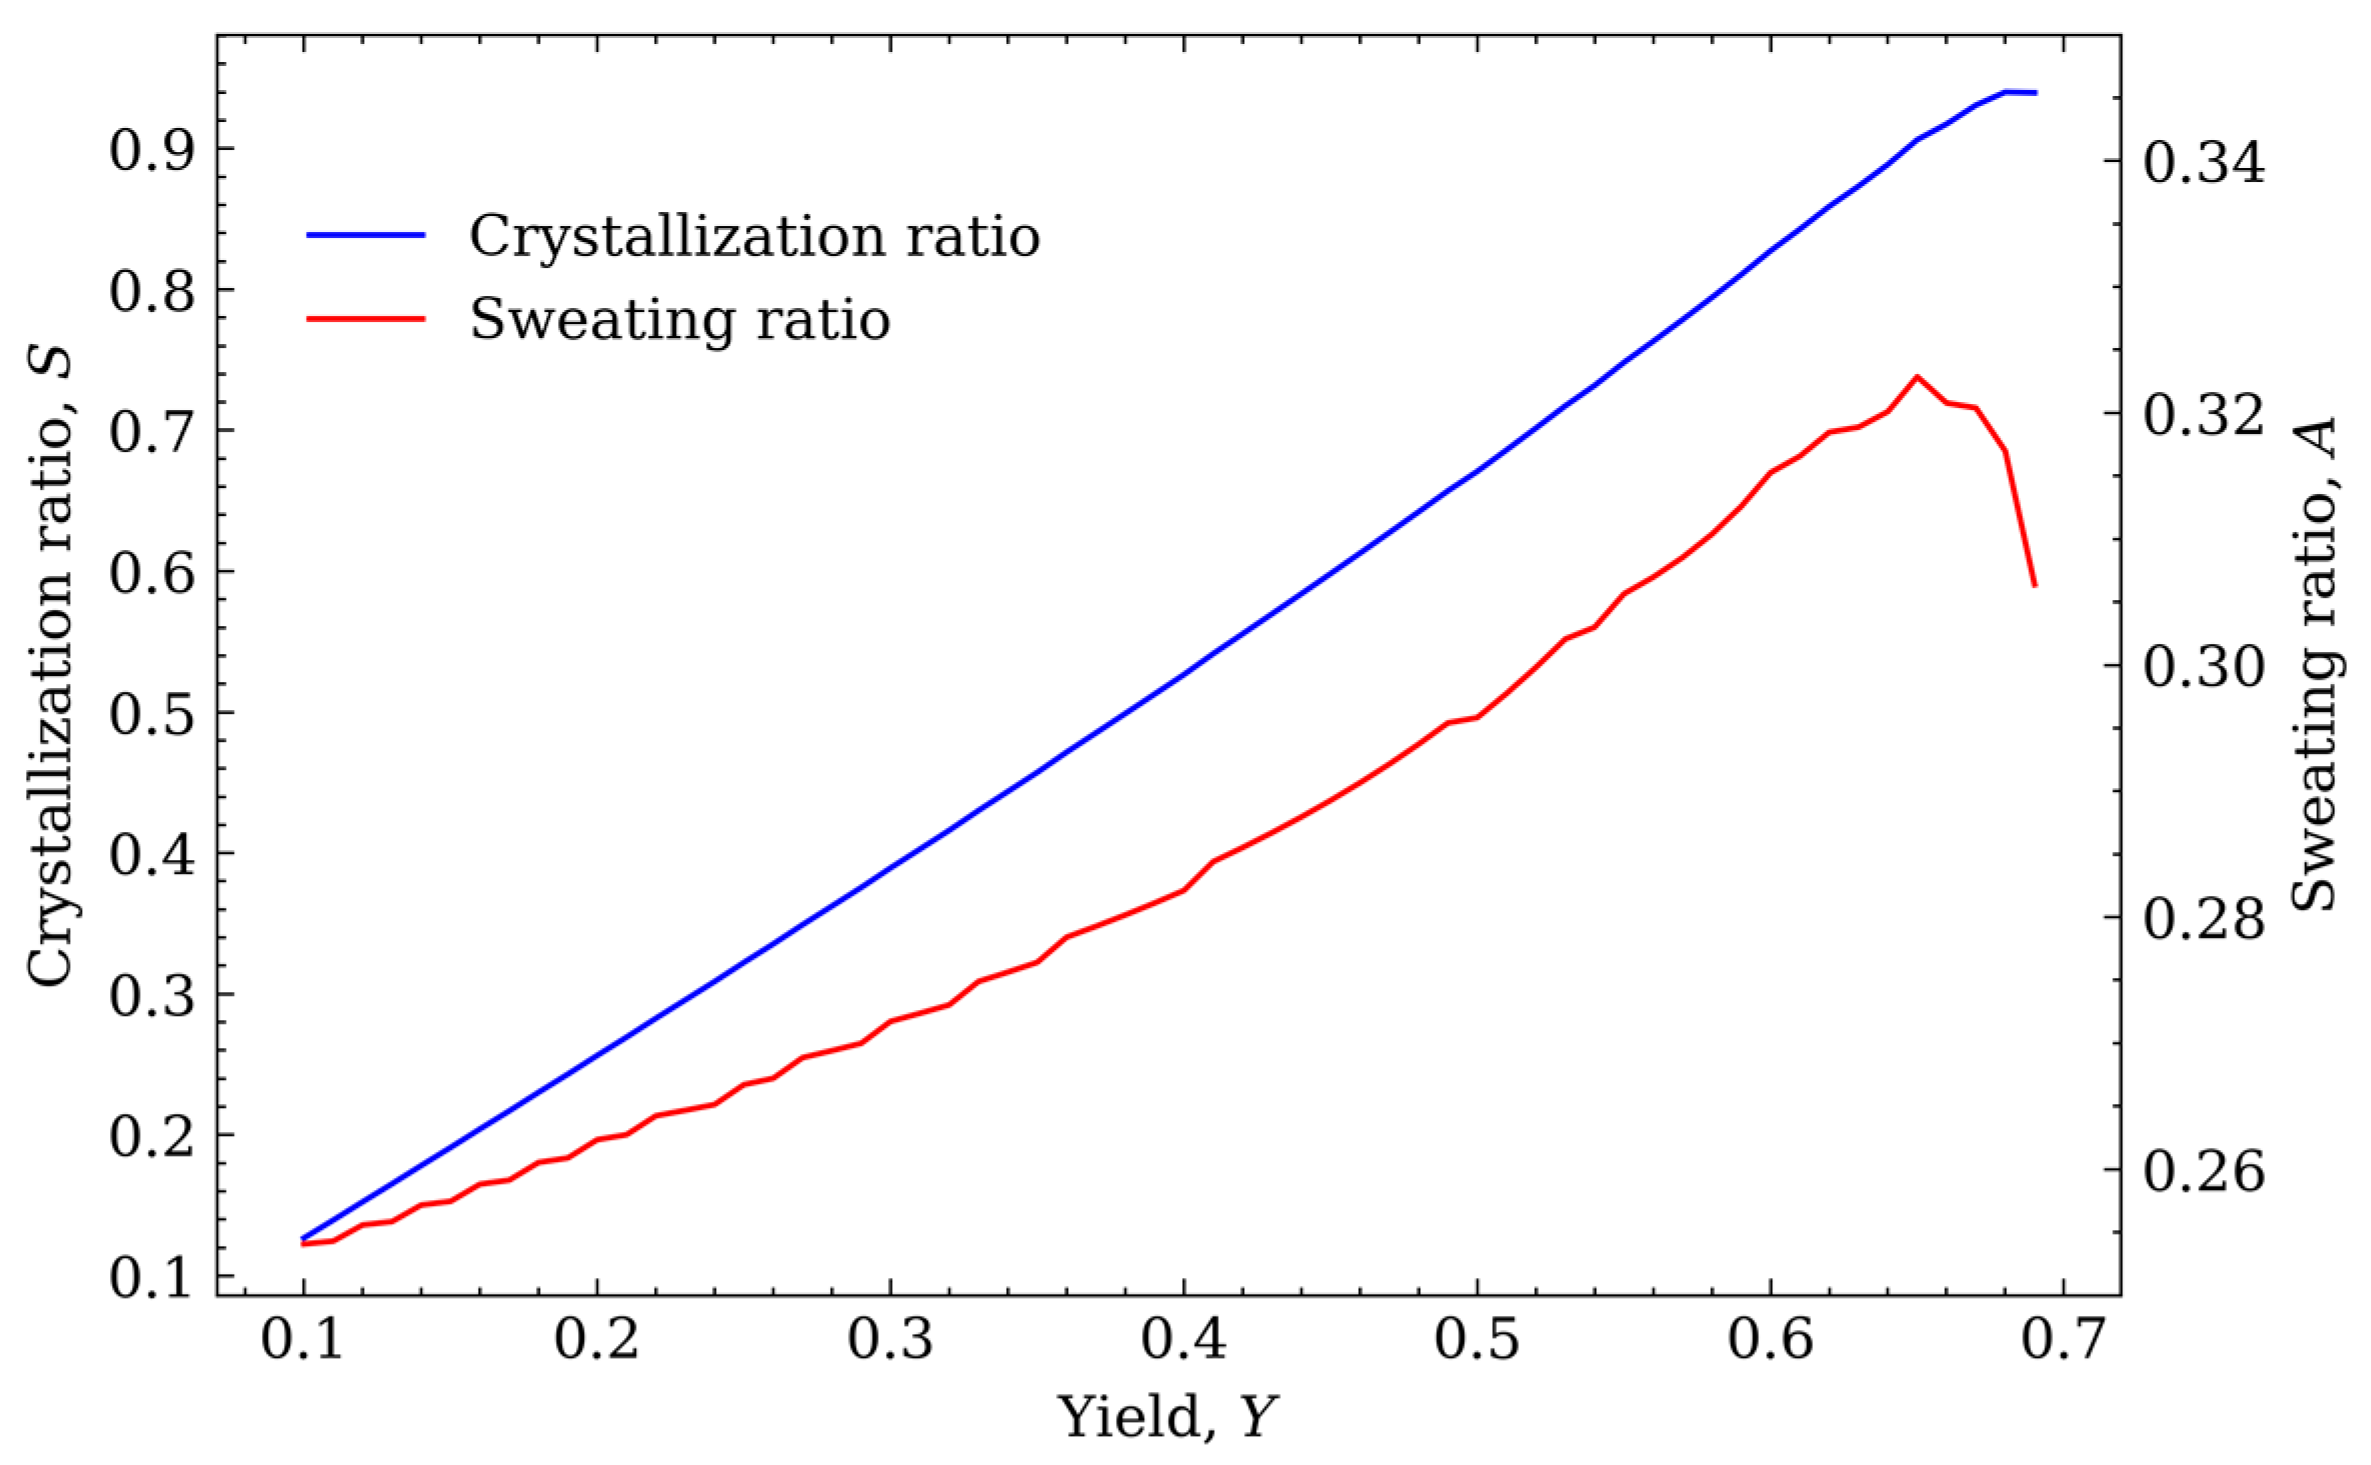
4.2. Optimization Results and Sensitivity Analysis

The variation in each operating time with the layer growth rate and product yield is shown in Figure 4. At a constant layer growth rate, the total operating time increases with the target yield. Additionally, the higher the yield, the greater the increase in total operating time. This is caused by the following two reasons. (1) For a tube crystallizer with a constant layer growth rate, the crystallization ratio decreases with a decrease in the S–L interface area. (2) The purity of the crystal layer obtained from the crystallization process decreases with the increase in the crystallization ratio, so more sweating time is required to obtain the target purity.
It can also be seen from Figure 4 that the yield upper limit is higher at low layer growth rates. However, this requires a long operating time. The crystal layer obtained at low layer growth rates is purer, requiring relatively small sweating losses to achieve the target purity. Therefore, it corresponds to a longer operating time and a higher yield. However, such high product yields cannot be obtained under high layer growth rate conditions because the crystal layer obtained under high yield conditions contains more inclusions, and a larger sweating ratio is required to obtain the product of target purity. A large sweating ratio reduces the product yield, so it has a lower upper limit for the product yield. At a determined yield, the crystallization time decreases with the increase in crystal layer growth rate (Figure 4b), while the sweating time exhibits the opposite trend (Figure 4c). This is also due to the lower purity of the crystal layer at the larger layer growth rate. The total operating time and layer growth rate exhibit a U-shape. There exists an optimal layer growth rate that minimizes the total operating time.
The black lines in Figure 4 are the optimal operating conditions for different yields. Figure 5 is the corresponding two-dimensional diagram. From this figure, the operating conditions at different yields can be read. For example, when the target yield is 0.5, the optimal operating conditions are a layer growth rate of 0.81 × 10 6 m/s, a crystallization time of 175 min and a sweating time of 110 min.
The optimal crystallization and sweating time increase with the increase in yield. When the yield < 0.45, the total operating time increases linearly, while when the yield > 0.45, the total operating time increases exponentially. The crystallization time is always greater than the sweating time, and the exponential variation in the total operation time is mainly due to the crystallization time. At yield > 0.45, the crystallization process becomes more important to the overall operation. It is necessary to obtain a purer crystal layer through the crystallization process. Three important parameters in the crystallization process, i.e., crystallization time, crystallization ratio and layer growth rate, are intrinsically related. At the same crystallization rate, the crystallization time is inversely proportional to the layer growth rate. Additionally, the optimization results show that with an increase in the crystallization rate, the trend in the layer growth rate is opposite to that of the crystallization time.
It can be seen from Equation (1) that k i n t increases with the increase in crystallization ratio, A . To obtain products with the required purity, k d i f f should be reduced by reducing the layer growth rate. The reduction in the crystal layer growth rate inevitably leads to an increase in the crystallization time.
The sweating time shows an almost linear variation with yield. The sweating process is an efficient means of crystal layer purification, and increasing the sweating ratio can improve the crystal layer purity. On the one hand, increasing the sweating ratio can make the allowable k i n t larger, thereby reducing the crystallization operating time. On the other hand, it will reduce the yield of the sweating process, which in turn requires a higher crystallization ratio to ensure the target yield. Since the crystallization and sweating processes interact with each other, the sweating time should be increased appropriately at high yield targets.
As can be seen from Figure 6, the crystallization and the sweating ratio under optimal conditions both increase with the increase in the target yield. Improving the crystallization ratio ensures a sufficient yield, but the higher the crystallization ratio, the lower the product purity. This requires an increased sweat ratio to ensure the purity of the crystal product. However, due to the increased sweating ratio, some product will be lost and the operating time will be prolonged, but it is worth it. The same conclusion was also presented in the study of Beierling et al. [15]. Therefore, to ensure the purity of the product, the crystallization ratio needs to be increased along with the sweating ratio.
There is a slight decrease in the sweating ratio when the yield is greater than 0.65. This mainly occurs in the red part in Figure 4a, and the optimization result changes from the original U-shape to a function that monotonically decreases with the crystallization rate. Its extremum exists on the edge of the model results, indicating that the yield of the product can only be increased by increasing the crystallization time at this stage. It can also be seen from Figure 5 that the corresponding sweating time has a slight decrease, while the crystallization time has increased significantly. At this yield, the crystallization ratio is already greater than 0.9. According to Equation (1), increasing the crystallization ratio at this time will greatly reduce the purity of the crystal layer. Due to the high yield requirement, the product purity cannot be improved through more sweating. Only by increasing the crystallization time and reducing the sweat ratio can the yield and purity be simultaneously guaranteed.

5. Conclusions

In this work, a new sweating model was proposed by combining mass balance and experimental parameter fitting. Combined with the existing crystallization model, a comprehensive mathematical model that is applicable for optimizing both layer melt crystallization and sweating processes was established. The optimization model was solved by the sequential least squares programming algorithm.
In a constant temperature sweating process, the sweating ratio was found to be directly proportional to the sweating time and inversely proportional to the crystallization ratio. The rate of the increase in the sweating ratio decreases with increasing sweating time. The purifying effect of sweating (the sweating distribution coefficient) is mainly related to the sweating ratio.
The model optimization results showed that the total operating time increased with the target yield. When the yield was > 0.45, the total operating time increased significantly, which was mainly caused by the increased crystallization time. When the yield was > 0.65, the sweating ratio exhibited a slight drop, and the influence of the sweating ratio on the yield was significant. The total operating time at low yield is U-shaped with the layer growth rate due to the interaction of crystallization and sweating processes.
This work determined the conditions of the layer melt crystallization and sweating processes using PX as the model substance. It can also provide helpful guidance for the selection of operating parameters for the layer melt crystallization and sweating of other substances.

Author Contributions

Conceptualization, Y.B. and C.X.; methodology, Y.B.; software, Y.B.; validation, L.Q. and Y.S.; formal analysis, L.Q.; investigation, C.X.; resources, C.X.; data curation, Y.B. and Y.S.; writing—original draft preparation, Y.B.; writing—review and editing, Y.B. and L.Q.; visualization, Y.S.; supervision, C.X. and Z.Z.; project administration, C.X.; funding acquisition, Z.Z. All authors have read and agreed to the published version of the manuscript.

Funding

This research was funded by the National Engineering Research Center for Petroleum Refining Technology and Catalyst (RIPP, SINOPEC). Grant no. 22-ZC0607-0027.

Data Availability Statement

Not applicable.

Conflicts of Interest

The authors declare no conflict of interest.

References

  1. Ulrich, J.; Stelzer, T. Melt Crystallization. In Crystallization; Beckmann, W., Ed.; Wiley-VCH Verlag GmbH & Co., KGaA: Weinheim, Germany, 2013; Volume 15, pp. 289–304. ISBN 978-3-527-65032-3. [Google Scholar]
  2. Yazdanpanah, N.; Ferguson, S.T.; Myerson, A.S.; Trout, B.L. Novel Technique for Filtration Avoidance in Continuous Crystallization. Cryst. Growth Des. 2016, 16, 285–296. [Google Scholar] [CrossRef]
  3. Fukui, K.; Maeda, K.; Kuramochi, H. Melt Crystallization for Refinement of Triolein and Palmitic Acid Mixture as a Model Waste Oil for Biodiesel Fuel Production. J. Cryst. Growth 2013, 373, 102–105. [Google Scholar] [CrossRef]
  4. Zhou, L.; Su, M.; Benyahia, B.; Singh, A.; Barton, P.I.; Trout, B.L.; Myerson, A.S.; Braatz, R.D. Mathematical Modeling and Design of Layer Crystallization in a Concentric Annulus with and without Recirculation. AIChE J. 2013, 59, 1308–1321. [Google Scholar] [CrossRef] [Green Version]
  5. Beierling, T.; Gorny, R.; Sadowski, G. Modeling Growth Rates in Static Layer Melt Crystallization. Cryst. Growth Des. 2013, 13, 5229–5240. [Google Scholar] [CrossRef]
  6. Ahmad, M.; Ulrich, J. Separation of Complex Feed Streams of a Product by Layer Melt Crystallization. Chem. Eng. Technol. 2016, 39, 1341–1345. [Google Scholar] [CrossRef]
  7. Chen, W.; Li, S.; Li, S. Purification of 2-Pyrrolidone by Falling Film Melt Crystallization. Ind. Eng. Chem. Res. 2021, 60, 13286–13292. [Google Scholar] [CrossRef]
  8. Jia, S.; Jing, B.; Hong, W.; Gao, Z.; Gong, J.; Wang, J.; Rohani, S. Purification of 2,4-Dinitrochlorobenzene Using Layer Melt Crystallization: Model and Experiment. Sep. Purif. Technol. 2021, 270, 118806. [Google Scholar] [CrossRef]
  9. Ulrich, J.; Bierwirth, J.; Henning, S. Solid Layer Melt Crystallization. Sep. Purif. Methods 1996, 25, 1–45. [Google Scholar] [CrossRef]
  10. Bai, Y.; Ye, Y.; Qi, L.; XuanYuan, S.; Yin, Q.; Hao, H.; Xie, C. Prediction of the Layer Growth Rate in Static Melt Crystallization. Ind. Eng. Chem. Res. 2022, 61, 18530–18536. [Google Scholar] [CrossRef]
  11. Ding, S.; Huang, X.; Yin, Q.; Dong, Y.; Bai, Y.; Wang, T.; Hao, H. Heat Transfer and Its Effect on Growth Behaviors of Crystal Layers during Static Layer Melt Crystallization. Chem. Eng. Sci. 2021, 233, 116390. [Google Scholar] [CrossRef]
  12. Yazdanpanah, N.; Myerson, A.; Trout, B. Mathematical Modeling of Layer Crystallization on a Cold Column with Recirculation. Ind. Eng. Chem. Res. 2016, 55, 5019–5029. [Google Scholar] [CrossRef]
  13. Mersmann, A. (Ed.) Crystallization Technology Handbook, 2nd ed.; Marcel Dekker: New York, NY, USA, 2001; ISBN 978-0-8247-0528-2. [Google Scholar]
  14. Micovic, J.; Beierling, T.; Lutze, P.; Sadowski, G.; Górak, A. Design of Hybrid Distillation/Melt Crystallisation Processes for Separation of Close Boiling Mixtures. Chem. Eng. Process. Process Intensif. 2013, 67, 16–24. [Google Scholar] [CrossRef]
  15. Beierling, T.; Micovic, J.; Lutze, P.; Sadowski, G. Using Complex Layer Melt Crystallization Models for the Optimization of Hybrid Distillation/Melt Crystallization Processes. Chem. Eng. Process. Process Intensif. 2014, 85, 10–23. [Google Scholar] [CrossRef]
  16. Shiau, L.-D. The Dependence of Effective Distribution Coefficient on Growth Rate and Mass Transfer Coefficient for P-Xylene in Solid-Layer Melt Crystallization. Processes 2020, 8, 175. [Google Scholar] [CrossRef] [Green Version]
  17. Matsuoka, M.; Ohishi, M.; Kasama, S. Purification of P-Dichlorobenzene and m-Chloronitrobenzene Crystalline Particles by Sweating. J. Chem. Eng. Japan/JCEJ 1986, 19, 181–185. [Google Scholar] [CrossRef] [Green Version]
  18. Kim, K.-J.; Ulrich, J. An Estimation of Purity and Yield in Purification of Crystalline Layers by Sweating Operations. Sep. Sci. Technol. 2002, 37, 2717–2737. [Google Scholar] [CrossRef]
  19. Jiang, X.; Hou, B.; He, G.; Wang, J. Falling Film Melt Crystallization (II): Model to Simulate the Dynamic Sweating Using Fractal Porous Media Theory. Chem. Eng. Sci. 2013, 91, 111–121. [Google Scholar] [CrossRef]
  20. Jiang, X.; Hou, B.; Zhao, Y.; Wang, J.; Zhang, M. Kinetics Study on the Liquid Entrapment and Melt Transport of Static and Falling-Film Melt Crystallization. Ind. Eng. Chem. Res. 2012, 51, 5037–5044. [Google Scholar] [CrossRef]
  21. Jiang, X.; He, G.; Cai, J.; Xiao, W. Microscale Flow and Separation Process Analysis in the Nanoporous Crystal Layer. In New Polymer Nanocomposites for Environmental Remediation; Hussain, C.M., Mishra, A.K., Eds.; Elsevier: Amsterdam, The Netherlands, 2018; pp. 175–206. ISBN 978-0-12-811033-1. [Google Scholar]
  22. Bai, Y.; Zhu, Z.; Yin, Q.; Xie, C. Facile Model for Predicting Sweat Mass and Concentration in Layer Melt Crystallization. Ind. Eng. Chem. Res. 2022, 61, 3704–3712. [Google Scholar] [CrossRef]
  23. Gilbert, S.W. Melt Crystallization: Process Analysis and Optimization. AIChE J. 1991, 37, 1205–1218. [Google Scholar] [CrossRef]
  24. Jiang, X.; Xiao, W.; He, G. Falling Film Melt Crystallization (III): Model Development, Separation Effect Compared to Static Melt Crystallization and Process Optimization. Chem. Eng. Sci. 2014, 117, 198–209. [Google Scholar] [CrossRef]
  25. Kraft, D. A Software Package for Sequential Quadratic Programming. In Forschungsbericht; Deutsche Forschungs- und Versuchsanstalt fur Luft- und Raumfahrt: Weβling, Germany, 1988. [Google Scholar]
Figure 1. Experimental setup.
Processes 11 01047 g001
Figure 2. Fitted (red line) and experimental (symbols) values of the sweating ratio.
Processes 11 01047 g002
Figure 3. Comparison of calculated (surface) and experimental (dots) values of sweating distribution coefficient. The black vertical line refers to the gap between the experimental value and the calculated value.
Processes 11 01047 g003
Figure 4. Optimization results for total operating time (a), crystallization time (b), and sweating time (c).
Processes 11 01047 g004
Figure 5. Operating time and layer growth rate under the optimal conditions.
Processes 11 01047 g005
Figure 6. Crystallization ratio and sweating ratio under the optimal conditions.
Processes 11 01047 g006
Disclaimer/Publisher’s Note: The statements, opinions and data contained in all publications are solely those of the individual author(s) and contributor(s) and not of MDPI and/or the editor(s). MDPI and/or the editor(s) disclaim responsibility for any injury to people or property resulting from any ideas, methods, instructions or products referred to in the content.

