Article

Numerical and Experimental Investigation on Flow Field of the Turbine Stage under Different Axial Gaps

1
College of Power and Energy Engineering, Harbin Engineering University, Harbin 150000, China
2
Dongfang Steam Turbine Co., Ltd., Deyang 618000, China
*
Author to whom correspondence should be addressed.
Processes 2023, 11(7), 2138; https://doi.org/10.3390/pr11072138
Submission received: 8 June 2023 / Revised: 27 June 2023 / Accepted: 13 July 2023 / Published: 17 July 2023
(This article belongs to the Special Issue Advance in Flow and Heat/Mass Transfer Technology)

Abstract

:
In order to reduce efficiency losses and improve the aerodynamic efficiency of axial turbines used in industry, the flow fields of the turbine stage were investigated numerically and experimentally under different axial gaps in this work. The influence of the axial gaps on the flow unsteadiness and the flow field distribution is discussed. The results show that the aerodynamic efficiency of the turbine stage increases when the axial distance is reduced. The difference in entropy increases under different axial distances are mainly found in the section from the stator inlet to the rotor inlet: the turbine not only has a better time-average aerodynamic performance, but also has a better transient aerodynamic performance under working conditions with a small axial distance. Additionally, the maximum disturbance amplitudes of the stator and rotor are located near the trailing edge of the stator and the leading edge of the rotor, respectively. Compared with the wake disturbance of the upstream stator to the downstream adjacent rotor, the reverse disturbance of the downstream stator to the adjacent upstream rotor is more sensitive to the change in the blade spacing.

1. Introduction

In turbines, the axial gap between the blades not only affects the axial length and the dynamic characteristics of the rotors, but also affects the distribution of aerodynamic parameters of the blades, thereby affecting the efficiency of the turbine.
In the process of turbine design, in order to minimize efficiency loss and improve aerodynamic efficiency, many scholars have studied and compared the flow characteristics inside the turbine under different axial gaps [1,2,3]. However, no unified conclusion has been formed to date, and some conclusions contradict each other. As early as 1952, Wu Zhonghua found, in research on supersonic turbines, that the aerodynamic efficiency of the turbine will increase with the increase in the axial gap of the turbine [4]. Subsequently, Dring et al. found, in an experimental study of the axial flow turbine, that when the axial gap is 15% of the axial chord length of the rotor blade, the fluctuation amplitude of the unsteady pressure at the leading edge of the rotor blade can reach 80% of the relative dynamic pressure [5]. Funazaki et al. and Park et al. found that, for the turbines with a low aspect ratio, reducing the axial gaps can improve the aerodynamic performances [6,7]. Bellucci et al. found a strong interdependence between the axial-gap-related losses and the aspect ratio and inlet Reynolds number [8]. Kikuchi et al. studied the aerodynamic performances of a turbine with three different axial gaps under two different working conditions. And the results showed that, under non-design conditions, the turbine efficiency will increase approximately linearly with the decrease in stage spacing [9]. Oettinger et al. used numerical simulation methods to study the influence of three axial gaps on turbine performances, and the results showed that two-dimensional profile losses increase for smaller gaps due to the higher wake-mixing losses and unsteady wake-blade interaction, and the turbine efficiency would increase with the decrease in axial spacing [10]. The research results of Shu et al. indicated a significant effect of the axial clearance on the flow field. When the axial clearance increases, the pressure fluctuation amplitude on the blade surface decreases significantly, but the instability strengthens, and the efficiency decreases slightly as the axial gap increases [11]. Li et al. conducted a numerical study on the influence of axial gap changes on turbines. The results have shown that the flow field in the blade tip seal undergoes complex changes with the increase in axial gap. The large vortex is found in the cavity and the small vortex near the wall of the shroud. The small vortex gradually disappears with the increase in axial gap. When the axial gap is increased to a certain value, the reverse large vortex is formed in the cavity behind the low teeth of the seal, and the leakage rate significantly increases [12]. Restemeier et al. also conducted similar research on the turbine test (RWTH) of Aachen University. It should also be noted that the smaller stage gap is more conducive to improving the efficiency of turbines with small aspect ratios [13]. Researchers still lack a mature theory of the influence of axial gap changes on turbine flow characteristics [14]. In order to further understand the influences that the axial gaps have on the aerodynamic performances of the turbine, the three-stage turbine model is used in the current article, along with experimental and numerical simulation research. An analysis was carried out on the influence of the change in axial gap on the aerodynamic performance of the turbine model.
In this paper, the aerodynamic efficiency of the three-stage turbine model with different axial distances is measured experimentally at different speeds. Numerical models of the three-stage turbine model with different axial distances are established as well, and the aerodynamic efficiency of the turbine model is studied through numerical calculation. The simulation results are compared with experimental measurements, thus verifying the reliability of the numerical method. Part of the flow field of unsteady flow is extracted, and the mechanism of the axial spacing of turbine stages on its unsteady aerodynamic performance is revealed.

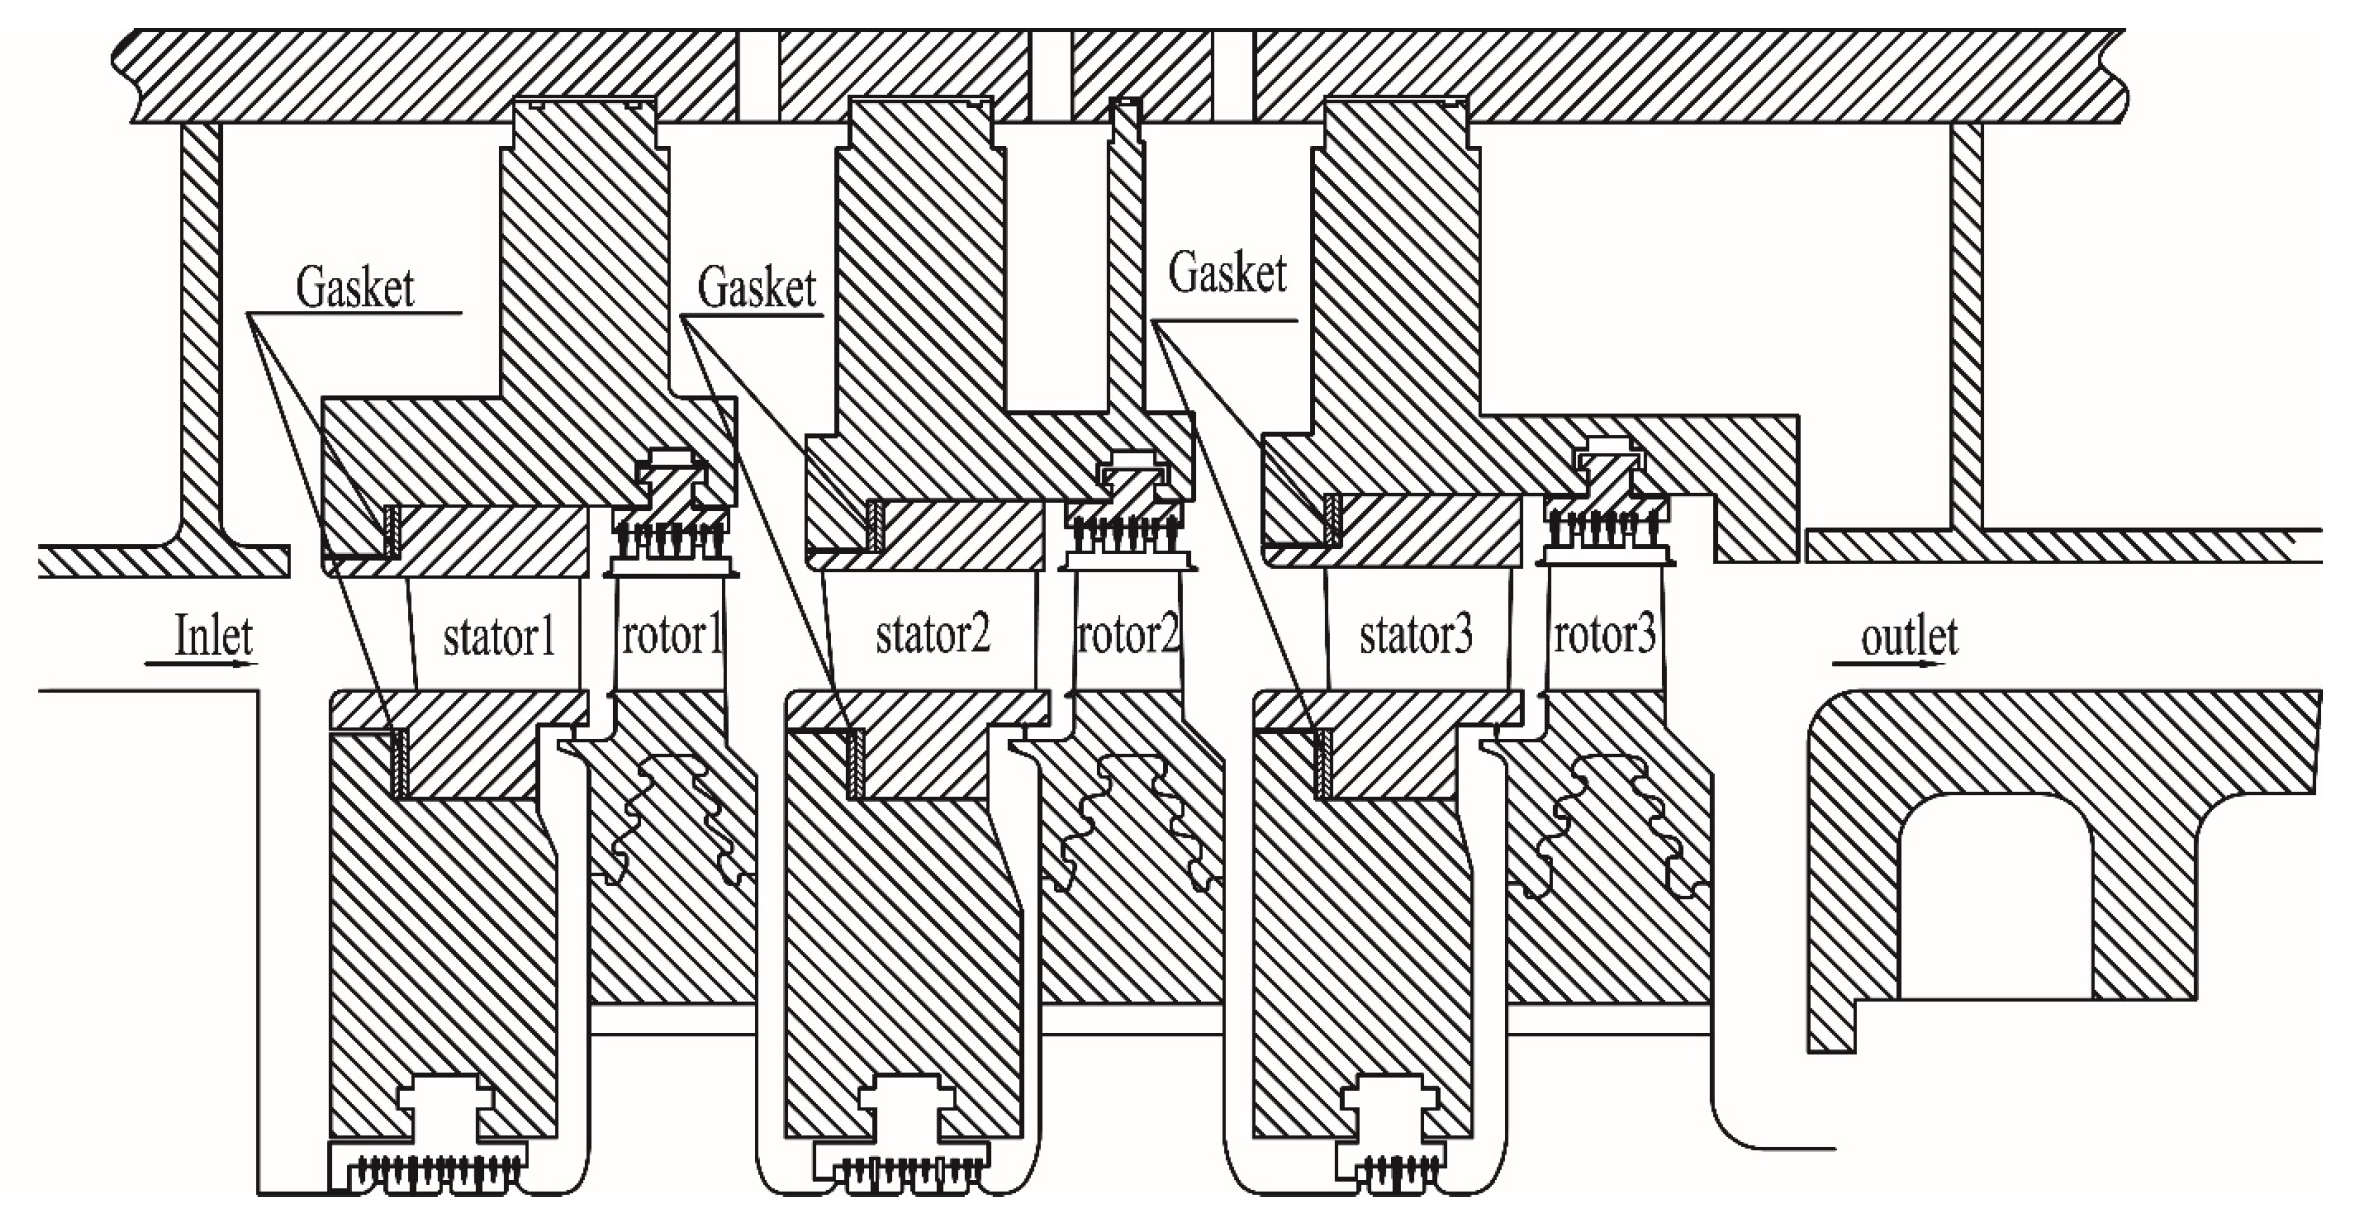
2. Experimental Setup

Figure 1 illustrates the experimental measurement setup for a three-stage turbine model, which has been extensively studied experimentally on the inter-stage flow field [14]. In order to adjust the axial gap between the stator and the rotor, a gasket structure was designed at the assembly point of the stator vane and the inner and outer rings. The axial gap between the stator and the rotor can be changed by changing the thickness of the gasket. When the axial distance between the stator and the rotor changes, the distance between the rotor of the previous stage and the stator of the next stage will also be changed.
Figure 2 shows the meridional flow path diagram of the turbine model, and marks the installation position of the gasket between the stator and the inner and outer rings. The figure shows that, by changing the thickness of the gasket, not only can the axial distance between the stator and the rotor in the stage be changed, but so can the axial distance between the rotor of the upper stage and the stator of the next stage. When no gasket is installed, the axial distance between the stator and the rotor is defined as maximum, and this axial distance becomes smaller as the thickness of the gasket gradually increases.
The parameters of the stator and rotor at all stages are listed in Table 1. The three-stage turbine model shows the first three stages of a supercritical unit: the blade root diameter is 0.86 m and the blade height is 0.0439–0.04876 m. Table 2 lists the axial gaps between the stator and the rotor in each stage under each working condition. When the average value of the ratio of the axial gap between the stator and the rotor to the chord length of the stator blade is 0.32, it is defined as a large gap (GAPL), when the average value is 0.24, it is defined as the middle gap (GAPM), and when the average value is 0.15, it is defined as a small gap (GAPS). Experimental measurements were carried out on that three-stage turbine model to evaluate the aerodynamic efficiency as a function of rotational speed for three axial gaps. During the measurement process, the total inlet temperature, total pressure and outlet static pressure of the turbine were basically kept unchanged, and the speed ranged from 1400 r/min to 2400 r/min. In order to reduce the influence of the compressibility of the medium on the temperature measurement during the experiment, temperature measurements were carried out at the diffuser with a stable inlet and outlet flow fleid. The compressibility of fluid can be ignored because the mach number at the measurement is less than 0.1. Table 3 lists the experimental measurement conditions for the change in aerodynamic efficiency with the rotational speed under the three axial gaps. In a speed range from 1400 r/min to 2400 r/min, an experimental measurement was carried out every 50 r/min, and the output power of the three-stage turbine was obtained through the hydraulic dynamometer.

3. Numerical Simulation

Steady and unsteady numerical simulations of the experimental turbine were carried out. Figure 3 shows a schematic diagram of the three-dimensional calculation grid of the blades of the three-stage turbine model. The current simulation uses a structured hexahedral grid partition scheme. The three-stage turbines are divided into about 3.815 million grids in total, and the specific grid distribution is shown in Table 4. The one equation S-A turbulence model is used for steady and unsteady numerical simulations, and the value of y+ in the entire calculation domain is maintained at around 1.
To improve the uniformity of the incoming flow field, an annular deflector is used at the inlet, and the turbulence intensity at the inlet is controlled at 3–5%. In the numercial calculation, the inlet turbulence intensity is set at a constant of 5%. Since the unsteady numerical simulation requires plenty of computing resources, the numerical simulation only selects the three-stage turbine model at a speed of 1900 r/min to study the steady and unsteady numerical values. Specific numerical solution methods are shown in Table 5.
The numerical simulation first completes the steady calculation at different distances, and then uses the steady calculation result as the initial value condition for the corresponding unsteady calculation. The same boundary conditions are used for steady calculation and unsteady calculation, and the specific boundary conditions are shown in Table 6. The inlet and outlet parameters in the table are the experimental measurement parameters at the corresponding speed.

4. Results Comparison and Analysis

The definitions of u and c 0 in the turbine equal efficiency speed ratio are as followed.
u = π D n 60
c 0 = 2 H 0 3
H 0 = R × k k 1 × T i n * × ( 1 ( P o u t P i n * ) k 1 k )
In the above formulas: D is the root diameter of the turbine stage, the unit is m; n is the speed, the unit is r/min; H 0 is the total enthalpy drop, the unit is J/kg; T i n * is the total temperature of the incoming flow, the unit is K; P o u t is the outlet static pressure, the unit is kPa; P i n * is the incoming total pressure, the unit is kPa; R is the air gas constant; k is the ideal air adiabatic index.
The relative efficiency of the turbines are defined in the following formulas.
η r e l = η η r e f
η = 1 T o u t * T i n * 1 ( P o u t P i n * ) k 1 k
T o u t * is the total temperature of the turbine outlet, T i n * is the total temperature of the turbine inlet, and P o u t is the static pressure in the turbine outlet. P i n * is the total pressure in the turbine inlet.
In Figure 4, the curves in the aerodynamic efficiency of the turbine as a function of the speed ratio at three different axial distances. Under the three different axial gap conditions, there is an optimal equivalent speed ratio, which means that the aerodynamic efficiency of the turbine is the highest. The optimal equivalent speed ratio is about 0.6. The reduction in the axial gap between the stator and the rotor is beneficial to the improvement in the aerodynamic efficiency of the turbine: when the average axial distance between the stator and the rotor decreases from 0.32 to 0.15, the aerodynamic efficiency of the turbine increases by about 1% at the best equivalent speed ratio. Preliminary analysis shows that while the axial distance between the stator and the rotor decreases, the axial distance between the rotor of the previous stage and the stator of the next stage increases. The enlarged cavity at the outlet of the upper-stage rotor leads to a more uniform flow field when the flow blends into the lower-stage stator, thereby improving aerodynamic efficiency.
Figure 5 shows the efficiency comparison of experimental measurements, steady and unsteady calculations under different axial distances (the rotational speed is 1900 r/min). The steady and unsteady calculated aerodynamic efficiency is basically consistent with the variation trend of the experimental measurement data. At the current speed, the experimental measurement shows that the turbine efficiency difference between the maximum and minimum axial gap is 0.93%, and the efficiency difference between the steady and unsteady calculations is 0.65% and 0.66%, respectively. Both numerical calculation and experimental results show that the aerodynamic efficiency of the three-stage turbine model increases with the decrease in axial gap. Research was carried out on the variation law of the flow field characteristics of the turbine stage with three different axial gaps. Since the entropy increase directly reflects the macroscopic flow loss, the entropy increase is firstly used to macroscopically analyze the axial flow of the turbine. S 1 0 , S 1 1 , R 1 1 , R 1 2 represent the inlet position near the leading edge of the first stage stator, the outlet location near the trailing edge of the first stage stator, the inlet position of the leading edge of the first stage rotor and the outlet position of the first stage rotor trailing edge, respectively. Similarly, S 2 0 , S 2 1 , R 2 1 , R 2 2 and S 3 0 , S 3 1 , R 3 1 , R 3 2 represent different positions of the second and third stages. Figure 6 shows the schematic diagram of six section positions of S 2 0 , S 2 1 , R 2 1 , R 2 2 , S 3 0 and S 3 1 .
Figure 7 shows the entropy increase curve of the turbine model along the flow direction under the GAPL and GAPS conditions. The calculation of entropy increase is based on parameters such as pressure and temperature, obtained from the calculation of each characteristic section. The reference pressure and reference temperature use the total pressure and total temperature of the first stage inlet, respectively, with the corresponding axial gap representing the reference pressure and temperature. Due to the strong unsteadiness of the flow inside the wake, the distribution of the velocity surface and Reynolds stress is unsteady, and it is relatively difficult to study the relaxation effect of the wake flow. Therefore, the steady and unsteady calculation methods are used to conduct a detailed comparative study on the flow. The entropy increase under the GAPS condition is smaller than that under the GAPL condition, and this difference mainly occurs in the section from the stator inlet to the rotor inlet.
Δ s = R × l n [ P r P × ( T T r ) k k 1 ]
Compared with the GAPL condition, the axial distance between the stator and the rotor of the same stage under the GAPS condition is larger, while the distance between the previous stage and the latter stage is smaller. Since the wake produced by the stator is an important factor affecting the aerodynamic performance of the turbine, the reduction in axial distance between the stator and the rotor at the same stage will help reduce the scope of the influence of the stator wake. Moreover, the larger distance between two adjacent stages will better blend the wake of the upstream rotor blade outlet and the main flow, thereby further increasing the uniformity of the inlet of the downstream stator blade. The trend of entropy increases obtained by unsteady calculations and steady calculations are basically the same, but in terms of specific values, the range of entropy increases obtained by unsteady calculation is relatively larger. The reason for this is analyzed as follows: the wake generated by the stator passes obliquely downstream along the direction of the trailing edge of the stator. When the wake propagates to the leading edge of the rotor, the wake is cut into two branches and continues to propagate downstream in the adjacent rotor channel. Due to the pressure difference between the pressure surface of the blade and the suction surface of the adjacent blade in the circumferential direction, the wake in the rotor channel is gradually stretched, twisted and deformed, and approaches the suction surface under the action of the pressure difference. Eventually, the wakes in adjacent rotor channels merge and continue downstream. Under GAPS conditions, the wake of the previous stage and the mainstream have enough time and space to mix more uniformly before flowing into the stator channel of the next stage, so the entropy increase in the stator channel is obviously small. Table 7 and Table 8, respectively, provide the pressure disturbance of different blade rows under GAPS and GAPL working conditions. The reference blade row is disturbed by the adjacent blade rows over time, and this disturbance is called the first-order disturbance. The disturbance caused by the reference blade row affected by the blade row one row apart is called the second-order disturbance. Corresponding to this, the first-stage stator (S1) brings first-order disturbance to the first stage rotor (R1), and the first-stage stator (S1) brings second-order disturbances to the second-stage stator (S2).
Figure 8 and Figure 9 show the pressure disturbances on the second-stage stator and rotor under GAPS and GAPL conditions. In Figure 8, harmonic4 (H4) is the largest disturbance to the second-stage stator, and this disturbance runs through the leading edge of the stator to the trailing edge of the stator in the entire range of blade height. The maximum value of the disturbance is at the position of the trailing edge of the blade. Table 7 shows that the disturbance comes from the second-stage rotor (R2). The disturbance of harmonic4 shows the disturbance of the downstream second-stage rotor to the upstream adjacent stator (this disturbance is also called potential interference in some existing studies). Judging from the distribution of the disturbance along the flow direction, this disturbance gradually decays against the flow direction, which also shows that the direction of this disturbance is opposite to the main flow direction. In addition, harmonic7 (H7) only has a certain pressure disturbance amplitude near the leading edge of the second stage vane at 50% of the blade height. Comparing this with Table 6, we know that harmonic7 is the amount of disturbance applied by the upstream first-stage rotor (R1) to the downstream second-stage stator, which also shows that, on the leading edge position of the upstream moving blade to the downstream stator blade on the 50% blade height section, a small disturbance occurred. The impact on other areas of the second-stage stator is almost negligible. Under GAPS conditions, the upstream rotor has relatively little impact on the adjacent downstream stator.
In Figure 9, the second-stage rotor is mainly affected by harmonic4/harmonic8 over the whole blade height range. The harmonic4 (H4)/harmonic8 (H8) comes from the disturbance of the second-stage stator (S2), and the maximum disturbance occurs at the leading edge of the rotor. The main cause of this disturbance is the propagation and development of the upstream stator wake. Compared with the disturbance of the second-stage stator (SX2), other disturbances to rotor 2 can be neglected. Compared with Figure 8, the main disturbance experienced by the rotor of the second stage is about 40 times that of the stator of the second stage. As the axial distance between stages increases, the pressure disturbance on the downstream rotor surface brought by the upstream stator decreases only slightly. For the GAPS working condition, generally speaking, the unsteady disturbance suffered by the stator is relatively weak, while the rotor is subjected to strong unsteady disturbances and their respective maximum disturbances are located near the trailing edge of the stator and the leading edge of the rotor. At the level of disturbance amplitude, the extreme value of the pressure disturbance on the rotor is about 10 times the maximum value of the pressure disturbance on the stator (the maximum pressure disturbance is around 400 Pa and 40 Pa, respectively).

5. Conclusions

The paper investigated the effect of different axial gaps on the aerodynamic performance of the turbine using both experimental and numerical methods. The main conclusions are as follows:
1.
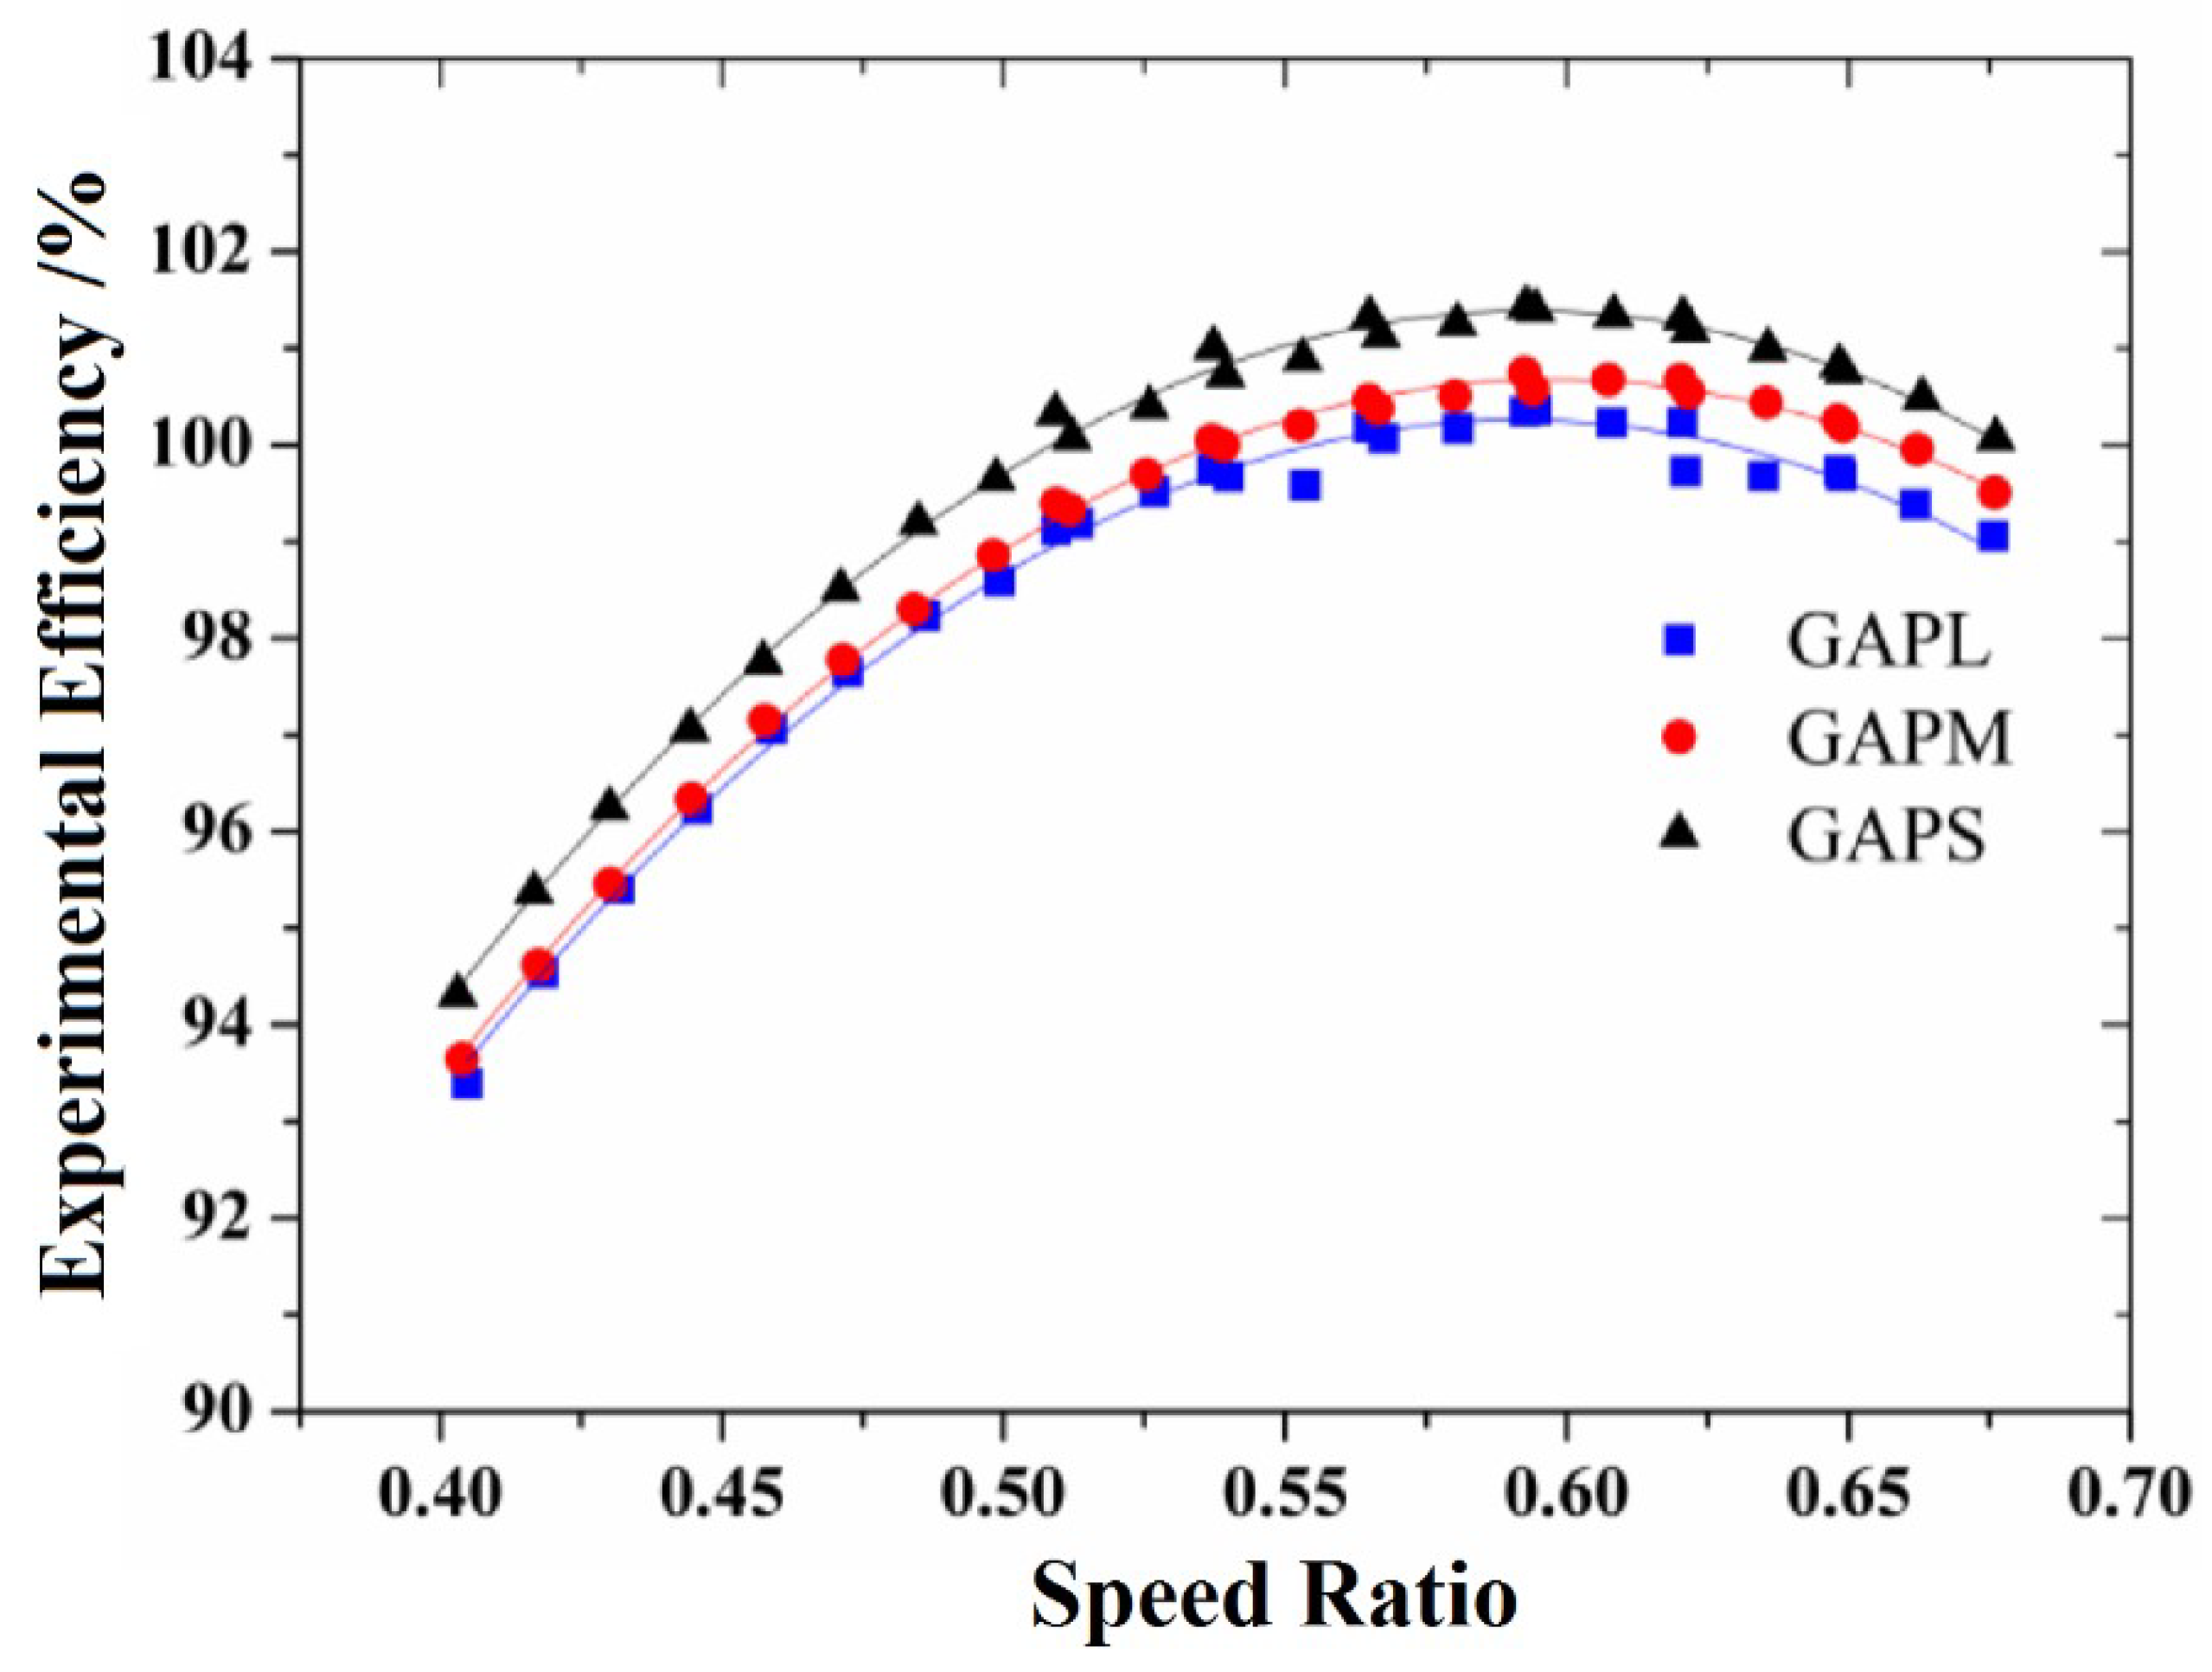
The adjustment of the axial gap was realized through the gasket mechanism, and an experimental research work was carried out on the aerodynamic performance of the turbine under different axial gaps. The experimental research shows that the aerodynamic performance of the turbine under different axial gaps is consistent with the change trend of the equivalent speed ratio, and the best equivalent speed ratio (ranging from 0.55 to 0.6) does not significantly change. The aerodynamic efficiency of the turbine stage increases when the axial distance is reduced. In the experiment, when the average axial gap is reduced from 0.32 to 0.15, the aerodynamic efficiency of the turbine increases by about 1% at the speed corresponding to the best equivalent speed ratio.
2.
The numerical model of the turbine under different axial gaps was established, and the corresponding numerical research was completed. Both steady and unsteady numerical studies show that the turbine efficiency increases as the axial gap decreases. The experimental measurement shows that the turbine efficiency difference between the maximum and minimum spacing is 0.93%, and the efficiency difference obtained by constant and unsteady numerical simulations is 0.65% and 0.66%, respectively.
3.
The research on the variation in turbine entropy increases along the axial direction shows that the difference in entropy increases under different axial distances. This mainly occurs in the section ranging from the stator inlet to the rotor inlet. Compared with the working conditions with a large axial distance, when the axial distance is small, the turbine not only has a better time-average aerodynamic performance, but also has a better transient aerodynamic performance.
4.
For the current turbine model, the maximum value of the unsteady disturbance pressure amplitude on the downstream rotor is about 10 times and 40 times the maximum value of the unsteady disturbance pressure amplitude on the upstream vane under small spacing and large spacing times, and the maximum disturbance amplitudes of the stator and rotor are located near the trailing edge of the stator and the leading edge of the rotor, respectively. When the turbine stage spacing is small, the disturbances in the downstream stator mainly derive from the downstream adjacent rotor. As the stage spacing gradually increases, the disturbance exerted by the downstream rotor, which is adjacent to the upstream stator, gradually weakens. At the same time, the disturbance of the upstream adjacent rotor to the second-stage stator gradually increases, and becomes the dominant factor in disturbances to the downstream stator at the front edge of the 50% blade height section. Compared with the wake disturbance of the upstream stator to the downstream adjacent rotor, the reverse disturbance of the downstream stator to the adjacent upstream rotor is more sensitive to the change in blade spacing.

Author Contributions

Conceptualization, C.Y. and L.F.; methodology, Z.Z.; software, H.Z.; validation, Z.Z., C.Y. and L.F.; formal analysis, C.Y.; investigation, Z.Z.; resources, L.F.; data curation, Z.Z.; writing—original draft preparation, Z.Z.; writing—review and editing, H.Z.; supervision, L.F.; project administration, C.Y.; funding acquisition, L.F. All authors have read and agreed to the published version of the manuscript.

Funding

This research was funded by FUNDER grant number 52071106. The research in this paper has been carried out with the financial support of the National Natural Science Foundation of China.

Data Availability Statement

The data that support the findings of this study are available from the corresponding author, upon reasonable request.

Conflicts of Interest

The authors declare no conflict of interest.

Abbreviations

The following abbreviations are used in this manuscript:
GAPSSmall gap between stator and rotor
GAPM  Middle gap between stator and rotor
GAPLLarge gap between stator and rotor

References

  1. Gorrell, S.E.; Okiishi, T.H.; Copenhaver, W.W. Stator-Rotor Interactions in a Transonic Compressor Part 1: Effect of Blade-Row Spacing on Performance. ASME J. Turbomach. 2003, 125, 328–335. [Google Scholar] [CrossRef]
  2. Gorrell, S.E.; Okiishi, T.H.; Copenhaver, W.W. Stator-Rotor Interactions in a Transonic Compressor Part 2: Effect of Blade-Row Spacing on Performance. ASME J. Turbomach. 2003, 125, 336–345. [Google Scholar] [CrossRef]
  3. Shi, Y.; Liu, S.J.; Deng, Q.H. Influence of Axial Clearance on Unsteady Flow Interaction in Turbine Stage. J. Xi’An Jiaotong Univ. 2007, 43, 9–13. [Google Scholar]
  4. Wu, Z.H. A General Theory of Three-Dimensional Flow in Subsonic and Supersonic Turbomachines of Axial, Radial, and Mixed-Flow Types; National Aeronautics and Space Administration: Washington, DC, USA, 1952; pp. 1–75. [Google Scholar]
  5. Dring, R.P.; Joslyn, H.D.; Hardin, L.W. Research on Turbine Rotor-Stator Aerodynamic Interaction and Rotor Negative Incidence Stall; United Technologies Research Center: East Hartford, CT, USA, 1981; pp. 1–94. [Google Scholar]
  6. Funazaki, K.; Yamada, K.; Kikuchi, M. Experimental Studies on Aerodynamic Performance and Unsteady Flow Behaviors of a Single Turbine Stage with Variable Rotor—Stator Axial Gap: Comparisons with Time-Accurate Numerical Simulation. In Proceedings of the ASME Turbo Expo 2007: Power for Land, Sea and Air, Montreal, QC, Canada, 14–17 May 2007; Volume 27670, pp. 703–711. [Google Scholar]
  7. Park, J.; Choi, M.; Baek, J. Effects of Axial Gap on Unsteady Flow in One-Stage Axial Turbine. Int. J. Turbo Jet Engines 2003, 20, 315–333. [Google Scholar] [CrossRef]
  8. Bellucci, J.; Rubechini, F.; Baek, J. Influence of Vane-Blade Spacing on Transonic Turbine Stage Aerodynamics: Part-I-Time-averaged Data and Analysis. J. Turbomach. 1999, 121, 663–672. [Google Scholar]
  9. Kikuchi, M.; Funazaki, K.; Yamada, K. Detailed Studies on Aerodynamic Performance and Unsteady Flow Behaviors of a Single Turbine Stage with Variable Rotor-Stator Axial Gap. Int. J. Gas Turbine 2008, 2, 30–37. [Google Scholar] [CrossRef] [PubMed]
  10. Oettinger, M.; Mimic, D.; Henke, K. Loss assessment of the axial-gap size effect in a low-pressure turbine. J. Glob. Power Propuls. Soc. 2021, 5, 1–14. [Google Scholar] [CrossRef]
  11. Shu, P.; Sun, T.; Yu, Q. Numerical investigation of the effect of axial clearance on the last stage of marine turbine. Ocean. Eng. 2022, 266, 112711. [Google Scholar] [CrossRef]
  12. Li, P.; Cao, L. Effect of Rotor-stator Axial Gap on the Tip Seal Leakage Flow of a Steam Turbine. J. Therm. Sci. 2021, 30, 973–982. [Google Scholar] [CrossRef]
  13. Restemeier, M.; Jeschke, P.; Guendogdu, Y. Numerical and Experimental Analysis of the Effect of Variable Blade Row Spacing in a Subsonic Axial Turbine. J. Turbomach. 2013, 135, 021031. [Google Scholar] [CrossRef]
  14. Xiao, X.; Bo, J.; Tian, C. Experimental Study on the Influence of Interstage Flow on stage Performance. Dongfang Steam Turbine 2018, 4, 30–35. [Google Scholar]
Figure 1. Three-stage turbine model. (a) Impeller tooling with adjustable gasket. (b) Partially enlarge the image of the gasket.
Processes 11 02138 g001
Figure 2. Schematic diagram of the meridian channel structure and gasket installation position of the three-stage turbine.
Processes 11 02138 g002
Figure 3. Calculation grid for turbine model.
Processes 11 02138 g003
Figure 4. Experimental and numerical calculation efficiency diagrams under different working conditions.
Processes 11 02138 g004
Figure 5. Experimental and numerical calculation efficiency results under different working conditions.
Processes 11 02138 g005
Figure 6. Model’s partial cross-sectional schematic.
Processes 11 02138 g006
Figure 7. Entropy increase for three-stage turbine simulation results. (a) steady calculation results. (b) transient calculation results.
Processes 11 02138 g007
Figure 8. The amplitude of the first-order disturbance pressure on s2. (a) GAPS (10% of the blade height) results. (b) GAPL (10% of the blade height) results. (c) GAPS (50% of the blade height) results. (d) GAPL (50% of the blade height) results. (e) GAPS (90% of the blade height) results. (f) GAPL (90% of the blade height) results.
Processes 11 02138 g008
Figure 9. The amplitude of the first-order disturbance pressure on r2. (a) GAPS (10% of the blade height) results. (b) GAPL (10% of the blade height) results. (c) GAPS (50% of the blade height) results. (d) GAPL (50% of the blade height) results. (e) GAPS (90% of the blade height) results. (f) GAPL (90% of the blade height) results.
Processes 11 02138 g009
Table 1. The main geometry parameters of the stator and rotor of the three-stage turbine model.
BladesRoot Diameter/mNumber of BladesBlade Height/mRelative Chord Length of Root SectionAverage Exit Geometric Angle/°
Stator of stage 10.86400.04390.5212.29
rotor of stage 10.86940.044330.721.81
stator of stage 20.86400.04570.5213.89
rotor of stage 20.86940.046550.719.17
stator of stage 30.86560.04790.5214.24
rotor of stage 30.86900.048760.718.86
Table 2. Axial gaps between stators and rotors for the three-stage turbine model.
GAPLGAPMGAPS
The thickness of the shim/mm0612
Axial gap of stage 1/mm21.8215.829.82
Axial gap of stage 2/mm22.9416.9410.94
Axial gap of stage 3/mm22.916.946.55
The ratio of axial gap to chord length0.35/0.29/0.330.25/0.22/0.240.16/0.14/0.16
Average of the ratio of axial gap to chord length0.320.240.15
Table 3. Experimental conditions.
DefinitionValueRemark
Rotating speed/r·min 1 1400 2400Measured at intervals of 50 r·min 1
Total pressure at the inlet/kPa142
Total temperature at the inlet/K350
Atmospheric pressure/kPa95.7
Table 4. Grid parameters.
Number of GridsMinimum Orthogonality Angle
Stator of stage 16,700,00030.8°
rotor of stage 16,370,00027.6°
stator of stage 26,510,00033.4°
rotor of stage 25,930,00030.7°
stator of stage 36,120,00034°
rotor of stage 36,520,00025.1°
total38,150,000-
Table 5. Grid parameters.
SteadyTransient
SolverNUMECA FINENUMECA FINE
Working fluidAIR (Perfect)AIR (Perfect)
Turbulence modelSpalart–AllmarasSpalart–Allmaras
Solution methodSteady, time advanceHARMONIC
Order of solution-2 (Max rank)
The treatment method of the interfaceCircumferentially conserved connection facesFully unmatched non-reflective interface
Table 6. Boundary condition settings.
GAPLGAPMGAPS
Rotating speed/r·min 1 190019001900
Total pressure at the inlet/kPa142.72141.98142.46
Total temperature at the inlet/K353.65353.15353.65
The average static pressure at the outlet/kPa95.7395.7395.73
Table 7. Disturbances of GAPS case.
S1R1S2R2S3R3
Harmonic1S2R2S3R1S2R2
Harmonic2(S2,R1)S1S1R3R3(R2,S3)
Harmonic3R1(R2,S2)(S1,R2)(R1,S2)(R3,R2)S3
Harmonic4(S2,R1)S2R2S2(S2,R2)(R2,S3)
Harmonic5 (R2,S2)(S3,R2)(R1,S2)R2
Harmonic6 (S1,S2)(S1,R1)(S2,S3)(S2,R2)
Harmonic7 R1(R3,S3)(R3,R2)
Harmonic8 (S1,R1)S3
Harmonic9 (R2,R1)(R3,S3)
Harmonic10 (S2,S3)
Table 8. Disturbances of GAPL case.
S1R1S2R2S3R3
Harmonic1S2R2S3(S3,S2)S2R2
Harmonic2(S2,R1)(R2,S2)S1R3R3(R2,S3)
Harmonic3R1S2(S1,R2)R1(R3,R2)S3
Harmonic4(S2,R1)(R2,S2)R2(R3,S3)(S2,R2)(R2,S3)
Harmonic5 S1(S3,R2)S3R2
Harmonic6 (S1,S2)(S1,R1)(R3,S3)(S2,R2)
Harmonic7 R1(R1,S2)(R3,R2)
Harmonic8 (S1,R1)S2
Harmonic9 (R2,R1)(R1,S2)
Harmonic10 (S2,S3)
Disclaimer/Publisher’s Note: The statements, opinions and data contained in all publications are solely those of the individual author(s) and contributor(s) and not of MDPI and/or the editor(s). MDPI and/or the editor(s) disclaim responsibility for any injury to people or property resulting from any ideas, methods, instructions or products referred to in the content.

