Article

Resonance-Enhanced Pulsing Water Injection for Improved Oil Recovery: Micromodel Experiments and Analysis

State Key Laboratory of Petroleum Resources and Prospecting, China University of Petroleum-Beijing, Beijing 102249, China
*
Author to whom correspondence should be addressed.
Processes 2023, 11(3), 957; https://doi.org/10.3390/pr11030957
Submission received: 1 March 2023 / Revised: 17 March 2023 / Accepted: 19 March 2023 / Published: 21 March 2023
(This article belongs to the Special Issue Advance in Flow and Heat/Mass Transfer Technology)

Abstract

:
Enhanced oil recovery (EOR) is a crucial technology in the petroleum industry, influenced by several factors, including flooding fluids and methods. The adjustment of injection strategies and the application of vibration stimulation can significantly impact oil recovery, especially residual oil. In this study, we conducted experiments using a glass micromodel to investigate the effect of pulsing water injection on oil recovery. Our results show that when the pulse frequency matches the natural frequency of the micromodel, resonance occurs during the two-phase flow of pulse driving, which causes an increase in the amplitude of oscillation, enhances the mobility of oil, and improves recovery. The efficiency of the kinetic energy of displacement is also improved. However, when the frequency is 3 Hz, the absence of resonance leads to the opposite effect. In addition, we found that a greater amplitude increases the fluidity of oil. These findings have significant implications for the design of EOR strategies and methods. Our experimental results provide insight into the effect of pulse water injection on oil recovery and offer a potential strategy for the optimization of EOR techniques.

1. Introduction

Nowadays, too much crude oil and natural gas are needed in industry and our daily life; enhanced oil recovery (EOR) technology is, therefore, vitally important in oil and gas production and development and is a key measure in overcoming energy shortages [1,2,3]. EOR technology is the application of external chemical and physical methods in oil and gas reservoirs in a manner that promotes favorable recovery conditions. The situation demands enterprises and colleges propose more theoretical and engineering methods. The major EOR technologies currently include gas [4,5], thermal [6,7], chemical [8,9,10], nanoparticle [11], and microbial [12,13], which aim to change the physical properties of crude oil, natural gas, and the porous media in the reservoir by reducing the viscosity of heavy oil through thermal EOR and the wettability of the reservoir change by surfactants. However, engineering examples show that EOR technology, combined with reasonable injection and production operations, is very significant in furthering the increase in oil and gas production. The injection and production operations can be regarded as the EOR methods, such as huff-n-puff, cyclic injection, and alternating injection, which can change the pressure field in the reservoir and remove more residual oil from pores.
Huff-n-puff replenishes formation energy with carbon dioxide, nitrogen, steam, etc. Through the diffusion and dissolution of gas to reservoir fluid, it can supplement the reservoir energy and improve the oil and gas recovery, and it is widely used in heavy oil and tight oil exploration and development. Gases enter the oil phase through molecular diffusion, causing the crude oil to expand and replenish the reservoir energy [14]; the oil swelling ratio varies with the pressure of injection gas [15]. This indicates that when the pressure of the injection gas is higher than that of the reservoir fluid, a force is generated that drives the gas into the oil phase, thereby expanding the crude oil and improving oil and gas recovery from the reservoir. However, because of the mechanism of huff-n-puff and its operating range, it cannot achieve a higher oil recovery, and in the later period of huff-n-puff, there is still a large amount of unutilized crude oil between wells. The cyclic injection is a process that improves waterflooding efficiency in heterogeneous reservoirs [16]. In the cyclic injection process, transient pressure response in regions of different permeability can lead to forced imbibition of the lesser permeable layers [17]. The efficiency of imbibition is related to the wettability of the rock [18]. Injection and extraction of water should be given due consideration, along with their associated safety risks, in the context of engineering [19]. Additionally, it takes tens of days for the unstable pressure field formed by periodic injection to promote imbibition. To achieve fluctuations of pressure in the reservoir in a short period of time, which can then allow more crude oil to move away from the pores, we try to use a low-frequency pulse injection method to drive the crude oil. This method can generate differential pressure in the porous media and enhance the oil recovery.
Micromodels are widely used by scholars to study multiphase flow in displacement processes. Making microscopic models with glass allows for the visualization of fluid distribution within porous media. The design of the glass model is based on CT images of actual cores. Therefore, this model has been adopted by many scholars in experiments investigating EOR mechanisms. They can investigate the effect of chemicals on oil–water interfacial tension (IFT), the EOR evaluation of different chemicals, and the mechanism of CO2 flooding in porous media. Table 1 shows the application of micromodels to EOR technology in recent years.
In this study, we employ a heterogeneous porous media micromodel to study the effect of an unsteady seepage field caused by displacement change on oil–water two-phase flow in the oil displacement process. We carried out a micromodel displacement experiment to study this phenomenon. During the experiment, the displacement of water changed periodically into a rectangular wave, which resulted in an unstable seepage field. The effect of pulse displacement was studied by images taken from the micromodels; the micromodel experiment enabled us to obtain the residual oil distribution in the displacement process. We can then know the energy utilization efficiency of each stage of displacement by the oil phase area in the images. The performance evaluation was carried out by (i) recovery ratio, (ii) flow visualization of oil displacement by pulse displacement in glass micromodels, and (iii) efficiency of the energy transformed from the water to oil by calculating the percentage of oil phase moved per unit time.

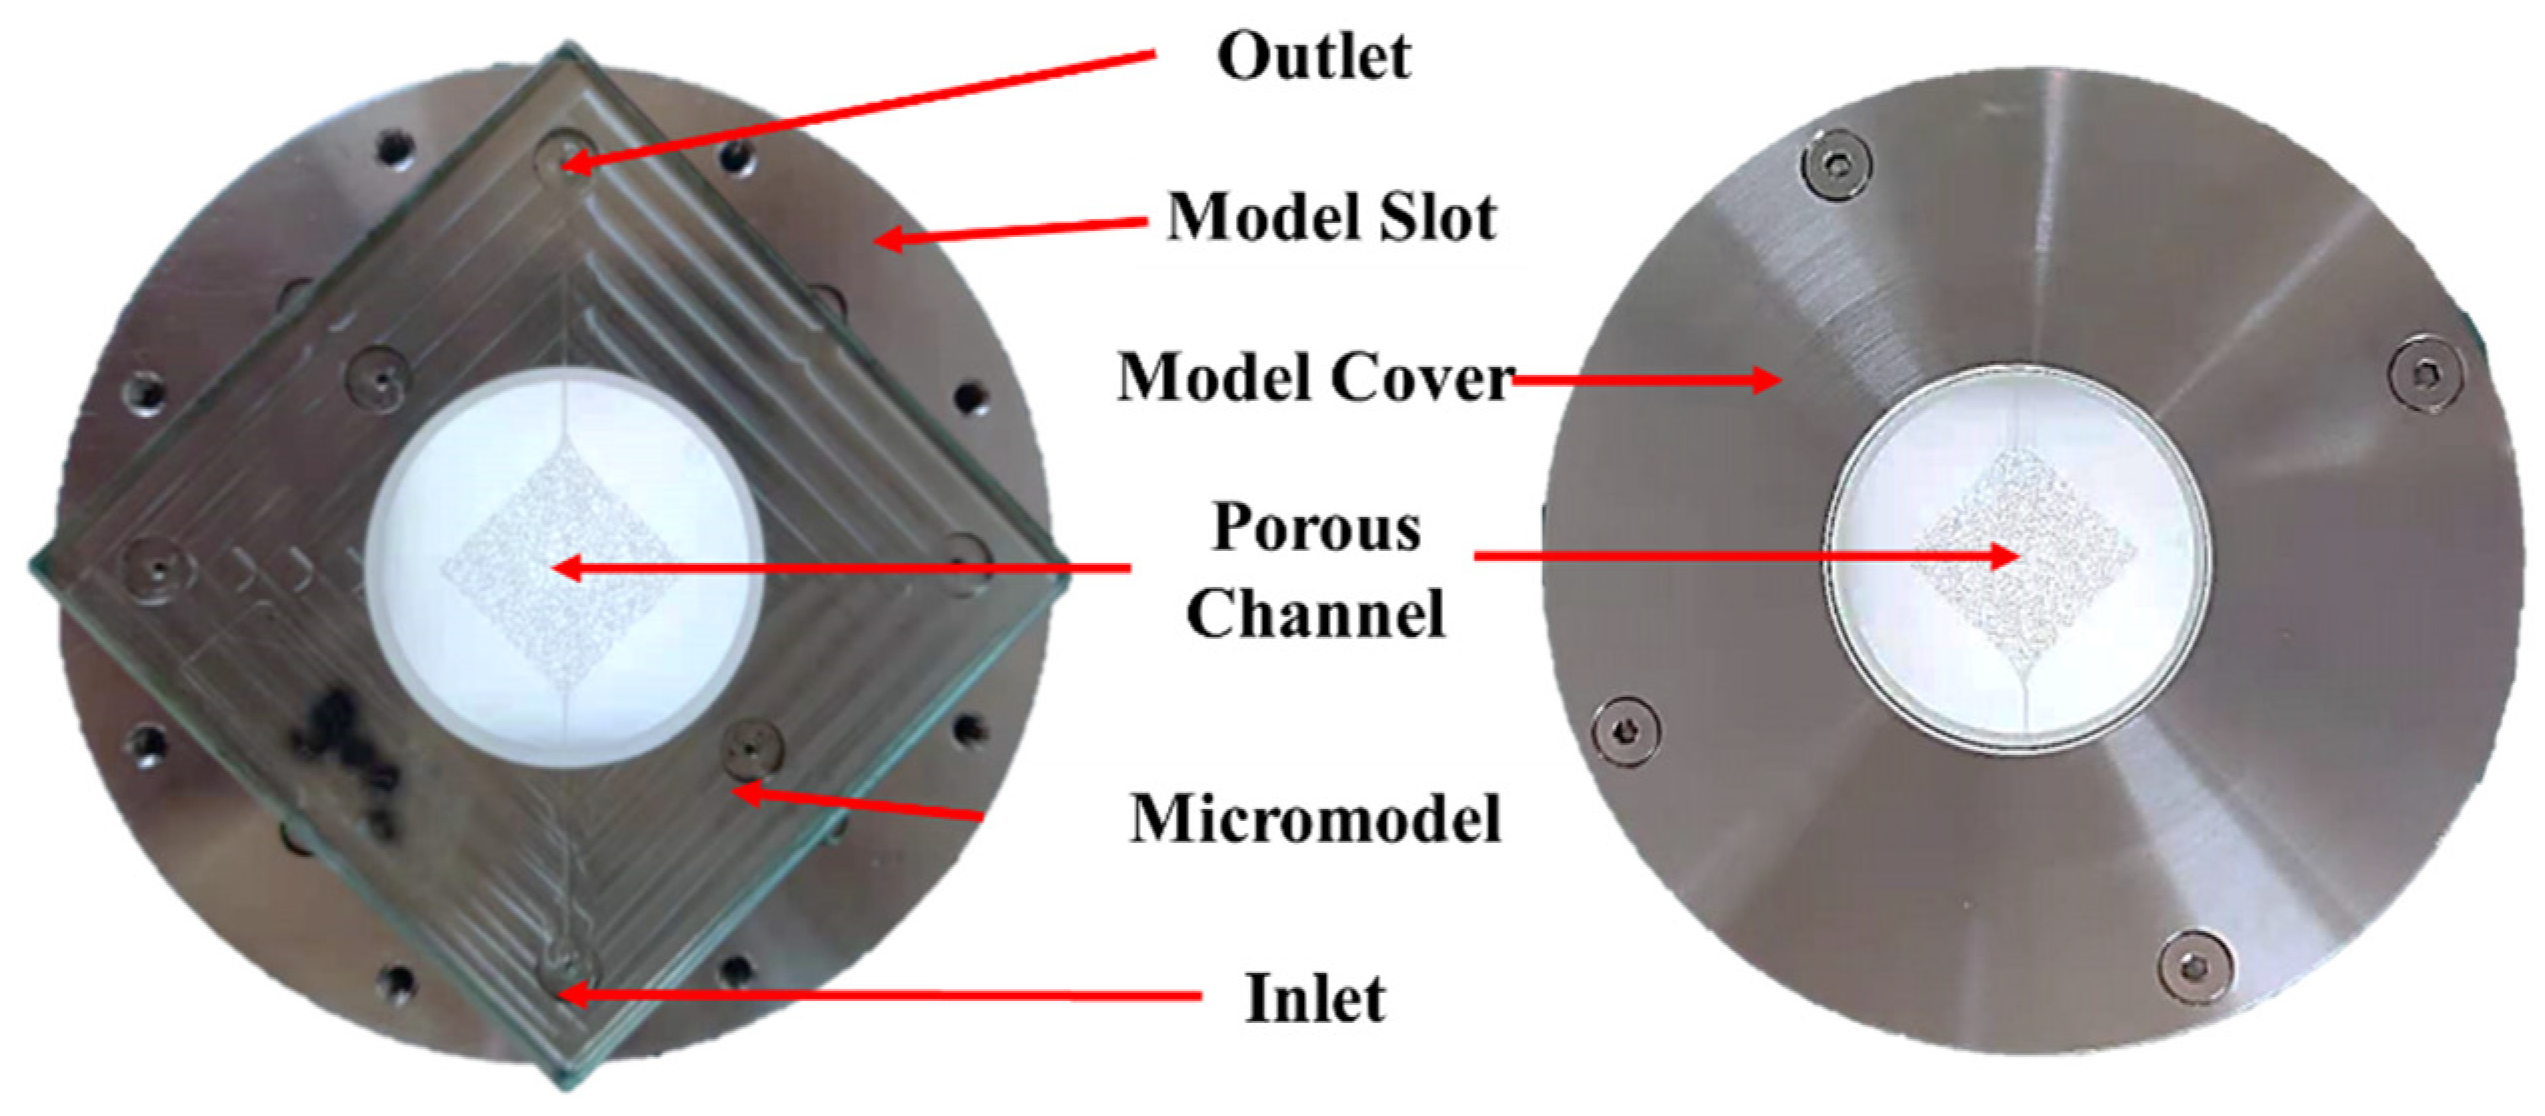
2. Experimental Setup and Procedure

2.1. Sample Preparations

2.1.1. Wettability Treatment

In this paper, we conducted micromodel experiments to analyze the characteristics of multiphase flow during pulse injection. A micromodel is a type of porous media used for studying multiphase flow. It is typically made by etching glass [30,31,32,33]. Both the water and oil phases show wetting on the glass surface, meaning that they spread out and form a thin film rather than beading up [34]. In order to avoid the influence of wettability difference during experiments, wettability treatment of micromodel is necessary. This operation ensures the success of the experiments and the reliability of the data.
First, petroleum ether is continuously injected into the porous medium to carry out the residual oil phase in the model, for the highly volatile solvent displacement can effectively carry out the remaining impurities. Petroleum ether is continuously injected into the porous medium to remove any remaining oil phase, which may contain impurities that could affect the wettability. The injection rate of petroleum ether is 0.05 mL/min, and the process lasts for 10 to 15 min until there is no visible oil in the model. The model is then dried by blowing air into the model to remove residual petroleum ether. Sometimes, the oil in the model driven by water will remain in some blind end of porous media and the narrow throat, where the petroleum ether adsorbs easily; therefore, we need air to displace the excess petroleum ether. Then, anhydrous ethanol is injected into the model. The pore surface of the porous medium treated with anhydrous ethanol will show water-wet. Next, the model is dried using a drying method. Finally, the micromodel is heated to 45–50 °C for 50 min to ensure complete drying and stabilize its wettability. The microfluidic model is shown in Figure 1, and is held by model slot and model cover. The inlet and outlet of the model have rubber rings connected to the slot. The model allows a maximum injection pressure of 20 bar. The maximum injection pressure of the model is allowed to increase under the support of the slot and cover with confining pressure, but this experiment is under atmospheric pressure environment, the maximum inlet pressure is not allowed to over 20 bar.

2.1.2. Oil and Water Used in Experiments

The small mobility ratio of oil to water will lead to slug propulsion at the two-phase interface, which results in the recovery rate being too high to correspond to the actual development situation. However, the oilfield data show that it is difficult to obtain the slug flow of the oil phase even at a low mobility ratio. In the study, the active phase during displacement is the water phase, which is deionized water. The passive phase is oil, which is a 1:1 mixture of degassed crude oil and # 46 white oil (viscosity 46.213 mPa·s in 40 °C, density 0.862 g/mL). The density of the mixed oil phase is 0.797 g/mL and the viscosity is 20 mPa·s.

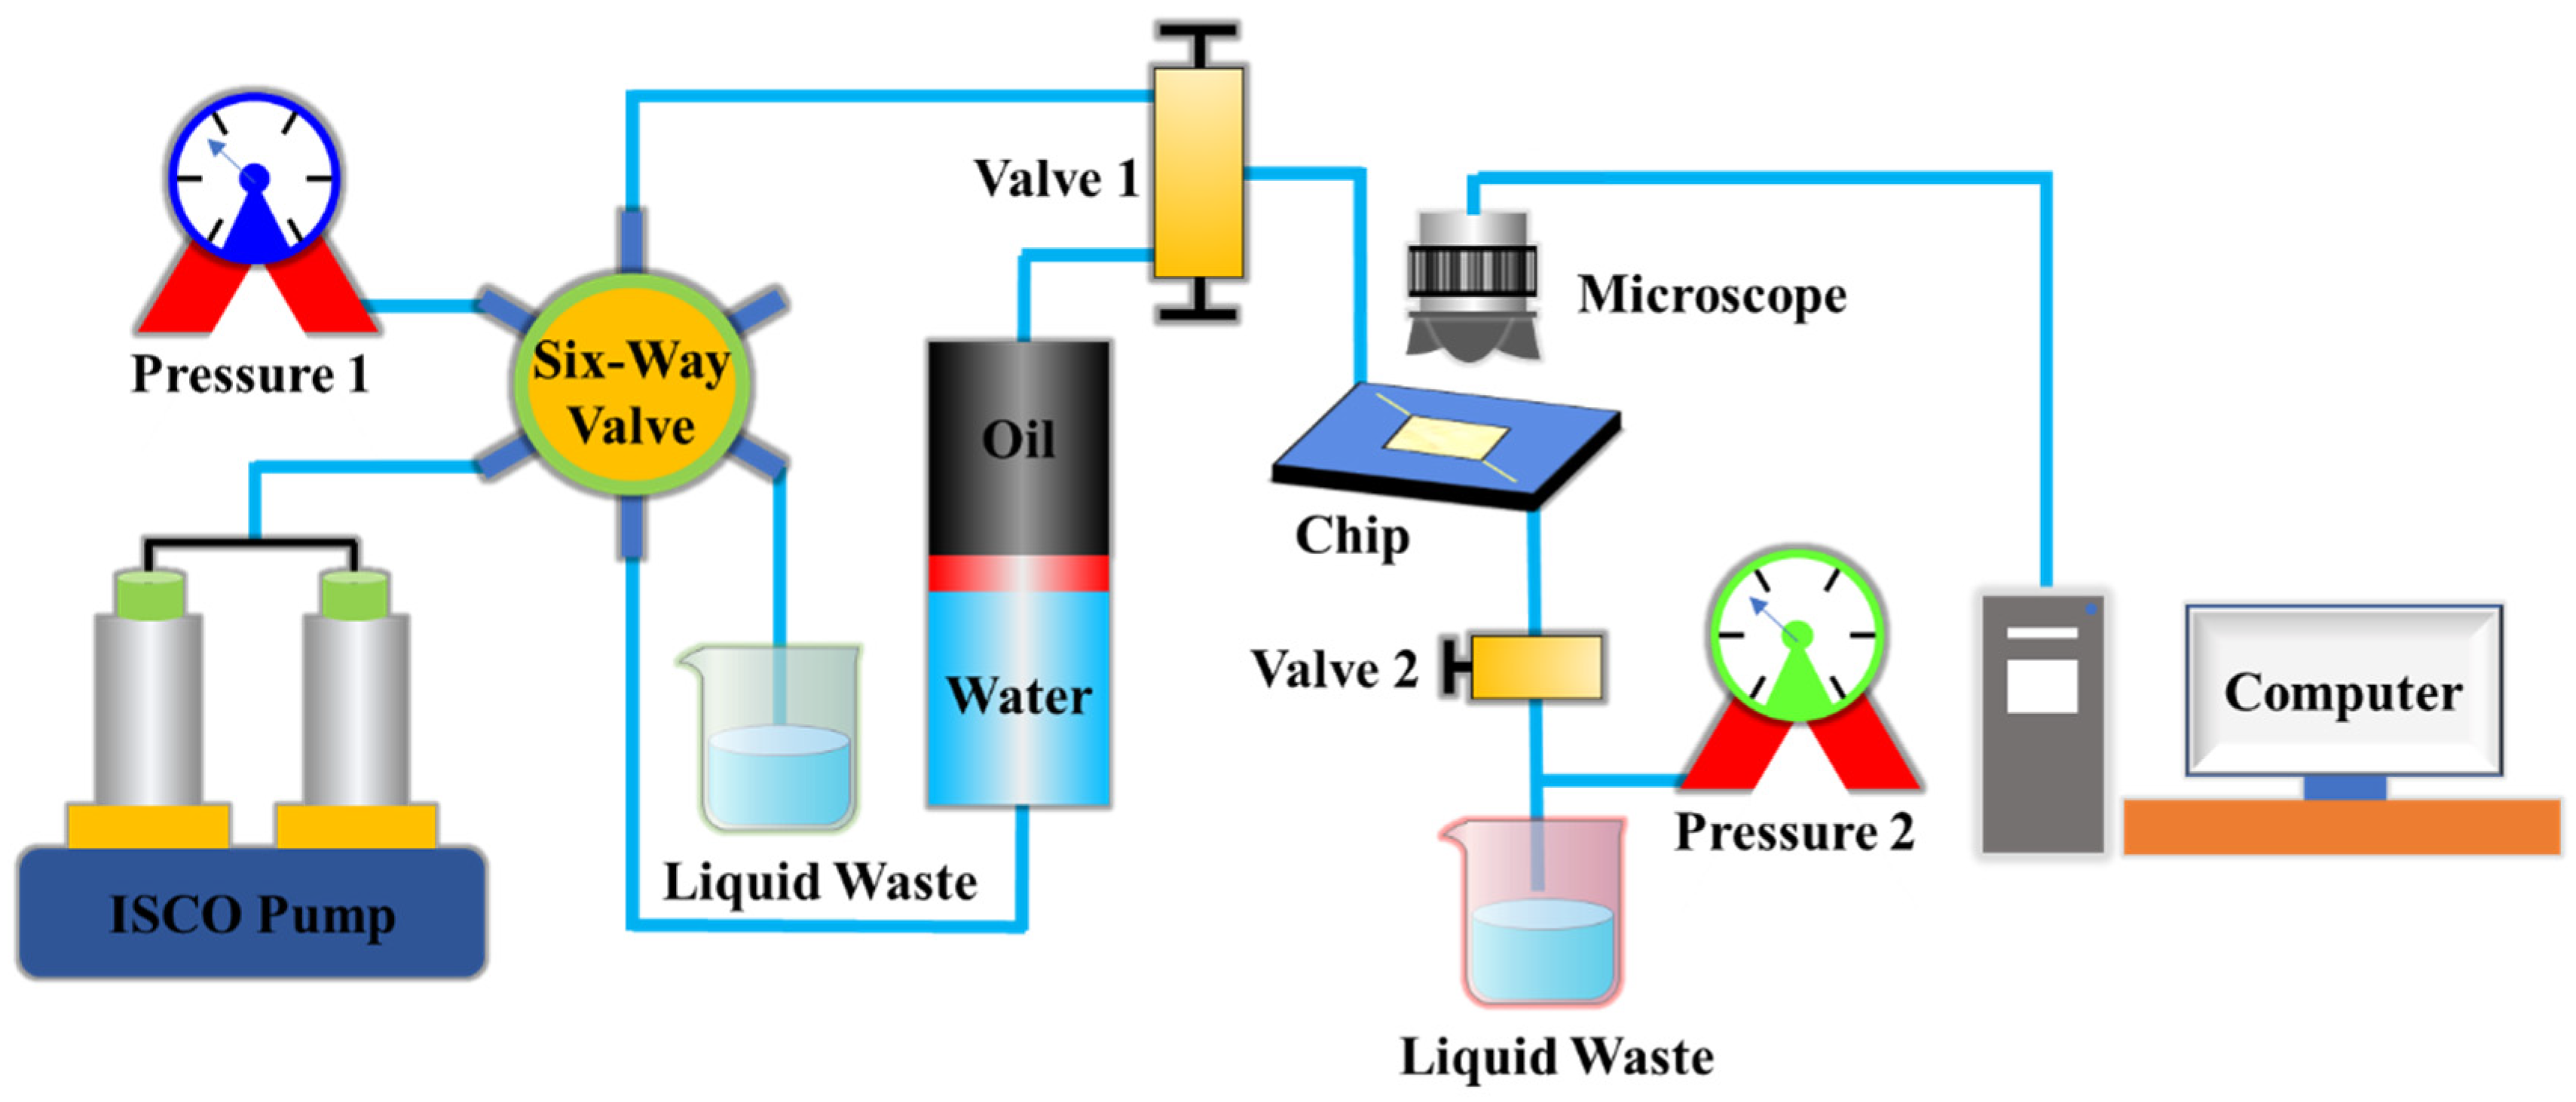
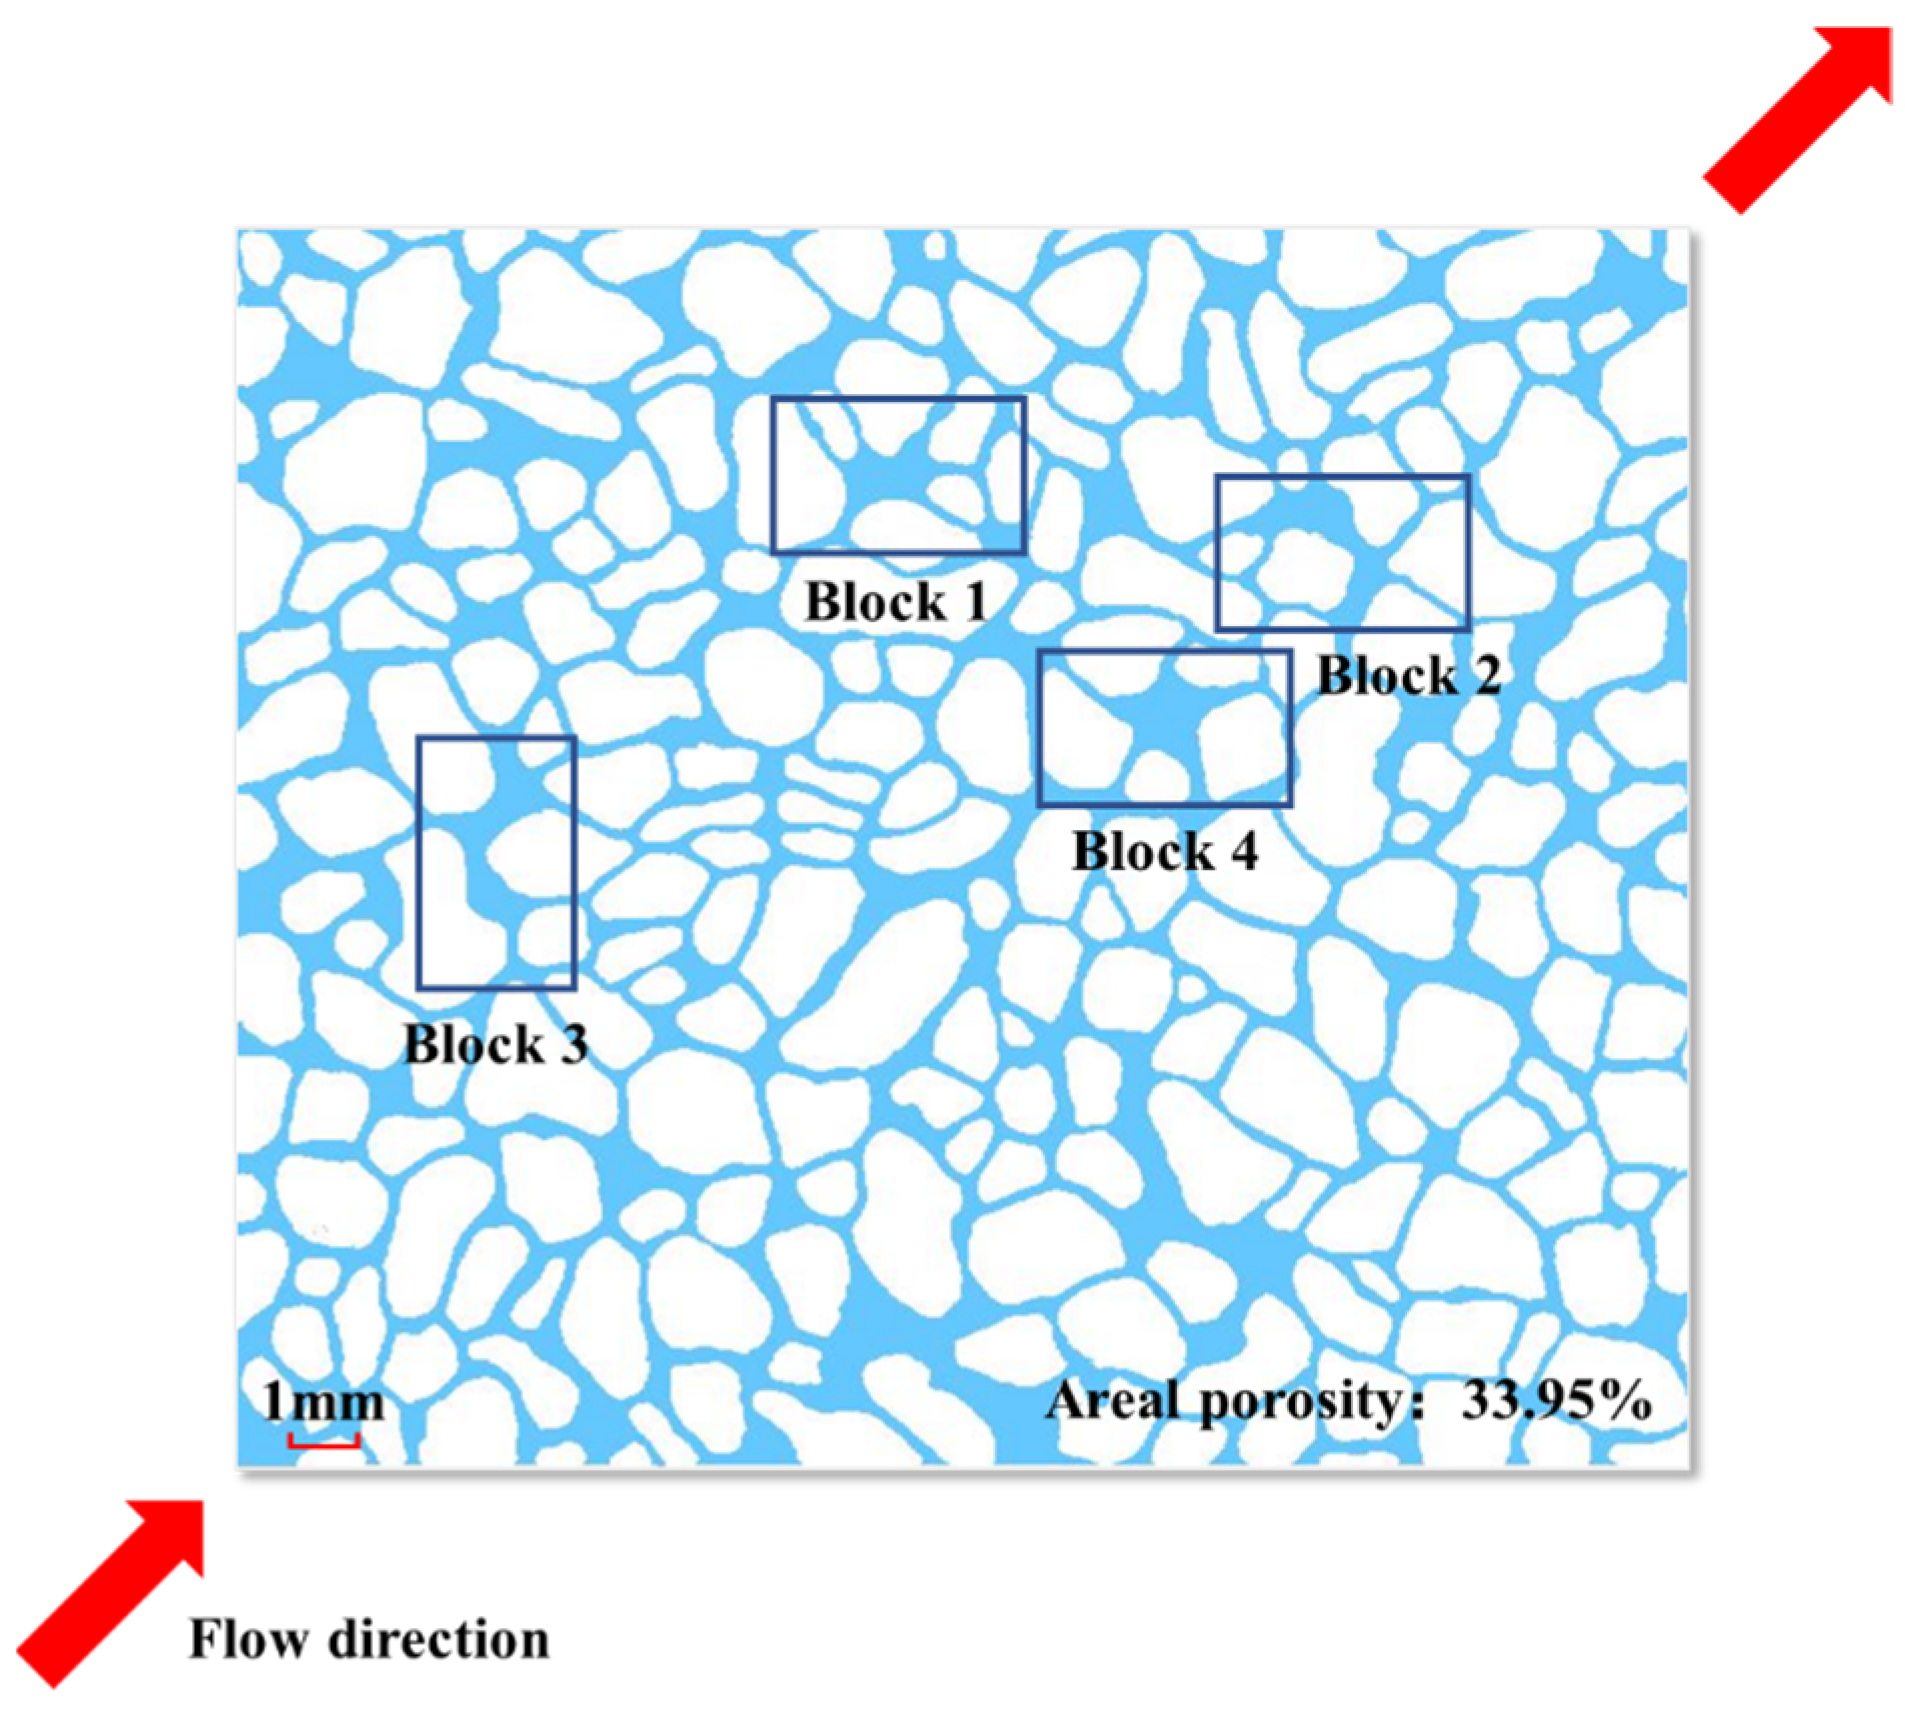
2.2. Experimental Setup

The schematic diagram of the experimental setup is shown in Figure 2. The experimental system is composed of a high-precision two-cylinder plunger pump, micromodel, type microscope, oil injection tank, and control valves. The pump is the Teledyne ISCO-65D, which has a flow rate range from 0.00001 to 25 mL/min, with an error of 0.3%, and the pressure ranges from 0.7 to 1379 bar. By modifying the pump control program, we realized the periodic change of displacement, which can pulse inject the water to the model. The frequency range of displacement changes is between 0 and 20 Hz. When the pumping frequency is above 10 Hz, the response to flow change is not timely and the error increases. The best frequency is between 0 to 5 Hz. All experiments were conducted at a temperature of 25 °C (77 °F) and atmospheric pressure (1 bar). The experimental procedure can be described as follows:
Vacuuming the micromodel: Close the inlet valve, connect the outlet with the vacuum pump, and vacuum the inside of the model.
Saturating the model with oil: Inject the oil phase to the model at a constant pressure of 6 Bar.
Relieving pressure in the setup: Close the inlet valve of the model, open the drain port of the six-way valve, and remove the pressure in the pipeline.
Injecting water at a constant pressure: Injecting at 2 Bar, the displacement will rise rapidly and decrease gradually. When the displacement is lower than 0.01 mL/min, increase the injection pressure by 2 Bar. Repeat this step until the maximum flow is less than 2 mL/min, shut off the pump and close the inlet valve of the micromodel.
Injection water under pulse flow rate: Set the average flow rate value and vary the amplitude and frequency of displacement. Start pulse injection with a safety pressure of 20 Bar.
How to deal with pressure overload: There is capillary resistance in the process of displacement, especially at the entrance of the model, and the pressure will increase sharply. As the water phase begins to enter the model, the displacement pressure will decrease significantly. When the pressure is overloaded, repeat steps 3–5.
Recording the data: Record the multiphase flow of water and oil in the micromodel using a microscope and camera.
Dealing with micromodel after injection: Follow the wettability treatment procedures outlined in Section 2.1 for the micromodel, after injection.

3. Experimental Results and Discussions

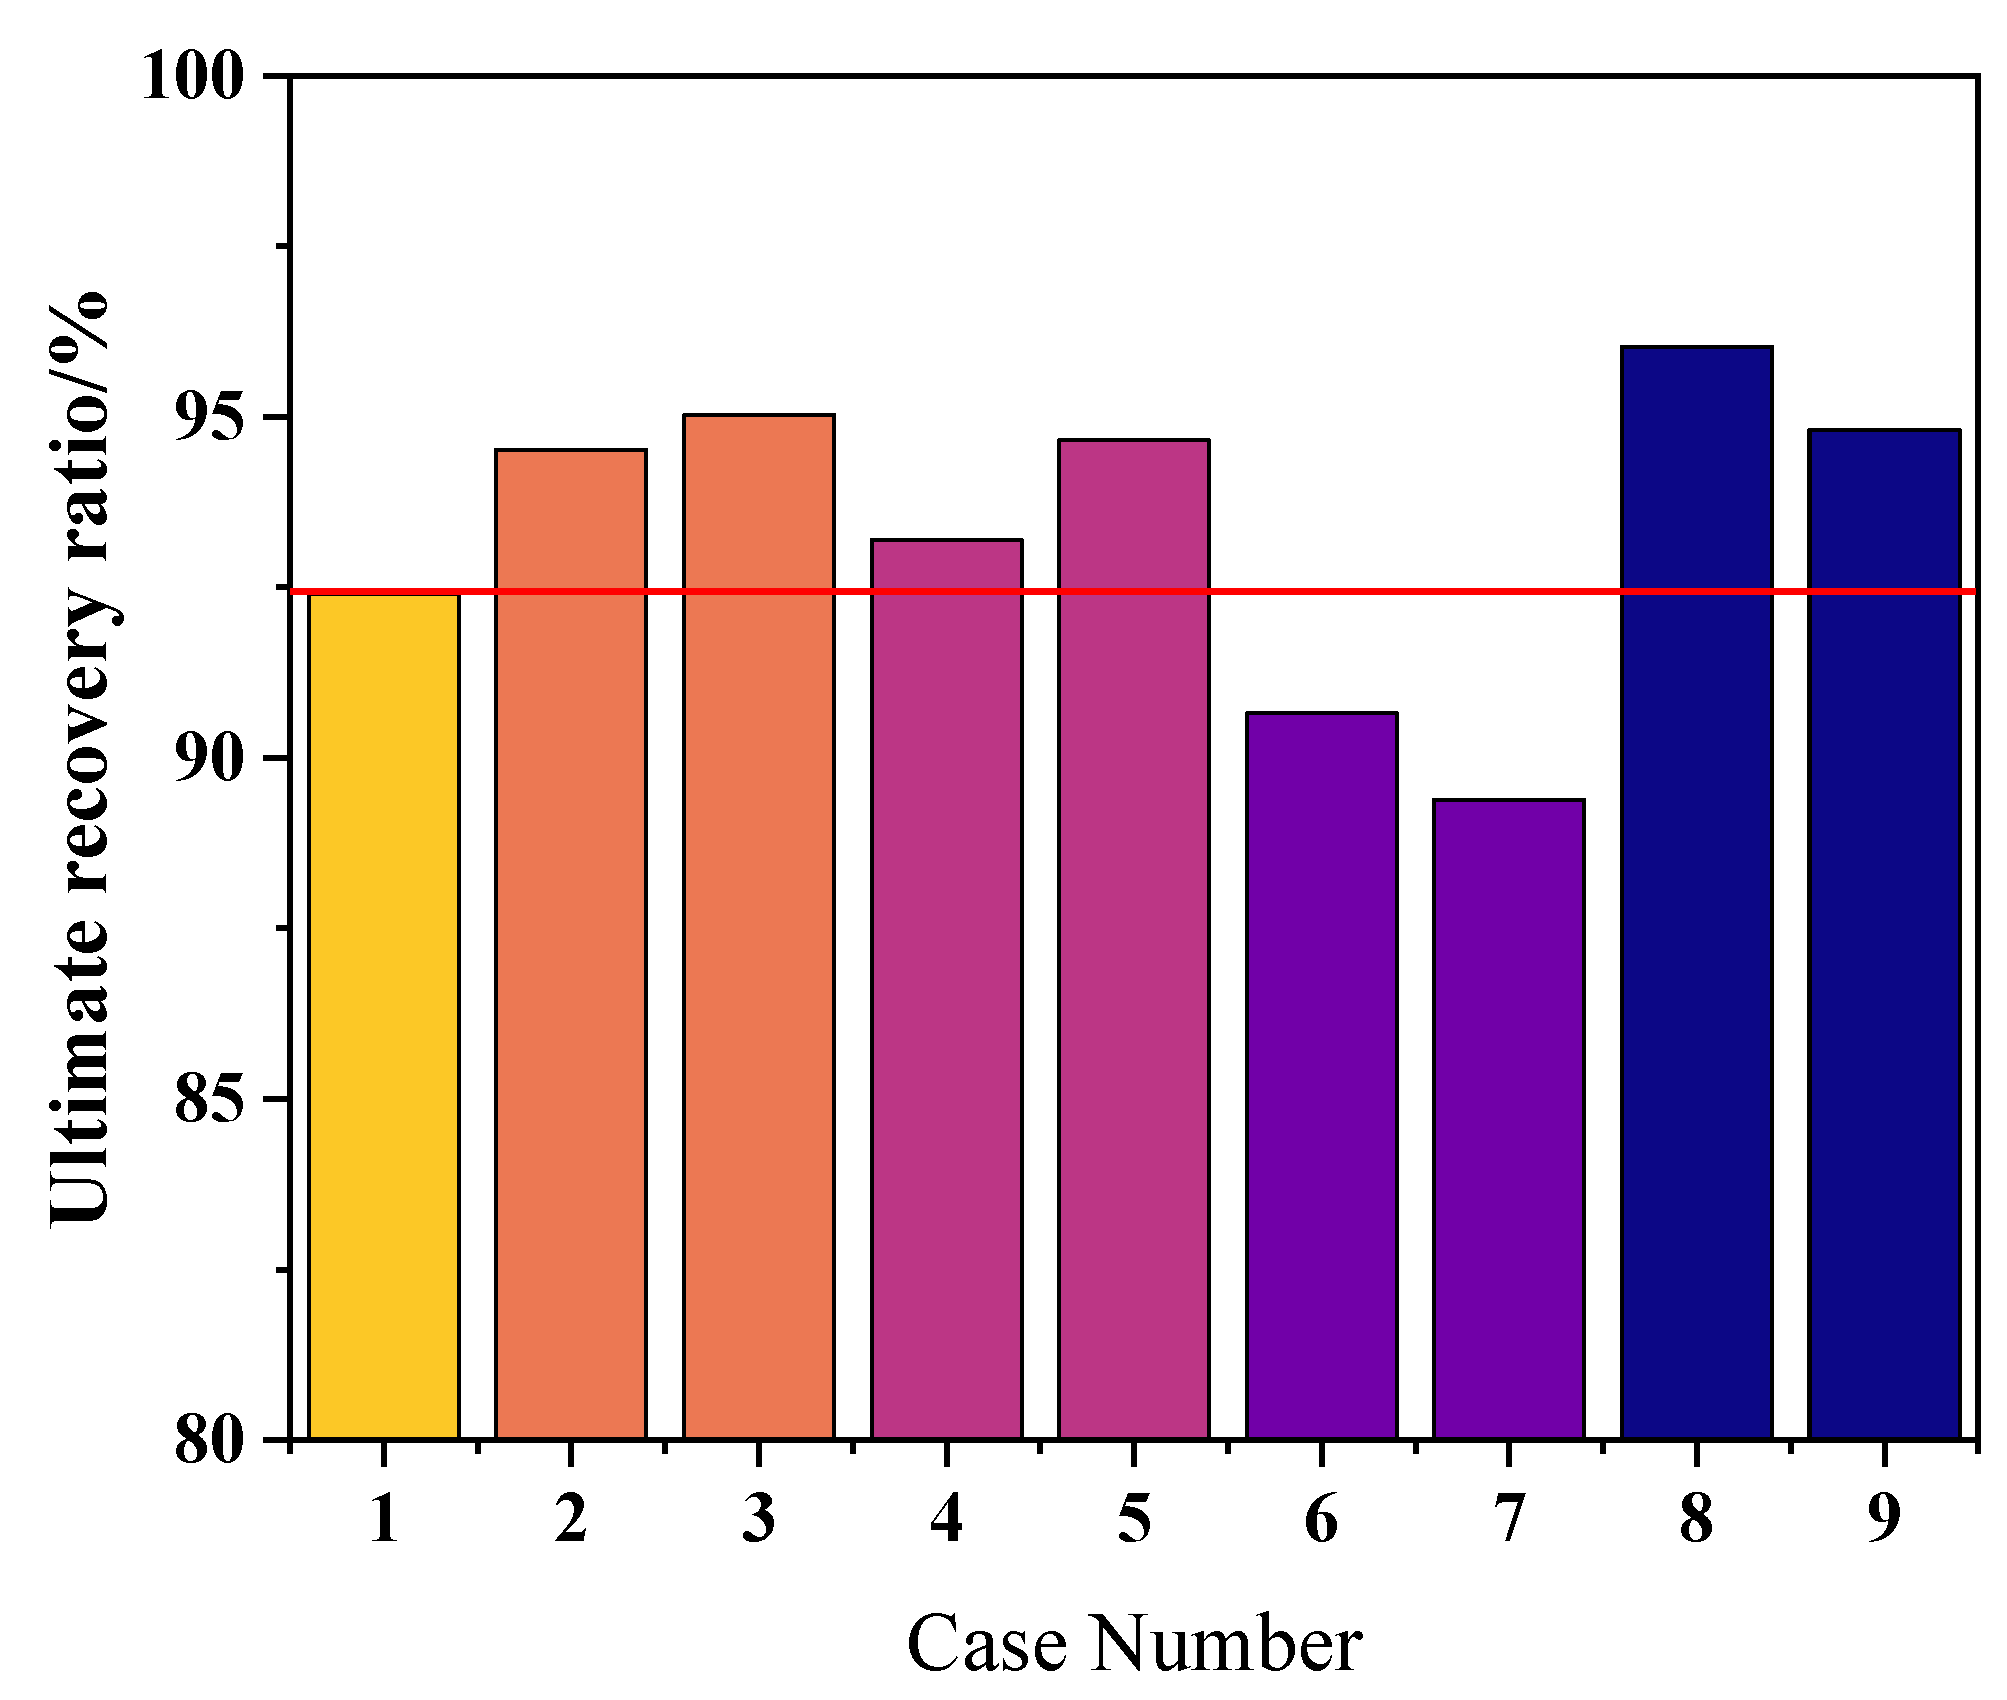
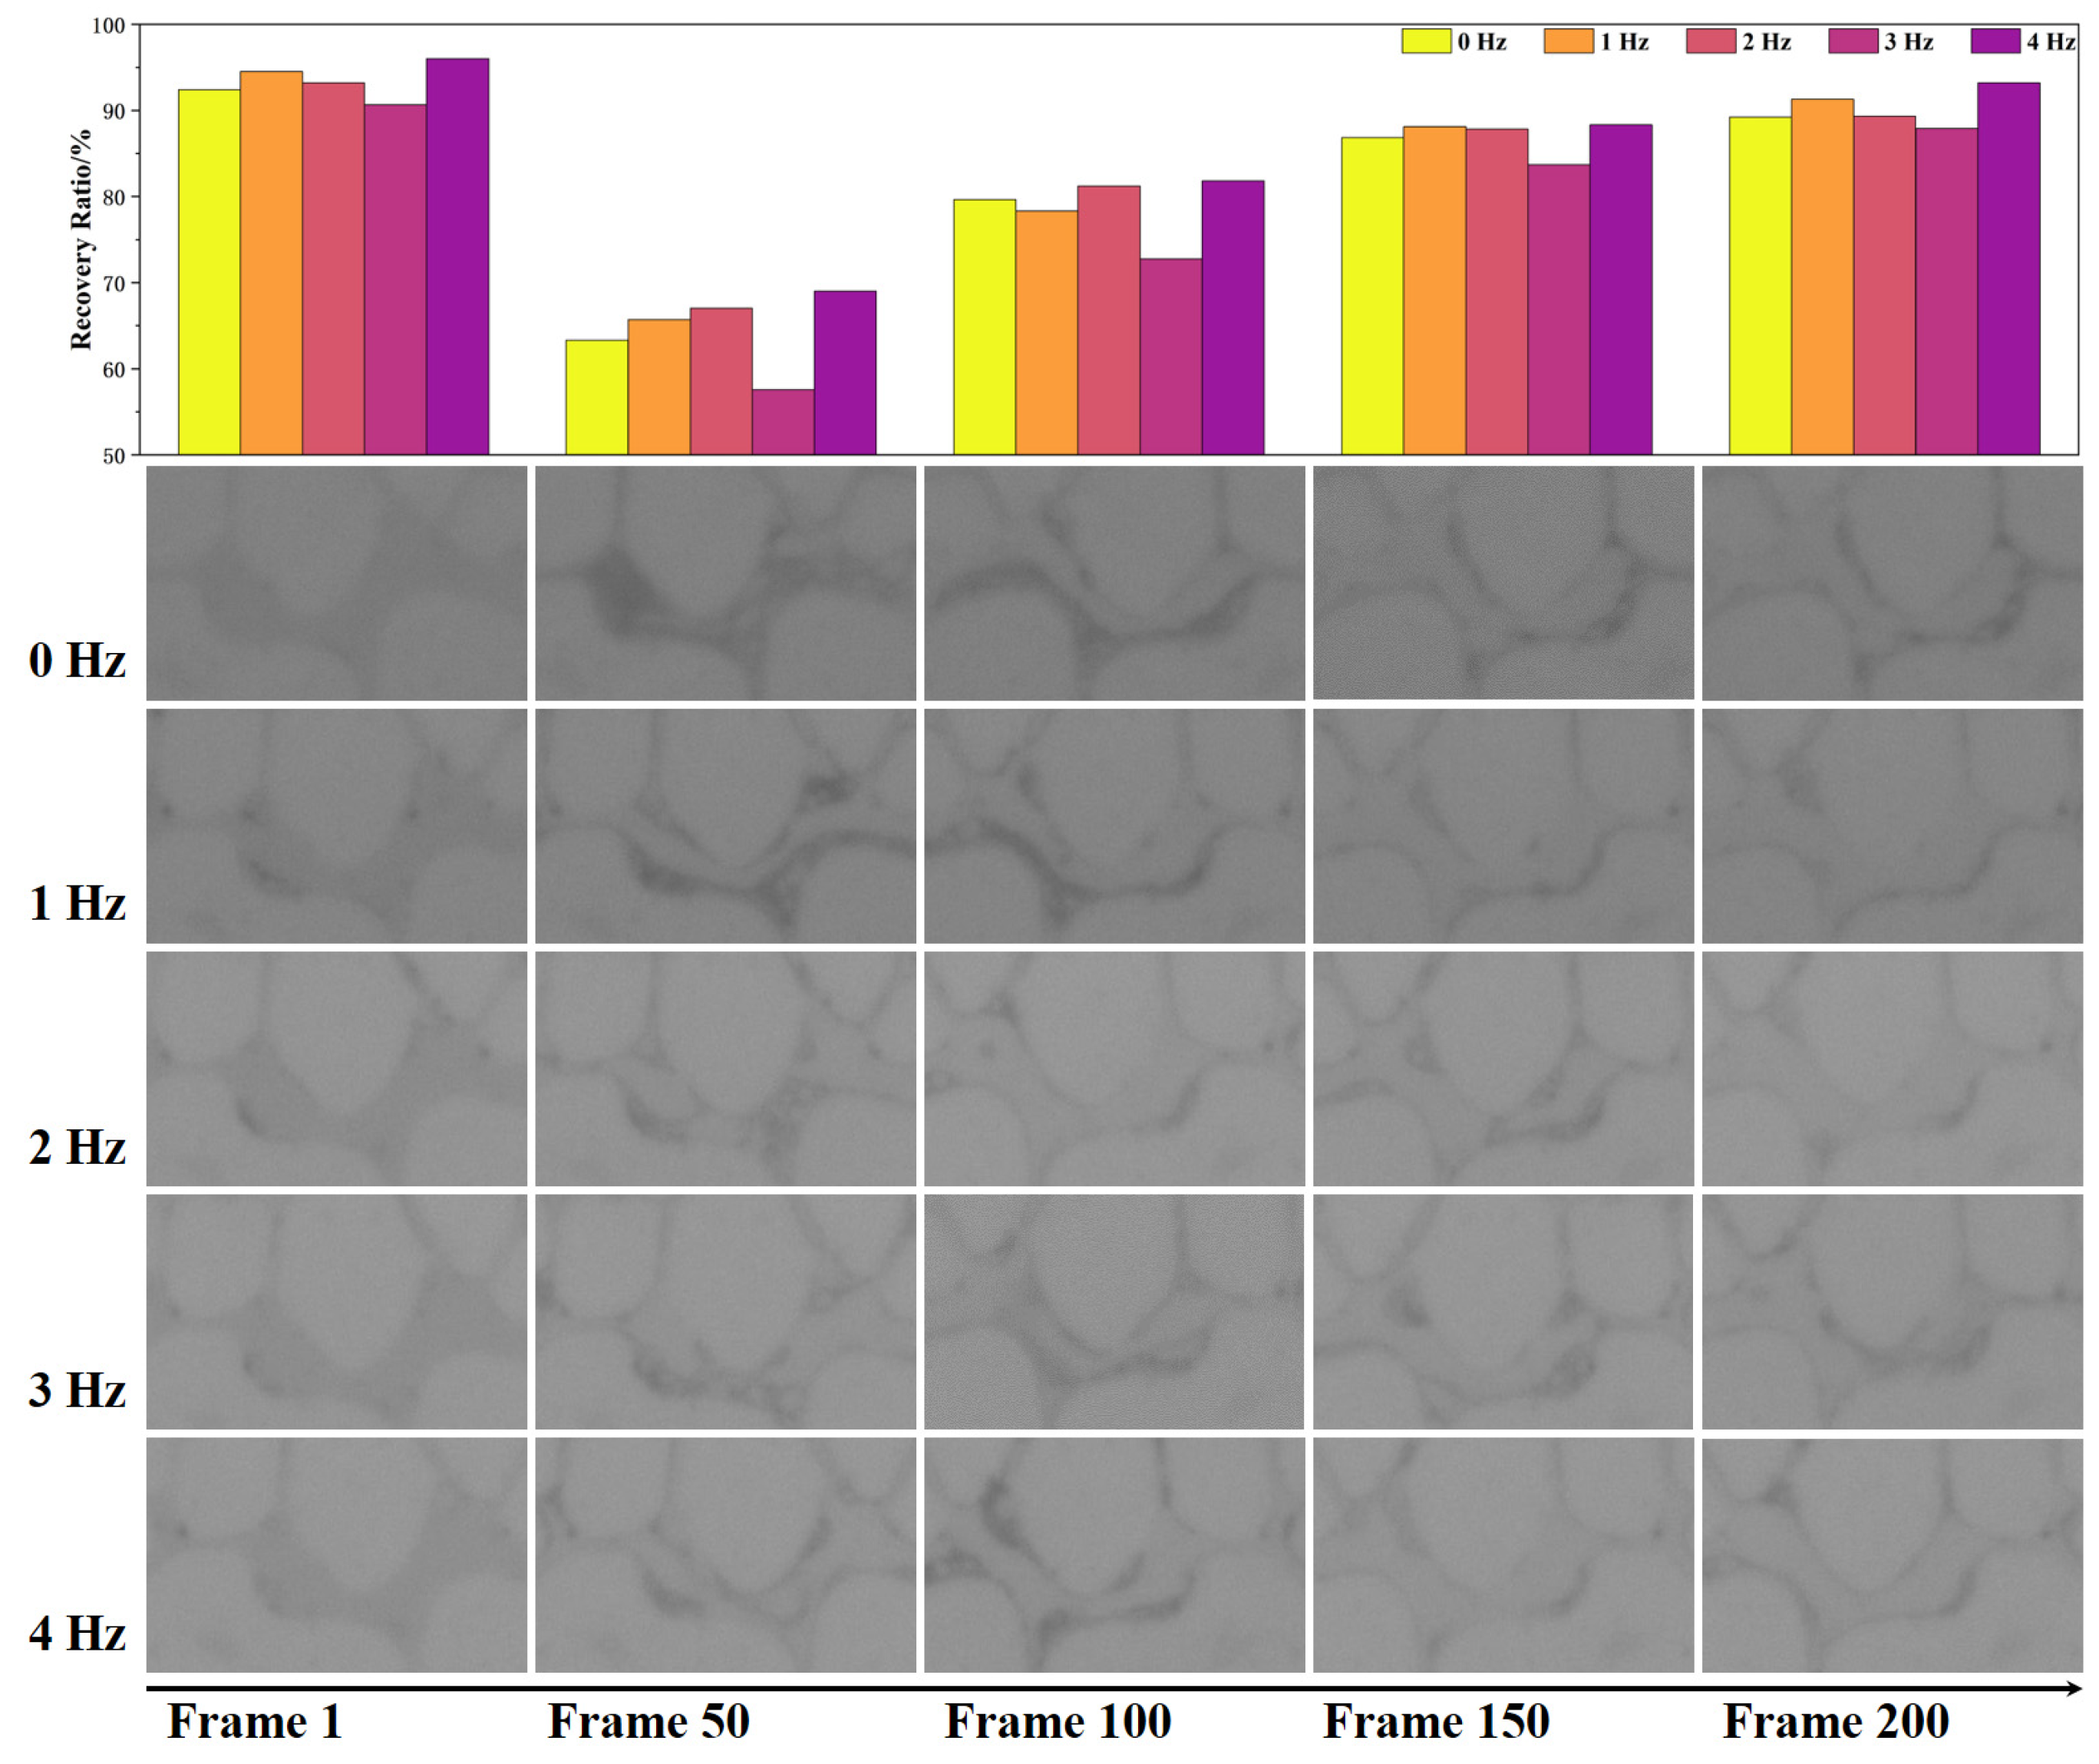
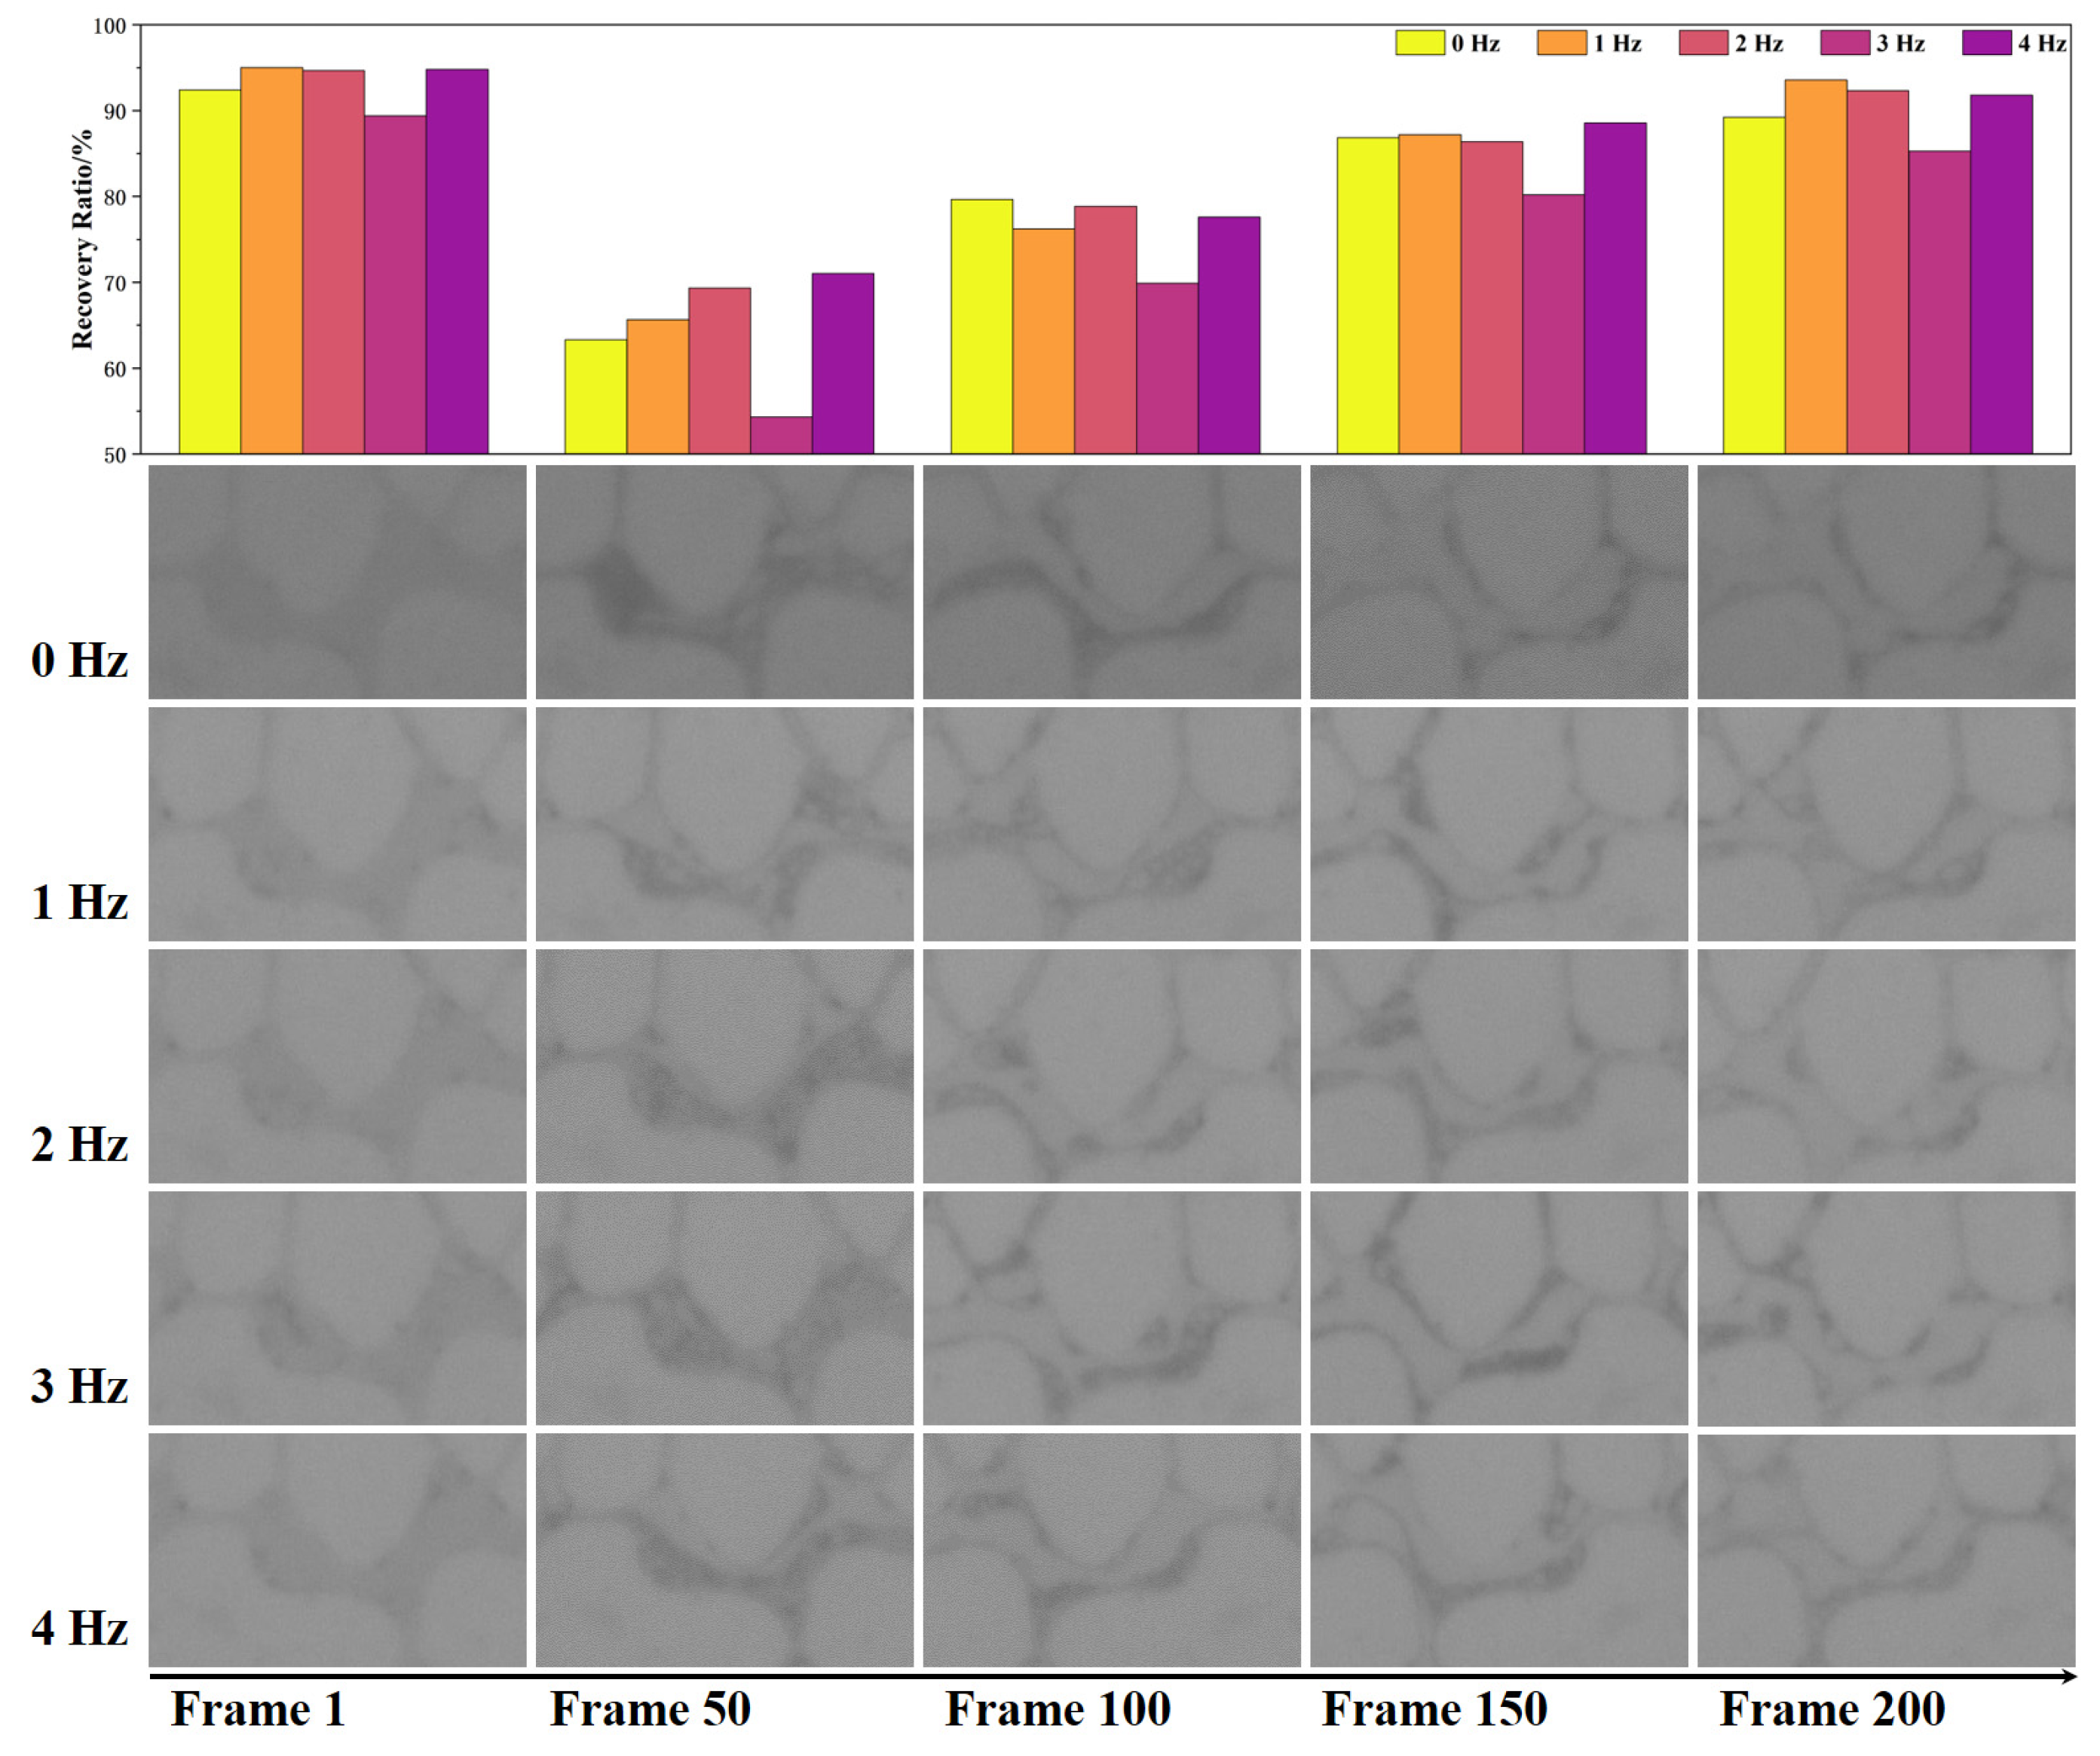
3.1. The Effect of Pulse Displacement on Oil Recovery Ratio

A micromodel was used to study the behavior of the two-phase flow in microstructures under pulse displacement, which can help us to observe the characteristics of two-phase flow intuitively [29,31,35]. It is convenient for us to accurately study the whole experiment process by stages according to the distribution image of oil and water in the micromodel. According to the characteristics of different stages, it is helpful for us to put forward targeted measures to enhance oil recovery [23]. The recovery ratio is one of the most important indexes to evaluate different development and displacement methods. In this paper, the ratio of oil phase to total pore area is used to represent recovery ratio, as shown in Figure 3.
By re-writing the pump control program, we were able to achieve pulse displacement functionality. The oil–water distribution at different times and the presence of residual oil and oil recovery ratio were obtained from the photographs captured by the camera. As seen in Table 2, the data indicate that the duration of displacement is largely dependent on the magnitude of displacement. For example, when the magnitude is 0.01 mL/min, the displacement lasts for around 200 frames, similar to non-pulse displacement. However, when the magnitude increases to 0.005 mL/min, the duration extends to 300 frames, as depicted in Figure 4. To accurately compare the oil–water distribution at the same time, we analyzed the displacement images at the 50th, 100th, 150th, and 200th frames.
At the conclusion of the experiment, the oil–water distribution in the micromodel was analyzed to calculate the recovery ratio, as seen in Figure 5. It was found that the experiment achieved a high recovery ratio, ranging from 90% or even higher [36,37]. Upon investigating the effect of pulse parameters on the ultimate recovery ratio, it was determined that the value is mainly impacted by the pulse frequency. For cases with the same pulse frequency, the ultimate recovery ratio was observed to be similar [38]. The structure of the porous media determines its natural frequency, and when the pulse frequency matches the natural frequency or there is a multiple relationship, it can result in resonance, thereby enhancing the flow of residual oil [39]. However, the natural frequency of the porous media in this experiment was found to be different from 3 Hz, leading to a reduction in the ultimate recovery ratio.

3.2. The Results of Oil and Water Distribution

Fluid distribution affects oil recovery by influencing factors such as capillary pressure, relative permeability, interfacial tension, and wettability. Different methods of enhanced oil recovery (EOR) aim to alter fluid distribution to increase oil production.
In this section, we analyze the displacement effect by comparing the displacement images of the 50th, 100th, 150th, and 200th time steps for each case. Four specific areas within the porous media have been selected for analysis, as depicted in Figure 6, and they have been named Block 1 to Block 4. Blocks 2 and 4 are positioned along the main flow channel, while Blocks 1 and 3 are located on the edge of the model and are affected by the boundary conditions. The pore diameter of Blocks 1 and 4 is large, with a larger pore-to-throat ratio, making it easier for residual oil to form clusters. On the other hand, the pore-to-throat ratio of Blocks 2 and 3 is smaller, causing the residual oil to mostly adhere to the pore walls and form a film. The distribution images of oil and water for each case during displacement can be found in Figure 7 and Figure 8.

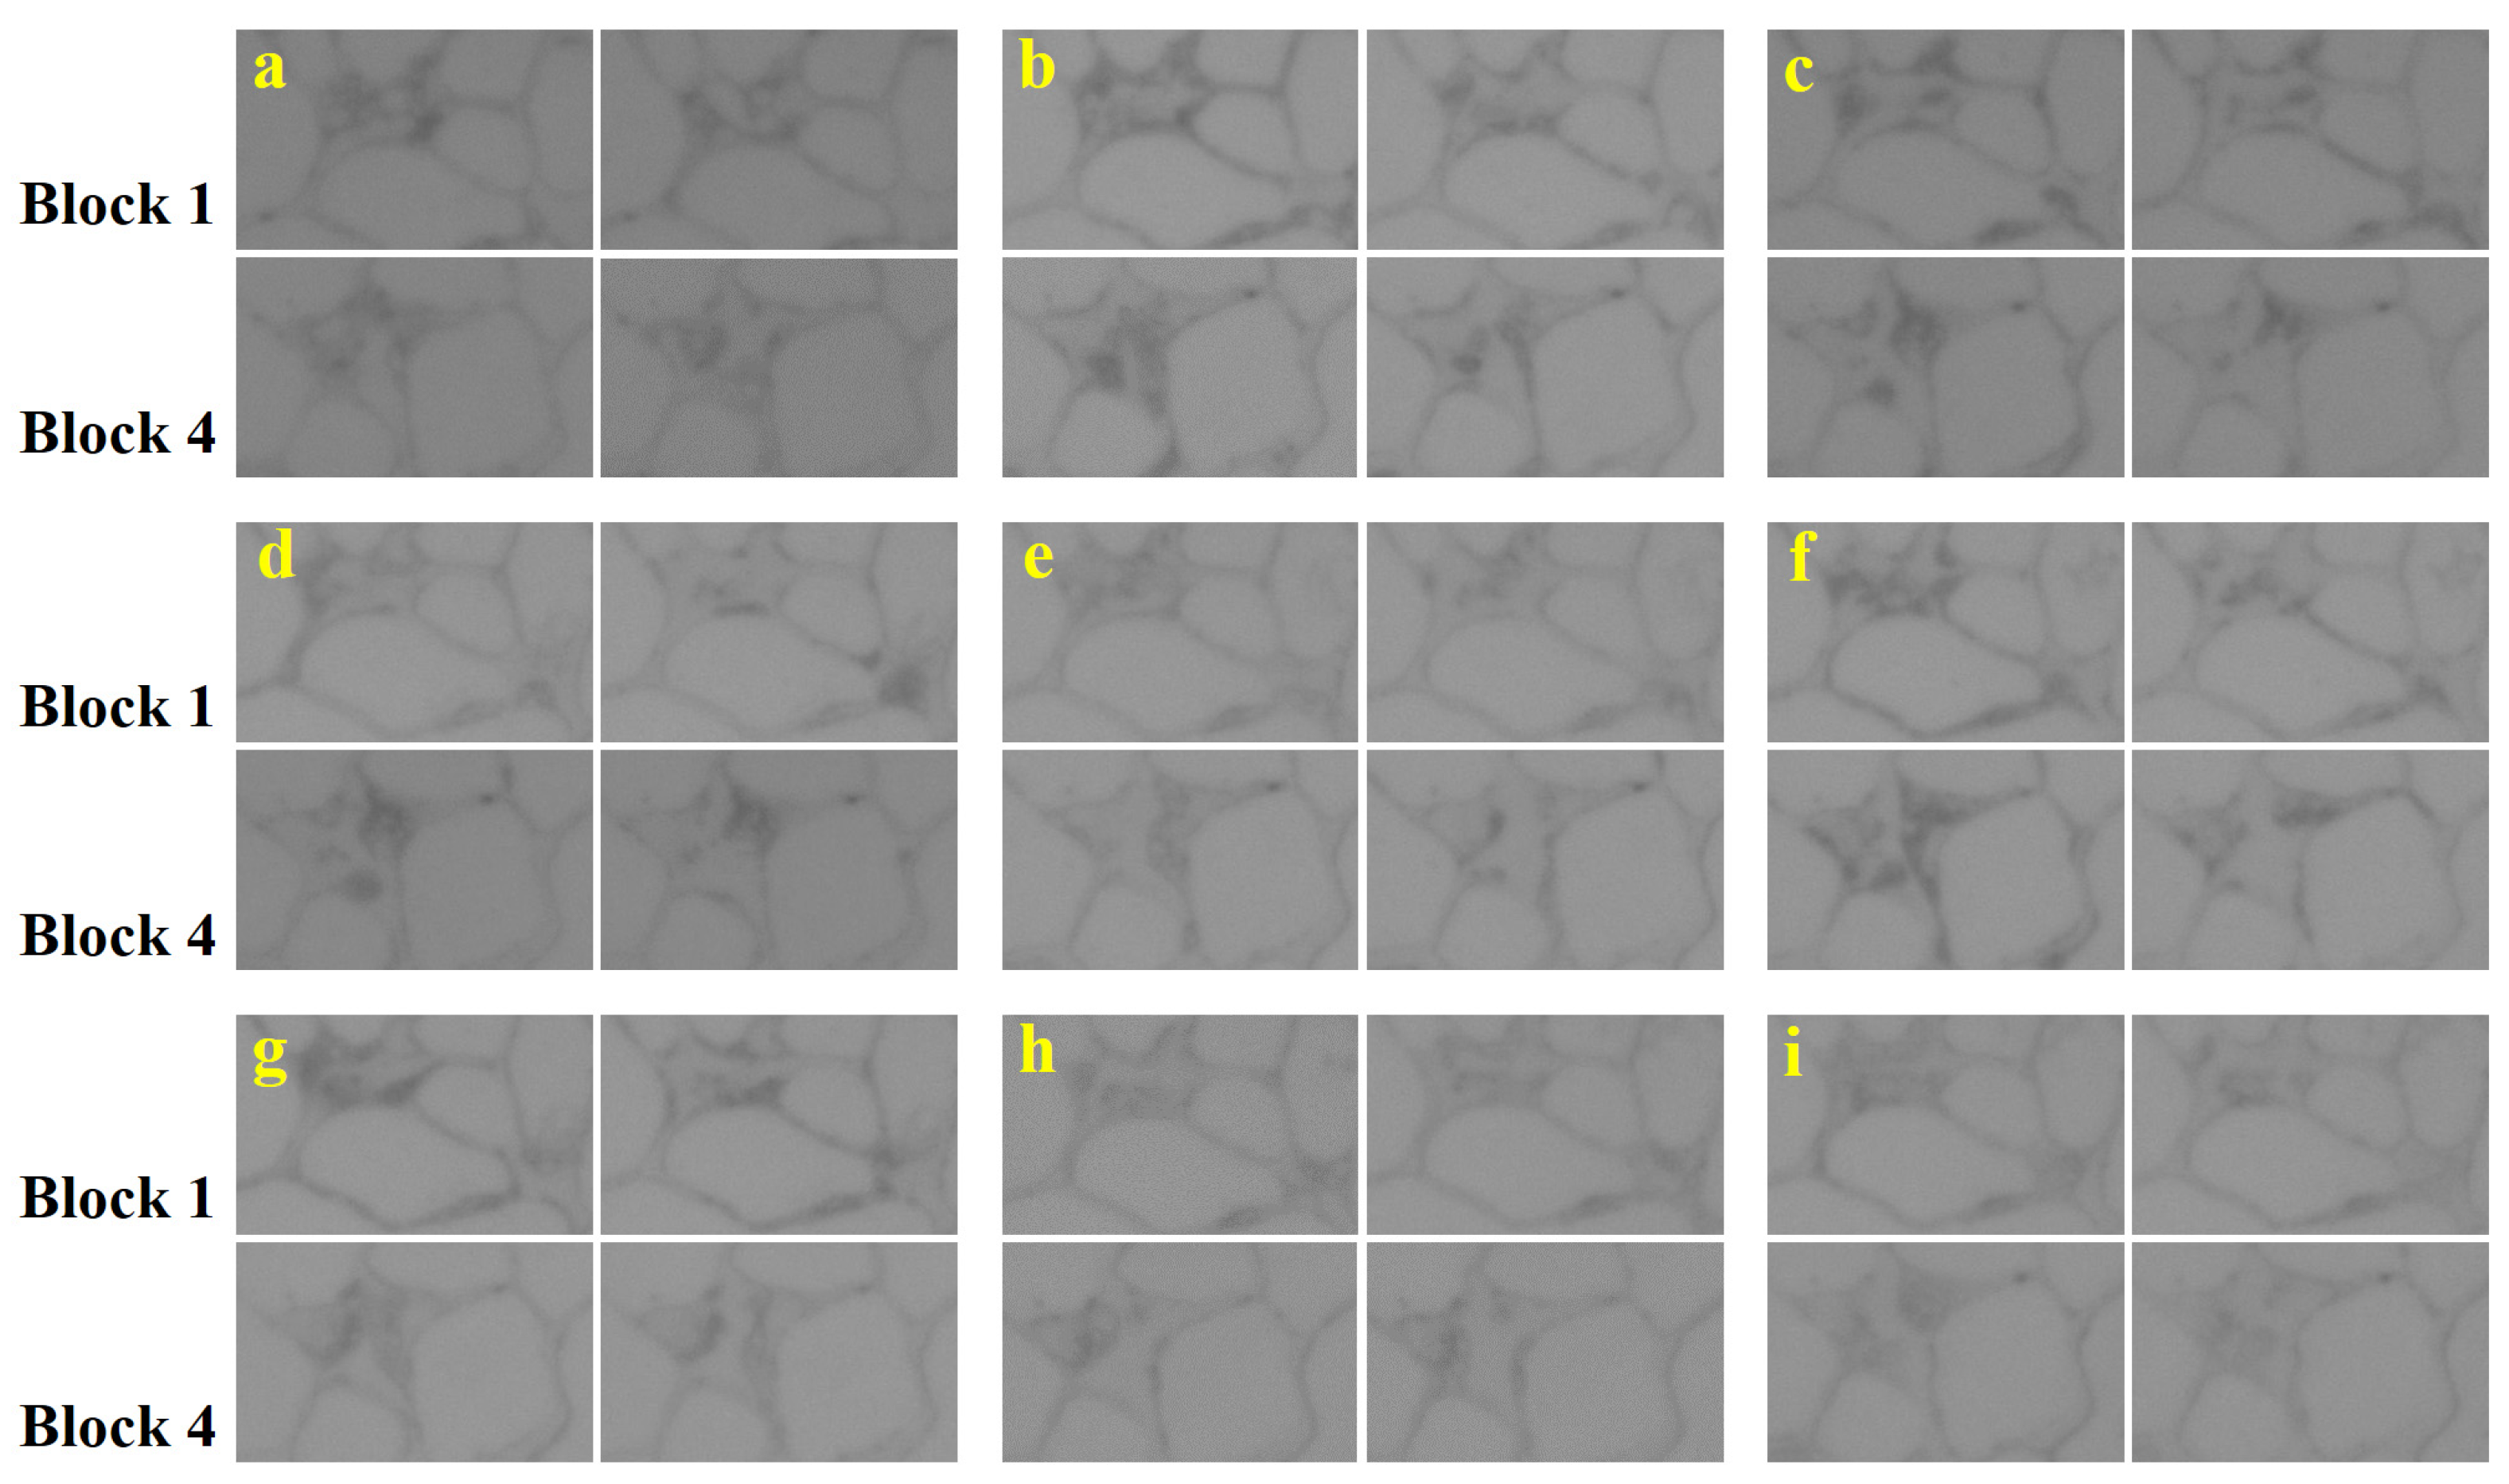
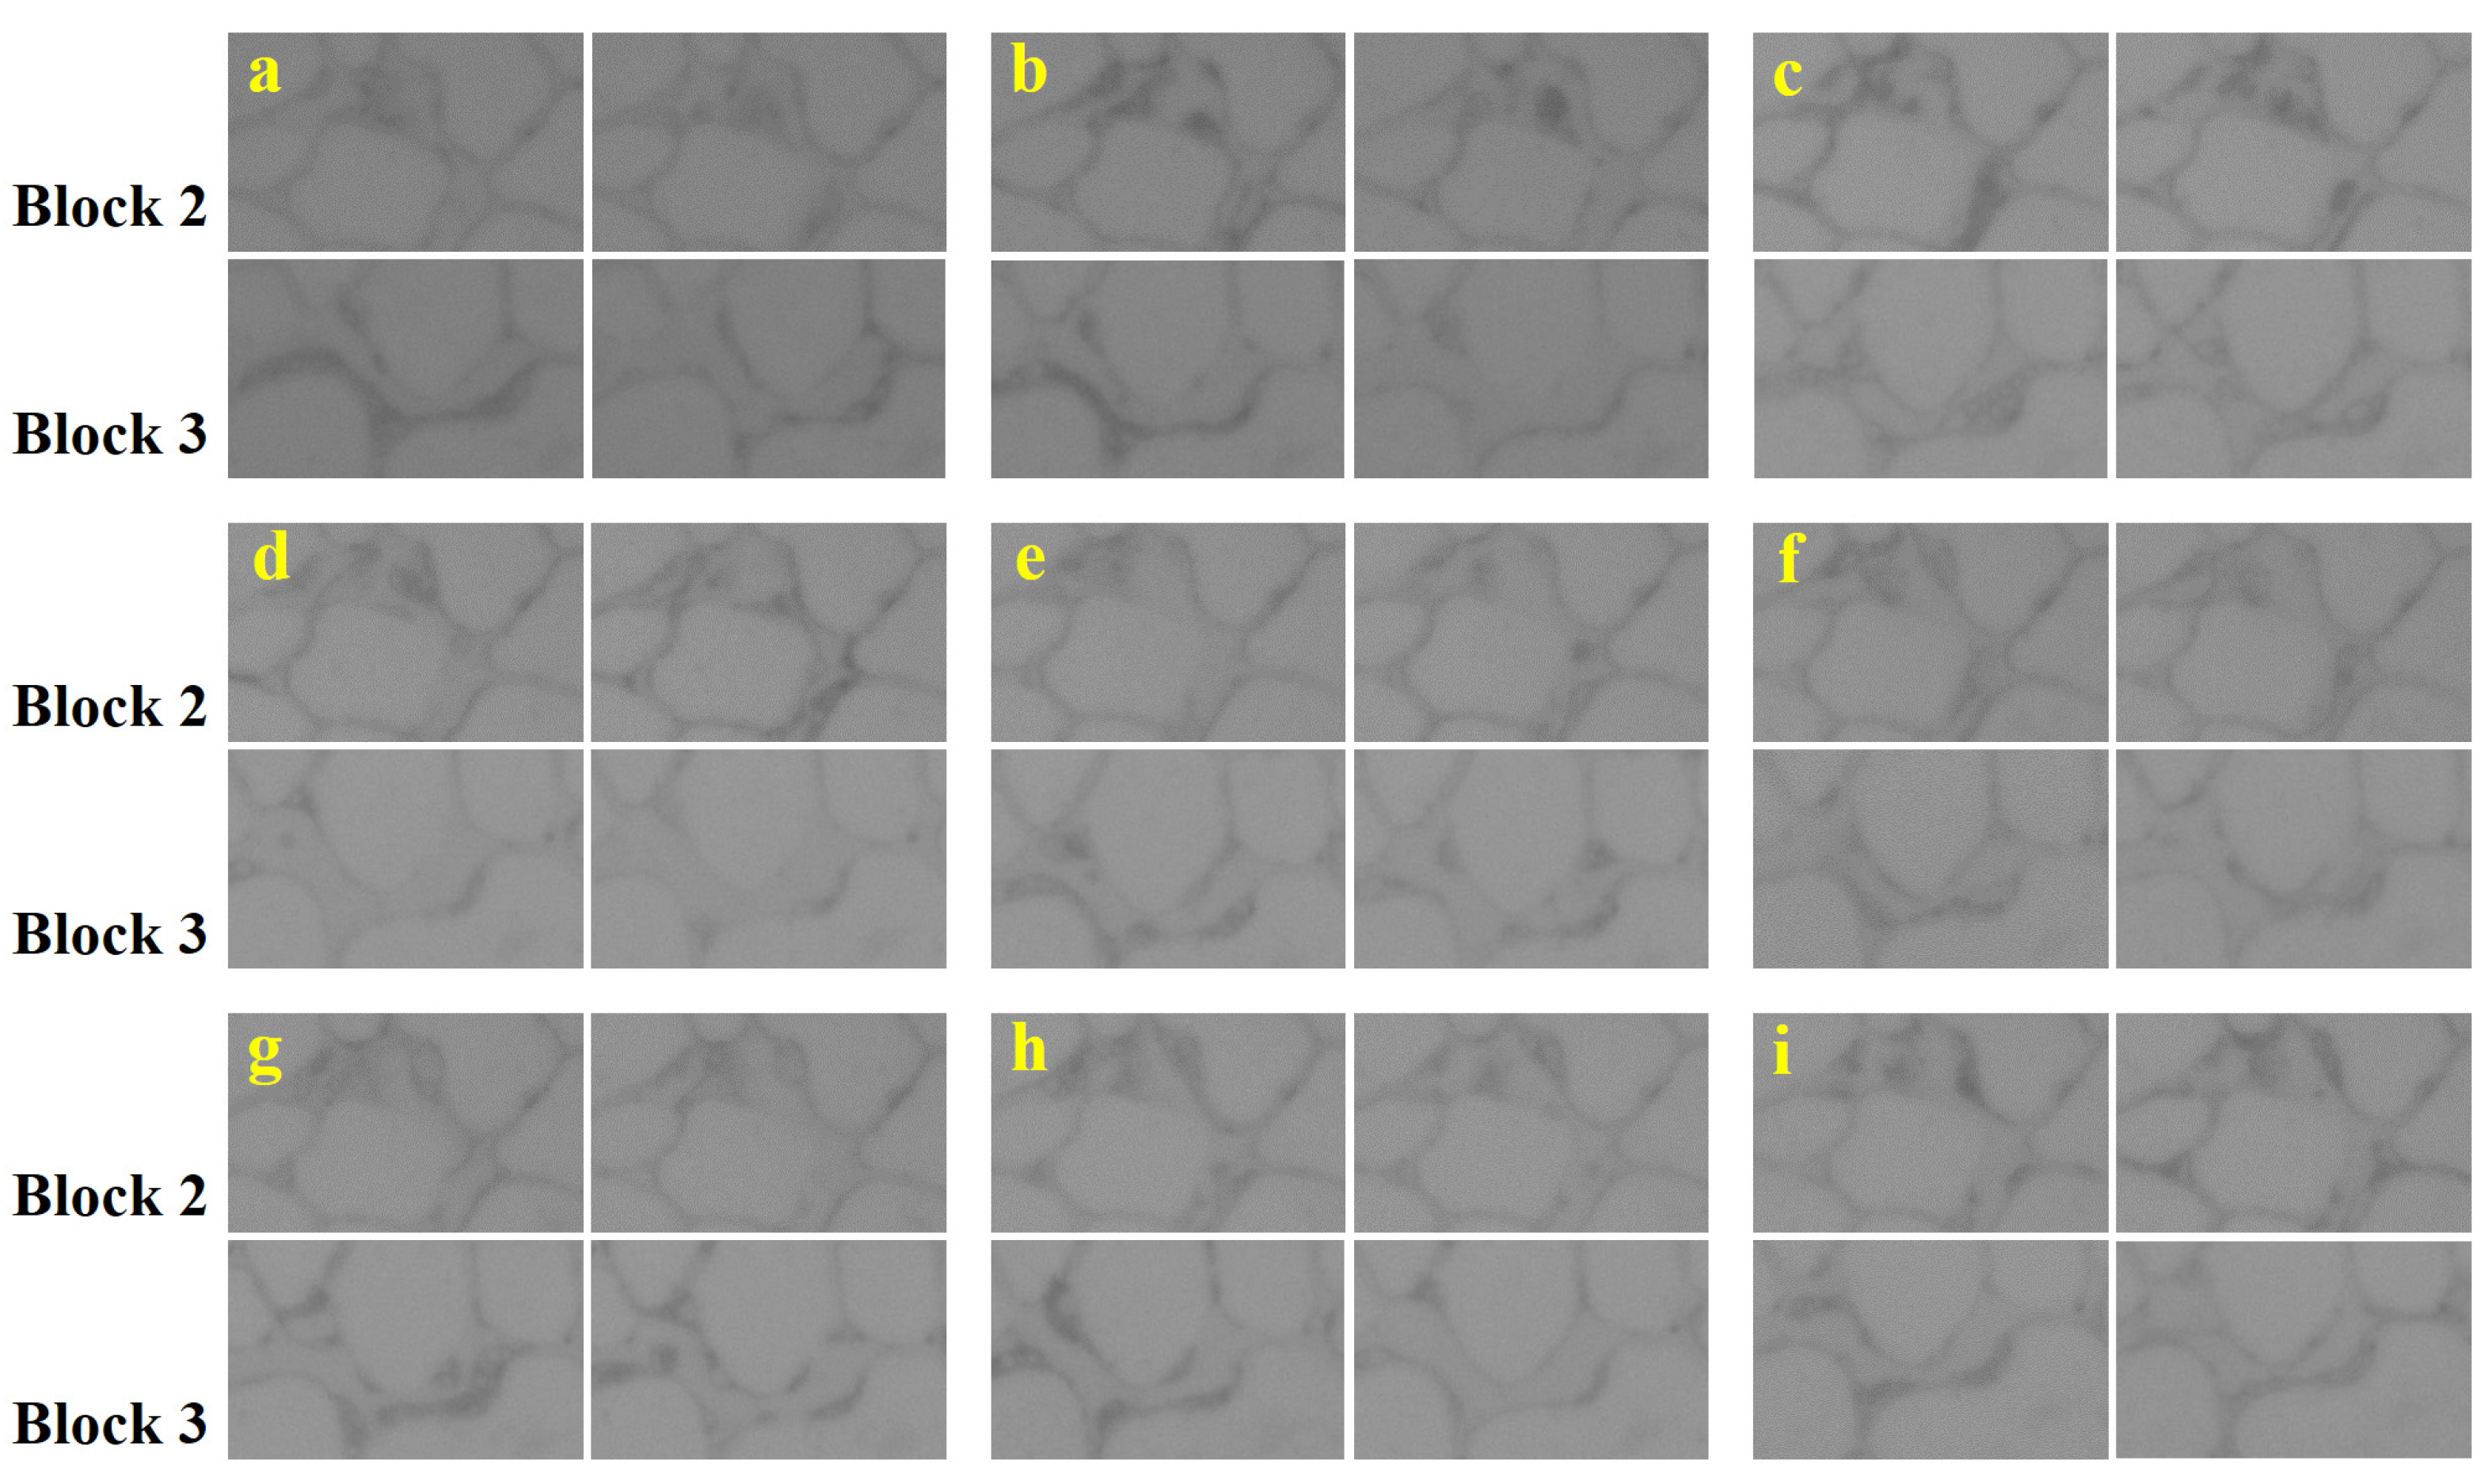
3.2.1. Effect of Pulse Displacement on Water and Oil Distribution

Pore-to-throat ratios in Blocks 1 and 4 were 1:6 and 1:5, respectively. The exit of the throat is located near the center of the micropore, which can lead to the formation of clusters of residual oil due to the capillary force of coordination throats and film-like residual oil due to wall adhesion in the pores [40,41]. Figure 7 displays images of residual oil distribution in Blocks 1 and 4, with cluster-like residual oil primarily found in Block 4. In Block 1, both types of residual oils were connected, with residual film oils concentrated near the micropores near the throat. Pulse flooding significantly reduced cluster-like residual oil, with the best pulse frequencies being 1 Hz, 2 Hz, and 4 Hz. The images indicate that, at the same displacement frequency, a greater frequency amplitude results in a better flow of residual oil, and the film-like residual oil is reduced and covers a smaller area compared to non-pulse displacement. The difference in displacement effect between Block 1 and Block 4 is due to their locations; Block 1 was located near the model boundary with a slower seepage flow velocity, resulting in a reduced effect of pressure fluctuation caused by pulse flooding. The benefits of pulse-induced displacement were more apparent in Block 4.
When the length-to-diameter ratio is small, the effect of the pore shape, including capillary force, is weak, making it easier for residual oil to flow again [42]. However, with a large length-to-diameter ratio, pores become long and narrow, creating greater resistance that makes it more difficult for crude oil to be swept out. In this study, both Block 2 and Block 3 have similar pore characteristics, as shown in Figure 8. The images in Figure 8 show that residual oil mainly adheres to the pore wall as a film, and when fluid flows in narrow and long pores, the flow mainly moves along the long end with a high velocity. This causes the residual cluster oil to be driven out or pressed against the wall to form a film-like residual oil [43,44]. Since the residual oil is distributed along the flow direction of the pore wall, the displacement medium can only pull it through interaction force, which results in a short force arm and higher friction resistance that makes it difficult to flow. Figure 8 shows the distribution of residual oil in pores under pulse displacement, and similar to Figure 7, it can be concluded that the amplitude of the pulse plays a more significant role in enhancing oil recovery than frequency. In particular, the frequency of 1 Hz, 2 Hz, and 4 Hz cases show a more significant effect. When the flow rate of the liquid changes, the pressure gradient of the vertical wall appears in the pores, causing the oil film to experience a force perpendicular to the flow direction. As a result, the film-like residual oil thickens along the vertical wall direction, which favors the residual oil to be displaced out of the pore by the displacement medium. Comparing the location differences, the 200th frame of each case was compared. Block 3 had even less residual oil, especially in Figure 8a,b,d,h, indicating that the influence of the pulse was weakened when the flow velocity was slowed down by the boundary, as seen in Figure 7. Consequently, the displacement efficiency of Block 3 in Figure 8b,d,h was better than that of Block 2.

3.2.2. Effect of Pulse Displacement on Residual Oil Migration

Additionally, to investigate the relationship between residual oil stimulation and pulse flooding, we present the results of residual oil performance in Block 4 for each case, as shown in Figure 9 and Figure 10, with displacement magnitudes of 0.01 mL/min and 0.005 mL/min, respectively. The upper cluster plots in both figures represent the recovery ratio data over time, with Frame 1 corresponding to the final oil recovery data of the experiment.
The information in Figure 9 and Figure 10 was analyzed, respectively. We can conclude that the characteristics of the images in Figure 10 tended to be the same at the same time, while the images were quite different before 100th in Figure 9, the oil–water distribution of Frame 150 and Frame 200 were quite similar. In Figure 9, there was less residual oil in the pores than in Figure 10, indicating that the amplitude played an important role, as conducted above. Under the same frequency amplitude, the final recovery was close, but there was a big difference in the initial stage of development. We find that the displacement efficiency of the whole displacement process was excellent at the frequency of 2 Hz. In Figure 10, the amplitude of the displacement was 0.005 mL/min in each case, which was too small to provide enough force to keep the residual oil away from the wall. Next, we will talk about the effect of displacement in the case of 3 Hz. Both images of 3 Hz cases in Figure 9 and Figure 10 at the 200th frame were similar to that in 0 Hz, and the recovery ratio at each time was lower than that of other cases, which shows that the natural frequency of porous medium and the pulse was not matched, reducing the oil displacement efficiency.

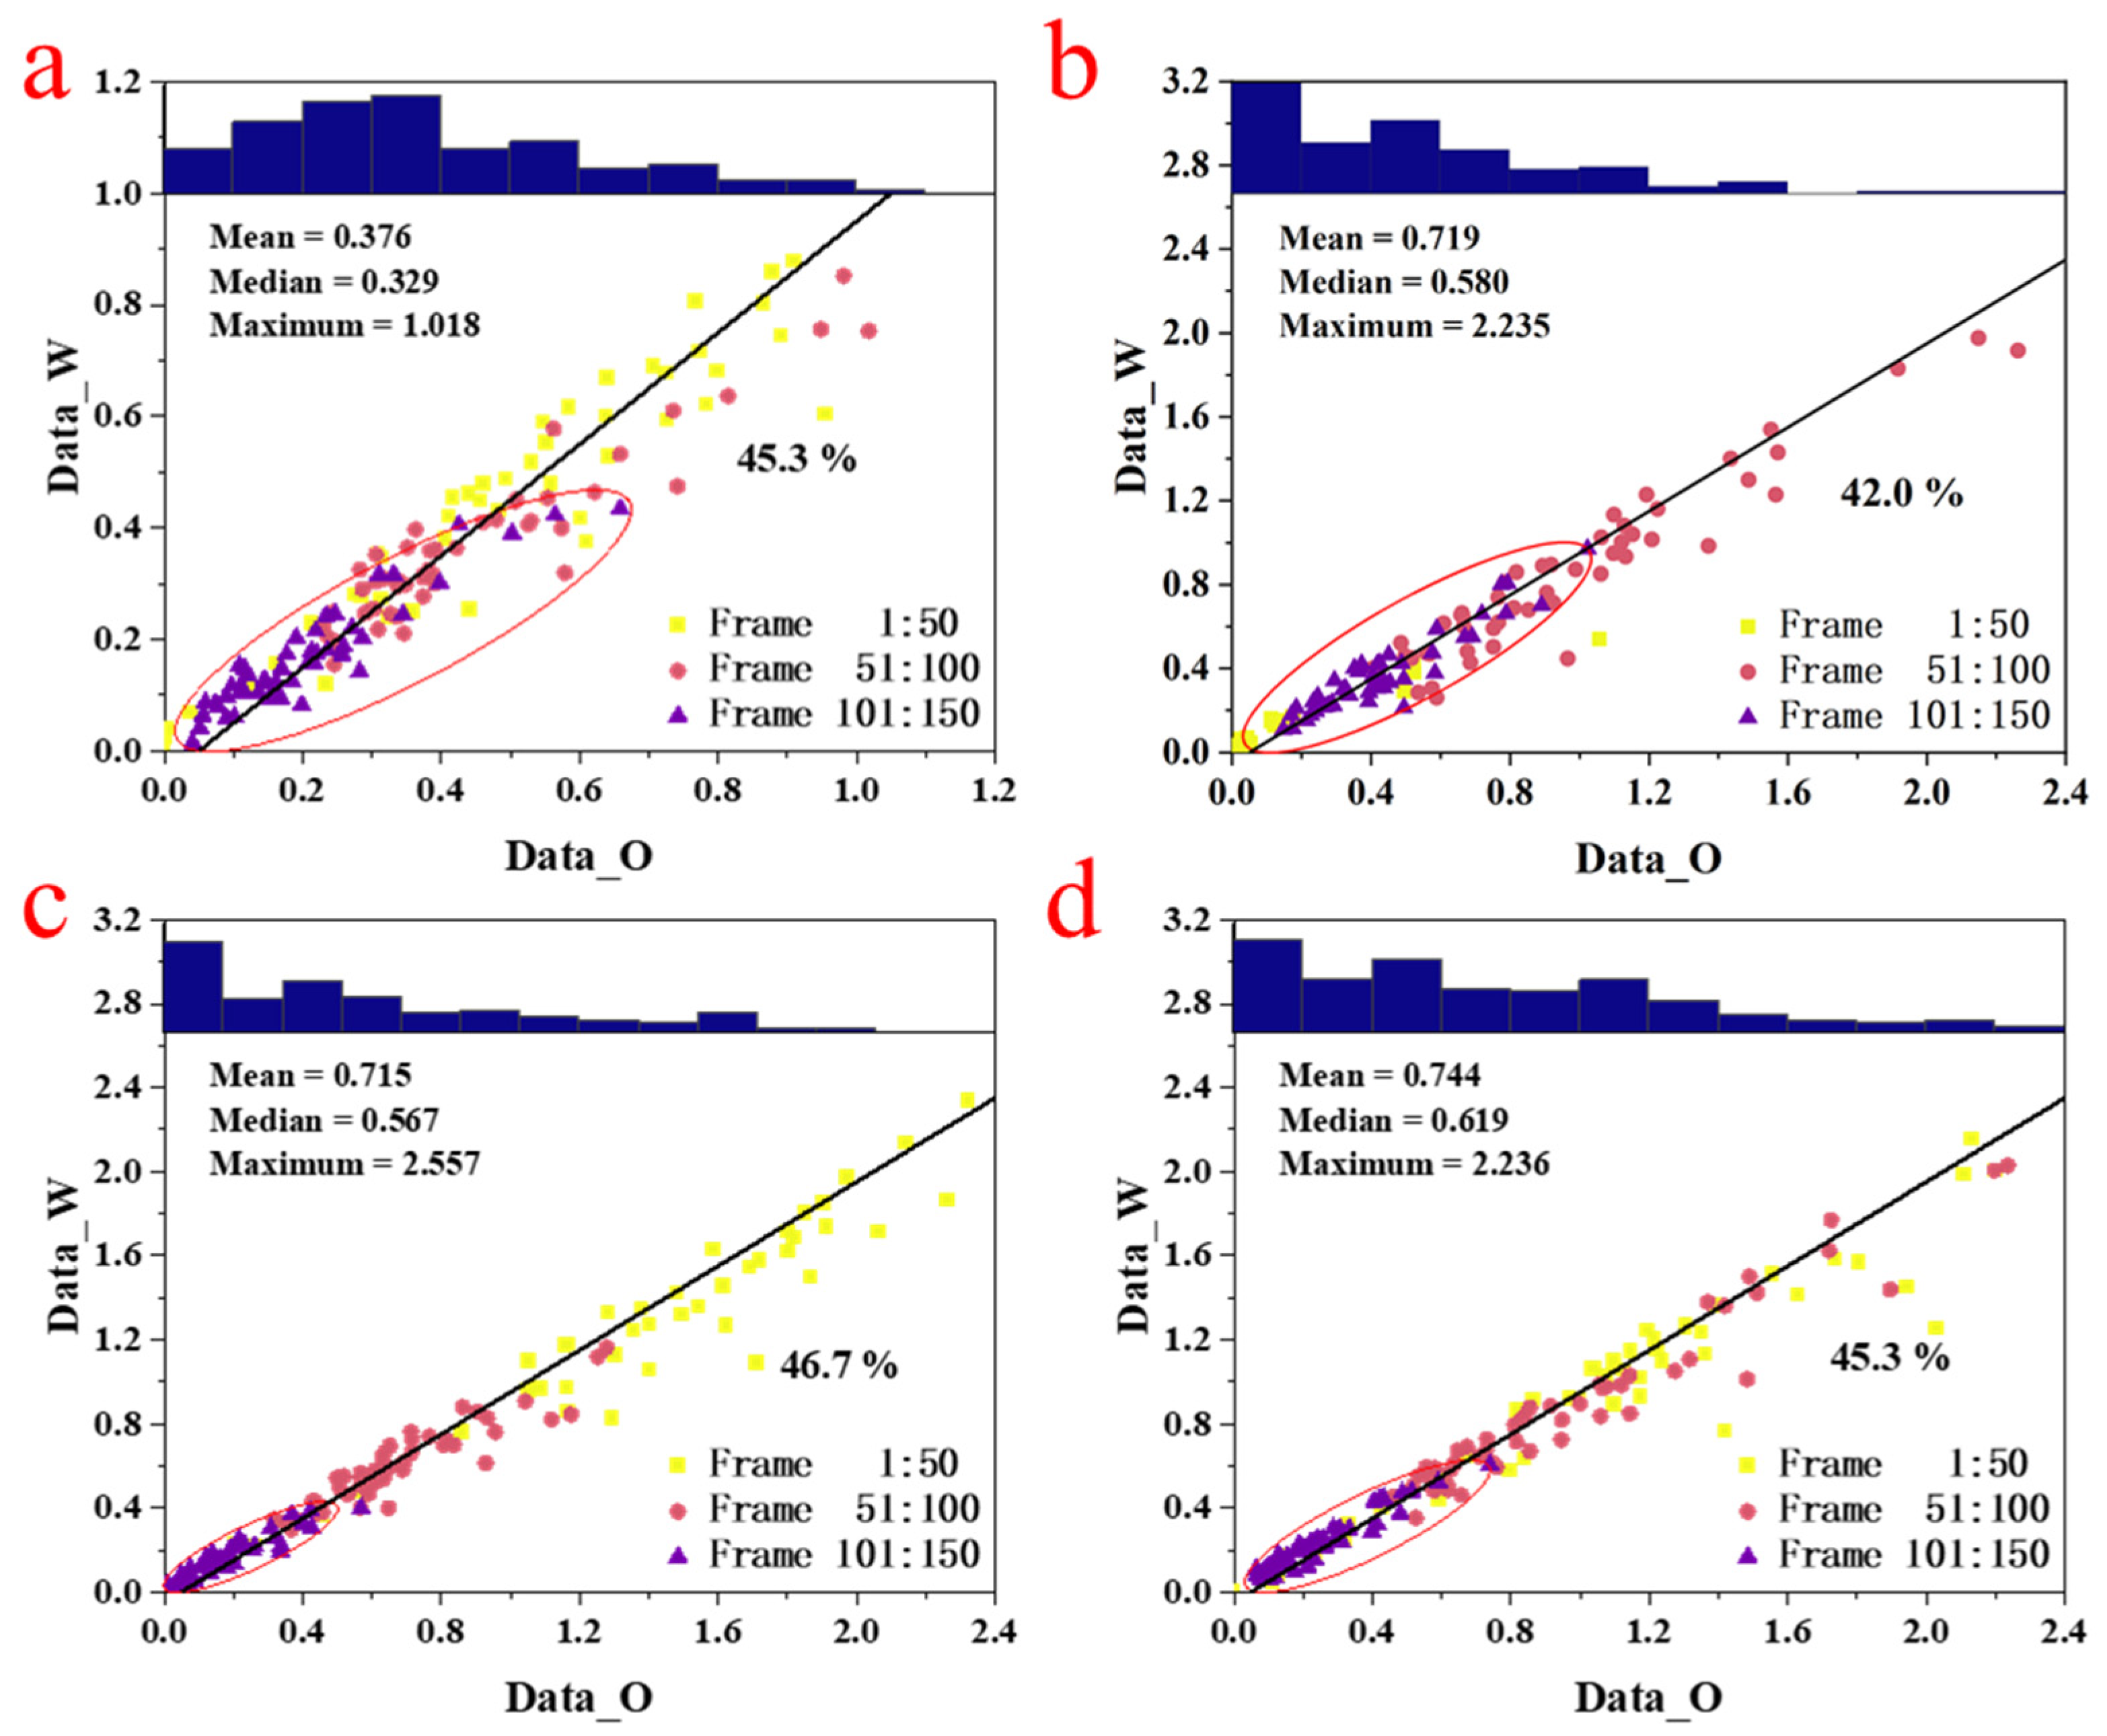
3.3. The Effect of Pulse Displacement on Displacement Energy Efficiency

In order to obtain more effective information, this paper carries on the statistics and the analysis of the experimental data through the recovery data in Figure 9 and Figure 10. However, we found that the color difference to obtain the recovery data had a large error, as the light was not uniform and the oil phase and the water phase color contrast was low, both having an impact on the statistical EOR data. To eliminate this effect. The oil phase and water phase in the region are analyzed by means of the frame difference method. The information is obtained by subtracting images from each other; by this method, we get the percentage of water and oil driven per unit time, which can represent the energy conversion efficiency of displacement fluids.

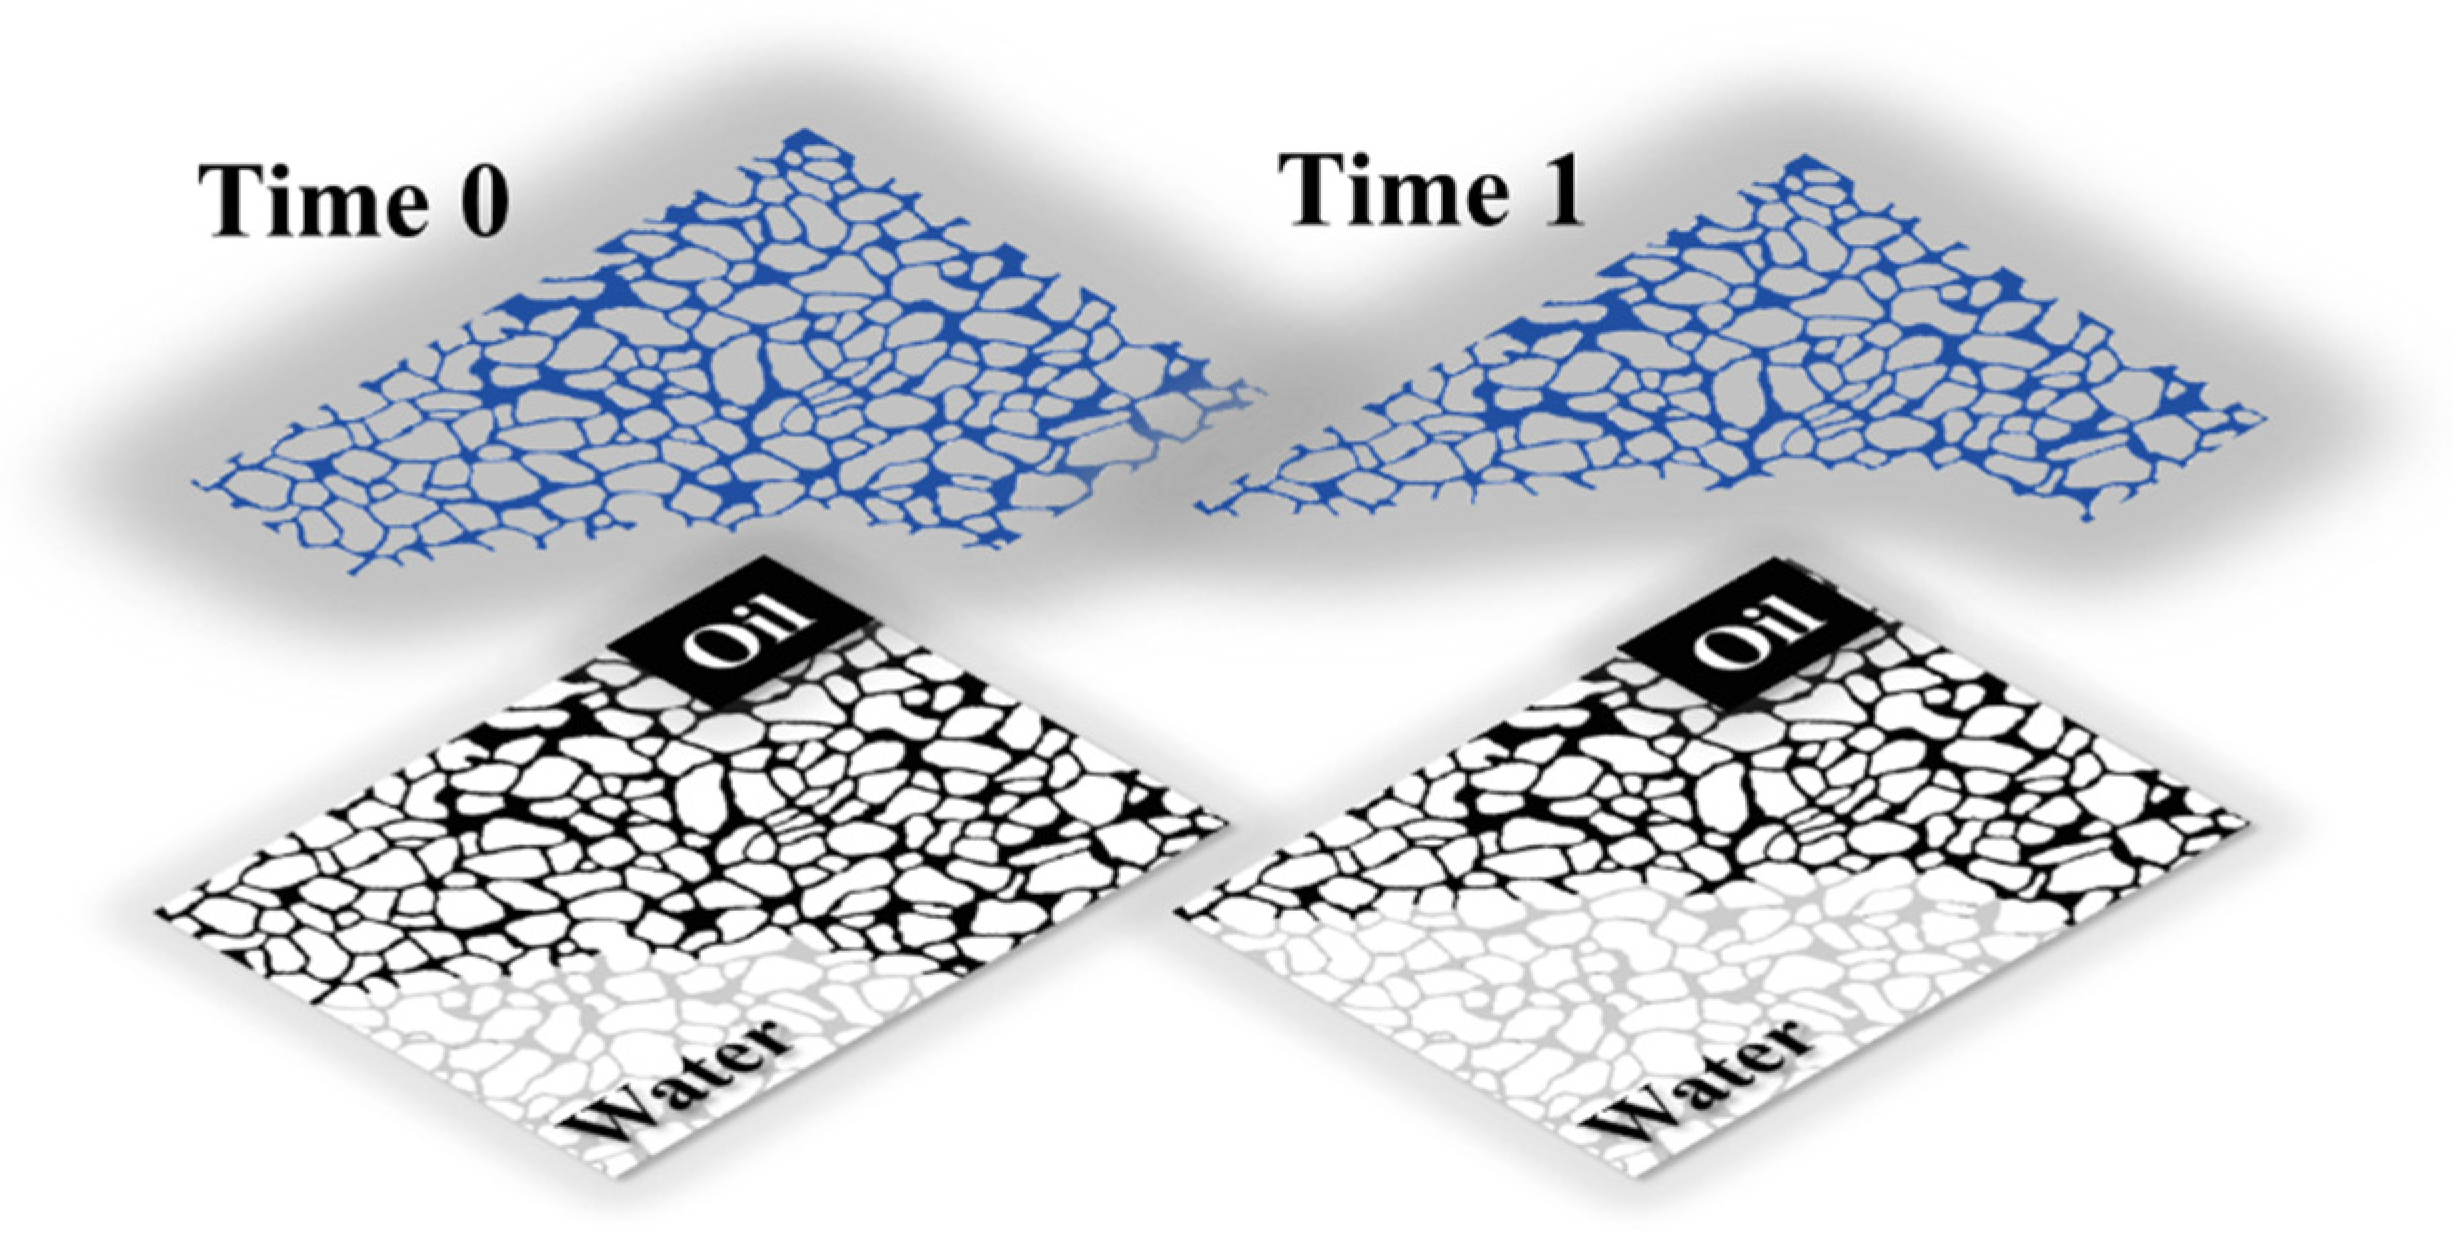
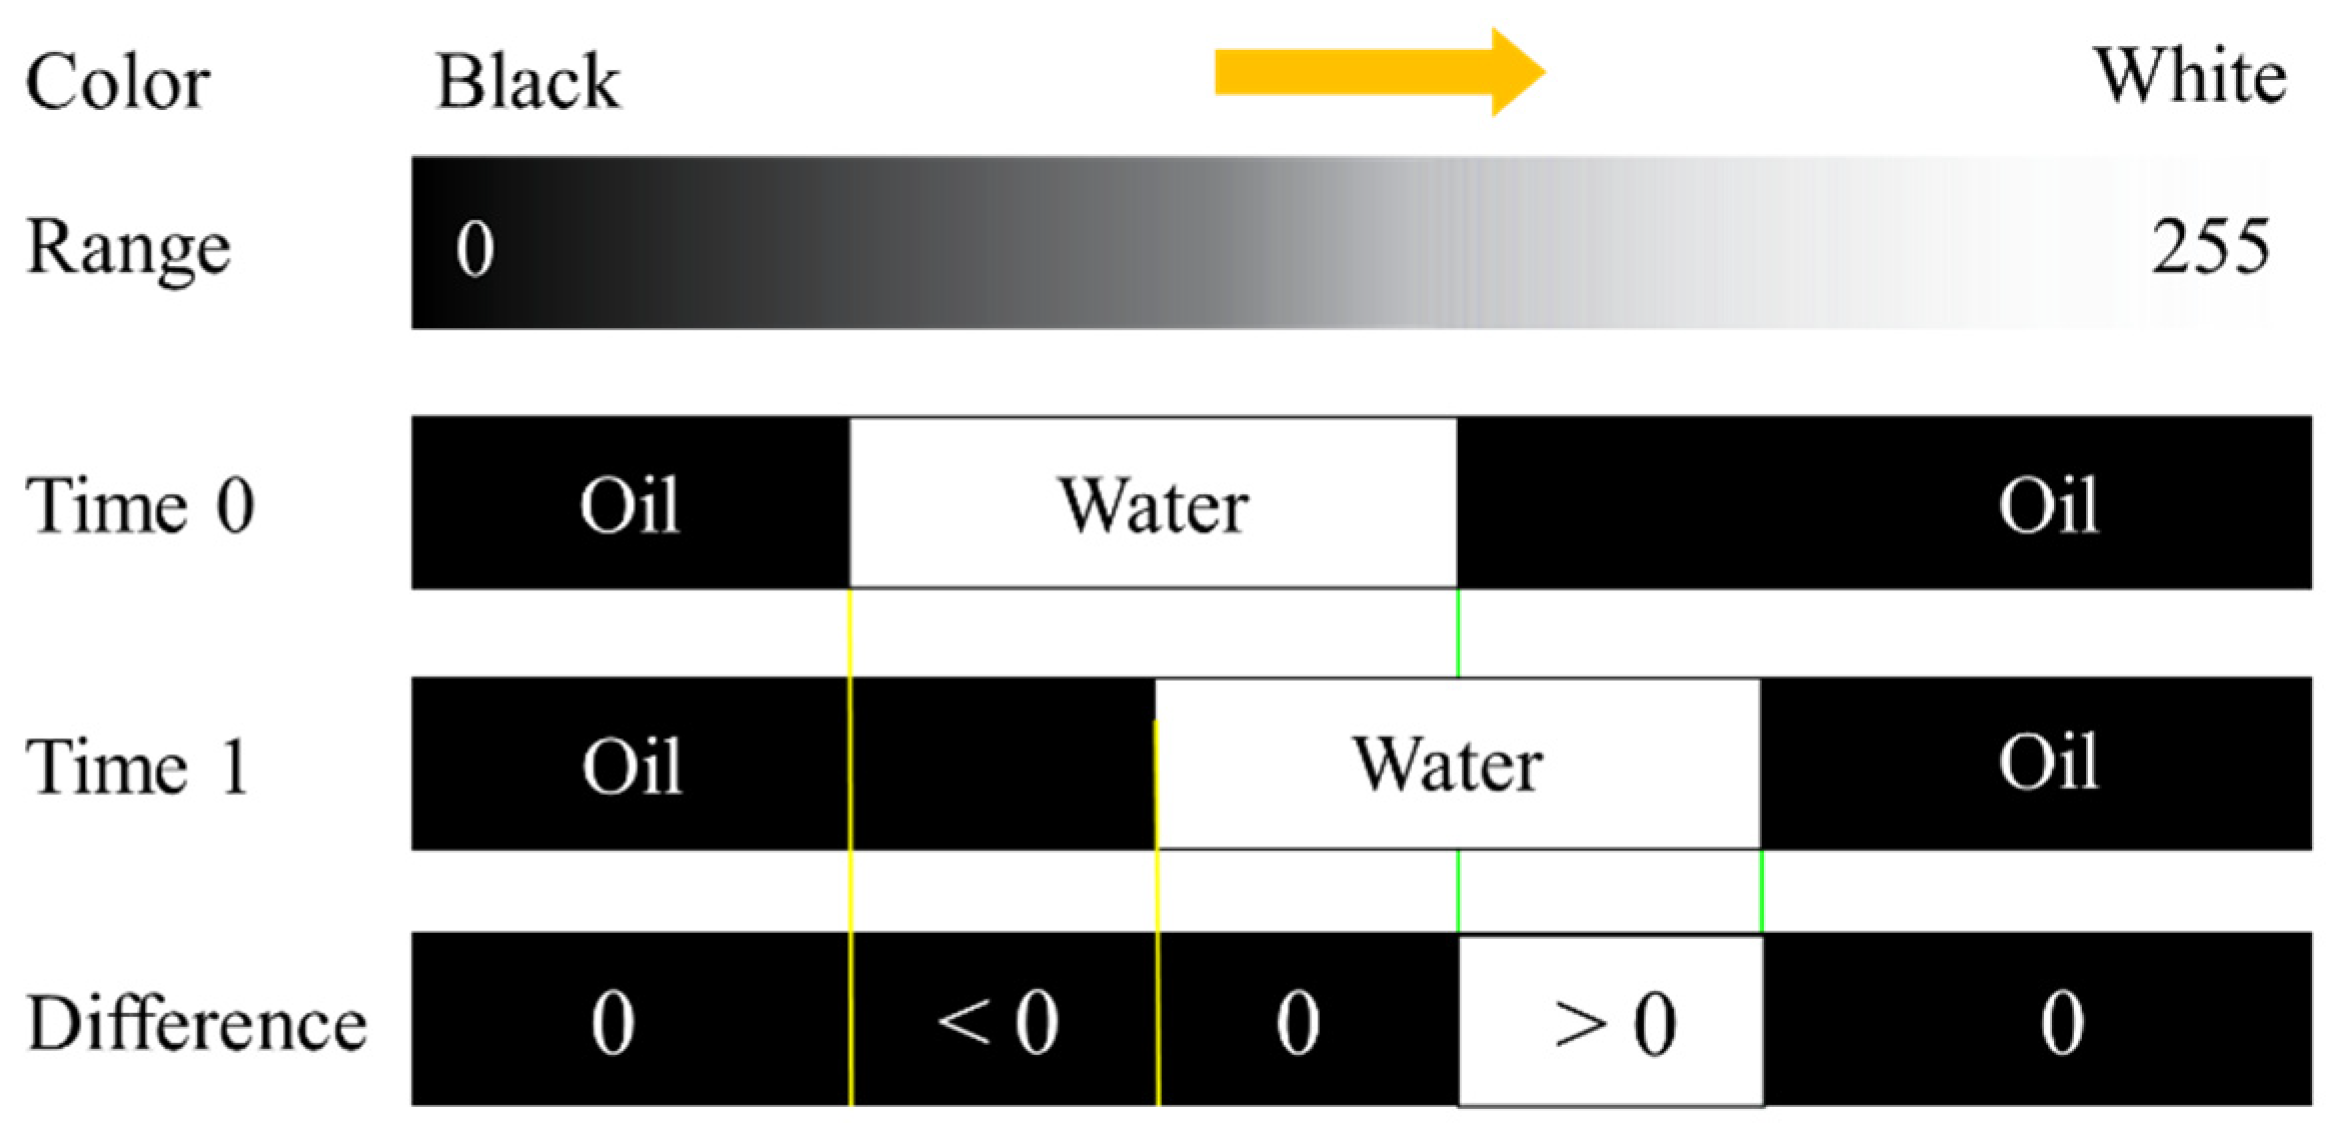
3.3.1. Interframe Difference Method with Images

We can get qualitative insights from the video data, such as A was bigger than B, and C was faster than D. But there was no way to quantify that difference and compare it across videos. In this paper, the interframe difference method was used to extract the inter-frame correlation and identify the moving objects and movement information [45,46]. The video of the displacement process is decomposed into pictures, and the interval between two images is same.
First, color photos of oil flooding process were converted into gray images, and each pixel of the gray was black to white from 0 to 255. The brighter color of the original image is, the larger the pixel value of the gray image is, and vice versa. The oil phase contains crude oil and is darker than the water phase. The value of the oil phase in the image is less than that of the water phase. Pixel coordinates represent the positions of microfluidic porous media channels. If the value of the pixel does not change, the liquid is either immobile or flowing in a continuous phase. It is possible to know whether the oil phase is replaced by the water at any throat or pore in the porous medium, or vice versa. If the difference is greater than 0, the image is represented in white after the difference, otherwise, it is represented in black. As shown in Figure 11, specifically, we make a difference between two pictures where they are adjacent in time. Subtract the former from the latter, such as the image at Time 1 minus the image at Time 0. If the difference is greater than 0, it indicates that the oil phase is replaced by water. Mark the area in white and use Data_O to represent the percentage of the area in the pore area. Conversely, subtract the latter from the former, for example, subtract the image at Time 0 from the image at Time 1, and the area of displacement of the water phase by oil can be obtained, which is represented by Data_W. Data_O and Data_W, which represent the percentage of oil and water replaced in pore volume at the same time, respectively.
There are obviously two possibilities. First, the value of Data_O and Data_W is equal (error ± 0.05%), indicating that the displaced oil phase flows in the form of a slug or droplet. Second, if Data_O is greater than Data_W, the oil phase continues to decrease. This stage usually occurs in the early of displacement and the oil phase is produced.

3.3.2. The Result of the Interframe Difference Method

Based on the above analysis, we focused on cases with an amplitude of 0.01 mL/min to discuss the displacement energy transfer efficiency. Because the phenomenon observed in these experimental cases is more obvious, the effect is more prominent. In Figure 12, the statistical results of the flow state at various times at 0 Hz, 1 Hz, 2 Hz, and 4 Hz are given. In this figure, Data_O represents the percentage of oil phase displaced and Data_W represents the water phase. It is well known that the oil phase decreases throughout development. The value of Data_O indicates the ability of the oil phase driven in the development. The larger the value is, the better displacement effect can be obtained by injecting the same volume of fluids. Because of the slippage in the process of water flooding, it is challenging to ensure the complete transfer of flow energy from water to oil.
The duration time of the 4 cases was about 200 frames, of which the oil phase flow was mainly in the first 150 frames. As shown in Figure 12, the oil phase was displaced from the micromodel for 42.0–46.7% of the time in all four cases, mainly during the first 150 frames, which was similar across all cases. In the case of 0 Hz, the maximum percentage of displacement per unit of time was the smallest, accounting for 1.018%, and the average is 0.376%, the median is 0.329%. The case of 0 Hz was much lower than the other in the value of displacement efficiency. With the effect of pulse flooding, the maximum displacement efficiency was in the range of 2.235–2.557%, with a mean of 0.715–0.744% and a median of 0.567–0.619%. In Figure 12, we circle the data of frames 101 to 150. When Data_O and Data_W are equal, the flow of oil is only in the model, which may be the swing of residual oil droplets or the flow of slug in pores. When Data_O is greater than Data_W, indicating crude oil is driven out. Taking into account the experimental error, we take y = x − 0.05 as the boundary of the displacement state. It can be found that the data of pulse flooding cases are distributed along y = x − 0.05, which shows that the oil phase flow is in the pore interior and rarely displaced out of the porous medium. The ellipse of 0 Hz case tilts to the right, indicating that some oil is still swept out at this stage. These experiments are close to each other in ultimate recovery. It shows that the displacement efficiency in the first two stages is low, and the displacement energy dissipation is large in 0 Hz case, and after pulse flooding, the utilization efficiency of water is improved.

4. Conclusions

We creatively used microfluidic experiments to study pulse flooding. The distribution and influence factors of residual oil in different pores under pulse conditions are obtained. It is obvious that pulse flooding is effective in enhancing oil recovery. In the same pore, after pulse flooding, the residual oil is obviously reduced, and in the process of displacement, the same displacement energy can make more oil to be used, which is what we like to find in the oil exploitation. The main conclusions are as follows:
(1) The effect of pulse flooding is affected by the natural frequency of porous media, which is similar to resonance damping and resonance effect. In this study, the displacement effect is worse at 3 Hz frequency but better at other pulse frequencies, which can get higher recovery at the same displacement time.
(2) Pulse displacement has a good effect on the utilization of cluster and film residual oil. The film-like residual oil in the narrow and long pores can be found to be thinner and less covered by pulse flooding. The utilization of residual oil is mainly related to the frequency and amplitude of the displacement change of the pulse, and the effect of amplitude is more favorable to the utilization of residual oil.
(3) In the early stage of oil displacement, the increase of recovery ratio is not obvious, and pulse operation can be carried out after the water cut increases.
(4) The effect of the pulse is related to the location of pores, and it becomes weaker near the boundary of the seepage field.
(5) Pulse flooding makes the energy transfer efficiency of displacement fluid higher. When the same volume of displacement fluid is injected, the volume of oil utilization is higher. In this study, the energy transfer efficiency is the same under the same displacement frequency amplitude, which is about two times as the pulseless case.

Author Contributions

Conceptualization, Y.T. and T.W.; methodology, S.T. and Y.Z.; investigation, C.Y.; writing—original draft preparation, F.W.; writing—review and editing, C.H. All authors have read and agreed to the published version of the manuscript.

Funding

This work was supported by the National Key Research and Development Program of China (2018YFA0702400).

Data Availability Statement

The datasets used and/or analyzed during the current study are available from the corresponding author upon reasonable request.

Conflicts of Interest

The authors declare no conflict of interest.

References

  1. Xu, Z.-X.; Li, S.-Y.; Li, B.-F.; Chen, D.-Q.; Liu, Z.-Y.; Li, Z.-M. A Review of Development Methods and EOR Technologies for Carbonate Reservoirs. Pet. Sci. 2020, 17, 990–1013. [Google Scholar] [CrossRef]
  2. Manrique, E.; Thomas, C.; Ravikiran, R.; Izadi, M.; Lantz, M.; Romero, J.; Alvarado, V. EOR: Current Status and Opportunities. In Proceedings of the SPE Improved Oil Recovery Symposium; OnePetro: Tulsa, OK, USA, 2010. [Google Scholar]
  3. Kazemzadeh, Y.; Shojaei, S.; Riazi, M.; Sharifi, M. Review on Application of Nanoparticles for EOR Purposes: A Critical Review of the Opportunities and Challenges. Chin. J. Chem. Eng. 2019, 27, 237–246. [Google Scholar] [CrossRef]
  4. Ettehadtavakkol, A.; Lake, L.W.; Bryant, S.L. CO2-EOR and Storage Design Optimization. Int. J. Greenh. Gas Control 2014, 25, 79–92. [Google Scholar] [CrossRef]
  5. Al Adasani, A.; Bai, B. Analysis of EOR Projects and Updated Screening Criteria. J. Pet. Sci. Eng. 2011, 79, 10–24. [Google Scholar] [CrossRef]
  6. Mokheimer, E.; Hamdy, M.; Abubakar, Z.; Shakeel, M.R.; Habib, M.A.; Mahmoud, M. A Comprehensive Review of Thermal Enhanced Oil Recovery: Techniques Evaluation. J. Energy Resour. Technol. 2019, 141, 030801. [Google Scholar] [CrossRef]
  7. Clark, H.P.; Ascanio, F.A.; van Kruijsdijk, C.; Chavarria, J.L.; Zatka, M.J.; Williams, W.; Yahyai, A.; Shaw, J.; Bedry, M. Method to Improve Thermal EOR Performance Using Intelligent Well Technology: Orion SAGD Field Trial. In Proceedings of the Canadian Unconventional Resources and International Petroleum Conference; OnePetro: Calgary, AB, Canada, 2010. [Google Scholar]
  8. Delamaide, E.; Tabary, R.; Rousseau, D. Chemical EOR in Low Permeability Reservoirs. In Proceedings of the SPE EOR Conference at Oil and Gas West Asia; OnePetro: Muscat, Oman, 2014. [Google Scholar]
  9. Delamaide, E.; Bazin, B.; Rousseau, D.; Degre, G. Chemical EOR for Heavy Oil: The Canadian Experience. In Proceedings of the SPE EOR Conference at Oil and Gas West Asia; OnePetro: Muscat, Oman, 2014. [Google Scholar]
  10. Pope, G.A. Overview of Chemical EOR. In Casper EOR Workshop; The University of Texas at Austin: Austin, TX, USA, 2007. [Google Scholar]
  11. Khormali, A.; Koochi, M.R.; Varfolomeev, M.A.; Ahmadi, S. Experimental Study of the Low Salinity Water Injection Process in the Presence of Scale Inhibitor and Various Nanoparticles. J. Pet. Explor. Prod. Technol. 2023, 13, 903–916. [Google Scholar] [CrossRef]
  12. Lazar, I.; Petrisor, I.G.; Yen, T.F. Microbial Enhanced Oil Recovery (MEOR). Pet. Sci. Technol. 2007, 25, 1353–1366. [Google Scholar] [CrossRef]
  13. Sen, R. Biotechnology in Petroleum Recovery: The Microbial EOR. Prog. Energy Combust. Sci. 2008, 34, 714–724. [Google Scholar] [CrossRef]
  14. Yu, W.; Lashgari, H.; Sepehrnoori, K. Simulation Study of CO2 Huff-n-Puff Process in Bakken Tight Oil Reservoirs. In Proceedings of the SPE Western North American and Rocky Mountain Joint Meeting; OnePetro: Denver, CO, USA, 2014. [Google Scholar]
  15. Pu, W.; Wei, B.; Jin, F.; Li, Y.; Jia, H.; Liu, P.; Tang, Z. Experimental Investigation of CO2 Huff-n-Puff Process for Enhancing Oil Recovery in Tight Reservoirs. Chem. Eng. Res. Des. 2016, 111, 269–276. [Google Scholar] [CrossRef]
  16. Surguchev, L.; Koundin, A.; Melberg, O.; Rolfsvåg, T.A.; Menard, W.P. Cyclic Water Injection: Improved Oil Recovery at Zero Cost. Pet. Geosci. 2002, 8, 89–95. [Google Scholar] [CrossRef]
  17. Stirpe, M.T.; Guzman, J.; Manrique, E.; Alvarado, V. Cyclic Water Injection Simulations for Evaluations of Its Potential in Lagocinco Field. In Proceedings of the SPE/DOE Symposium on Improved Oil Recovery; OnePetro: Tulsa, OK, USA, 2004. [Google Scholar]
  18. Mattax, C.C.; Kyte, J.R. Imbibition Oil Recovery from Fractured, Water-Drive Reservoir. Soc. Pet. Eng. J. 1962, 2, 177–184. [Google Scholar] [CrossRef]
  19. Pershin, I.M.; Papush, E.G.; Malkov, A.V.; Kukharova, T.V.; Spivak, A.O. Operational Control of Underground Water Exploitation Regimes. In Proceedings of the 2019 III International Conference on Control in Technical Systems (CTS), St. Petersburg, Russia, 30 October–1 November 2019; pp. 77–80. [Google Scholar]
  20. Zhang, Z.; Azad, M.S.; Trivedi, J.J. IFT or Wettability Alteration: What Is More Important for Oil Recovery in Oil-Wet Formation? Fuel 2021, 291, 119986. [Google Scholar] [CrossRef]
  21. Yan, L.; Chang, Y.; Hassanizadeh, S.M.; Xiao, S.; Raoof, A.; Berg, C.F.; He, J. A Quantitative Study of Salinity Effect on Water Diffusion in N-Alkane Phases: From Pore-Scale Experiments to Molecular Dynamic Simulation. Fuel 2022, 324, 124716. [Google Scholar] [CrossRef]
  22. Wang, X.; Liu, W.; Shi, L.; Zou, Z.; Ye, Z.; Wang, H.; Han, L. A Comprehensive Insight on the Impact of Individual Ions on Engineered Waterflood: With Already Strongly Water-Wet Sandstone. J. Pet. Sci. Eng. 2021, 207, 109153. [Google Scholar] [CrossRef]
  23. Mahmoodi, M.; James, L.A.; Johansen, T. Automated Advanced Image Processing for Micromodel Flow Experiments; an Application Using LabVIEW. J. Pet. Sci. Eng. 2018, 167, 829–843. [Google Scholar] [CrossRef]
  24. Zhang, X.; Su, Y.; Li, L.; Da, Q.; Hao, Y.; Wang, W.; Liu, J.; Gao, X.; Zhao, A.; Wang, K. Microscopic Remaining Oil Initiation Mechanism and Formation Damage of CO2 Injection after Waterflooding in Deep Reservoirs. Energy 2022, 248, 123649. [Google Scholar] [CrossRef]
  25. Sun, X.; Zhang, Y.; Gai, Z.; Zhao, H.; Chen, G.; Song, Z. Comprehensive Experimental Study of the Interfacial Stability of Foamy Oil and Identification of the Characteristic Responsible for Foamy Oil Formation. Fuel 2019, 238, 514–525. [Google Scholar] [CrossRef]
  26. Lv, Q.; Zheng, R.; Zhou, T.; Guo, X.; Wang, W.; Li, J.; Liu, Z. Visualization Study of CO2-EOR in Carbonate Reservoirs Using 2.5D Heterogeneous Micromodels for CCUS. Fuel 2022, 330, 125533. [Google Scholar] [CrossRef]
  27. Wang, L.; He, Y.; Wang, Q.; Liu, M.; Jin, X. Multiphase Flow Characteristics and EOR Mechanism of Immiscible CO2 Water-Alternating-Gas Injection after Continuous CO2 Injection: A Micro-Scale Visual Investigation. Fuel 2020, 282, 118689. [Google Scholar] [CrossRef]
  28. Bashir, A.; Haddad, A.S.; Sherratt, J.; Rafati, R. An Investigation of Viscous Oil Displacement in a Fractured Porous Medium Using Polymer-Enhanced Surfactant Alternating Foam Flooding. J. Pet. Sci. Eng. 2022, 212, 110280. [Google Scholar] [CrossRef]
  29. Guo, Y.; Liu, F.; Qiu, J.; Xu, Z.; Bao, B. Microscopic Transport and Phase Behaviors of CO2 Injection in Heterogeneous Formations Using Microfluidics. Energy 2022, 256, 124524. [Google Scholar] [CrossRef]
  30. Xu, K.; Liang, T.; Zhu, P.; Qi, P.; Lu, J.; Huh, C.; Balhoff, M. A 2.5-D Glass Micromodel for Investigation of Multi-Phase Flow in Porous Media. Lab. Chip 2017, 17, 640–646. [Google Scholar] [CrossRef] [PubMed]
  31. Karadimitriou, N.K.; Hassanizadeh, S.M. A Review of Micromodels and Their Use in Two-phase Flow Studies. Vadose Zone J. 2012, 11, vzj2011.0072. [Google Scholar] [CrossRef] [Green Version]
  32. Mejia, L.; Tagavifar, M.; Xu, K.; Mejia, M.; Du, Y.; Balhoff, M. Surfactant Flooding in Oil-Wet Micromodels with High Permeability Fractures. Fuel 2019, 241, 1117–1128. [Google Scholar] [CrossRef]
  33. Mejia, L.; Zhu, P.; Hyman, J.D.; Mohanty, K.K.; Balhoff, M.T. Coreflood on a Chip: Core-Scale Micromodels for Subsurface Applications. Fuel 2020, 281, 118716. [Google Scholar] [CrossRef]
  34. Hosseini, H.; Tsau, J.S.; Wasserbauer, J.; Aryana, S.A.; Ghahfarokhi, R.B. Synergistic Foam Stabilization and Transport Improvement in Simulated Fractures with Polyelectrolyte Complex Nanoparticles: Microscale Observation Using Laser Etched Glass Micromodels. Fuel 2021, 301, 121004. [Google Scholar] [CrossRef]
  35. Tian, J.; Kang, Y.; You, L.; Jia, N.; Xi, Z.; Luo, P. Investigation on Water Phase Trapping Mechanisms in Tight Gas Reservoirs: Pore-Scale Visualization Observation and Core-Scale Flooding Analysis. J. Pet. Sci. Eng. 2021, 198, 108185. [Google Scholar] [CrossRef]
  36. Mahmoudzadeh, A.; Fatemi, M.; Masihi, M. Microfluidics Experimental Investigation of the Mechanisms of Enhanced Oil Recovery by Low Salinity Water Flooding in Fractured Porous Media. Fuel 2022, 314, 123067. [Google Scholar] [CrossRef]
  37. Javadi, A.H.; Fatemi, M. Impact of Salinity on Fluid/Fluid and Rock/Fluid Interactions in Enhanced Oil Recovery by Hybrid Low Salinity Water and Surfactant Flooding from Fractured Porous Media. Fuel 2022, 329, 125426. [Google Scholar] [CrossRef]
  38. Mohammadian, E.; Junin, R.; Rahmani, O.; Idris, A.K. Effects of Sonication Radiation on Oil Recovery by Ultrasonic Waves Stimulated Water-Flooding. Ultrasonics 2013, 53, 607–614. [Google Scholar] [CrossRef]
  39. Gensheng, L.; Zhonghou, S.; Changshan, Z.; Debin, Z.; Hongbing, C. Investigation and Application of Self-Resonating Cavitating Water Jet in Petroleum Engineering. Pet. Sci. Technol. 2005, 23, 1–15. [Google Scholar] [CrossRef]
  40. Mehmani, A.; Kelly, S.; Torres-Verdín, C.; Balhoff, M. Residual Oil Saturation Following Gas Injection in Sandstones: Microfluidic Quantification of the Impact of Pore-Scale Surface Roughness. Fuel 2019, 251, 147–161. [Google Scholar] [CrossRef]
  41. Zhao, H.; Yang, H.; Kang, X.; Jiang, H.; Li, M.; Kang, W.; Sarsenbekuly, B. Study on the Types and Formation Mechanisms of Residual Oil after Two Surfactant Imbibition. J. Pet. Sci. Eng. 2020, 195, 107904. [Google Scholar] [CrossRef]
  42. Moebius, F.; Or, D. Inertial Forces Affect Fluid Front Displacement Dynamics in a Pore-Throat Network Model. Phys. Rev. E. 2014, 90, 23019. [Google Scholar] [CrossRef]
  43. Han, X.; Wang, L.; Xia, H.; Han, P.; Cao, R.; Liu, L. Mechanism Underlying Initiation of Migration of Film-like Residual Oil. J. Dispers. Sci. Technol. 2022, 43, 1927–1947. [Google Scholar] [CrossRef]
  44. Fan, J.; Liu, L.; Ni, S.; Zhao, J. Displacement Mechanisms of Residual Oil Film in 2D Microchannels. ACS Omega 2021, 6, 4155–4160. [Google Scholar] [CrossRef]
  45. Cheng, Y.H.; Wang, J. A Motion Image Detection Method Based on the Inter-Frame Difference Method. In Applied Mechanics and Materials; Trans Tech Publications: Beijing, China, 2013; Volume 490, pp. 1283–1286. [Google Scholar]
  46. Weng, M.; Huang, G.; Da, X. A New Interframe Difference Algorithm for Moving Target Detection. In Proceedings of the 2010 3rd International Congress on Image and Signal Processing, Yantai, China, 16–18 October 2010; Volume 1, pp. 285–289. [Google Scholar]
Figure 1. Micromodel setup.
Processes 11 00957 g001
Figure 2. Schematic of the experimental setup.
Processes 11 00957 g002
Figure 3. The representation of the recovery ration of the micromodel.
Processes 11 00957 g003
Figure 4. The fame interval of different cases.
Processes 11 00957 g004
Figure 5. The ultimate recovery ratio of different cases.
Processes 11 00957 g005
Figure 6. A photomask of micromodel with four blocks selected for analysis.
Processes 11 00957 g006
Figure 7. The oil/water distribution in Block 1 and 4 at 100th and 200th images ((a)—0 Hz; (b)—1 Hz; and 0.005 mL/min; (c)—1 Hz and 0.01 mL/min; (d)—2 Hz and 0.005 mL/min; (e)—2 Hz and 0.01 mL/min; (f)—3 Hz and 0.005 mL/min; (g)—3 Hz and 0.01 mL/min; (h)—2 Hz and 0.005 mL/min; (i)—2 Hz and 0.01 mL/min).
Processes 11 00957 g007
Figure 8. The oil/water distribution in Block 2 and 3 at 100th and 200th images ((a)—0 Hz, (b)—1 Hz and 0.005 mL/min, (c)—1 Hz and 0.01 mL/min, (d)—2 Hz and 0.005 mL/min, (e)—2 Hz and 0.01 mL/min, (f)—3 Hz and 0.005 mL/min, (g)—3 Hz and 0.01 mL/min, (h)—2 Hz and 0.005 mL/min, (i)—2 Hz and 0.01 mL/min).
Processes 11 00957 g008
Figure 9. The oil/water distribution images in Block 4 and recovery factor cluster plots when the amplitude is 0.01 mL/min.
Processes 11 00957 g009
Figure 10. The oil/water distribution images in Block 4 and recovery factor cluster plots when the amplitude is 0.005 mL/min.
Processes 11 00957 g010
Figure 11. Schematic diagram of interframe difference method.
Processes 11 00957 g011
Figure 12. The result of the interframe difference method with an amplitude of 0.01 mL/min cases, (a) is 0 Hz case, (b) is 1 Hz case, (c) is 2 Hz case, (d) is 4 Hz case.
Processes 11 00957 g012
Table 1. Application of microscopic model in EOR experiment.
MethodsHighlightsDisplacement
Fluids
DimensionTemperature and PressureFlow RateRef
Liquid
flooding
Wettability alterationSurfactant7 cm × 1 cm × 40 μmAmbient [20]
Salinity effectBrine20 mm × 10 mmAmbient0.05 mL/min[21]
Salinity effect
Heavy oil
Brine3 cm × 3 cm × 0.2 cmAmbient0.001 mL/min[22]
Image analysisCarbonated
water
200 mm × 50.7 mmambient [23]
Gas floodingCO2-EORCO26.234 mm × 8.492 mm115 °C and 55 MPa0.02 mL/min[24]
Foamy oilNatural gas, N2, CO24.9 cm × 4.9 cm54.2 °C and 6 MPa [25]
CO2-EOR
2.5D micromodels
CO2 65 °C and
atmospheric pressure
70, 80, 90, and 95 μL/h[26]
WAG injectionWater
CO2
40 mm × 40 mm,
pore diameter 9–181 μm
Ambient0.05, 0.1 mL/min[27]
Polymer floodingPolymer-enhanced foam flooding;Polymer8 cm × 10 cm × 0.4 cm;
spherical glass beads
(diameter: 0.5 mm, 2 mm)
25 °C and 50 kPa0.2 mL/min[28]
Huff-n-puffCO2-EORCO219 mm × 5 mm;
(100 μm in width and 100 μm in depth);
low-permeability region (48 μm in width and 100 μm in depth)
20 °C and
5.6 MPa
[29]
Table 2. The experimental scheme and results.
Case No.Displacement ParameterImage of the ProcessUltimate
Recovery Ratio
(%)
Flow Rate
(mL/min)
Frequency
(Hz)
Amplitude
(mL/min)
Start
Frame
End
Frame
Frame Interval
10.03009131222192.412
20.0310.0053333430194.518
30.0310.015426821495.023
40.0320.00525162036993.201
50.0320.013725221594.656
60.0330.00514647332790.654
70.0330.017024517589.389
80.0340.00522852930196.022
90.0340.0119636516994.812
Disclaimer/Publisher’s Note: The statements, opinions and data contained in all publications are solely those of the individual author(s) and contributor(s) and not of MDPI and/or the editor(s). MDPI and/or the editor(s) disclaim responsibility for any injury to people or property resulting from any ideas, methods, instructions or products referred to in the content.

