Article

Cluster Optimization for Integrated Energy Systems Considering Multi-Energy Sharing and Asymmetric Profit Allocation: A Case Study of China

1
Research Center of Civil, Hydraulic and Power Engineering of Tibet, Tibet Agriculture and Animal Husbandry University, Linzhi 860000, China
2
College of Water Conservancy and Civil Engineering, Tibet Agriculture and Animal Husbandry University, Linzhi 860000, China
3
Electric Power Research Institute of State Grid Tibet Electric Power Co., Ltd., Lhasa 850000, China
4
School of Electrical Engineering, Tibet Agriculture and Animal Husbandry University, Linzhi 860000, China
*
Author to whom correspondence should be addressed.
Processes 2023, 11(7), 2027; https://doi.org/10.3390/pr11072027
Submission received: 5 June 2023 / Revised: 30 June 2023 / Accepted: 5 July 2023 / Published: 6 July 2023
(This article belongs to the Special Issue Advances in Electrical Systems and Power Networks)

Abstract

:
This study proposes a novel integrated energy system (IES) cluster optimization structure that uses multi-energy sharing, multi-Nash games, and asymmetric profit allocation according to the energy supply demand and energy development planning for Tibet. First, it integrates clean energy units such as concentrated solar power, power to hydrogen to power, and vacuum pressure swing adsorption to build a novel IES including electricity, heat, and oxygen. Second, multiple novel IESs are combined to form an IES cluster and the IES cluster is divided into three stages of optimization: the first stage is to achieve optimal multi-energy sharing under cluster optimization, the second stage is to conduct multi-Nash games to achieve optimal sharing cost, and the third stage is to conduct asymmetric profit allocation. Finally, the case study is conducted and the results show that the multi-Nash games and asymmetric profit allocation can effectively improve the renewable energy consumption of the IES cluster, reduce the operation cost of the cluster, and reduce the cost of multi-energy sharing compared to only considering the cluster energy supply price as the sharing price, thereby improving the economy of multi-energy sharing.

1. Introduction

Tibet’s power grid has been deficient for some time due to the significant distance between its source and its load. The electricity surplus during the wet season and the electricity shortage during the dry season are substantial, and there are various problems with safe and stable operation, forcing Tibet to rely on an external transmission channel to receive electricity [1]. Although Tibet has proposed a development plan for urban electric power and oxygen supply as part of China’s Fourteenth Five-Year Plan [2,3,4,5], the growth of energy supply demand and oxygen supply equipment has intensified the imbalance of electricity supply and demand. The supply side structure—hydropower accounts for 60% and renewable energy (RE) accounts for 30%, while other energy sources account for 10%—is limited by a weak power grid and significant abandonment of RE, leading to a power shortage of 350,000–450,000 kW in the Tibetan region at the end of 2022. The existing dispatching methods are insufficient to meet the demand for energy supply, resulting in a power grid supply and demand imbalance. Other energy demands include heating, which mostly depends on natural gas, and oxygen supply, which relies on electricity. Energy utilization efficiency is low, and carbon emissions remain high. To overcome these problems, the concept of an integrated energy system (IES) is being introduced. As an energy system to promote sustainable energy development, an IES could effectively improve energy utilization efficiency while meeting diversified energy demands within the system. Compared with the existing energy framework in Tibet, the combination of source-network-load-storage modular interactions and integrated interactions in IESs has significantly altered the construction of energy systems and improved power grid resilience, and these benefits can be harnessed to meet the unique demand for an oxygen supply on the plateau.
However, REs such as photovoltaic (PV) and wind turbines (WT) are climate-sensitive, and their output is fluctuating, restricting energy development. A large number of adjustable hydropower (HP), concentrated solar power (CSP), and power to hydrogen to power (PHP) projects planned for construction in high altitude areas are highly flexible and responsive, reducing the negative impact of PV and WT output [6,7,8]. The power to hydrogen (P2H) equipment using proton exchange membrane (PEM) technology has a fast response speed. P2H combines hydrogen fuel cell (HFC) to form PHP, which serves as an energy hub to supply electricity, heat, and oxygen. CSP, as an electricity and heat auxiliary regulation object, is similar to traditional cogeneration of heat and power (CHP) in that both have the advantages of quick start–stop and fast power response. Moreover, CSP emits no carbon emissions [9,10], and HP has a large installed capacity, and serves as one of the adjustable sources of electric energy balance. Furthermore, traditional power to gas (P2G) includes two processes—P2H and methanation—but the carbon emissions from natural gas use should be considered [11]. This study proposes the utilization of oxygen and hydrogen in PHP products that are tailored to high altitude area’s energy development plan and local conditions. Related studies show the feasibility of VPSA in the plateau area for oxygen supply and higher economic benefits [12,13]. Moreover, electrolytic oxygen production can be used for civil oxygen supply [14], indicating that P2H-produced oxygen can be used for oxygen supply in plateau areas. The hydrogen generated by electrolysis can be used for hydrogen energy vehicles (HEVs), which include three vehicle types used in urban areas: buses, cabs, and official vehicles. In addition, China’s first renewable energy + PEM hydrogen production + hydrogenation integrated station has now been successfully trialed [15]. Furthermore, an IES must allow for a two-way apportionment of carbon emissions when purchasing electricity from the grid and hydrogen from the hydrogen network [16]. Based on the above analysis, integrating clean energy units such as CSP, PHP, and VPSA into an efficient IES is crucial for meeting high altitude area’s energy supply demand and emission peak and carbon neutrality targets.
A cooperative game mode and the alternating direction method of multipliers (ADMM) are generally used when investigating how to reduce the overall cost of an energy-sharing dispatch model [17,18,19]. For example, Ma et al. [20] concentrated on the cooperative operation of a wind–solar–hydrogen multi-agent energy system and then proposed a cooperative operational model for the energy system based on the Nash bargaining theory. Chen et al. [21] also proposed a cooperative game model among multi-microgrids through interactive power and energy storage. Moreover, Zhong et al. [22] discussed how a microgrid’s extra energy and carbon emission quota could be shared with other microgrids. The energy sharing and carbon trading problems for multi-energy microgrids were formulated using the Nash game theory. However, the energy-sharing cooperation game studied mainly focused on electric energy.
Related studies show that game theory has been widely applied to energy sharing problems [23,24,25,26]. According to [27], bargaining game models overcome the flaws of cooperative games in global energy optimization. Siqin et al. [28] considered power sharing and profit distribution in the multi-community IES and achieved a fair allocation of excess returns. Cui et al. [29] proposed an asymmetric benefits sharing model based on prosumers and energy storage providers. However, in cooperative game models, it is unfair for energy systems to enjoy the same cost reduction benefits, as each contributes differently to cost minimization. Therefore, fair cooperation between energy systems is expected, with bargaining power directly proportional to their contributions.
Based on the above analysis, domestic and foreign scholars have conducted research on energy systems in terms of system mode, dispatching model, and profit allocation. However, it should be noted that the extant literature has some gaps. First, while most studies choose CHP as the main component of IES, CHP’s power output produces carbon emissions. Reducing carbon emissions while meeting the demand for electricity, heat, and oxygen supply is a problem that must be solved under high altitude areas. Therefore, it is worth discussing how to build a new comprehensive energy system and increase clean energy power generation to achieve low-carbon, economical, and efficient energy utilization. Second, dividing IES clusters and considering multi-energy sharing improves the cluster’s economy while reducing the capacity purchased and sold from the power grid. With each IES as the main body, the cost of multi-energy sharing is reduced through multi-Nash games. Third, IES clusters lower the price of multi-energy sharing through multi-Nash games, generating additional profits that are then justly allocated using asymmetric profit allocation. This study’s main contributions are as follows:
(1)
In line with Tibet’s energy development goals, PHP and CSP are integrated into a traditional IES to build a new IES that integrates electricity, heat, and oxygen supply. Compared to traditional IESs, the integration of oxygen supply into an IES is innovative, and the carbon emissions are extremely low.
(2)
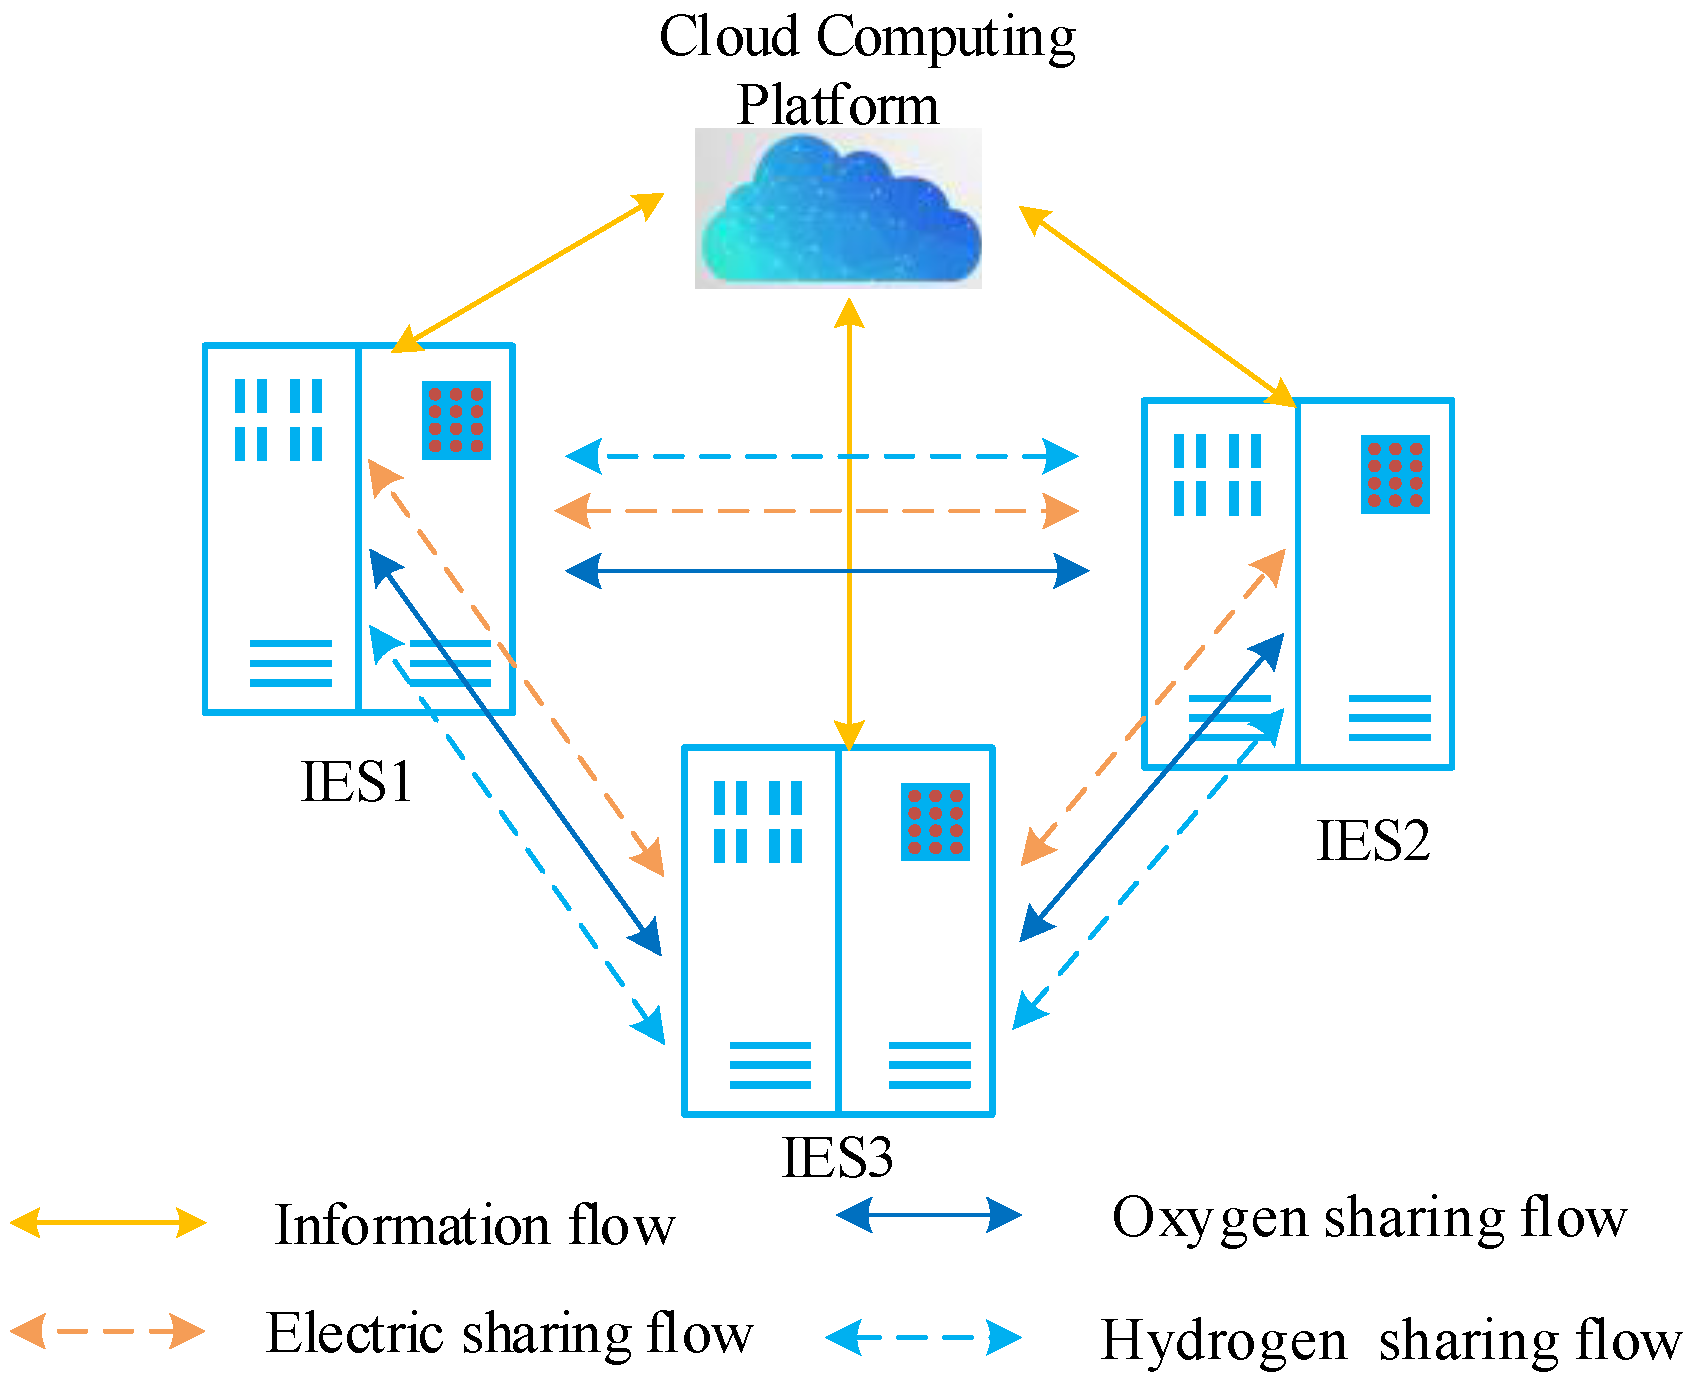
Through multi-energy sharing, energy complementation between each IES is promoted. The optimal energy sharing amount under the minimum operating cost is determined by IES cluster optimization, which conducts multi-Nash games on the sharing prices of electricity, oxygen, and hydrogen, with each IES as the main body and the cluster’s minimum sharing cost as the goal.
(3)
For the profit allocation of multi-energy sharing, a novel asymmetric profit allocation model is proposed for each IES to share the benefits of energy sharing based on their contributions. Profits are justly allocated through asymmetric profit allocation.
This paper’s main structure is as follows: Section 2 presents the multi-Nash game theory model; Section 3 discusses the new IES model and asymmetric profit allocation; Section 4 simulates a numerical example; and Section 5 delivers the conclusions.

2. The Nash Game Model

In the IES cluster, different IESs pertain to varied interest subjects. According to the energy sharing among the subjects, the clusters reach agreements with each other through bargaining and negotiation to enhance the economic benefits of the IES cluster as a whole and motivate each subject to cooperate. As independent subjects, each subject reaches a consensus through negotiation and seeks a balanced strategy to maximize the benefits of each participant. Determining a fair and reasonable sharing price is the key objective based on the premise that the cluster has determined the optimal sharing amount.

2.1. The Multi-Nash Game Model

This study seeks the equilibrium solution of the game problem using the multi-Nash game theory, such as Equation (1)
max n N U n U n 0 , n N U n U n 0
where U n is the benefit of participating in cooperative negotiation, U n 0 is the benefit before cooperative negotiation, N is the number of subjects.
The multi-Nash game model is equivalently converted. See [30] for more details. Under the condition of the existing optimal sharing amount, the lowest sharing and cooperation electricity price is found to achieve the maximum sharing benefit and further improve the alliance benefit based on the optimal operation cost. The logarithm of the maximum benefit sub-model from Equation (2) is converted to Equation (3) to find the minimum value sub-problem:
max   f r + C t r a d e . e i F r . e i f r + C t r a d e . h i F r . h i f r + C t r a d e . o i F r . o i s . t . C t r a d e . e i = t T i K P r i . e . i t P e . t r . i t , t T C t r a d e . h i = t T i K P r i . h . i t P h . t r . i t , t T C t r a d e . o i = t T i K P r i . o . i t P o . t r . i t , t T
min   - ln F r . e i f r i + C t r a d e . e i ln F r . h i f r i + C t r a d e . h i ln F r . o i f r i + C t r a d e . o i
where i = 1 , 2 , , K is the scheduling period, The operation time of the energy cooperation system is set at t = 1 h, which can be adjusted according to demand. P r i . e . i t is the sharing electricity price, P r i . h . i t is the sharing hydrogen price, P r i . o . i t is the sharing oxygen price, P e . t r . i t is the sharing electricity quantity, P h . t r . i t is the sharing hydrogen quantity, P o . t r . i t is the sharing oxygen quantity, C t r a d e . e i , C t r a d e . h i and C t r a d e . o i are the sharing benefits of electricity, hydrogen, and oxygen, respectively, F r . e i , F r . h i and F r . o i are the costs before the negotiation of electricity, hydrogen, and oxygen cooperation, respectively, and f r is the operating cost.
The subjects’ consensus must satisfy the condition that the energy-sharing price between them is the same, and thus auxiliary variables must be introduced to decouple them, as shown in Equation (4):
P r i . e . i t P r i . e . 0 . i t = 0 P r i . h . i t P r i . h . 0 . i t = 0 P r i . o . i t P r i . o . 0 . i t = 0
where P r i . e . i t and P r i . e . 0 . i t are the quotations of both parties in the electricity sharing negotiation between the i th sharing subject, P r i . h . i t and P r i . h . 0 . i t are the quotations of hydrogen sharing negotiators between the i th sharing subject, P r i . o . i t and P r i . o . 0 . i t are the quotations of both parties in the oxygen sharing negotiation between the i th sharing subject, and the cluster’s IES as the sharing subject.
Considering the complexity of the multi-Nash game model between clusters with multiple energy sharing, the sharing object is decomposed according to the principle of ADMM.
min i K t T f i x i s . t . h i ( x i ) = 0 g i ( x i ) 0 X i = X 0 i X i = X 0 i i K
where f i x i is the IES cluster’s decomposition sub-problem; h i ( x i ) is the equality equation constraint contained in the IES cluster; g i ( x i ) is the inequality equation constraint contained in the IES cluster, X i is the multi-energy sharing coupling variable; and X i and X 0 i are the shared IESs’ set of shared coupling variables, which is X i = P r i . e . i t , P r i . h . i t , P r i . o . i t .
Lagrangian multipliers and penalty factors are introduced to obtain the form of augmented Lagrangian function, as follows:
                         min   - ln F r . e i f r + C t r a d e . e i + ln F r . h i f r + C t r a d e . h i + ln F r . o i f r + C t r a d e . o i + ρ 1 2 t T i K P r i . e . i t P r i . e . 0 . i t 2 2 + t T i K λ i . e k P r i . e . i t P r i . e . 0 . i t + ρ 2 2 t T i K P r i . h . i t P r i . h . 0 . i t 2 2 + t T i K λ i . h k P r i . h . i t P r i . h . 0 . i t + ρ 3 2 t T i K P r i . o . i t P r i . o . 0 . i t 2 2 + t T i K λ i . o k P r i . o . i t P r i . o . 0 . i t s . t . λ i . e k = λ i . e k 1 + ρ 1 P r i . e i , k P r i . e 0 . i , k λ i . h k = λ i . h k 1 + ρ 2 P r i . h i , k P r i . h 0 . i , k λ i . o k = λ i . o k 1 + ρ 3 P r i . o i , k P r i . o 0 . i , k
where ρ 1 , ρ 2 and ρ 3 are the penalty factors, taking 1; λ i . e k , λ i . h k and λ i . o k are the Lagrange multipliers of generation k th; P r i . e i , k and P r i . e 0 . i , k are the electricity prices between generation k th sharing agents; P r i . h i , T and P r i . h 0 . i , T are the hydrogen prices between generation k th sharing agents; P r i . o i , k and P r i . o 0 . i , k are the oxygen prices between generation k th sharing agents, (for specific steps refer to [20]), t T , i K .
According to the principle of ADMM, Equation (6) is decomposed into three submodels:
(1)
Electricity sharing distribution optimization submodel:
min   - ln F r . e i f r + C t r a d e . e i + ρ 1 2 t T i K P r i . e . i t P r i . e . 0 . i t 2 2 + t T i K λ i . e k P r i . e . i t P r i . e . 0 . i t
μ P r i . b u y P r i . e . i t P r i . b u y μ P r i . b u y P r i . e . 0 . i t P r i . b u y
f r + P r i . g r i d . m i d P e . t r . i t = F r . e i f r + C t r a d e . h i F r . e i P e . t r . min t P e . t r . i t P e . t r . max t
where P r i . b u y is the electric purchase price of grid power (GP), P e . t r . min t and P e . t r . max t are the limits of electric energy sharing. The sub-models of oxygen and hydrogen sharing and distribution optimization are similar to Equations (7)–(9) and will not be further discussed, t T , i K .

2.2. IES Cluster Cooperation Game Framework

For multiple regional IESs, RE and loads have different characteristics. IES clusters are formed by interconnecting adjacent IESs, and coordinated operation is achieved through large-scale energy mutual assistance and complementary advantages. This method can improve the economy of each IES, thus generating higher cost advantages. The IES multi-energy sharing architecture is depicted in Figure 1, where interactive cluster information flows through a CCP and multi-energy sharing comprises electricity, oxygen, and hydrogen sharing. Heat sharing within IES clusters is not taken into account due to substantial pipe heat losses. The IES multi-energy sharing flow is based on conventional electric sharing, as well as oxygen and hydrogen, which are energy sources with extremely low transmission losses, are shared. This can partially replace the function of energy storage and achieve multi-energy sharing among IES clusters, substantially increasing the overall system scheduling flexibility and partially substituting the function of energy storage.

2.3. Objective Function

2.3.1. Multi-Energy Sharing and Cooperation Optimization Objective Function

This study maximizes the alliance’s sharing benefits by minimizing the sharing price based on the optimal sharing amount. The sharing objects are electricity, oxygen, and hydrogen, whose convergence criteria are as follows:
t T i K P r i . e . i t P r i . e . 0 . i t δ t T i K P r i . o . i t P r i . o . 0 . i t δ t T i K P r i . h . i t P r i . h . 0 . i t δ
where δ is the convergence accuracy, t T , i K .

2.3.2. Cluster Optimization

f r = j M f e j + f h j + f D R j + f R E j + f E S j
where j = 1 , 2 , , M .
(1)
The GP interaction cost f e is as follows:
f e = t T P r i b u y t P b u y . e t P r i s e l l t P s e l l . e t , t T
where P r i b u y t and P r i s e l l t are the electric purchase and price, respectively, P b u y . e t and P s e l l . e t are the interaction between IES and GP.
(2)
The hydrogen network (HN) interaction cost f h is as follows:
f h = t T P r i . h . buy t P h . b u y P r i . h . sell t P h . s e l l , t T
where P r i . h . buy t and P r i . h . sell t are the hydrogen purchase and sell price, respectively, and P h . b u y and P h . s e l l are the interaction between IES and HN.
(3)
The load adjustment cost is as follows:
f D R = δ t r t T P t r t + H t r t + δ c u t t T P c u t t + H c u t t + O c u t t , t T
where δ t r and δ c u t are the load translation and adjustment price, respectively.
(4)
The energy storage cost f E S is as follows:
f E S = δ H S t T P H S . c h t + P H S . d i s t + δ h s t T ρ h V h s . c h t + V h s . d i s t , t T
where P H S . c h t and P H S . d i s t are the charging and discharging heat power, respectively, V h s . c h t and V h s . d i s t are the charging and discharging hydrogen volume, respectively, δ H S and δ h s are the used price of heat storage (HS) and the hydrogen gas storage (HGS), respectively, ρ h is the density of hydrogen.
(5)
The discarding RE cost f R E is as follows:
f R E = δ R E t T P P . R E t P R E t , t T
where δ R E is the discarding RE payment price, P P . R E t is the RE output, and P R E t is the actual RE consumption power.

3. IES and Asymmetric Profit Allocation

The IES architecture is shown in Figure 2, and it typically includes demand response load and units for CSP, HP, PHP, VPSA, EF, RE and hydrogen charging stations, etc. The oxygen could be combined with the VPSA to supply oxygen loads, while the hydrogen generated by P2H could be used by HFCs, as well as hydrogen sharing and hydrogen charging stations, resulting in efficient energy utilization.
For a more detailed description of IES, refer to [31]. In [31], authors completed capacity planning for IES clusters using distributed robust optimization. The study explored economic dispatch with a focus on energy sharing, the sharing price game, and profit distribution. Because a single IES gathers a community, the distribution network and power flow within the IES are not considered.
In summary, electricity, heat, and oxygen are the main energy provisions. CSP, HP, HFC, and RE units, as well as power sharing and interaction with GP, are used to supply electric energy. CSP, EF, and HFC units are also used for heat supply, while P2H and VPSA units, as well as oxygen sharing, are used for oxygen supply. Hydrogen energy is supplied by HN, P2H units, and HGS; the hydrogen belongs to a secondary energy supply.

3.1. PHP-VPSA Joint Model

(1)
The P2H model constraints are as follows:
V E L . h t = η P 2 H P E L t / P H . e / ρ h V E L . O t = η P 2 H P E L t / P O . e / ρ O s . t . P E L min P E L t P E L max M P 2 H Δ P E L l p P E L t P E L t 1 Δ P E L u p
where P E L t is the electrolysis power, V E L . h t and V E L . O t are the hydrogen and oxygen production by electrolysis, respectively, η P 2 H is the electrolysis efficiency, ρ O is the density of oxygen, P H . e and P O . e are the energy consumption for electrolysis, M P 2 H is the installed capacity of P2H units, P E L min and P E L max are the electrolysis power constraints, Δ P E L u p and Δ P E L l p are the P2H climbing power constraints.
(2)
The HFC model constraints are as follows:
V H F C . h t = η H . e P H F C . e t / P H . e / ρ H / η H F C s . t . P H F C . h min P H F C . h t P H F C . h max 0 P H F C . e t M H F C η e . H min P H F C . e t P H F C . H t η e . H max P H F C . e t Δ P H F C . e l p P H F C . e t P H F C . e t 1 Δ P H F C . e u p
where η H F C is the HFC efficiency, P H F C . e t is the HFC output electric power, P H F C . H t is the HFC adjustable heat power, V H F C . h t is the HFC hydrogen consumption volume, η e . H max and η e . H min are electric and heat conversion coefficient, respectively, Δ P H F C . H u p and Δ P H F C . H l p are the HFC climbing power constraints, M H F C is the installed capacity of the HFC units.
(3)
The VPSA model constraints are as follows:
V V P S A t = η V P S A P V P S A t / P V P S A . e s . t . P V P S A min P V P S A t P V P S A max M V P S A Δ P V P S A l p P V P S A t P V P S A t 1 Δ P V P S A u p
where P V P S A t is the VPSA power, η V P S A is the VPSA oxygen production efficiency, P VPSA . e is the energy consumption, V V P S A t denotes the VPSA-produced oxygen, P V P S A max and P V P S A min are the VPSA power constraints, respectively, Δ P V P S A u p and Δ P V P S A l p are the VPSA climbing power constraints, M V P S A is the installed capacity of the VPSA units.

3.2. CSP Unit and Energy Balance Constraint

(1)
Since a CSP experiences very little heat fluid transmission loss, it was disregarded. The CSP model constraints are as follows:
P S F - H T F t + P H S . d i s t = P H S . c h t + P C S P . H . e t s . t . P S F - H T F t = η S F - H T F S L P D t ρ P . L P P C S P . e t = η C S P P C S P . H . e t P C S P . H . e min P C S P . H . e t P C S P . H . e max M C S P P C S P . H . e l p P C S P . H . e t P C S P . H . e t 1 P C S P . H . e u p
where P S F - H T F t is the CSP input heat fluid power, P C S P . H . e t is the CSP steam turbine input heat power, η S F - H T F is the heat-collector photothermal efficiency, S L P is the heat-collector area, D t is the solar radiation intensity, ρ P . L P is the heat-collector actual energy flow density, η C S P is the steam turbine efficiency, P C S P . H . e max and P C S P . H . e min are the CSP output electric power constraints, P C S P . e t is the CSP output power, P C S P . H . e l p and P C S P . H . e u p are the CSP climbing power constraints.
(2)
The CSP-HS constraints are as follows:
S H S t = S H S t 1 + η H S c h P H S . c h t P C S P . H t + P H S . d i s t / η S H d i s s . t . S H min S H S t S H max M H S P H . c h min P H S . c h t α H . c h P H . c h max P H . d i s min P H S . d i s t α H . d i s P H . d i s max P C S P . H min P C S P . H t P C S P . H max α H . d i s + α H . c h 1 S H t = 1 = S H t = 24 2 t 24
where M H S is the HS installed capacity, S H t is the HS available capacity, S H max and S H min are the HS capacity constraints, α H . d i s and α H . c h are the HS discharging and charging status parameters, respectively, P H . c h m a x and P H . c h min are the charging heat power constraints, P H . d i s max and P H . d i s min are the discharging heat power constraints, η S H c h and η S H d i s are the HS charging and discharging efficiency, respectively, P C S P . H t is the output heat power, P C S P . H max and P C S P . H min are the CSP output heat power constraints.
(3)
The energy balance constraints are as follows:
P C S P . e t + P H P t + P R E t + P H F C . e t + P b u y . e t = P s e l l . e t + P i a . e t + P E L . D R t + P E F . e t + P V P S A t + P E L t s . t . 0 P b u y . e t P b u y . e max 0 P s e l l . e t P s e l l . e max P i a . e min P i a . e t P i a . e max 0 < P R E t < P P . R E t
P C S P . H t + P E F . H t + P H F C . H t = P H L . D R t
V V P S A t + V E L . O t = V O L . D R t + P i a . O t s . t . P i a . O min P i a . O t P i a . O max
V E L . h t + V h s . d i s t + P h . b u y = V H F C . h t + V h s . c h t + P h . s e l l + P i a . h t s . t . 0 P h . s e l l t P h . s e l l max 0 P h . b u y t P h . b u y max P i a . h min P i a . h t P i a . h max
where P i a . e t , P i a . O t and P i a . h t refers to electric sharing, oxygen sharing and hydrogen sharing, respectively, P H P t is the HP units output electric power, P E F . H t is the EF units output heat power, P EF . e t is the EF units input electric power, P E L . D R t , P H L . D R t and V O L . D R t are the loads after the demand response, P b u y . e max and P s e l l . e max are the interaction constraints with the GP, P h . s e l l max and P h . b u y max are the interaction constraints with the HN, P i a . e max and P i a . e min are the electric sharing constraints, P i a . h max and P i a . h min are the hydrogen sharing constraints, P i a . O max and P i a . O min are the oxygen sharing constraints.
For information on the other equipment constraints and IES cluster energy supply price refer to Appendix A of [31].

3.3. IES Cluster Asymmetric Profit Allocation

In this study, authors optimized the energy-sharing price through multi-Nash games based on multi-energy sharing. Therefore, the profit mainly comes from the additional profits generated between cases 4 and 5. Please refer to Section 4.1 for case settings
The IES cluster’s multi-energy sharing could reduce its dependence on external energy. Sharing electric energy, for example, would reduce energy dependence on the GP and electric storage, while sharing oxygen energy would reduce reliance on oxygen storage. Moreover, authors consider both giving and getting energy as contributions, and without any energy sharing, there is no contribution. Thus, authors used IES contributions as the cluster cooperative game power.
The IESs’ overall giving electric E i + , getting electric E i and the maximum reference points E max , E max + are as follows:
E i + = t = T max 0 , P i a . e t E i + = t = T min 0 , P i a . e t E max + = max E i + ,   E max = max E i  
The IESs’ overall giving oxygen O i + , getting oxygen O i and the maximum reference points O max , O max + are as follows:
O i + = t = T max 0 , P i a . O t O i + = t = T min 0 , P i a . O t O max + = max O i + ,   E max = max O i  
The IESs’ overall giving hydrogen H i + , getting hydrogen H i and the maximum reference points H max , H max + are as follows:
H i + = t = T max 0 , P i a . h t H i + = t = T min 0 , P i a . h t H max + = max H i + , H max = max H i  
(1)
The contributions S i of IESs are quantified as follows:
S i = ϖ e e E i + / E max + e E i / E max + ϖ o e O i + / O max + e O i / O max + ϖ h e H i + / H max + e H i / H max , i
where ϖ e , ϖ h and ϖ o are the energy sharing weights of electricity, oxygen and hydrogen, respectively.
(2)
Similar in Equation (1), the asymmetric profit allocation model is as follows:
max i K C i p r o f i t C i cos t S i s . t . i K C 0 . i p r o f i t = C p r o f i t C i p r o f i t C i cos t > 0 ,   i K
where authors took the logarithm of Equation (30), Lagrangian multipliers and penalty factors are introduced to obtain the form of augmented Lagrangian function, the equivalent formula of the objective function includes clusters and CCP.
The IES i objective function are as follows:
min S i ln C i p r o f i t C i cos t + ρ 1 2 i = 1 K C i p r o f i t C 0 . i p r o f i t 2 2 + i = 1 K α i k C i p r o f i t C 0 . i p r o f i t s . t .   C i p r o f i t C i cos t > 0 ,   i K
CCP’s objective function is as follows:
min   ρ 1 2 i = 1 K C i p r o f i t C 0 . i p r o f i t 2 2 + i = 1 K α i k C i p r o f i t C 0 . i p r o f i t s . t .   i K C 0 . i p r o f i t = C p r o f i t ,   i K
Lagrangian multipliers is updated as follows:
α i k = α i k + 1 + ρ C i p r o f i t C 0 . i p r o f i t
where C i p r o f i t , C 0 . i p r o f i t are the profit allocation plans of IESs and CCP, respectively, C i cos t is the energy sharing cost, C p r o f i t is the IES cluster generating additional profits through the multi- energy sharing price reduction, α i k is the Lagrange multiplier of generation k th.
In Equation (31), C i p r o f i t C i cos t > 0 denotes that each IES will receive profits by giving/getting energy contributions, i K C 0 . i p r o f i t = C p r o f i t is for satisfying the fairness in profit allocation.
(3)
The convergence criteria are as follows:
i K C i p r o f i t C 0 . i p r o f i t < δ 1
where δ 1 denotes convergence accuracy.

4. Case Simulation

4.1. Optimization Flowchart and Basic Data

The optimization flowchart in Figure 3 depicts three processes: IES cluster multi-energy sharing optimization, Nash bargaining-coordinated transaction prices between IESs, and asymmetric profit allocation.
First, the IES cluster chooses the best energy-sharing option P i a . e t , P i a . O t , P i a . h t based on the cluster’s economic factors and energy demands. Second, based on the cooperative game model, the Nash game equilibrium solution is used to coordinate the conflict of interest when sharing energy among IESs. The distributed ADMM is used to take electricity, oxygen, and hydrogen as optimization submodels, as shown in Equations (7)–(9). In the cooperative game negotiation, the optimal operation cost of the IES cluster without multi-energy sharing is taken as the breakdown point of Nash negotiation. Third, based on the asymmetric profit allocation, the profit allocation is negotiated to reduce the multi-energy sharing cost between IESs, with the profit mainly derived from the additional profits generated between cases 4 and 5.
Three adjacent areas in Lhasa, Tibet, including medical, office, and commercial areas, were used for numerical simulation. The load in these three areas and relevant data of typical RE scenarios are provided below. Moreover, typical renewable energy scenarios are generated by the method of literature [32].
Figure 4, Figure 5 and Figure 6 shows typical loads, RE and HEVs for each IES. Typical loads include electricity, heat, and oxygen. IES1 refers to wind turbine (RE-wt) output, IES2 refers to the wind turbine (RE-wt), and photovoltaic (RE-pv) output and IES3 refers to photovoltaic (RE-pv) output.
Table 1 provides the electric price, and the electric price’s median value is adopted as the power load price.
Table 2 lists the IES parameters. Among these parameters, the HP and RE’s installed capacity is considered the construction capacity, without take into account the efficiency and energy consumption ratio, whereas hydrogen storage does not consider the energy consumption ratio. For RE, only the amount of abandoned wind/solar power is considered.
Table 3 shows the CSP parameters, where CSP efficiency is the steam turbine generation’s efficiency.
Table 4 provides CSP installed capacity, P C S P 1 . e max , P C S P 2 . e max and P C S P 3 . e max denote the installed capacity of the IES1, IES2, and IES3 CSP generation stations, respectively.
Table 5 provides equipment capacity [31].
To verify the effectiveness of the proposed strategy, the following different case settings were used:
Case 1: Basic scenario with no multi-energy sharing, no multi-Nash game, no PHP supply oxygen. This scenario only considered the IES cluster’s autonomous optimization.
Case 2: A scenario with a multi-Nash game, but with no multi-energy sharing. PHP supply of oxygen was considered. This scenario mainly used P2H to aid in the supply of oxygen and to verify the improved energy utilization efficiency.
Case 3: A scenario that considered multi-energy sharing but not the multi-Nash game and PHP supply of oxygen. This scenario applied multi-energy sharing to verify flexibility and economy.
Case 4: A scenario that considered multi-energy sharing and PHP supply of oxygen, but not the multi-Nash game of shared energy. Multi-energy sharing combined P2H supply of oxygen scenarios. This scenario considered multi-energy sharing and PHP supply of oxygen to verify the joint effect.
Case 5: This scenario considered the multi-Nash game, PHP supply of oxygen, and multi-energy sharing. Based on Case 4, this scenario reduced the price of energy sharing through the multi-Nash game.
To resolve this problem, authors used Gurobi and Mosek in MATLAB.

4.2. Cluster Optimization Analysis

The IES is a clean energy unit. Given that the Tibet power grid is powered by coal-fired power generation, the hydrogen from the hydrogen network is non-green hydrogen, and carbon emissions generated from construction and vehicle transportation are not accounted for. Therefore, in the IES cluster, only the purchase of electricity and hydrogen will consider carbon emissions. The difference in carbon emissions of the IES cluster can be evaluated by comparing the electricity and hydrogen purchases. The IES cluster’s electricity and hydrogen purchases are shown in Table 6.
The PHP–VPSA combined oxygen supply model is adopted to price the intra-cluster energy supply demand; for the IES cluster energy supply price, refer to Appendix A of [31]. Figure 7 depicts a comparison of the IES cluster energy supply price and market price, where the cases without the PHP–VPSA combined oxygen supply model use market prices. To ensure profit, the energy supply price in the cluster should be lower than the market price, and lower prices could enhance consumer activity. The optimization results are shown in Table 6, Table 7 and Table 8 as other costs and benefits. See Appendix A for the dispatching results.
Table 7 demonstrates that, when compared to the VPSA supply of oxygen in Case 1, the PHP–VPSA combined oxygen supply model in Case 2 improves the IES cluster’s RE consumption rate while lowering power purchase and operation costs. Therefore, the PHP–VPSA combined oxygen supply model can reduce carbon emissions and improve economic benefits. Meanwhile, the cluster energy supply price is adopted to increase demand by lowering prices on the premise of ensuring a 10% profit. The multi-energy sharing model in Case 3 can improve the IES cluster’s RE consumption rate, reduce its operating cost, and increase its flexibility. However, the sharing cost reduces the overall benefit, and the electricity purchasing is higher than that in Case 2. The power purchase and operation costs are lower in Case 4’s scenario of multiple energy sharing and PHP supply of oxygen, indicating that its carbon emission reduction effect, economic benefits, and system flexibility are higher than those in other cases. To ensure profits, the overall energy supply income must be slightly lower than that of Case 2, with the demand-side enthusiasm higher than that in Case 2. However, the cost of multi-energy sharing is high, reducing the overall economic benefits. Thus, this study proposes a comprehensive Case 5 scenario based on Case 4, as shown in Table 8, in which the sharing cost is reduced from USD 2825.54 to USD 18.02. When compared to the other cases, Case 5’s electricity purchasing, as well as operating and sharing costs have decreased, while the energy supply revenue is lower on the premise of ensuring profits, indicating that its carbon emissions, economic benefits, and demand-side enthusiasm are higher than those of the other cases. Considering that Qinghai and Sichuan are the power interconnection channels in Tibet, the proportion of coal-fired power generation is approximately 30%, and the unit carbon emission of coal-fired power generation is 30%. Case 5’s carbon emission is 45.24% lower than Case 1.
According to Equations (11)–(16) and Table 6, Table 7 and Table 8, in Case 5, electricity sales are 51,199.95 kWh, and electricity purchases are 12,320.50 kWh, while hydrogen purchases volume is 0 m3, and sales volume is 33,063.09 m3. The operating costs are a negative because f e j and f h j are negative numbers.

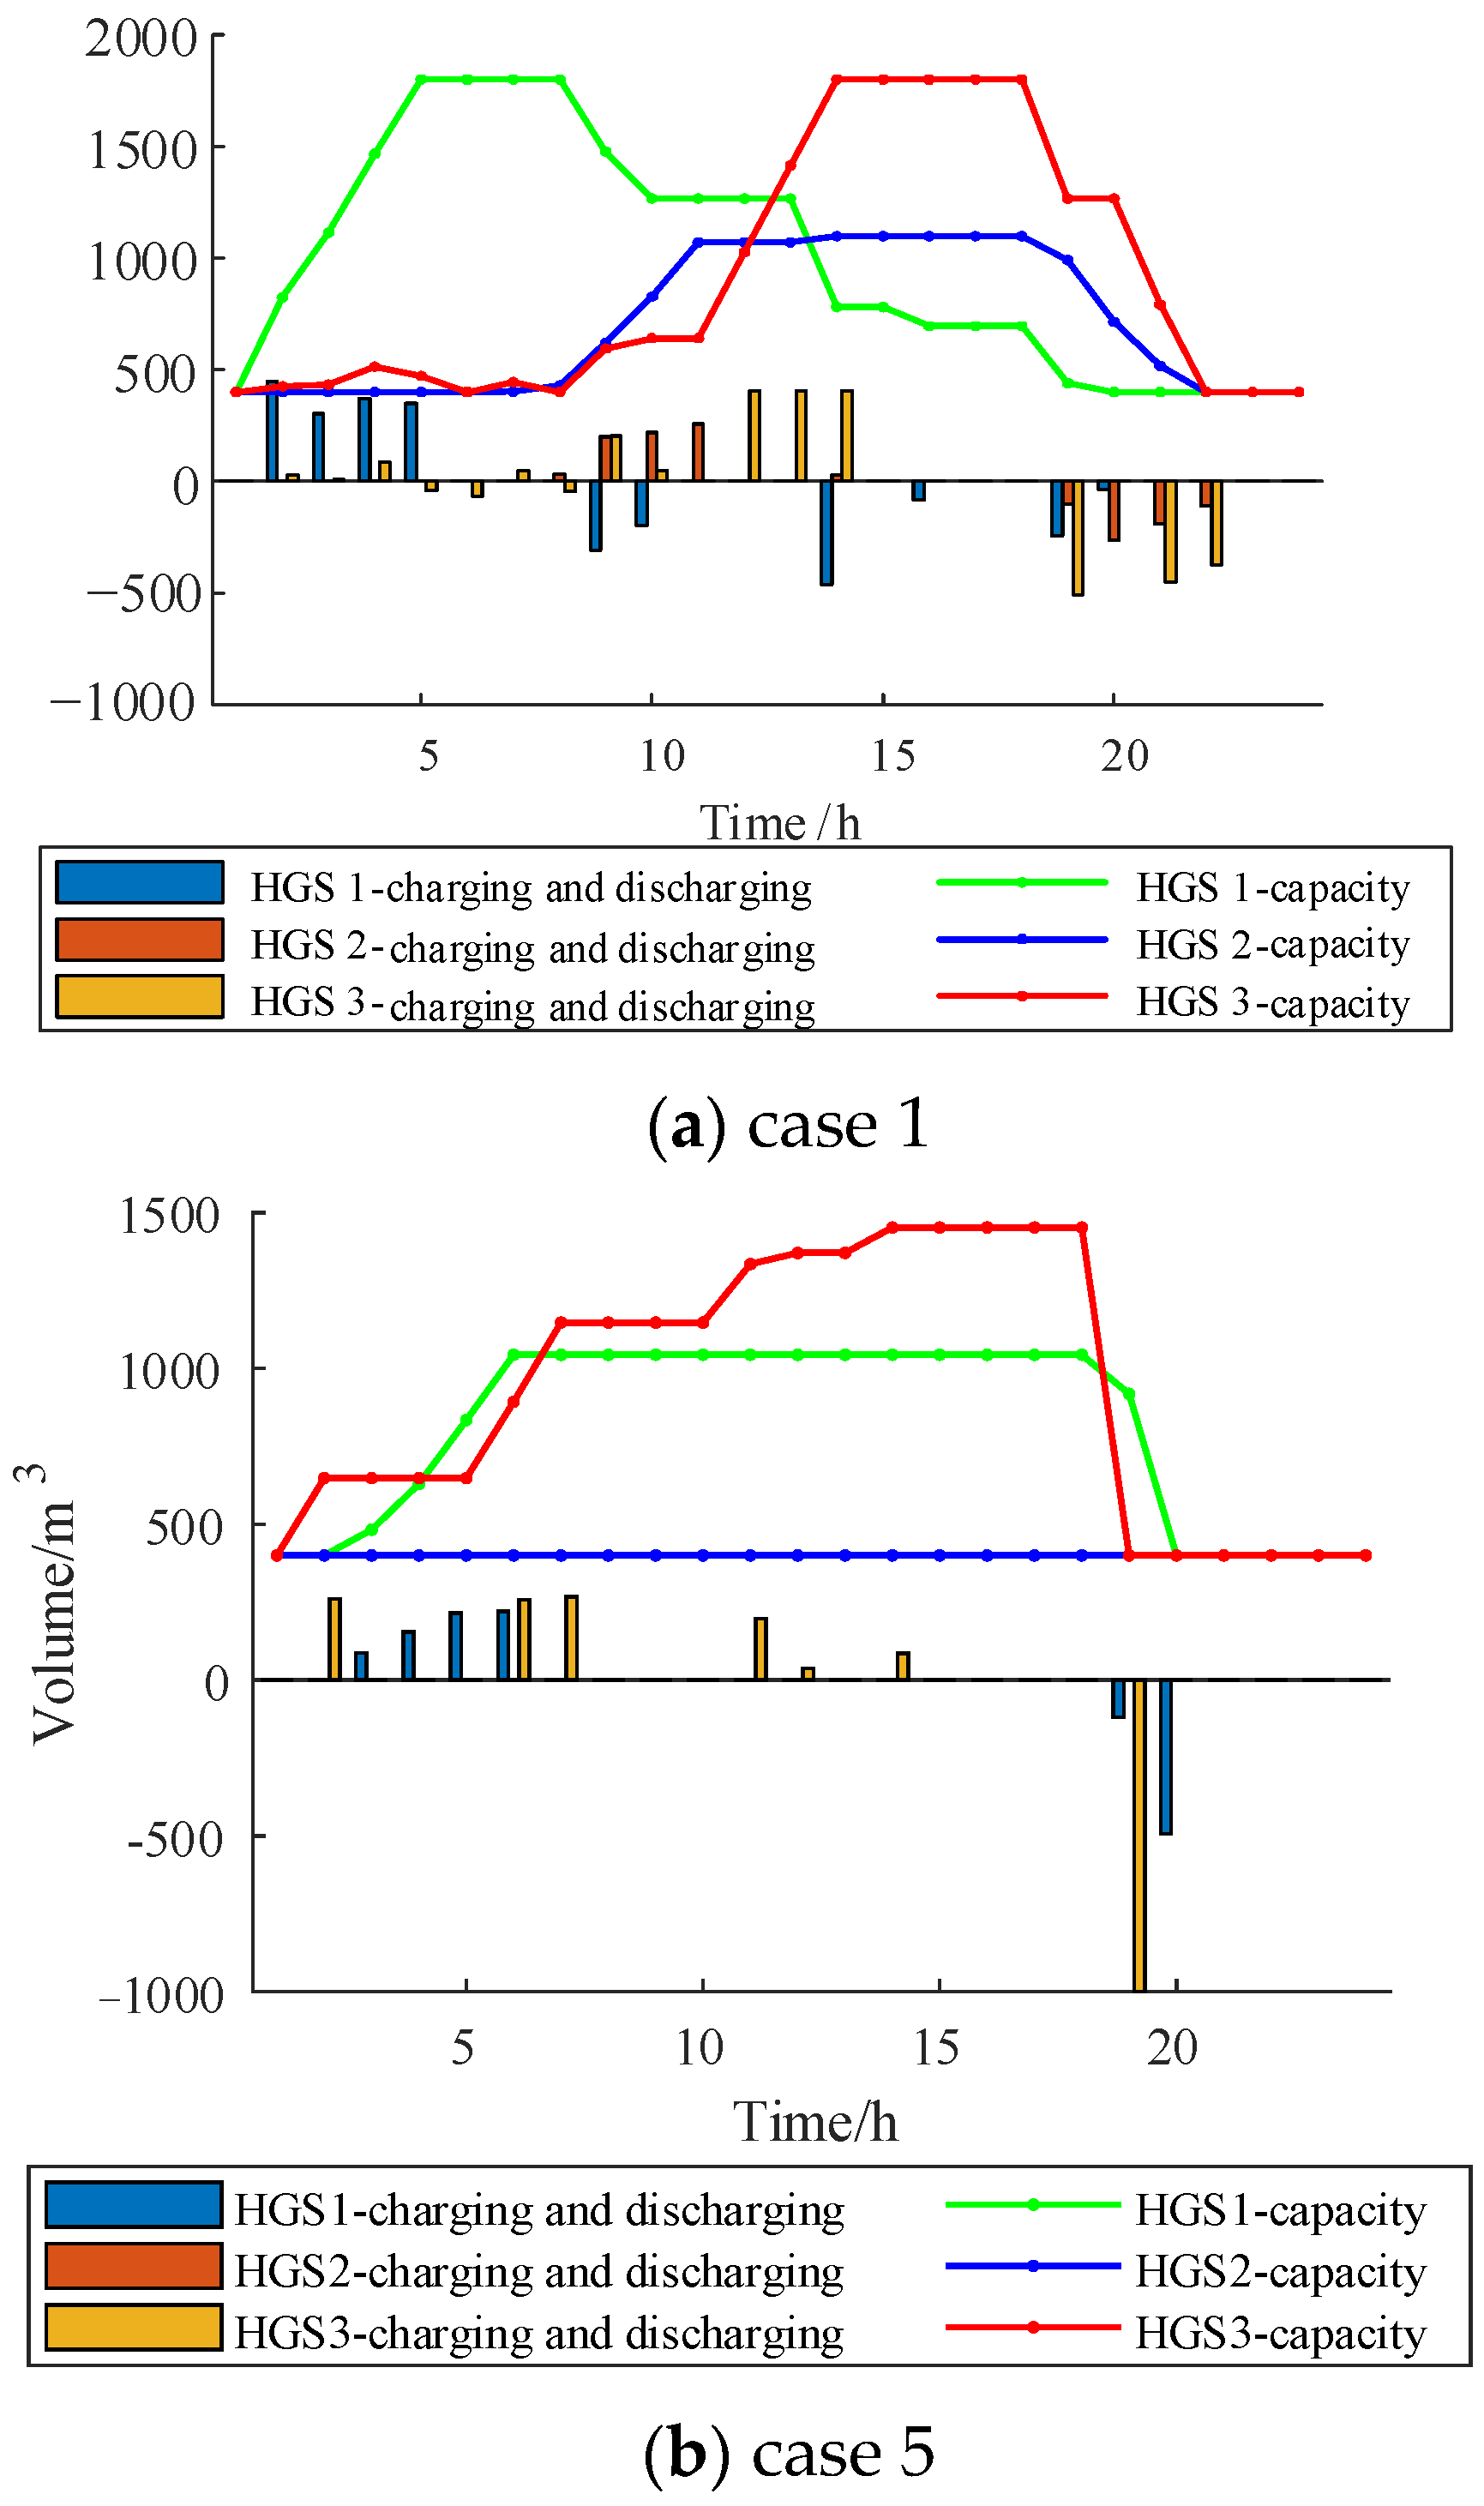
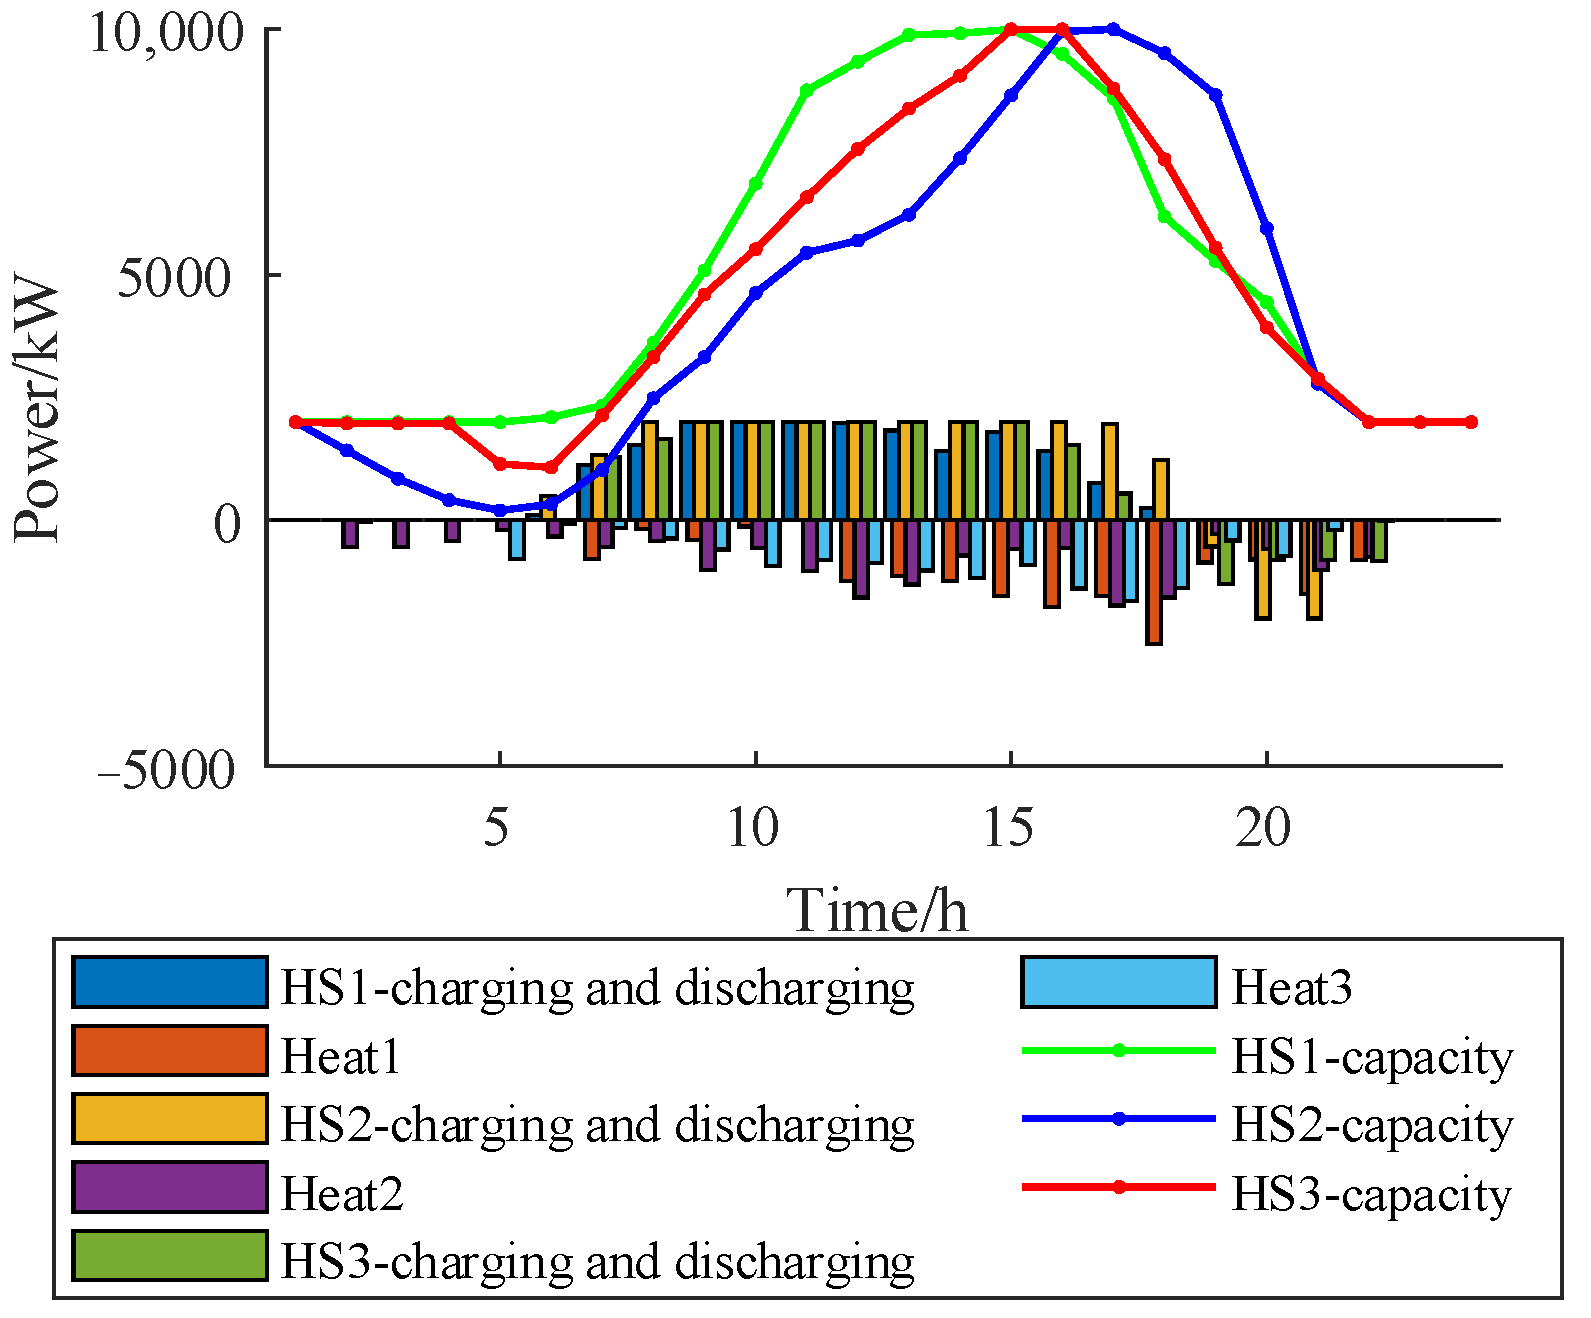
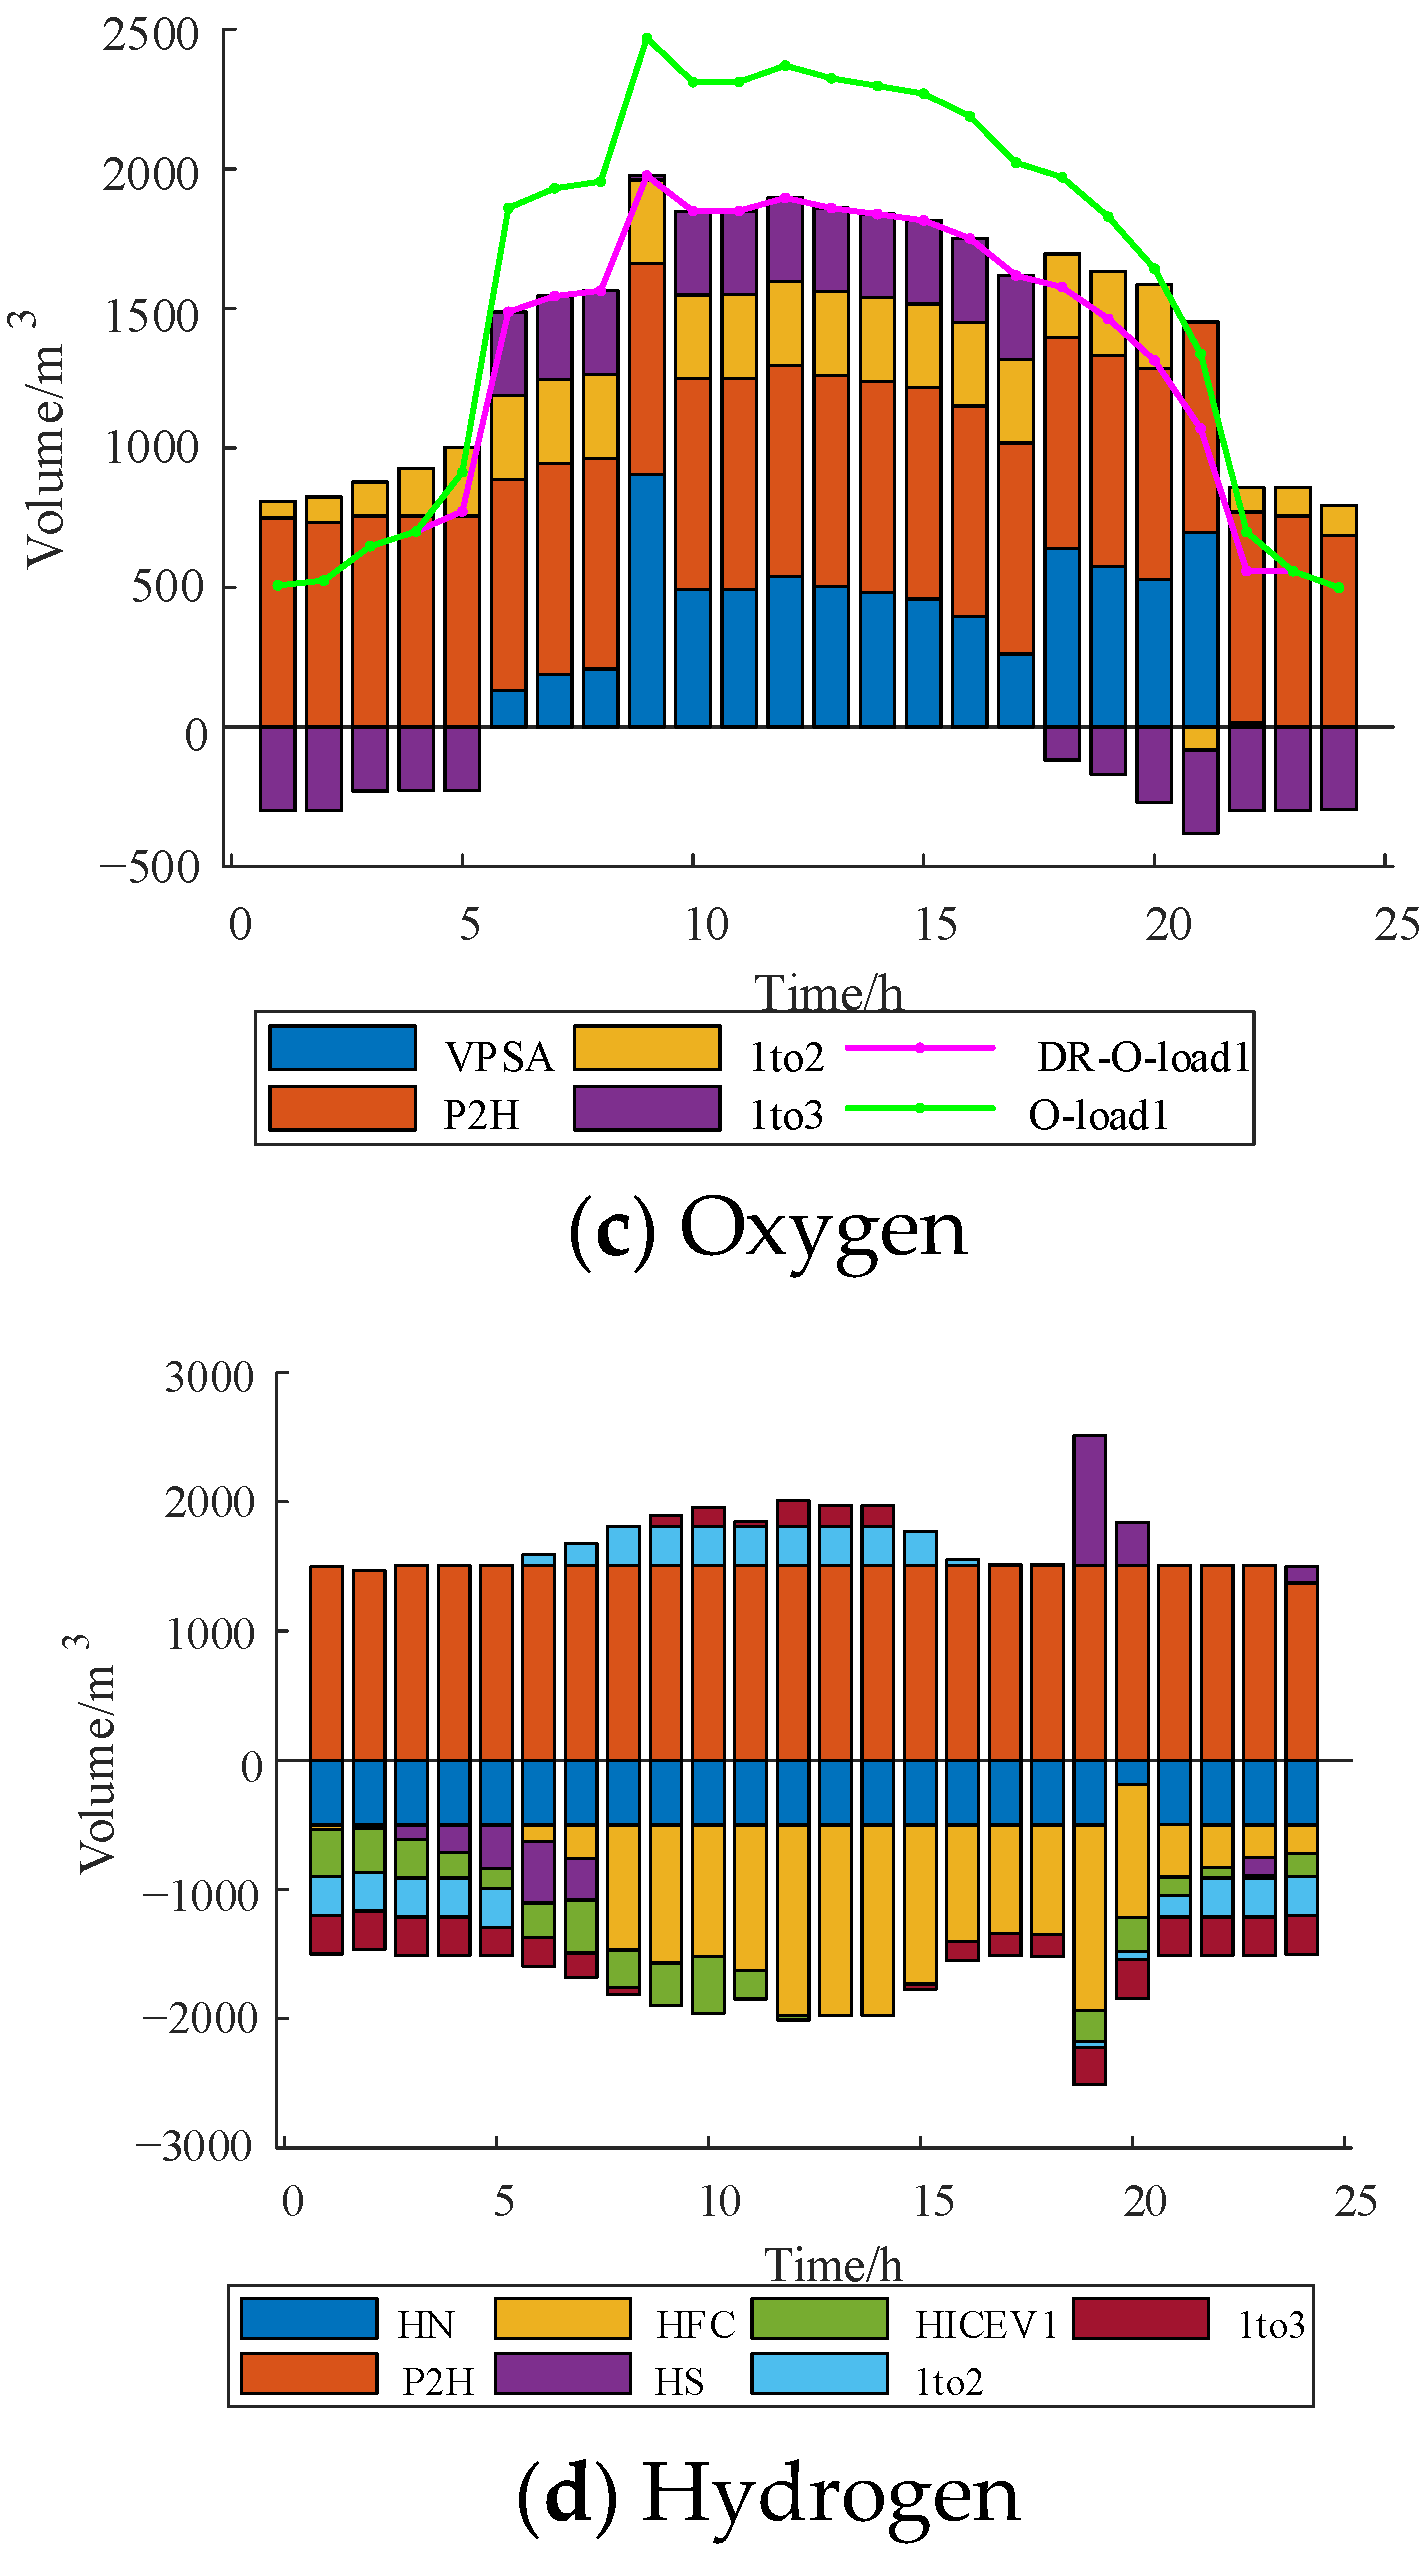
4.2.1. The HGS Optimization Analysis

By comparing the HGS dispatching results of Cases 1 and 5 in Figure 8, the HGS in Case 5’s IES2 is not used, and the HGS capacity of IES1 and IES3 is significantly reduced. This shows that multiple energy sharing can replace the role of HGS to a certain extent.

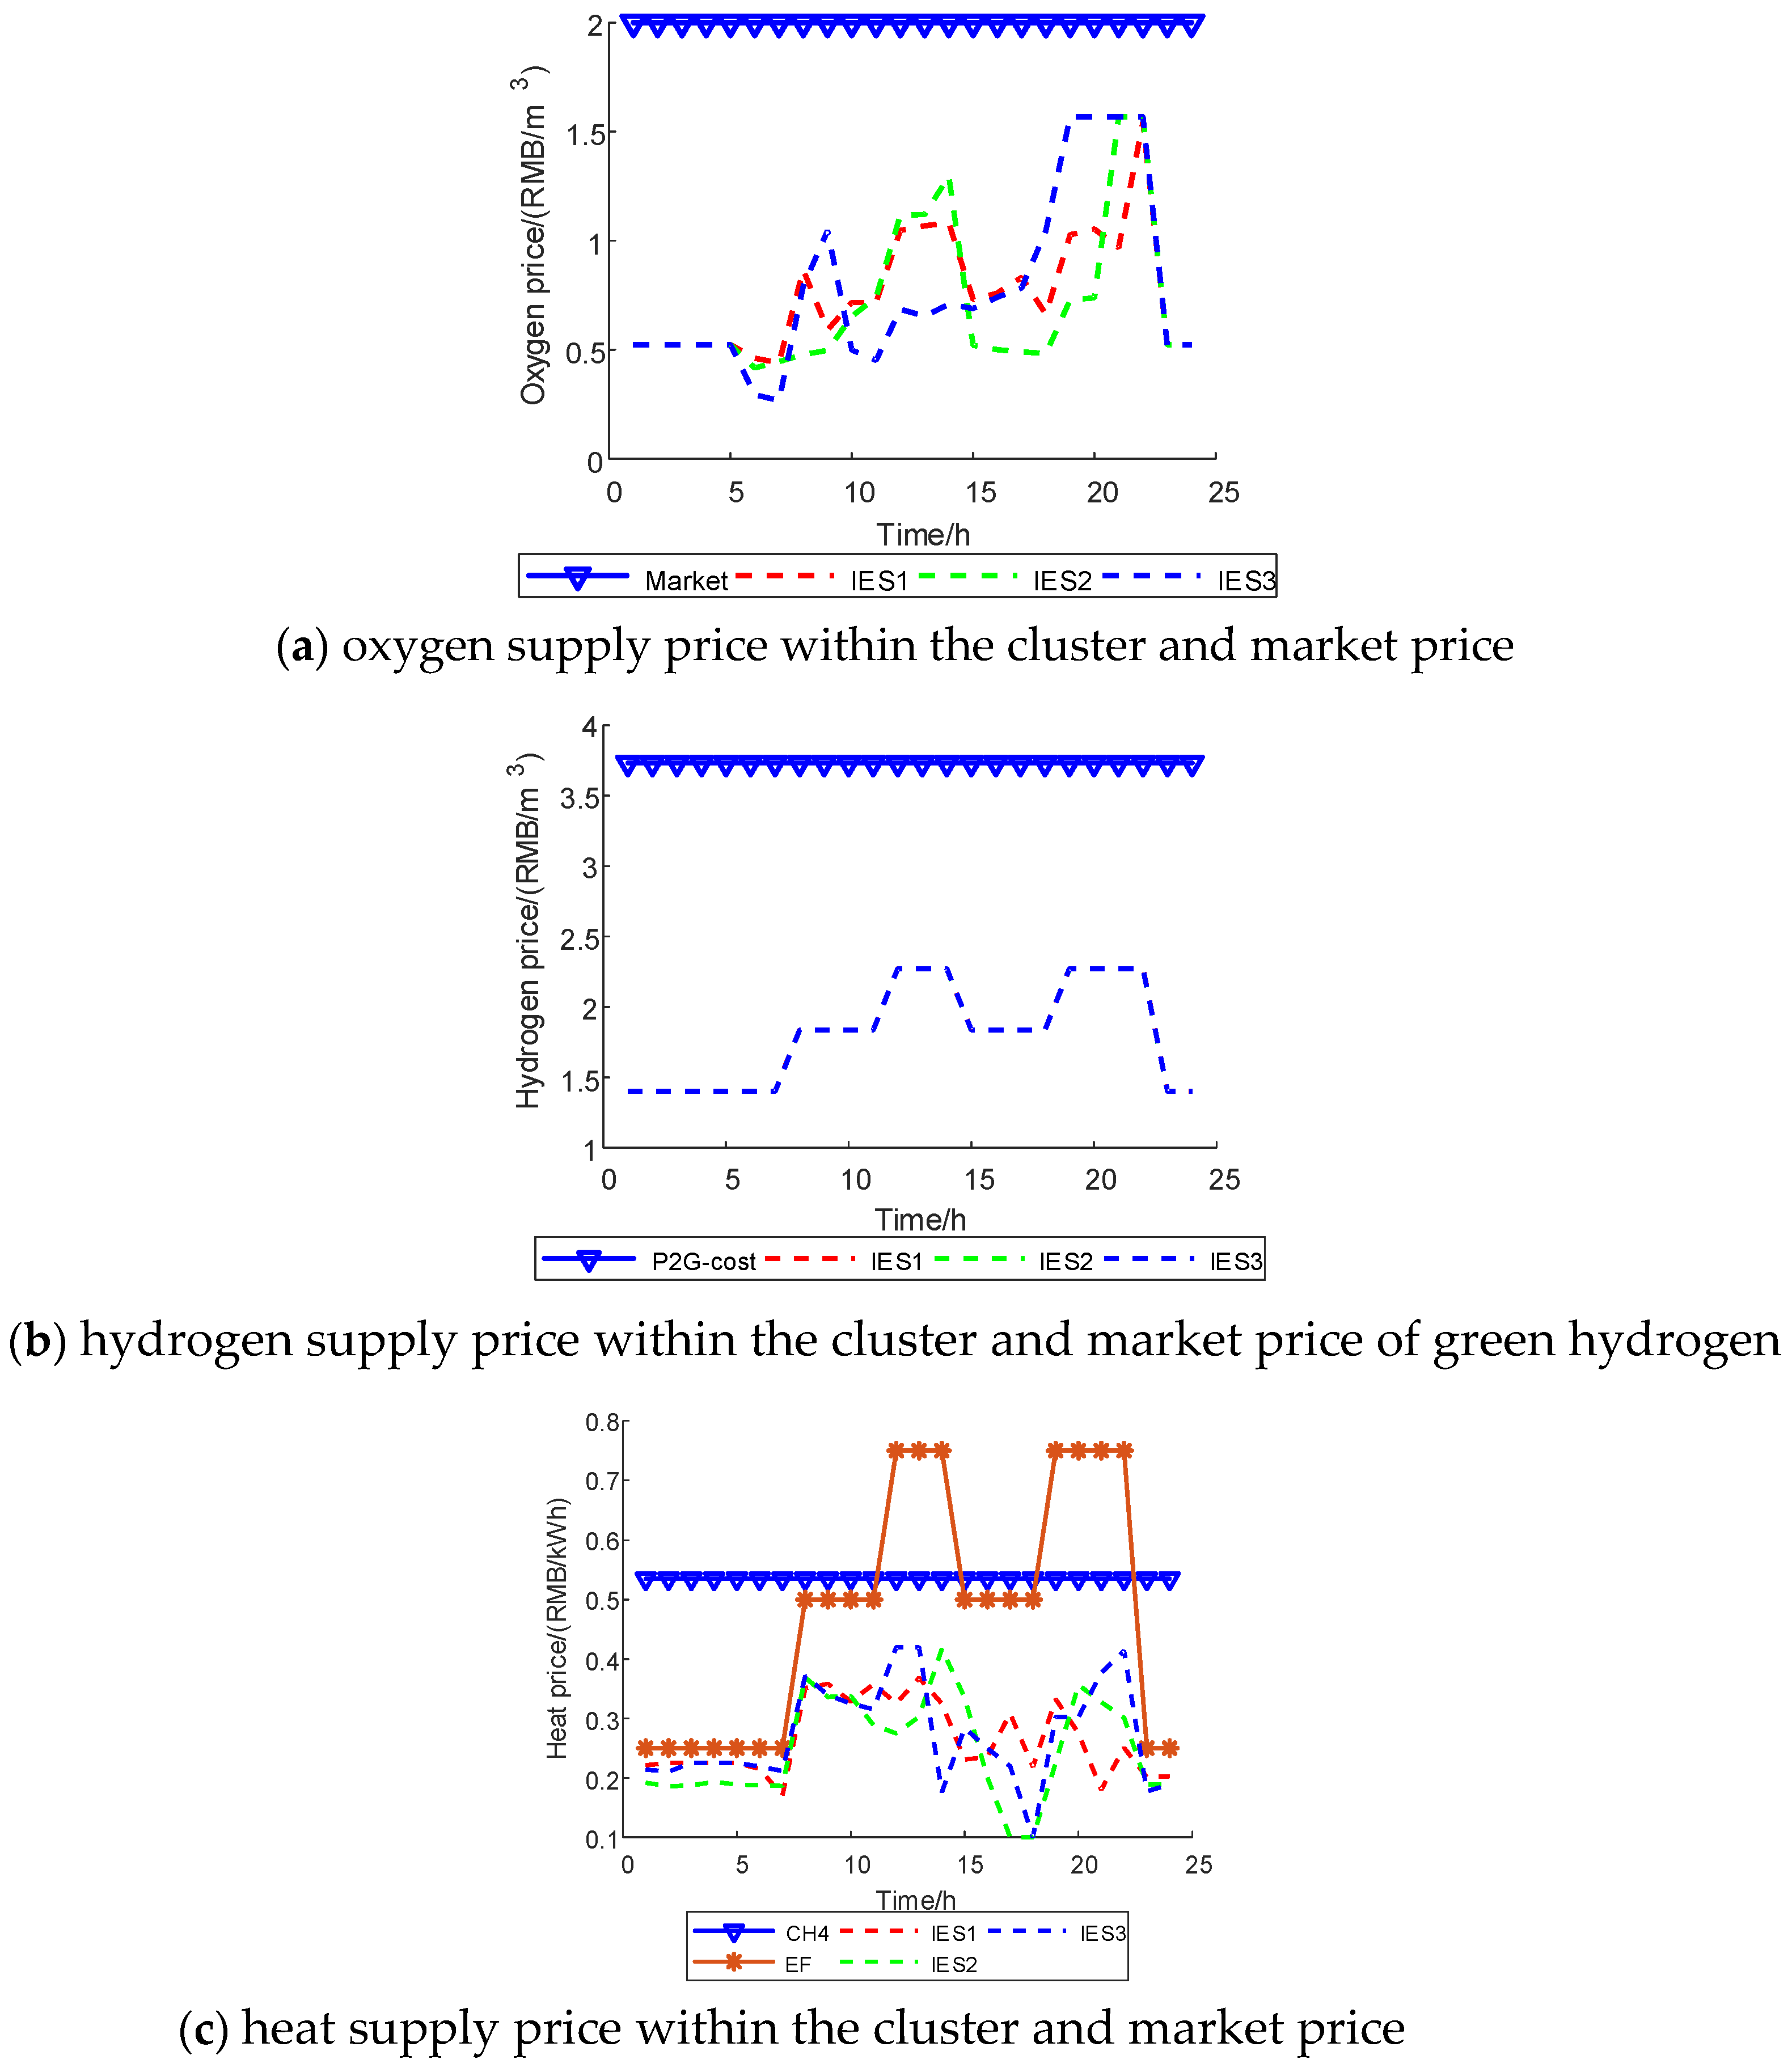
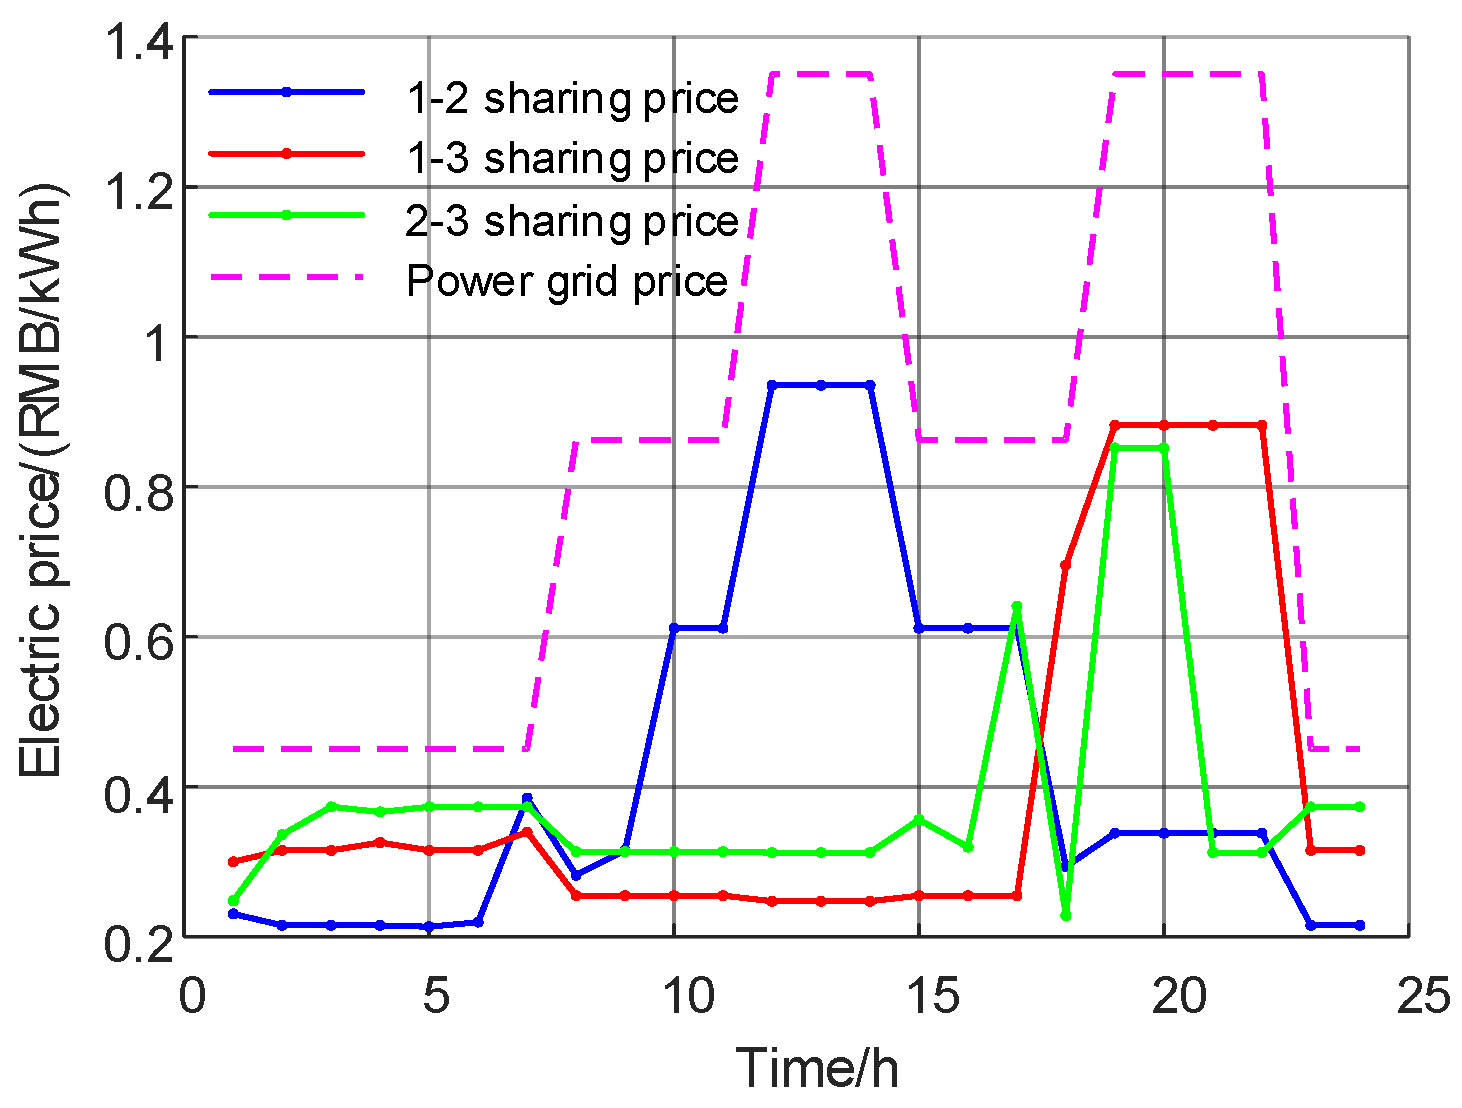
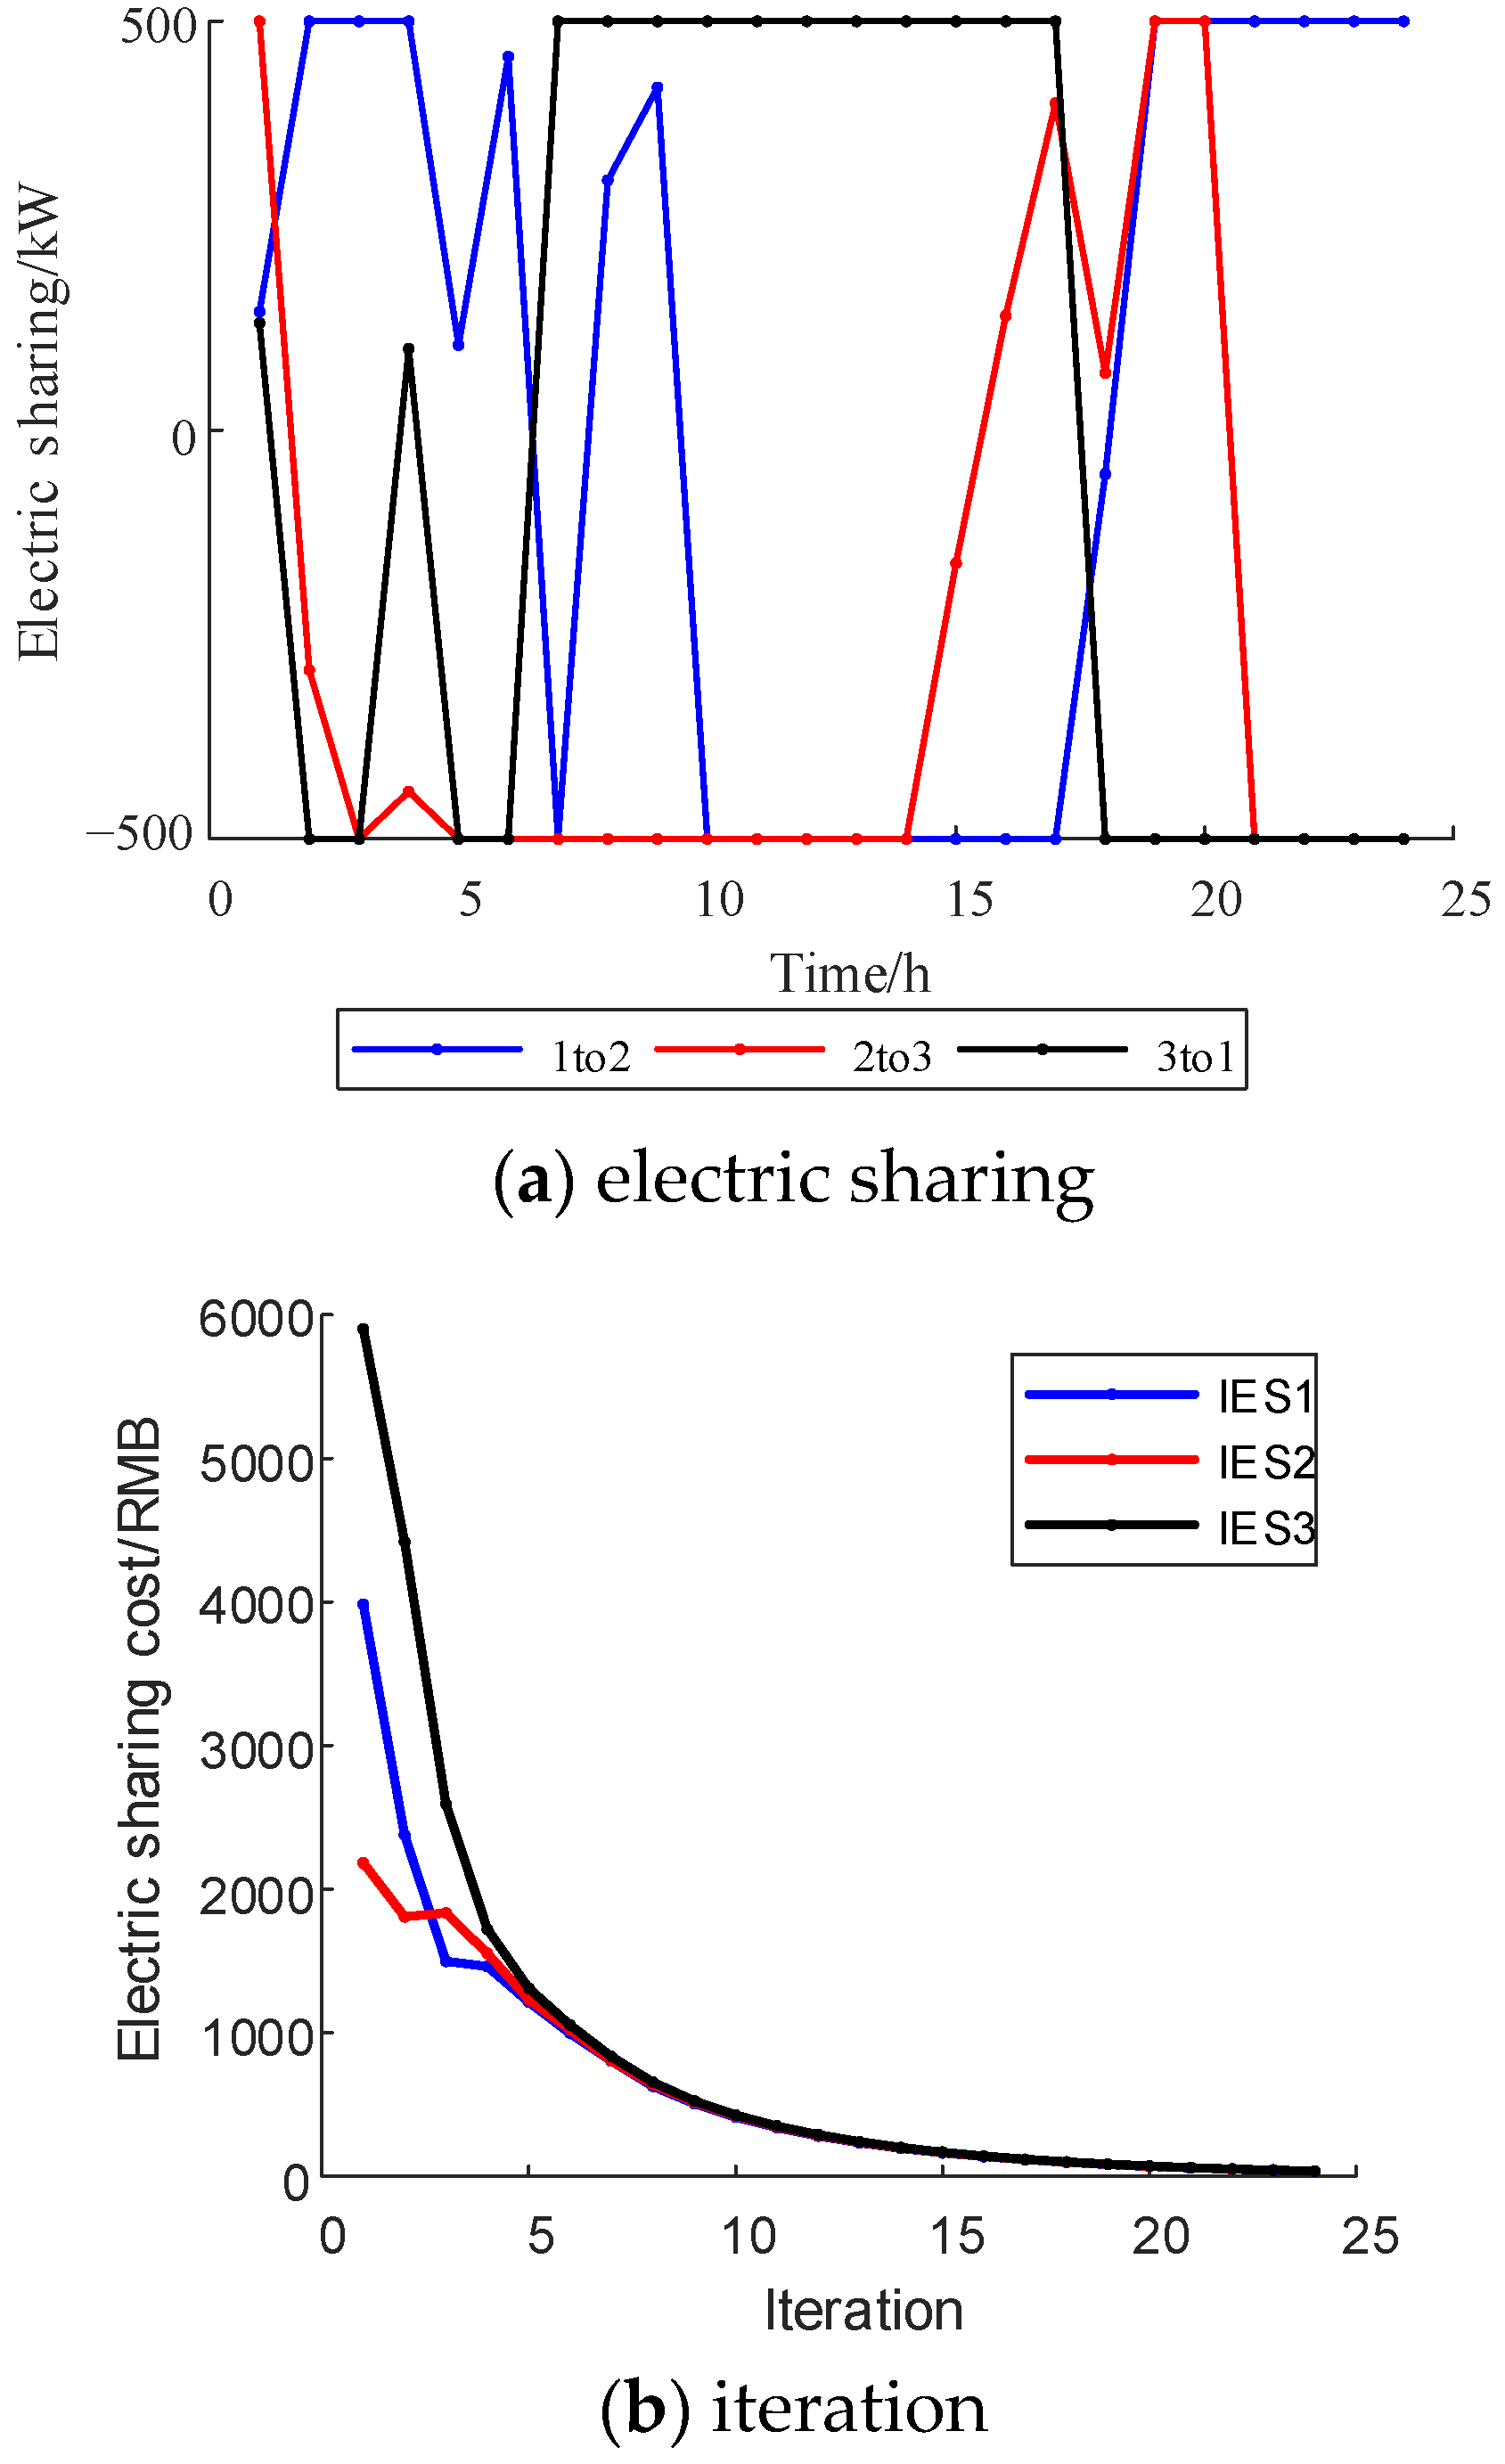
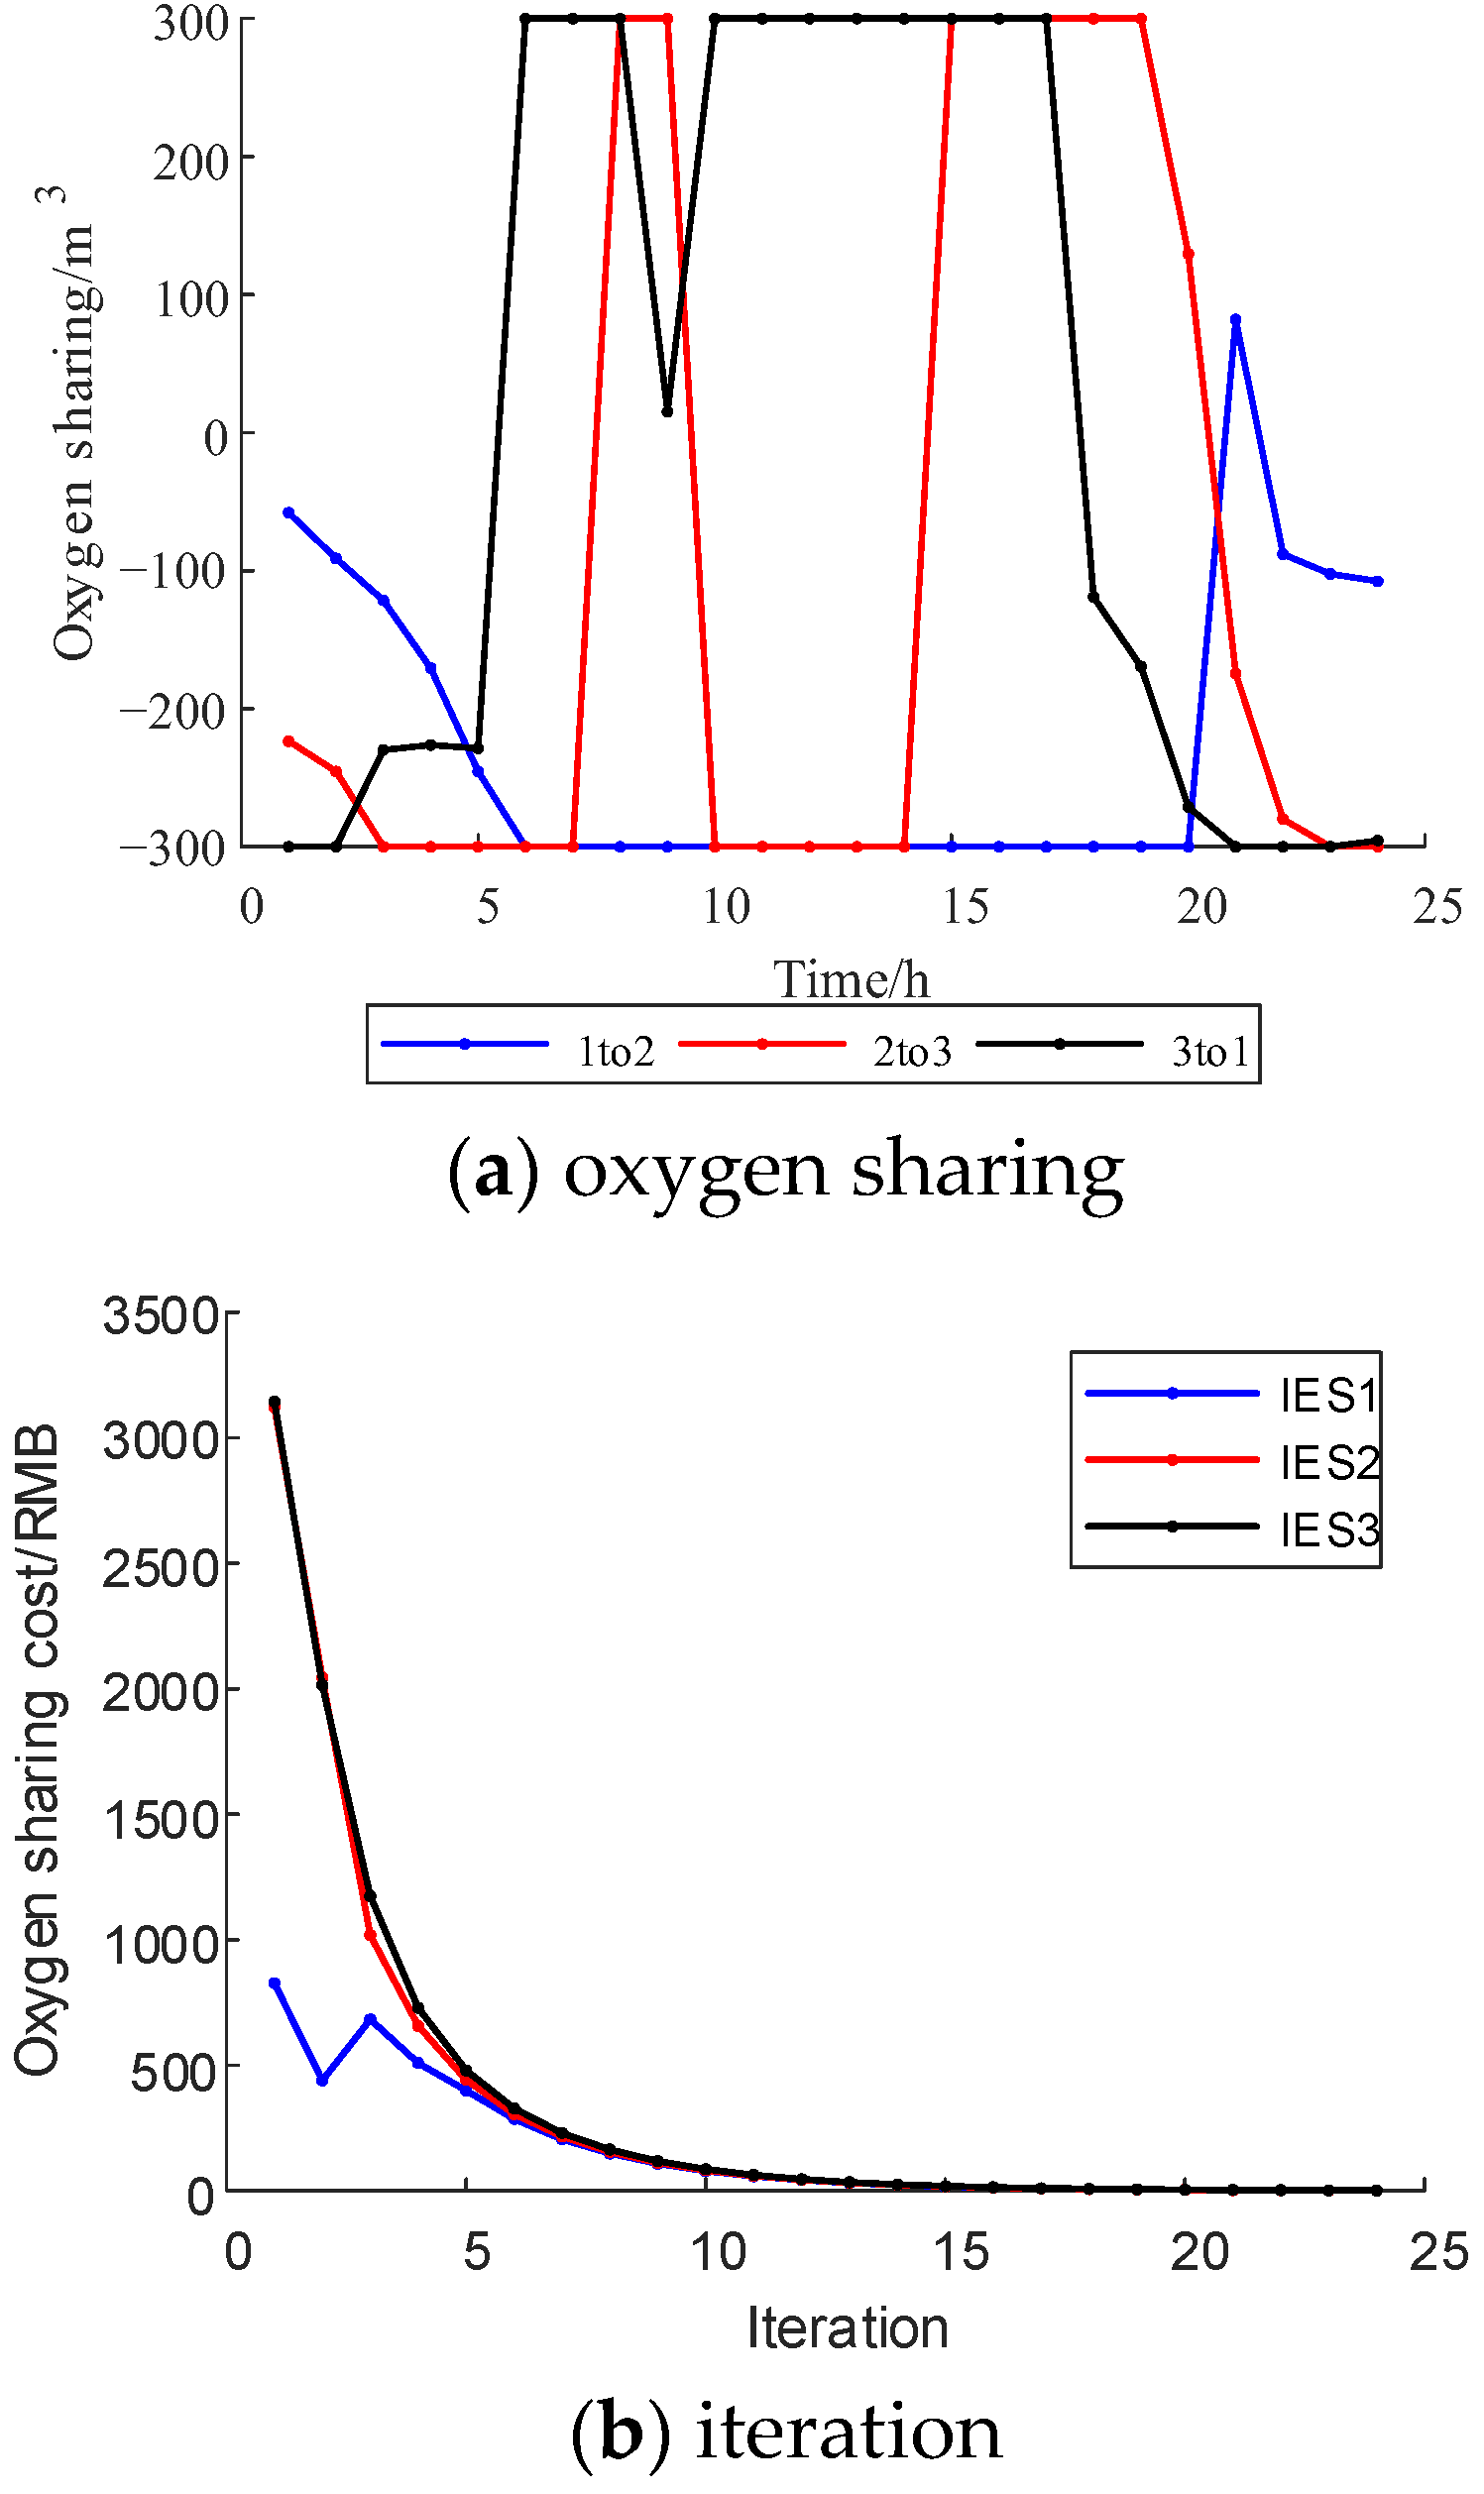
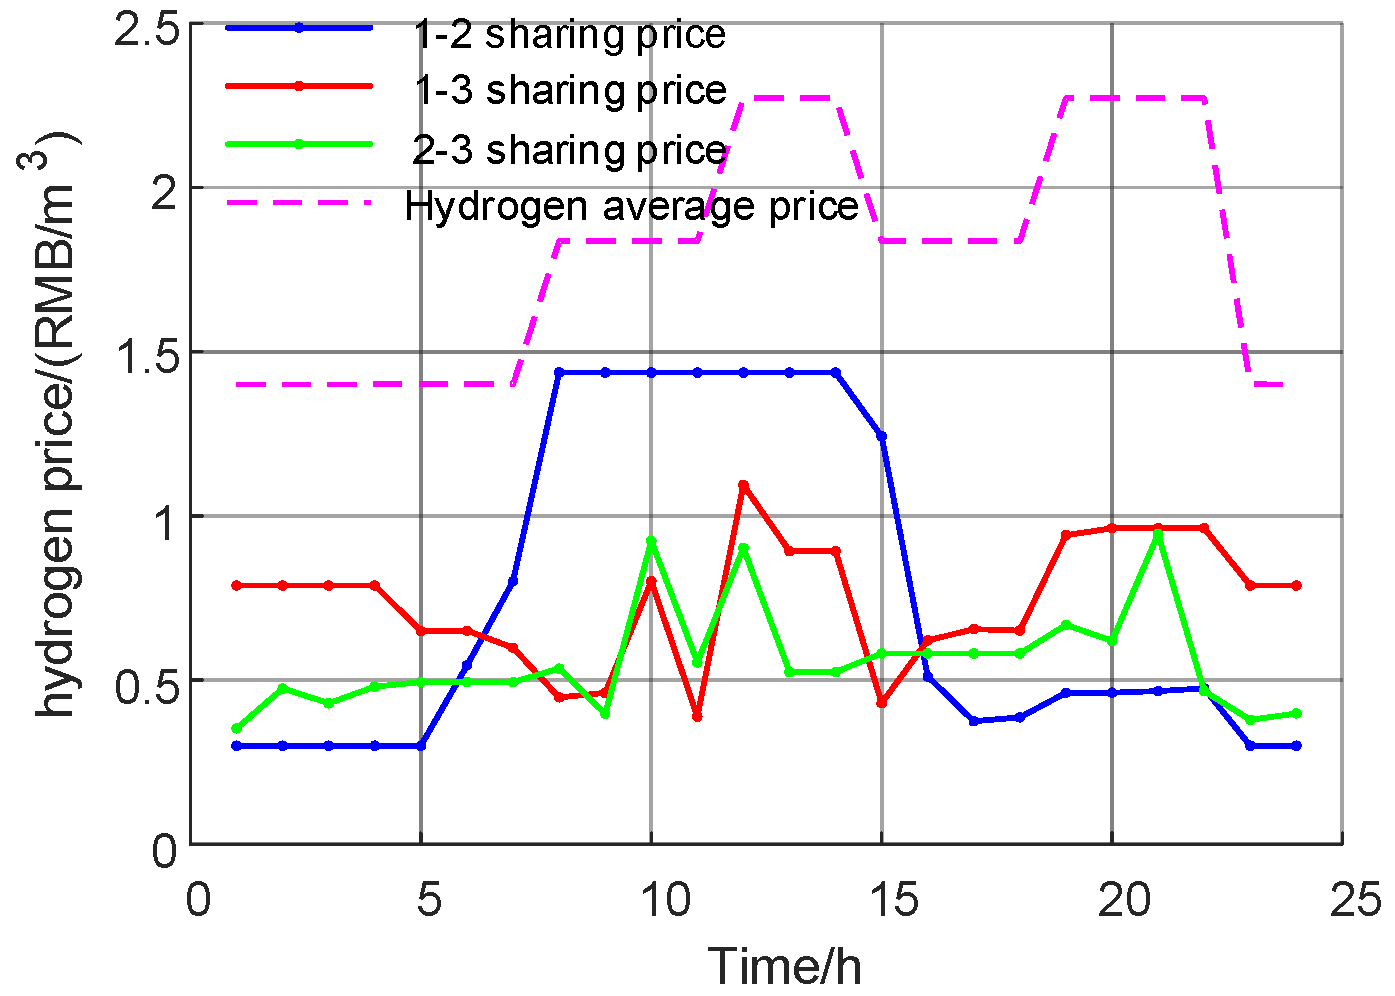
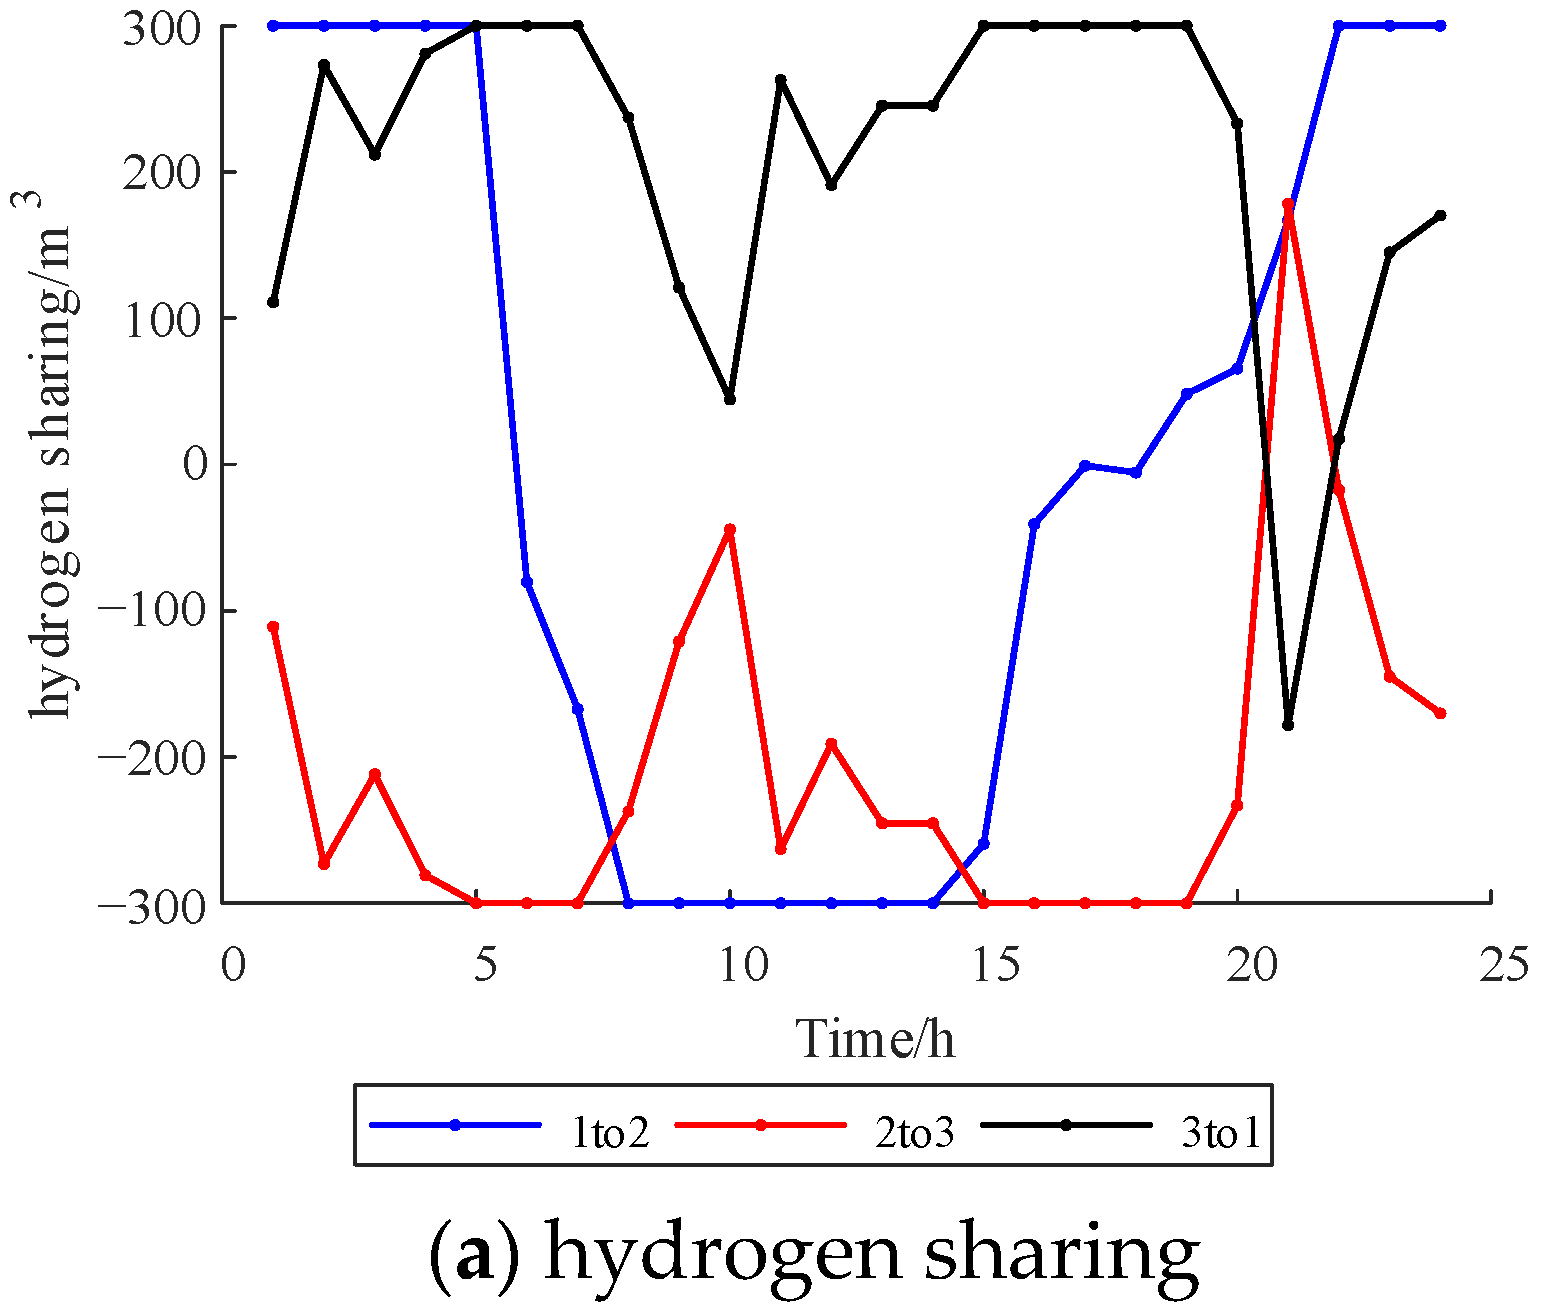
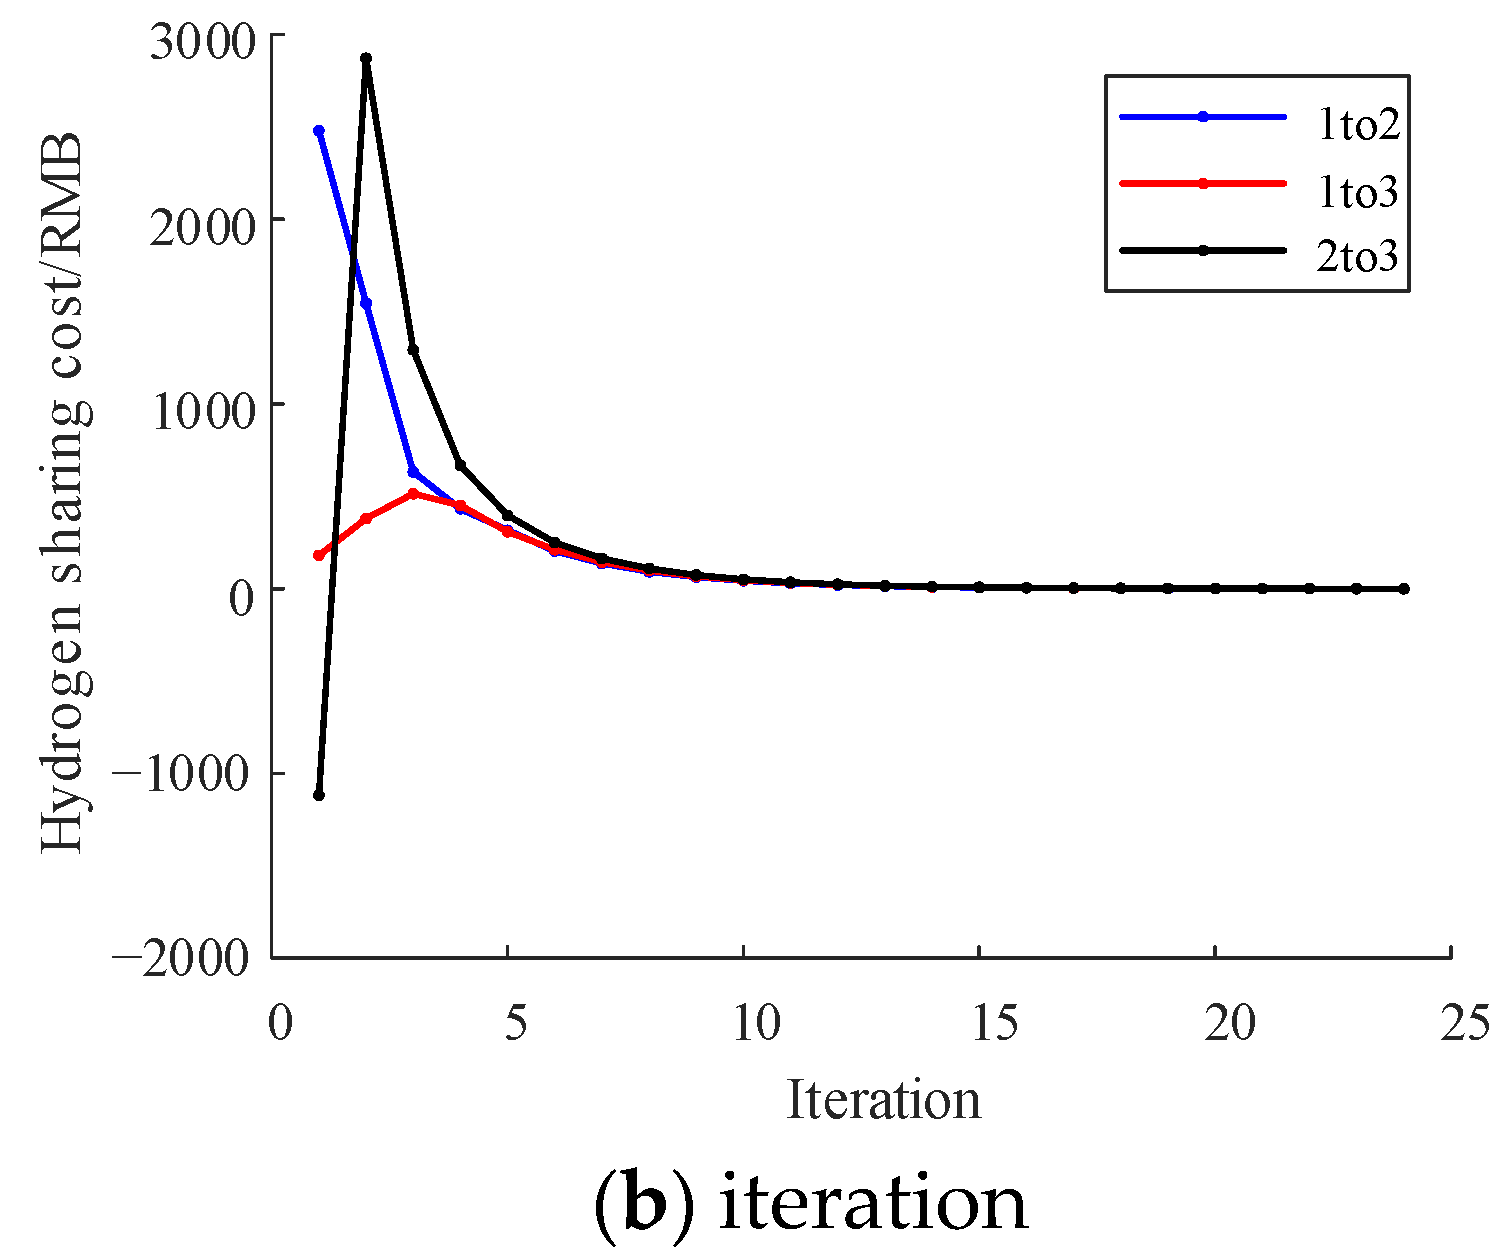
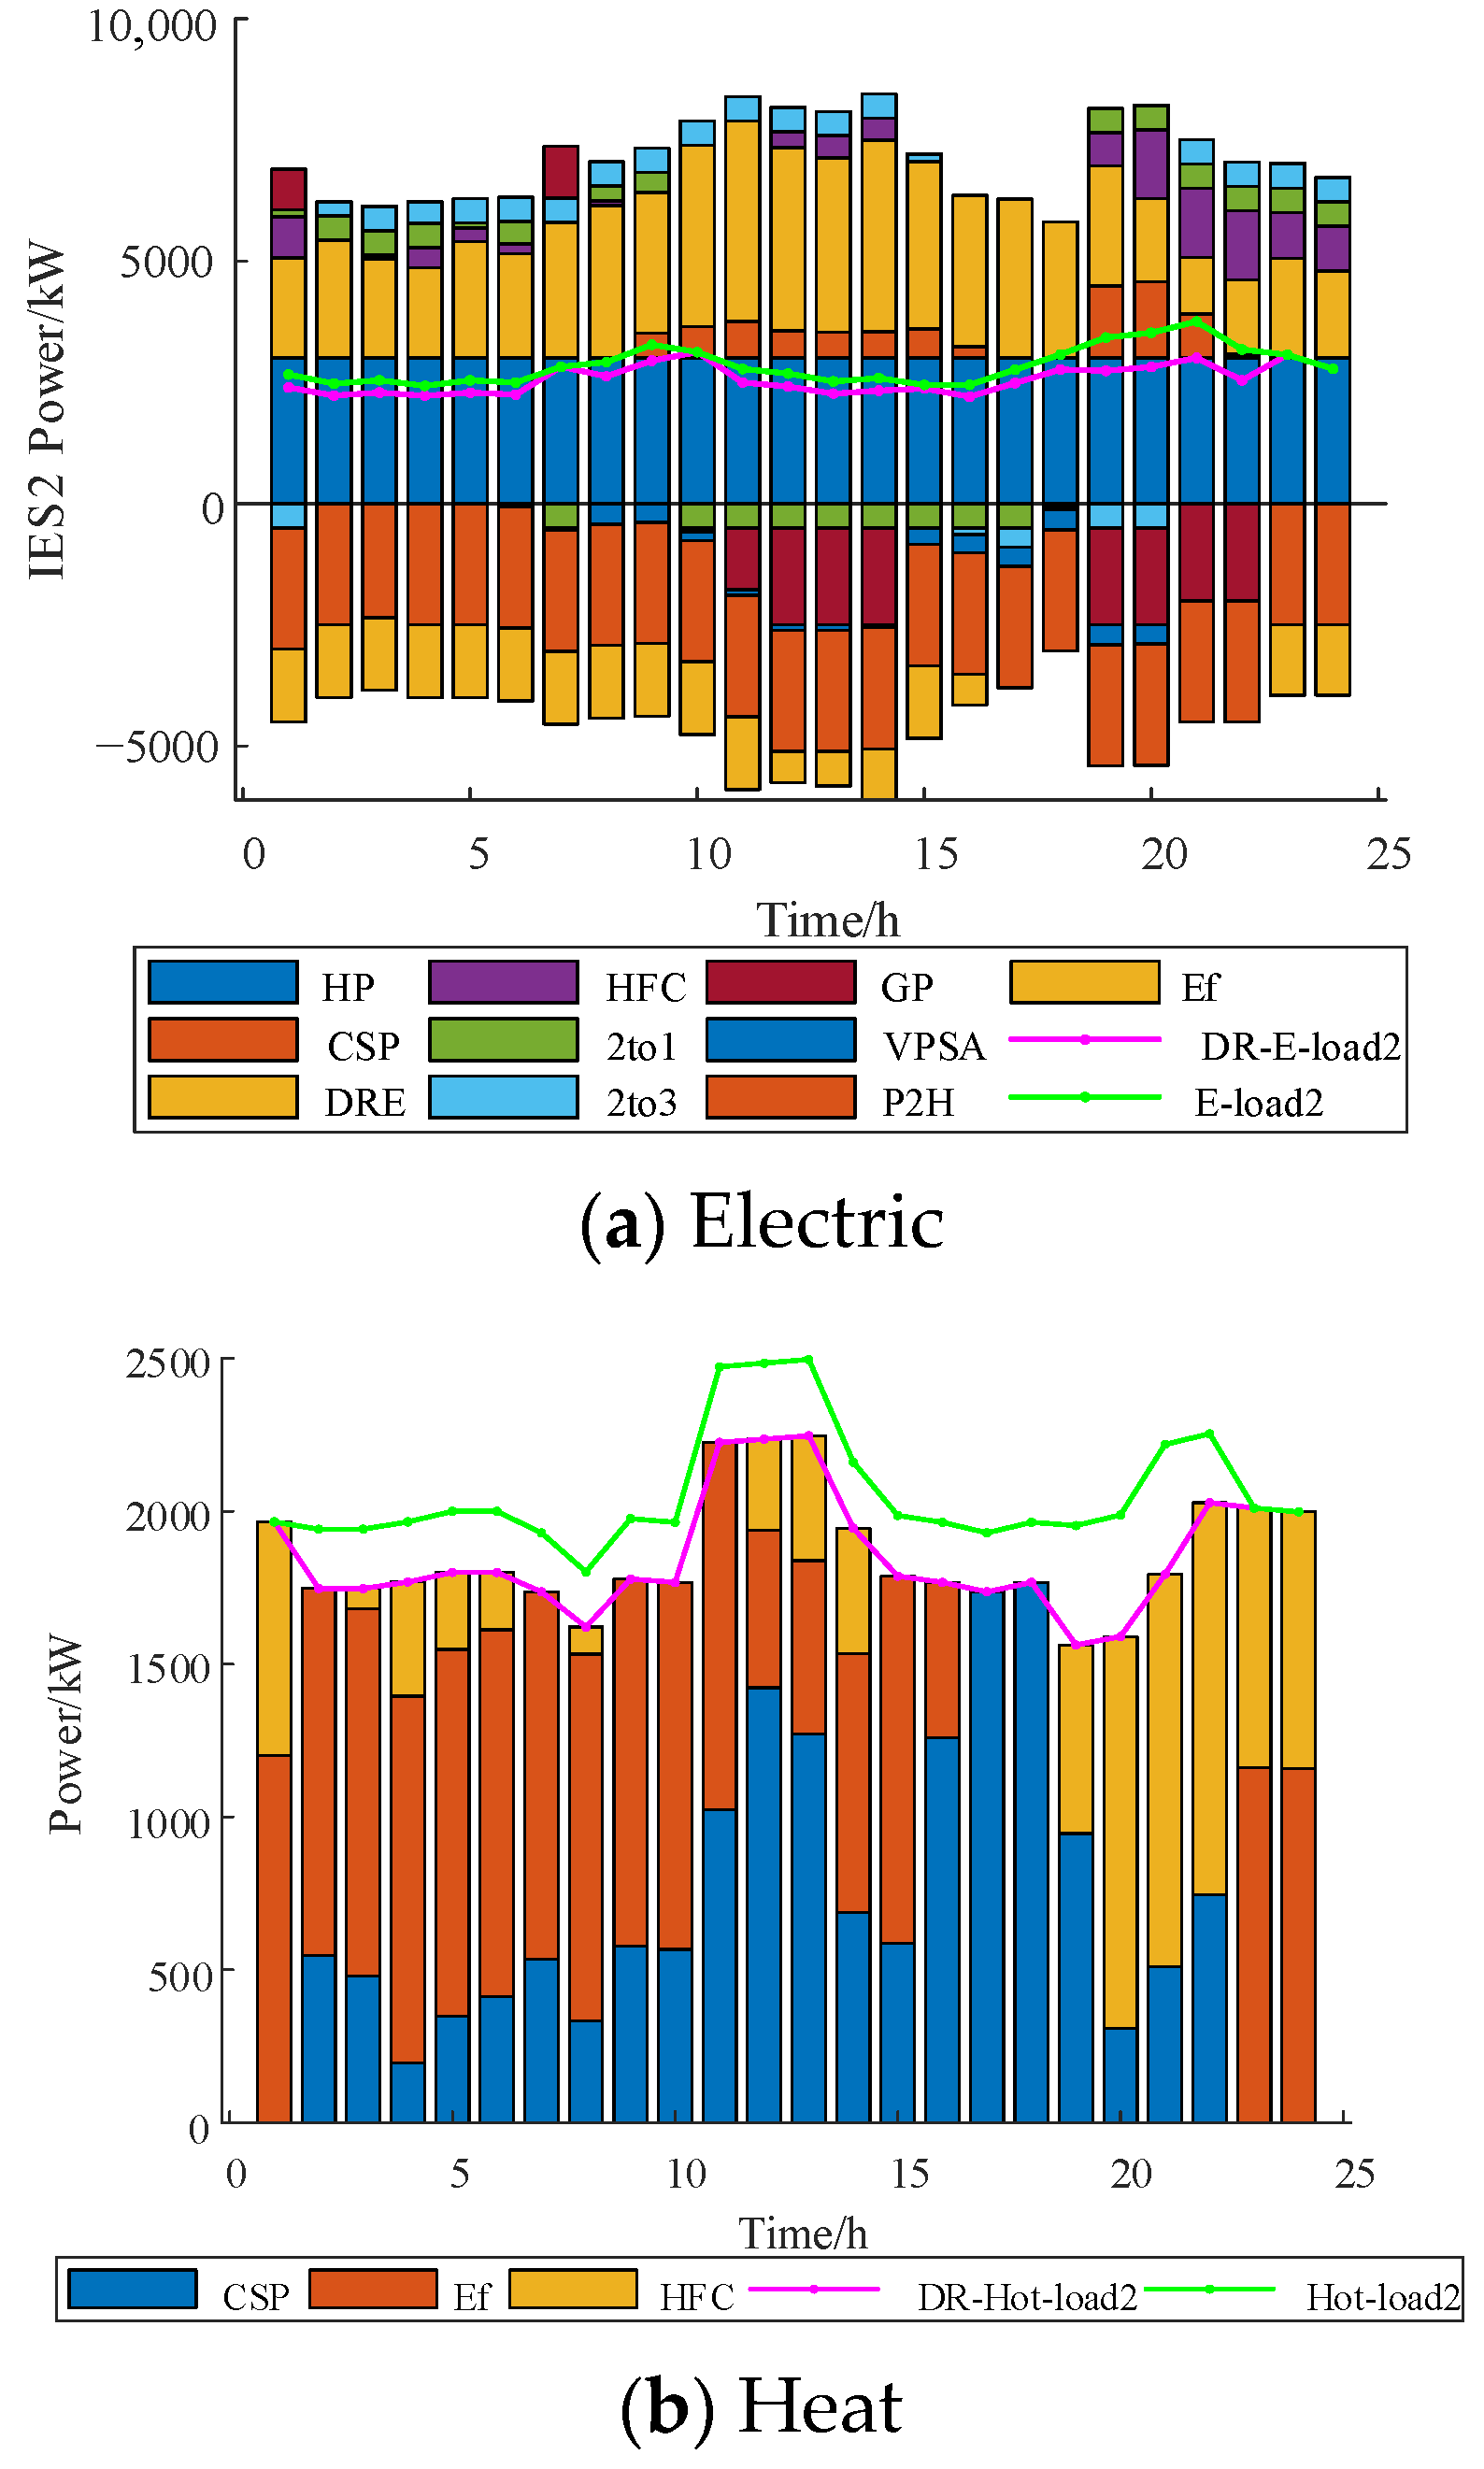
4.2.2. The Multi-Nash Game Optimization Analysis

Figure 9 and Figure 10 show the optimization results of the multi-Nash game of electric sharing. Based on the IES cluster power supply price, the electric sharing cost is RMB 11,943.44 (USD 1648.76). After the multi-Nash game, the sharing price between IES clusters is significantly reduced to RMB 122.94 (USD 16.97). Figure 11 and Figure 12 show the optimization results of the multi-Nash game of oxygen sharing. Based on the IES cluster oxygen supply price, the oxygen sharing cost is RMB 1512.30 (USD 208.77). After the multi-Nash game, the shared oxygen sharing price among IES clusters is significantly reduced to RMB 3.63 (USD 0.50). Figure 13 and Figure 14 show the optimization results of the multi-Nash game of hydrogen sharing. Based on the IES cluster hydrogen supply price, the hydrogen sharing cost is RMB 7085.10 (USD 978.08). After the multi-Nash game, the hydrogen sharing price between IES clusters is significantly reduced to RMB 3.96 (USD 0.55).
The total shared cost was reduced by 60.52%, on the basis of ensure the flexibility of the IES cluster. This proves the effectiveness of multi-Nash games in reducing the cost of multi-energy sharing.

4.2.3. Asymmetric Profit Allocation Optimization Analysis

The asymmetric profit allocation (APA) results are shown in Table 9. In this study, an IES cluster lowers the price of multi-energy sharing through multi-Nash games, generating additional profits, which are fairly distributed via asymmetric profit allocation. The operation cost of each IES can be reduced after profit allocation, effectively motivating IESs to participate in the cluster, lowering cluster costs, and maximizing cluster benefits. EPA is equitable profit allocation.

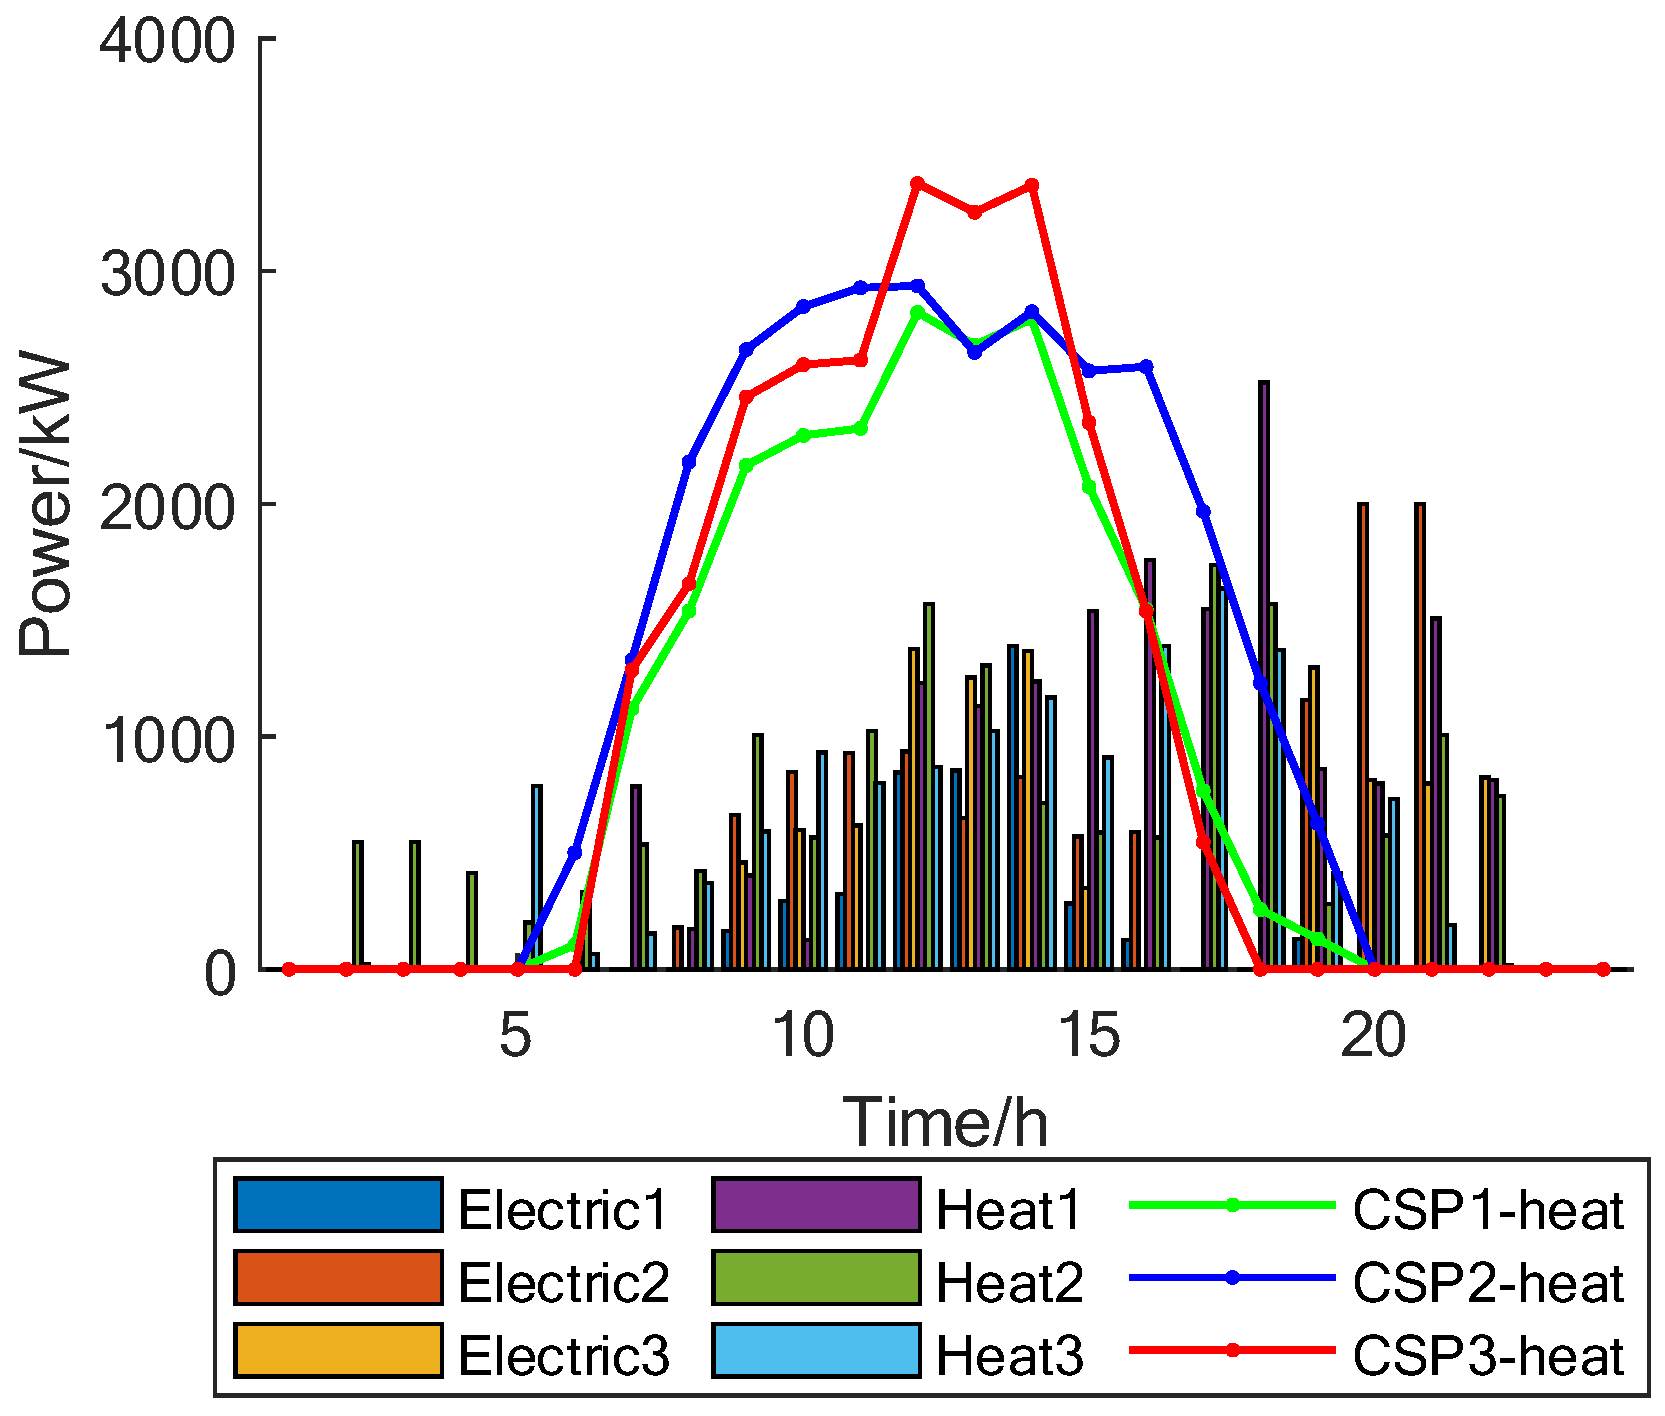
4.2.4. PHP and CSP Optimization Analysis

The percentage of PHP oxygen supply is shown in Table 10. VPSA of IES1 decreases supply electric by 9553.79 kW, the VPSA of IES2 decreases supply electric by 4765.29 kW, and the VPSA of IES3 decreases supply electric by 5730.43 kW. The combined oxygen supply mode of PHP-VPSA enables the IES cluster to have a greater dispatch margin. According to Table 6 and Table 7, it can be seen that the power purchase and operation cost of the IES cluster will be further reduced, and the low-carbon and economic efficiency will be improved.
Taking the CSP as an example, the dispatching result of CSP is shown in Figure 15, and the HS dispatching in CSP is shown in Figure 16. Compared to the traditional CHP, the flexibility of both is approximately the same. The low carbon and construction cost of CSP is higher than that of CHP, the energy supply cost is lower than that of CHP, and the IES cluster can reduce the cost of CSP through cost sharing.

5. Conclusions

This paper’s research context focused on Tibet’s energy development and energy demand. It constructed a novel IES based on a new complementary energy model, incorporating key factors such as energy sharing and clean energy unit integration. Moreover, this study applied the multi-Nash game and asymmetric profit allocation to the multi-energy sharing optimization of IES clusters, optimizing key indicators such as RE consumption rate, energy-sharing cost, and profit allocation, all of which are crucial to Tibet’s energy development. Its main conclusions are as follows:
(1)
To meet the demand for energy supply and energy development planning in Tibet, a new integrated energy system coupled with electricity, heat, and oxygen was proposed. Compared with Case 1, the operating cost, sharing cost, and discard RE rate of the strategy proposed in this paper were reduced by 31.53%, 99.36% and 3.02%, respectively.
(2)
Based on the multi-Nash game theory, multi-Nash games were conducted on the sharing prices of electricity, oxygen, and hydrogen to reduce by 60.52% for the energy sharing cost. The simulation results verified the efficiency of multi-Nash games, reducing the cluster’s operation cost.
(3)
To ensure the profit allocation is balanced by cluster, an asymmetric profit allocation was proposed; this effectively motivated each IES through the reasonable allocation of profit, thereby reducing the cluster’s costs and maximizing its benefits.
Building upon the existing literature, future research may focus on energy storage sharing and bi-level game theory for economic scheduling.

Author Contributions

Conceptualization, R.Z.; Methodology, S.C.; Software, Y.G.; Validation, Y.G.; Resources, P.W.; Data curation, P.W.; Writing—original draft, S.C.; Writing—review & editing, R.Z. All authors have read and agreed to the published version of the manuscript.

Funding

This work was supported by the Open Research Fund from the Research Center of Civil, Hydraulic and Power Engineering of Tibet (XZA202305CHP2006B), the National Natural Science Foundation of China (52167015) and Tibet Agriculture and Animal Husbandry University Postgraduate education and innovation plan project (YJS2023-48).

Institutional Review Board Statement

We exclude this statement because the study did not require ethical approval.

Informed Consent Statement

We exclude this statement because the study did not involve humans.

Data Availability Statement

No research data to share.

Conflicts of Interest

The authors declare that they have no known competing financial interest or personal relationships that could have appeared to influence the work reported in this paper.

Nomenclatures

(RE)renewable energy(P2H)power to hydrogen
(IES)integrated energy system(PEM)proton exchange membrane
(HP)hydropower(HFC)hydrogen fuel cells
(CSP)concentrated solar power(CHP)cogeneration of heat and power
(PHP)power to hydrogen to power(VPSA)vacuum pressure swing adsorption
(CCP)cloud computing platform(HEVs)hydrogen energy vehicles
(ADMM)alternating direction method of multipliers(EF)electric furnace
(GP)grid power(P2G)power to gas
(APA)asymmetric profit allocation(EPA)equitable profit allocation

Appendix A

Figure A1. IES1 dispatching results.
Processes 11 02027 g0a1Processes 11 02027 g0a1a
Figure A2. IES2 dispatching results.
Processes 11 02027 g0a2Processes 11 02027 g0a2a
Figure A3. IES3 dispatching results.
Processes 11 02027 g0a3Processes 11 02027 g0a3a

References

  1. Jia, J.C.; Zhao, B.; Luo, X.Z.; Dong, W.G.; Liu, W.L. Research on the security and stability characteristics of central tibet power grid after qinghai-tibet hvdc putting into operation. Power Syst. Prot. Control 2014, 42, 104–109. [Google Scholar]
  2. State Grid Tibet Electric Power Co., Ltd. Southwest Electric Power Design Institute the 14th Five Year Plan for the Development of Tibet Power Grid; State Grid Tibet Electric Power Co., Ltd.: Lhasa, China, 2020. (In Chinese) [Google Scholar]
  3. GB/T 35414-2017; Requirements of Oxygen Conditioning for Indoor Oxygen Diffusion in Plateau Area. The Standardization Administration of China: Beijing, China, 2017. (In Chinese)
  4. DJB 540005-2018; Specification for Engineering Construction and Acceptance of Civil Oxygen Supply in Tibet. Department of Housing and Urban Rural Development of the Tibet Autonomous Region: Tibet, China, 2018. (In Chinese)
  5. DJB 540004-2018; Design Standard for Engineering of Civil Oxygen Supply in Tibet. Department of Housing and Urban Rural Development of the Tibet Autonomous Region: Tibet, China, 2018. (In Chinese)
  6. Nastasi, B.; Mazzoni, S. Renewable Hydrogen Energy Communities layouts towards off-grid operation. Energy Convers. Manag. 2023, 291, 117293. [Google Scholar] [CrossRef]
  7. Wang, X.; Zhao, H.; Lu, H.; Zhang, Y.; Wang, Y.; Wang, J. Decentralized coordinated operation model of VPP and P2H systems based on stochastic-bargaining game considering multiple uncertainties and carbon cost. Appl. Energy 2022, 312, 118750. [Google Scholar] [CrossRef]
  8. Zhang, J.; Cheng, C.; Yu, S.; Shen, J.; Wu, X.; Su, H. Preliminary feasibility analysis for remaking the function of cascade hydropower stations to enhance hydropower flexibility: A case study in China. Energy 2022, 255, 125163. [Google Scholar] [CrossRef]
  9. Ju, L.; Zhao, R.; Tan, Q.; Lu, Y.; Tan, Q.; Wang, W. A multi-objective robust scheduling model and solution algorithm for a novel virtual power plant connected with power-to-gas and gas storage tank considering uncertainty and demand response. Appl. Energy 2019, 250, 1336-55. [Google Scholar] [CrossRef]
  10. Zhao, B.C.; Cheng, M.S.; Liu, C.; Dai, Z.M. System-level performance optimization of molten-salt packed-bed thermal energy storage for concentrating solar power. Appl. Energy 2018, 226, 225–239. [Google Scholar] [CrossRef]
  11. Solaymani, S. A prediction on the impacts of China’s national emissions trading scheme on CO2 emissions from electricity generation. Front. Energy Res. 2022, 10, 956280. [Google Scholar] [CrossRef]
  12. Li, Y.; Meng, F.; Chen, Y.; Wu, Q.; Dan, Z.; Wang, S. Research and development Status of oxygen production technology in the Tibet. Low Temp. Spec. Gases 2021, 39, 5–9+31. (In Chinese) [Google Scholar]
  13. Li, W.; Yu, B.; Tian, G.; Han, Z. Design of diffused oxygen supply scheme in plateau area. Med. Gases Eng. 2018, 3, 15–17. [Google Scholar]
  14. Li, J.; Yin, Y.; Zhou, K.; Wang, F.; Ren, C. Progress of Oxygen Generation Technology by Water Electrolysis in Space Station. Space Med. Med. Eng. 2013, 26, 215–220. (In Chinese) [Google Scholar]
  15. Shang, H. China’s first renewable energy + PEM hydrogen production + hydrogenation integrated station has been successfully put into trial operation. Shanghai Energy Sav. 2022, 1418, 1149. (In Chinese) [Google Scholar]
  16. Wang, C.; Chen, Y.; Wen, F. Improvement and perfection of carbon emission flow theory in power systems. Power Syst. Technol. 2022, 46, 1683–1693. [Google Scholar]
  17. Bai, X.; Liu, L.; Ju, J.; Zhong, X.; Zhou, Y.; Lin, J.; Huang, Y.; Wu, N.; Xie, S.; Zhao, Y. Distributed optimization method for multi-area integrated energy systems considering demand response. Front. Energy Res. 2022, 10, 975214. [Google Scholar] [CrossRef]
  18. Jiang, A.; Yuan, H.; Li, D. Energy management for a community-level integrated energy system with photovoltaic prosumers based on bargaining theory. Energy 2021, 225, 120272. [Google Scholar] [CrossRef]
  19. He, J.; Li, Y.; Li, H.; Tong, H.; Yuan, Z.; Yang, X.; Huang, W. Application of game theory in integrated energy system systems: A review. IEEE Access 2020, 8, 93380–93397. [Google Scholar] [CrossRef]
  20. Ma, T.; Pei, W.; Xiao, H. Cooperative Operation Method for Wind-solar-hydrogen Multi-agent Energy System Based on Nash Bargaining Theory. Proc. CSEE 2021, 41, 25–39+395. [Google Scholar]
  21. Chen, W.; Wang, J.; Yu, G.; Chen, J.; Hu, Y. Research on day-ahead transactions between multi-microgrid based on cooperative game model. Appl. Energy 2022, 316, 119106. [Google Scholar] [CrossRef]
  22. Zhong, X.; Liu, Y.; Xie, K.; Xie, S. A Local Electricity and Carbon Trading Method for Multi-Energy Microgrids Considering Cross-Chain Interaction. Sensors 2022, 22, 6935. [Google Scholar] [CrossRef]
  23. Wayes, T.; Chau, Y.; Hamed, M.R.; Tapan, S.; Vincent, P.H.; Wood, K.L. Transforming energy networks via peer to peer energy trading: Potential of game theoretic approaches. IEEE Signal Process. Mag. 2018, 35, 90–111. [Google Scholar]
  24. Tushar, W.; Saha, T.K.; Yuen, C.; Smith, D.; Poor, H.V. Peer-to-peer trading in electricity networks: An overview. IEEE Trans. Smart Grid 2020, 11, 3185–3200. [Google Scholar] [CrossRef] [Green Version]
  25. Hong, Q.; Meng, F.; Liu, J.; Bo, R. A bilevel game-theoretic decision-making framework for strategic retailers in both local and wholesale electricity markets. Appl. Energy 2023, 330, 120311. [Google Scholar] [CrossRef]
  26. Wang, H.; Wang, C.; Zhao, L.; Ji, X.; Yang, C.; Wang, J. Multi-Micro-Grid Main Body Electric Heating Double-Layer Sharing Strategy Based on Nash Game. Electronics 2023, 12, 214. [Google Scholar] [CrossRef]
  27. Lu, A.; Jie, D.; Chow, M.Y.; Duel-Hallen, A. A Distributed and Resilient Bargaining Game for Weather-Predictive Microgrid Energy Cooperation. IEEE Trans. Ind. Inform. 2019, 15, 4721–4730. [Google Scholar]
  28. Siqin, Z.; Niu, D.; Li, M.; Gao, T.; Lu, Y.; Xu, X. Distributionally robust dispatching of multi-community integrated energy system considering energy sharing and profit allocation. Appl. Energy 2022, 312, 119202. [Google Scholar] [CrossRef]
  29. Cui, S.; Wang, Y.W.; Liu, X.K.; Wang, Z.; Xiao, J.W. Economic storage sharing framework: Asymmetric bargaining based energy cooperation. IEEE Trans. Ind. Inform. 2021, 17, 7489–7500. [Google Scholar] [CrossRef]
  30. Gu, X.; Wang, Q.; Hu, Y.; Zhu, Y.; Ge, Z. Distributed Low-carbon Optimal Operation Strategy of Multi-microgrids Integrated Energy System Based on Nash Bargaining. Power Syst. Technol. 2022, 46, 1464–1482. [Google Scholar] [CrossRef]
  31. Cui, S.; Zhu, R.; Gao, Y. Distributionally Robust Optimization of an Integrated Energy System Cluster Considering the Oxygen Supply Demand and Multi-Energy Sharing. Energies 2022, 15, 8723. [Google Scholar] [CrossRef]
  32. Zhao, J.; Yuan, Y.; Fu, Z.; Sun, C.J.; Qian, K.; Xu, W.C. Reliability assessment of wind-PV hybrid generation system based on Copula theory. Electr. Power Autom. Equip. 2013, 33, 124–129. (In Chinese) [Google Scholar]
Figure 1. Multi-energy sharing architecture.
Processes 11 02027 g001
Figure 2. IES architecture.
Processes 11 02027 g002
Figure 3. Optimization flowchart.
Processes 11 02027 g003
Figure 4. IES1 loads, RE and HEVs.
Processes 11 02027 g004
Figure 5. IES2 loads, RE and HEVs.
Processes 11 02027 g005
Figure 6. IES3 loads, RE and HEVs.
Processes 11 02027 g006
Figure 7. Comparison of energy supply prices.
Processes 11 02027 g007
Figure 8. HGS optimization comparison.
Processes 11 02027 g008
Figure 9. Electric sharing price and cluster supply price.
Processes 11 02027 g009
Figure 10. Electric sharing and iteration.
Processes 11 02027 g010
Figure 11. The oxygen sharing price and the average price of cluster supply oxygen.
Processes 11 02027 g011
Figure 12. Oxygen sharing and iteration.
Processes 11 02027 g012
Figure 13. The hydrogen price.
Processes 11 02027 g013
Figure 14. Hydrogen sharing and iteration.
Processes 11 02027 g014Processes 11 02027 g014a
Figure 15. Cluster CSP scheduling results.
Processes 11 02027 g015
Figure 16. Cluster HS scheduling results.
Processes 11 02027 g016
Table 1. Electric price of the GP.
Time/(h)
1–78–1112–1415–1819–2223–24
Purchase/USD0.060.100.170.100.170.06
sale/USD0.030.060.080.060.080.03
Table 2. Unit parameters.
EquipmentEfficiencyEnergy ConsumptionClimbing Power
P2H0.735 (kW/kg)20%
HFC0.953.3 (kW/m3)20%
VPSA0.850.45 (kW/m3)20%
HP//20%
WT///
PV///
HGS0.95/250 (m3/h)
Table 3. CSP parameters.
EquipmentEfficiencyHeated Fluid TransmissionClimbing Power
CSP0.8 (electric)0.7220%
HS0.95/2000 (kW/h)
Table 4. CSP installed capacity.
EquipmentInstalled Capacity/(kW)
IES1IES2IES3
CSP P C S P 1 . e max P C S P 2 . e max P C S P 3 . e max
HS105105105
Table 5. Other unit installed capacity.
VPSA
/(kW)
P2H
/(kW)
EF
/(kW)
HP
/(kW)
HGS
/(m3)
HFC
/(kW)
IES1100050002500600020003500
IES2100025001500300020001500
IES3100030001600450020001500
Table 6. Energy purchase in case 1–4.
Case 1 Case 2Case 3Case 4
electricity/kW224,977.92156,027.5518,139.5612,320.50
hydrogen/m30000
Table 7. Optimization results comparison of cases 1–4.
Case 1 Case 2Case 3Case 4
f r /USD−10,491.02−11,297.85−12,583.94−13,798.46
Electric supply income/USD21,435.6621,435.6621,435.6621,435.66
Hydrogen supply income/USD1631.514550.971594.934531.78
Heat supply income/USD13,268.818204.9613,268.817773.13
Supply oxygen income/USD98032.3244,886.349978.1844,407.60
Discard RE rate3.02%2%0%0%
Energy sharing cost/USD//2720.172825.54
Table 8. Optimization results of cases 5.
f e j /USD f h j /USD f DR j /USD f DRE j /USD f ES j /USDEnergy Sharing Cost/USDInstalled Permeability
IES1−1016.35−3882.2822.330274.8618.0233.56%
IES2−1175.26−3875.513.410279.5038.87%
IES3−1163.67−3527.2549.920211.8342.32%
Table 9. Profit allocation results in case 5.
IES1IES2IES3
S i 0.92340.89231.3267
APA/RMB6077.986354.548353.98
EPA/RMB6236.086928.987621.88
APA/USD839.05877.231153.24
EPA/USD860.87956.531052.18
Table 10. Percentage of PHP supply oxygen in case 5.
IES1IES2IES3
proportion68.35%61.16%56.71%
Disclaimer/Publisher’s Note: The statements, opinions and data contained in all publications are solely those of the individual author(s) and contributor(s) and not of MDPI and/or the editor(s). MDPI and/or the editor(s) disclaim responsibility for any injury to people or property resulting from any ideas, methods, instructions or products referred to in the content.

