
Formulation of Nucleic Acids by Encapsulation in Lipid Nanoparticles for Continuous Production of mRNA


Abstract
:1. Introduction
State-of-the-Art in Lipid Nanoparticle Manufacturing
2. Materials and Methods
2.1. pDNA Production
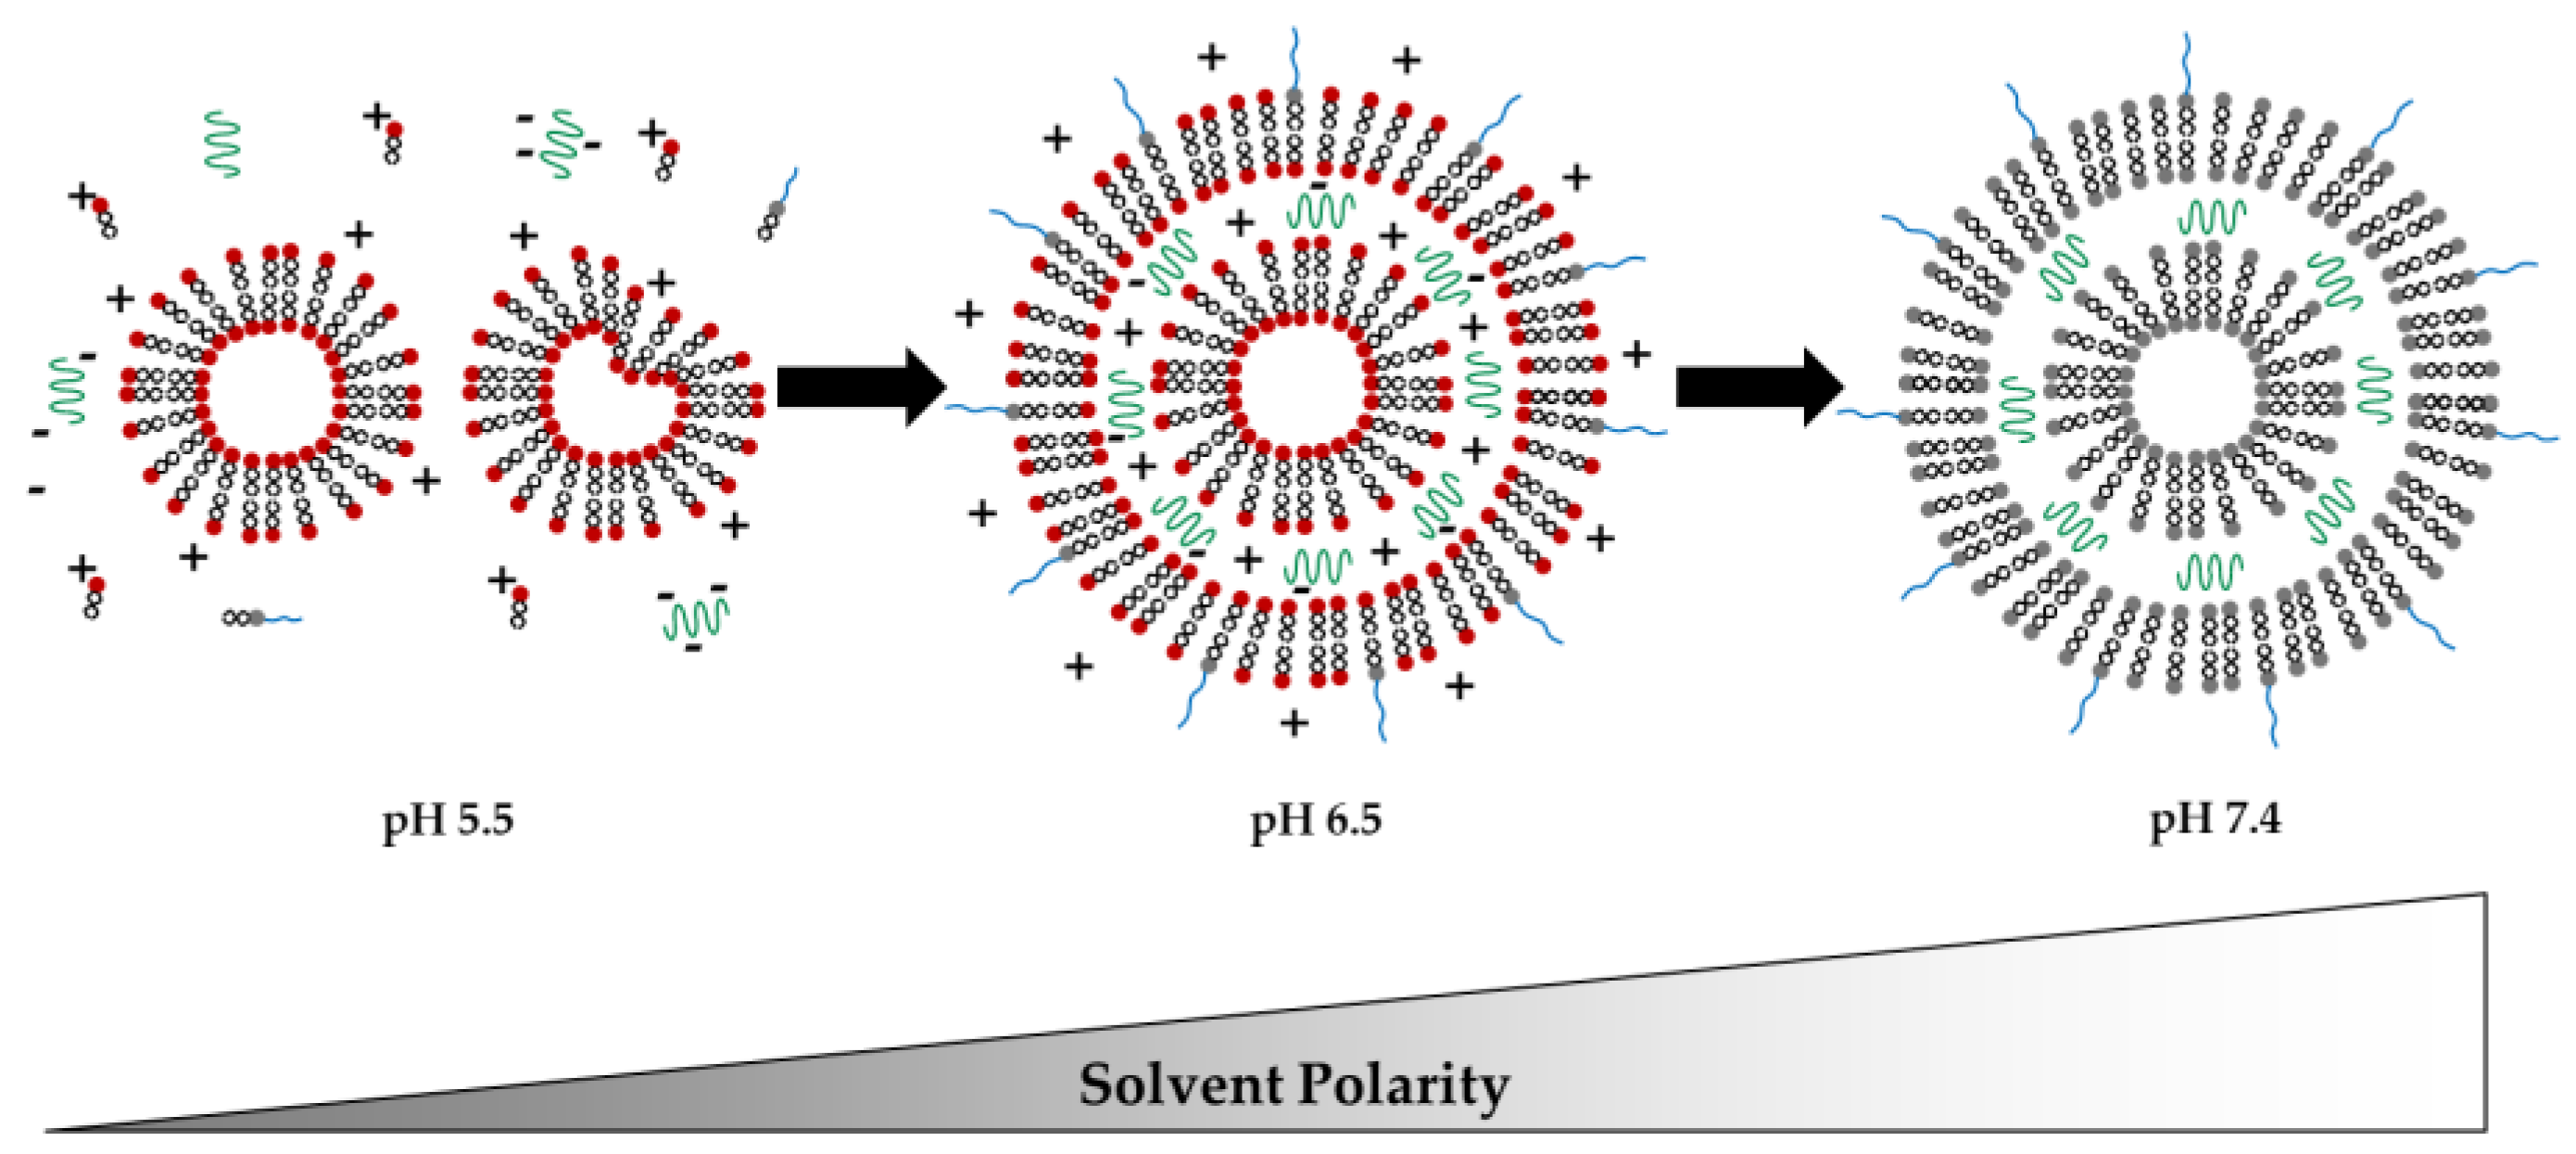
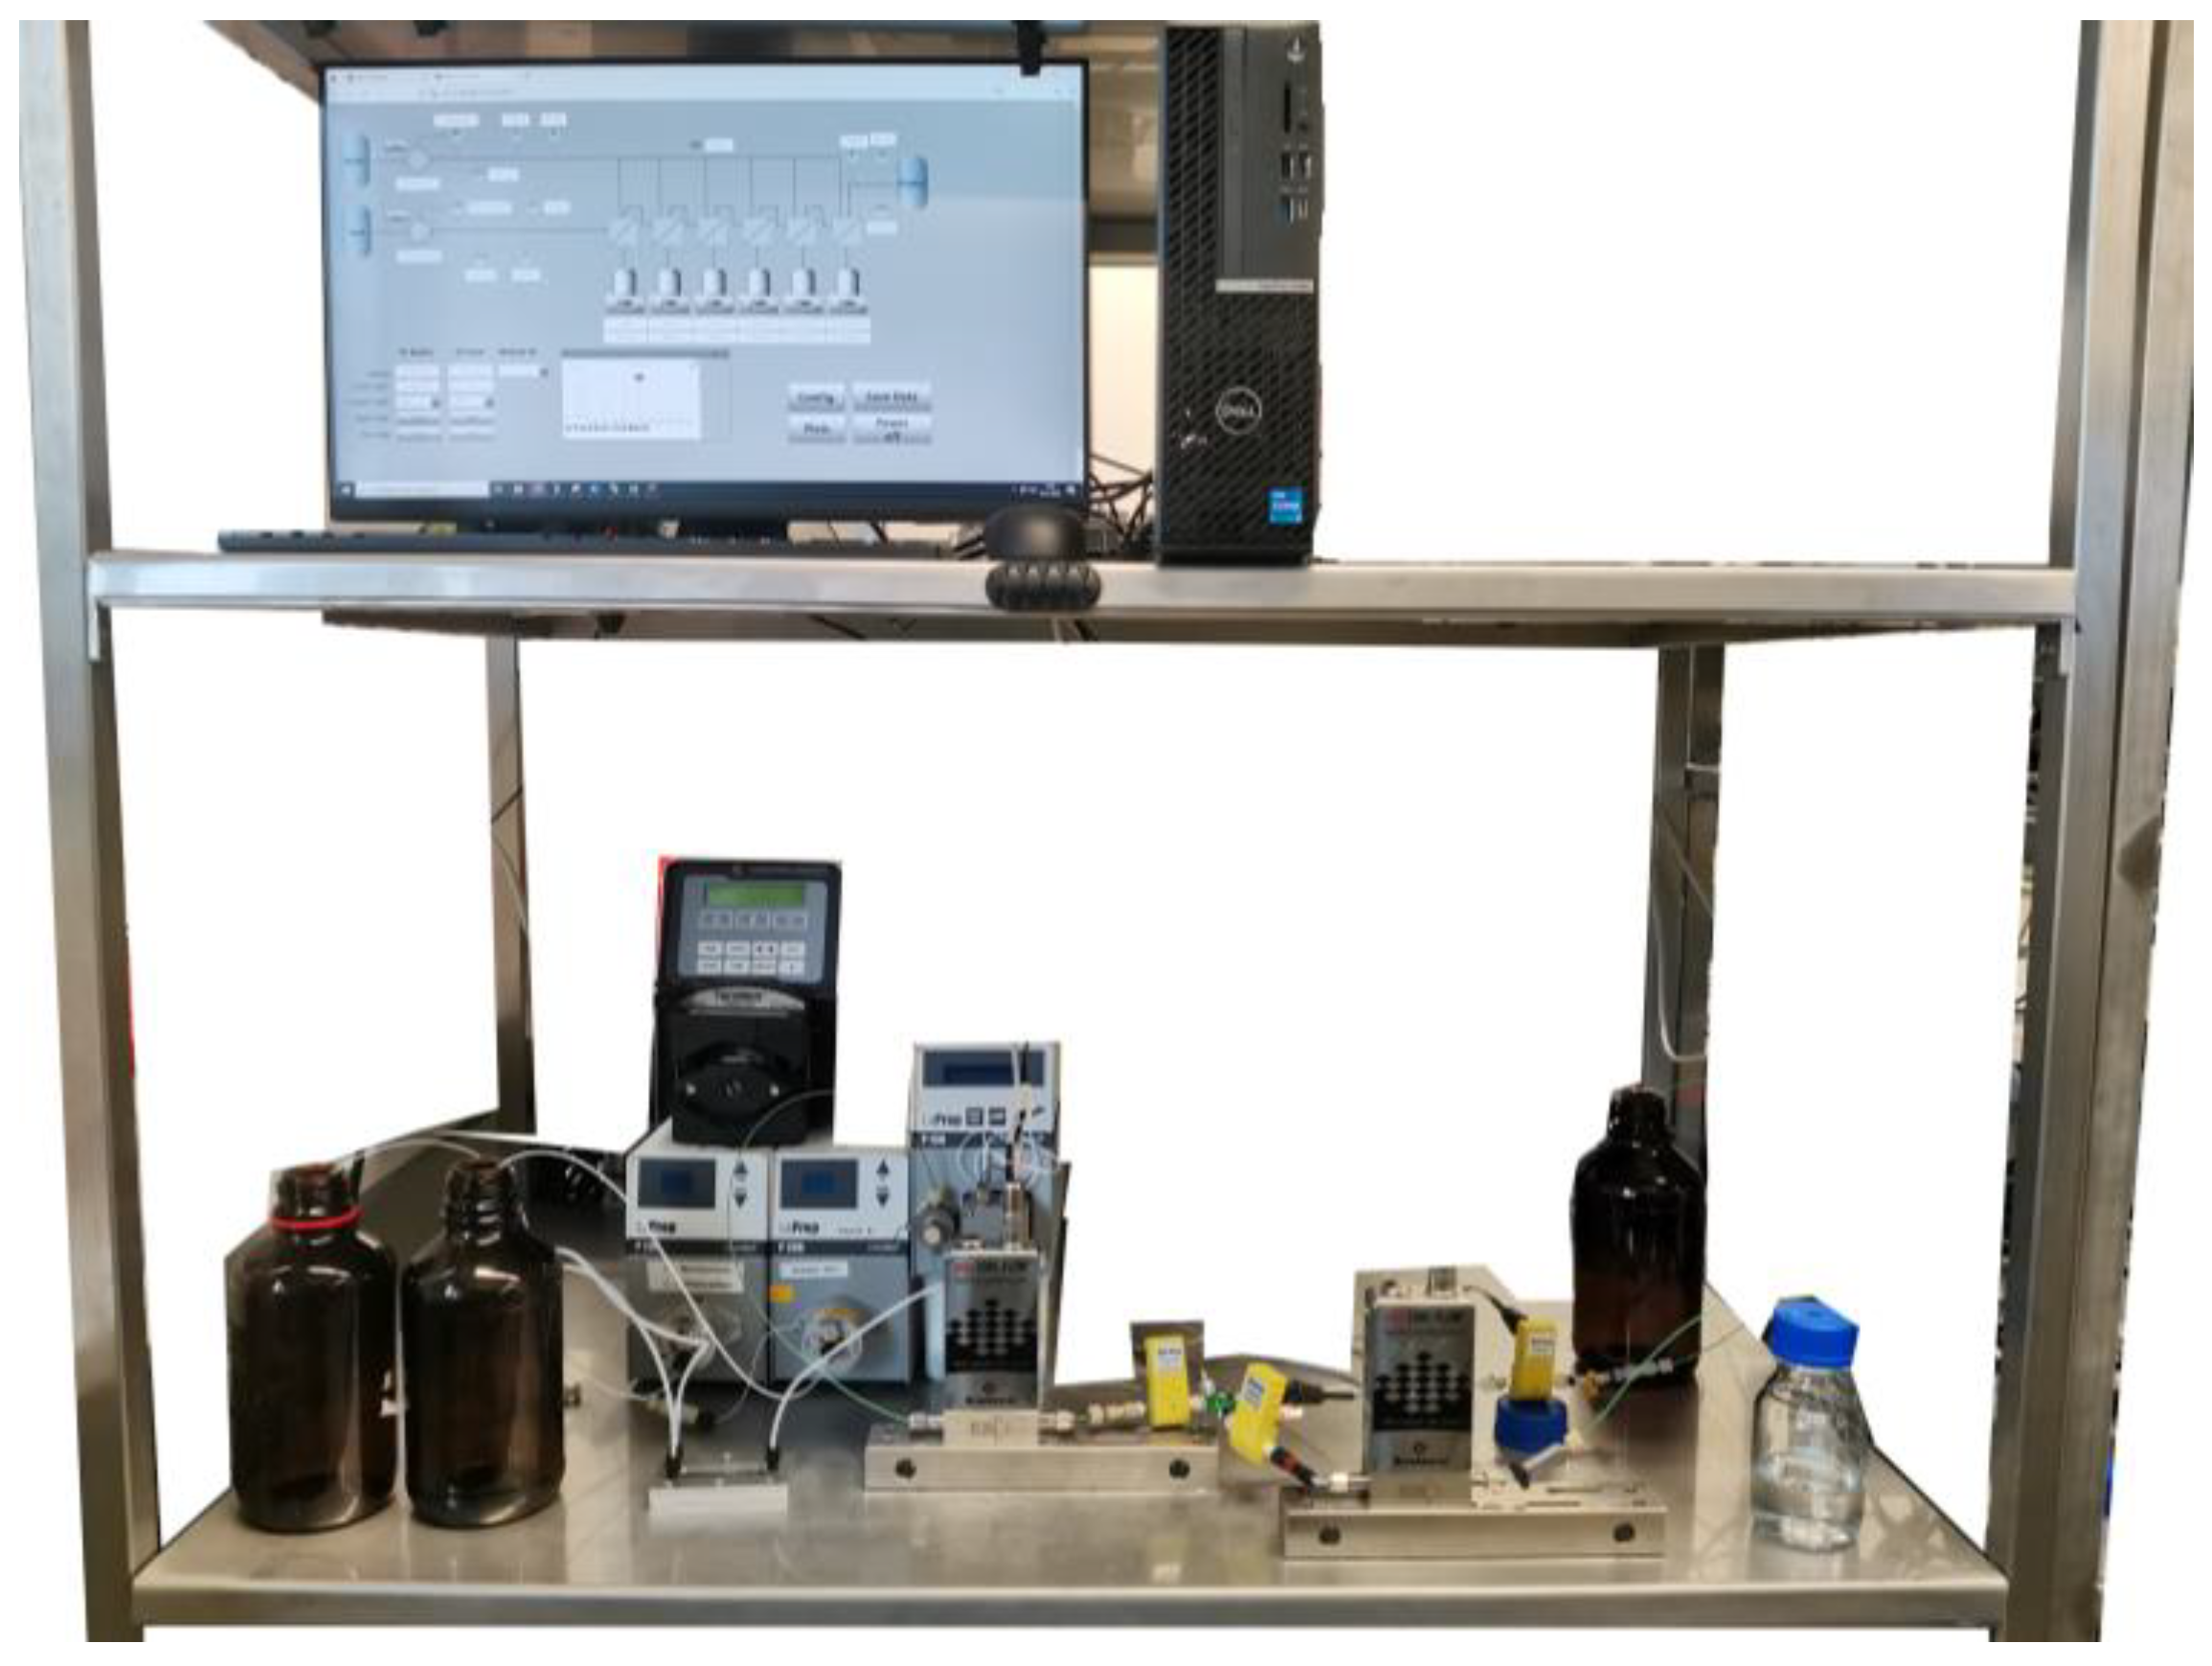
2.2. Formulation of LNPs
2.3. Analytics of LNP

| Quality Attribute | Acceptance Criteria |
|---|---|
| Encapsulation Efficiency | >80% |
| LNP Size | <100 nm |
| Polydispersity Index | <0.3 |
| LNP Charge | ±20 mV |
| Lipid Identity and Content, Lipid-related Impurities | N/A |
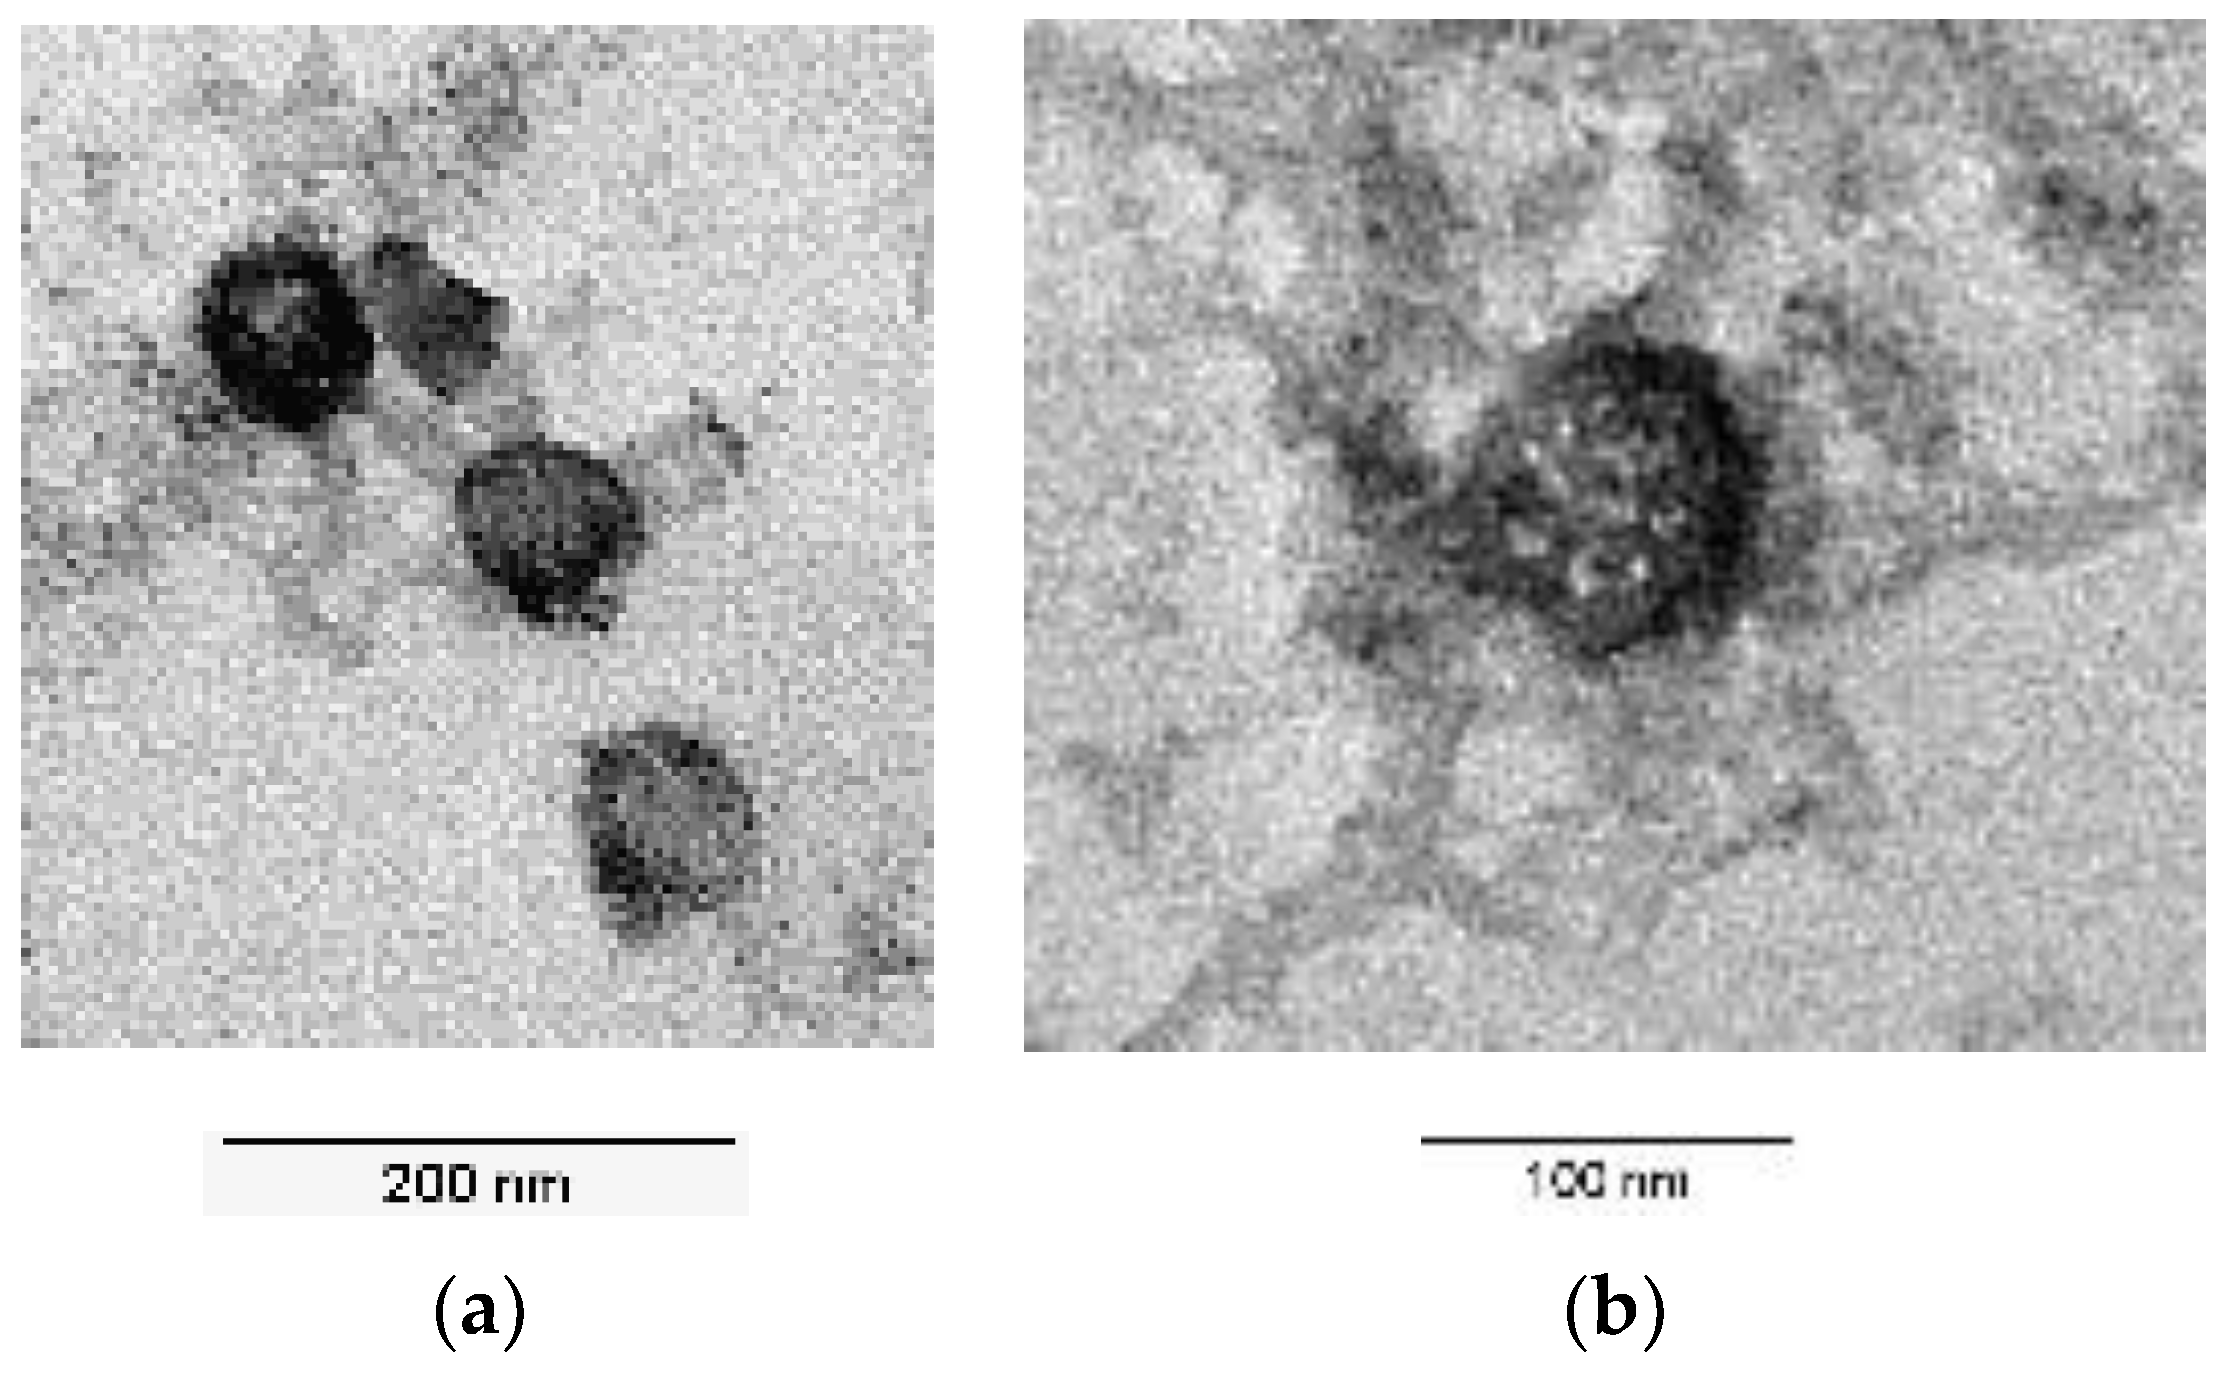
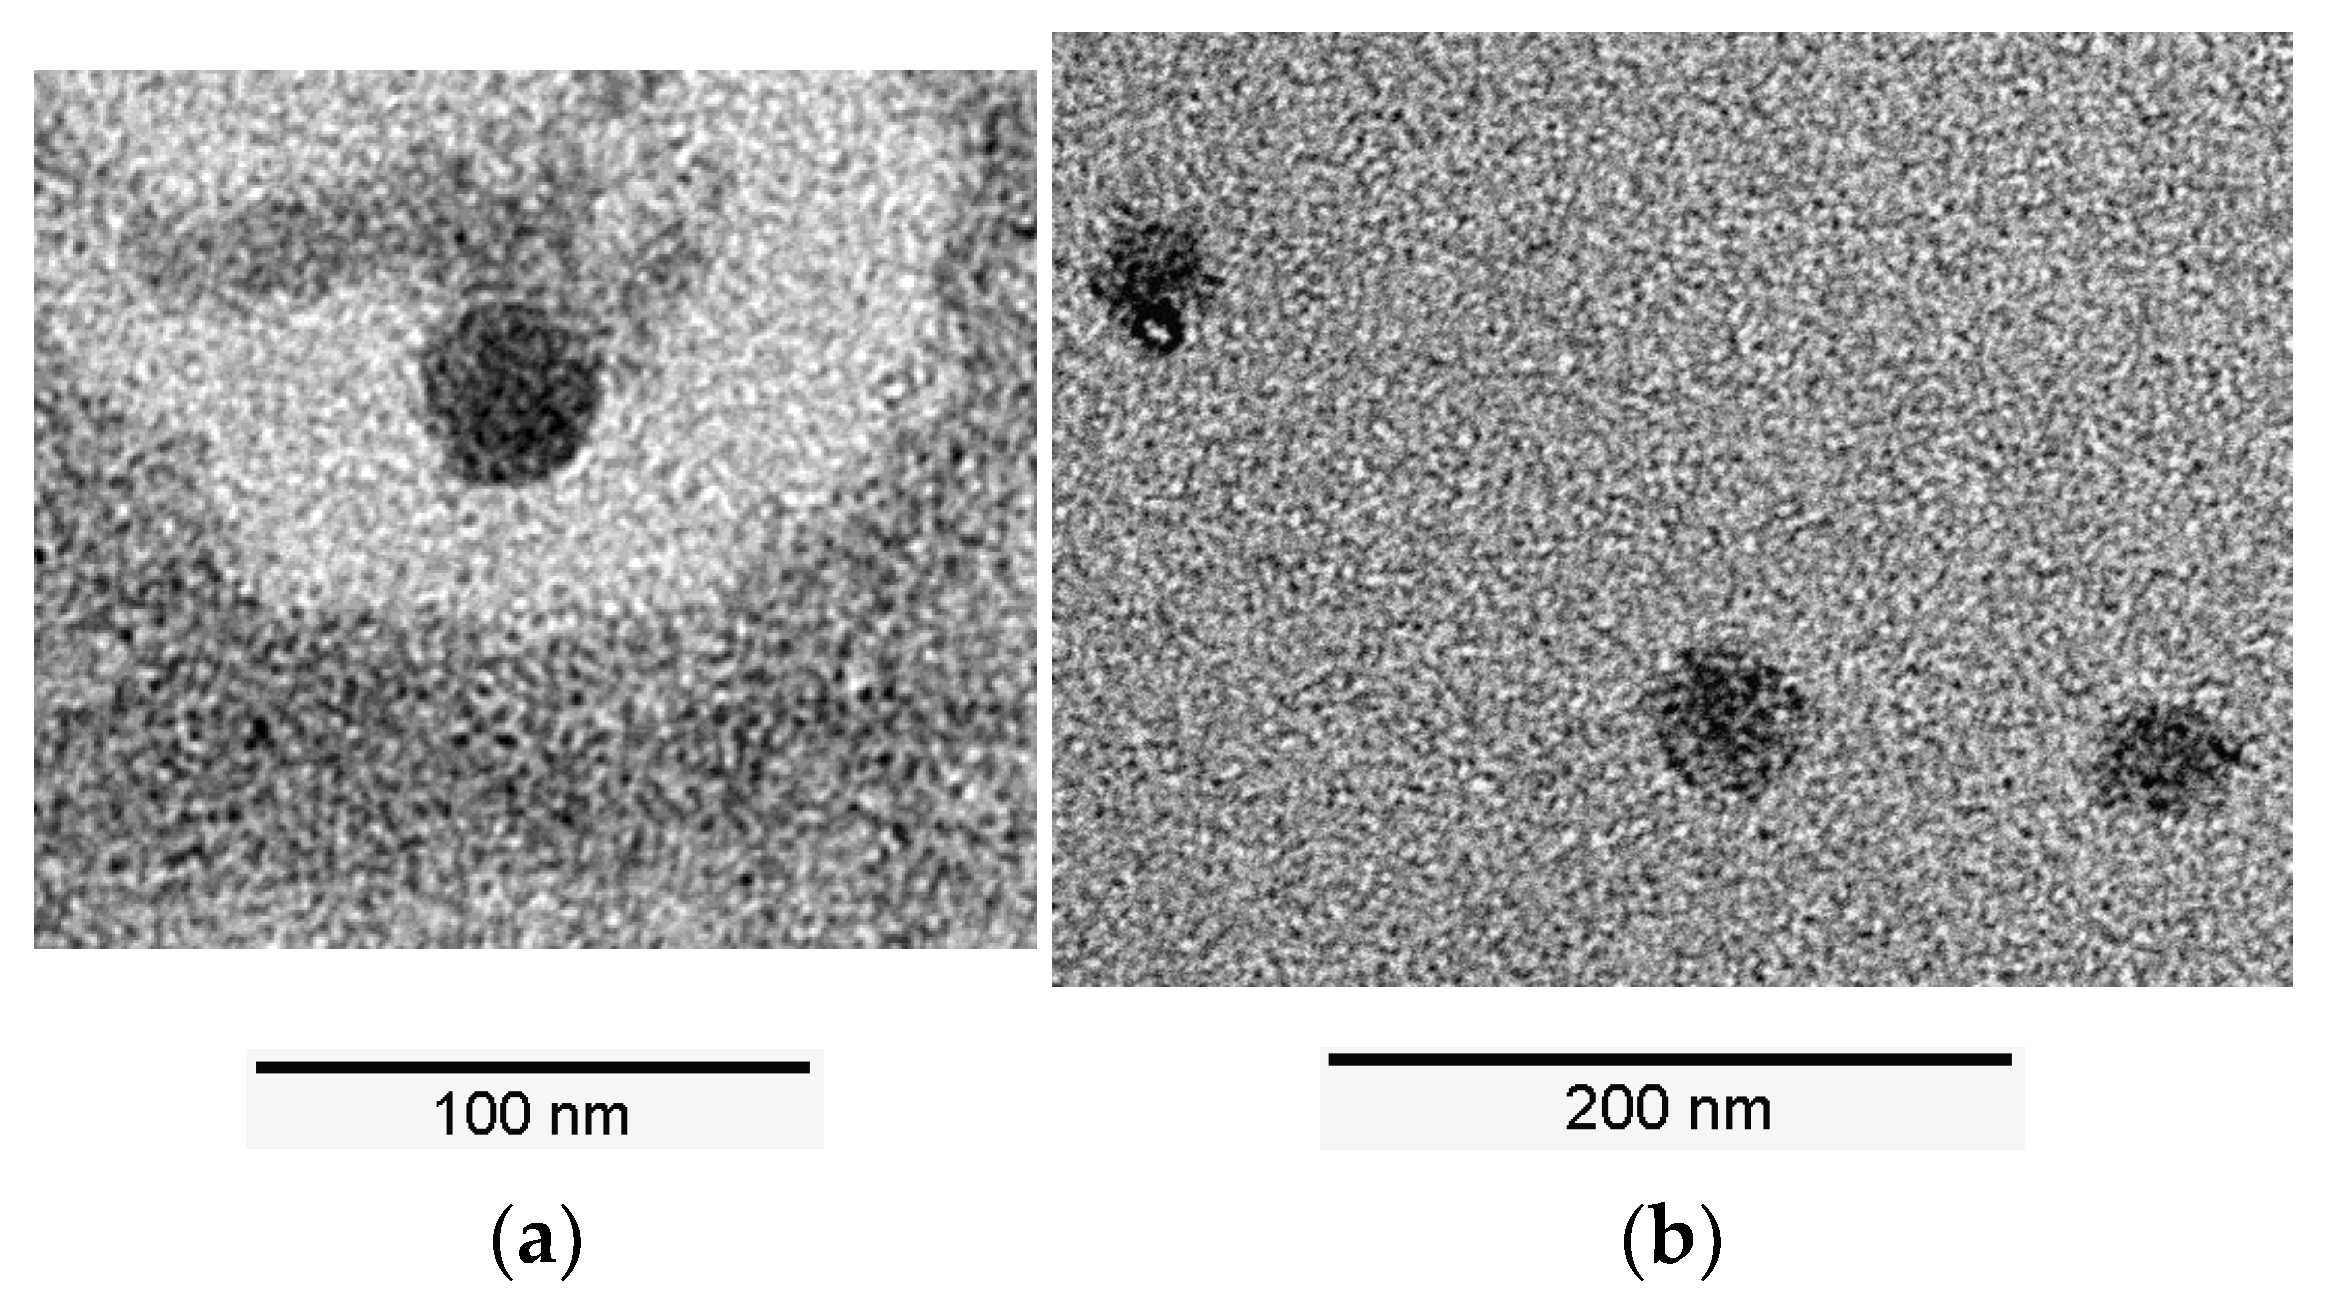
| LNP Morphology | N/A |
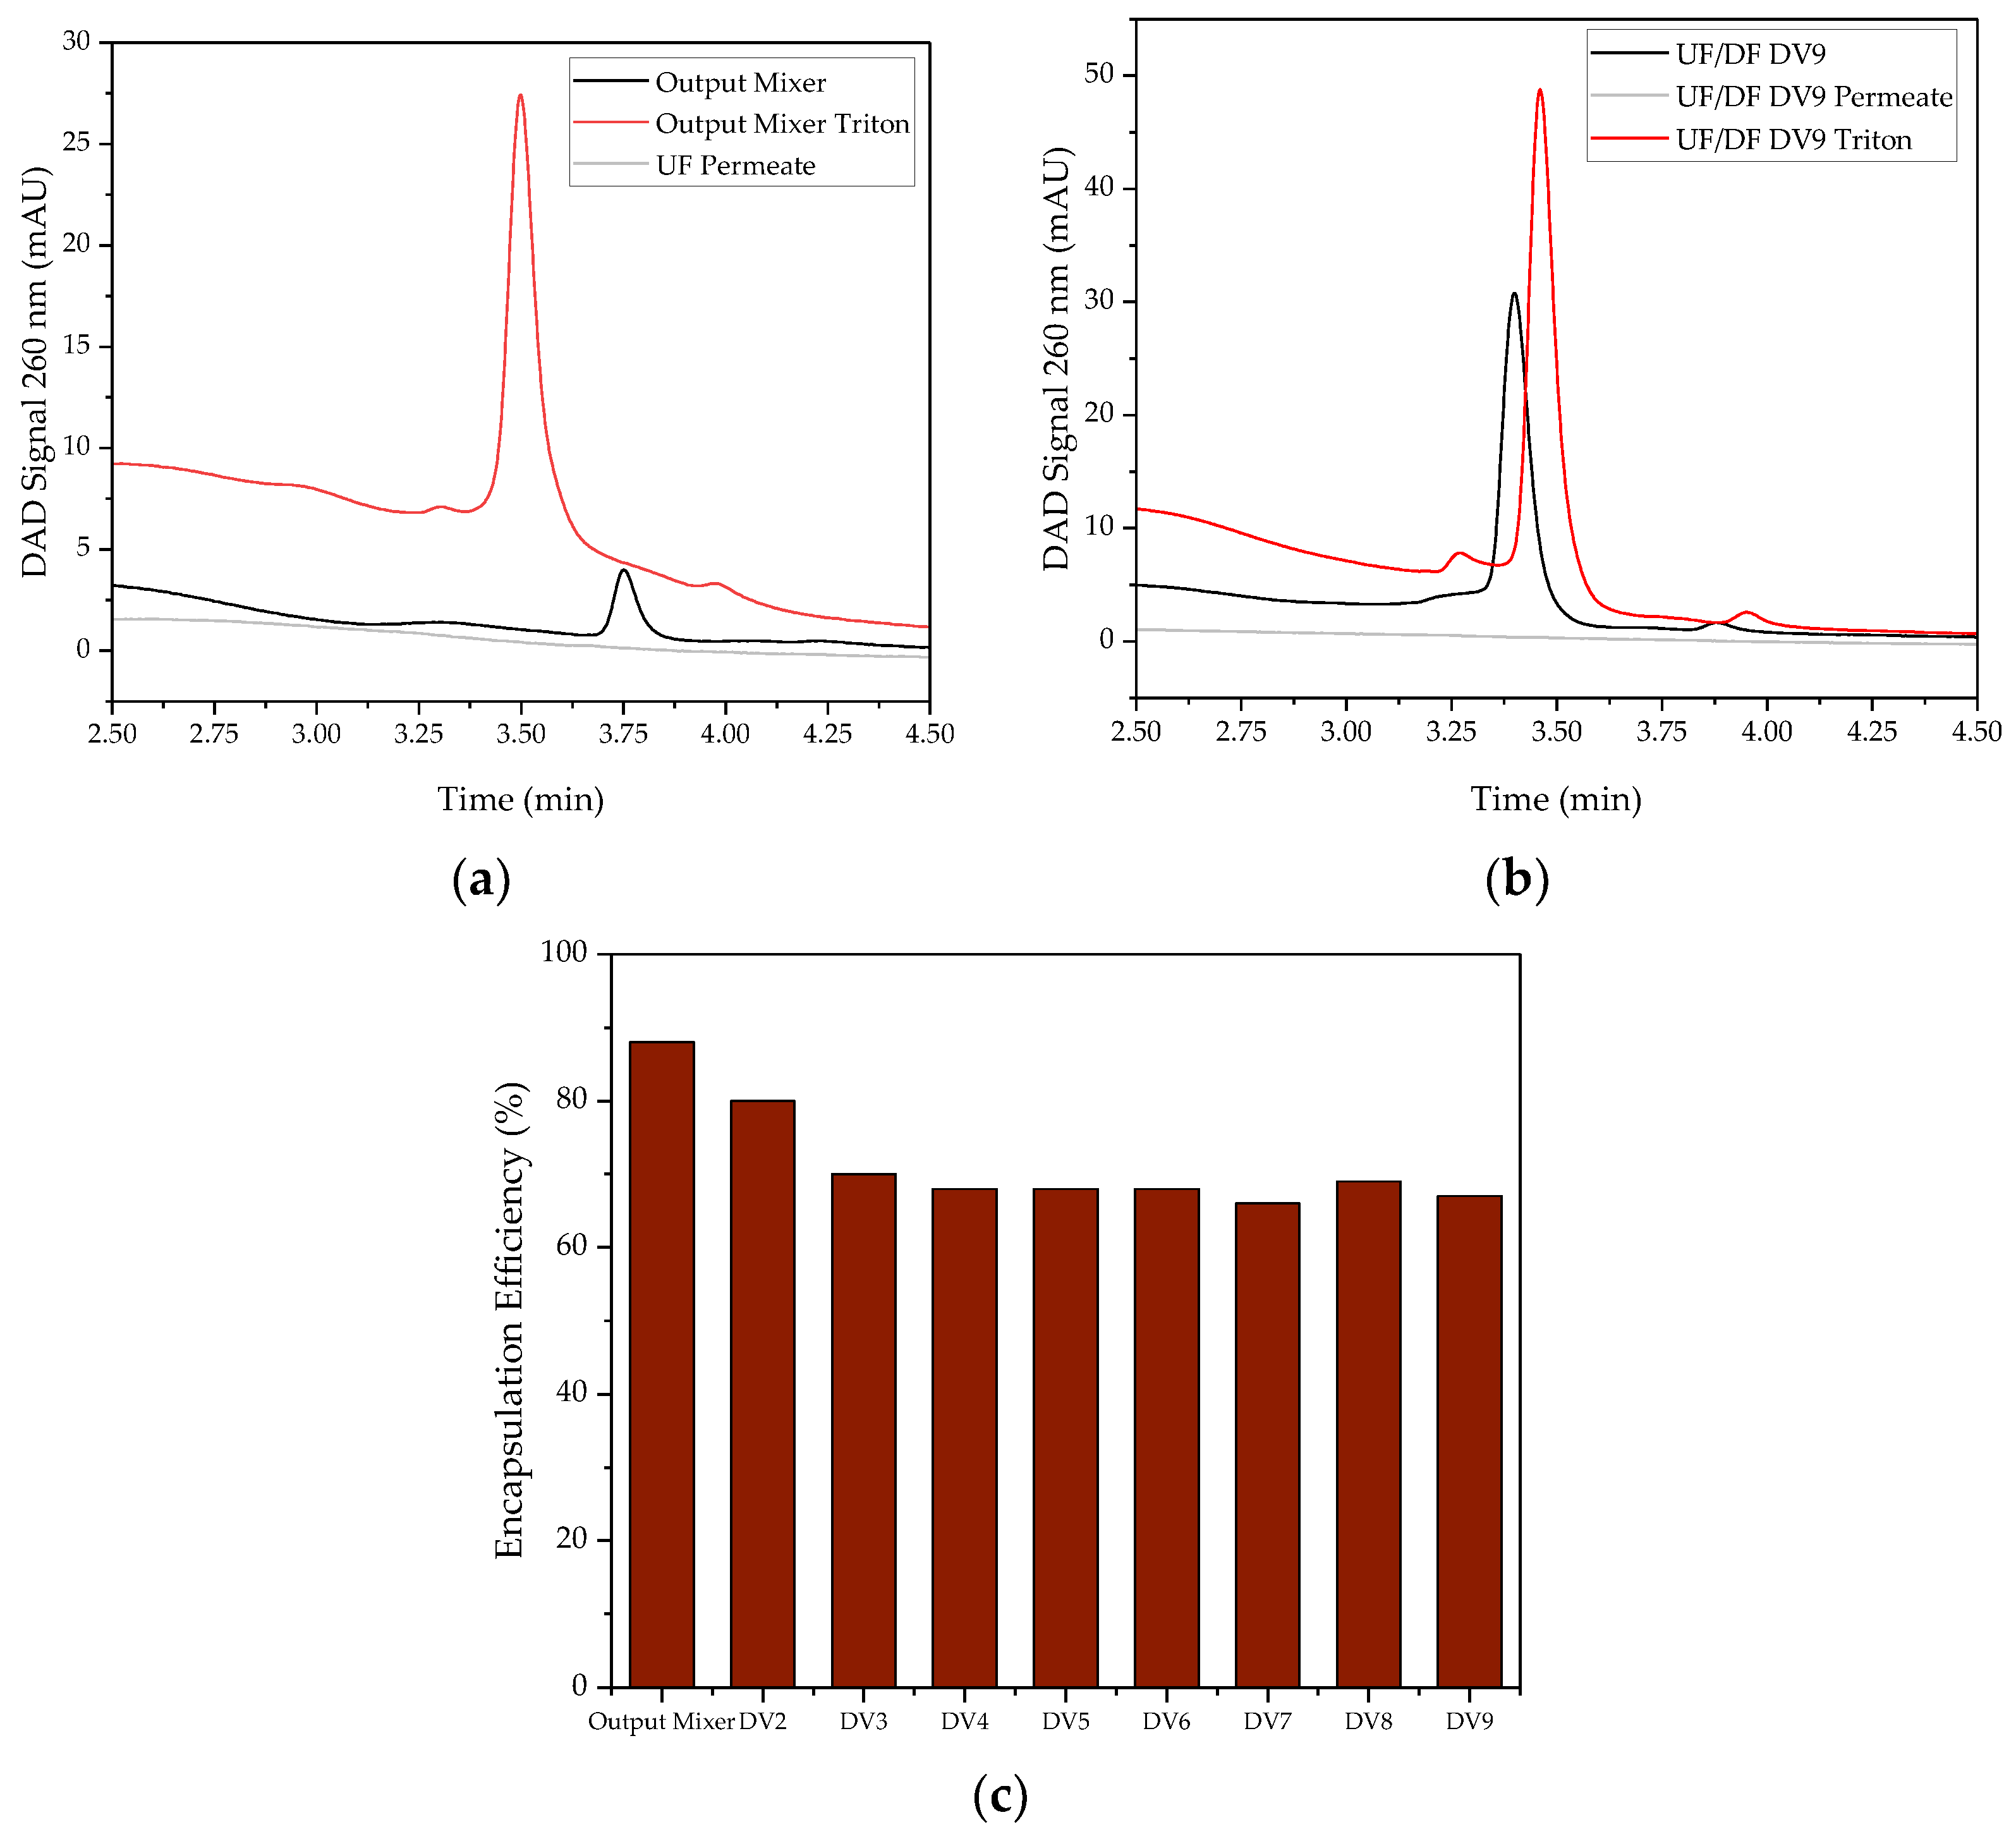
2.3.1. Encapsulation Efficiency
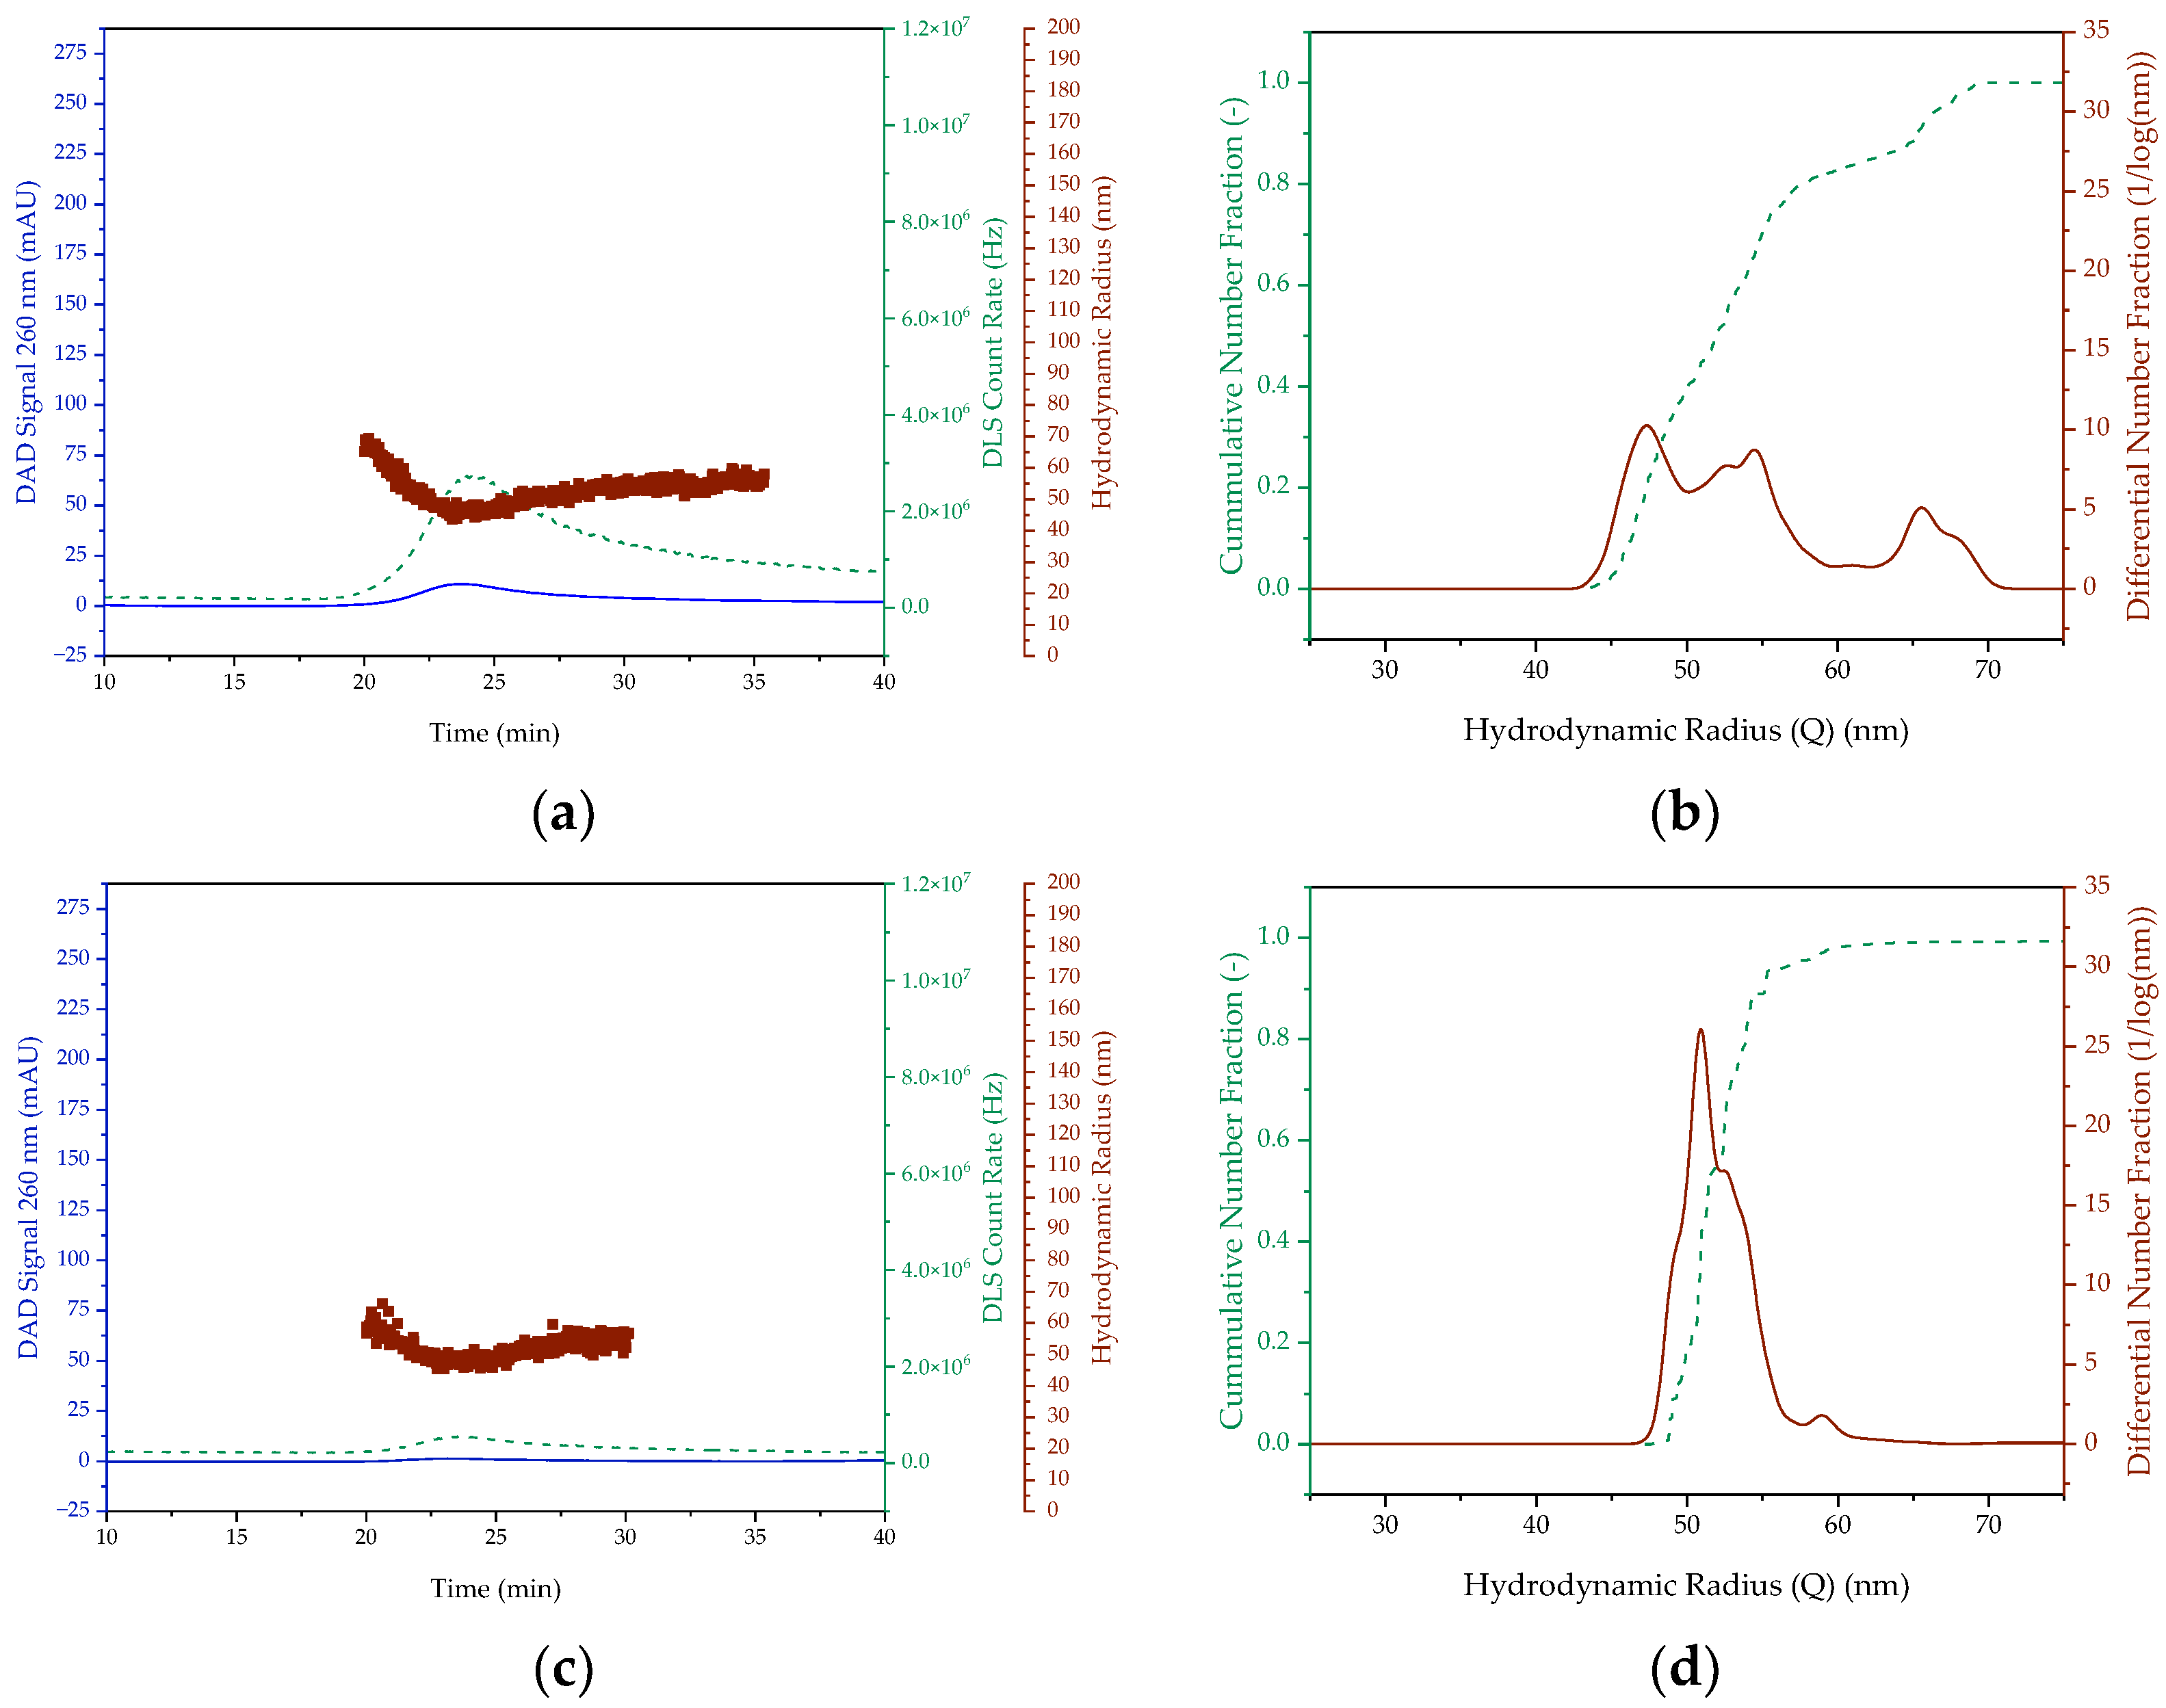
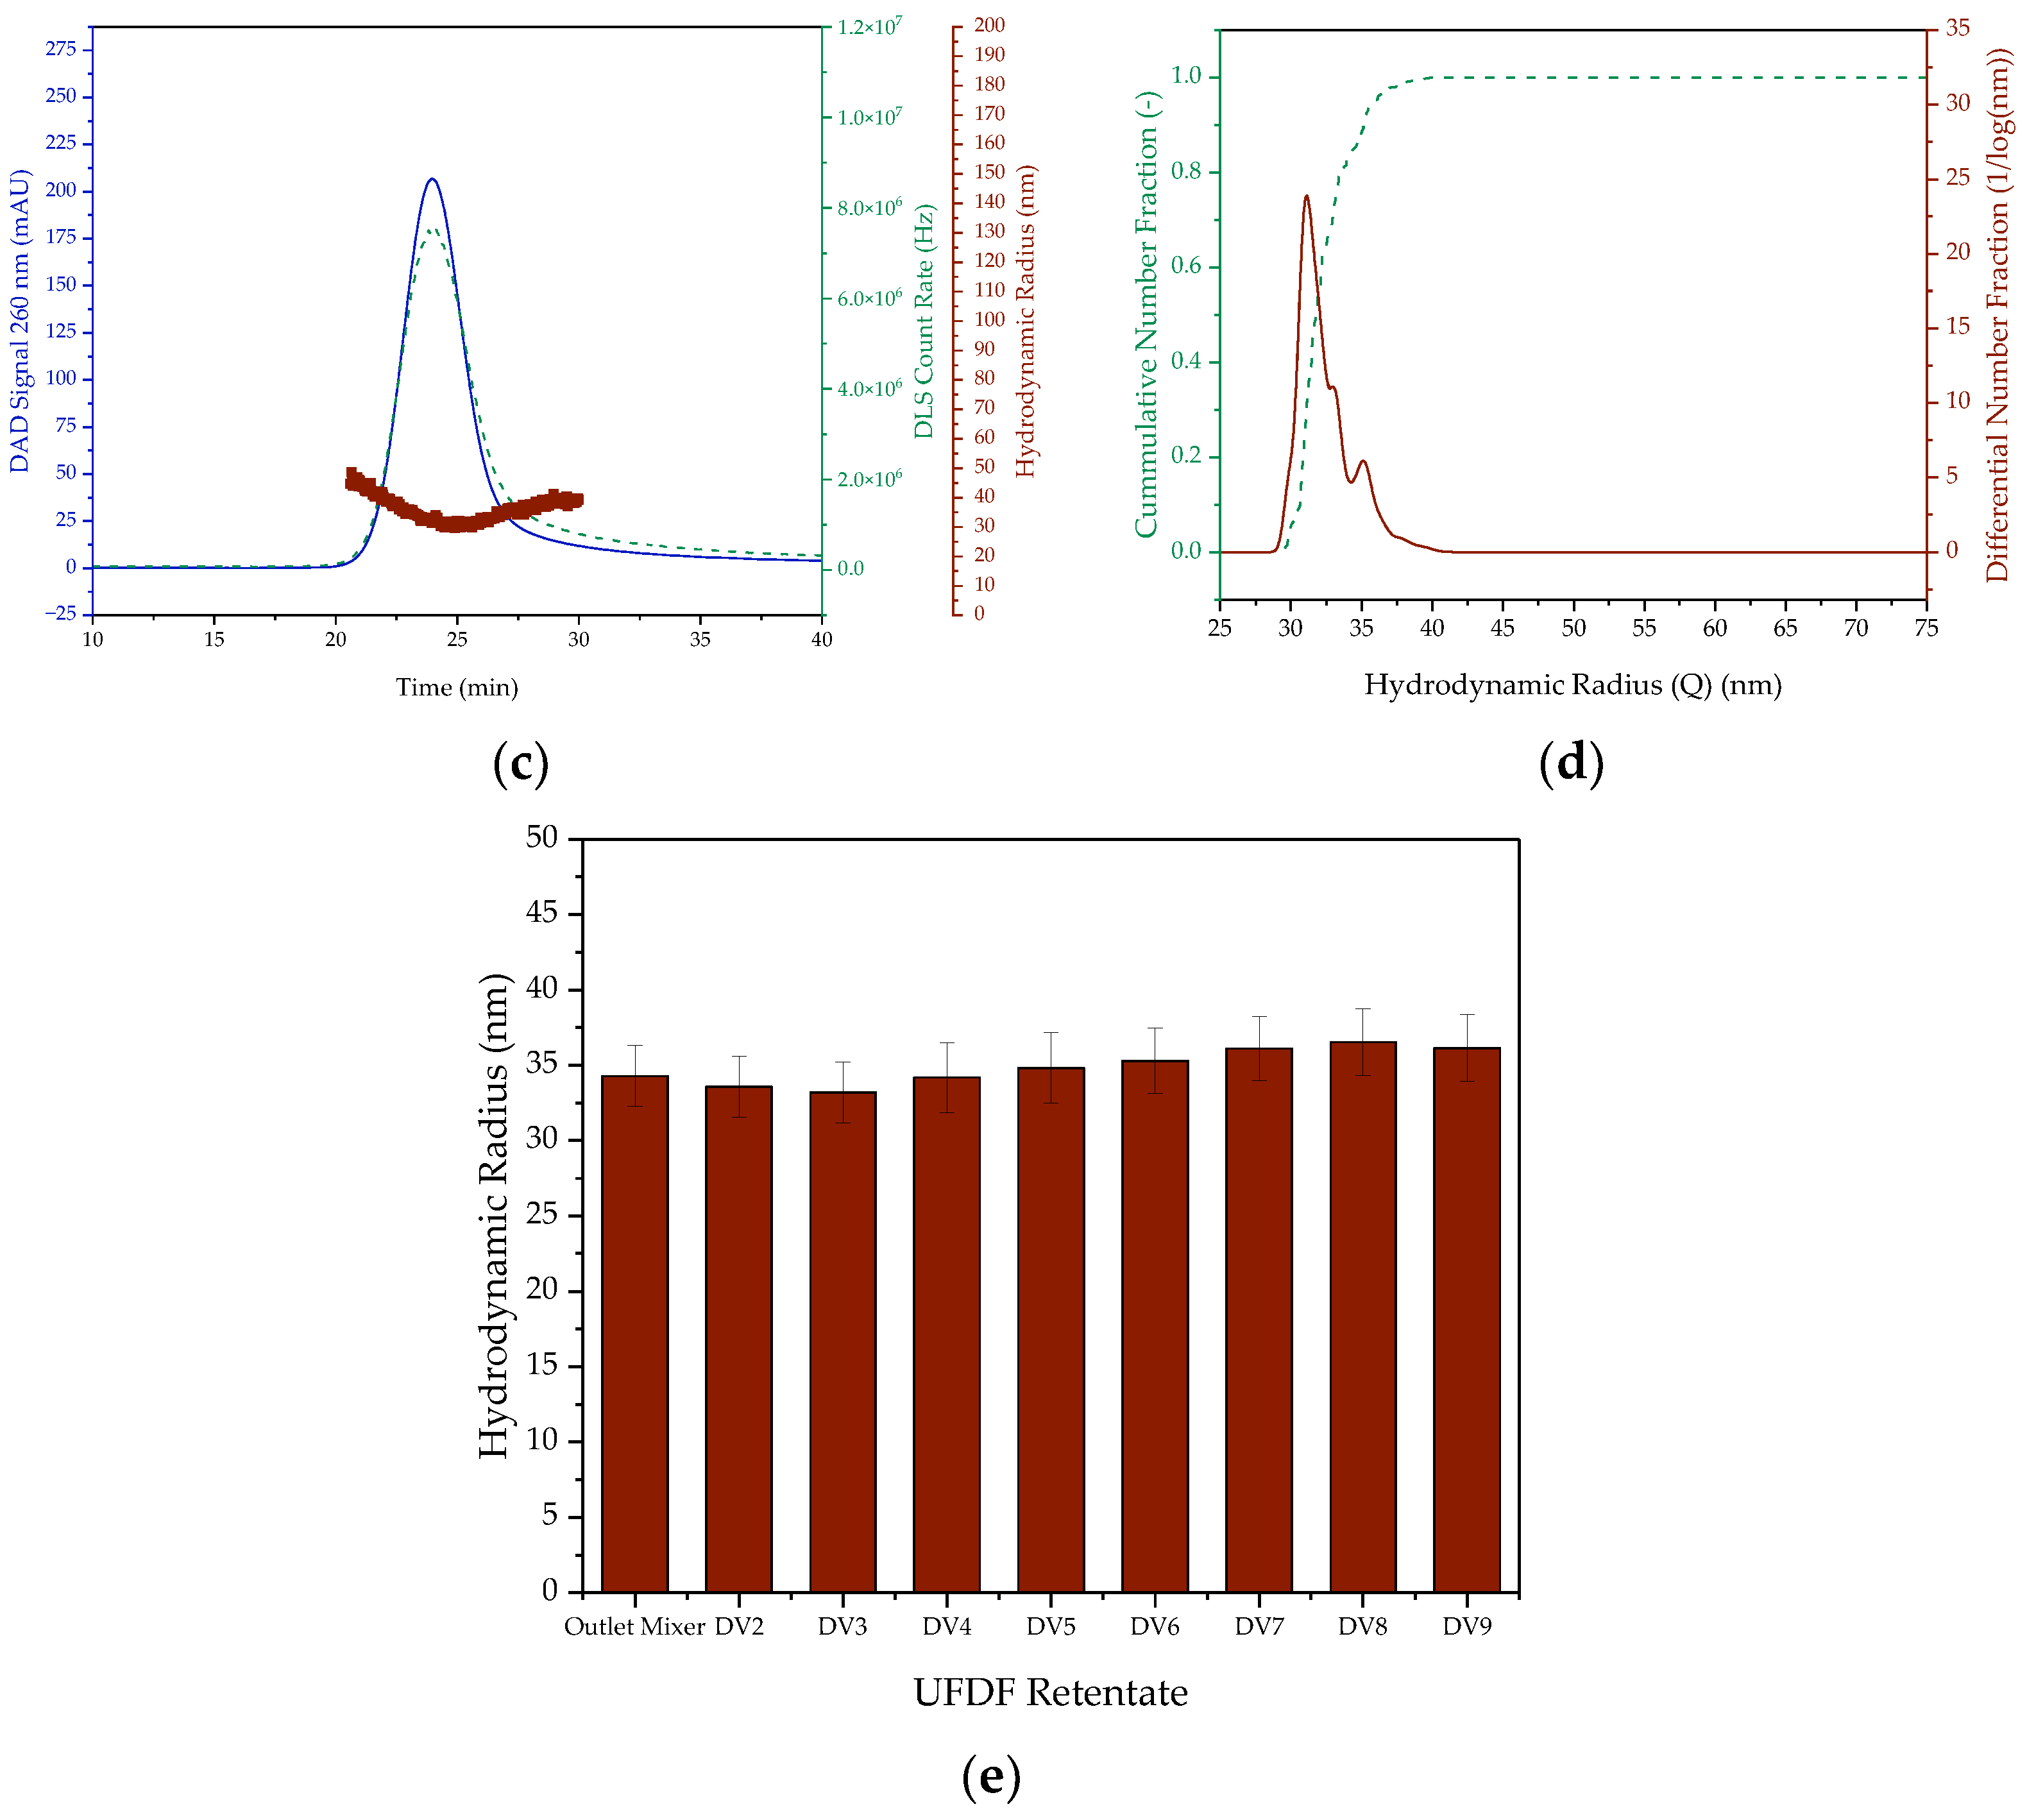
2.3.2. Size Characterization
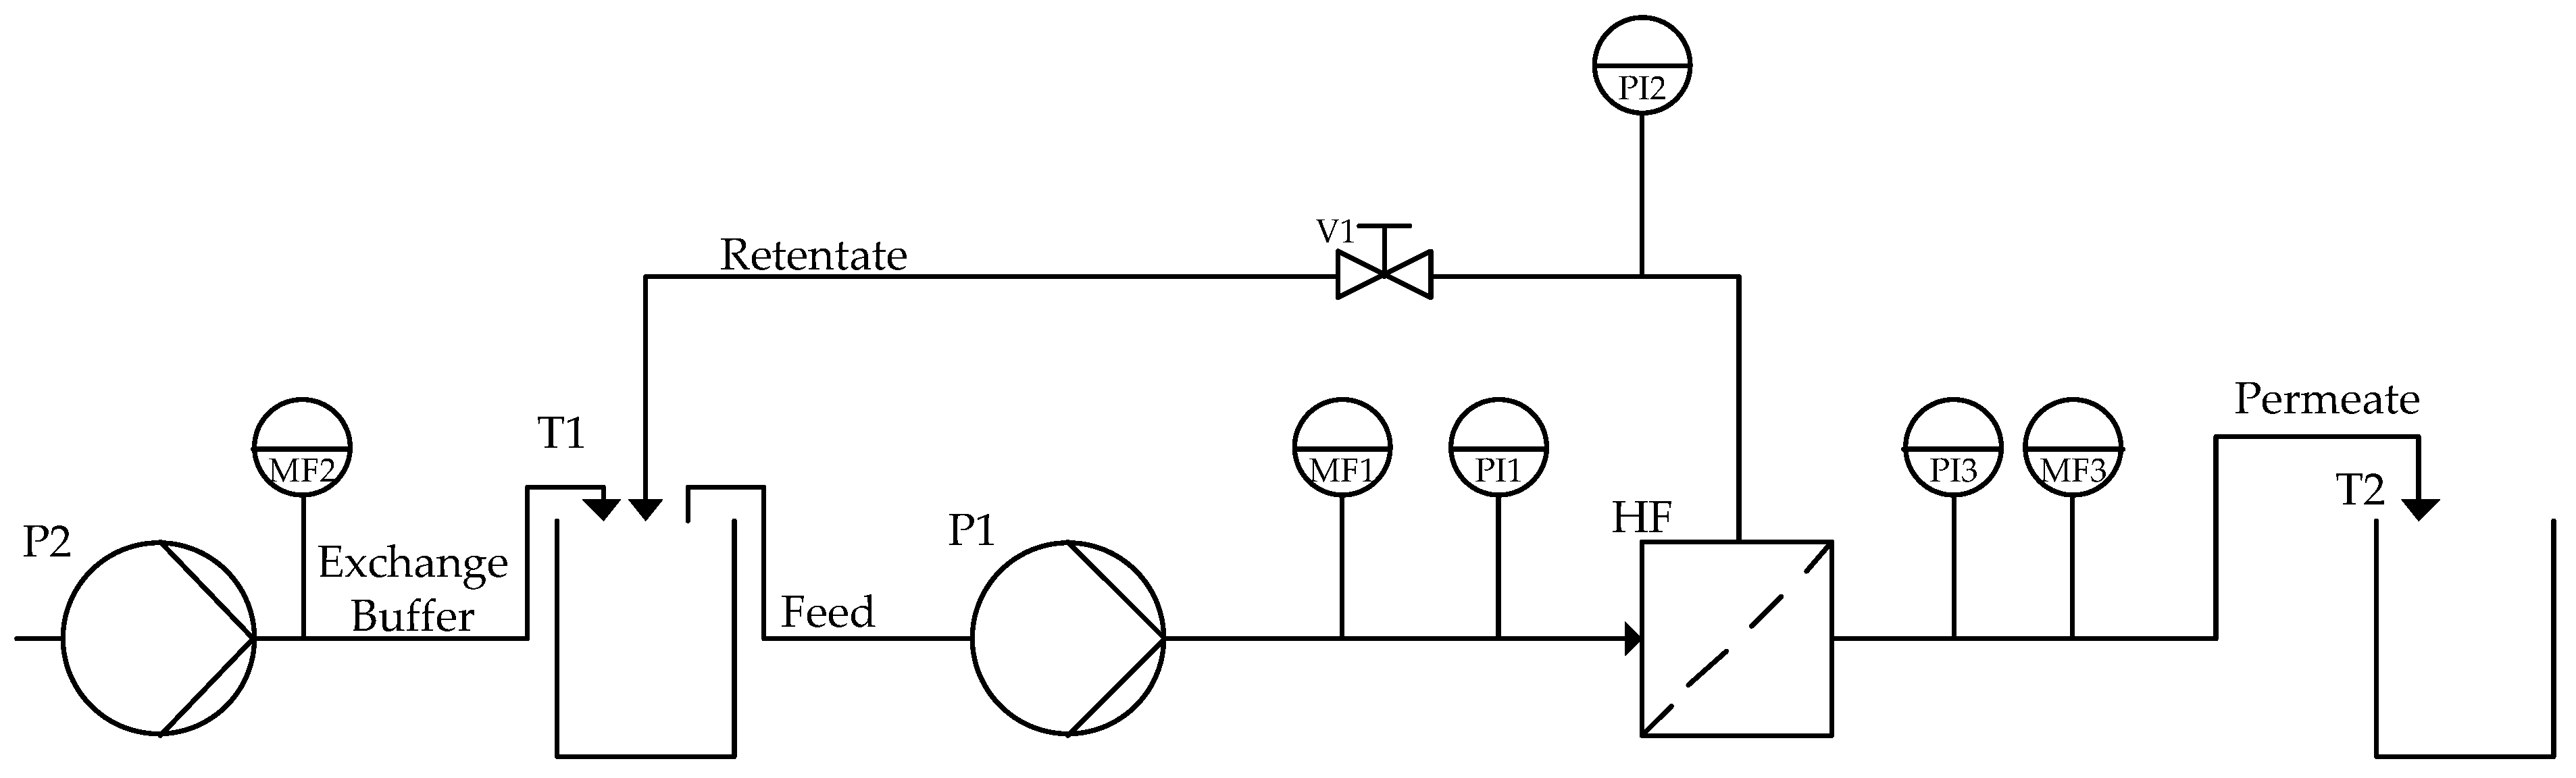
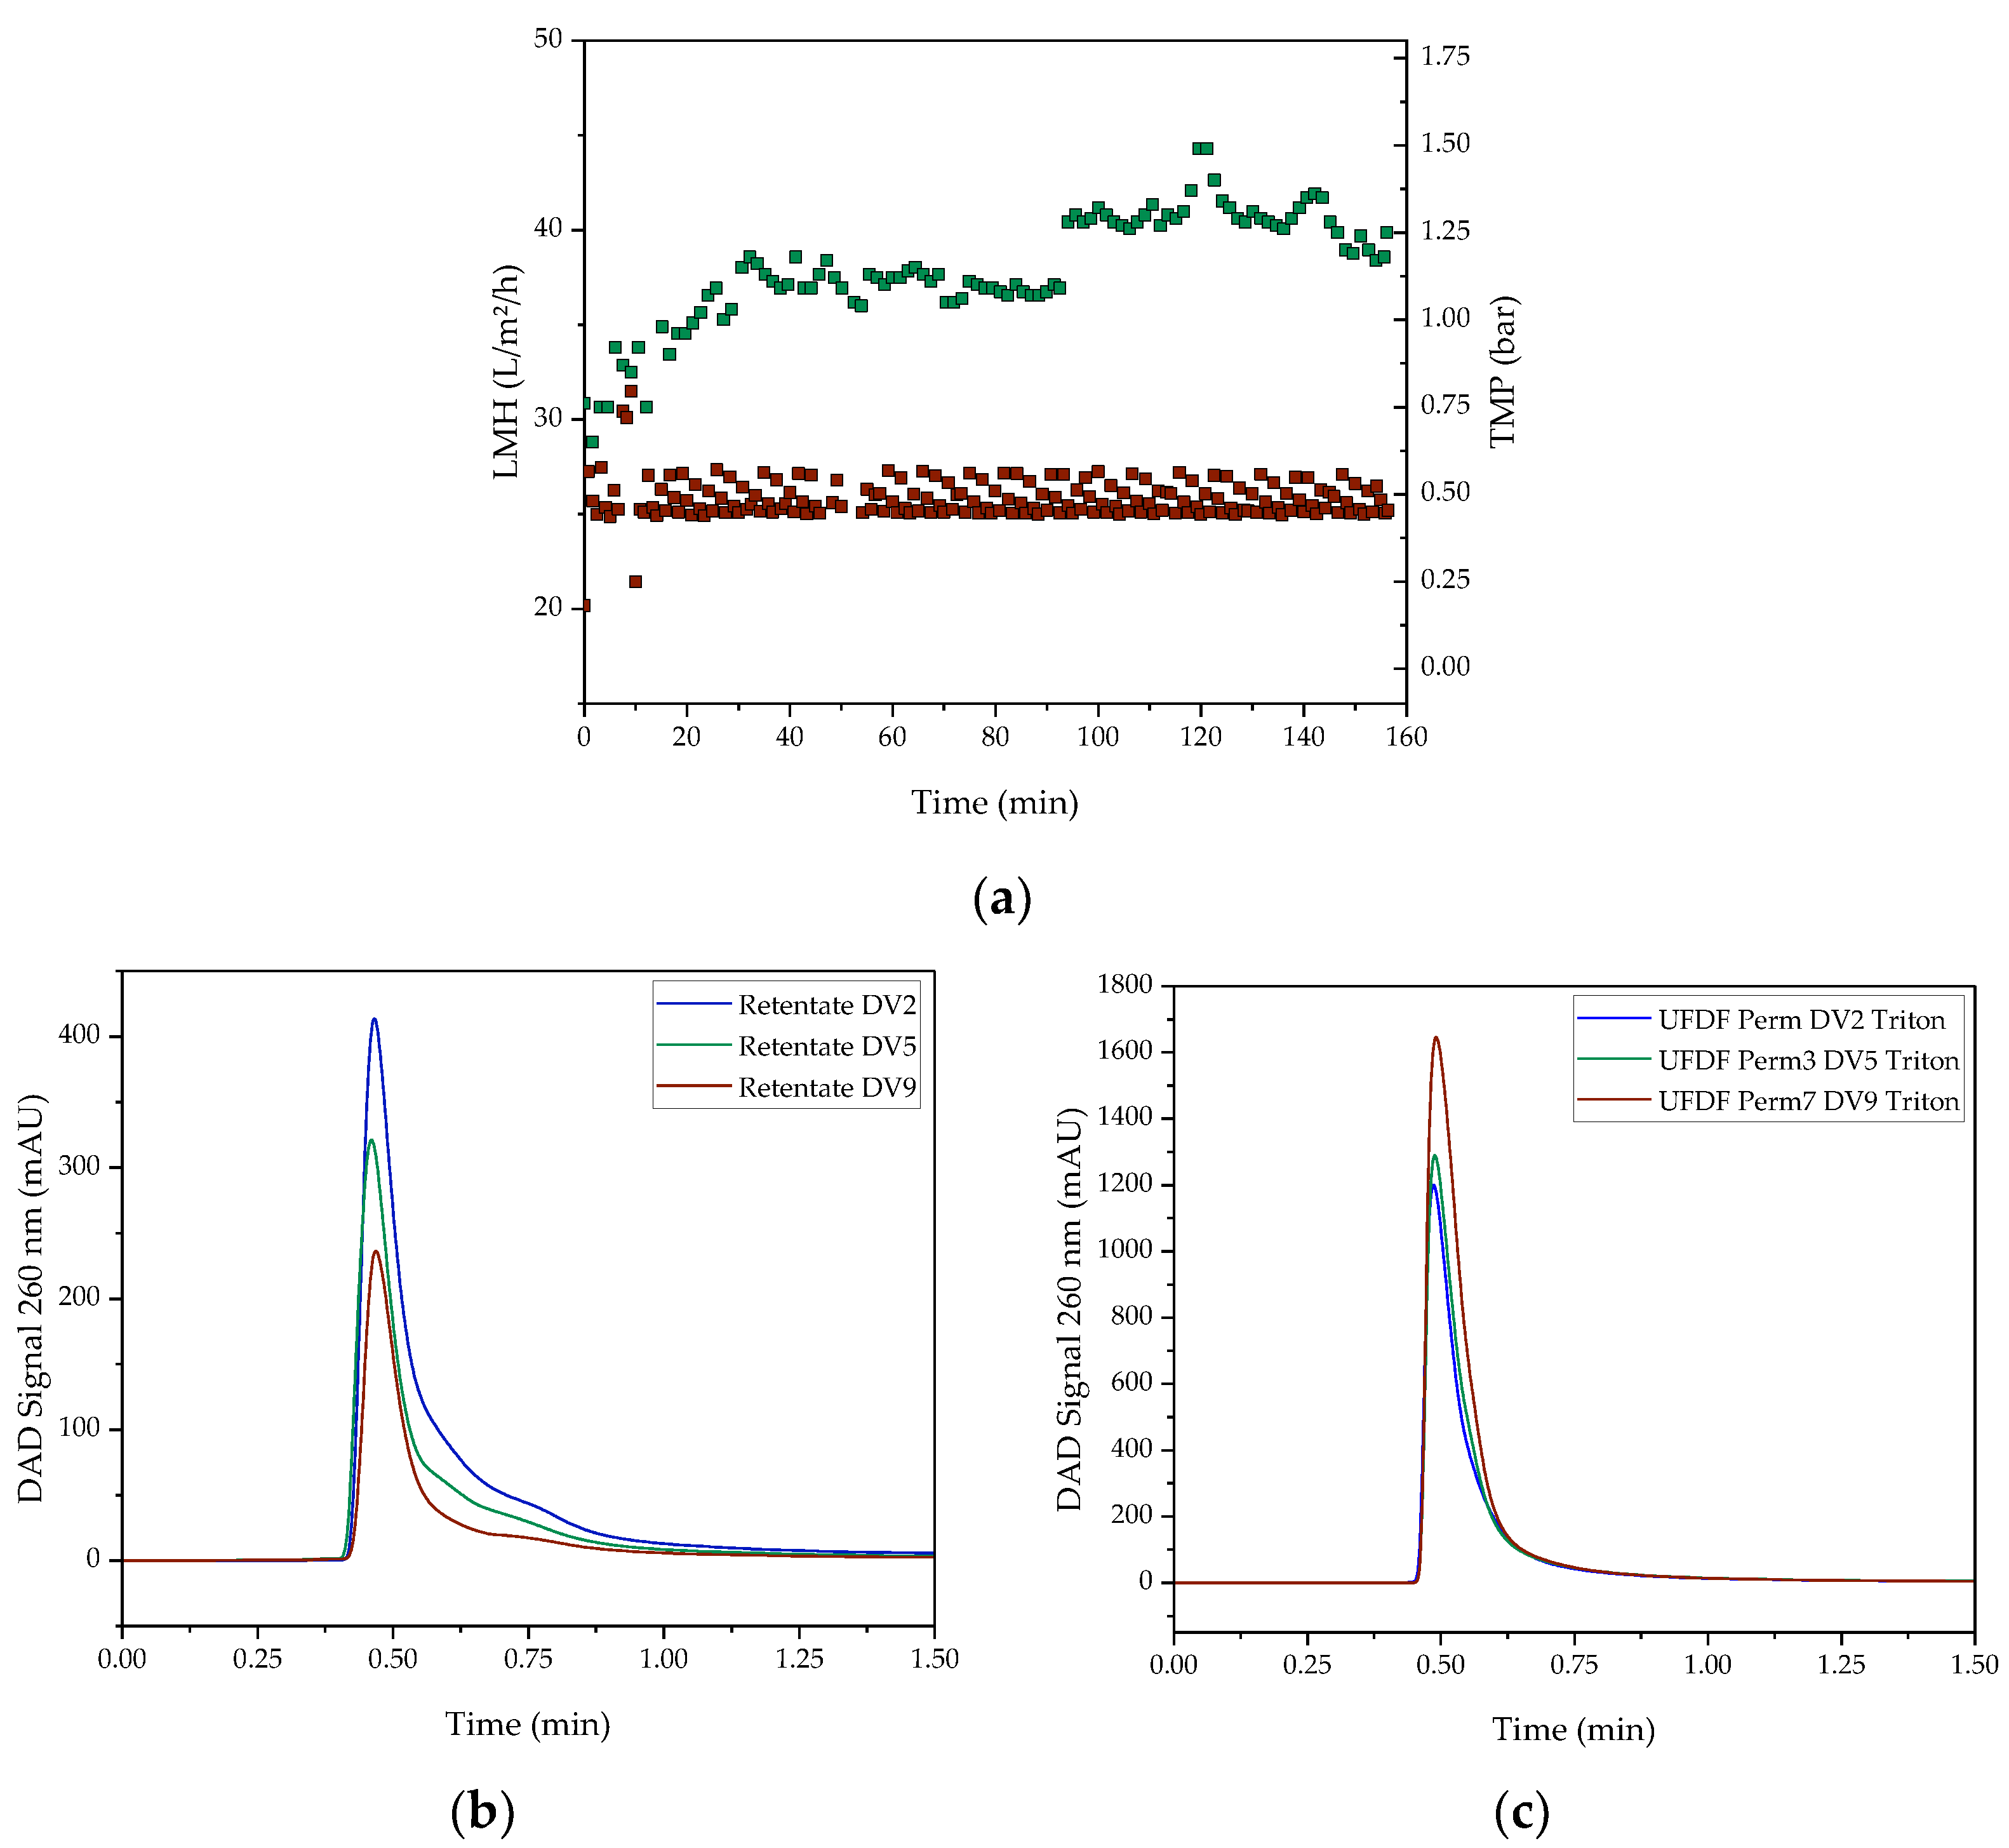
2.4. Ultra-/Diafiltration
3. Results
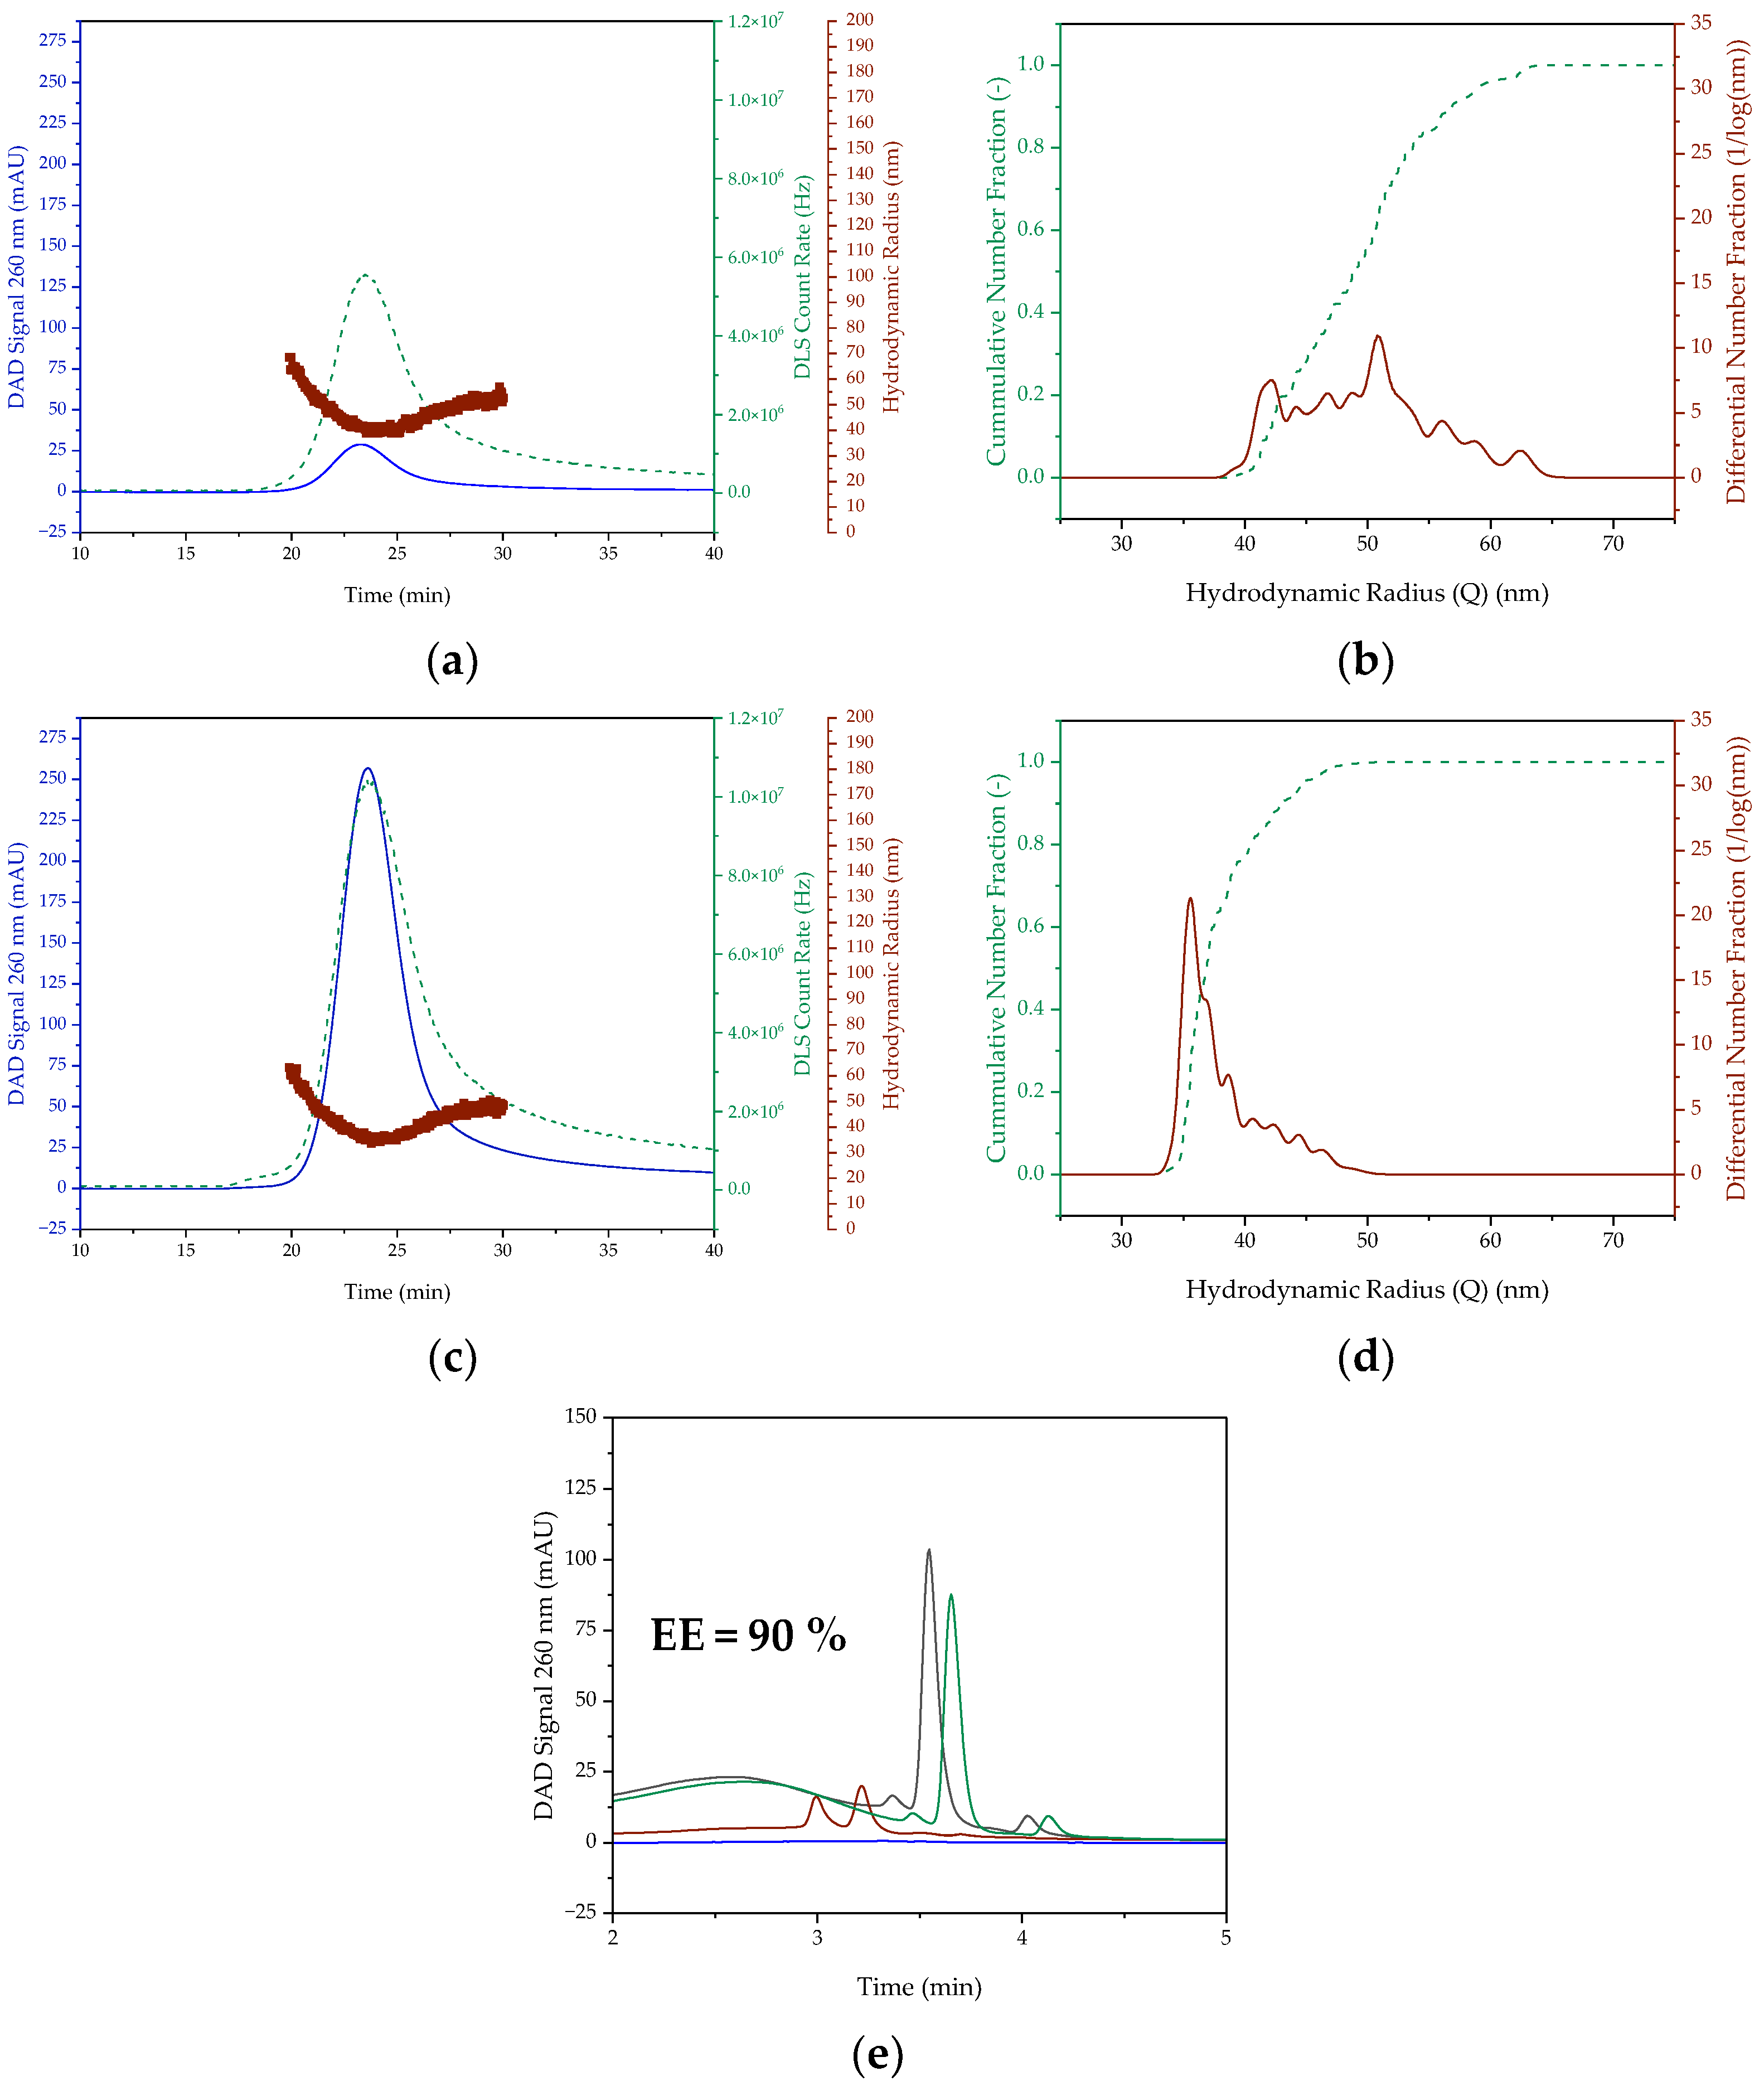
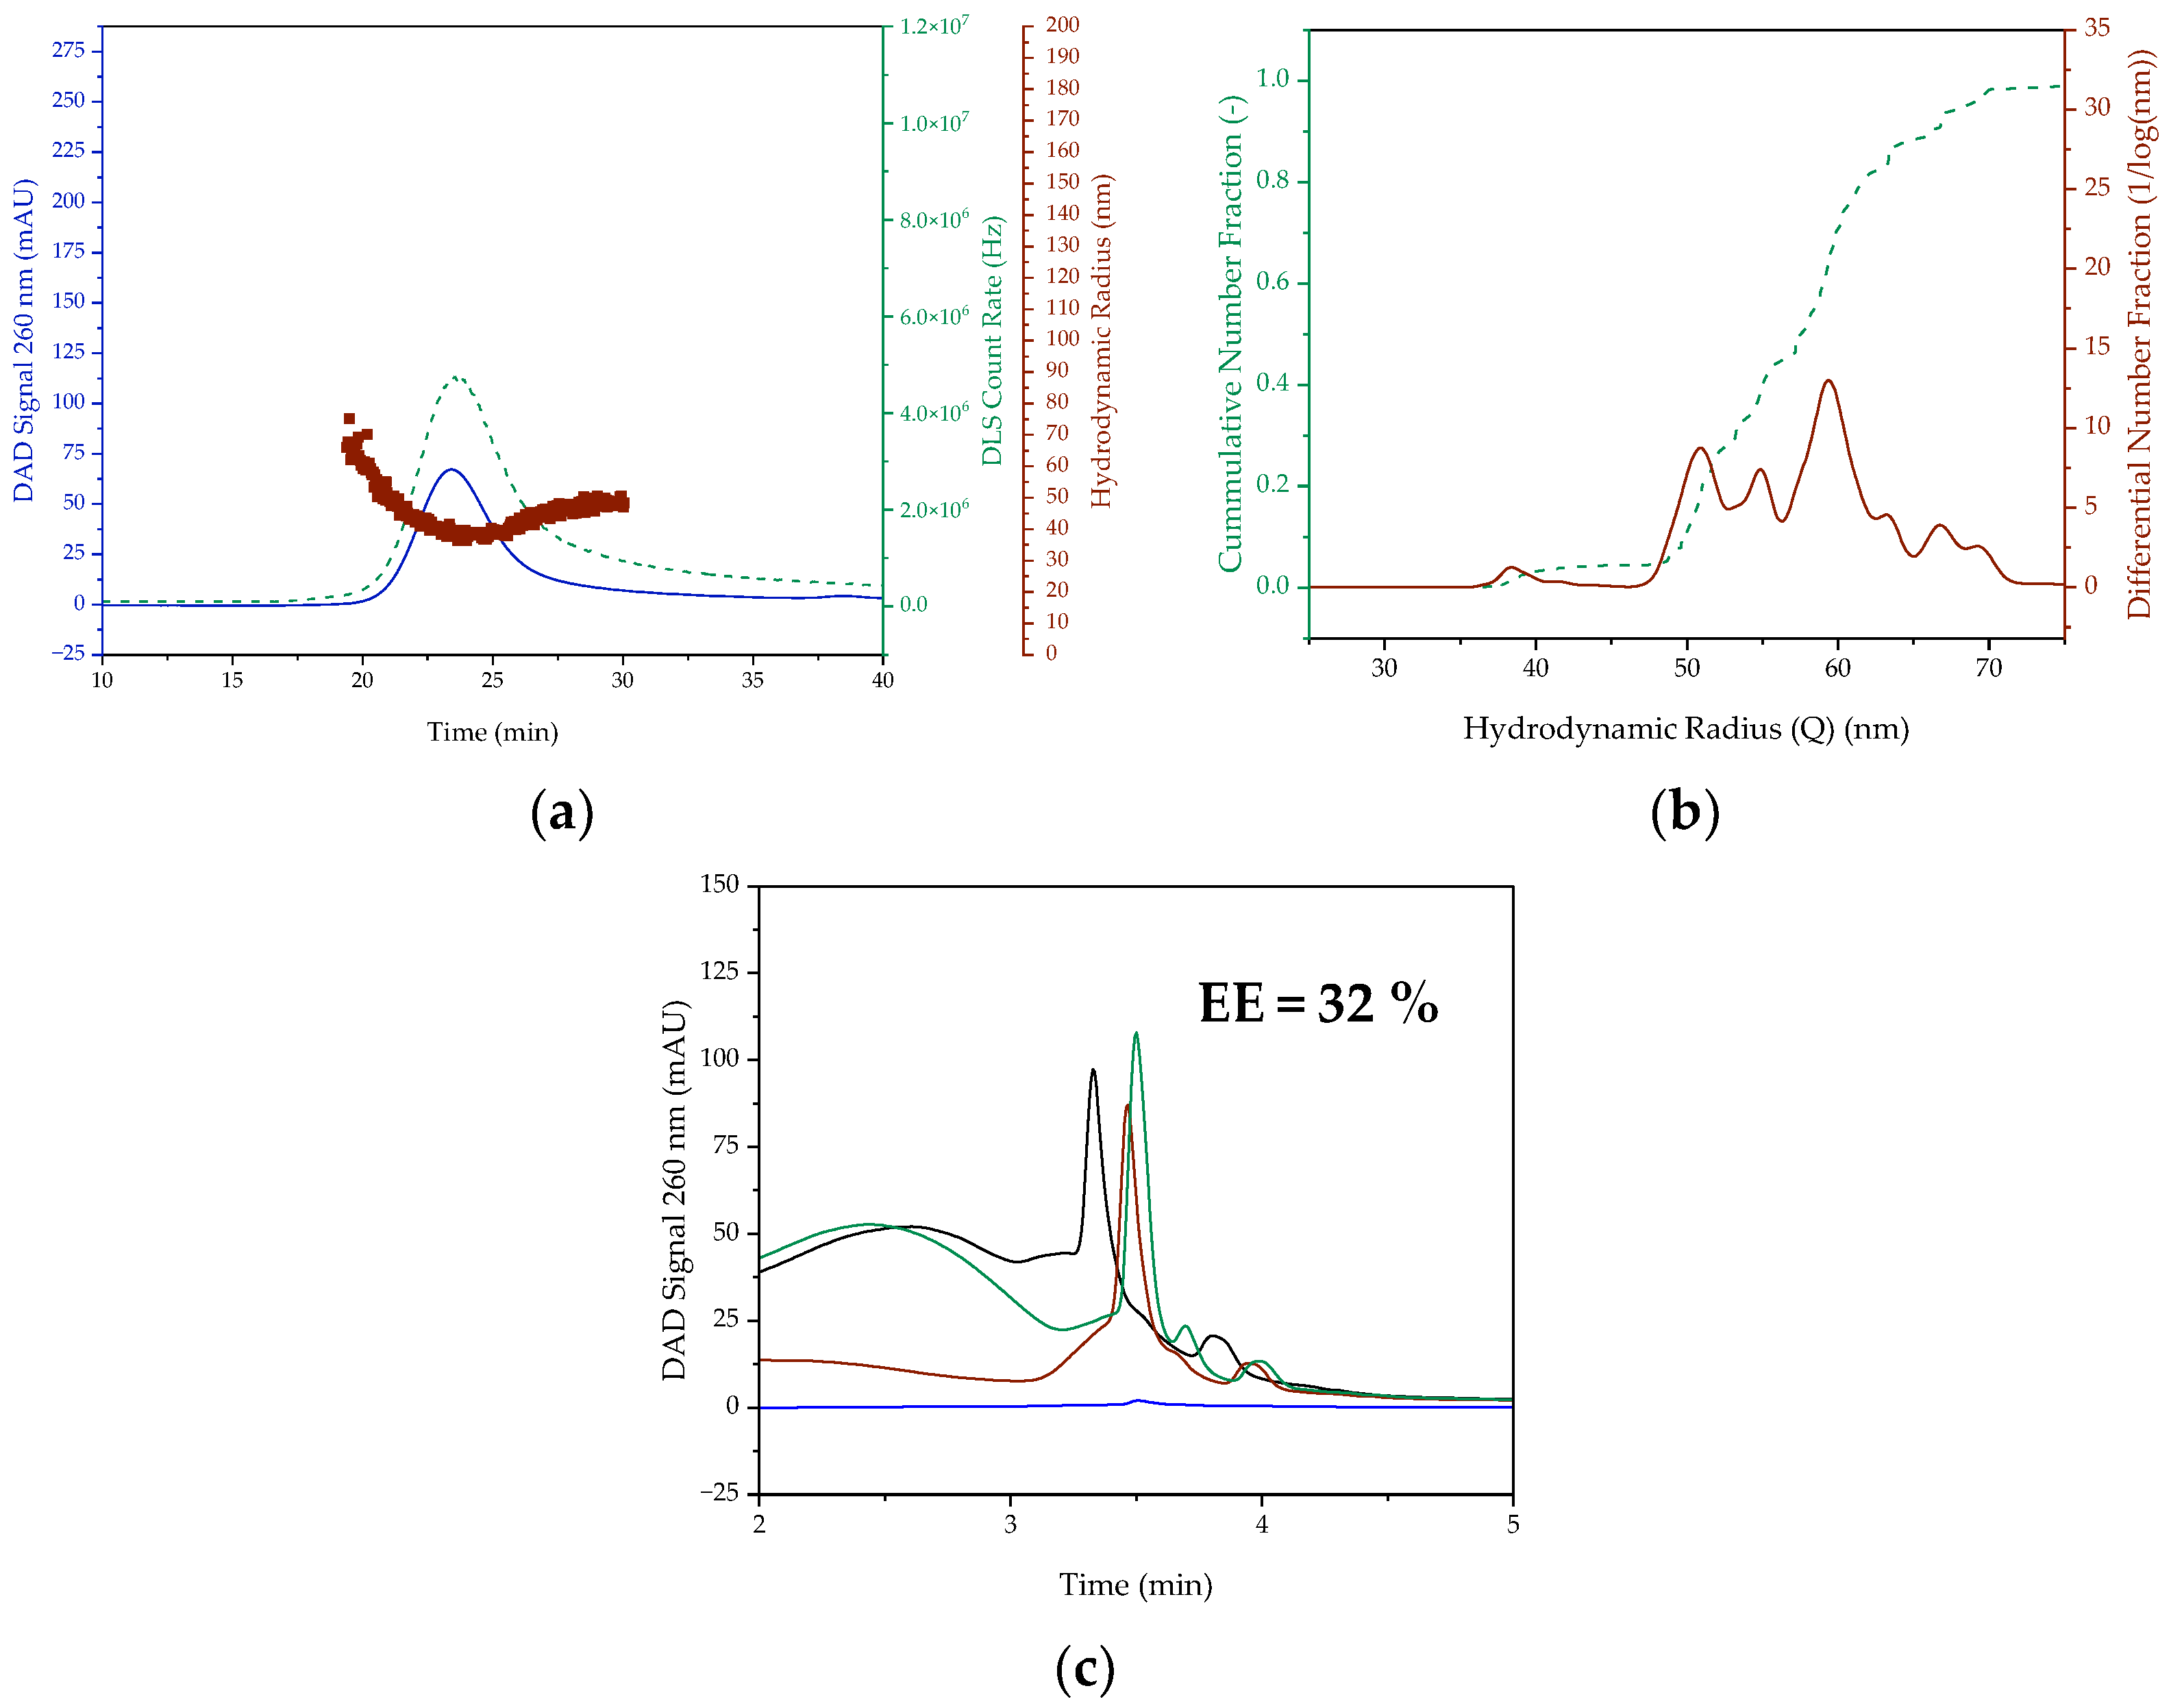
3.1. LNP Formation in Batch
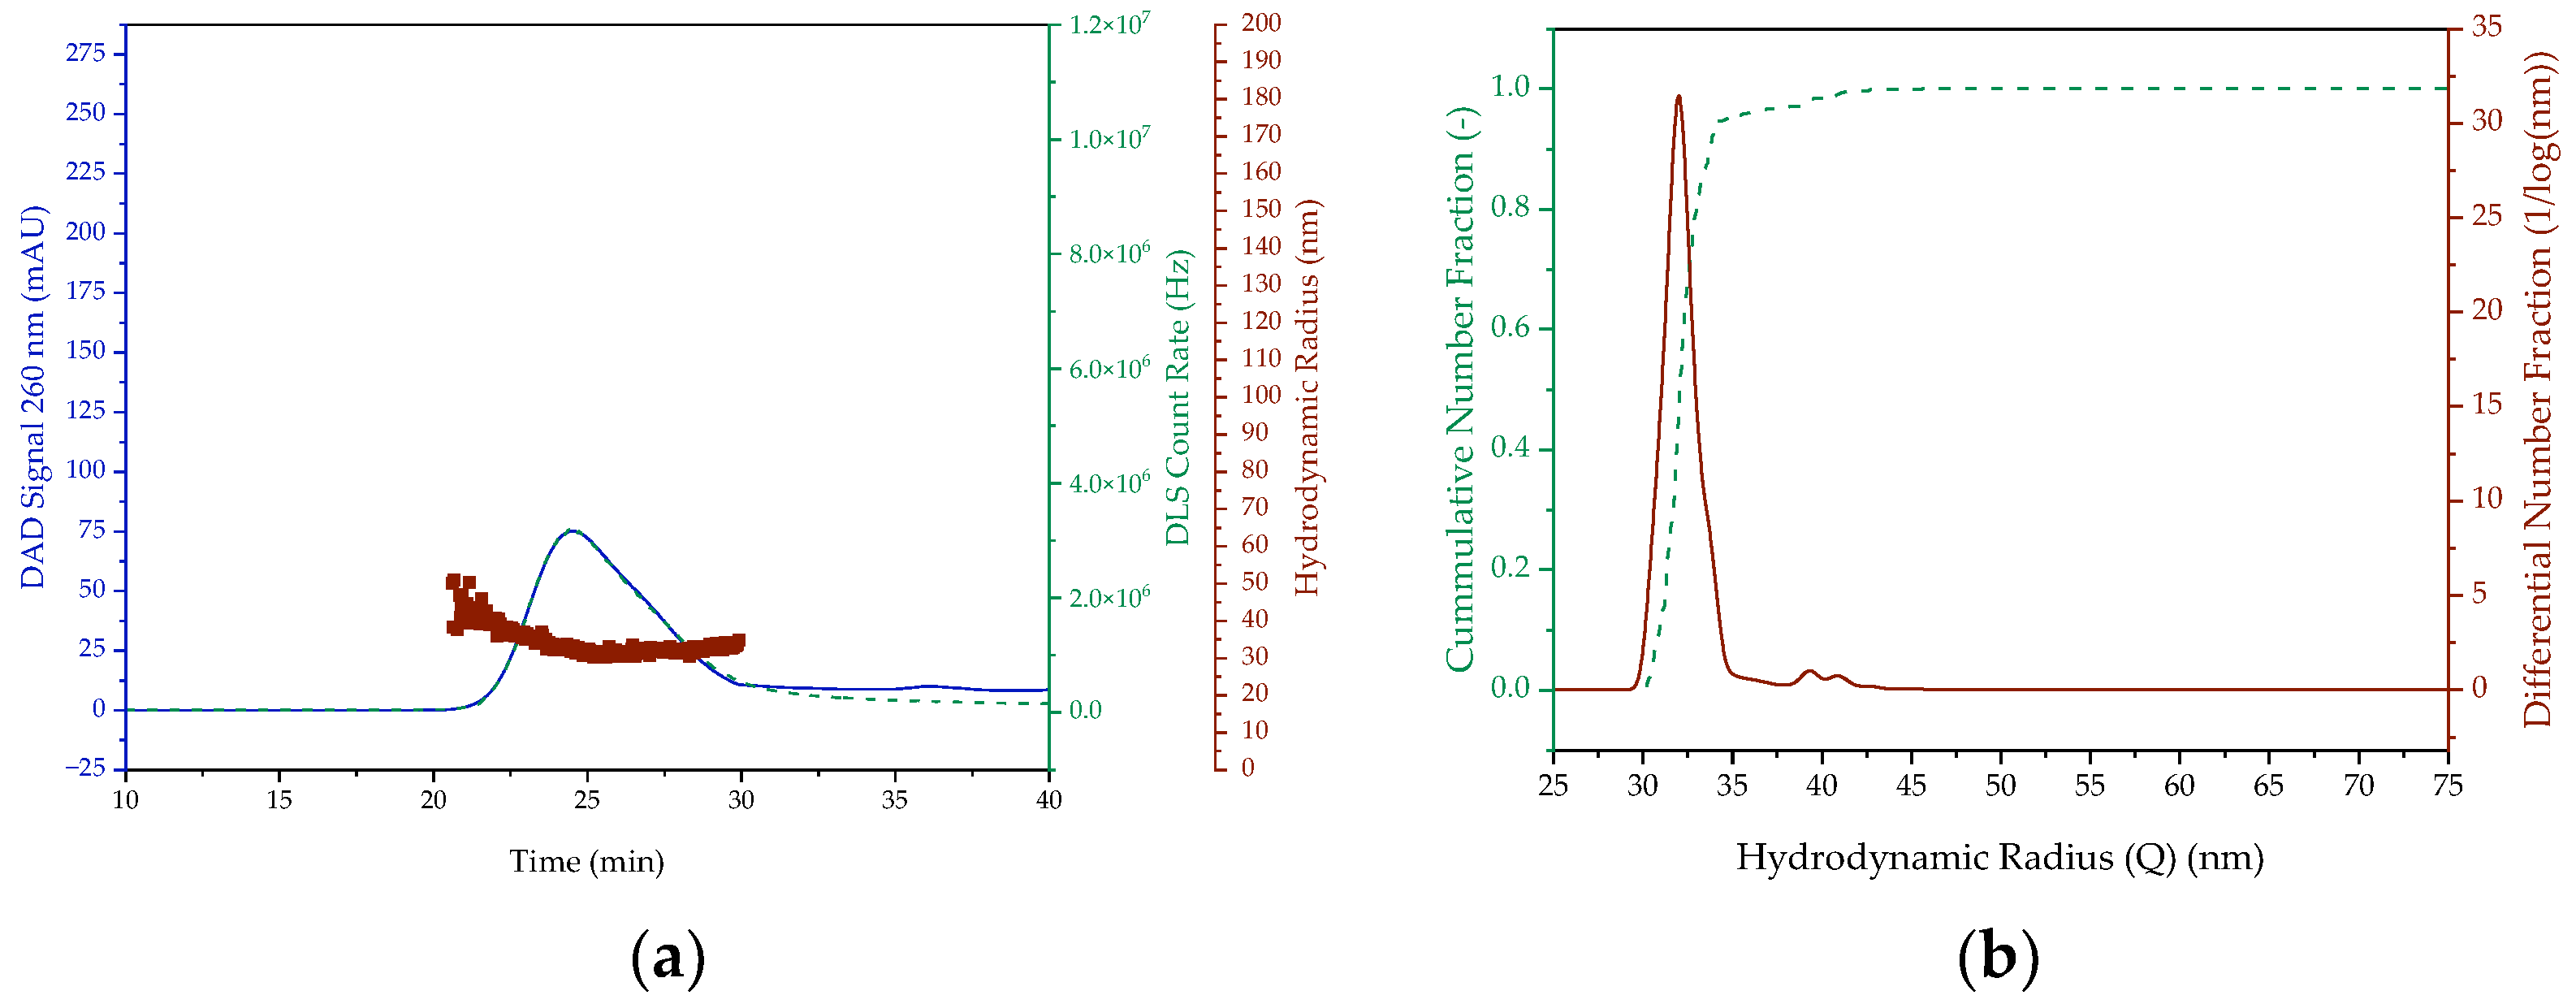
3.2. Continuous LNP Formation
3.3. LNP Quality in Batch and Continuous Mode
4. Discussion and Conclusions
Author Contributions
Funding
Institutional Review Board Statement
Informed Consent Statement
Data Availability Statement
Acknowledgments
Conflicts of Interest
References
- Burgos, R.M.; Badowski, M.E.; Drwiega, E.; Ghassemi, S.; Griffith, N.; Herald, F.; Johnson, M.; Smith, R.O.; Michienzi, S.M. The race to a COVID-19 vaccine: Opportunities and challenges in development and distribution. Drugs Context 2021, 10. [Google Scholar] [CrossRef] [PubMed]
- Wang, J.; Peng, Y.; Xu, H.; Cui, Z.; Williams, R.O. The COVID-19 Vaccine Race: Challenges and Opportunities in Vaccine Formulation. AAPS PharmSciTech 2020, 21, 225. [Google Scholar] [CrossRef]
- Rosa, S.S.; Nunes, D.; Antunes, L.; Prazeres, D.M.F.; Marques, M.P.C.; Azevedo, A.M. Maximizing mRNA vaccine production with Bayesian optimization. Biotechnol. Bioeng. 2022, 119, 3127–3139. [Google Scholar] [CrossRef]
- Uttarilli, A.; Amalakanti, S.; Kommoju, P.-R.; Sharma, S.; Goyal, P.; Manjunath, G.K.; Upadhayay, V.; Parveen, A.; Tandon, R.; Prasad, K.S.; et al. Super-rapid race for saving lives by developing COVID-19 vaccines. J. Integr. Bioinform. 2021, 18, 27–43. [Google Scholar] [CrossRef] [PubMed]
- Zhang, Y.; Hu, Y.; Tian, H.; Chen, X. Opportunities and Challenges for mRNA Delivery Nanoplatforms. J. Phys. Chem. Lett. 2022, 13, 1314–1322. [Google Scholar] [CrossRef] [PubMed]
- Catignol, P.; Lim, H. Overcoming-Bottlenecks-in-mRNA-Manufacturing. Whitepaper. Available online: https://samsungbiologics.com/media/science-technology/overcoming-bottlenecks-in-mrna-manufacturing (accessed on 24 April 2023).
- Carugo, D.; Bottaro, E.; Owen, J.; Stride, E.; Nastruzzi, C. Liposome production by microfluidics: Potential and limiting factors. Sci. Rep. 2016, 6, 25876. [Google Scholar] [CrossRef] [Green Version]
- Maeki, M.; Kimura, N.; Sato, Y.; Harashima, H.; Tokeshi, M. Advances in microfluidics for lipid nanoparticles and extracellular vesicles and applications in drug delivery systems. Adv. Drug Deliv. Rev. 2018, 128, 84–100. [Google Scholar] [CrossRef] [PubMed]
- Maherani, B.; Arab-Tehrany, E.; Mozafari, M.R.; Gaiani, C.; Linder, M. Liposomes: A Review of Manufacturing Techniques and Targeting Strategies. Curr. Nanosci. 2011, 7, 436–452. [Google Scholar] [CrossRef]
- Blanco, E.; Shen, H.; Ferrari, M. Principles of nanoparticle design for overcoming biological barriers to drug delivery. Nat. Biotechnol. 2015, 33, 941–951. [Google Scholar] [CrossRef]
- Widmer, J.; Thauvin, C.; Mottas, I.; van Nguyen, N.; Delie, F.; Allémann, E.; Bourquin, C. Polymer-based nanoparticles loaded with a TLR7 ligand to target the lymph node for immunostimulation. Int. J. Pharm. 2018, 535, 444–451. [Google Scholar] [CrossRef] [Green Version]
- Schoenmaker, L.; Witzigmann, D.; Kulkarni, J.A.; Verbeke, R.; Kersten, G.; Jiskoot, W.; Crommelin, D.J.A. mRNA-lipid nanoparticle COVID-19 vaccines: Structure and stability. Int. J. Pharm. 2021, 601, 120586. [Google Scholar] [CrossRef] [PubMed]
- Liang, F.; Lindgren, G.; Lin, A.; Thompson, E.A.; Ols, S.; Röhss, J.; John, S.; Hassett, K.; Yuzhakov, O.; Bahl, K.; et al. Efficient Targeting and Activation of Antigen-Presenting Cells In Vivo after Modified mRNA Vaccine Administration in Rhesus Macaques. Mol. Ther. 2017, 25, 2635–2647. [Google Scholar] [CrossRef] [Green Version]
- Lindsay, K.E.; Bhosle, S.M.; Zurla, C.; Beyersdorf, J.; Rogers, K.A.; Vanover, D.; Xiao, P.; Araínga, M.; Shirreff, L.M.; Pitard, B.; et al. Visualization of early events in mRNA vaccine delivery in non-human primates via PET-CT and near-infrared imaging. Nat. Biomed. Eng. 2019, 3, 371–380. [Google Scholar] [CrossRef]
- Hassett, K.J.; Benenato, K.E.; Jacquinet, E.; Lee, A.; Woods, A.; Yuzhakov, O.; Himansu, S.; Deterling, J.; Geilich, B.M.; Ketova, T.; et al. Optimization of Lipid Nanoparticles for Intramuscular Administration of mRNA Vaccines. Mol. Ther. Nucleic Acids 2019, 15, 1–11. [Google Scholar] [CrossRef] [PubMed] [Green Version]
- Evers, M.J.W.; Kulkarni, J.A.; van der Meel, R.; Cullis, P.R.; Vader, P.; Schiffelers, R.M. State-of-the-Art Design and Rapid-Mixing Production Techniques of Lipid Nanoparticles for Nucleic Acid Delivery. Small Methods 2018, 2, 1700375. [Google Scholar] [CrossRef] [Green Version]
- Reichmuth, A.M.; Oberli, M.A.; Jaklenec, A.; Langer, R.; Blankschtein, D. mRNA vaccine delivery using lipid nanoparticles. Ther. Deliv. 2016, 7, 319–334. [Google Scholar] [CrossRef] [PubMed] [Green Version]
- Buschmann, M.D.; Carrasco, M.J.; Alishetty, S.; Paige, M.; Alameh, M.G.; Weissman, D. Nanomaterial Delivery Systems for mRNA Vaccines. Vaccines 2021, 9, 65. [Google Scholar] [CrossRef] [PubMed]
- Yanez Arteta, M.; Kjellman, T.; Bartesaghi, S.; Wallin, S.; Wu, X.; Kvist, A.J.; Dabkowska, A.; Székely, N.; Radulescu, A.; Bergenholtz, J.; et al. Successful reprogramming of cellular protein production through mRNA delivered by functionalized lipid nanoparticles. Proc. Natl. Acad. Sci. USA 2018, 115, E3351–E3360. [Google Scholar] [CrossRef] [Green Version]
- Ball, R.L.; Bajaj, P.; Whitehead, K.A. Achieving long-term stability of lipid nanoparticles: Examining the effect of pH, temperature, and lyophilization. Int. J. Nanomed. 2017, 12, 305–315. [Google Scholar] [CrossRef] [Green Version]
- Cayman Chemical. A Guide to Lipid Nanoparticle Formulation: Basic Concepts & Preparation Procedures. Available online: https://www.biomol.com/dateien/Cayman--A-Guide-to-Lipid-Nanoparticle-Formulation.pdf (accessed on 26 April 2023).
- Cayabyab, C.; Brown, A.; Tharmarajah, A.T. mRNA Lipid Nanoparticles: Robust Low-Volume Production for Screening High-Value Nanoparticle Materials. Mrnaspark-Application Note-1018. Available online: https://www.precisionnanosystems.com/docs/default-source/pni-files/app-notes/spark-mrna-appnote-1018.pdf?sfvrsn=50662346_0 (accessed on 26 April 2023).
- Kulkarni, J.A.; Darjuan, M.M.; Mercer, J.E.; Chen, S.; van der Meel, R.; Thewalt, J.L.; Tam, Y.Y.C.; Cullis, P.R. On the Formation and Morphology of Lipid Nanoparticles Containing Ionizable Cationic Lipids and siRNA. ACS Nano 2018, 12, 4787–4795. [Google Scholar] [CrossRef] [Green Version]
- Kulkarni, J.A.; Tam, Y.Y.C.; Chen, S.; Tam, Y.K.; Zaifman, J.; Cullis, P.R.; Biswas, S. Rapid synthesis of lipid nanoparticles containing hydrophobic inorganic nanoparticles. Nanoscale 2017, 9, 13600–13609. [Google Scholar] [CrossRef]
- Hirota, S.; de Ilarduya, C.T.; Barron, L.G.; Szoka, F.C. Simple mixing device to reproducibly prepare cationic lipid-DNA complexes (lipoplexes). Biotechniques 1999, 27, 286–290. [Google Scholar] [CrossRef] [PubMed]
- Quagliarini, E.; Renzi, S.; Digiacomo, L.; Giulimondi, F.; Sartori, B.; Amenitsch, H.; Tassinari, V.; Masuelli, L.; Bei, R.; Cui, L.; et al. Microfluidic Formulation of DNA-Loaded Multicomponent Lipid Nanoparticles for Gene Delivery. Pharmaceutics 2021, 13, 1292. [Google Scholar] [CrossRef] [PubMed]
- Kulkarni, J.A.; Witzigmann, D.; Leung, J.; van der Meel, R.; Zaifman, J.; Darjuan, M.M.; Grisch-Chan, H.M.; Thöny, B.; Tam, Y.Y.C.; Cullis, P.R. Fusion-dependent formation of lipid nanoparticles containing macromolecular payloads. Nanoscale 2019, 11, 9023–9031. [Google Scholar] [CrossRef]
- Pilkington, E.H.; Suys, E.J.A.; Trevaskis, N.L.; Wheatley, A.K.; Zukancic, D.; Algarni, A.; Al-Wassiti, H.; Davis, T.P.; Pouton, C.W.; Kent, S.J.; et al. From influenza to COVID-19: Lipid nanoparticle mRNA vaccines at the frontiers of infectious diseases. Acta Biomater. 2021, 131, 16–40. [Google Scholar] [CrossRef] [PubMed]
- Kulkarni, J.A.; Myhre, J.L.; Chen, S.; Tam, Y.Y.C.; Danescu, A.; Richman, J.M.; Cullis, P.R. Design of lipid nanoparticles for in vitro and in vivo delivery of plasmid DNA. Nanomedicine 2017, 13, 1377–1387. [Google Scholar] [CrossRef] [PubMed]
- He, Z.; Hu, Y.; Nie, T.; Tang, H.; Zhu, J.; Chen, K.; Liu, L.; Leong, K.W.; Chen, Y.; Mao, H.-Q. Size-controlled lipid nanoparticle production using turbulent mixing to enhance oral DNA delivery. Acta Biomater. 2018, 81, 195–207. [Google Scholar] [CrossRef]
- Mucker, E.M.; Karmali, P.P.; Vega, J.; Kwilas, S.A.; Wu, H.; Joselyn, M.; Ballantyne, J.; Sampey, D.; Mukthavaram, R.; Sullivan, E.; et al. Lipid Nanoparticle Formulation Increases Efficiency of DNA-Vectored Vaccines/Immunoprophylaxis in Animals Including Transchromosomic Bovines. Sci. Rep. 2020, 10, 8764. [Google Scholar] [CrossRef]
- Sinegra, A.J.; Evangelopoulos, M.; Park, J.; Huang, Z.; Mirkin, C.A. Lipid Nanoparticle Spherical Nucleic Acids for Intracellular DNA and RNA Delivery. Nano Lett. 2021, 21, 6584–6591. [Google Scholar] [CrossRef]
- Cui, L.; Renzi, S.; Quagliarini, E.; Digiacomo, L.; Amenitsch, H.; Masuelli, L.; Bei, R.; Ferri, G.; Cardarelli, F.; Wang, J.; et al. Efficient Delivery of DNA Using Lipid Nanoparticles. Pharmaceutics 2022, 14, 1698. [Google Scholar] [CrossRef]
- Quagliarini, E.; Wang, J.; Renzi, S.; Cui, L.; Digiacomo, L.; Ferri, G.; Pesce, L.; de Lorenzi, V.; Matteoli, G.; Amenitsch, H.; et al. Mechanistic Insights into the Superior DNA Delivery Efficiency of Multicomponent Lipid Nanoparticles: An In Vitro and In Vivo Study. ACS Appl. Mater. Interfaces 2022, 14, 56666–56677. [Google Scholar] [CrossRef] [PubMed]
- Food and Drug Administration. Pfizer-BioNTech COVID-19 Vaccine EUA Letter of Authorization reissued 05-10-2021. Available online: https://www.fda.gov/media/144412/download (accessed on 4 February 2023).
- Mendonça, M.C.P.; Kont, A.; Kowalski, P.S.; O’Driscoll, C.M. Design of lipid-based nanoparticles for delivery of therapeutic nucleic acids. Drug Discov. Today 2023, 28, 103505. [Google Scholar] [CrossRef] [PubMed]
- Cunha, S.; Costa, C.P.; Moreira, J.N.; Sousa Lobo, J.M.; Silva, A.C. Using the quality by design (QbD) approach to optimize formulations of lipid nanoparticles and nanoemulsions: A review. Nanomedicine 2020, 28, 102206. [Google Scholar] [CrossRef] [PubMed]
- Caputo, F.; Arnould, A.; Bacia, M.; Ling, W.L.; Rustique, E.; Texier, I.; Mello, A.P.; Couffin, A.-C. Measuring Particle Size Distribution by Asymmetric Flow Field Flow Fractionation: A Powerful Method for the Preclinical Characterization of Lipid-Based Nanoparticles. Mol. Pharm. 2019, 16, 756–767. [Google Scholar] [CrossRef] [PubMed] [Green Version]
- Daniel, S.; Kis, Z.; Kontoravdi, C.; Shah, N. Quality by Design for enabling RNA platform production processes. Trends Biotechnol. 2022, 40, 1213–1228. [Google Scholar] [CrossRef] [PubMed]
- Fan, Y.; Marioli, M.; Zhang, K. Analytical characterization of liposomes and other lipid nanoparticles for drug delivery. J. Pharm. Biomed. Anal. 2021, 192, 113642. [Google Scholar] [CrossRef]
- Hupfeld, S.; Holsaeter, A.M.; Skar, M.; Frantzen, C.B.; Brandl, M. Liposome size analysis by dynamic/static light scattering upon size exclusion-/field flow-fractionation. J. Nanosci. Nanotechnol. 2006, 6, 3025–3031. [Google Scholar] [CrossRef] [Green Version]
- Jia, X.; Liu, Y.; Wagner, A.M.; Chen, M.; Zhao, Y.; Smith, K.J.; Some, D.; Abend, A.M.; Pennington, J. Enabling online determination of the size-dependent RNA content of lipid nanoparticle-based RNA formulations. J. Chromatogr. B Analyt. Technol. Biomed. Life Sci. 2021, 1186, 123015. [Google Scholar] [CrossRef]
- Mildner, R.; Hak, S.; Parot, J.; Hyldbakk, A.; Borgos, S.E.; Some, D.; Johann, C.; Caputo, F. Improved multidetector asymmetrical-flow field-flow fractionation method for particle sizing and concentration measurements of lipid-based nanocarriers for RNA delivery. Eur. J. Pharm. Biopharm. 2021, 163, 252–265. [Google Scholar] [CrossRef]
- Parot, J.; Caputo, F.; Mehn, D.; Hackley, V.A.; Calzolai, L. Physical characterization of liposomal drug formulations using multi-detector asymmetrical-flow field flow fractionation. J. Control. Release 2020, 320, 495–510. [Google Scholar] [CrossRef]
- Zhang, J.; Haas, R.M.; Leone, A.M. Polydispersity characterization of lipid nanoparticles for siRNA delivery using multiple detection size-exclusion chromatography. Anal. Chem. 2012, 84, 6088–6096. [Google Scholar] [CrossRef]
- Whitley, J.; Zwolinski, C.; Denis, C.; Maughan, M.; Hayles, L.; Clarke, D.; Snare, M.; Liao, H.; Chiou, S.; Marmura, T.; et al. Development of mRNA manufacturing for vaccines and therapeutics: mRNA platform requirements and development of a scalable production process to support early phase clinical trials. Transl. Res. 2022, 242, 38–55. [Google Scholar] [CrossRef] [PubMed]
- Crawford, R.; Dogdas, B.; Keough, E.; Haas, R.M.; Wepukhulu, W.; Krotzer, S.; Burke, P.A.; Sepp-Lorenzino, L.; Bagchi, A.; Howell, B.J. Analysis of lipid nanoparticles by Cryo-EM for characterizing siRNA delivery vehicles. Int. J. Pharm. 2011, 403, 237–244. [Google Scholar] [CrossRef] [PubMed]
- An, K.; Kurek, D.; Mahadeo, M.; Zhang, Y.; Thewalt, J.L.; Cullis, P.R.; Kulkarni, J.A. On the Influence of Nucleic Acid Backbone Modifications on Lipid Nanoparticle Morphology. Langmuir 2022, 38, 14036–14043. [Google Scholar] [CrossRef] [PubMed]
- Gao, R.Y.; Riley, C.M.; Toth, E.; Blair, R.H.; Gerold, M.N.; McCormick, C.; Taylor, A.W.; Hu, T.; Rowlen, K.L.; Dawson, E.D. Rapid Identity and Quantity CQA Test for Multivalent mRNA Drug Product Formulations. Vaccines 2022, 10, 1704. [Google Scholar] [CrossRef] [PubMed]
- Malburet, C.; Leclercq, L.; Cotte, J.-F.; Thiebaud, J.; Bazin, E.; Garinot, M.; Cottet, H. Size and Charge Characterization of Lipid Nanoparticles for mRNA Vaccines. Anal. Chem. 2022, 94, 4677–4685. [Google Scholar] [CrossRef] [PubMed]
- Hengelbrock, A.; Schmidt, A.; Helgers, H.; Vetter, F.L.; Strube, J. Scalable mRNA Machine for Regulatory Approval of Variable Scale between 1000 Clinical Doses to 10 Million Manufacturing Scale Doses. Processes 2023, 11, 745. [Google Scholar] [CrossRef]
- van der Bruggen, B. Microfiltration, ultrafiltration, nanofiltration, reverse osmosis, and forward osmosis. In Fundamental Modelling of Membrane Systems; Elsevier: Amsterdam, The Netherlands, 2018; pp. 25–70. ISBN 9780128134832. [Google Scholar]
- Russo, T. A Hands-On Guide to Ultrafiltration/Diafiltration Optimization Using Pellicon® Cassettes: Application Note; EMD Millipore Corporation: Burlington. MA, USA, 2013. [Google Scholar]
- Jung, H.N.; Lee, S.-Y.; Lee, S.; Youn, H.; Im, H.-J. Lipid nanoparticles for delivery of RNA therapeutics: Current status and the role of in vivo imaging. Theranostics 2022, 12, 7509–7531. [Google Scholar] [CrossRef]
- McKay, P.F.; Hu, K.; Blakney, A.K.; Samnuan, K.; Brown, J.C.; Penn, R.; Zhou, J.; Bouton, C.R.; Rogers, P.; Polra, K.; et al. Self-amplifying RNA SARS-CoV-2 lipid nanoparticle vaccine candidate induces high neutralizing antibody titers in mice. Nat. Commun. 2020, 11, 3523. [Google Scholar] [CrossRef]
- Zhang, H.; Rombouts, K.; Raes, L.; Xiong, R.; de Smedt, S.C.; Braeckmans, K.; Remaut, K. Fluorescence-Based Quantification of Messenger RNA and Plasmid DNA Decay Kinetics in Extracellular Biological Fluids and Cell Extracts. Adv. Biosyst. 2020, 4, e2000057. [Google Scholar] [CrossRef]
- Kudsiova, L.; Lansley, A.; Scutt, G.; Allen, M.; Bowler, L.; Williams, S.; Lippett, S.; Stafford, S.; Tarzi, M.; Cross, M.; et al. Stability testing of the Pfizer-BioNTech BNT162b2 COVID-19 vaccine: A translational study in UK vaccination centres. BMJ Open Sci. 2021, 5, e100203. [Google Scholar] [CrossRef]
- Szebeni, J.; Kiss, B.; Bozó, T.; Turjeman, K.; Levi-Kalisman, Y.; Barenholz, Y.; Kellermayer, M. New insights into the structure of Comirnaty COVID-19 vaccine: A theory on soft nanoparticles with mRNA-lipid supercoils stabilized by hydrogen bonds. bioRxiv 2022. [Google Scholar]
- Thaller, A.; Schmauder, L.; Frieß, W.; Winter, G.; Menzen, T.; Hawe, A.; Richter, K. SV-AUC as a stability-indicating method for the characterization of mRNA-LNPs. Eur. J. Pharm. Biopharm. 2023, 182, 152–156. [Google Scholar] [CrossRef] [PubMed]
- Zhao, H.; Wang, T.-C.; Li, X.-F.; Zhang, N.-N.; Li, L.; Zhou, C.; Deng, Y.-Q.; Cao, T.-S.; Yang, G.; Li, R.-T.; et al. Long-term stability and protection efficacy of the RBD-targeting COVID-19 mRNA vaccine in nonhuman primates. Signal Transduct. Target. Ther. 2021, 6, 438. [Google Scholar] [CrossRef] [PubMed]
- Helgers, H.; Hengelbrock, A.; Schmidt, A.; Strube, J. Digital Twins for Continuous mRNA Production. Processes 2021, 9, 1967. [Google Scholar] [CrossRef]
- Schmidt, A.; Helgers, H.; Vetter, F.L.; Zobel-Roos, S.; Hengelbrock, A.; Strube, J. Process Automation and Control Strategy by Quality-by-Design in Total Continuous mRNA Manufacturing Platforms. Processes 2022, 10, 1783. [Google Scholar] [CrossRef]
- Schmidt, A.; Helgers, H.; Lohmann, L.J.; Vetter, F.; Juckers, A.; Mouellef, M.; Zobel-Roos, S.; Strube, J. Process analytical technology as key-enabler for digital twins in continuous biomanufacturing. J. Chem. Technol. Biotechnol. 2022, 97, 2336–2346. [Google Scholar] [CrossRef]
- Helgers, H.; Hengelbrock, A.; Schmidt, A.; Vetter, F.L.; Juckers, A.; Strube, J. Digital Twins for scFv Production in Escherichia coli. Processes 2022, 10, 809. [Google Scholar] [CrossRef]
- Helgers, H.; Hengelbrock, A.; Schmidt, A.; Rosengarten, J.; Stitz, J.; Strube, J. Process Design and Optimization towards Digital Twins for HIV-Gag VLP Production in HEK293 Cells, including Purification. Processes 2022, 10, 419. [Google Scholar] [CrossRef]
- Helgers, H.; Schmidt, A.; Strube, J. Towards Autonomous Process Control—Digital Twin for CHO Cell-Based Antibody Manufacturing Using a Dynamic Metabolic Model. Processes 2022, 10, 316. [Google Scholar] [CrossRef]
- Hengelbrock, A.; Helgers, H.; Schmidt, A.; Vetter, F.L.; Juckers, A.; Rosengarten, J.F.; Stitz, J.; Strube, J. Digital Twin for HIV-Gag VLP Production in HEK293 Cells. Processes 2022, 10, 866. [Google Scholar] [CrossRef]
- Mouellef, M.; Szabo, G.; Vetter, F.L.; Siemers, C.; Strube, J. Artificial Neural Network for Fast and Versatile Model Parameter Adjustment Utilizing PAT Signals of Chromatography Processes for Process Control under Production Conditions. Processes 2022, 10, 709. [Google Scholar] [CrossRef]
- FDA perspective on continuous manufacturing. In Proceedings of the IFPAC Annual Meeting, Baltimore, MD, USA, 22–25 January 2012.
- ICH Expert Working Group. Pharmaceuticel Development Q8(R2): ICH Harmonised Tripartite Guideline; ICH Expert Working Group: Geneva, Switzerland, 2009. [Google Scholar]
- ICH Expert Working Group. ICH Q12—Technical and Regulatory Considerations for Pharmaceutical Product Lifecycle Management; ICH Expert Working Group: Geneva, Switzerland, 2020. [Google Scholar]
- Uhl, A.; Schmidt, A.; Hlawitschka, M.W.; Strube, J. Autonomous Liquid–Liquid Extraction Operation in Biologics Manufacturing with Aid of a Digital Twin including Process Analytical Technology. Processes 2023, 11, 553. [Google Scholar] [CrossRef]
- Vetter, F.L.; Zobel-Roos, S.; Mota, J.P.B.; Nilsson, B.; Schmidt, A.; Strube, J. Toward Autonomous Production of mRNA-Therapeutics in the Light of Advanced Process Control and Traditional Control Strategies for Chromatography. Processes 2022, 10, 1868. [Google Scholar] [CrossRef]
- Schmidt, A.; Helgers, H.; Vetter, F.L.; Juckers, A.; Strube, J. Digital Twin of mRNA-Based SARS-COVID-19 Vaccine Manufacturing towards Autonomous Operation for Improvements in Speed, Scale, Robustness, Flexibility and Real-Time Release Testing. Processes 2021, 9, 748. [Google Scholar] [CrossRef]
- Schmidt, A.; Helgers, H.; Vetter, F.L.; Juckers, A.; Strube, J. Fast and Flexible mRNA Vaccine Manufacturing as a Solution to Pandemic Situations by Adopting Chemical Engineering Good Practice—Continuous Autonomous Operation in Stainless Steel Equipment Concepts. Processes 2021, 9, 1874. [Google Scholar] [CrossRef]


| Exp. No. | mRNA/pDNA | mRNA/pDNA (mg/mL) | Ion. Lipid (mg/mL) | PEG-Lipid (mg/mL) | DSPC (mg/mL) | Cholesterol (mg/mL) |
|---|---|---|---|---|---|---|
| 0 | (pos. control) | 0 | 11.8 | 1.4 | 2.5 | 5.5 |
| 1 | pDNA | 0.27 | 11.8 | 1.4 | 2.5 | 5.5 |
| 2 | lin. pDNA | 0.27 | 11.8 | 1.4 | 2.5 | 5.5 |
| Scale (mL) | Preparation Method | Nucleic Acid | Mean Hdrodynamic Radius (nm) | Min. Hydrodymanic Radius | Max. Hydrodynamic Radius | Polydispersity Index | Encapsulation Efficiency (%) |
|---|---|---|---|---|---|---|---|
| 0.5 | Batch | – | 52 ± 6 | 44 | 69 | 0.012 | – |
| 0.5 | Batch | pDNA | 52 ± 6 | 45 | 66 | 0.012 | – |
| 1.5 | Batch | – | 48 ± 6 | 39 | 69 | 0.017 | – |
| 1.5 | Batch | pDNA | 43 ± 4 | 34 | 63 | 0.021 | 90 |
| 1.5 | Batch | lin. pDNA | 60 ± 10 | 36 | 75 | 0.027 | 32 |
| 12 | Continuous | pDNA | 35 ± 2 | 30 | 45 | 0.004 | 88 |
Disclaimer/Publisher’s Note: The statements, opinions and data contained in all publications are solely those of the individual author(s) and contributor(s) and not of MDPI and/or the editor(s). MDPI and/or the editor(s) disclaim responsibility for any injury to people or property resulting from any ideas, methods, instructions or products referred to in the content. |
© 2023 by the authors. Licensee MDPI, Basel, Switzerland. This article is an open access article distributed under the terms and conditions of the Creative Commons Attribution (CC BY) license (https://creativecommons.org/licenses/by/4.0/).
Share and Cite
Hengelbrock, A.; Schmidt, A.; Strube, J. Formulation of Nucleic Acids by Encapsulation in Lipid Nanoparticles for Continuous Production of mRNA. Processes 2023, 11, 1718. https://doi.org/10.3390/pr11061718
Hengelbrock A, Schmidt A, Strube J. Formulation of Nucleic Acids by Encapsulation in Lipid Nanoparticles for Continuous Production of mRNA. Processes. 2023; 11(6):1718. https://doi.org/10.3390/pr11061718
Chicago/Turabian StyleHengelbrock, Alina, Axel Schmidt, and Jochen Strube. 2023. "Formulation of Nucleic Acids by Encapsulation in Lipid Nanoparticles for Continuous Production of mRNA" Processes 11, no. 6: 1718. https://doi.org/10.3390/pr11061718