Article

Is Regulatory Approval without Autonomous Operation for Natural Extract Manufacturing under Economic Competitiveness and Climate-Neutrality Demands Still Permissible?

Institute for Separation and Process Technology, Clausthal University of Technology, Leibnizstr. 15, D38678 Clausthal-Zellerfeld, Germany
*
Author to whom correspondence should be addressed.
Processes 2023, 11(6), 1790; https://doi.org/10.3390/pr11061790
Submission received: 3 May 2023 / Revised: 3 June 2023 / Accepted: 7 June 2023 / Published: 12 June 2023
(This article belongs to the Special Issue Towards Autonomous Operation of Biologics and Botanicals)

Abstract

:
Natural extracts are broadly utilized as remedies, nutrition additives, cosmetics or flavors as well as natural pesticides, fungicides or herbicides. Green manufacturing technologies are of added market value and are sustainable towards the climate neutrality politically demanded for 2045. The concept of digital twins involves experimentally distinct validated process models combined with process analytical technology that is to be adapted to the existing operations. This is a key technology for the autonomous operations in industry 4.0. This paper exemplifies this approach and evaluates the results of the application and implementation efforts of regulated industries. A conductivity sensor for the measurement of the dry residue content and/or Fourier-transformed infrared spectroscopy for marker/lead or reference substance concentration determination are the most feasible and straight forward solutions. Different process control concepts from simple PID controllers (proportional, integral and differential) to advanced process control using digital twin models are evaluated and discussed in terms of industrialization efforts and benefits. The global warming potential CO2 equivalent per kg of natural product could be decreased by a factor of 5–10 as well as the cost of goods, which makes the pay-out time for the industrialization investment less than 1 year and the approach highly competitive. The success rate of the extraction process under regulatory constraints can be raised to 100%, reducing waste, overall solvent consumption, personnel efforts and energy requirements to a minimum.

1. Introduction

The Quality by Design (QbD) approach to process development, originally developed for the pharmaceutical industry, can be applied to other process industries as well. By emphasizing process robustness and understanding through process modelling and implementing digital twins and process analytical technologies (PATs), QbD can facilitate advanced process control (APC) through model predictive control and process status evaluation.
The industry that produces goods from renewable resources, specifically plants, is a significant supplier of versatile products and has been experiencing growth. The range of applications for these products is extensive, including pharmaceuticals, food, health and nutrition as well as plant protection for ecological farming, construction materials, basic chemicals and energy resources [1,2,3,4,5,6,7].
The plant processing industry, particularly in regulated sectors, predominantly employs traditional extraction processes. This is due to the regulatory environment that ties manufacturing approvals to traditional processes, hindering the optimization and development of processes. As a result, the dependence on conventional manufacturing methods may lead to the suboptimal utilization of raw materials due to the selection of inappropriate process parameters. Additionally, traditional extraction methods can cause high process variabilities and poor stability. To address these issues, innovative approaches, such as Quality by Design, which incorporates process analytical technology, offer potential solutions to meet the regulatory requirements, including reducing product variability across production batches [8,9,10].
Traditionally, the extraction process is performed with a constant flow rate over a set amount of time or until a set amount of solvent is consumed. A novel process control strategy should take information from the process to control it to achieve an optimal result for each batch. This is especially important considering the variation in plant material quality, which is the basis of all phytoproducts. The goal of this work is to establish a novel control strategy for the extraction process to enable it to have a high success rate under the regulatory constraints while optimizing it to obtain a high space–time yield and low solvent consumption. These factors are key to enabling a climate-neutral industry while keeping a competitive advantage in the global market.

1.1. Solid–Liquid Extraction

The extraction of natural components or component groups with suitable organic or water-based solvents has been described and modelled [11,12,13]. Those models have been extensively experimentally validated [14,15] for either maceration or percolation.
The idea of autonomous operation was proposed by Uhlenbrock [16,17], was detailed by Jensch [18] and is shown in Figure 1. This is based on process analytical technologies (PATs), with a conductivity sensor for the measurement of the dry residue (DR) content to control this process parameter and an FTIR detector, as shown in Figure 1. Studies on various component systems [19,20] have been conducted for the determination of marker/lead substances or even reference substances as defined in the drug master file for regulatory approval [21]. In the following section, this concept is explained in detail and is exemplified as well as discussed and evaluated in terms of industrialization.

1.2. Regulatory Considerations

The regulatory requirements for a plant extract depend on its intended use. For food supplements (NEM), no special requirements are set, as the applied regulatory constraints for food products are set [21].
Contrast extracts used for pharmaceutical products have to fulfill specific regulatory requirements. For extracts where the total dry residue is the target component, the drug–extract ratio (DER) is chosen as the regulatory parameter. This is calculated according to Equation (1) with the plant mass m p l a n t and the mass of the dry residue m D R . The upper and lower limits are defined for the DER, which must be observed. The boundaries are of a magnitude between 4 and 7:1 for plants obtained through cultivation [14].
D E R = m p l a n t m d r y   r e s i d u e : 1
For the analytical concept, a lead substance (“marker”) is established, which is used for recovery estimation, stability studies, etc. This group of extracts is officially called “other extracts”.
If a specific group of ingredients, e.g., flavonoids for ginkgoes [22], is the target of extraction, the marker substance is representative of the substance class. In this case, the total content of the extract of the substance class is inferred from the so-called marker or lead substance. The extracts are classified as quantified extracts. Quality requirements, such as the DER, are set by the published monographs in the European union [23]; growing and collection procedures as well as primary processing are set by the Good Agricultural and Collection Practice (GACP) [24,25].
If a component with a proven pharmacological effect is the target substance of extraction, it is called the reference substance. This is the case for only a small group of herbal remedies. The DER has to be determined for all classes of extracts used for herbal remedies [26].
Another regulatory specification that is frequently used is the solvent ratio, which is shown in Equation (2). This indicates which ratio of solvent ( V s o l v e n t ) to plant material is prescribed. The intention is to guarantee complete extraction [27].
S M R = V s o l v e n t m p l a n t

1.3. Digital Twin

Digital twins are virtual models that mirror physical objects or processes. They enable real-time connections between the physical and virtual worlds, making it possible to monitor and control these objects from any location. Digital twins can represent any living or non-living object, from airplanes to production equipment to people. Digital twins are being developed and, in some cases, are already in use in all sectors of industry and society. Some important application areas are preventive maintenance, process monitoring, testing and continuous optimization [28,29].
The basis for the scalable digital twin in process engineering is always a validated physicochemical process model. By separating thermodynamics, reaction kinetics and fluid mechanics, the process model can be transferred to other scales. For control, the process model must be validated with respect to the process to represent it as accurately and precisely as the process is. For use as a digital twin, a bidirectional interface is required to ensure communication between the process and the digital twin. This must be faster than how fast a new state can occur in the process. In this way, model predictive control of the process can be implemented [30,31].
The course of the development of a digital twin starting from steady-state or dynamic process models over validated models and a digital shadow has been defined and demonstrated manifold in the meantime, e.g., in [32,33,34,35]. Model development and validation run through the process developed by Sixt and was tested many times [9,10,15,36]. For development, it must be proven through simulation that the digital twin can sufficiently fulfill the control task set for it. For this purpose, process optimization is first performed with the validated process model and the experimentally determined model parameters. For this optimized operating point, a risk analysis is performed to determine the limits of the safe operating range. Within this operating range, it can be guaranteed that the critical quality attributes (CQAs) are within the specified limits. For solid–liquid extraction, this is the DER. A subsequent PAT study explores whether the critical process parameters (CPPs) that determine the CQAs can be measured and how accurate this measurement is. With this data, a simulation study tests whether a stable process can be run. This involves testing in various disturbance scenarios when the product is still within the limits of the CQAs.
If controllability is proven, the digital twin is implemented in an existing process. This is performed as shown in Figure 2 for the first time via standardized data interfaces. If the data exchange and the simulation of the digital twin are performed at a sufficient speed, a demonstration with the real process can be performed. A sufficient speed is achieved here when the control system can intervene in the running process faster than a new operating state is established.

2. Process Development

2.1. Process Model

In this study, a model developed and validated by Sixt [15] was used. This included mass transport through the extraction column in the form of an axial dispersion model. This considered both convective and dispersive mass transport in the axial direction of the extraction apparatus. In addition, mass transfer from the solid to the liquid phase was considered. This was performed with a pore diffusion model, which described the mass transfer within the plant material. The particles were assumed to be spherical. A Langmuir model was used for the desorption of the components under consideration within the particles [11,37].

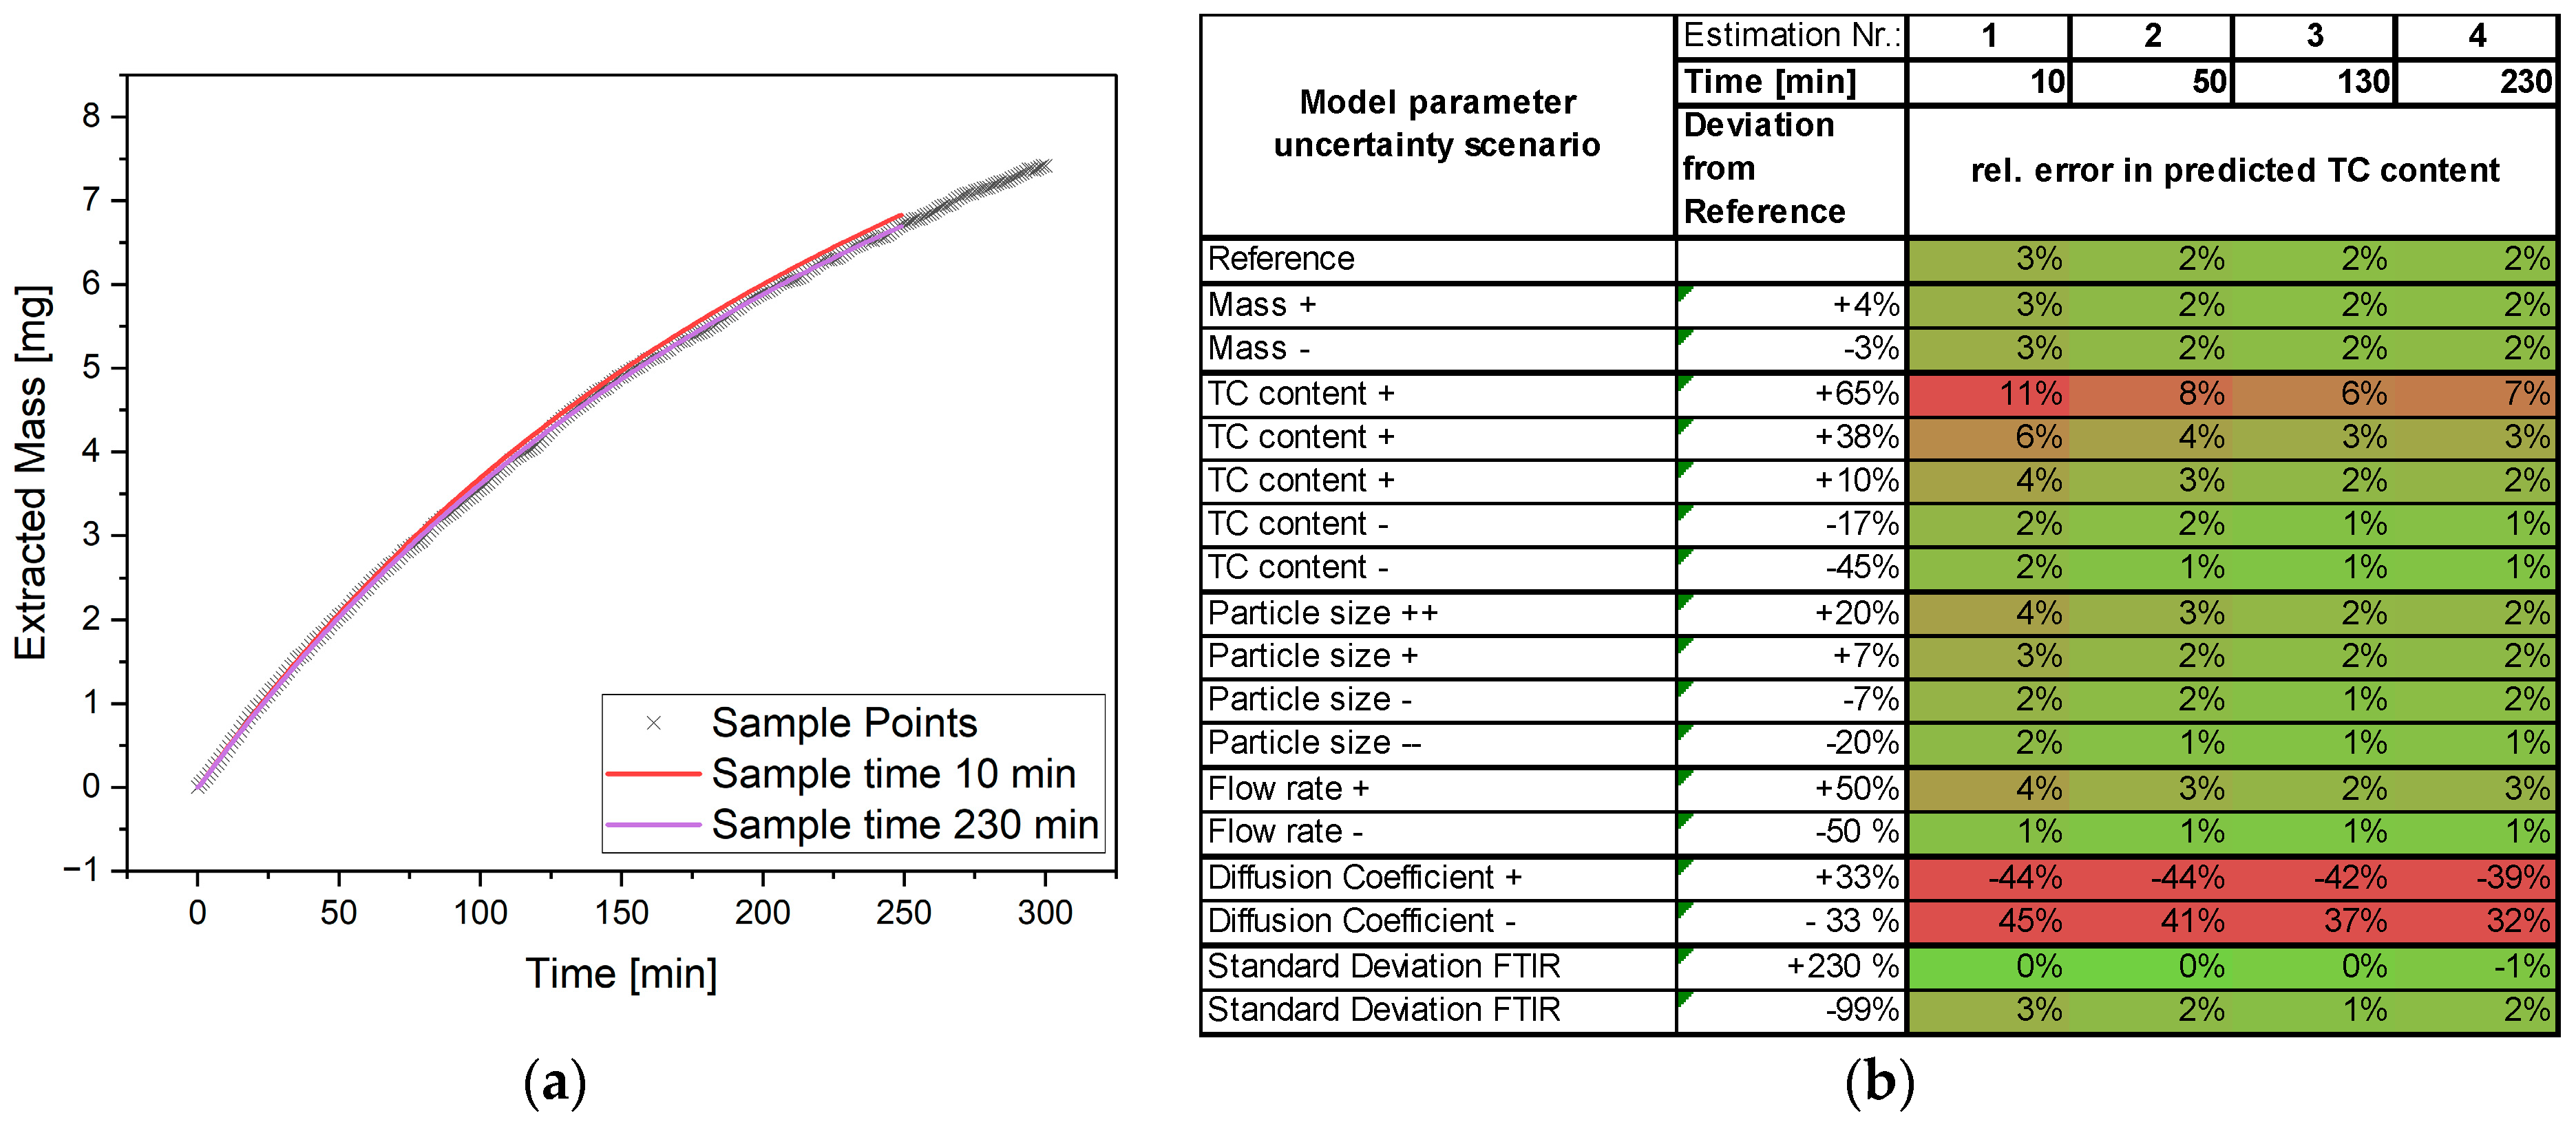
2.2. Process Model Parameter Determination

Model parameter determination followed the scheme described in Kaßing, Altenhöner and others [38,39,40] and demonstrated in Uhlenbrock [16]. Existing correlations from Altenhöner [41] were used for the axial dispersion coefficient. For the determination of the maximum loading of the Langmuir model of the particles, exhaustive percolation was performed. Furthermore, a series of macerations was performed to determine the equilibrium parameter K h of the Langmuir model. At last, the pore diffusion had to be quantified, and this was performed through percolation experiments [11,42].

2.3. Process Analytical Technologies

An established chromatography method was used for the quantitative determination of the content of the target component from the samples [18]. One goal of process development in the area of Quality by Design is the online monitoring of product quality. For this purpose, FTIR was investigated as PAT following the procedure described in [18]. For calibration and PLS model building, the samples from model parameter determination were measured using this measurement method. A model with a good correlation between spectrum and target component content could be formed (calibration: R² = 0.999) (validation: 0.937). Furthermore, a strong correlation between electrical conductivity of the extract and extracted dry residue could be observed in previous work [18]. Linear regression between conductivity and concentration of dry residue showed a good correlation score of R² = 0.997. For the system investigated in this study, a similar procedure was performed, and a strong correlation was also observed. Thus, a sufficiently accurate online measurement procedure was established for both target components.

2.4. Operating Point Determination

In the context of QbD-based process design, the modeling and simulation of the processes were relied upon. The primary goal was to maximize product quality and space–time yield. In the case of phytoextraction, the trade-off between plant material yield and productivity was of particular importance here. To determine the optimum operating point, the process attributes (space–time yield and productivity) were investigated here by simulating the process at different volumetric flows. In addition, the yield was also considered. All process attributes are shown in Figure 3 in relation to volumetric flow rate.
A typical behavior of extraction processes could be observed [43,44,45]. At high volume flow rates, the time until a yield was achieved decreased asymptotically since the kinetic limitation was reached here. At low volumetric flows, on the other hand, the equilibrium limit was reached. The optimum operating point was determined by combining the space–time yield and productivity, and it was about 0.5 CV/min. This value depended on the kinetic and equilibrium behavior of the plant material and the target component.
For the current example, the following was considered with respect to the DER. For extraction, a DER of 5.7 was obtained for the selected extraction conditions. For a variation of ±25% of the DR content of the plant material, bands for the DER were set from 4.5 to 7.5 as shown in Figure 4. For a plant material with a higher dry content distribution of ±50%, DER bands of 3.7 to 11.3 would result. Due to the reciprocal character of the DER, a higher dry residue content in the plant material caused a smaller absolute deviation in the DER than the “deterioration” of the plant material quality.

3. Process Control Studies

With an optimal operating point, different control strategies were tested and evaluated. These were examined according to the disturbance scenarios and their effects on the critical quality attributes as well as the process attributes.
This was performed by simulating the control strategies. In doing so, the influences of the individual parameters were examined in an initial one-factor-at-a-time (OFAT) study, and the interactions of the parameters were examined in a multiple-factor-at-a-time study (MFAT). This was performed in an expectable range of process and operational parameters (Table 1). The evaluation was achieved using ordinary least squares regression. The quality of regression was quantified using the coefficient of determination R², and the influences of the operating and process parameters were quantified using the p-value. For clarity and understanding, these were converted to qualitative scores. Here, the highest values were given for the strongest influences. By multiplying the highest influences on the relevant process and the quality attributes, an overall score was determined as previously calculated in [31,33].

3.1. Fixed Cutoff Time

With a fixed cutoff time, the extraction process is operated with a constant volume flow independent of the plant material. In this case, the process was terminated after a previously determined time. The advantage of this strategy is a simple design methodology.
As shown in Figure 5, the result of this process was highly sensitive to the volume flow, plant mass and target component content of the plants. Unconscious and conscious changes are included in this process evaluation. Here, it also depended on what performance key figure was important to the operator of the plant. Should this be limited to the DER, only the content of dry residue would be important. For example, the concentration of the target component in the extract was most dependent on the volume flow. As such, the evaluation could be tailored to the regulatory constraints and the important CQAs for downstream processing.

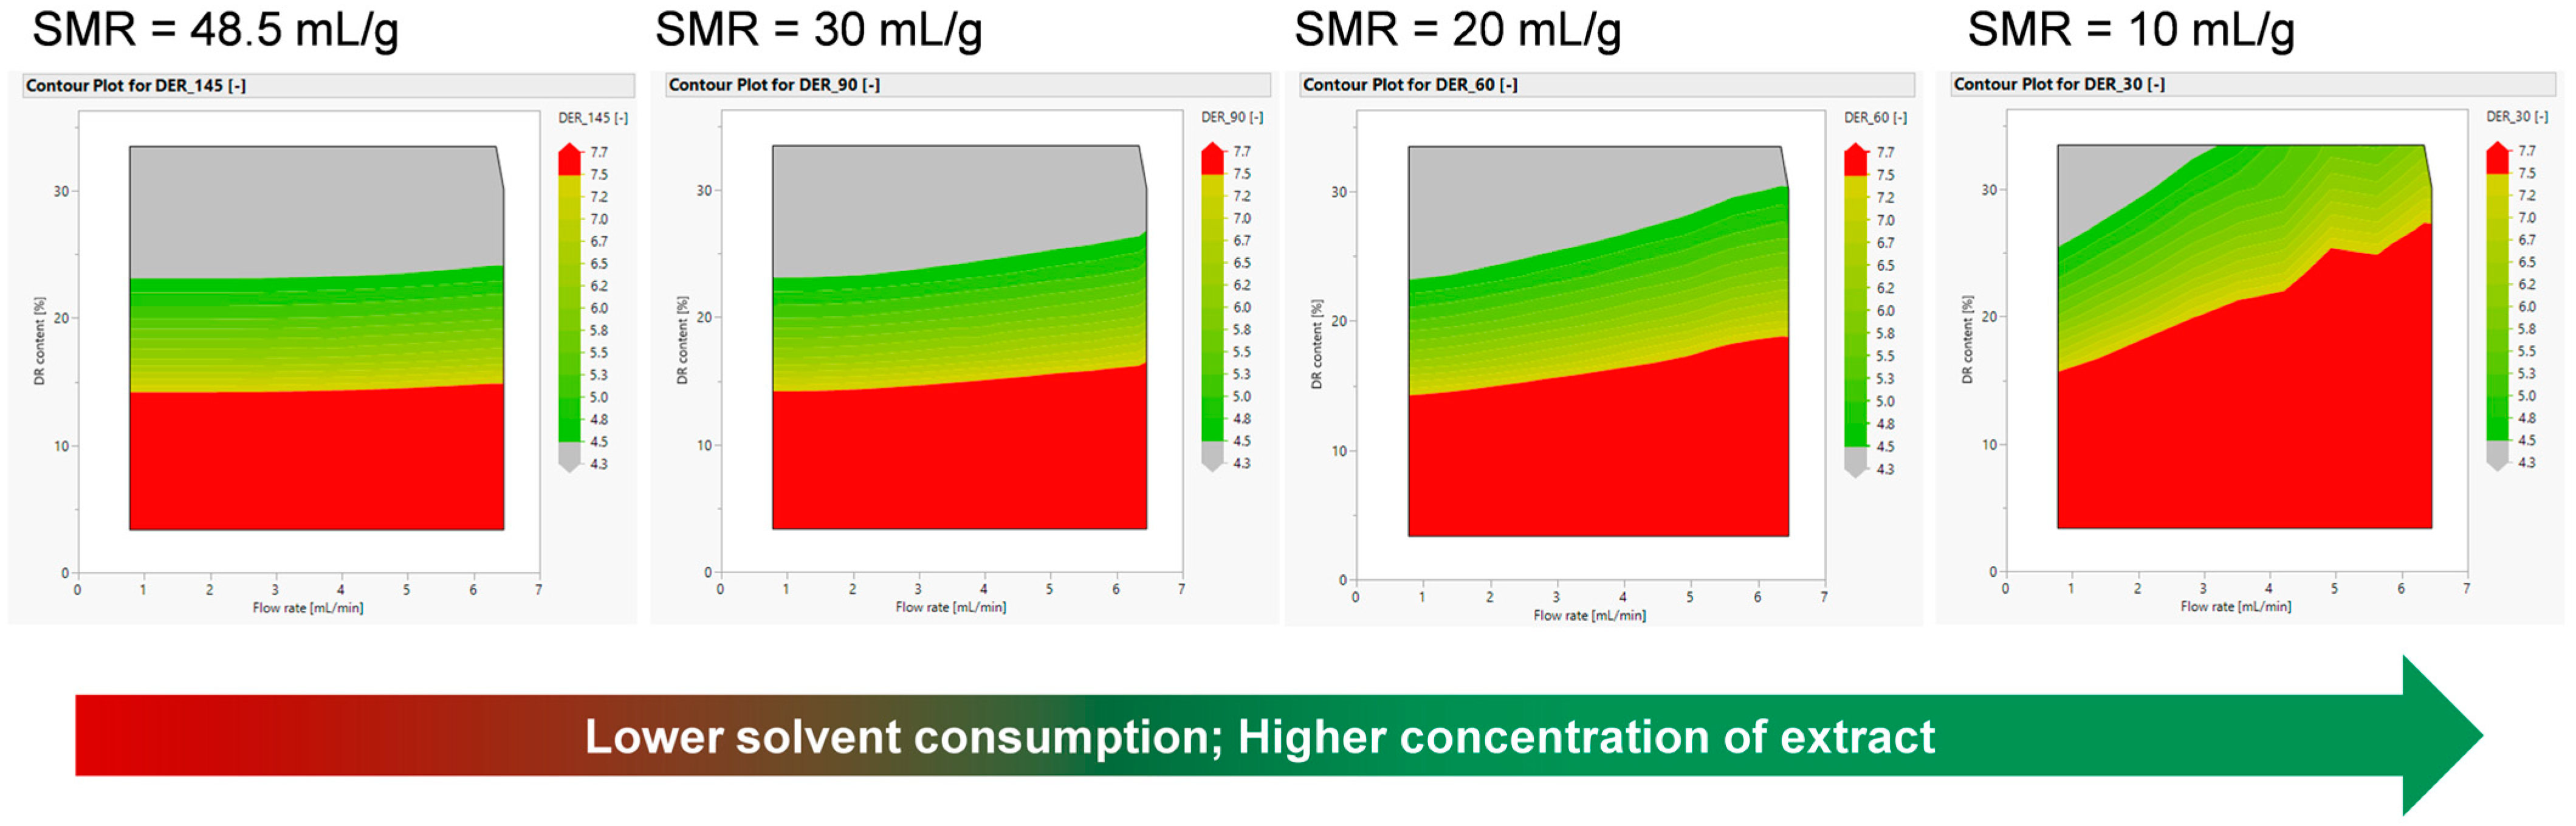
3.2. Fixed Solvent–Drug Ratio
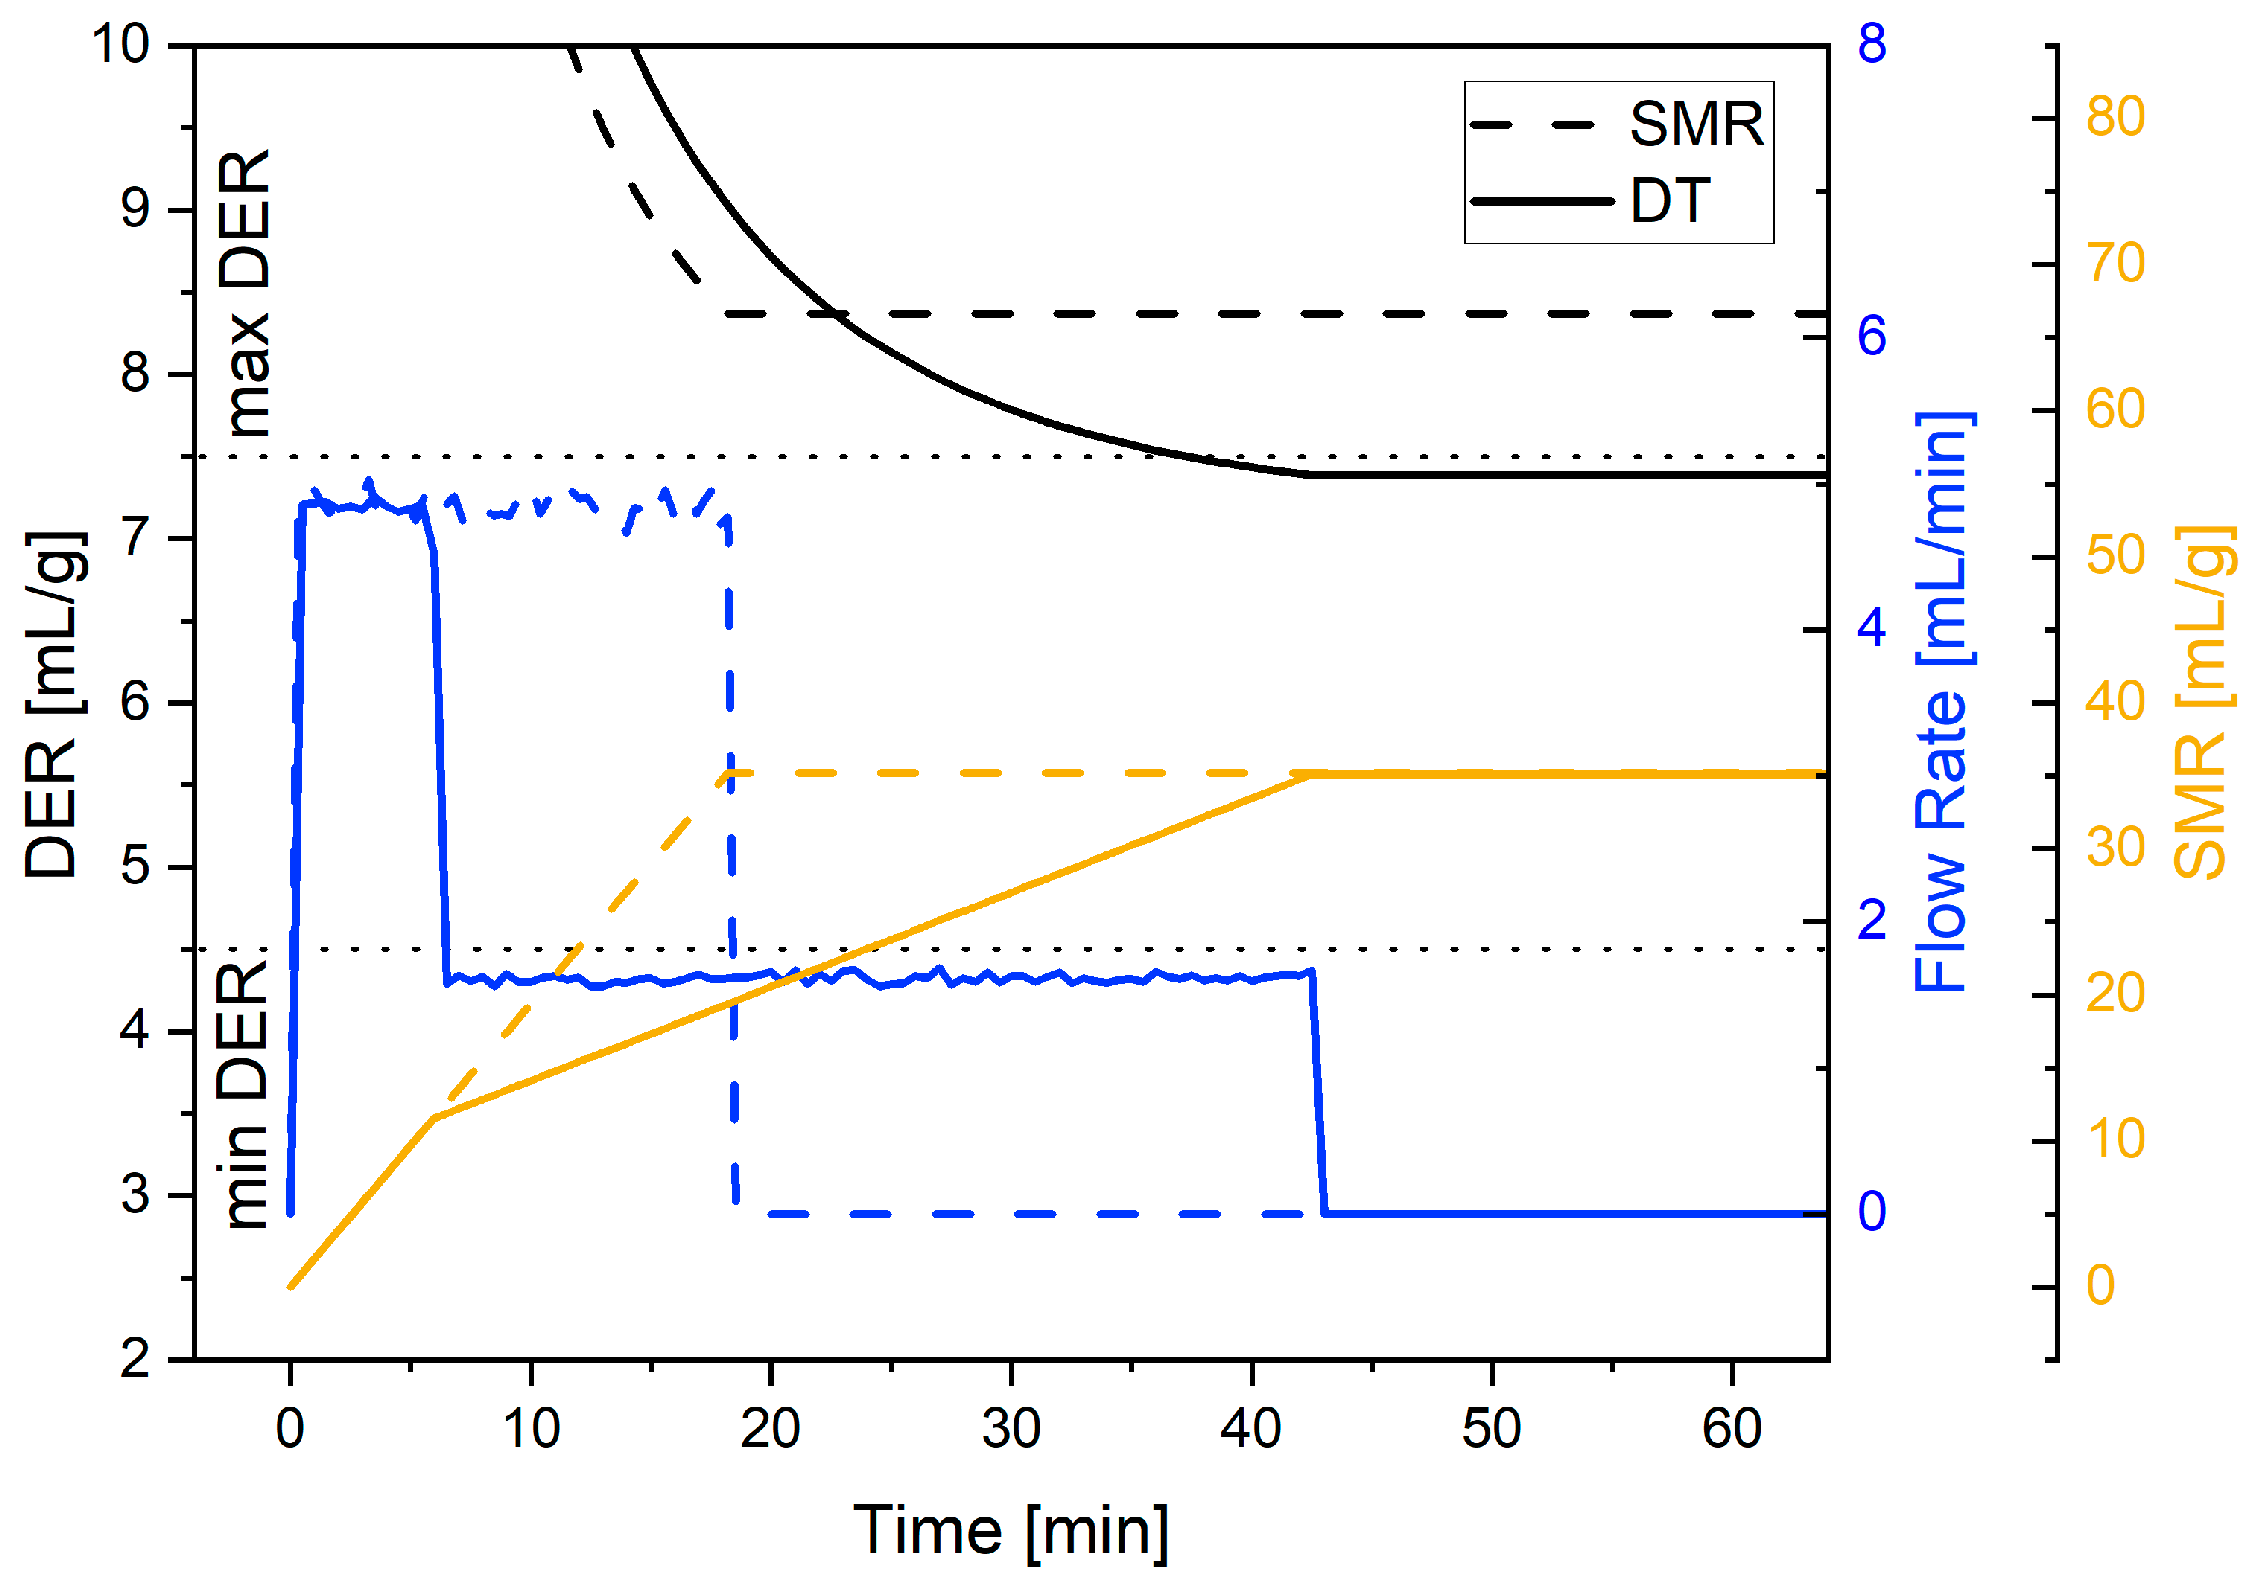
In this control strategy, extraction is carried out with a fixed volume of solvent. The amount of solvent is determined through a series of piloting experiments and is set to ensure the total extraction of the target component. This can prove to be wasteful in terms of the solvent and can result in a less concentrated extract. The process attributes and quality attributes are strongly dependent on the selected solvent ratio; here, one was selected according to the reference process. The risk assessment is shown in Figure 6.
Solvent consumption was not a process attribute here since, in the control strategy, the amount consumed was set by process development. It is shown that, compared to the fixed cutoff time strategy, the volumetric flow rate and the plant mass were not very sensitive here. However, the size of the particles played a greater role. This can be explained by the higher diffusion due to the shorter diffusion path of the dry residue into the extract. Since it could no longer be offset by a higher flow rate in the simulation studies, it gained importance in particular in its interaction with other parameters as can be seen in Figure 6.

3.3. In-Line Cutoff

In the course of developing a PAT strategy for the quality monitoring of the process, the measurement of electrical conductivity for the dry residue and FTIR for the marker substance were determined as quantitative measurement methods. These can be used as control technologies. For the in-line cutoff control strategy, the minimum value of the target component or the dry residue is determined at which the extraction is considered complete. Until this in-line concentration is reached, extraction is carried out at a constant volume flow rate.
By establishing this control strategy, the effect of the volume flow, particle size and plant material mass can be reduced, especially on the DER, as shown in Figure 7. The content of the target component/dry residue in the plant material remains a major influence on the quality of the extract and the productivity of the process. The severity of all other processes and operating parameters can be reduced by implementing this control strategy.

3.4. PID-Controlled Process

The extension of this control strategy is the direct control of the volume flow via the concentration of the target component or dry residue in the extract. The PID controller reduces the volume flow to maintain a high concentration in the extract until a minimum volume flow is reached at which the process is stopped. This requires the concentration measurement to be as fast as possible. In the simulation studies used, the signal of the measurement signal was assigned an experimentally determined standard deviation and a delay in order to simulate the real process conditions as well. This is shown in Figure 8.
From this simulation, the process and operating parameters shown in Table 1 were used to simulate and evaluate the influences.
The risk assessment of this control strategy in Figure 9 showed a pattern similar to that of the cutoff control. This was due to the fact that both strategies were related to the same signal and were expected.

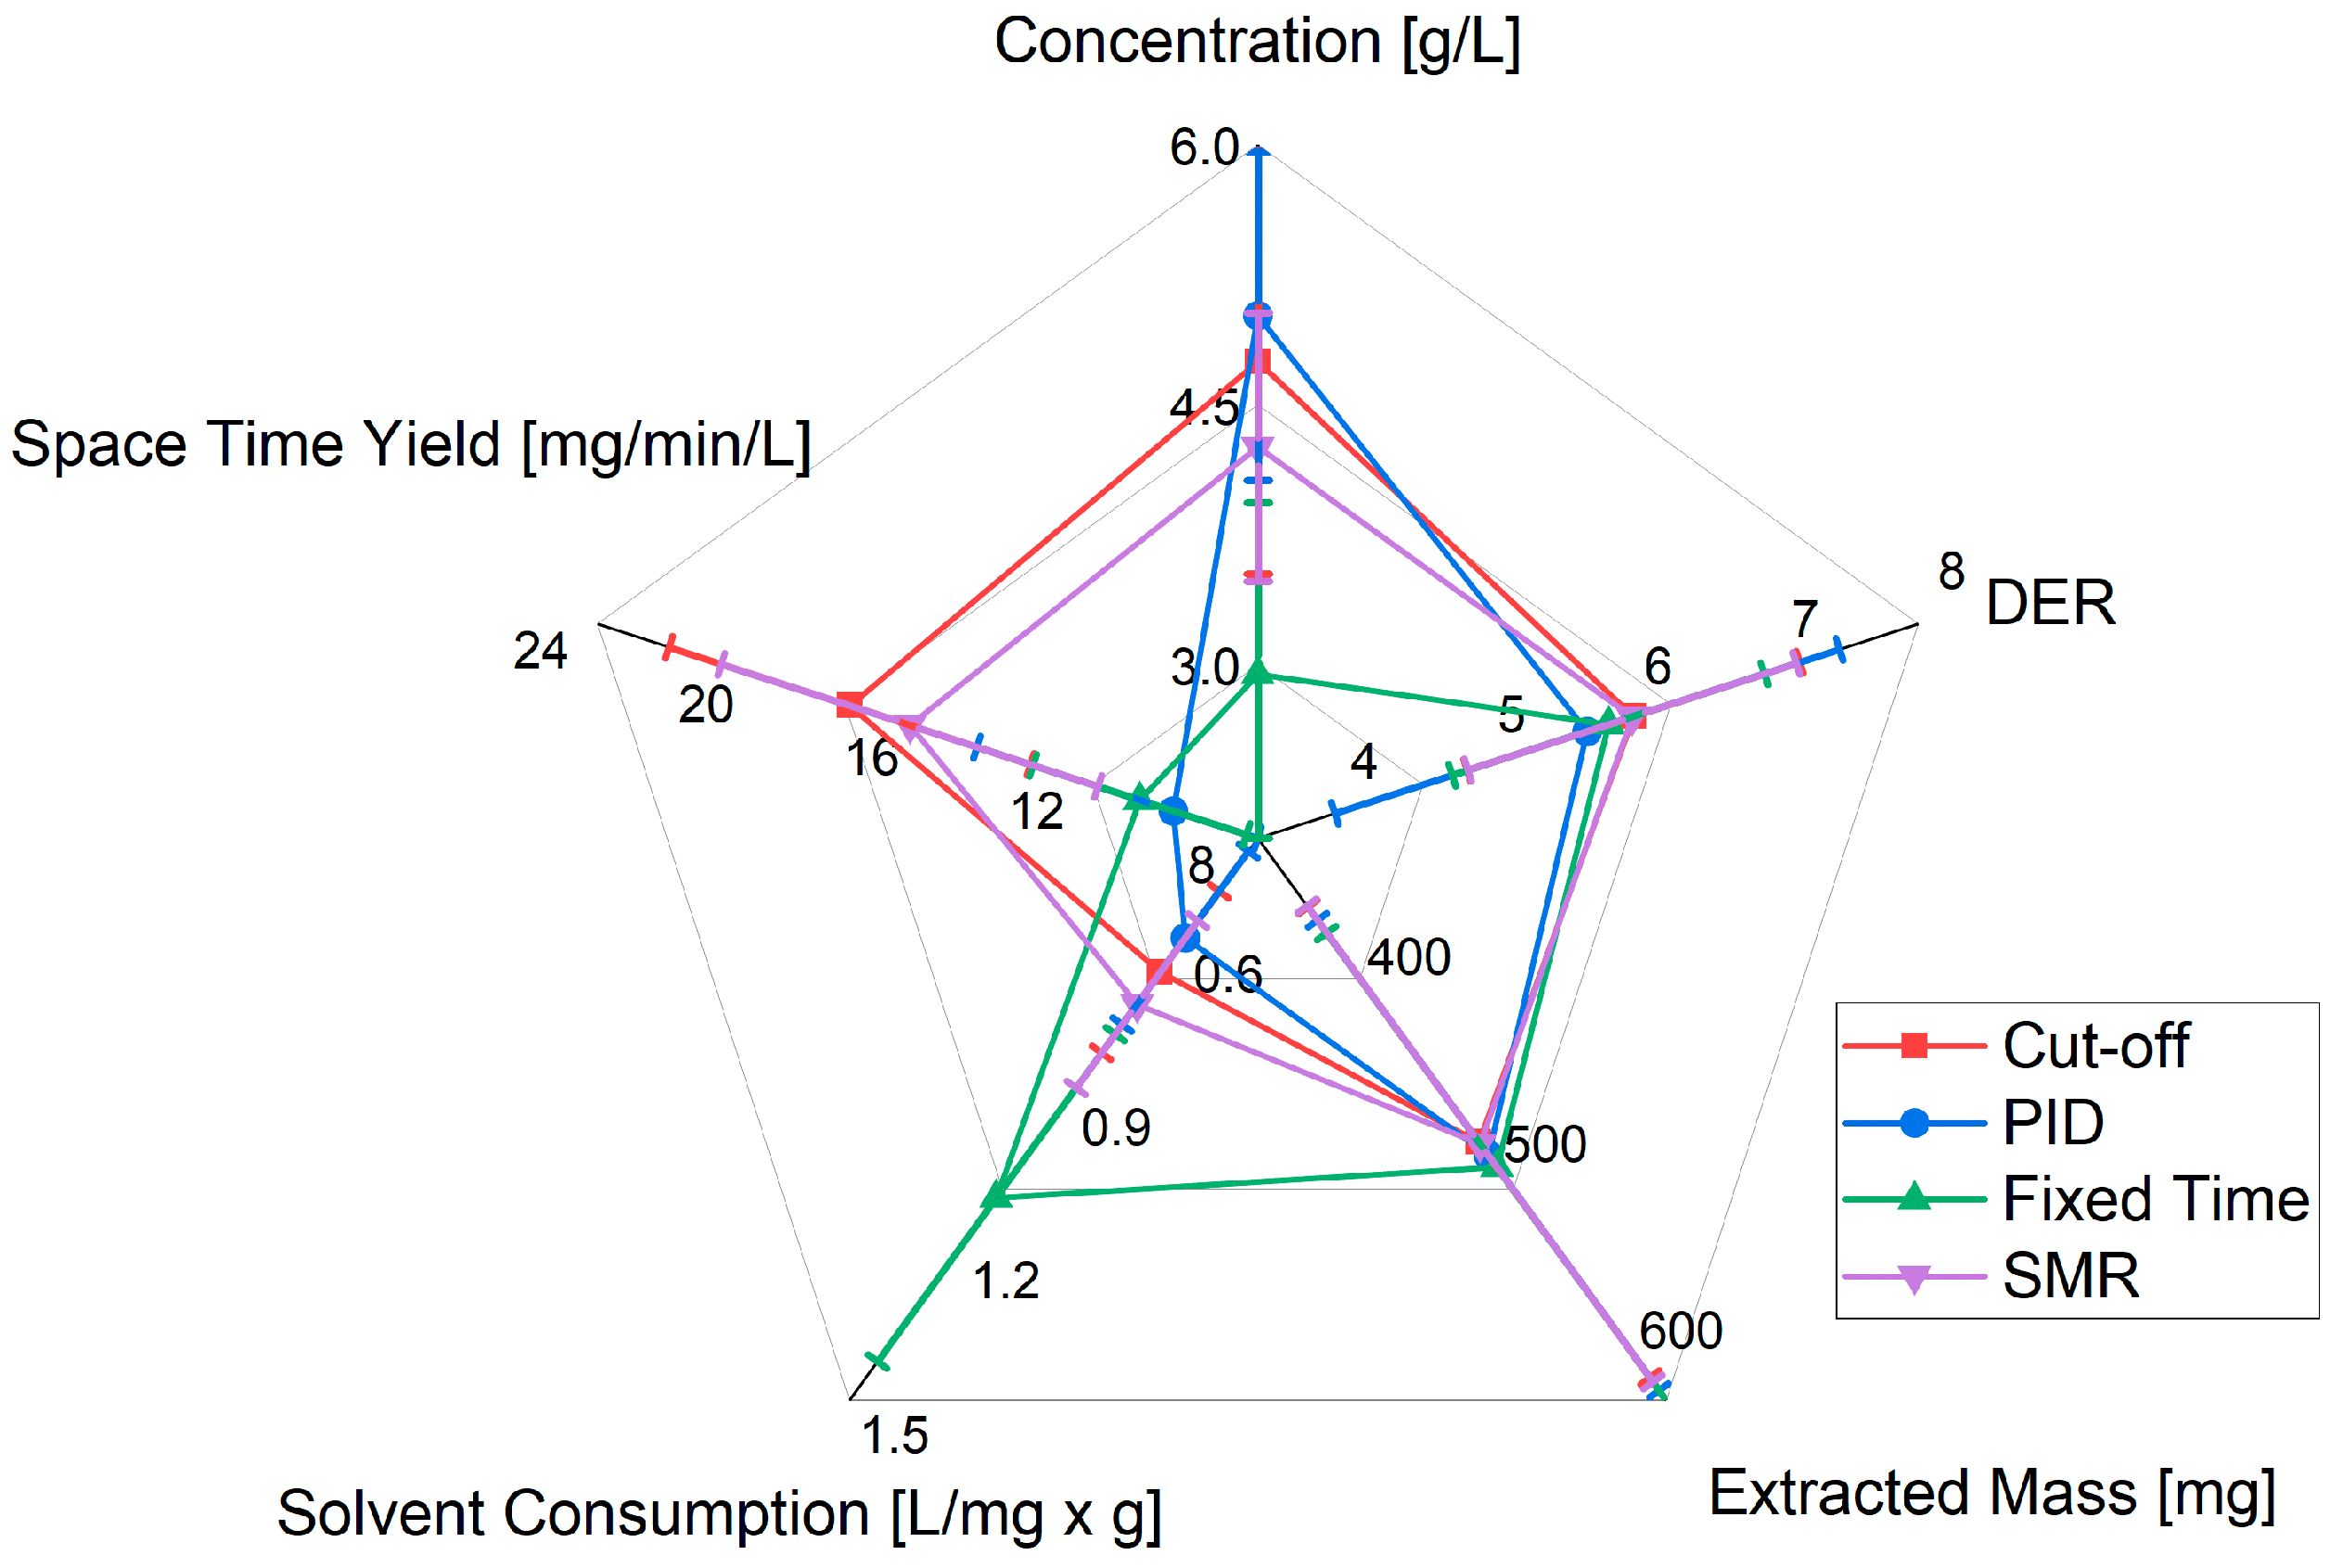
3.5. Comparative Evaluation

The quantitative comparison of the control strategies is shown in Figure 10. Again, the cutoff and PID strategies showed similar patterns for the reasons shown. However, it can be seen that the cutoff strategy showed more desirable values in all of the categories. Since the process was run to completion with a full volume flow, the space–time yield increased. The most inefficient control strategy was the fixed-time strategy, with the lowest space–time yield and the highest solvent consumption. This was due to the lack of ability to influence the existing process variables. The highest space–time yield and therefore the lowest COGs were achieved through the in-line cutoff strategy.

4. Digital Twin Performance Evaluation for Autonomous Operation

In all of the previous control strategies, the most sensitive process parameter was the target component/dry residue content of the plant material. To reduce this, a digital twin was proposed that was supported by on-line PATs (FTIR or electrical conductivity). By measuring the concentrations, the sum curves of the target components were formed, and these were used as the basis of an estimate of the total content of the plant material. In doing so, a proprietary algorithm reduced the sum of the squares of the error between the simulated cumulative curve and the measured one. This was performed at fixed intervals depending on the estimated process time.
Using this, the digital twin can accurately predict the course of extraction and can intervene in the process. First, the digital twin simulates the expected quality of the extract. If this does not meet the desired criteria, especially the DER, the volume flow can be adjusted. As shown in Figure 11, a lower volume flow rate can thus lead to more acceptable results from a regulatory point of view in respect to the DER even with a plant material of poorer quality, e.g., a lower dry residue content. The basis for this is shown in Figure 11; in these contour plots, the volume flow rate is varied on the X-axis, and the dry residue content is varied on the Y-axis. Thus, for a fixed SMR, the extract reached a different DER. In the figure, the regulatory defined areas are colored green. At a high SMR, the volume flow rate and dry residue content were not sensitive to the DER of the extract. On the other hand, at a lower SMR, if the dry residue content deviated negatively, a sufficiently good extract could only be achieved with a lower volume flow.
For the determination of the dry residue content, model parameters according to [15,16] were determined before the operation with the digital twin. In addition, the mass and particle size of the plant material had to be recorded. With these data, the course of the volume flow and the cumulative curve of the extraction process, the dry residue content of the plant material was determined. Figure 12a shows the exemplary estimation, and Figure 12b shows the evaluation of its quality with green color showing good fit. Here, a good estimate of the dry residue content could be given after 4 min of extraction time. This was performed for variations in the model, operating and process parameters. As expected, the accuracy of the estimate increased with a longer sampling time. A significant degradation of the quality of the estimate happened only due to inaccuracies in the recording of the particle size. However, a technical solution to ensure the measurement accuracy of the particle size is very cost-effective and ready-to-use [46,47].
For target components with a very low diffusion coefficient or slow mass transfer, data could be recorded over a longer time span, and the estimation could thus be improved. However, for specific target components, the measurement method used was FTIR. This may have a higher standard deviation at low concentrations and a higher percentage of minor components than the measurement of electrical conductivity. This is shown in Figure 13. Due to much slower extraction, the particle size did not have a high influence on the estimation quality here since the effect was superimposed by the slower desorption due to the shorter diffusion paths. The most inaccurate estimation was present for a deviation in the diffusion coefficient, the accuracy of this value could only be improved with the data from production. Thus, the performance of the digital twin will continue to improve after implementation [48,49,50].
Parameter estimation took 5 min on average but could be shortened to 2.5 min. Thus, a new optimized extraction strategy could be applied after 6.5 min. As demonstrated in Figure 14, after approximately 7 min, the volume flow was ramped down to continue to meet the bands of the DER at a regulatory SMR. If the process were to continue at a constant flow rate, this extract would have to be discarded. In the simulation studies, there was a 14% error rate when running at the SMR, and there was a 100% success rate when implementing the digital twin. The digital twin did slow down production and reduce the space–time yield; however, the higher success rate resulted in higher overall efficiency. More of the plant material could be used, reducing waste. This should be particularly reflected in the GWP balance since each discarded batch included not only the GWP of the process with solvent use but also of the entire value chain beforehand. This started with plant breeding or wild collection and also included GWP-intensive drying, which can make up 90% of the GWP of a botanical product [20,51].

5. Discussion

Pharmaceutical products are approved according to regulatory definitions, while non-prescription food products allow more degrees of freedom in manufacturing. The requirements have changed over the years.
Either the product is defined as a DR via a DER or a marker and lead substance as a non-pharmacologically active but analytically easily measurable representative of a substance group, while a reference substance has a pharmacological effect.
Under regulatory constraints, a DER range and an SMR are usually specified, and sometimes an extraction time and/or a particle size range is specified.
The DER implies that exceeding the lower limit would be economically efficient process-wise. With a low DR content per plant, the DER range may be exceeded, with rather high operating costs. Good plant material selection thus provides a narrow DER of 3–4:1 for cultivated plants but a DER of about 6–8:1 for wild collections.

5.1. Case 0—All Parameters (DER, SMR, Process Time Ranges) Fixed

If everything is specified, the process variance in the preliminary studies is taken out, and there is no more freedom to react to potential variations and disturbances. Any deviation is a batch out of specification.
If one wanted to improve this, a QbD approach would have to be pursued with respect to the DS and CS. This would be a re-registration with the corresponding expenses.
Pharmaceutical re-authorization is unlikely, but switching to NEM regulations would be reasonable. However, for the GMP, consider the current state of science and technology as a way to maintain the lower cost structure.

5.2. Case 1a—DER Range to Be Met, but SMR Free or Broad Range Defined

Rarely, the case occurs that a regulatory dry residue area DER is to be met and that no SMR is prescribed:
The optimum control strategy in this case is to stop the extraction process when the extract concentration falls below a critical level (in-line cutoff). The dry residue content of the extract is determined through the in-line measurement of the electrical conductivity so that the extraction can be stopped when this target value is reached.
In principle, the highest possible volume flow rate is selected without exceeding the kinetic limitation of the extraction in order to have a high space–time yield. The upper limit of the volume flow rate is determined in previous laboratory experiments. In these experiments, the conductivity value at which the extraction is terminated is also determined. The criterion for the termination value is the near exhaustion of the extraction.
  • In the process, approx. 9–40% of the solvent can be saved, and a 9–65% increase in the space–time yield can be achieved. The regulatory limits of the DER are reliably met.
  • This corresponds to a COG reduction of up to 65% (STY) and a GWP reduction of up to 40% (solvent).
This control strategy can optionally be supported by a digital shadow or digital twin. The task of this would be to predict the quality (concentration and DEV) of the extract during the extraction process and the termination of the extraction for predictive production planning.
  • In the process, approx. 14% of additional solvent can be saved, the space-time yield can increase by up to 14%, beacuse the success rate can be increased. The regulatory limits of the DER are reliably complied with.
  • This corresponds to an additional COG reduction of 14% and GWP reduction of 14%.
The additional financial outlay for the development of a digital twin is particularly worthwhile for extraction processes with cost-intensive or environmentally harmful extraction agents. The reduction in the COGs of the phytoproducts results from the slope of the space–time yield and the reduction in the solvent consumption; thus, the change in the process control strategy has a double effect here.

5.3. Case 1b—DER Range Defined as Well as SMR Range

A dry residue area DER is to be met from a regulatory point of view, and an SMR is to be adhered to in the process:
As a rule, a volume of solvent in relation to the solid plant material is also specified in the SMR in addition to the DER range that has to be met in which case the only manipulated variable for percolation is the volume flow over the extraction time.
For this case, the optimal control strategy is the digital twin because, with a given SMR, only the time remains as a variance, so the control variable must be the volume flow over the extraction time, which is individually optimized depending on the extract concentration. Without this newly proposed control, any variance in the plant ingredient content is found in the DER range specifications. In total, ± 25% variance in the plant ingredient content is covered in a DER of 3.7 to 11.3.
The digital twin can predict the dry residue content of the plant material used at any given time through the in-line measurement of the electrical conductivity of the extract. With this prediction, the digital twin can estimate if the flow rate has to be adjusted to stay within the previously defined regulatory bands of the DER with the still-needed solvent volume.
Three scenarios emerge in the process:
  • At the current volume flow rate, the extract will meet the regulatory requirements (DER) after the extraction process has been completed. There is no need for action; the extraction is completed at the current volume flow.
  • The predefined DER is exceeded, e.g., if the content in the plant material is too low. The digital twin reduces the volume flow to increase the extraction efficiency and to extract more dry residue.
  • The DER is undercut, e.g., if the content in the plant material is too high. Even if this case is rather unrealistic since this specification of a quality maximum makes little economic sense, the digital twin can increase the volume flow here and thus reduce the extraction efficiency.
The advantage of this control is its ability to ensure the quality of the extract when integrating it into an existing process. Thus, the quality (concentration as the SMR and DER) of the extract can be calculated during the process and can be predicted for the completed process. This reduces the number of extracts that do not meet regulatory requirements and must be discarded.
Another major advantage arises when designing a new process. Here, a lower solvent ratio can be selected. By controlling it via the digital twin, the quality of the extract can still be guaranteed from a previous 86% to 100% success rate. This can save solvent operating costs and can increase the concentration of the extract. This can, in turn, make the downstream process more cost effective.
  • In the process, approx. 64% of the solvent can be saved, and the space–time yield increases by up to 64%. The regulatory limits of the DER are reliably complied with.
  • This corresponds to a COG reduction of up to 75% and a GWP reduction of up to 64%.

5.4. Case 2—Marker/Lead or Even Reference Substance Content Range Defined as Well as SMR Range

A regulatory marker or lead substance, or even a pharmacologically active reference substance, is defined as the target component, and an SMR must be adhered to.
The concentration of the marker/guide/reference substance in the extract can be determined through an in-line measurement using FTIR. This is used to record data for the digital twin. This creates the same situation as in case 1b; again, the introduction of the digital twin can improve the existing process. In addition, when a new process is introduced, optimization can be achieved by using less solvent, further increasing the efficiency up to the maximum quoted amount.
This study proves the benefits of such an approach under industrial constraints in regulatory approval, COG competitiveness and GWP reduction towards politically demanded climate neutrality; see Figure 15 to visualize the benefits of digital twin application as a summary of the case studies.
The presented concept corresponds to the future procedure for the development of new extraction procedures. In the case of herbal medicinal products, the adaptation of the extraction procedures that already exist and are described in marketing authorization documentation can only take place via notifications of change. If necessary, this can be a cumbersome procedure. For new marketing authorization procedures, on the other hand, the concept can be easily implemented. For the implementation of the concept presented, it is advisable to apply the recommendations of the ICH Guidelines for the Development of Active Substances and Medicinal Products, e.g., on design space. In addition, for established medicinal drugs, the requirements of the corresponding monograph of the HMPC of the European Medicines Agency (EMA) must be met [52,53].

5.5. Discussing Finally Efforts End Benefits

A typical small and medium entity with about 100 employees utilizes in magnitude about 30 mil. tons per year of plant material and generates about a EUR 30 mil. sale with about a 10–20% margin, i.e., about EUR 4.5 mil.
Estimating for simplicity about forty batches per year, i.e., one per week, one batch is valid for about EUR 1,000,000 in sales and a EUR 110,000 profit at the typical cost of goods at about 10–20%, i.e., EUR 100–200,000.
The implementation of an additional conductivity sensor (~EUR 20,000) and an FTIR detector (~EUR 150,000) for any process control concept, even the sophisticated digital twin application for advanced process control, is estimated to have the following costs:
  • An equipment and device investment CAPEX of about EUR 200,000, which will depreciate technically over 10 years for simplicity, i.e., EUR 20,000/a;
  • With the implementation the cost of about EUR 200.000, it will again depreciate an additional EUR 20,000/a and will have an added standard maintenance lumped-sum rate of about EUR 20.000/a;
  • In sum, a cost of about EUR 60,000/a, i.e., of lower than EUR 100,000/a [53];
  • The ROI will be less than 1 year if only one of the points is gained;
  • One batch failure will be reduced (~EUR 110,000 profit);
  • OR will be operated nearer to the optimal operation point and will correspond to a reduction in the solvent amount, recycling efforts and the energy reduced (i.e., about 50% of COGs, i.e., ~EUR 150,000/2 = EUR 75,000);
  • OR the personnel manpower of about two coworkers (~EUR 200,000/a) with a probability near 100% regarding the simulation study presented.
Thus, any economic and COG vs. GWP evaluation towards the politically demanded climate neutrality in 2045 point out that the implementation of the presented autonomous operation concept is, without a doubt, ecologically and economically efficient.
The return on the investment is lower than about 1 year and, with a probability near 100%, product quality assurance is improved for patients’ safety.
Therefore, such approaches should have a regulatory demand to be implemented as mandatory and as the actual state-of-the-art method under a continuous good manufacturing practice. The concept is ready for industrialization.

6. Conclusions

This paper addressed the process control of percolation in the regulatory environment. The problem is the high variability in plant materials. They have different contents of ingredients due to their cultivation and collection conditions. This can lead to the rejection of product batches if the extract does not meet the specified standards. This increases the ecological footprint and the cost of the product.
To address this, simulation studies on different control strategies were conducted and compared based on their space–time yield and solvent consumption. The best strategy is an in-line cutoff supported by the PATs of conductivity and FTIR. These can achieve reductions of up to 65% in the COGs and up to 40% in GWP. The further improvement of the process can be achieved with the digital twin conceptualized here. By estimating the content of the plant material online, the success rate of extraction can be increased to 100%. This reduces the COGs of extraction by a total of up to 75% and the GWP of extraction by 64%. The implementation of this technology has an ROI of less than one year for a typical small and medium entity and can thus contribute to a reduction in the global warming potential while improving the competitiveness of the company.

Author Contributions

Conceptualization, J.S. and M.T.; methodology, A.U.; validation, L.K. and A.S.; investigation, L.K.; resources, L.K.; writing—original draft preparation, A.U.; writing—review and editing, L.K., A.S., M.T. and J.S.; visualization, A.U. and L.K.; supervision, J.S.; project administration, J.S.; funding acquisition, J.S. All authors have read and agreed to the published version of the manuscript.

Funding

The authors want to gratefully acknowledge the Bundesministerium für Wirtschaft und Klimaschutz (BMWK), especially Michael Gahr (Projektträger FZ Jülich), for funding their scientific work.

Data Availability Statement

Not applicable.

Acknowledgments

The authors would like to thank the whole team of the institute for their valuable contributions and their partners in many industrial applications especially.

Conflicts of Interest

The authors declare no conflict of interest.

Abbreviations

APIActive pharmaceutical ingredient
COGsCost of goods
CPPCritical process parameter
CQACritical quality attribute
CSControl space
CVColumn volume
DERDrug–extract ratio
DSDesign space
DTDigital twin
EMAEuropean Medicines Agency
FTIRFourier-transformed infrared spectroscopy
GMPGood manufacturing practice
GWPGlobal warming potential
HMPCCommittee on Herbal Medicinal Products
NEMFood supplements
ICHInternational Council for Harmonization
PATProcess analytical technology
PLSPartial least squares regression
QbDQuality by Design
SCSolvent consumption
SLESolid–Liquid extraction
SMRSolvent–plant material ratio
STYSpace–time yield

References

  1. Fortschrittliche Alternative Flüssige Brenn-und Kraftstoffe: Für Klimaschutz im Globalen Rohstoffwandel. Positionspapier des ProcessNet-Arbeitsausschusses “Alternative Flüssige und Gasförmige Kraft- und Brennstoffe”. 2017. Available online: https://dechema.de/dechema_media/Downloads/Positionspapiere/2017_Positionspapier+Alt+Kraftstoffe.pdf (accessed on 27 April 2023).
  2. Leonel, M.; Sarmento, S.B.S.; Cereda, M.P. New starches for the food industry: Curcuma longa and Curcuma zedoaria. Carbohydr. Polym. 2003, 54, 385–388. [Google Scholar] [CrossRef]
  3. Fraunhofer-Einrichtung für Wertstoffkreisläufe und Ressourcenstrategie IWKS. Positionspapier zu Bioplastik. Available online: https://www.iwks.fraunhofer.de/de/presse-und-medien/pressemeldungen-2018/positionspapier-zu-bioplastik.html (accessed on 27 April 2023).
  4. Borges, A.; Abreu, A.C.; Dias, C.; Saavedra, M.J.; Borges, F.; Simões, M. New Perspectives on the Use of Phytochemicals as an Emergent Strategy to Control Bacterial Infections Including Biofilms. Molecules 2016, 21, 877. [Google Scholar] [CrossRef] [PubMed] [Green Version]
  5. D’Antuono, I.; Carola, A.; Sena, L.M.; Linsalata, V.; Cardinali, A.; Logrieco, A.F.; Colucci, M.G.; Apone, F. Artichoke Polyphenols Produce Skin Anti-Age Effects by Improving Endothelial Cell Integrity and Functionality. Molecules 2018, 23, 2729. [Google Scholar] [CrossRef] [PubMed] [Green Version]
  6. Ninčević Grassino, A.; Rimac Brnčić, S.; Badanjak Sabolović, M.; Šic Žlabur, J.; Marović, R.; Brnčić, M. Carotenoid Content and Profiles of Pumpkin Products and By-Products. Molecules 2023, 28, 858. [Google Scholar] [CrossRef]
  7. Horbańczuk, O.K.; Kurek, M.A.; Atanasov, A.G.; Brnčić, M.; Rimac Brnčić, S. The Effect of Natural Antioxidants on Quality and Shelf Life of Beef and Beef Products. Food Technol. Biotechnol. 2019, 57, 439–447. [Google Scholar] [CrossRef]
  8. European Working Group. “Phytoextracts—Products and Processes”: Proposal towards a New Comprehensive Research Focus; Ditz, R., Gerard, D., Hagels, H.J., Igel, N., Schäffler, M., Schulz, H., Tegtmeier, M., Treutwein, J., Strube, J., Eds.; ProcessNet-Subject Division Plant Based Extracts—Products and Processes: Frankfurt am Main, Germany, 2016. [Google Scholar]
  9. Zobel-Roos, S.; Schmidt, A.; Mestmäcker, F.; Mouellef, M.; Huter, M.; Uhlenbrock, L.; Kornecki, M.; Lohmann, L.; Ditz, R.; Strube, J. Accelerating Biologics Manufacturing by Modeling or: Is Approval under the QbD and PAT Approaches Demanded by Authorities Acceptable without a Digital-Twin? Processes 2019, 7, 94. [Google Scholar] [CrossRef] [Green Version]
  10. Uhlenbrock, L.; Sixt, M.; Strube, J. Quality-by-Design (QbD) process evaluation for phytopharmaceuticals on the example of 10-deacetylbaccatin III from yew. Resour. Effic. Technol. 2017, 3, 137–143. [Google Scholar] [CrossRef]
  11. Kassing, M.; Jenelten, U.; Schenk, J.; Strube, J. A New Approach for Process Development of Plant-Based Extraction Processes. Chem. Eng. Technol. 2010, 33, 377–387. [Google Scholar] [CrossRef]
  12. Sixt, M.; Strube, J. Systematic and Model-Assisted Evaluation of Solvent Based- or Pressurized Hot Water Extraction for the Extraction of Artemisinin from Artemisia annua L. Processes 2017, 5, 86. [Google Scholar] [CrossRef] [Green Version]
  13. Both, S.; Koudous, I.; Jenelten, U.; Strube, J. Model-based equipment-design for plant-based extraction processes—Considering botanic and thermodynamic aspects. Comptes. Rendus Chim. 2014, 17, 187–196. [Google Scholar] [CrossRef]
  14. Sixt, M.; Strube, J. Systematic Design and Evaluation of an Extraction Process for Traditionally Used Herbal Medicine on the Example of Hawthorn (Crataegus monogyna JACQ.). Processes 2018, 6, 73. [Google Scholar] [CrossRef] [Green Version]
  15. Sixt, M.; Uhlenbrock, L.; Strube, J. Toward a Distinct and Quantitative Validation Method for Predictive Process Modelling—On the Example of Solid-Liquid Extraction Processes of Complex Plant Extracts. Processes 2018, 6, 66. [Google Scholar] [CrossRef] [Green Version]
  16. Uhlenbrock, L. Quality-by-Design zur Systematischen Entwicklung von Wertschöpfungsprozessen Pflanzlicher Rohstoffe. Ph.D. Dissertation, Technische Universität Clausthal, Clausthal-Zellerfeld, Germany, Shaker Verlag, Herzogenrath, Germany, 2021. [Google Scholar]
  17. Jensch, C.; Knierim, L.; Tegtmeier, M.; Strube, J. Development of a General PAT Strategy for Online Monitoring of Complex Mixtures—On the Example of Natural Product Extracts from Bearberry Leaf (Arctostaphylos uva-ursi). Processes 2021, 9, 2129. [Google Scholar] [CrossRef]
  18. Uhlenbrock, L.; Sixt, M.; Tegtmeier, M.; Schulz, H.; Hagels, H.; Ditz, R.; Strube, J. Natural Products Extraction of the Future—Sustainable Manufacturing Solutions for Societal Needs. Processes 2018, 6, 177. [Google Scholar] [CrossRef] [Green Version]
  19. Jensch, C.; Strube, J. Proposal of a New Green Process for Waste Valorization and Cascade Utilization of Essential Oil Plants. Sustainability 2022, 14, 3227. [Google Scholar] [CrossRef]
  20. Tegtmeier, M.; Knierim, L.; Schmidt, A.; Strube, J. Green Manufacturing for Herbal Remedies with Advanced Pharmaceutical Technology. Pharmaceutics 2023, 15, 188. [Google Scholar] [CrossRef] [PubMed]
  21. Rojas, P.; Montes, P.; Rojas, C.; Serrano-García, N.; Rojas-Castañeda, J.C. Effect of a phytopharmaceutical medicine, Ginko biloba extract 761, in an animal model of Parkinson’s disease: Therapeutic perspectives. Nutrition 2012, 28, 1081–1088. [Google Scholar] [CrossRef]
  22. Peschel, W.; Alvarez, B.M. Harmonised European Standards as a Basis for the Safe Use of Herbal Medicinal Products and Their Marketing Authorisation in European Union Member States. Pharm. Med. 2018, 32, 275–293. [Google Scholar] [CrossRef]
  23. vom Graf Hagen-Plettenberg, M.; Klier, B.; Tegtmeier, M.; Waimer, F.; Steinhoff, B. Good Agricultural and Collection Practice (GACP)—A Pragmatic and Efficient State-of-the-Art Standard; Europharm: Brussels, Belgium, 2012; pp. 1078–1084. [Google Scholar]
  24. European Medicines Agency; Evaluation of Medicines for Human Use, Committee on Herbal Medicinal Products. Guideline on Good Agricultural and Collection Practice (GACP) for Starting Materials of Herbal Origin; EMEA/HMPC/246816/2005; European Medicines Agency: Amsterdam, The Netherlands, 2006. [Google Scholar]
  25. European Directorate for the Quality of Medicines & Healthcare. European Pharmacopoeia 11th Edition Print Subscription 2023 (11.0, 11.1 and 11.2), 11th ed.; European Directorate for the Quality of Medicines & Healthcare: Strasbourg, France, 2022; ISBN 978-92-871-9105-2. [Google Scholar]
  26. FDA. Botanical Drug Development Guidance for Industry; FDA: Rockville, MD, USA, 2016. [Google Scholar]
  27. Enders, M.; Hoßbach, N. Dimensions of digital twin applications—A literature review. In Proceedings of the 25th Americas Conference on Information Systems, Cancun, Mexico, 15–17 August 2019. [Google Scholar]
  28. Herwig, C.; Pörtner, R.; Möller, J. Digital Twins; Springer International Publishing: Cham, Switzerland, 2021; ISBN 978-3-030-71659-2. [Google Scholar]
  29. Udugama, I.A.; Lopez, P.C.; Gargalo, C.L.; Li, X.; Bayer, C.; Gernaey, K.V. Digital Twin in biomanufacturing: Challenges and opportunities towards its implementation. Syst. Microbiol. Biomanuf. 2021, 1, 257–274. [Google Scholar] [CrossRef]
  30. Helgers, H.; Hengelbrock, A.; Schmidt, A.; Strube, J. Digital Twins for Continuous mRNA Production. Processes 2021, 9, 1967. [Google Scholar] [CrossRef]
  31. Zobel-Roos, S.; Schmidt, A.; Uhlenbrock, L.; Ditz, R.; Köster, D.; Strube, J. Digital Twins in Biomanufacturing. Adv. Biochem. Eng. Biotechnol. 2021, 176, 181–262. [Google Scholar] [CrossRef] [PubMed]
  32. Uhl, A.; Schmidt, A.; Hlawitschka, M.W.; Strube, J. Autonomous Liquid–Liquid Extraction Operation in Biologics Manufacturing with Aid of a Digital Twin including Process Analytical Technology. Processes 2023, 11, 553. [Google Scholar] [CrossRef]
  33. Helgers, H.; Hengelbrock, A.; Schmidt, A.; Vetter, F.L.; Juckers, A.; Strube, J. Digital Twins for scFv Production in Escherichia coli. Processes 2022, 10, 809. [Google Scholar] [CrossRef]
  34. Hengelbrock, A.; Helgers, H.; Schmidt, A.; Vetter, F.L.; Juckers, A.; Rosengarten, J.F.; Stitz, J.; Strube, J. Digital Twin for HIV-Gag VLP Production in HEK293 Cells. Processes 2022, 10, 866. [Google Scholar] [CrossRef]
  35. Sixt, M.; Schmidt, A.; Mestmäcker, F.; Huter, M.; Uhlenbrock, L.; Strube, J. Systematic and Model-Assisted Process Design for the Extraction and Purification of Artemisinin from Artemisia annua L.—Part I: Conceptual Process Design and Cost Estimation. Processes 2018, 6, 161. [Google Scholar] [CrossRef] [Green Version]
  36. Ndocko Ndocko, E.; Ditz, R.; Josch, J.-P.; Strube, J. New Material Design Strategy for Chromatographic Separation Steps in Bio-Recovery and Downstream Processing. Chem. Ing. Tech. 2011, 83, 113–129. [Google Scholar] [CrossRef]
  37. Kaßing, M. Process Development for Plant-Based Extract Production; Shaker: Aachen, Germany, 2012; ISBN 9783844007039. [Google Scholar]
  38. Strube, J.; Altenhöner, U.; Meurer, M.; Schmidt-Traub, H.; Schulte, M. Dynamic simulation of simulated moving-bed chromatographic processes for the optimization of chiral separations. J. Chromatogr. A 1997, 769, 81–92. [Google Scholar] [CrossRef]
  39. Schmidt-Traub, H. Preparative Chromatography, 2nd ed.; John Wiley & Sons Incorporated: Newark, NJ, USA, 2012; ISBN 978-3-527-32898-7. [Google Scholar]
  40. Altenhöner, U.; Meurer, M.; Strube, J.; Schmidt-Traub, H. Parameter estimation for the simulation of liquid chromatography. J. Chromatogr. A 1997, 769, 59–69. [Google Scholar] [CrossRef]
  41. Baerns, M.; Behr, A.; Brehm, A.; Gmehling, J.; Hinrichsen, K.-O.; Hofmann, H.; Palkovits, R.; Onken, U.; Renken, A. Technische Chemie, Zweite, Erweiterte Auflage; Wiley-VCH/Ciando: Weinheim, Germany, 2013; ISBN 978-3-527-33072-0. [Google Scholar]
  42. Khajenoori, M.; Asl, A.H.; Hormozi, F. Proposed Models for Subcritical Water Extraction of Essential Oils. Chin. J. Chem. Eng. 2009, 17, 359–365. [Google Scholar] [CrossRef]
  43. Penn, C.J.; Williams, M.R.; Camberato, J.; Wenos, N.; Wason, H. Desorption Kinetics of Legacy Soil Phosphorus: Implications for Non-Point Transport and Plant Uptake. Soil Syst. 2022, 6, 6. [Google Scholar] [CrossRef]
  44. United Nations Industrial Development Organization and the International Centre. Maceration, Percolation and Infusion Techniques for the Extraction of Medicinal and Aromatic Plants; United Nations Industrial Development Organization and the International Centre: Vienna, Austria, 2008. [Google Scholar]
  45. Gommeren, H.J.C.; Heitzmann, D.A.; Moolenaar, J.A.C.; Scarlett, B. Modelling and control of a jet mill plant. Powder Technol. 2000, 108, 147–154. [Google Scholar] [CrossRef] [Green Version]
  46. Allen, T. Particle Size Measurement; Springer: Berlin/Heidelberg, Germany, 2013; ISBN 9781489930637. [Google Scholar]
  47. Bonvin, D.; Srinivasan, B.; Ruppen, D. Dynamic Optimization in the Batch Chemical Industry. Technical Report. 2001. Available online: https://www.researchgate.net/publication/37408808_Dynamic_Optimization_in_the_Batch_Chemical_Industry (accessed on 23 April 2023).
  48. Stapenhurst, T. Mastering Statistical Process Control; Taylor and Francis: Hoboken, NJ, USA, 2013; ISBN 0750665297. [Google Scholar]
  49. Montgomery, D.C. Introduction to Statistical Quality Control; John Wiley & Sons: Hoboken, NJ, USA, 2020; ISBN 9781119723097. [Google Scholar]
  50. Schmidt, A.; Uhlenbrock, L.; Strube, J. Technical Potential for Energy and GWP Reduction in Chemical–Pharmaceutical Industry in Germany and EU—Focused on Biologics and Botanicals Manufacturing. Processes 2020, 8, 818. [Google Scholar] [CrossRef]
  51. Ich Harmonised Tripartite Guideline; Development And Manufacture of Drug Substances: (Chemical Entities and Biotechnological/Biological Entities) Q11; European Medicines Agency: London, UK, 2011.
  52. ICH. Guideline Q8 (R2) on Pharmaceutical Development: EMA/CHMP/ICH/167068/2004; European Medicines Agency: London, UK, 2006. [Google Scholar]
  53. Peters, M.S.; Timmerhaus, K.D.; West, R.E. Plant Design and Economics for Chemical Engineers, 5th ed.; McGraw-Hill: Boston, MA, USA, 2004; ISBN 978-0071240444. [Google Scholar]
Figure 1. Overview of Quality by Design (QbD) and process analytical technology (PAT) concept and its implementation in phytoextraction process for varying batches A, B, and C [17,18].
Processes 11 01790 g001
Figure 2. Workflow of the development of digital twins for process control [15].
Processes 11 01790 g002
Figure 3. Derivation of key process figures, solvent consumption (a), extraction time (b), ratio of plant material to solvent (c), space-time-yield (d), productivity (e) and combination of space-time-yield and productivity (f) as function of flow rate.
Processes 11 01790 g003
Figure 4. Resulting DER from derivation of DR content in plant material.
Processes 11 01790 g004
Figure 5. Display of the risk assessment for fixed solvent–drug ratio with the quality of regression and parameter sensitivity for the key process figures. DER (a,b), concentration of extract (c,d), space–time yield (e,f), water consumption (g,h) and summary (i). * Severity score refers to combination the main impact and interaction of process parameter.
Processes 11 01790 g005aProcesses 11 01790 g005b
Figure 6. Display of the risk assessment for fixed solvent–drug ratio with the quality of regression and parameter sensitivity for the key process figures. DER (a,b), concentration of extract (c,d), extracted mass (e,f), space–time yield (g,h) and summary (i). * Severity score refers to combination the main impact and interaction of process parameter.
Processes 11 01790 g006aProcesses 11 01790 g006b
Figure 7. Display of the risk assessment for in-line cutoff controlled by conductivity with the quality of regression and parameter sensitivity for the key process figures. DER (a,b), concentration of extract (c,d), space–time yield (e,f), water consumption (g,h) and summary (i). * Severity score refers to combination the main impact and interaction of process parameter.
Processes 11 01790 g007
Figure 8. Process flowchart and sensor placement of the PID conductivity-controlled flow rate (a) and the process including expected standard derivation of sensor and actor (b). The black is the flow rate, as the color corresponds to the left y-axis.
Processes 11 01790 g008
Figure 9. Display of the risk assessment for PID-controlled flow rate with the quality of regression and parameter sensitivity for the key process figures. DER (a,b), concentration of extract (c,d), space–time yield (e,f), yield (g,h), water consumption (i,j) and summary (k). * Severity score refers to combination the main impact and interaction of process parameter.
Processes 11 01790 g009aProcesses 11 01790 g009b
Figure 10. Quantitative comparison of the control strategies assessed in Section 3.
Processes 11 01790 g010
Figure 11. Representation of the area of acceptable DER with decreasing SMR as a function of flow rate and derivation of DR content of the plant material.
Processes 11 01790 g011
Figure 12. Example of online parameter estimation of DR content and predicted process (a) and relative derivation from actual value dependent on derivation of estimated model parameters and sample time (b).
Processes 11 01790 g012
Figure 13. Example of online parameter estimation of TC content and predicted process (a) and relative derivation from actual value dependent on derivation of estimated model parameters and sample time (b).
Processes 11 01790 g013
Figure 14. Example of the extraction process for a fixed SMR regulatory constraint with a constant flow rate and a process controlled by digital twin.
Processes 11 01790 g014
Figure 15. GWP vs. COGs for the different automation concepts.
Processes 11 01790 g015
Table 1. Parameters varied in the control studies, and their respective derivations were used.
ParameterPositive DerivationNegative Derivation
Flow rate25%25%
Material mass20%20%
Dry residue content20%20%
Target component content60%60%
Particle diameter20%20%
Water content50%50%
Disclaimer/Publisher’s Note: The statements, opinions and data contained in all publications are solely those of the individual author(s) and contributor(s) and not of MDPI and/or the editor(s). MDPI and/or the editor(s) disclaim responsibility for any injury to people or property resulting from any ideas, methods, instructions or products referred to in the content.

