
Electromagnetic Vibration Characteristics of High-Frequency Transformer under DC Bias with Different Winding Structures
Abstract
:1. Introduction
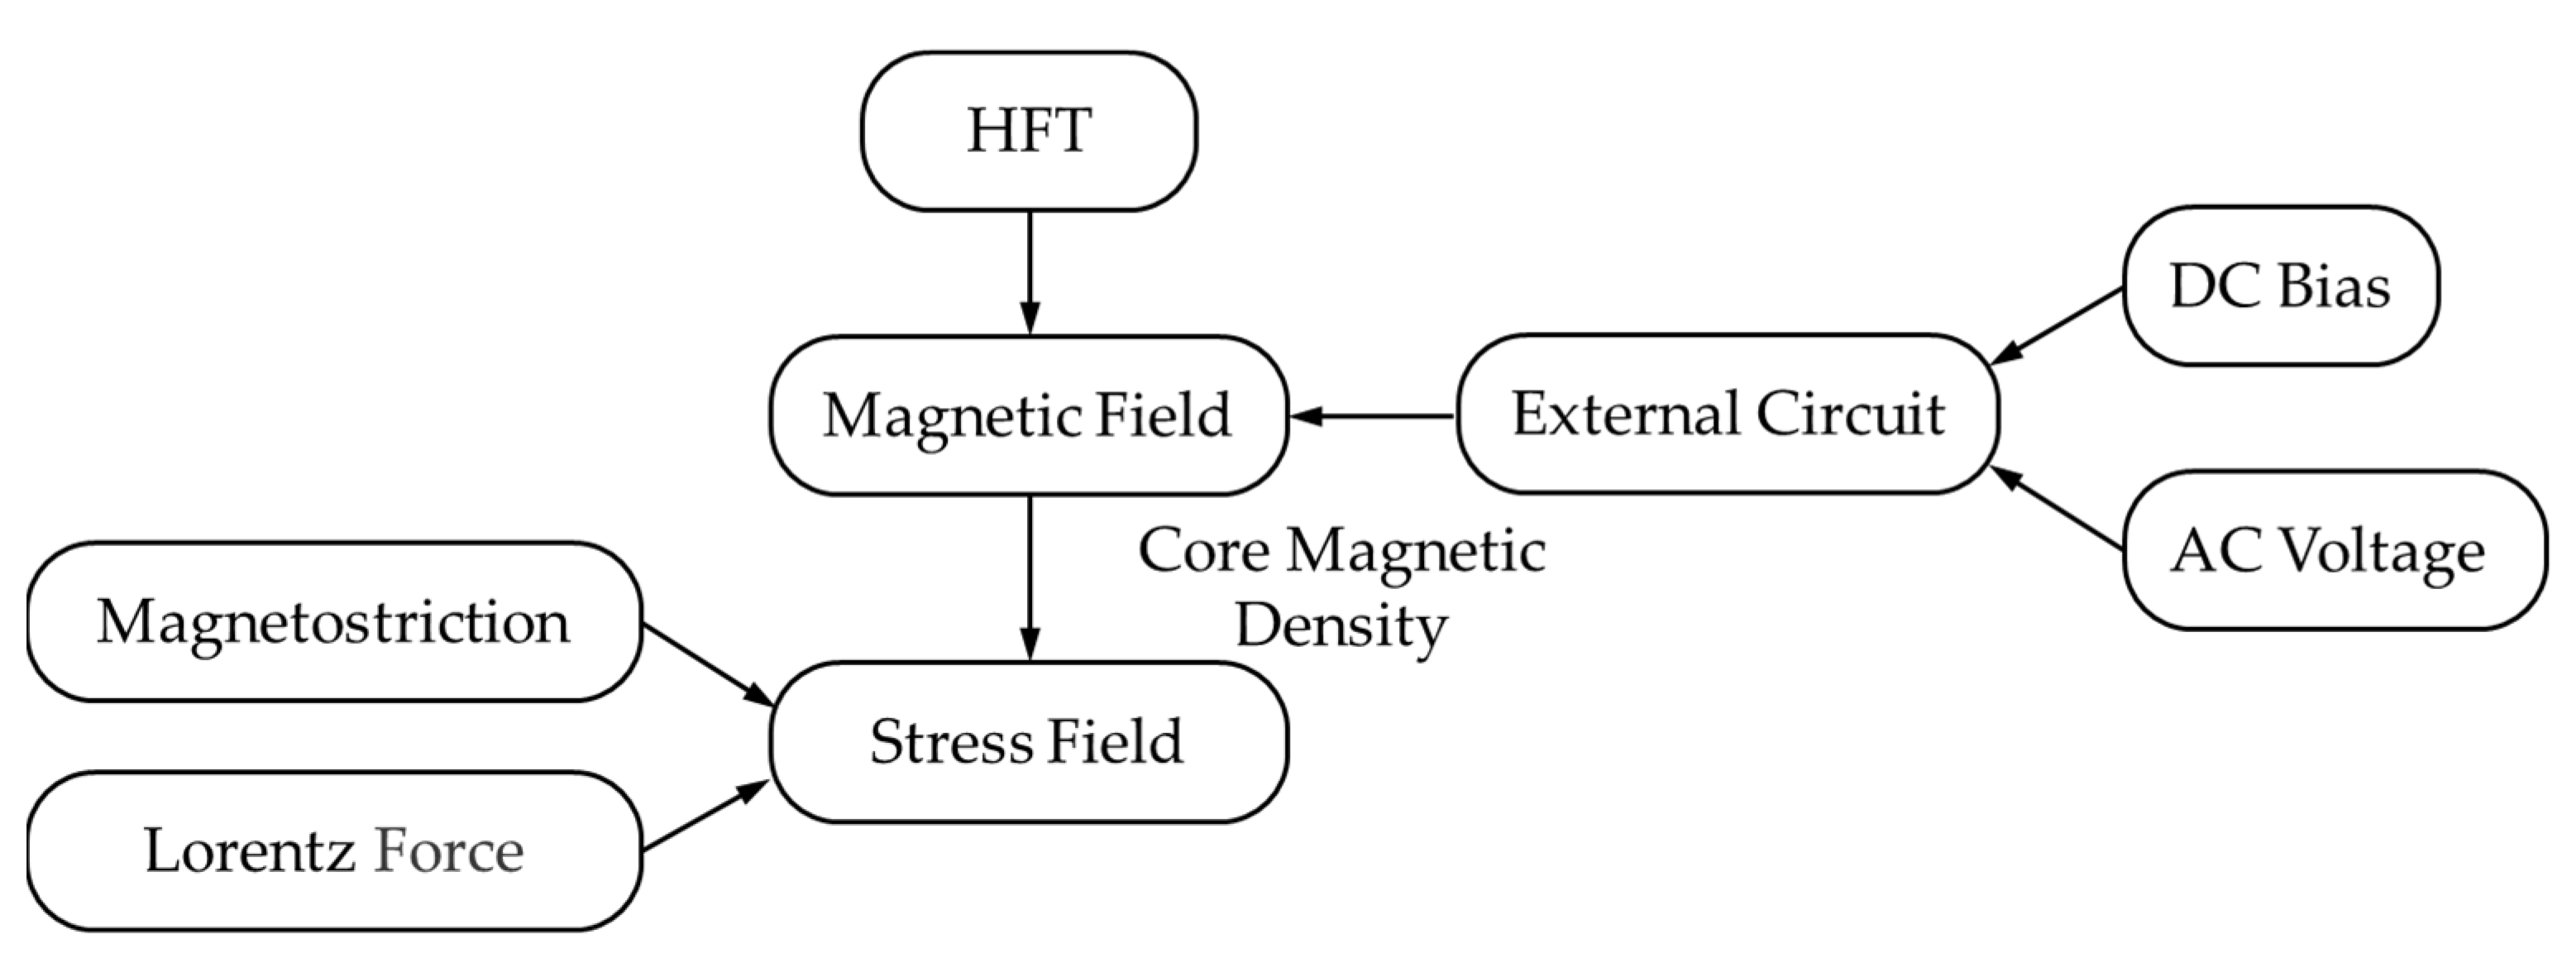
2. Electromagnetic Vibration Mechanism of High-Frequency Transformer under DC Bias
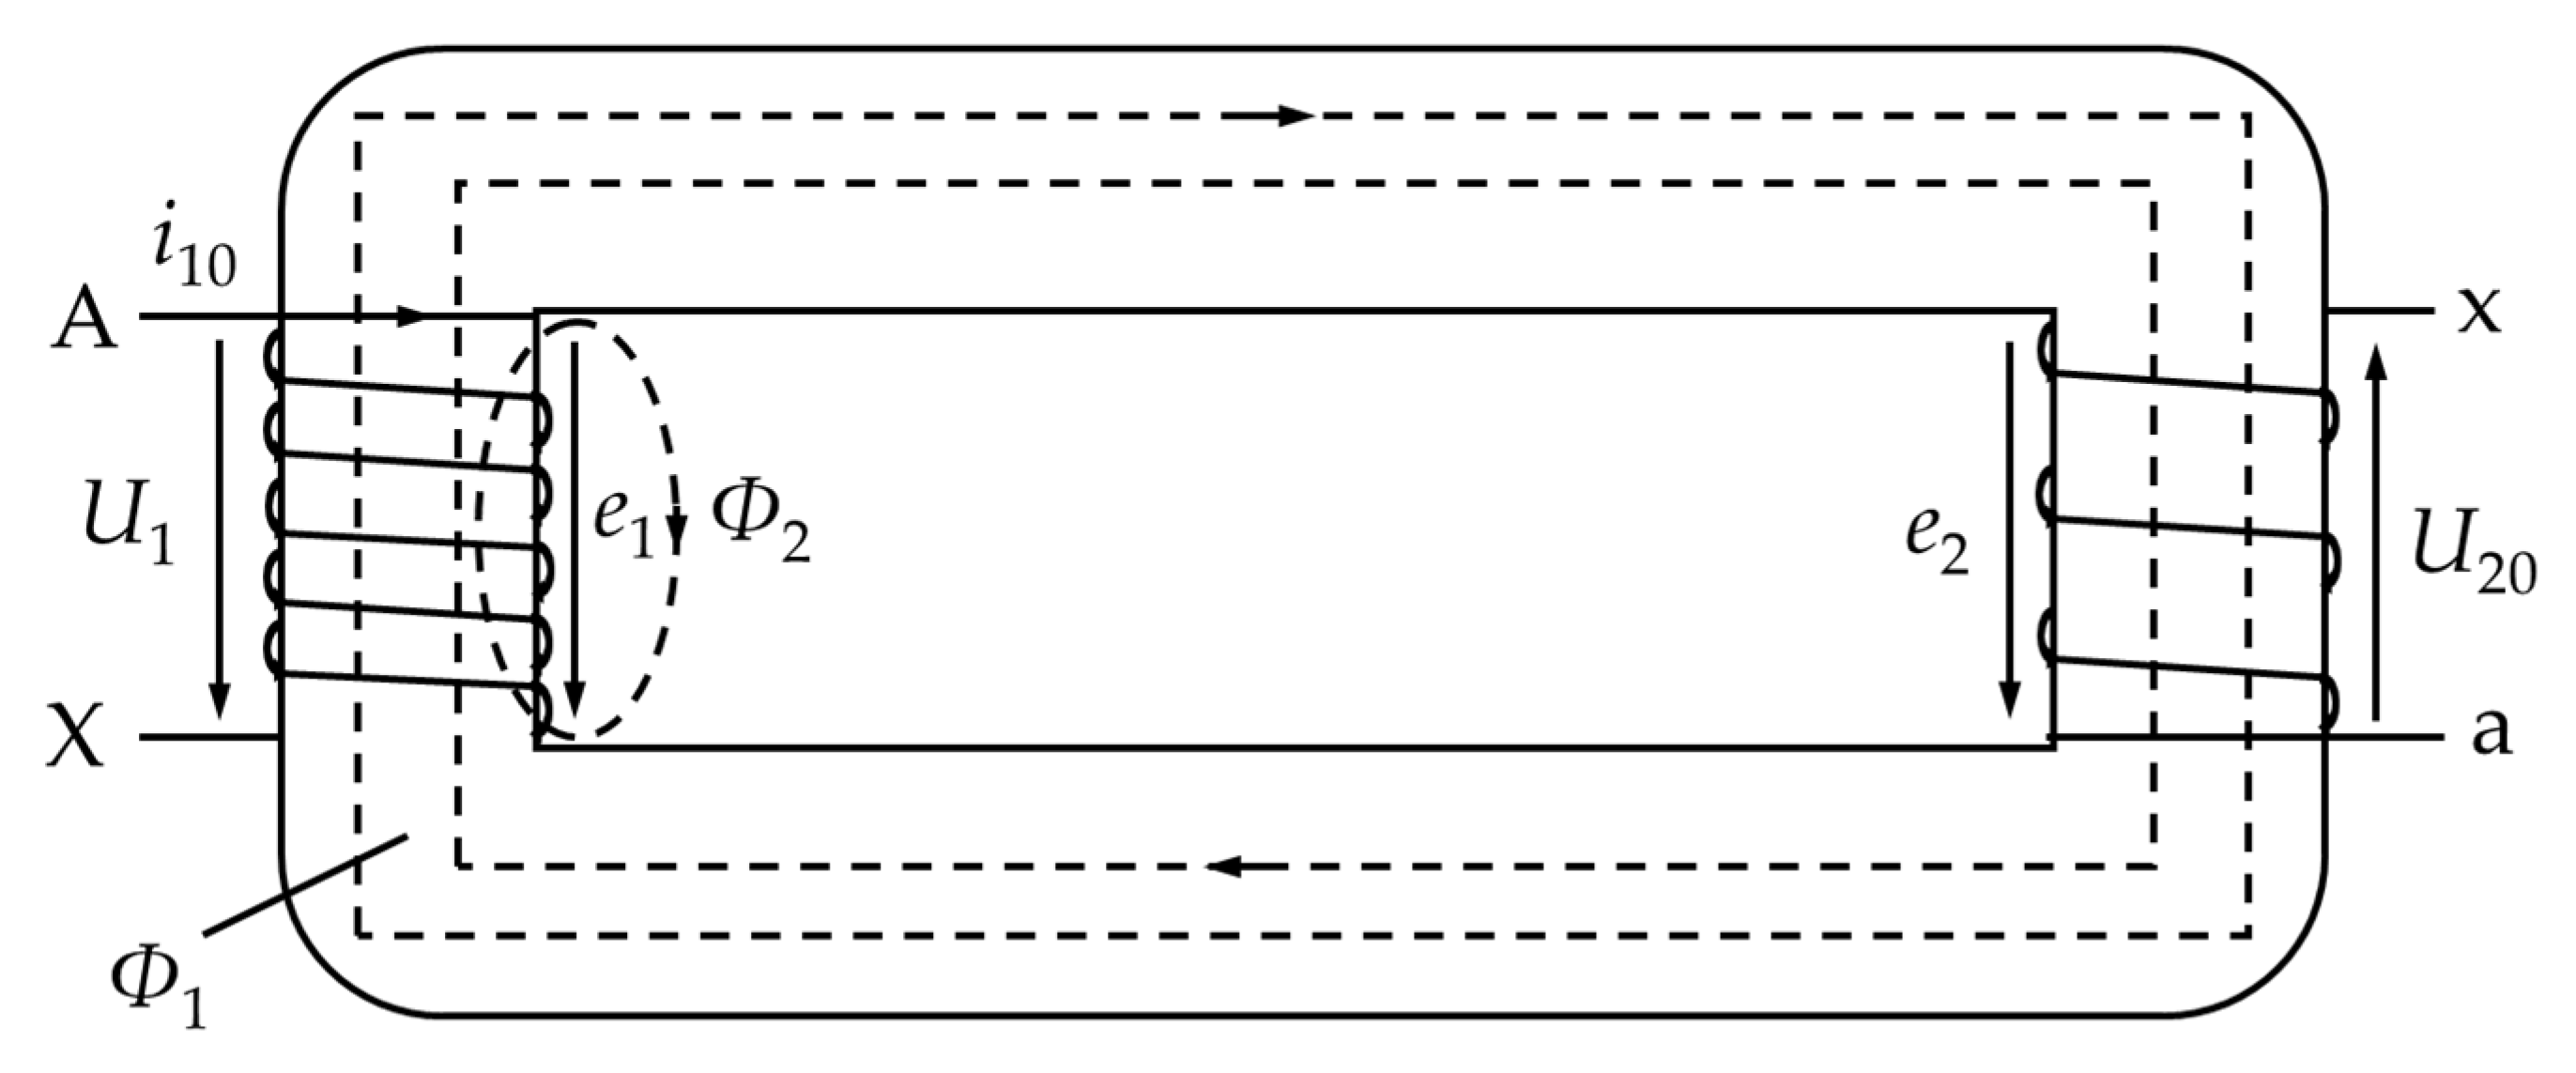
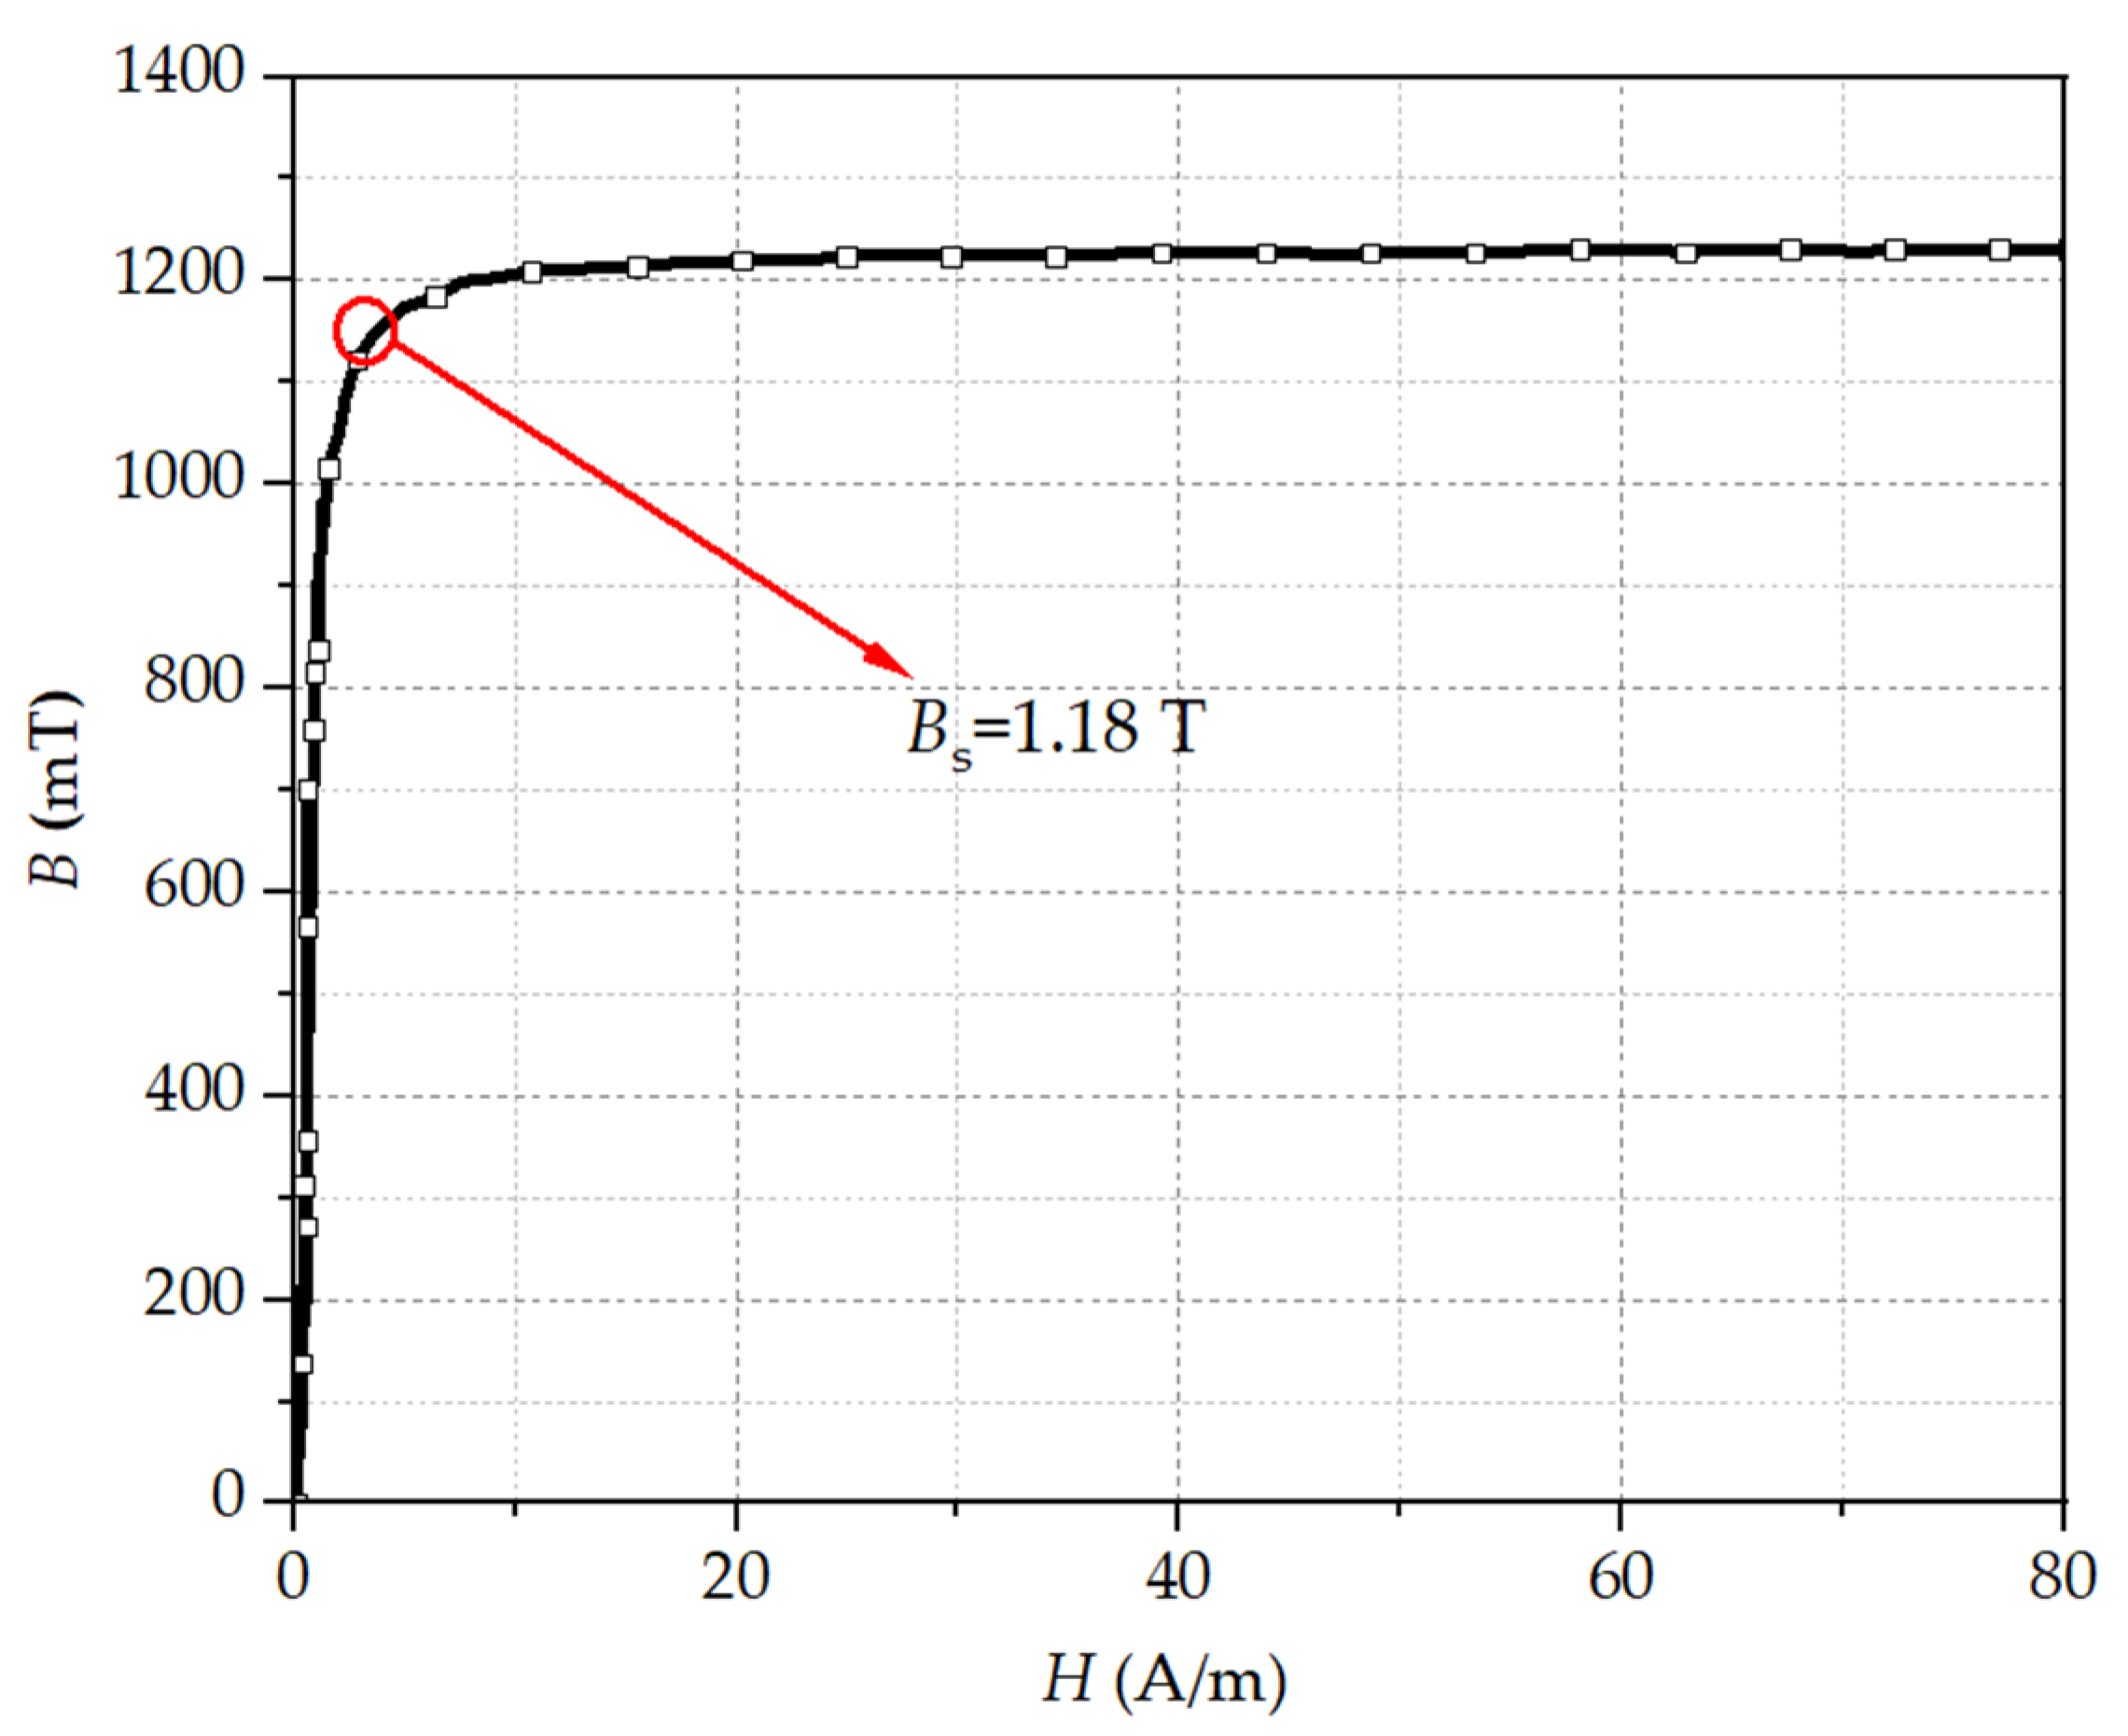
2.1. Electromagnetic Field
2.2. Stress Field
3. Modeling and DC Bias Design of High-Frequency Transformer
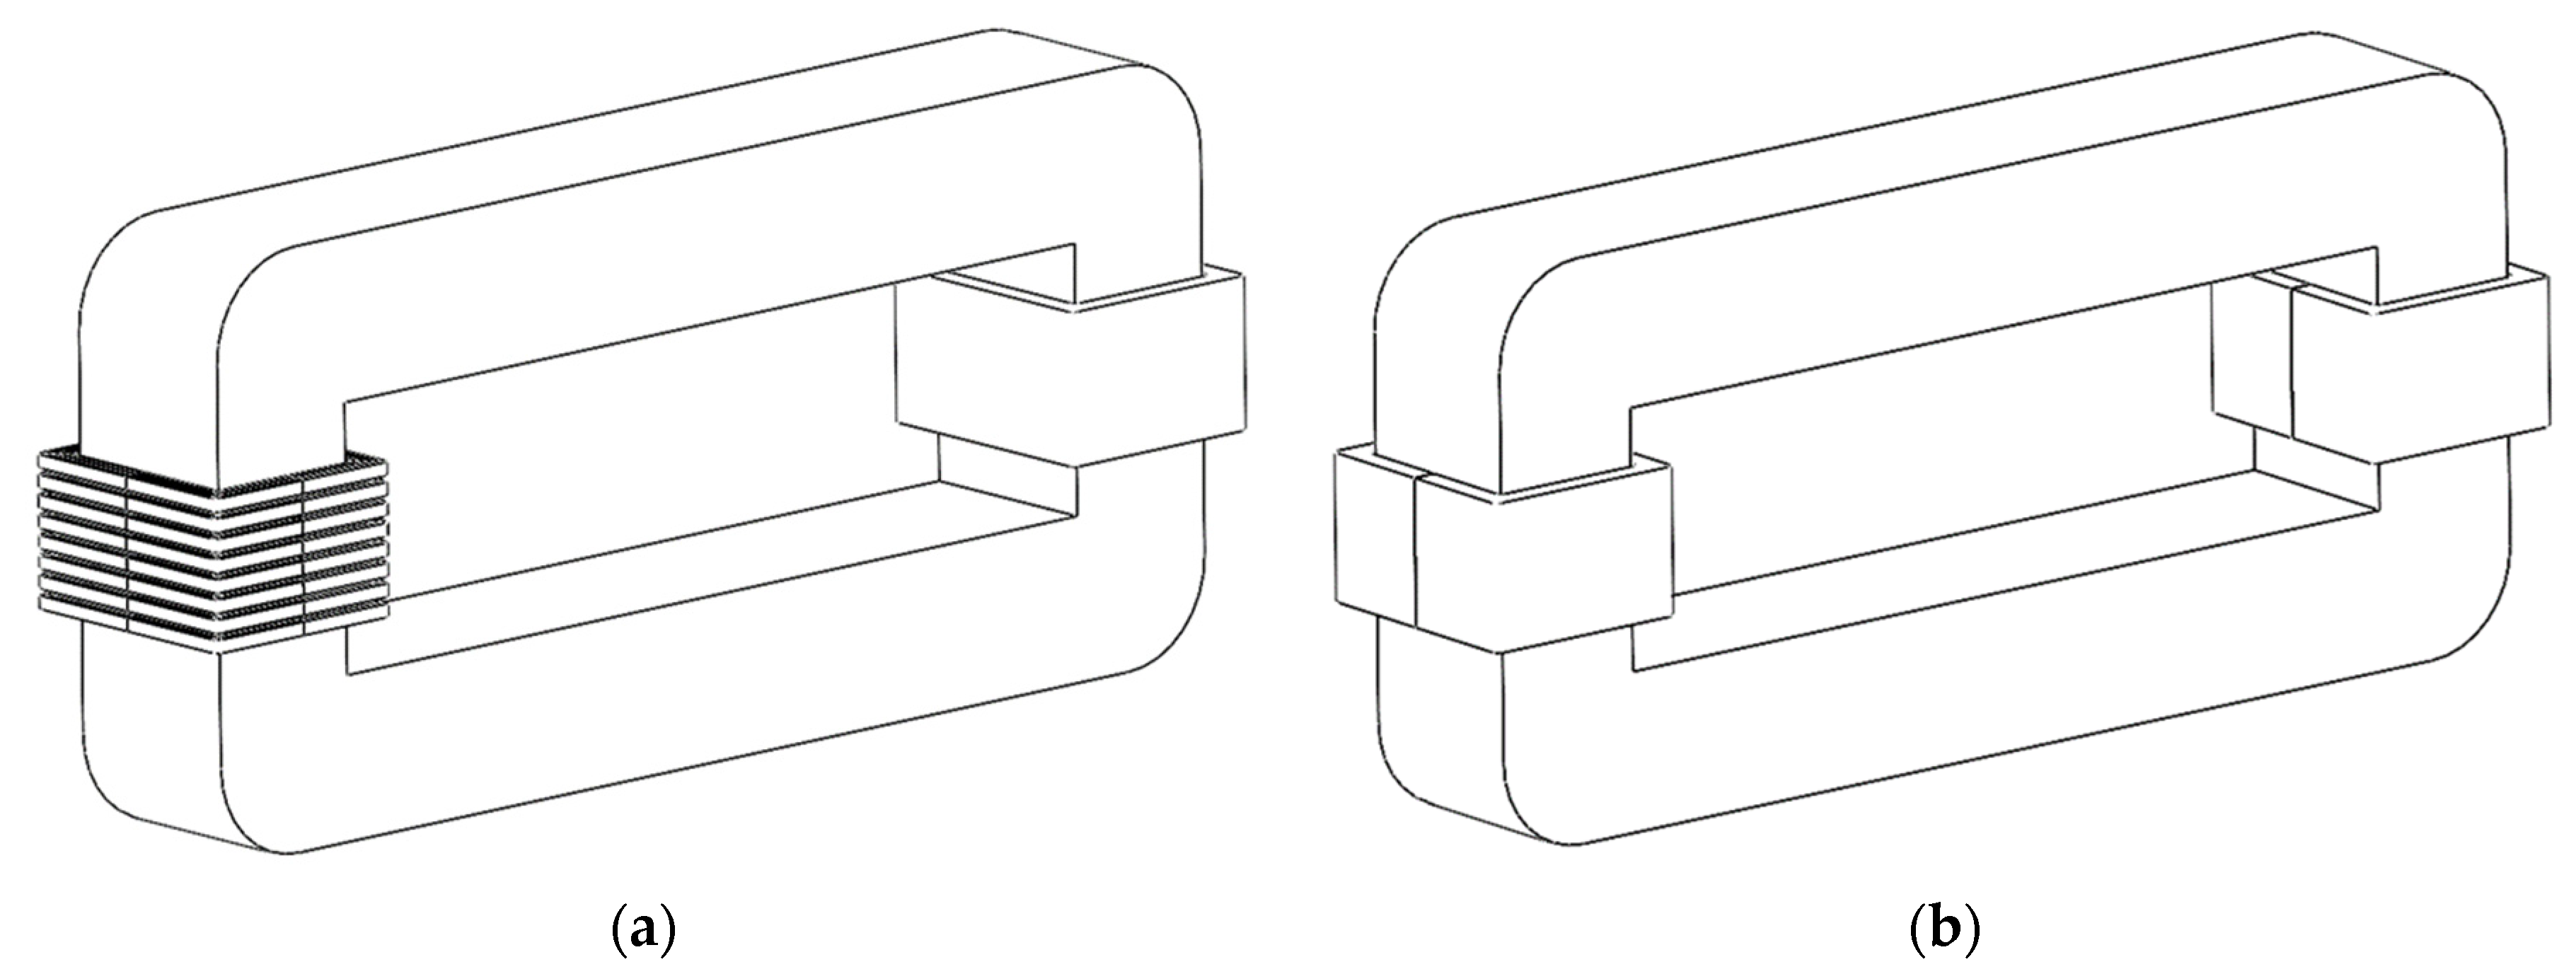
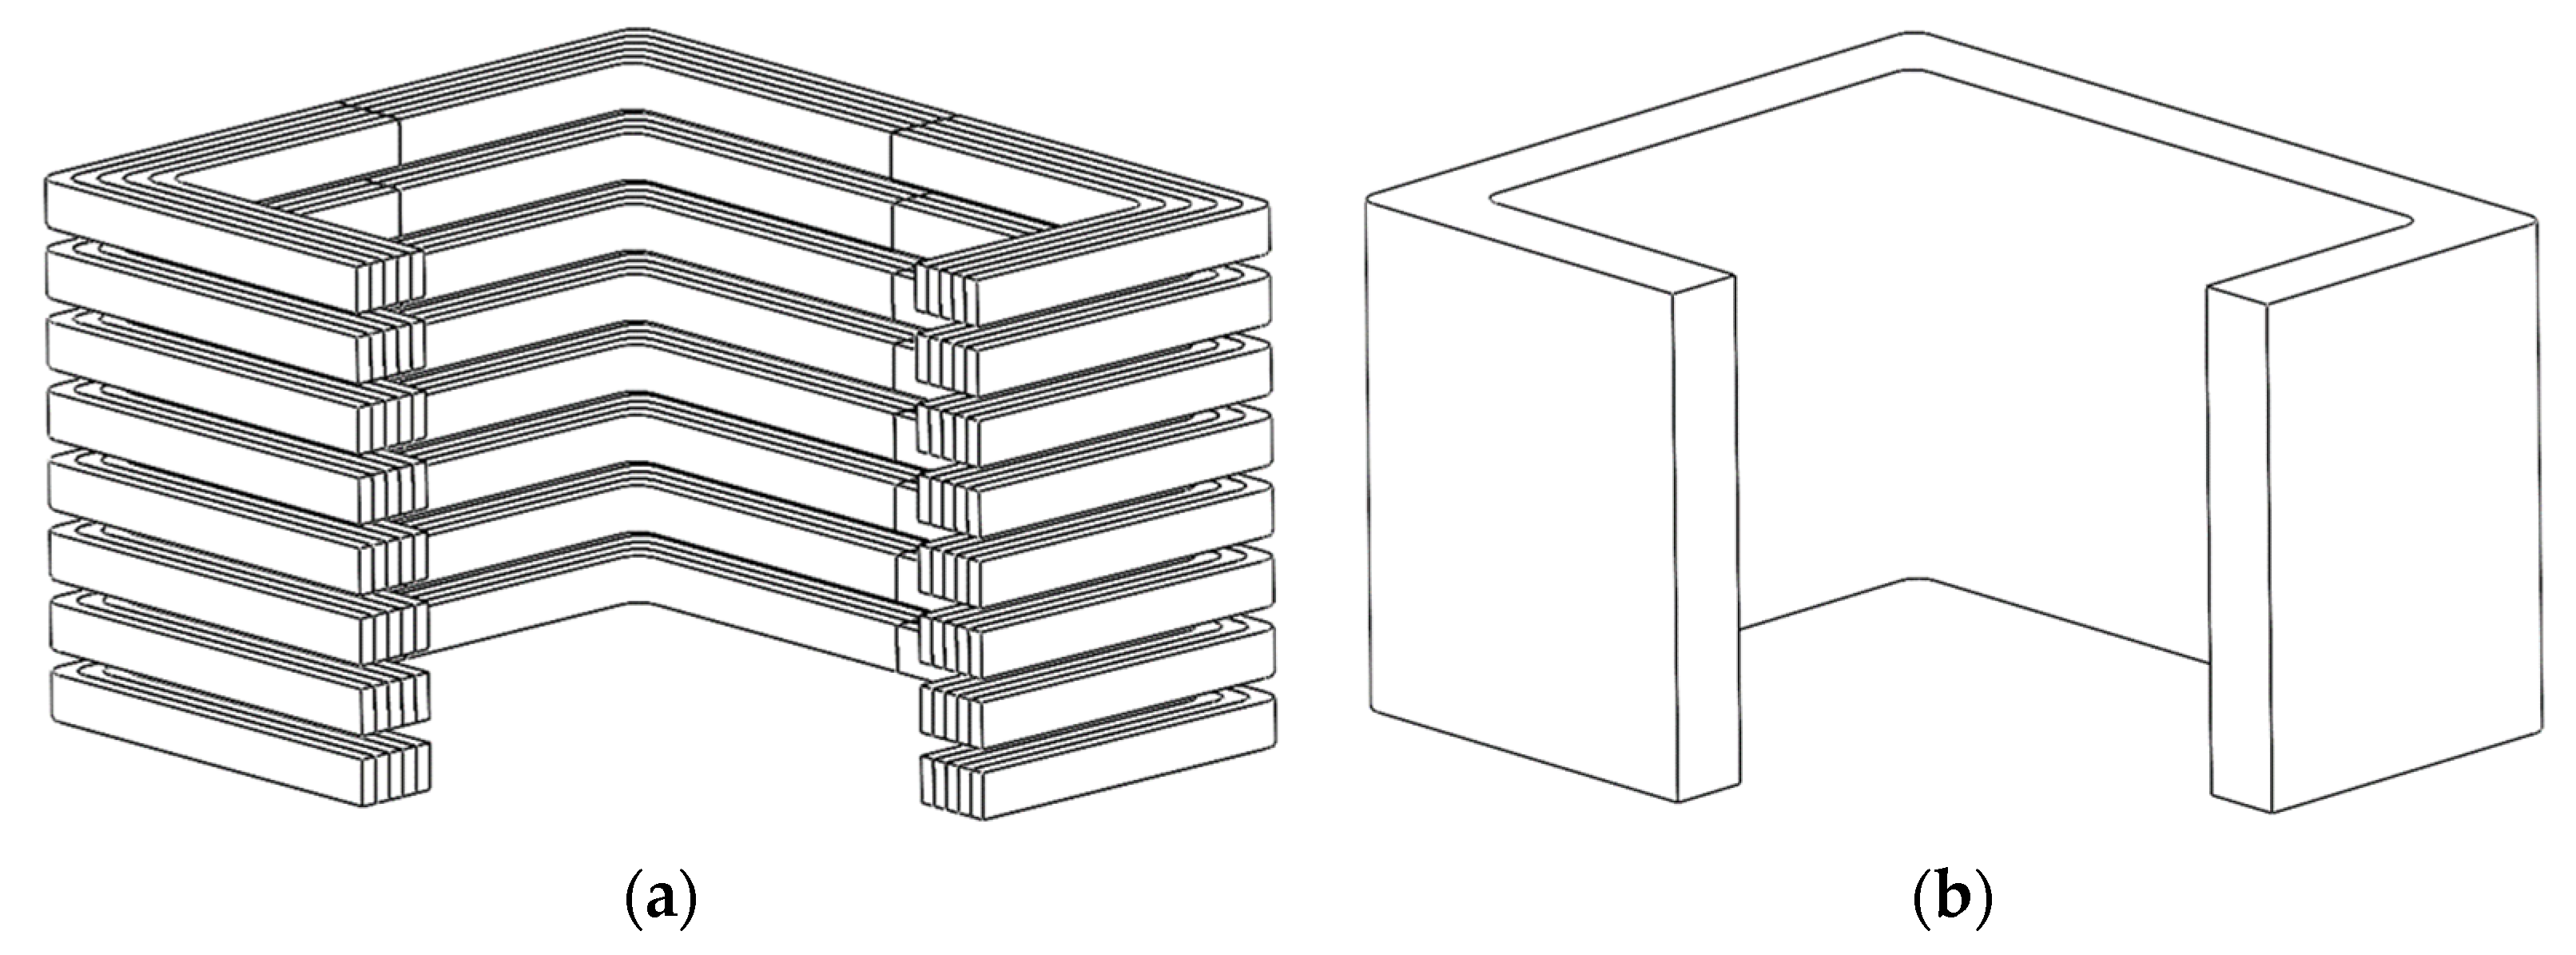
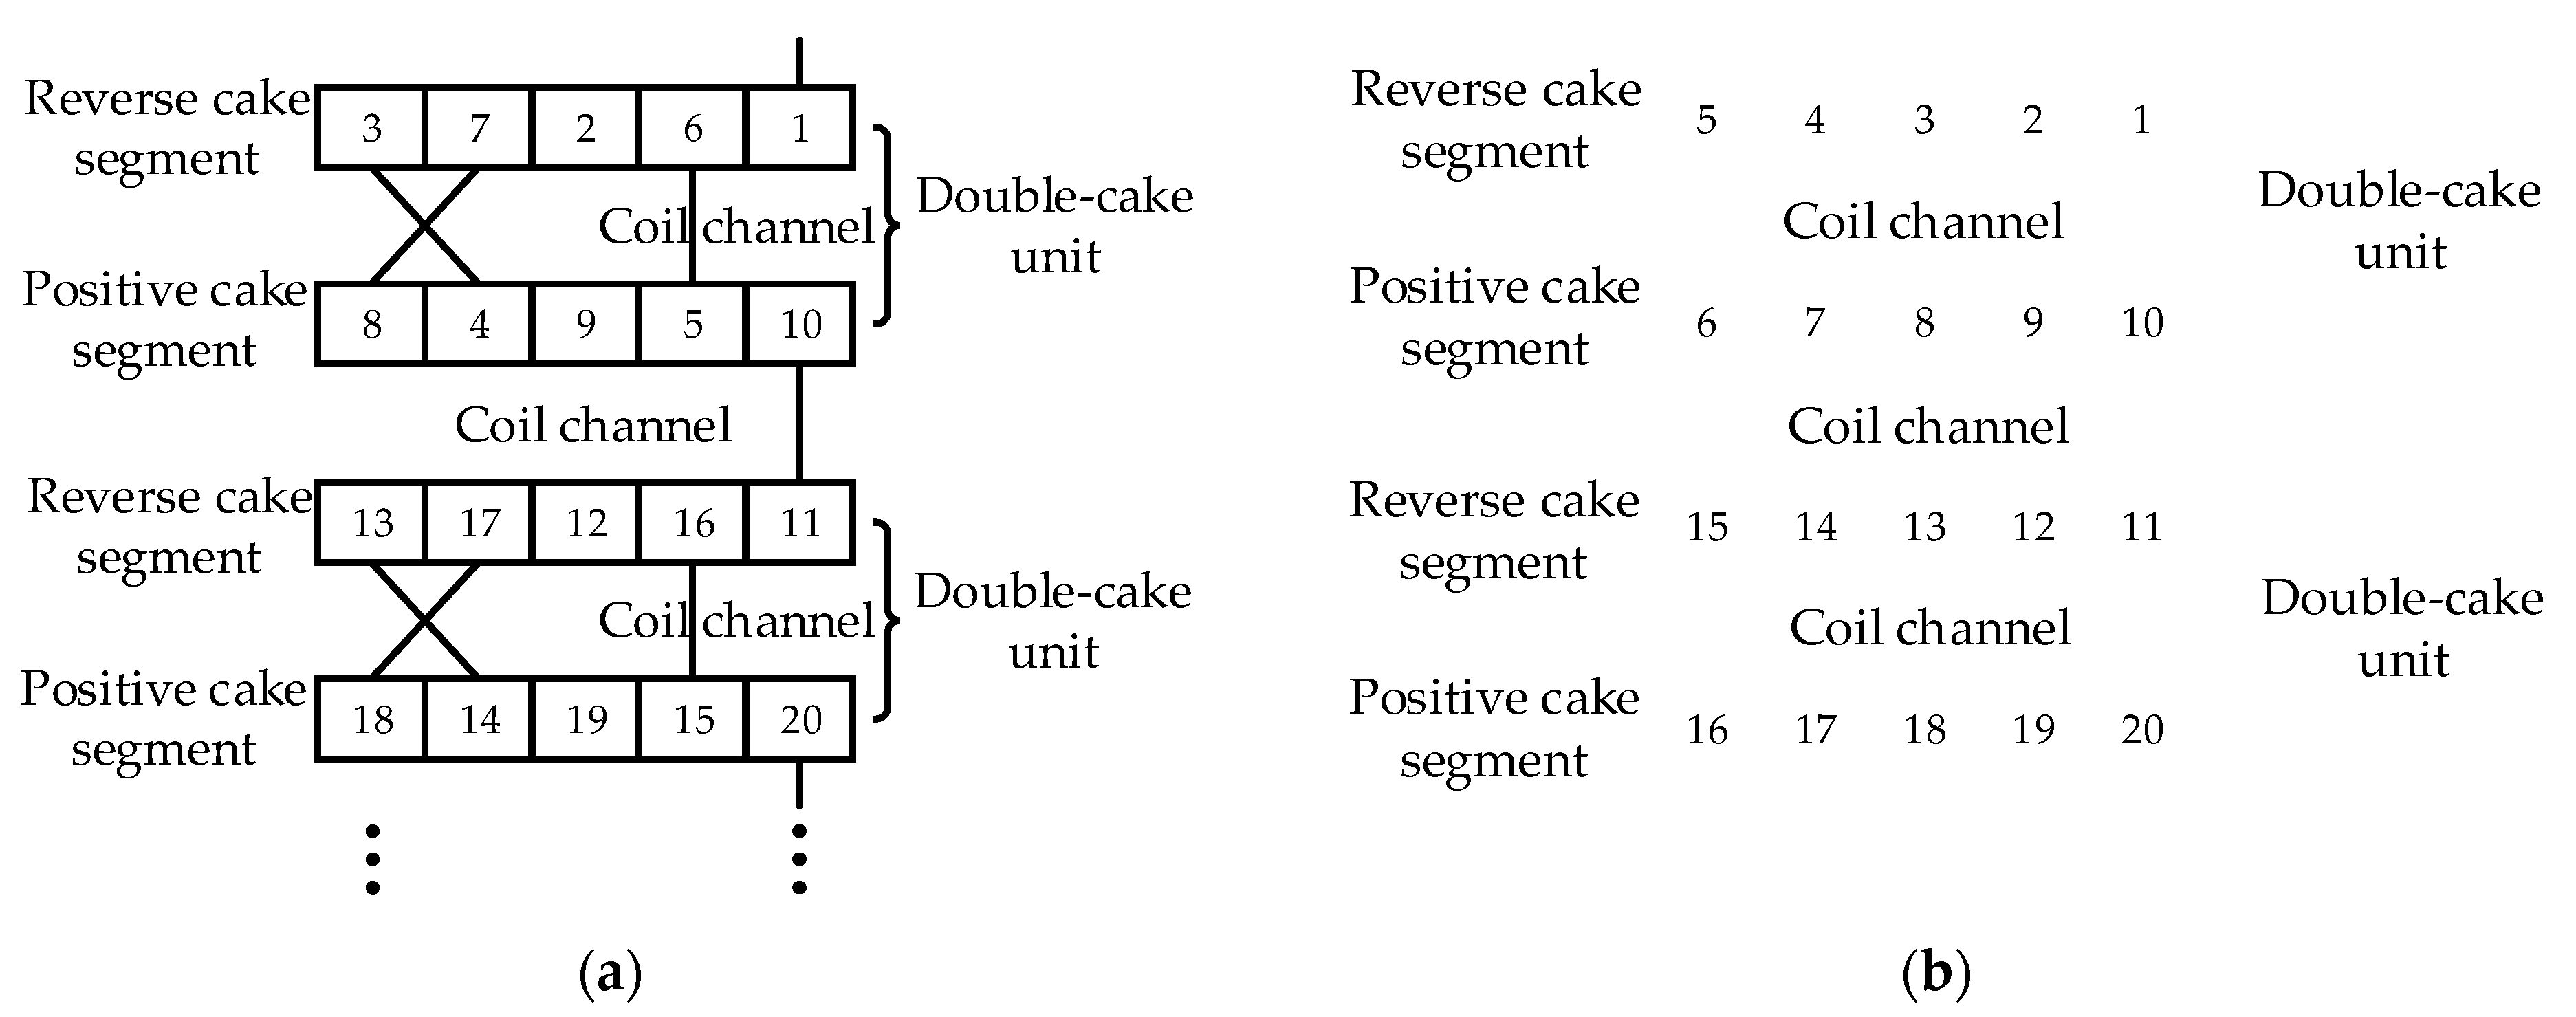
3.1. Design of Winding
3.2. HFT Model
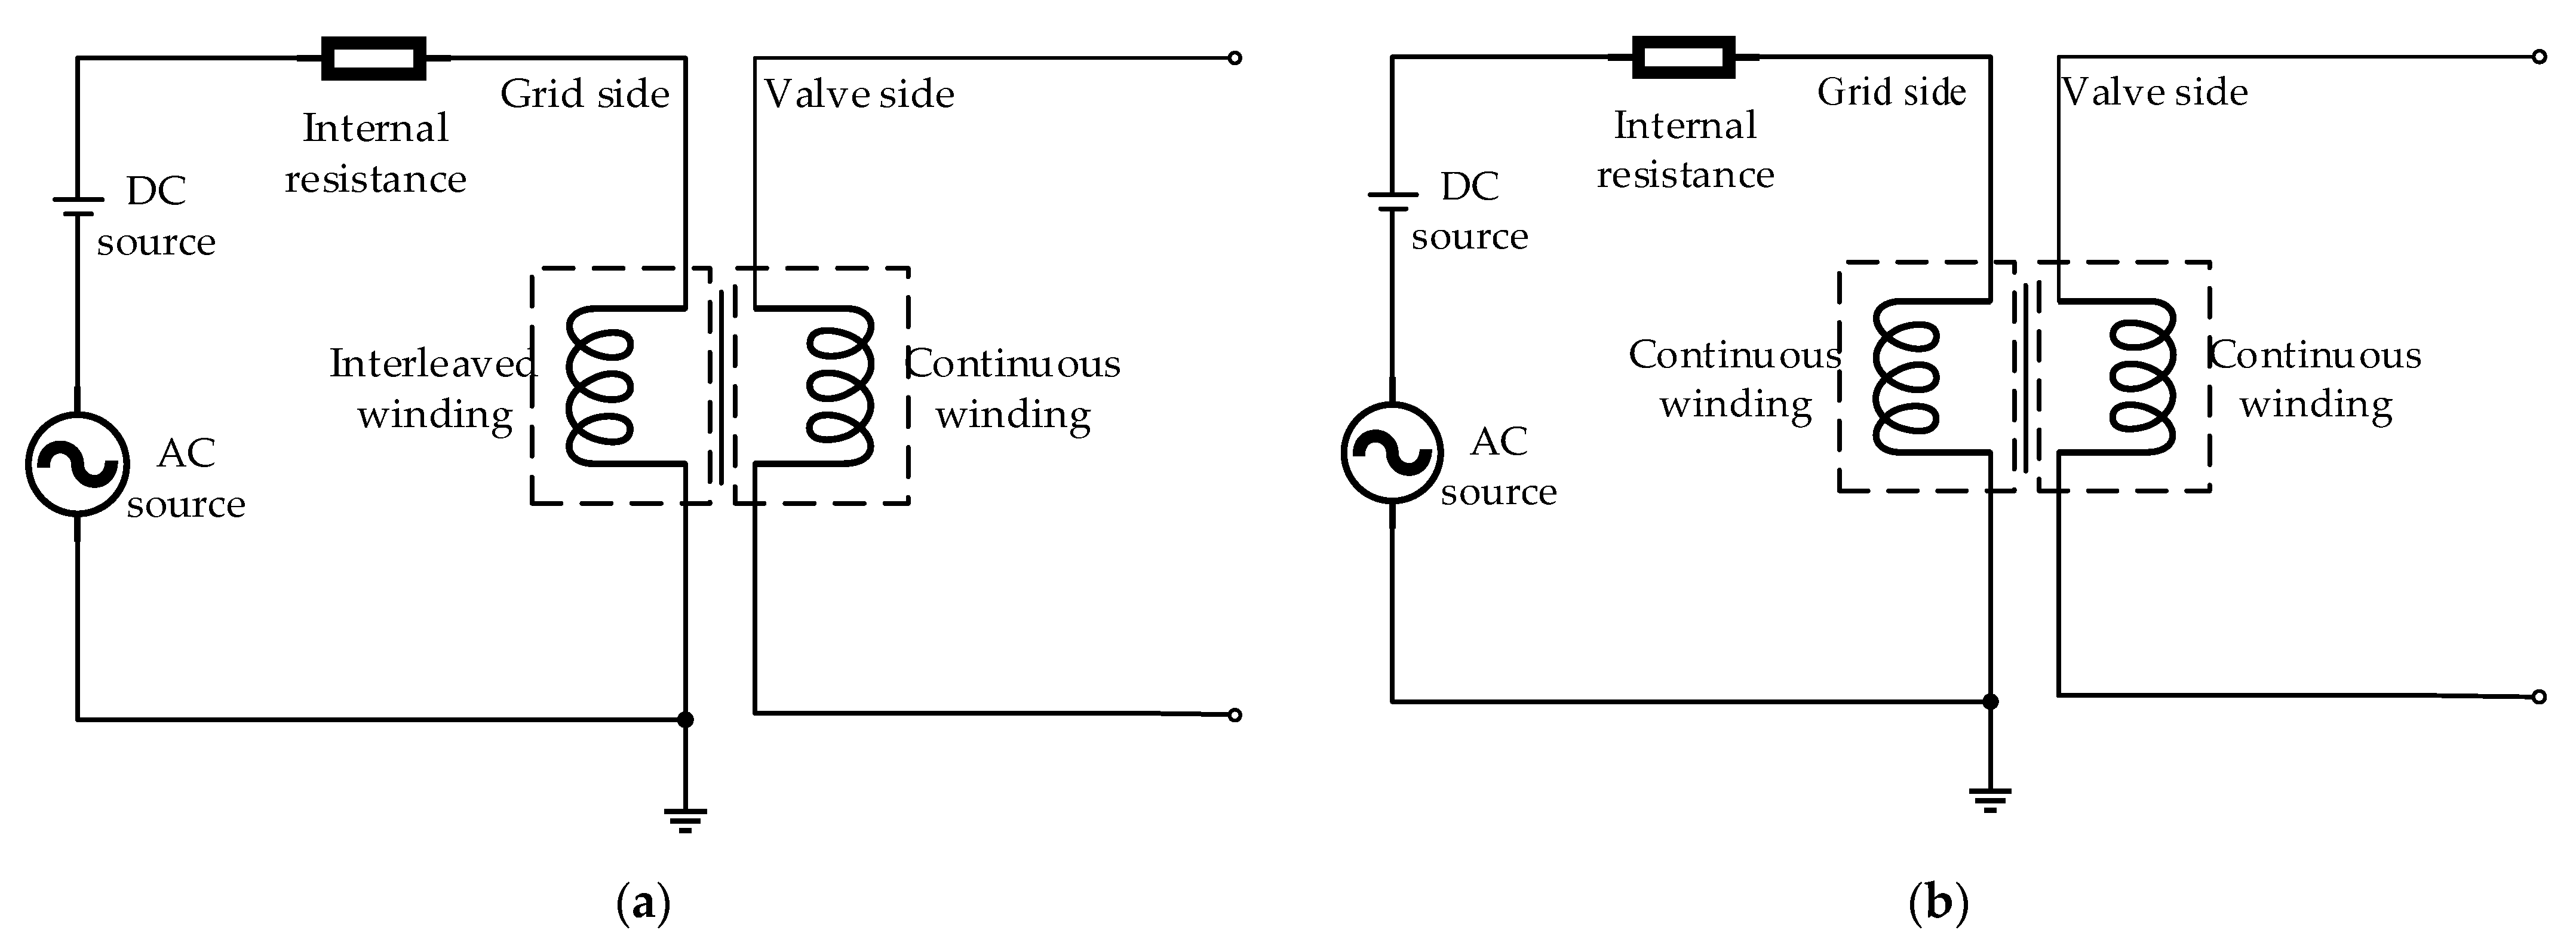
3.3. DC Bias Model
4. Analysis of Electromagnetic Vibration Characteristics under DC Bias
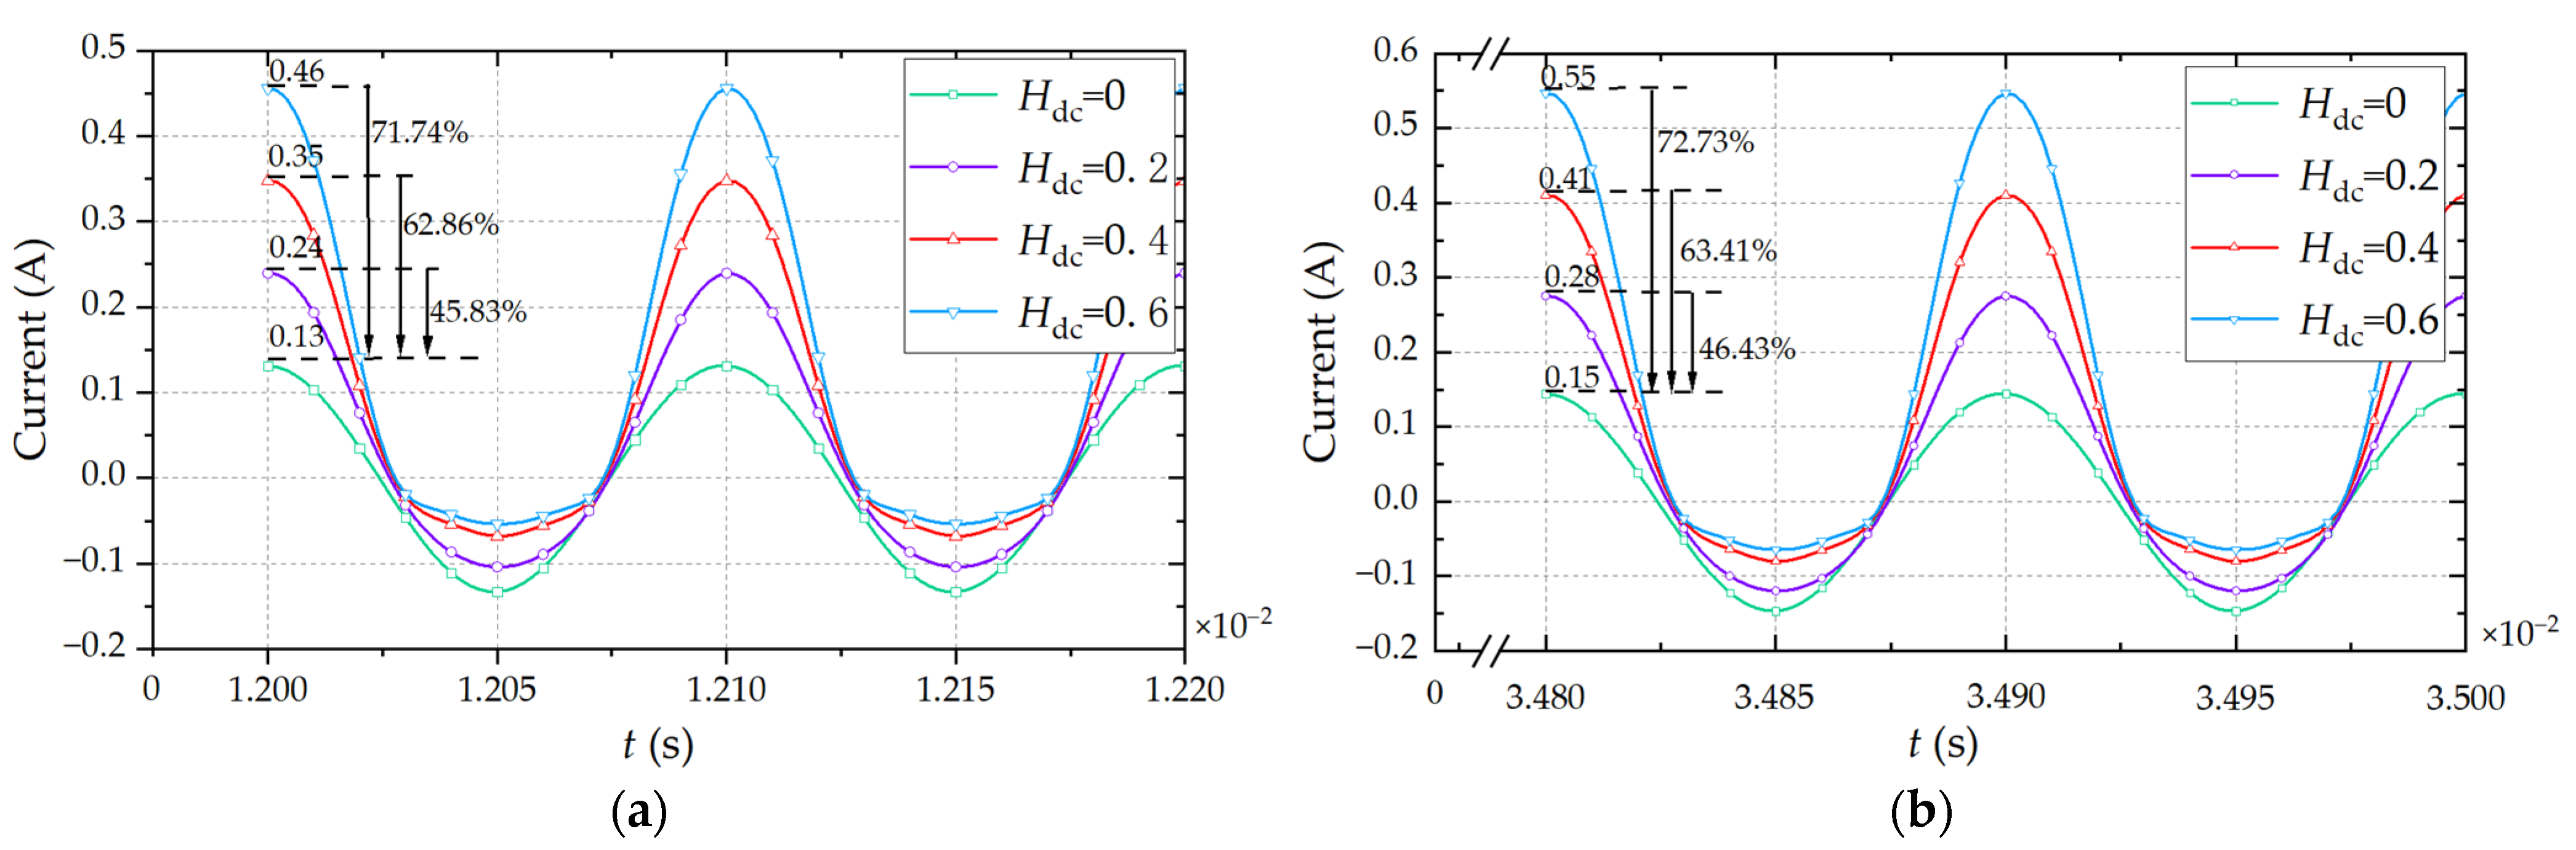
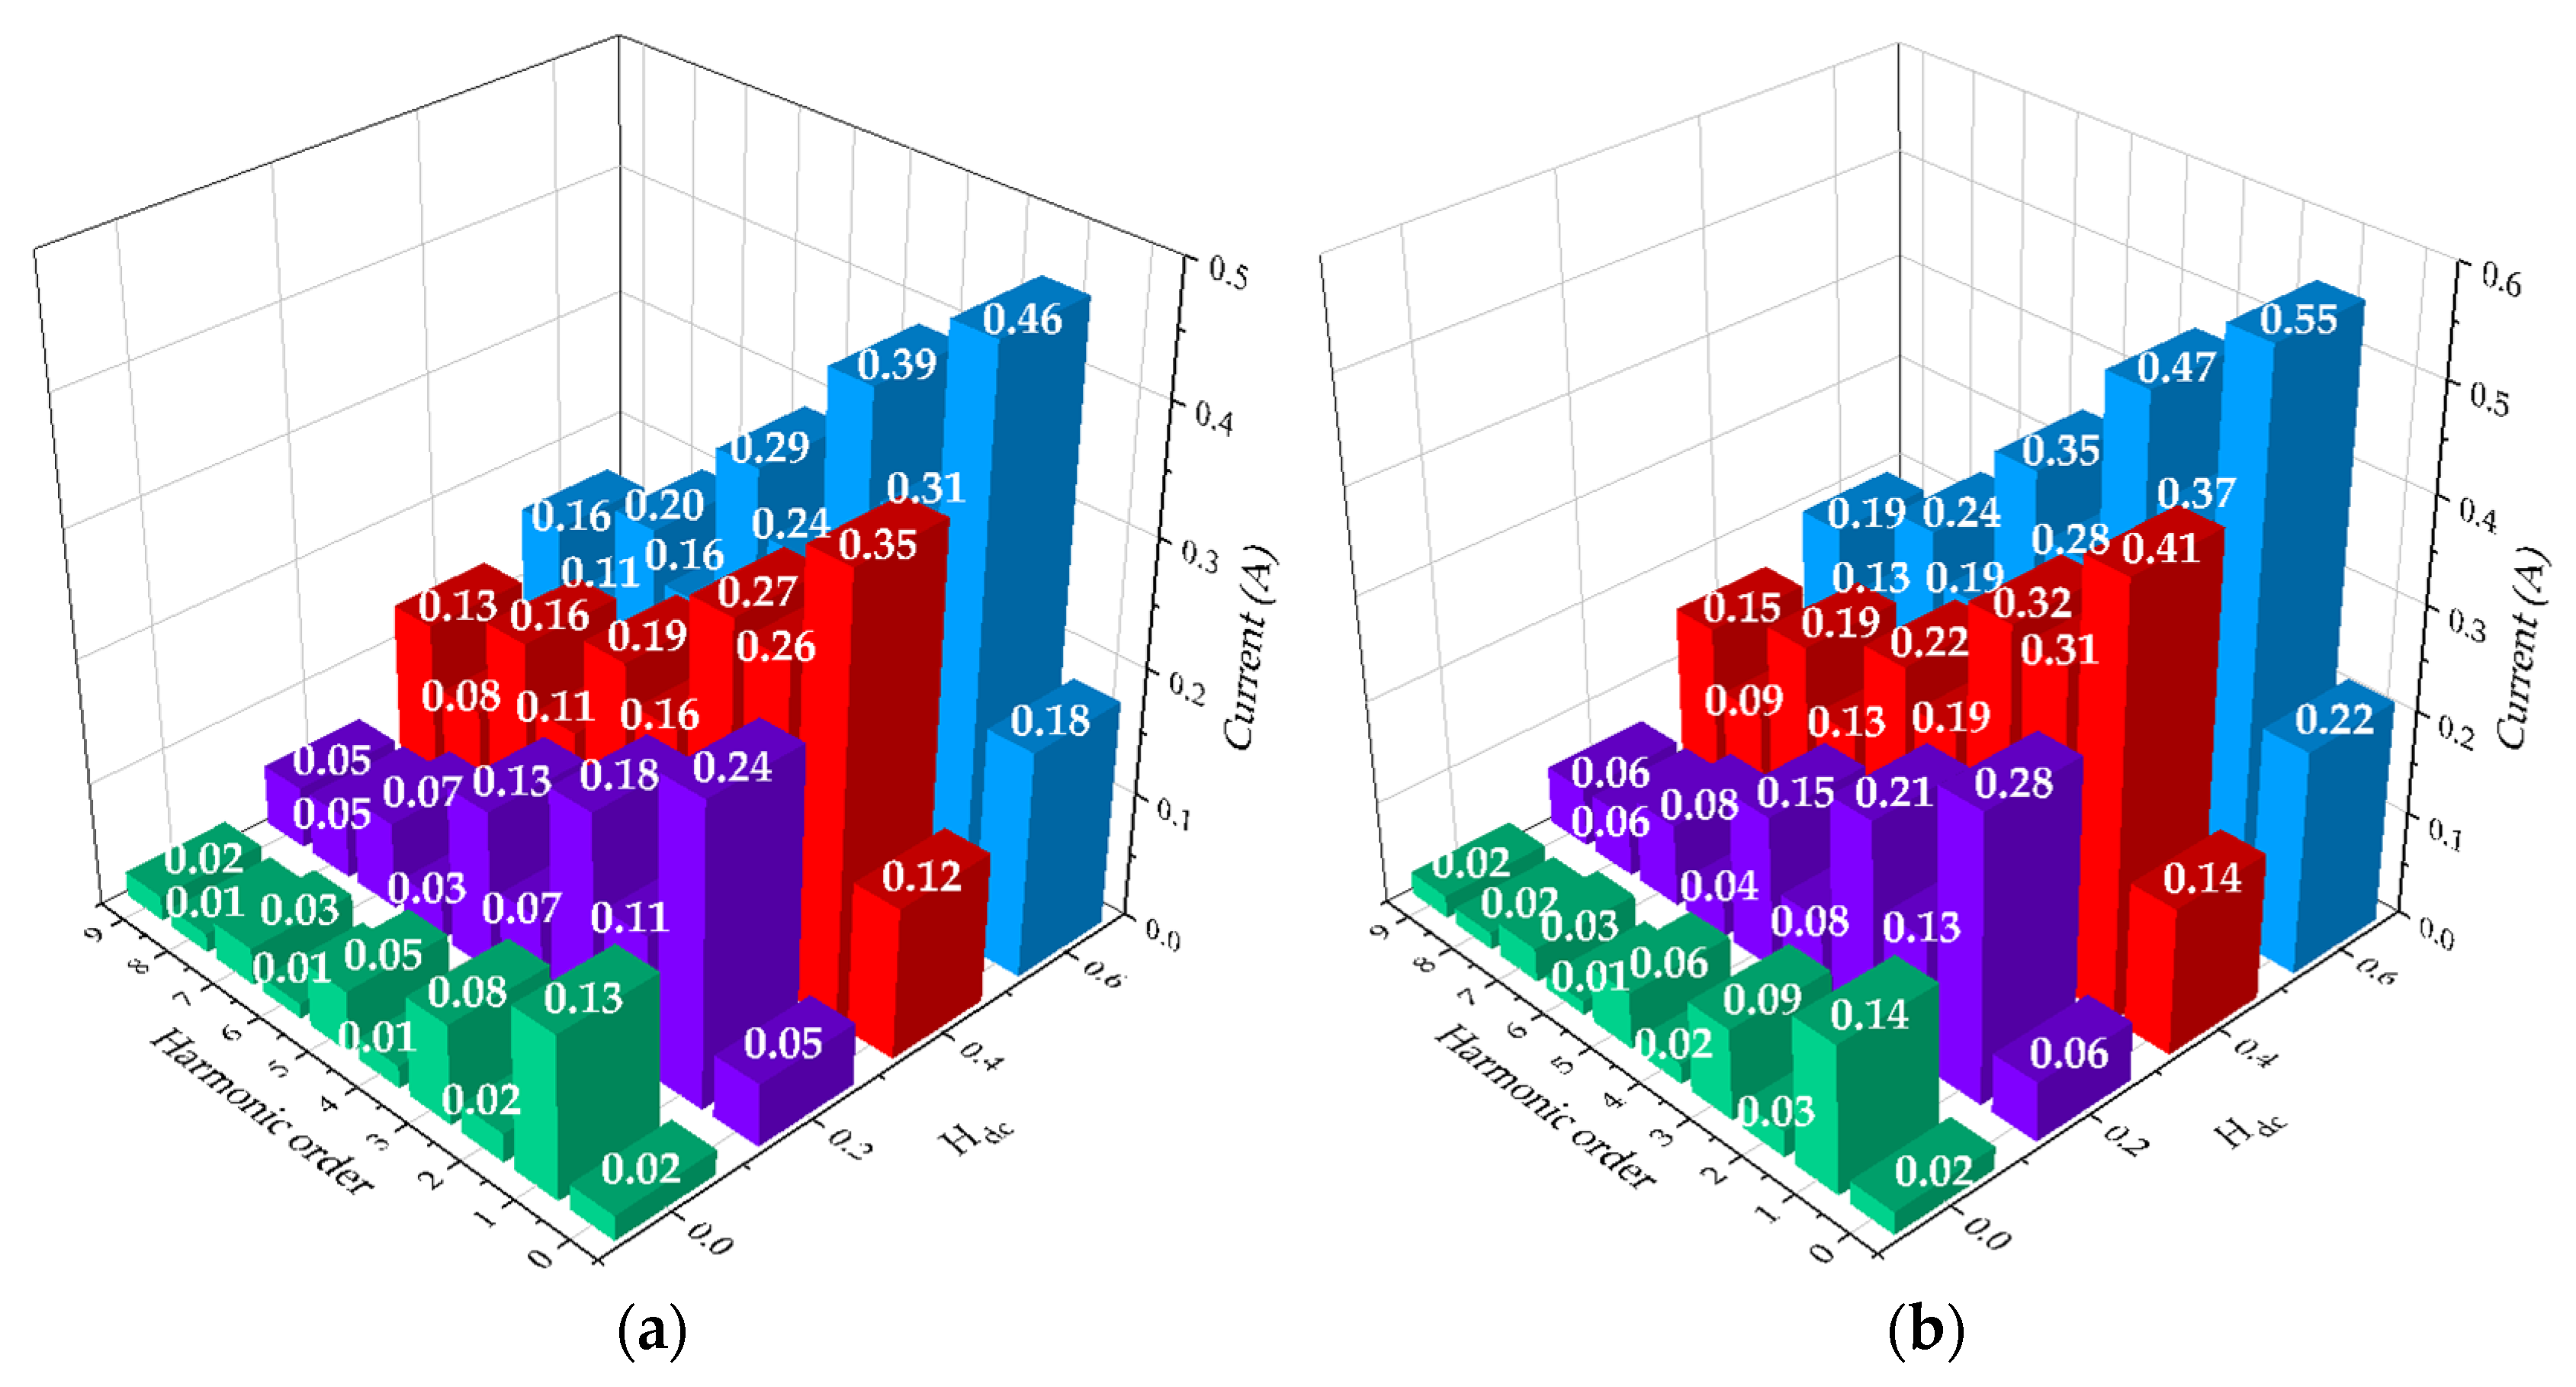
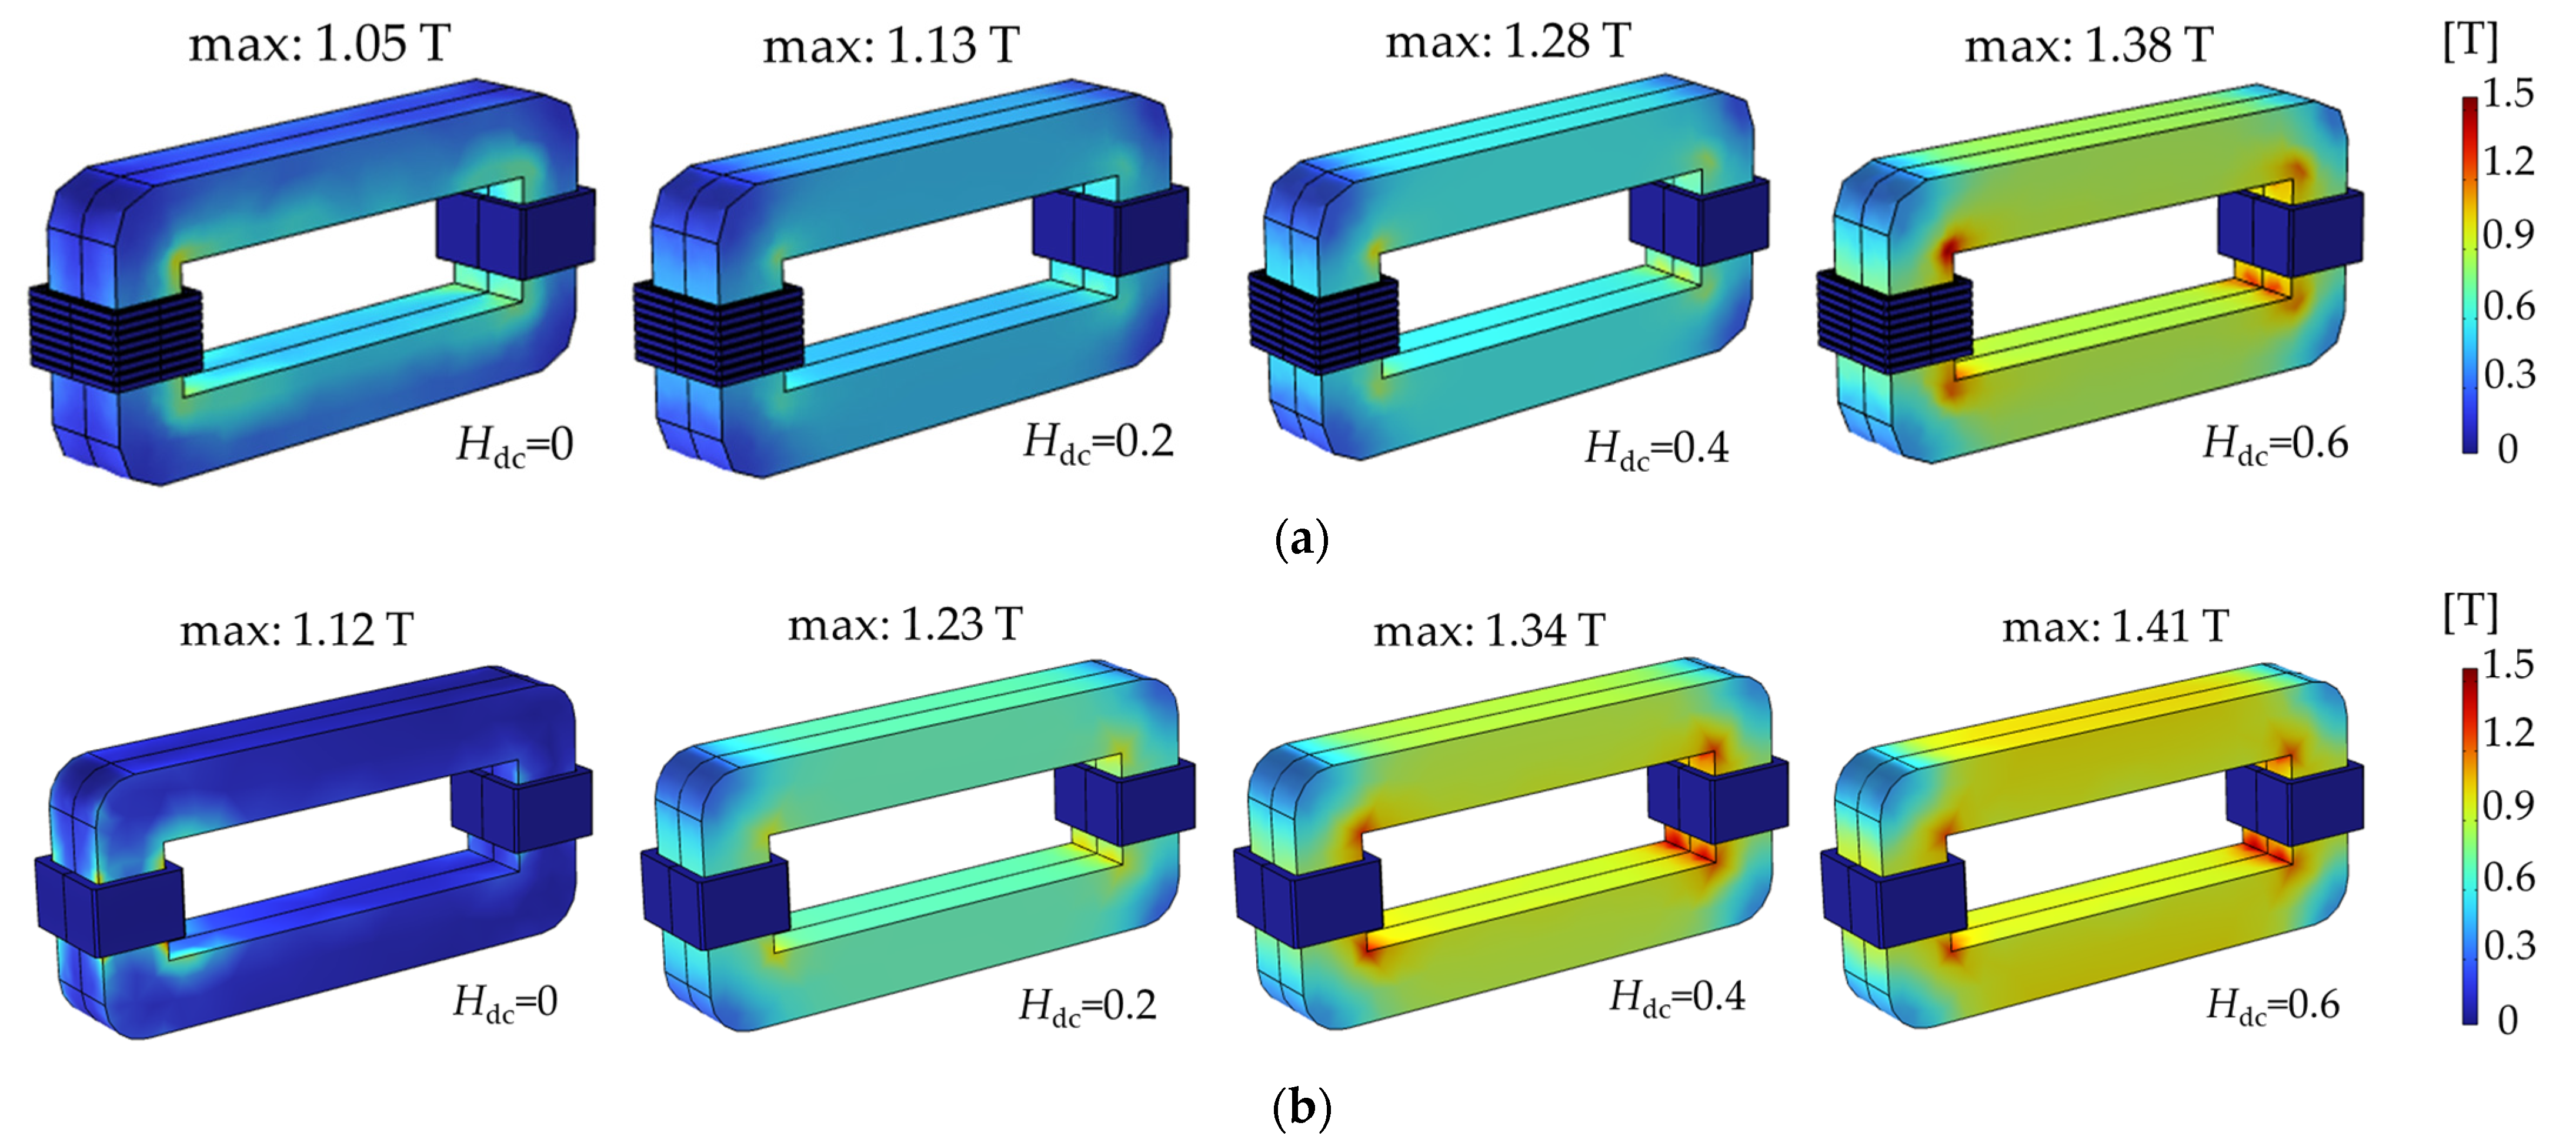
4.1. Electromagnetic Characteristics
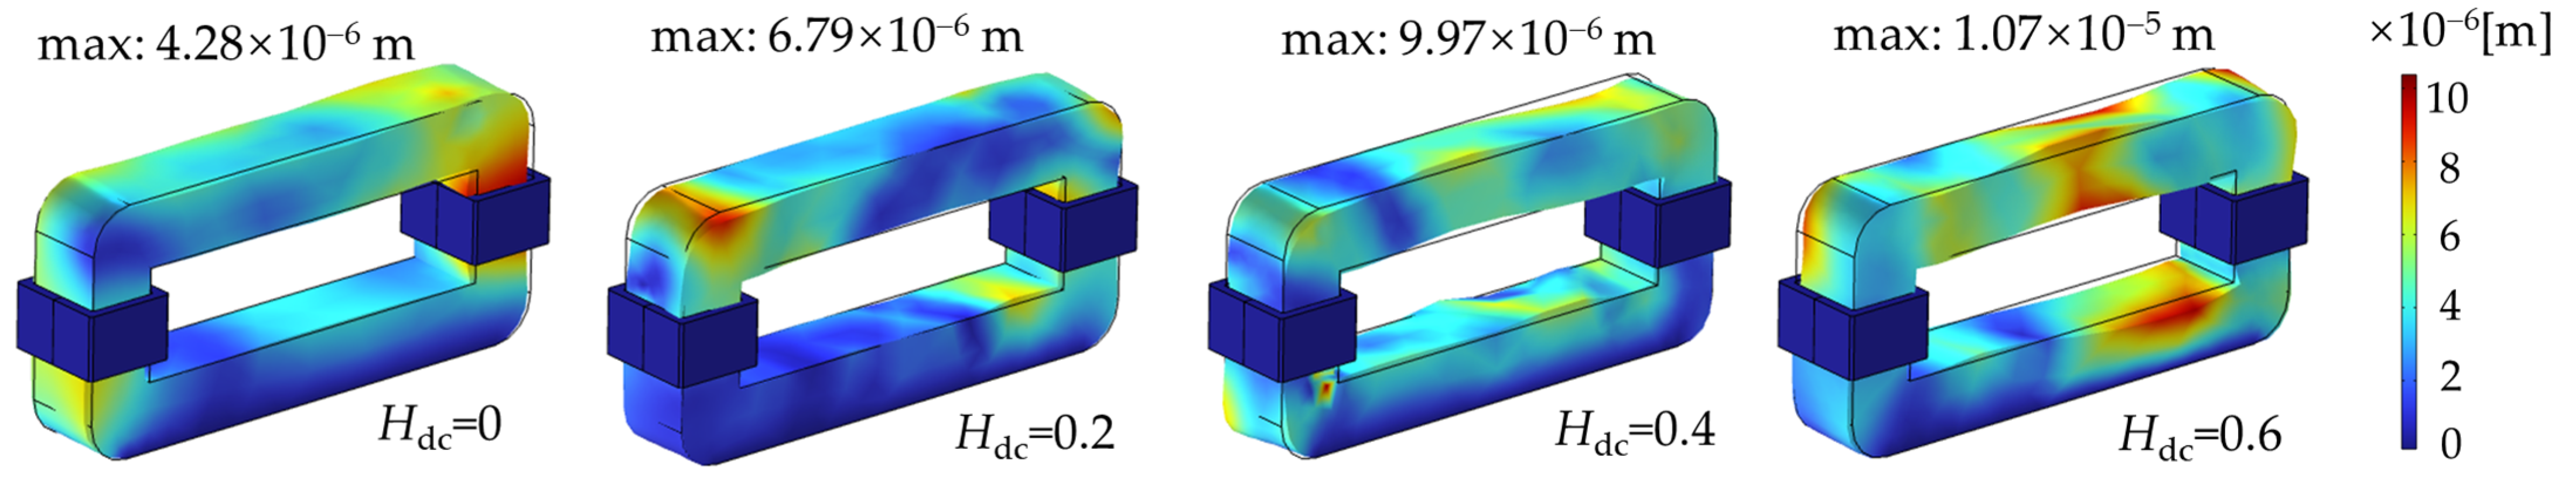
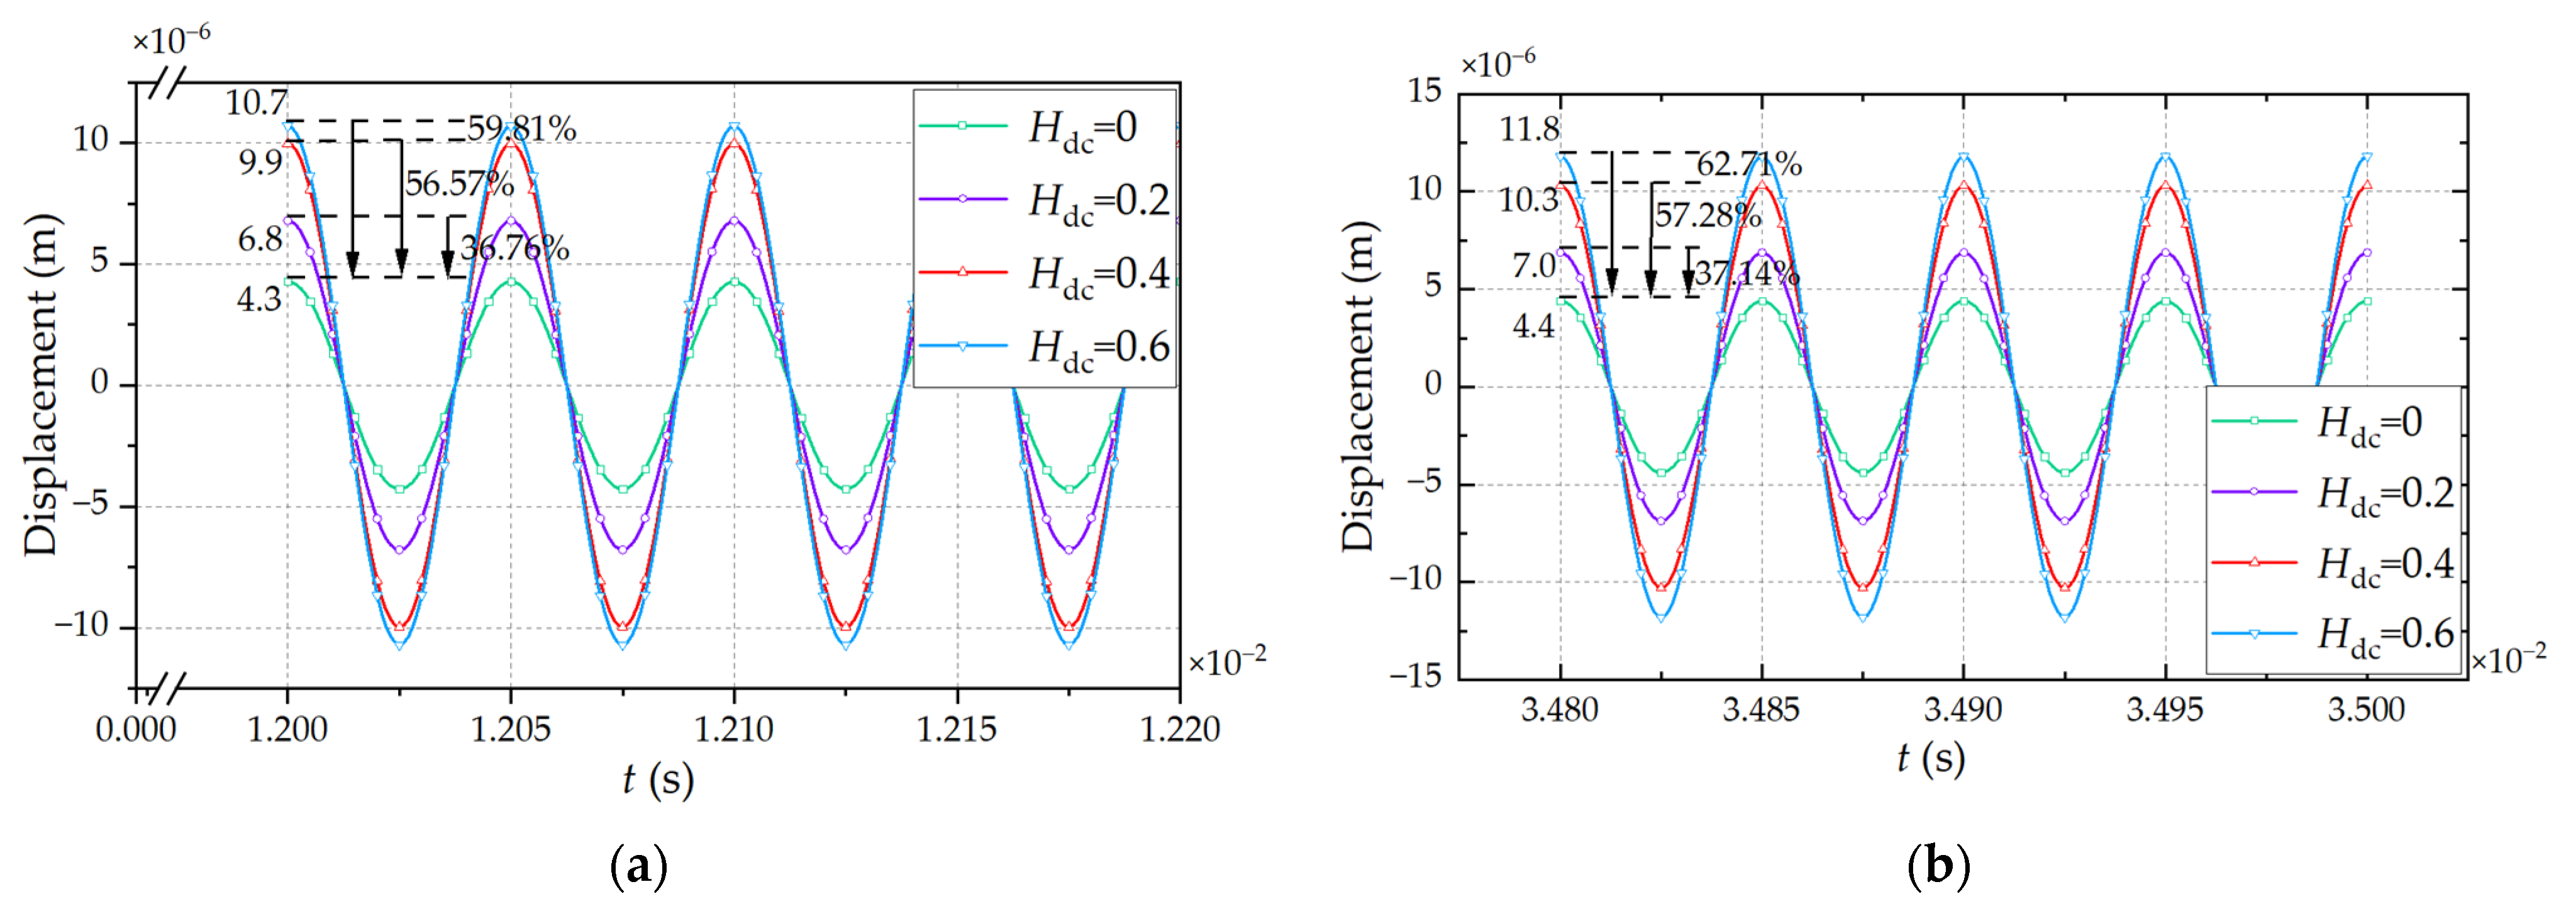
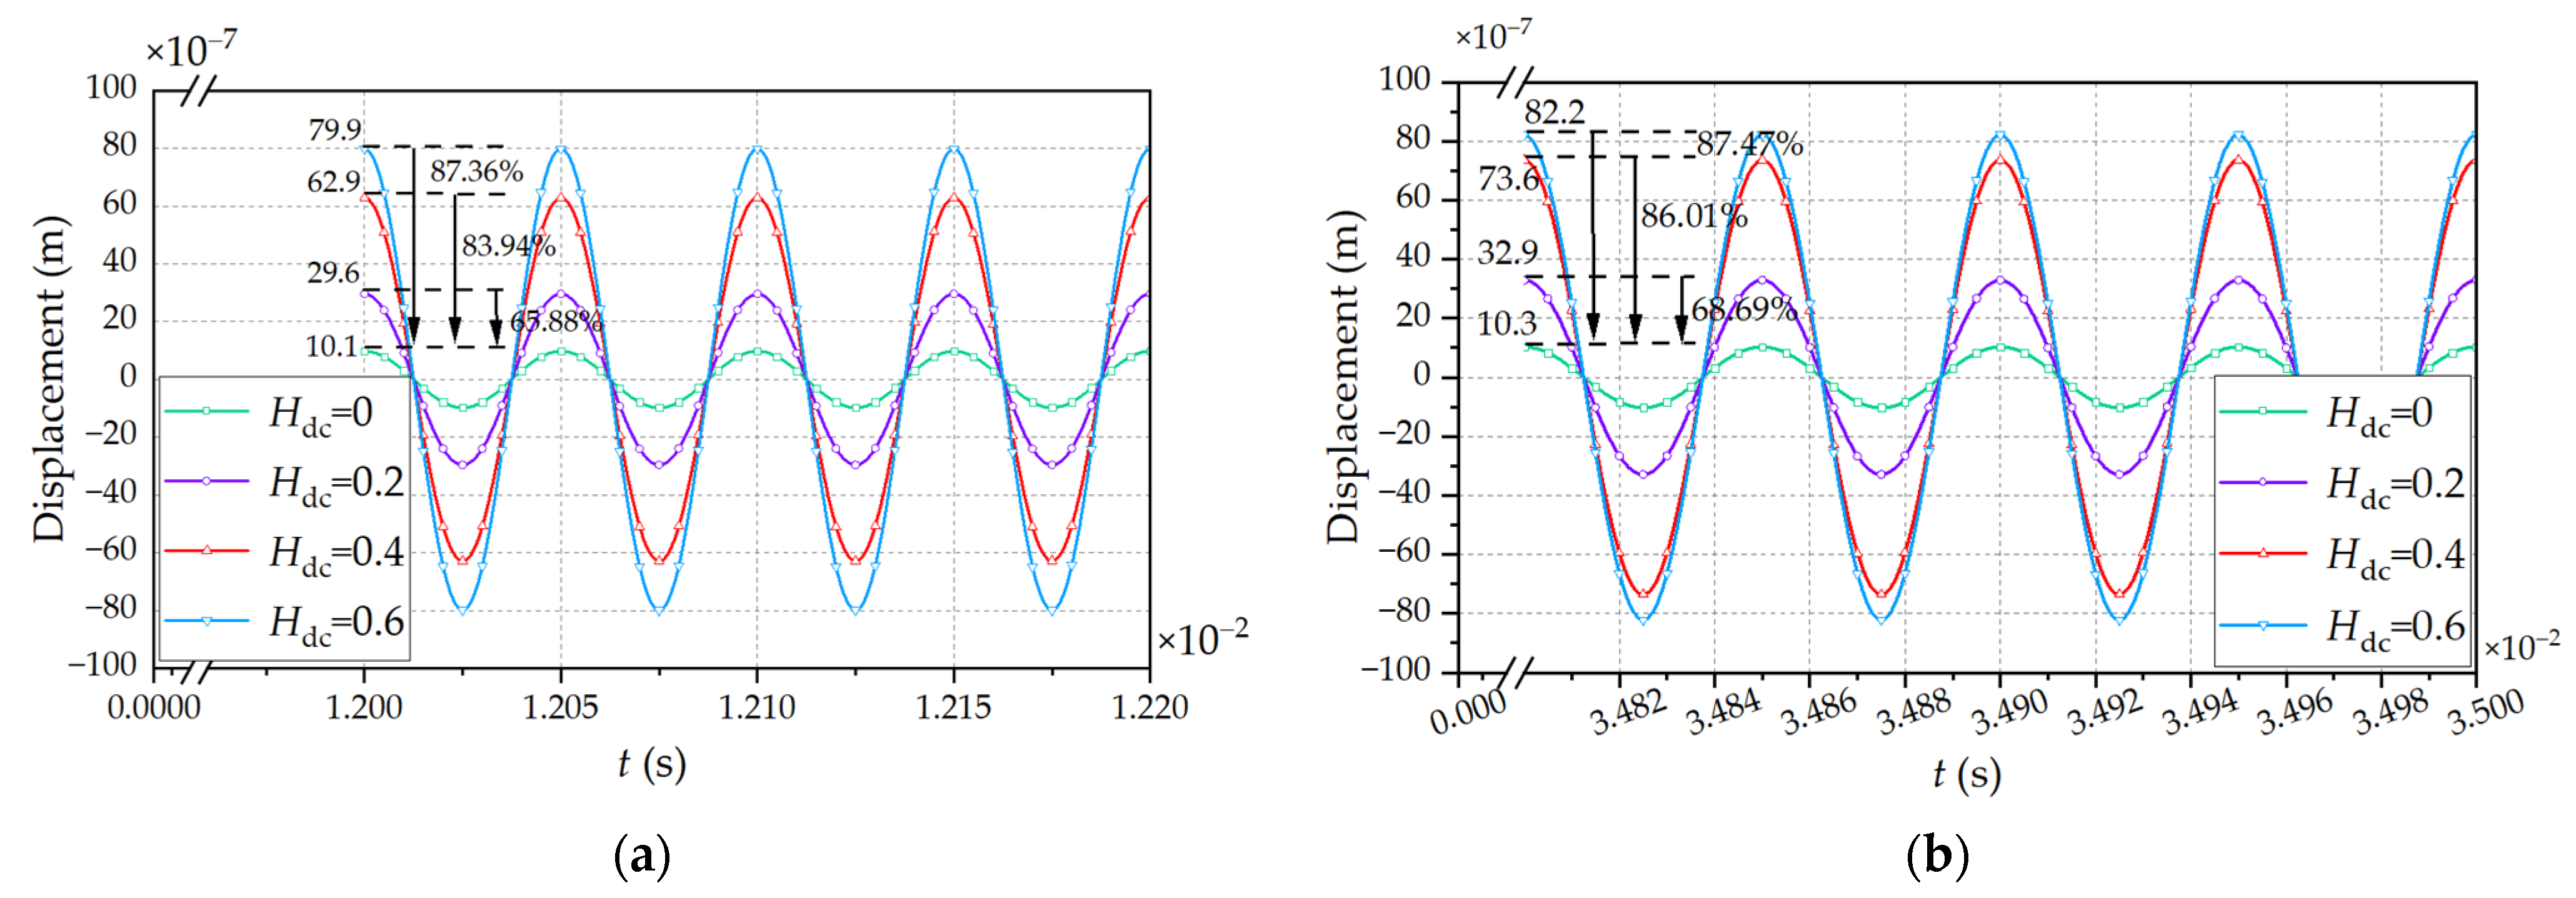
4.2. Vibration Characteristics
5. Conclusions
Author Contributions
Funding
Data Availability Statement
Conflicts of Interest
References
- Chen, Z.; Li, H.; Liu, L.; Xiang, L.; Bai, B. DC Bias Treatment of Hybrid Type Transformer Based on Magnetic Flux Modulation Mechanism. IEEE Trans. Magn. 2019, 55, 1700204. [Google Scholar] [CrossRef]
- Pan, C.; Wang, C.J.; Su, H. Excitation Current and Vibration Characteristics of DC Biased Transformer. CSEE J. Power Energy Syst. 2021, 7, 604–613. [Google Scholar]
- Li, X.; Wen, X.; Markham, P.N.; Liu, Y. Analysis of Nonlinear Characteristics for a Three-Phase, Five-Limb Transformer under DC Bias. IEEE Trans. Power Deliv. 2010, 25, 2504–2510. [Google Scholar] [CrossRef]
- Yang, C.; Ding, Y.; Qiu, H.; Xiong, B. Analysis of Turn-to-Turn Fault on Split-Winding Transformer Using Coupled Field-Circuit Approach. Processes 2021, 9, 1314. [Google Scholar] [CrossRef]
- Zhang, X.; Liu, X.; Guo, F. Calculation of DC Bias Reactive Power Loss of Converter Transformer via Finite Element Analysis. IEEE Trans. Power Deliv. 2020, 36, 751–759. [Google Scholar] [CrossRef]
- Liu, C.M.; Li, X.H.; Li, X.J. Simulating the Vibration Increase of the Transformer Iron Core due to the DC Bias. Int. J. Appl. Electrom. Mech. 2017, 55, 423–433. [Google Scholar] [CrossRef]
- Bíró, O.; Koczka, G.; Leber, G.; Preis, K.; Wagner, B. Finite Element Analysis of Three-Phase Three-Limb Power Transformers under DC Bias. IEEE Trans. Magn. 2014, 50, 565–568. [Google Scholar] [CrossRef]
- Fuchs, E.F.; You, Y.; Roesler, D.J. Modeling and Simulation, and Their Validation of Three-Phase Transformers with Three Legs under DC Bias. IEEE Trans. Power Deliv. 1999, 14, 443–449. [Google Scholar] [CrossRef]
- Zhao, Z.G.; Liu, F.G.; Cheng, Z.G.; Yan, W.L.; Liu, L.R.; Zhang, J.J.; Fan, Y.N. Measurements and Calculation of Core-Based B-H Curve and Magnetizing Current in DC-Biased Transformers. IEEE Trans. Appl. Supercond. 2010, 20, 1131–1134. [Google Scholar] [CrossRef]
- Chen, D.; Feng, Z.; Wang, Q.; Fang, L.; Bai, B. Study of Analysis and Experiment for Ability to Withstand DC Bias in Power Transformers. IEEE Trans. Magn. 2018, 54, 1–6. [Google Scholar] [CrossRef]
- Chen, Y.; Fu, W.; Lin, H.; Niu, S. A Passive Negative Magnetic Reluctance Structure-Based kHz Transformer for Improved DC Magnetic Bias Withstanding. IEEE Trans. Power Electron. 2023, 38, 717–727. [Google Scholar] [CrossRef]
- Zhou, Z.Q.; Duan, H.; Cheng, L.; Xie, Q.; Chen, D.Z. Study on Influence of Different Winding Structure Parameters on Insulation Structure of UHV Converter Transformer. Transformer 2022, 59, 36–42. [Google Scholar]
- Zhang, J.H. Control Measures of Creepage between Transformer Disc Coils. Transformer 2019, 56, 18–20. [Google Scholar]
- Luo, Q.L.; Luo, Q.S.; Wang, B. Research and Calculation of Longitudinal Insulation in Special Interleaved Winding of Converter Transformer. Transformer 2013, 50, 1–4. [Google Scholar]
- Zhang, B.; Zhang, Q. Characteristic Analysis of Magnetic Resonant Coupling-Based Wireless Power Transfer System with Two Receivers. J. South Chin. Univ. Technol. 2012, 40, 152–158. [Google Scholar]
- Sawahara, Y.; Futagami, D.; Ishizaki, T.; Awai, I. Development of underwater WPT system independent of salinity. In Proceedings of the 2014 Asia-Pacific Microwave Conference (APMC), Sendai, Japan, 4–7 November 2014; pp. 1363–1365. [Google Scholar]
- Li, J.; Zhang, P.; Ma, T.; Zhang, Y.; Wang, Y.W.; Wei, C.; Wang, B. Simulation and experimental analysis of wireless power transmission system via magnetic resonance coupling. Electr. Mach. Control 2015, 19, 72–78. [Google Scholar]
- Yang, Y.M.; Liu, X.M.; Yang, F.; Jadoon, A.; Zhang, C.Y. Analysis of DC bias vibration of transformer core based on electromagnetic force field coupling. Int. J. Appl. Electrom. Mech. 2014, 50, 297–309. [Google Scholar] [CrossRef]
- Georgi, S.; Helmut, P.; Peter, H. Spatial Distributions of Magnetostriction Displacements and Noise Generation of Model Transformer Cores. Int. J. Mech. Sci. 2016, 118, 188–194. [Google Scholar]
- Pfutzner, H.; Shilyashki, G.; Bengtsson, C. Effects of DC Bias on Regional Flux and Magnetostriction of A Single-Phase Transformer Core Modeled by 3-D MACC. IEEE Trans. Magn. 2018, 54, 1–6. [Google Scholar] [CrossRef]
- Li, B.; Wang, Z.Z. Research on Winding Current of UHV Transformer under DC-Bias. Trans. Chin. Electrotech. Soc. 2020, 35, 1422–1431. [Google Scholar]
- Liu, T.; Wu, H.; Liu, L.; Peng, Z.; Wang, H. Simulation of Losses in DC-Biased Single Phase Three Limb Transformer. In Proceedings of the 2016 IEEE International Conference on High Voltage Engineering and Application (ICHVE), Chongqing, China, 19–22 September 2016; pp. 1–4. [Google Scholar]
- Pan, Z.H.; Wang, X.M.; Tan, B.; Zhu, L.; Liu, Y.; Liu, Y.L.; Wen, X.S. Potential Compensation Method for Restraining the DC Bias of Transformers During HVDC Monopolar Operation. IEEE Trans. Power Deliv. 2016, 31, 103–111. [Google Scholar] [CrossRef]
- Yang, Y.M.; Liu, X.M.; Yang, F. Soil structure effect on transformer DC bias. In Proceedings of the 2014 IEEE International Conference on Industrial Technology (ICIT), Busan, Republic of Korea, 26 February–1 March 2014; pp. 535–540. [Google Scholar]


| Item | Unit | Value |
|---|---|---|
| Model | / | QZ-2 |
| Cross-sectional area | mm2 | 3.55 |
| Resistivity | Ω·m | 1.67 × 10⁻⁸ |
| Length | mm | 3.55 |
| Width | mm | 1.00 |
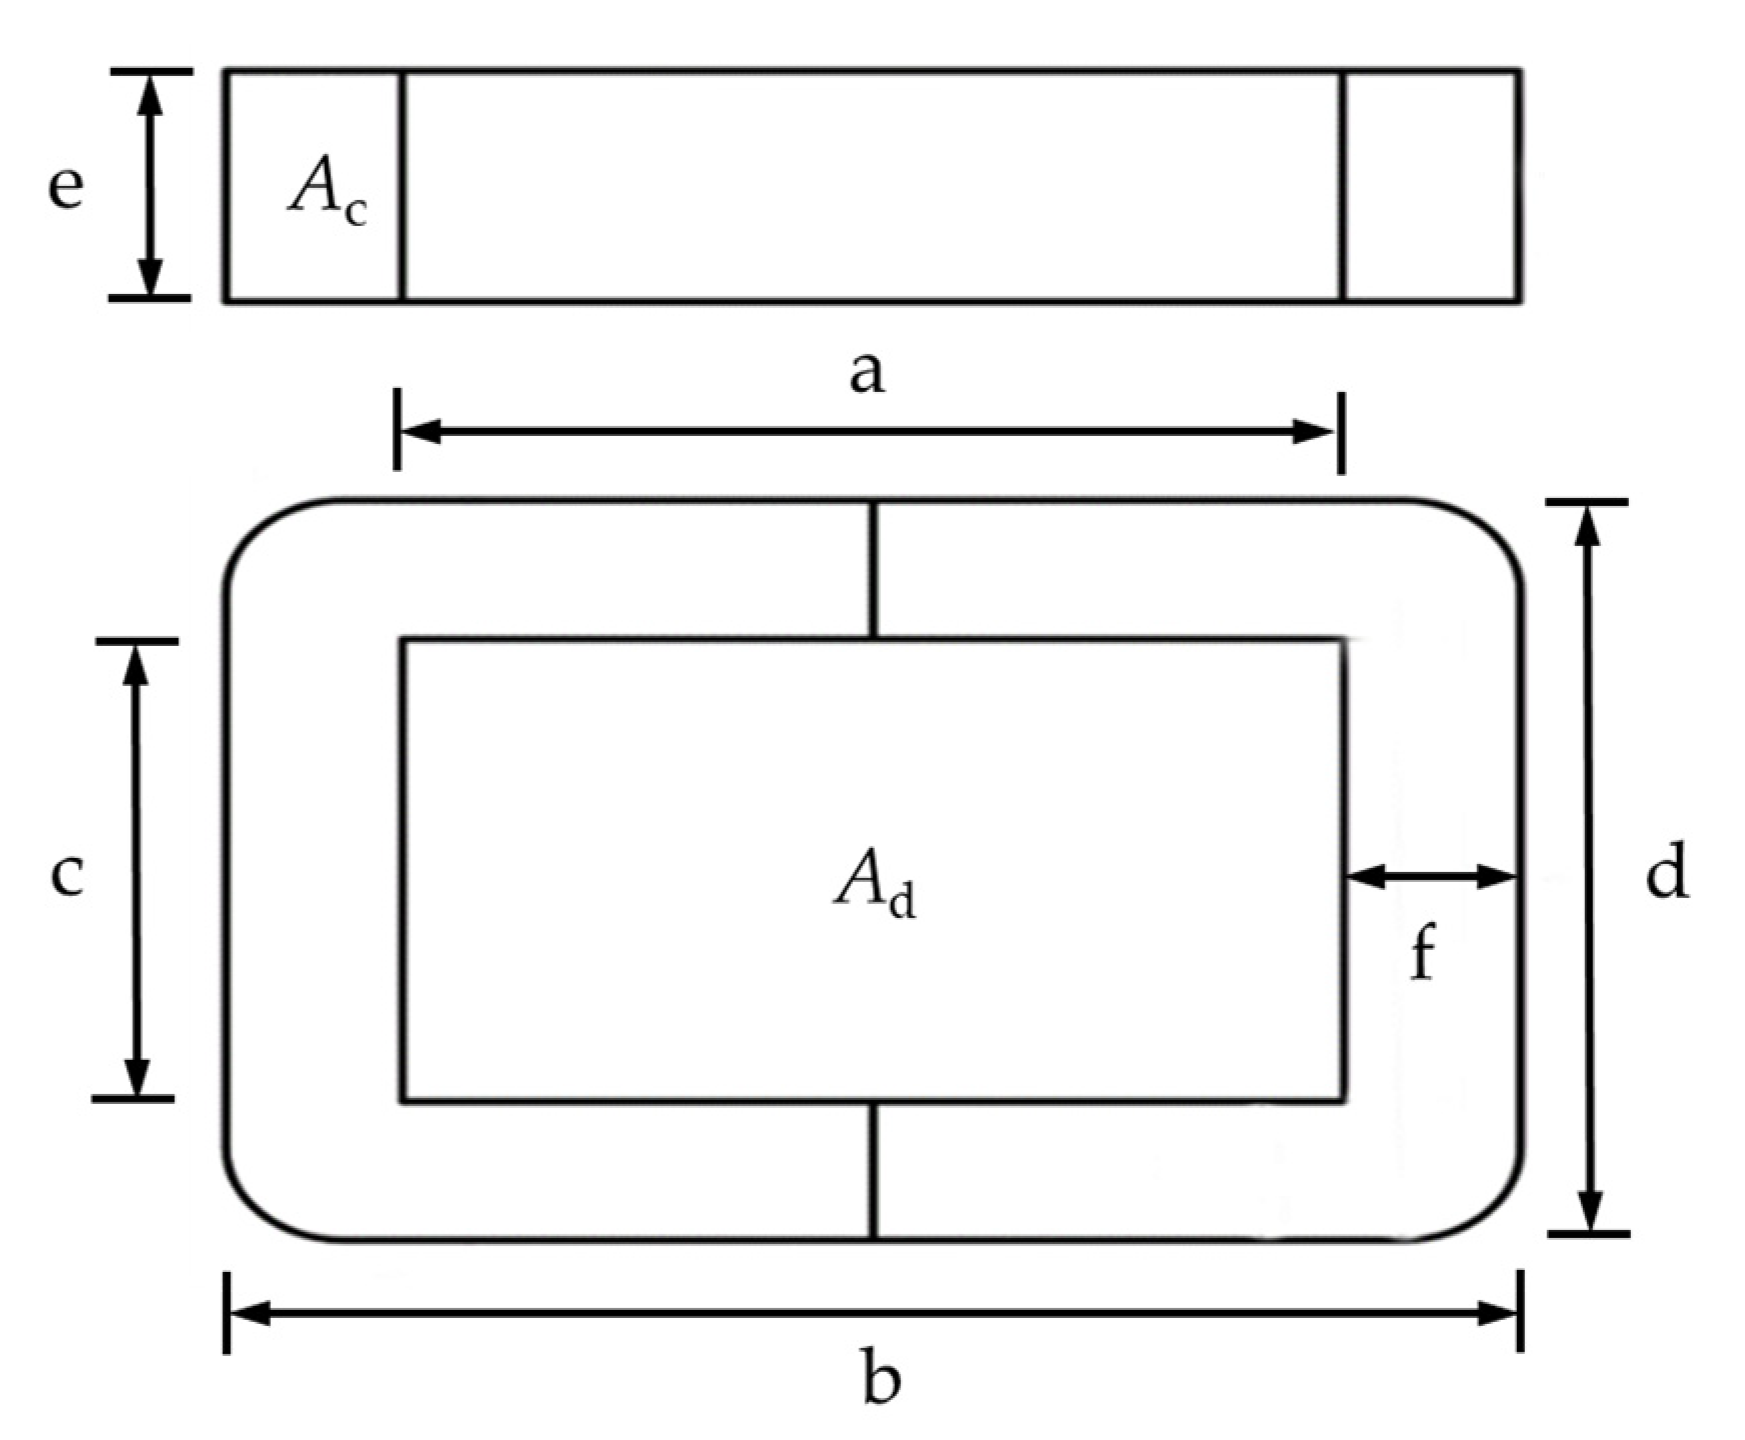
| Item | Unit | Value | Item | Unit | Value |
|---|---|---|---|---|---|
| a | mm | 141 | e | mm | 25 |
| b | mm | 190 | f | mm | 25 |
| c | mm | 40.5 | Ac | cm2 | 6 |
| d | mm | 90 | Ad | cm2 | 57.1 |
| Winding Type | Hdc | Maximum Magnetic Flux Density (T) | Average Core Loss Density (W/m3) | Average Winding Loss Density (W/m3) |
|---|---|---|---|---|
| Interleaved winding | 0 | 1.05 | 3.43 × 10⁶ | 1.12 × 10⁶ |
| 0.2 | 1.13 | 4.25 × 10⁶ | 1.54 × 10⁶ | |
| 0.4 | 1.28 | 5.80 × 10⁶ | 1.86 × 10⁶ | |
| 0.6 | 1.38 | 8.39 × 10⁶ | 1.91 × 10⁶ | |
| Continuous winding | 0 | 1.12 | 3.58 × 10⁶ | 1.40 × 10⁶ |
| 0.2 | 1.23 | 4.39 × 10⁶ | 1.91 × 10⁶ | |
| 0.4 | 1.34 | 6.16 × 10⁶ | 2.11 × 10⁶ | |
| 0.6 | 1.41 | 8.69 × 10⁶ | 2.19 × 10⁶ |
| Winding Type | Hdc | Maximum Iron Core Stress (N/m2) | Maximum Winding Stress (N/m2) | Maximum Iron Core Deformation (m) | Maximum Winding Deformation (m) |
|---|---|---|---|---|---|
| Interleaved winding | 0 | 8.91 × 10⁵ | 4.96 × 10⁵ | 4.28 × 10⁻⁶ | 1.01 × 10⁻⁶ |
| 0.2 | 1.86 × 10⁶ | 8.49 × 10⁵ | 6.79 × 10⁻⁶ | 2.96 × 10⁻⁶ | |
| 0.4 | 3.39 × 10⁶ | 1.53 × 10⁶ | 9.97 × 10⁻⁶ | 6.29 × 10⁻⁶ | |
| 0.6 | 4.03 × 10⁶ | 1.78 × 10⁶ | 1.07 × 10⁻⁵ | 7.99 × 10⁻⁶ | |
| Continuous winding | 0 | 9.21 × 10⁵ | 5.31 × 10⁵ | 4.39 × 10⁻⁶ | 1.03 × 10⁻⁶ |
| 0.2 | 1.97 × 10⁶ | 8.64 × 10⁵ | 6.97 ×10⁻⁶ | 3.29 × 10⁻⁶ | |
| 0.4 | 3.56 × 10⁶ | 1.63 × 10⁶ | 1.03 × 10⁻⁵ | 7.36 × 10⁻⁶ | |
| 0.6 | 3.94 × 10⁶ | 1.82 × 10⁶ | 1.18 × 10⁻⁵ | 8.22 × 10⁻⁶ |
Disclaimer/Publisher’s Note: The statements, opinions and data contained in all publications are solely those of the individual author(s) and contributor(s) and not of MDPI and/or the editor(s). MDPI and/or the editor(s) disclaim responsibility for any injury to people or property resulting from any ideas, methods, instructions or products referred to in the content. |
© 2023 by the authors. Licensee MDPI, Basel, Switzerland. This article is an open access article distributed under the terms and conditions of the Creative Commons Attribution (CC BY) license (https://creativecommons.org/licenses/by/4.0/).
Share and Cite
Ding, H.; Zhao, W.; Li, M.; Zhang, L.; Sun, Y. Electromagnetic Vibration Characteristics of High-Frequency Transformer under DC Bias with Different Winding Structures. Processes 2023, 11, 1185. https://doi.org/10.3390/pr11041185
Ding H, Zhao W, Li M, Zhang L, Sun Y. Electromagnetic Vibration Characteristics of High-Frequency Transformer under DC Bias with Different Winding Structures. Processes. 2023; 11(4):1185. https://doi.org/10.3390/pr11041185
Chicago/Turabian StyleDing, Haibo, Wenliang Zhao, Min Li, Li Zhang, and Youliang Sun. 2023. "Electromagnetic Vibration Characteristics of High-Frequency Transformer under DC Bias with Different Winding Structures" Processes 11, no. 4: 1185. https://doi.org/10.3390/pr11041185