

Power and Energy Management Strategies for a Microgrid with the Presence of Electric Vehicles and CAES Considering the Uncertainty of Resources
Abstract
:1. Introduction
1.1. General Perspective
1.2. Review of Recent Literature
1.3. Motivation and Structure of the Paper
- Energy storage in microgrids considering the uncertainty of resources.
- Scenarios with and without CAES.
- Comparison of operating costs.
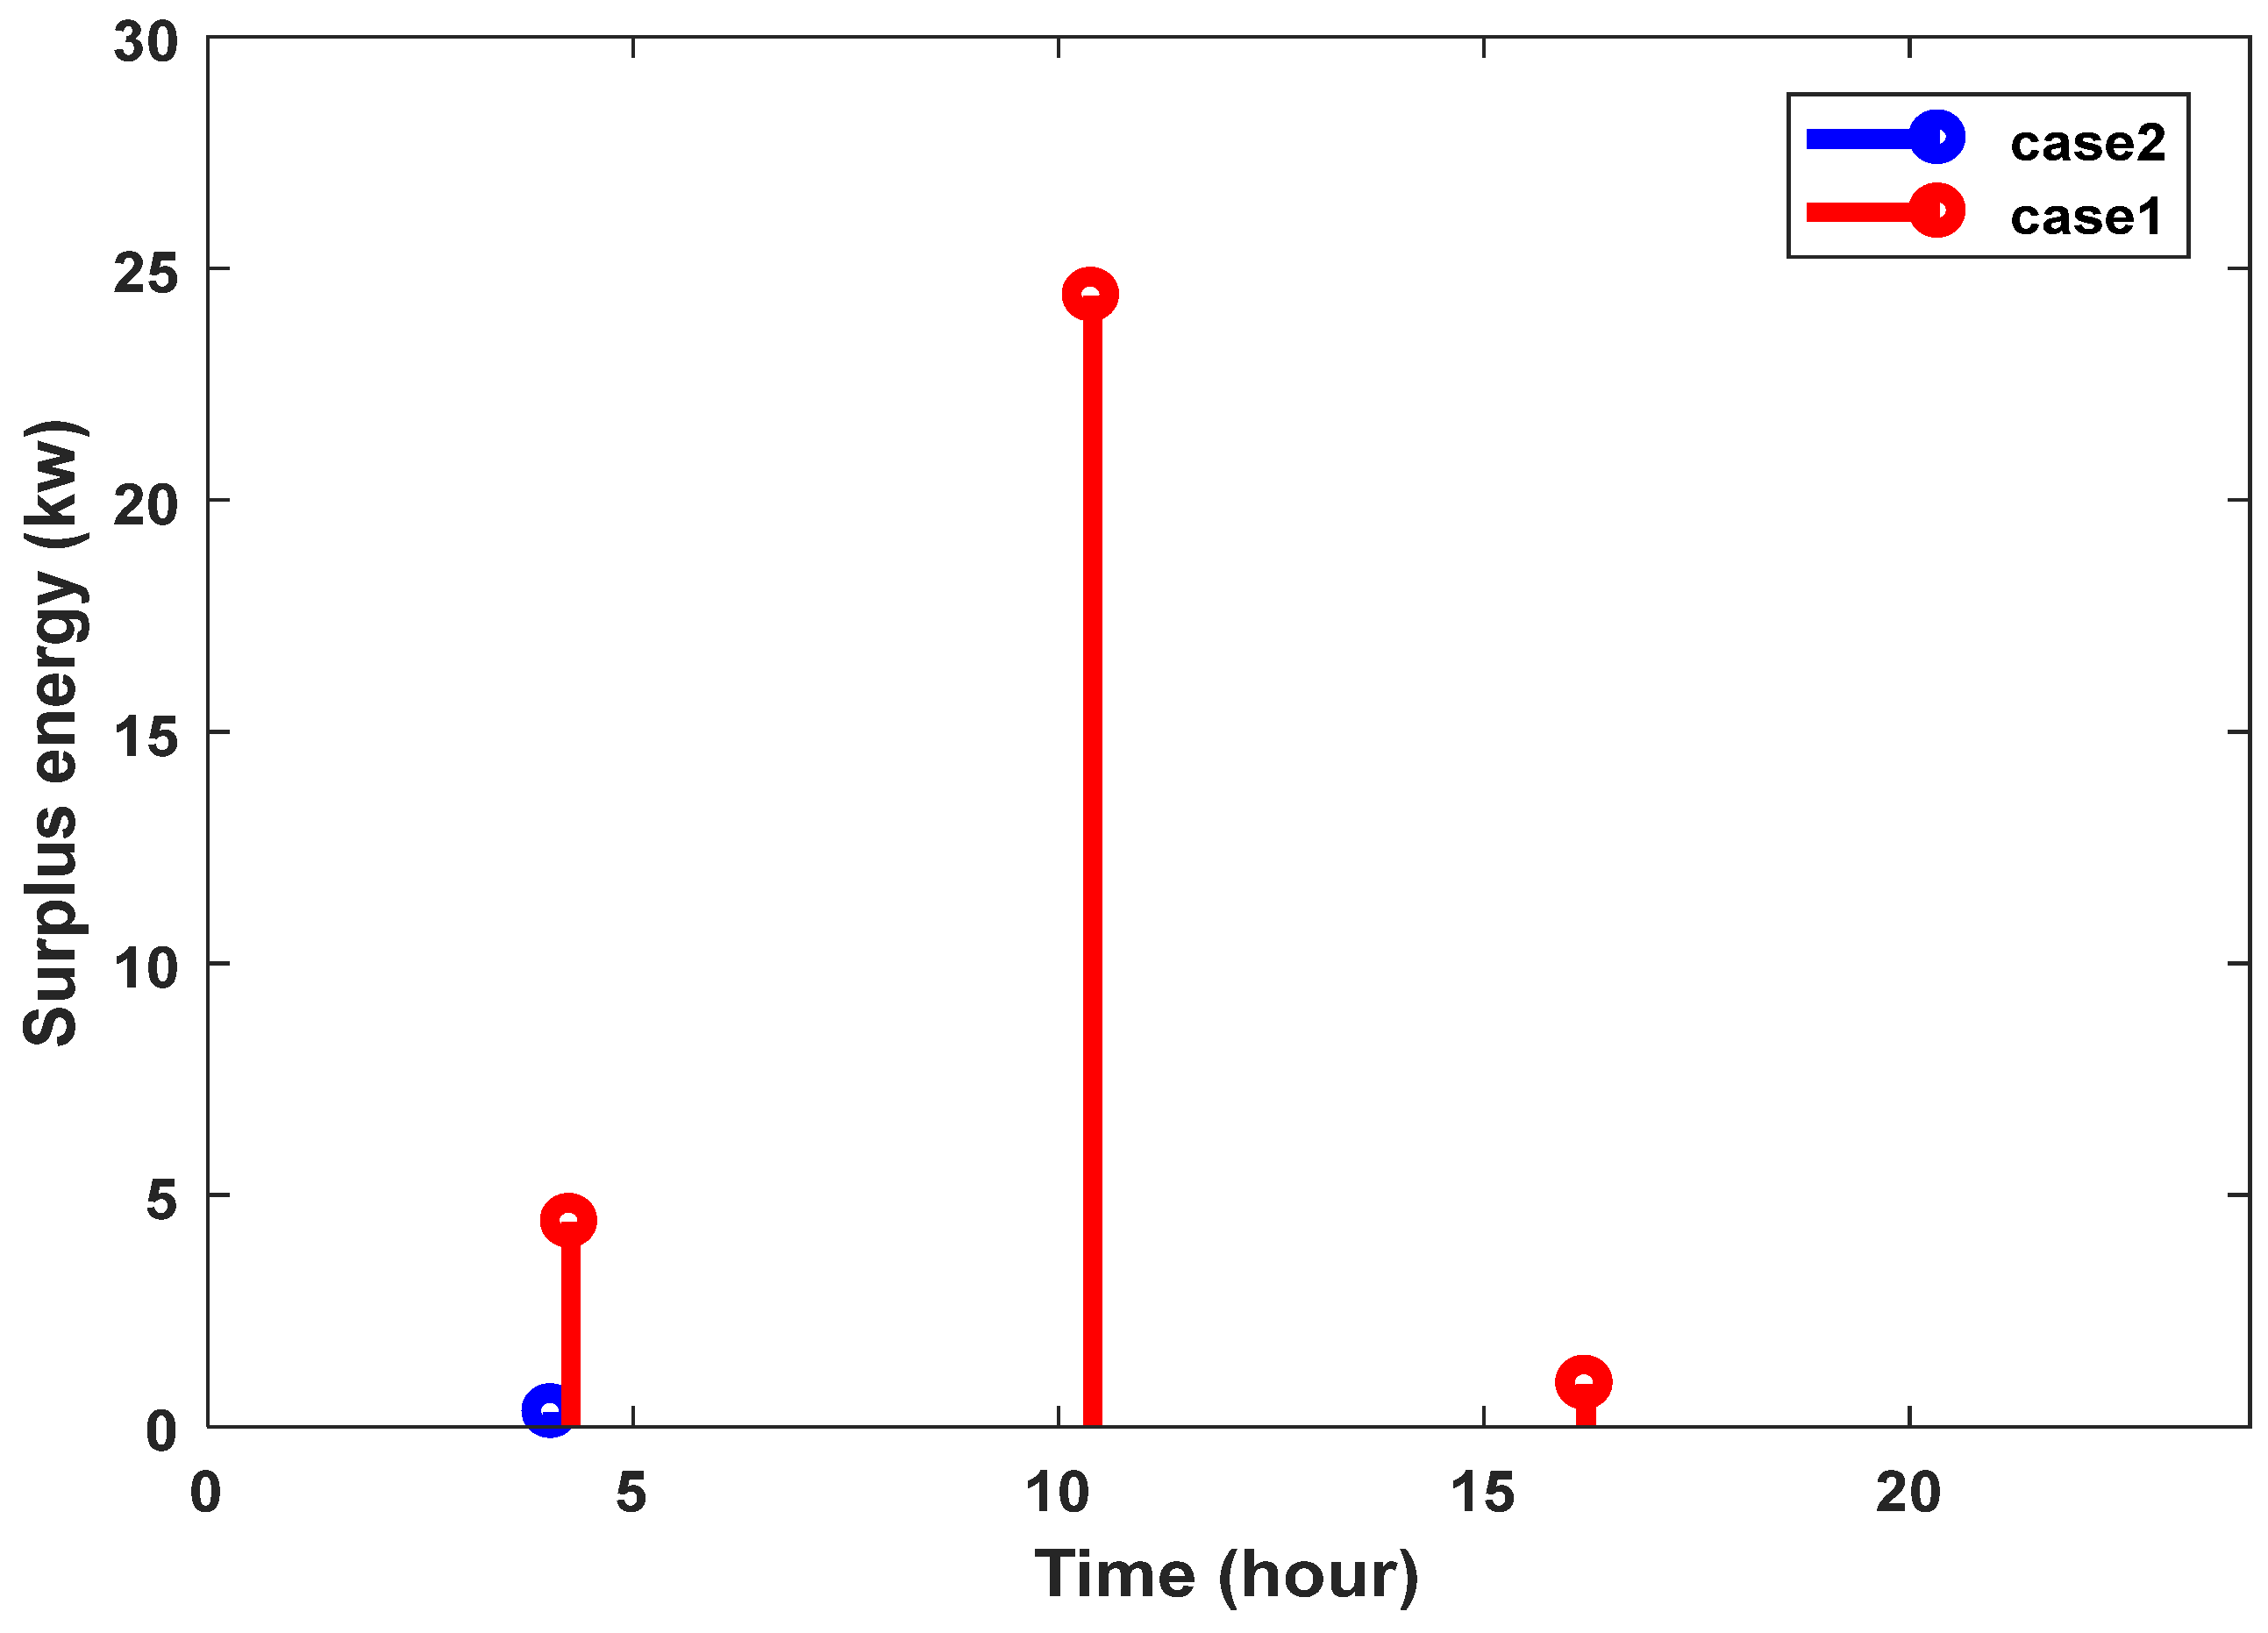
- Management strategy to achieve economic goals (surplus energy).
- Power planning and coordination between participating units.
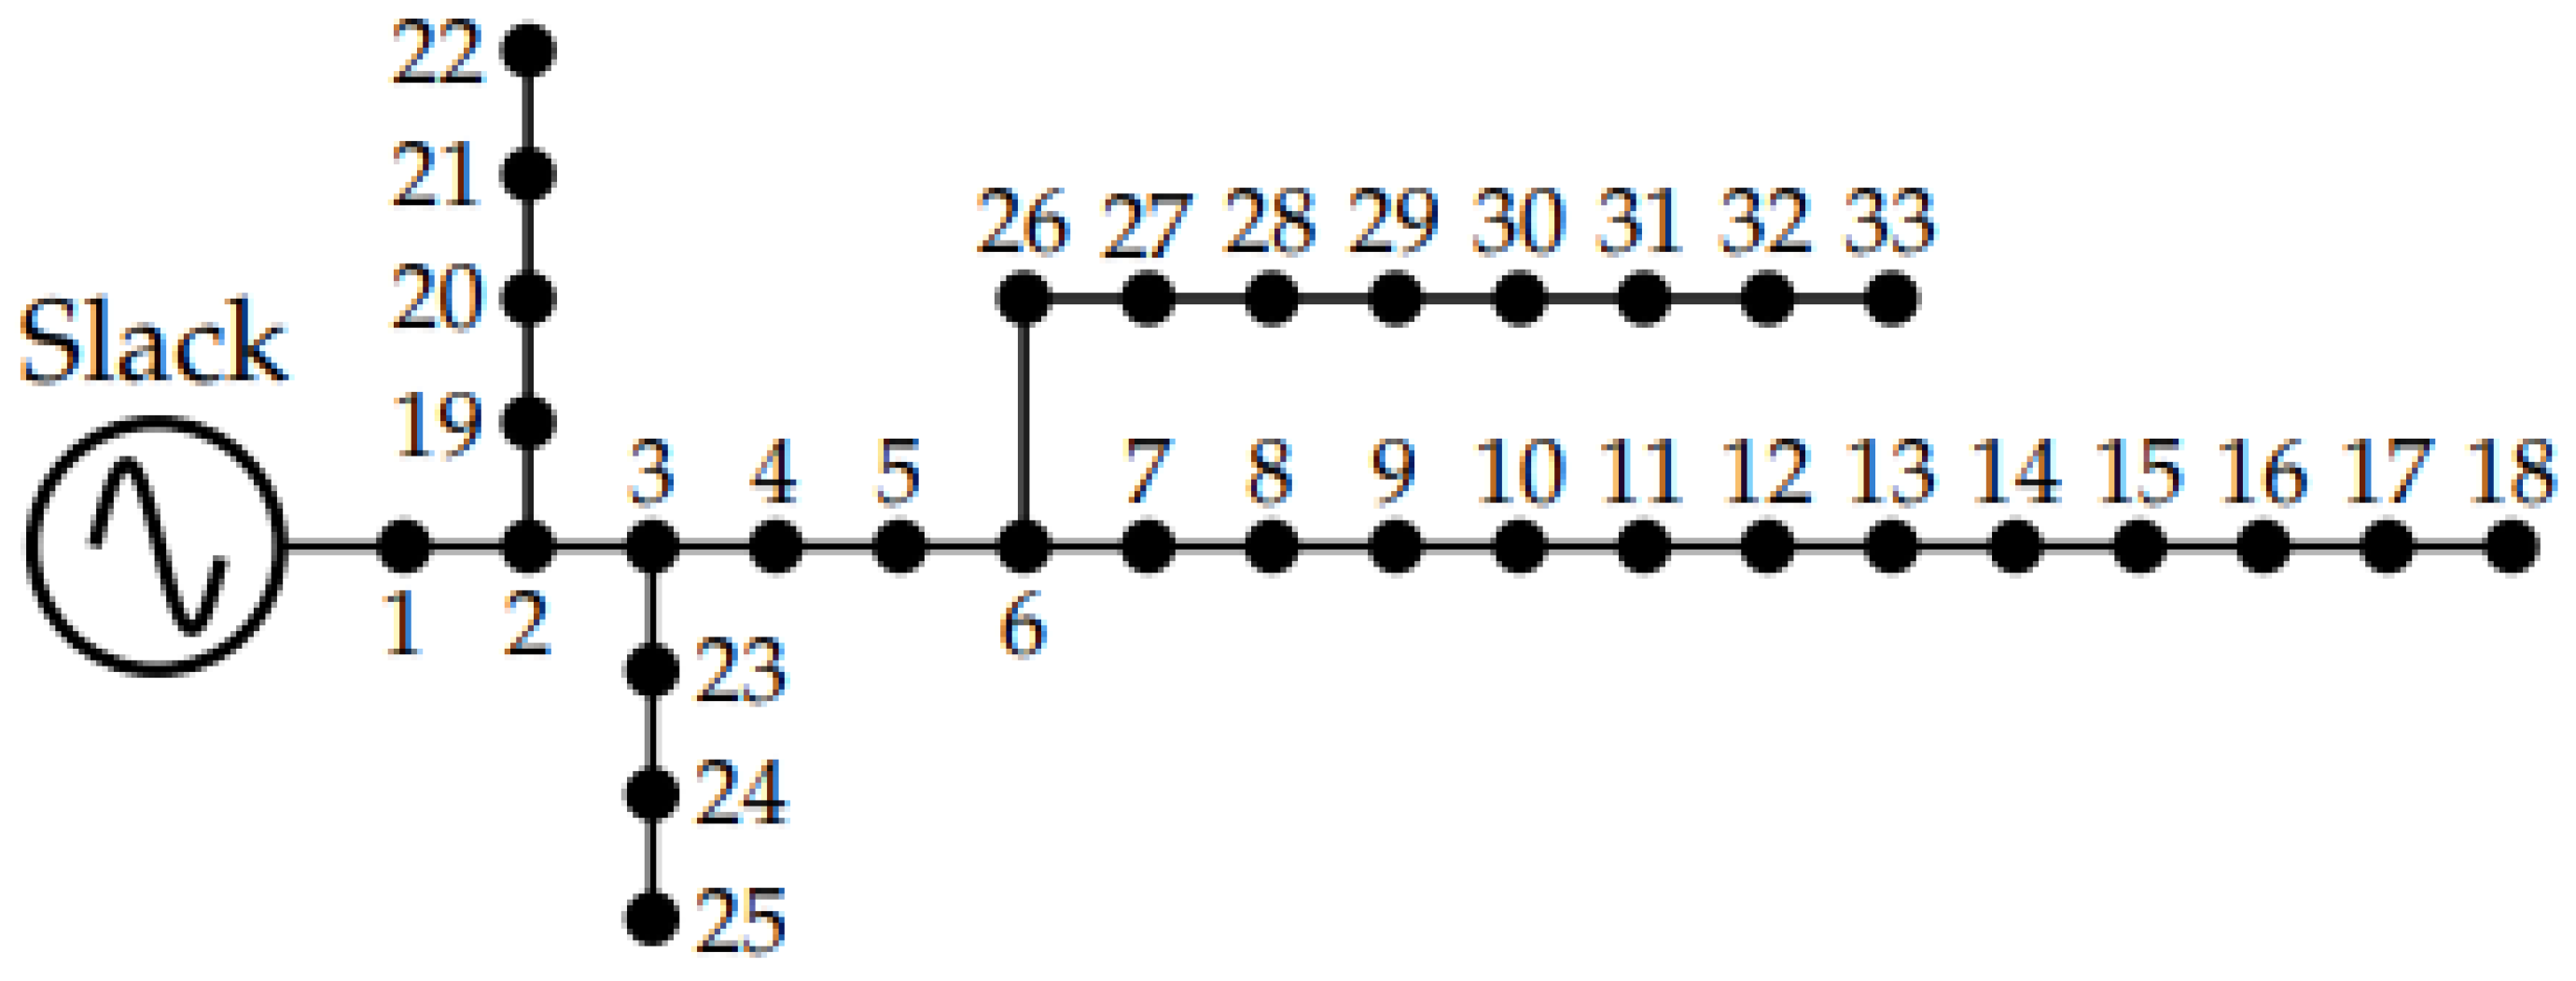
- Selection of the IEEE 33-bus network for large systems and the examination of how PHEVs are charged and discharged.
- Economic indicators and network users are compared using two algorithms, IHS and PSO.
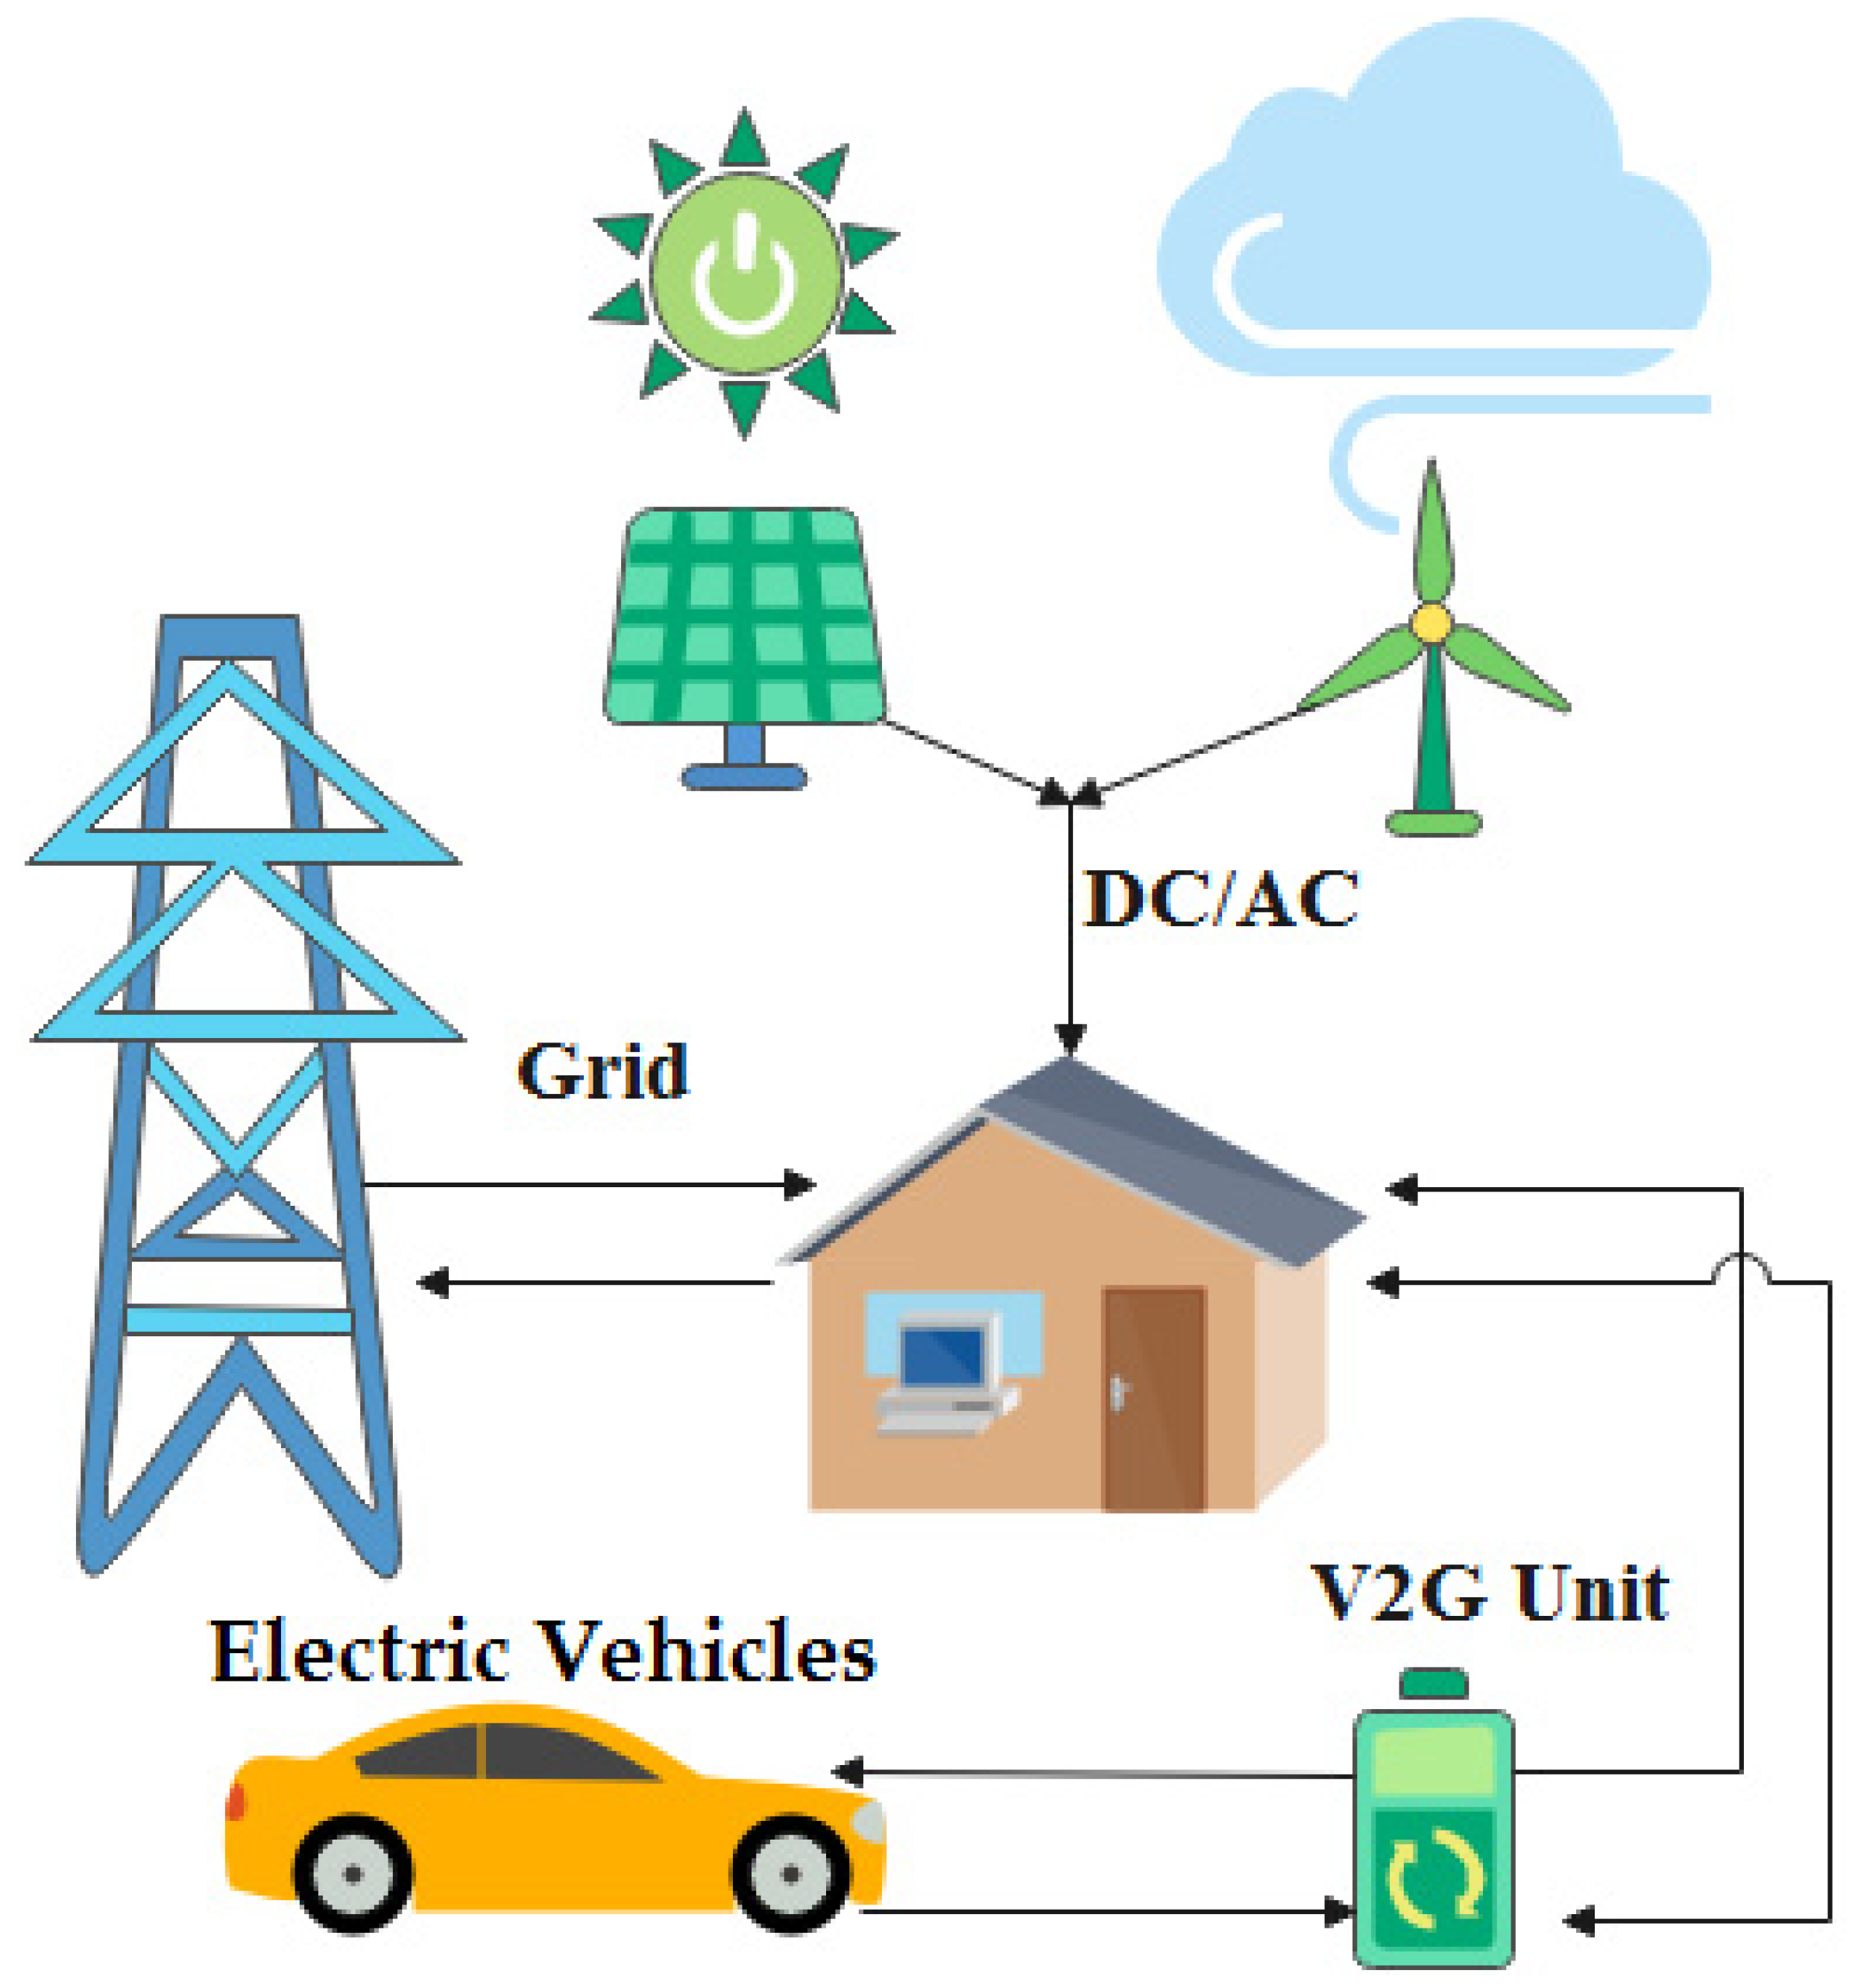
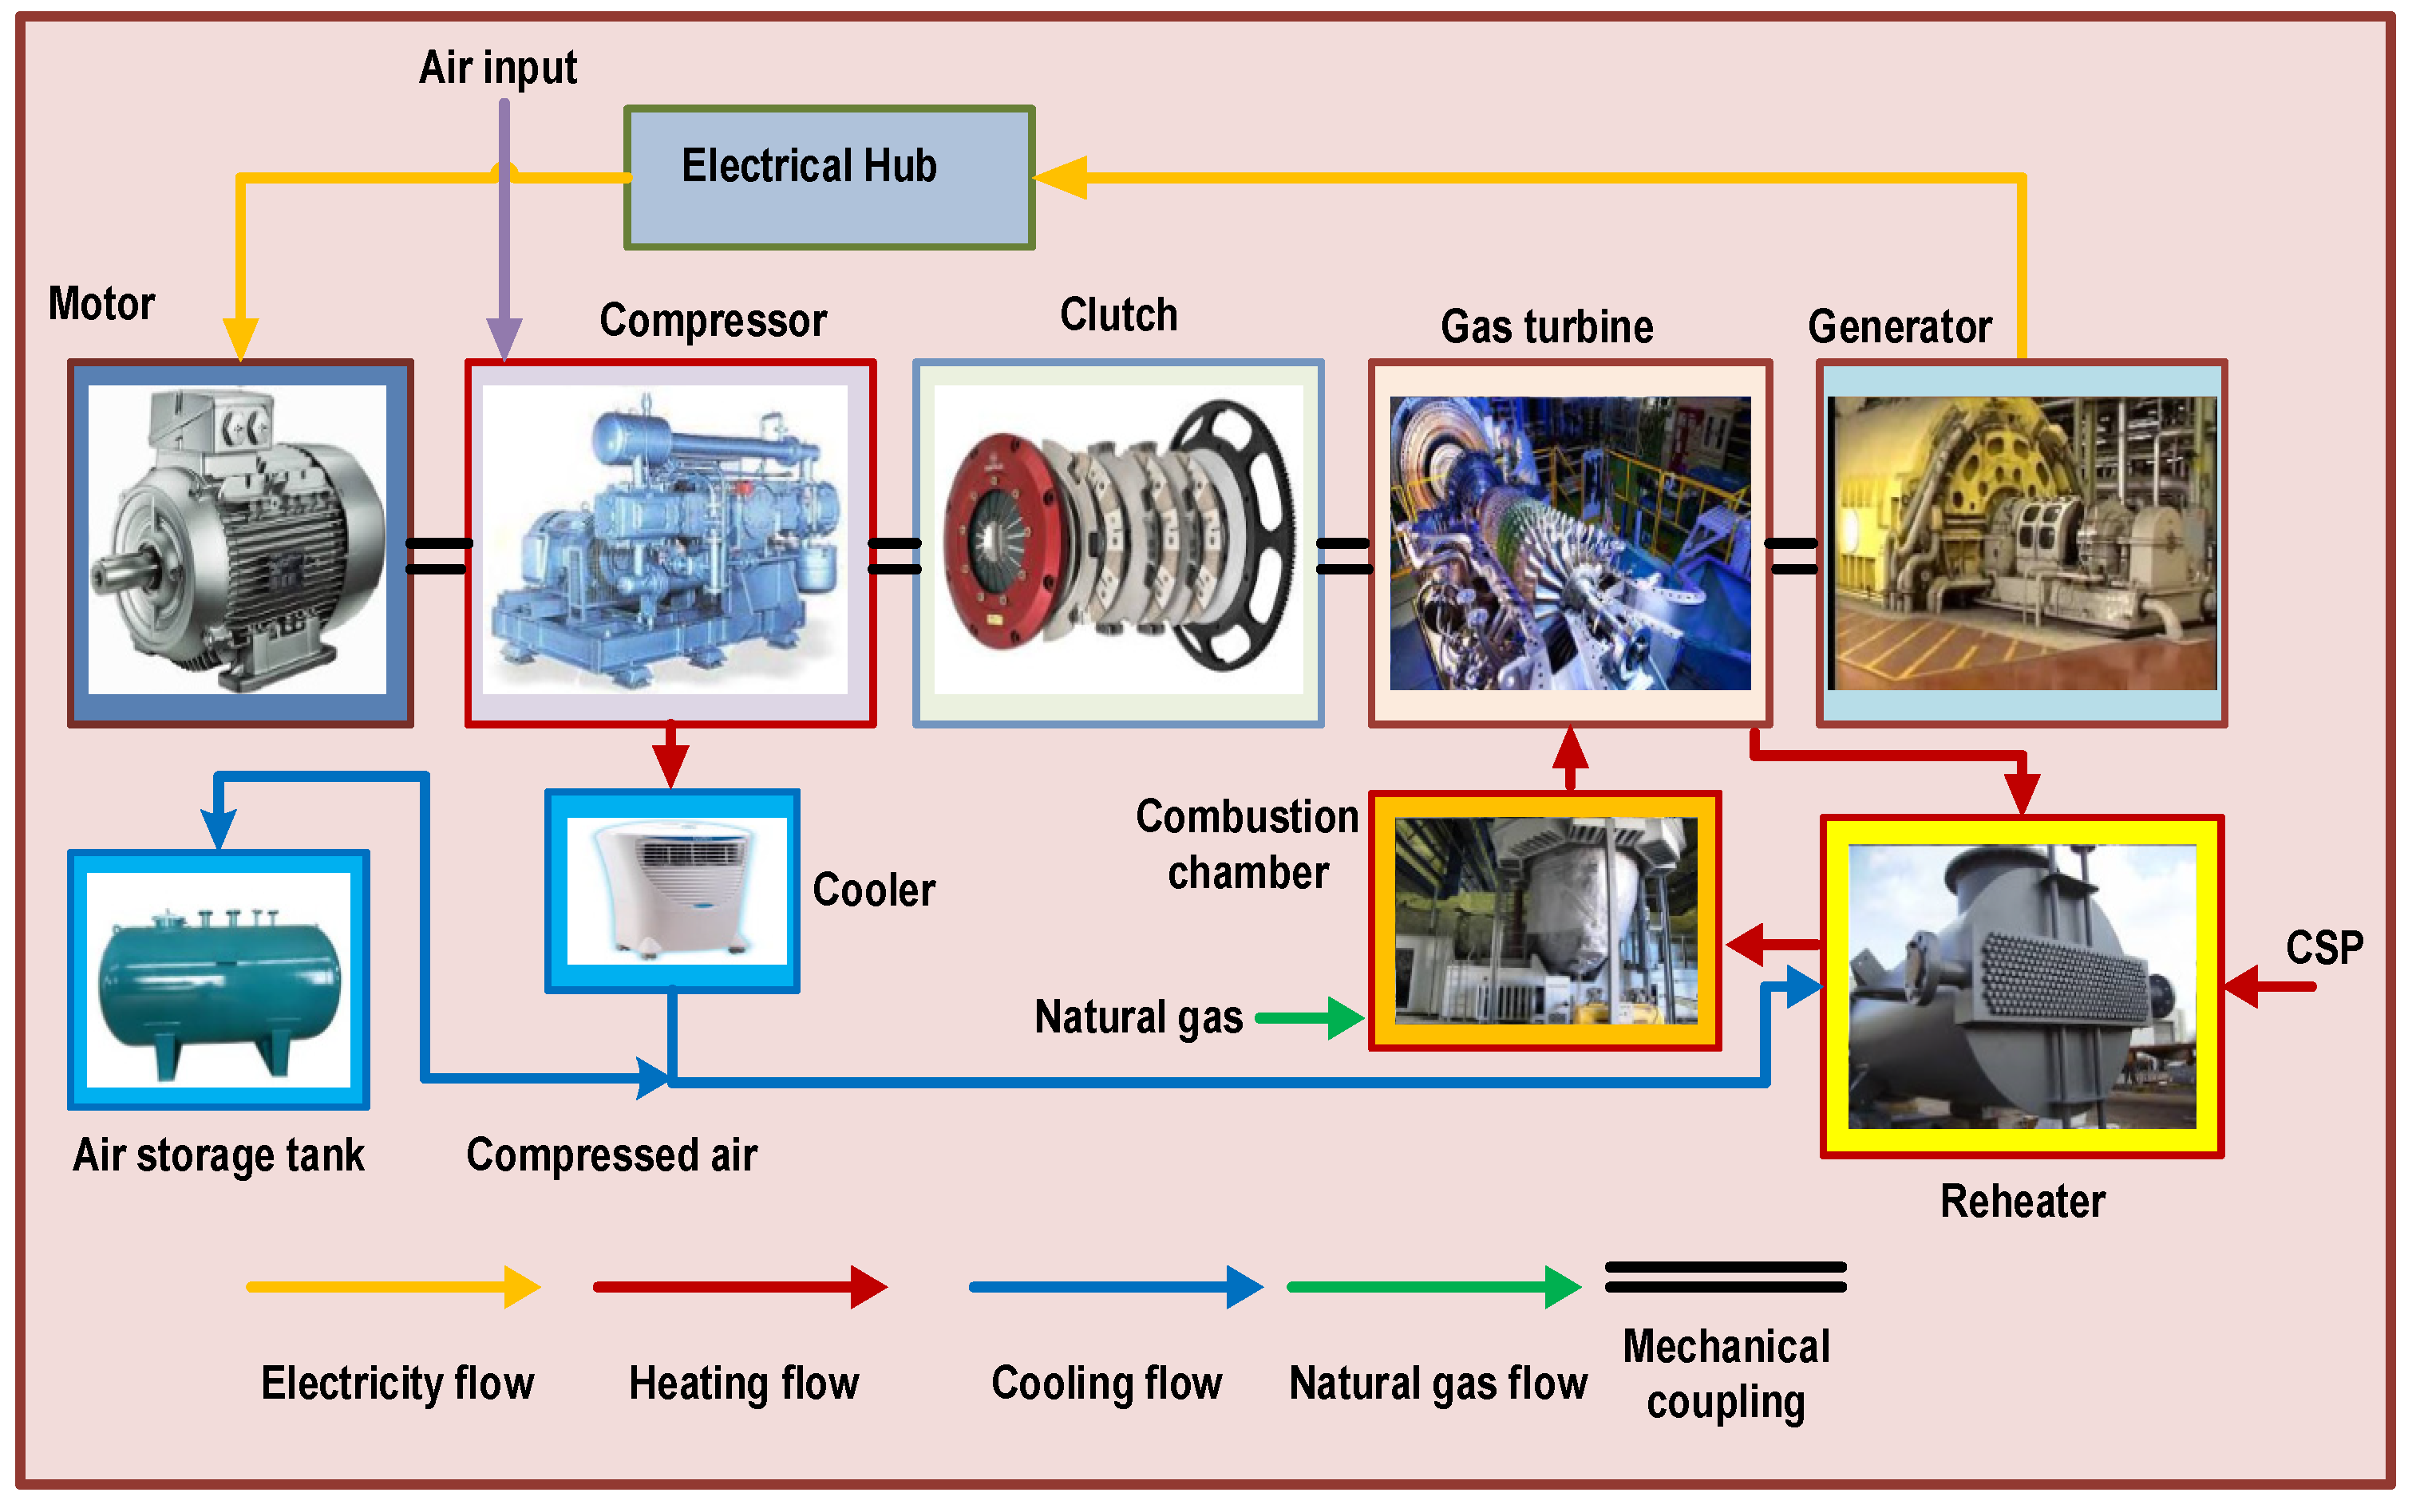
2. Electric Vehicle and CAES
3. Formulation of the Problem
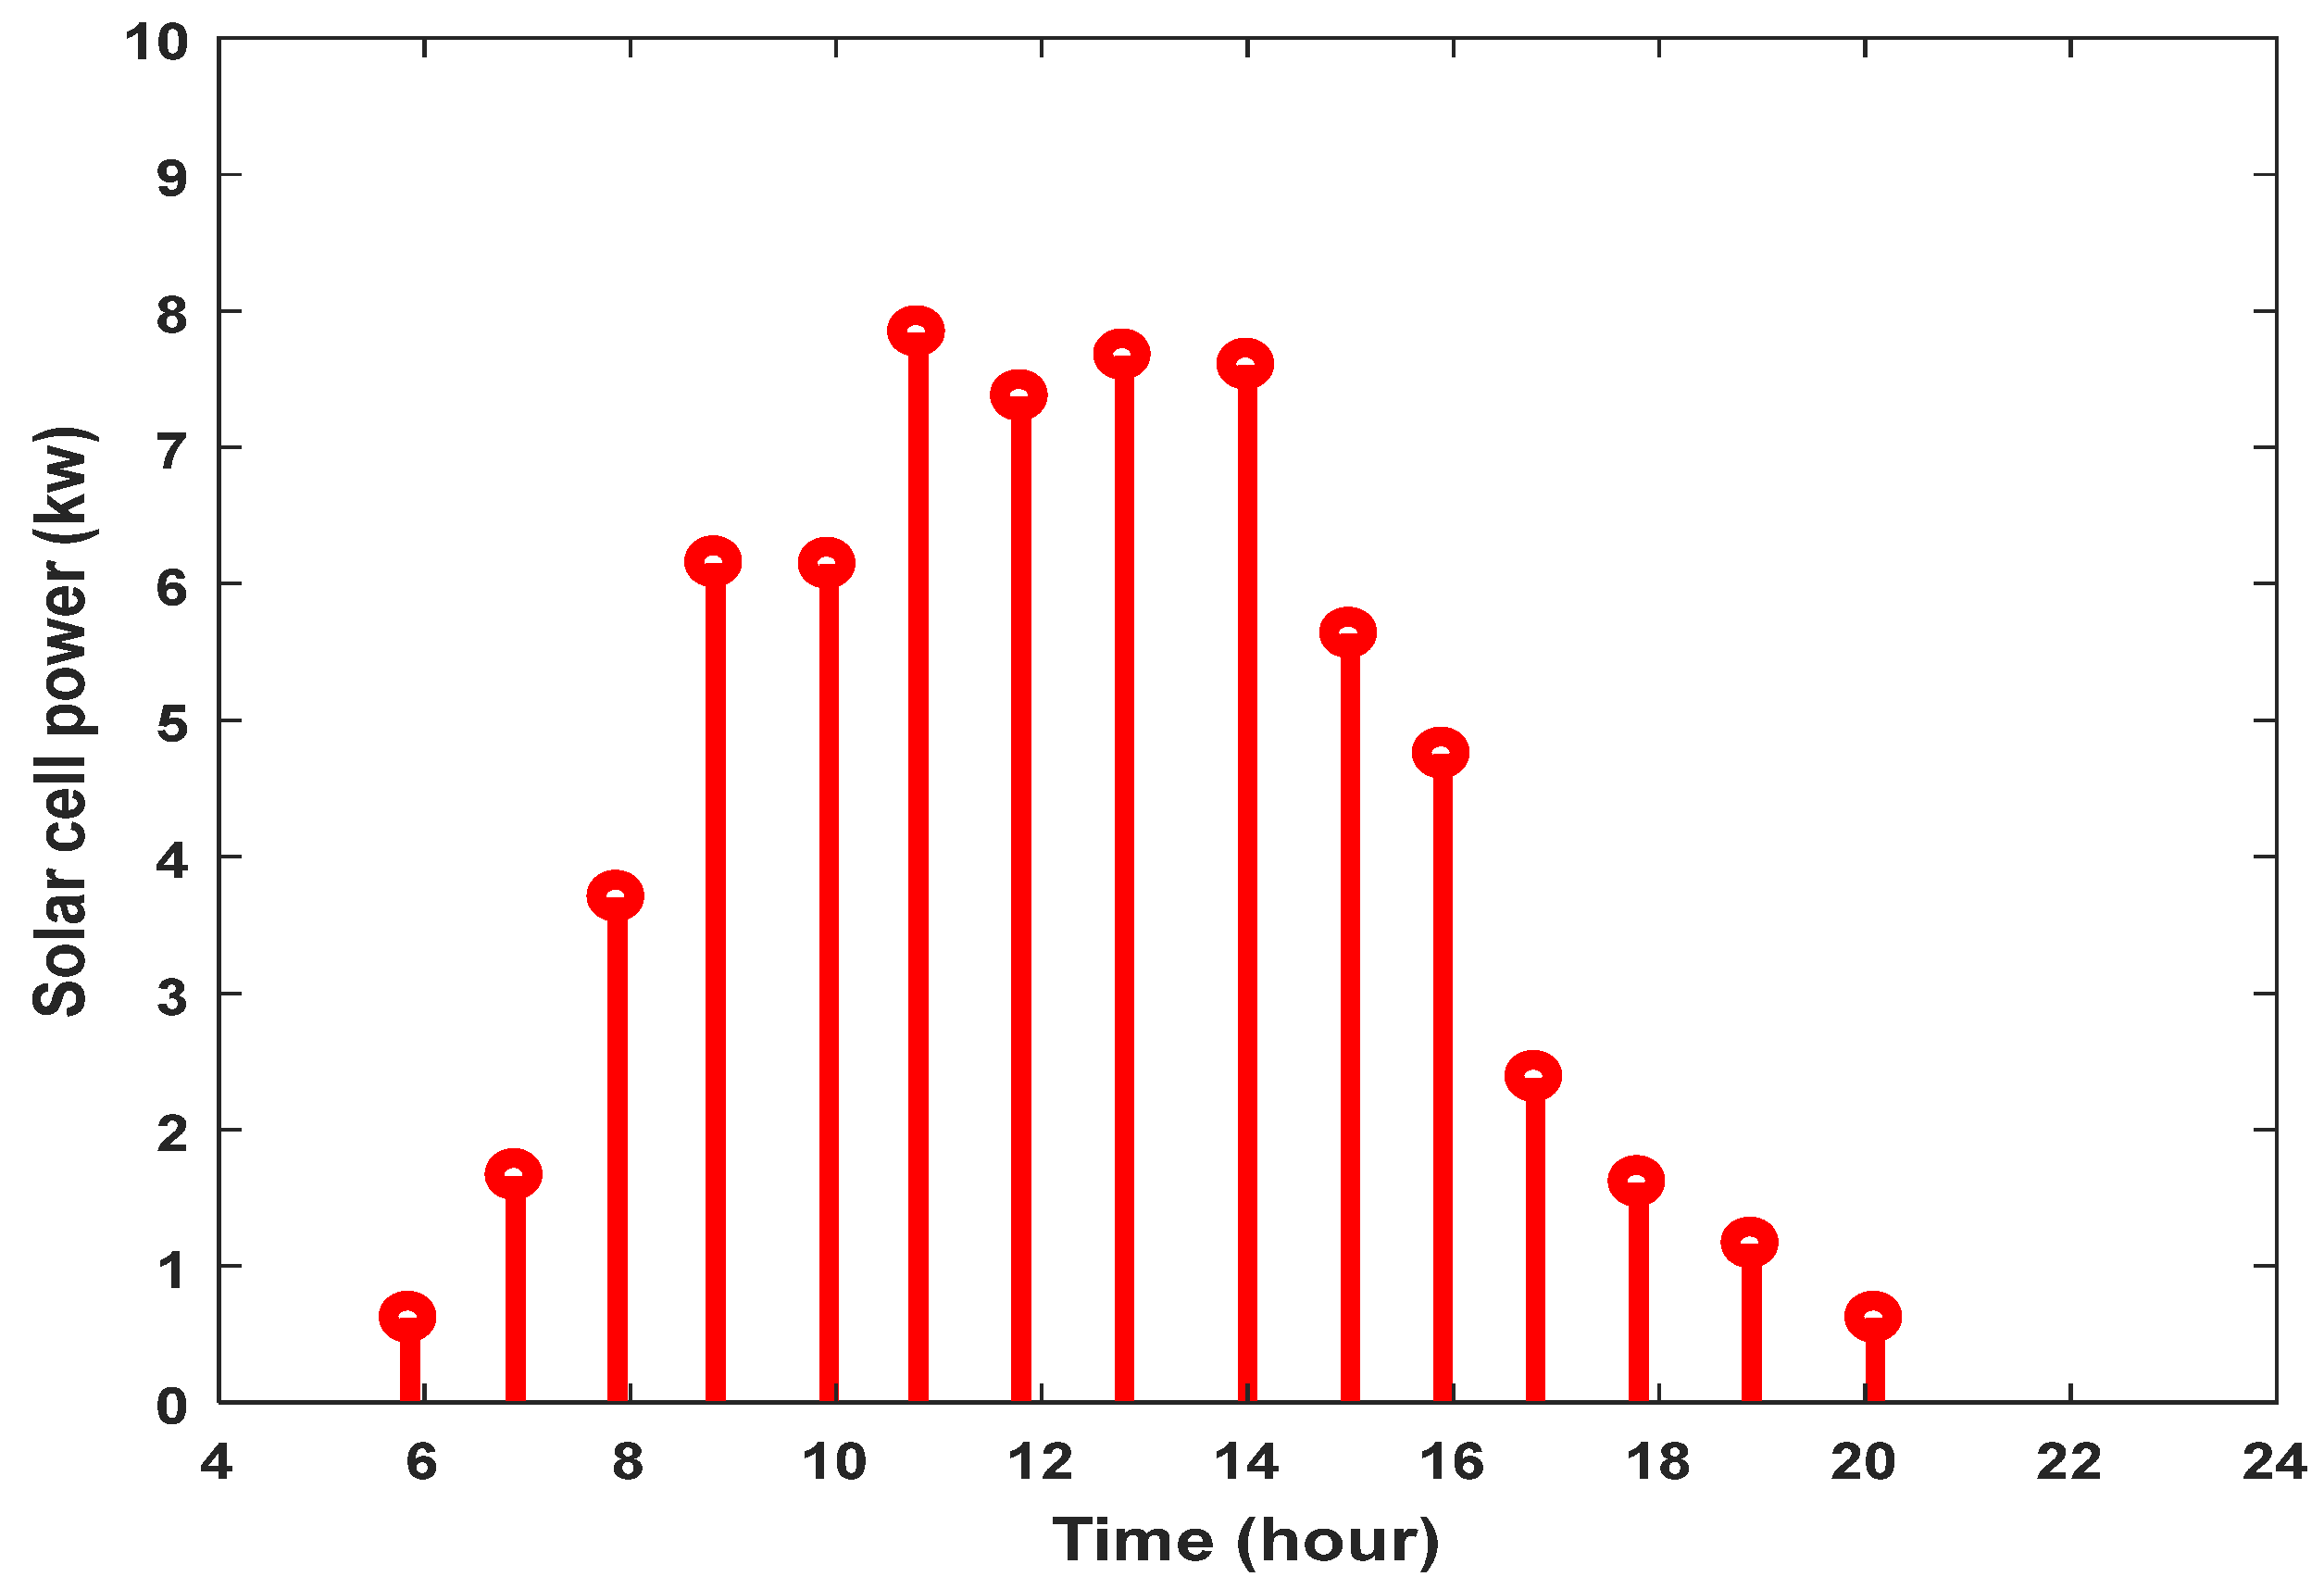
3.1. Photovoltaic System
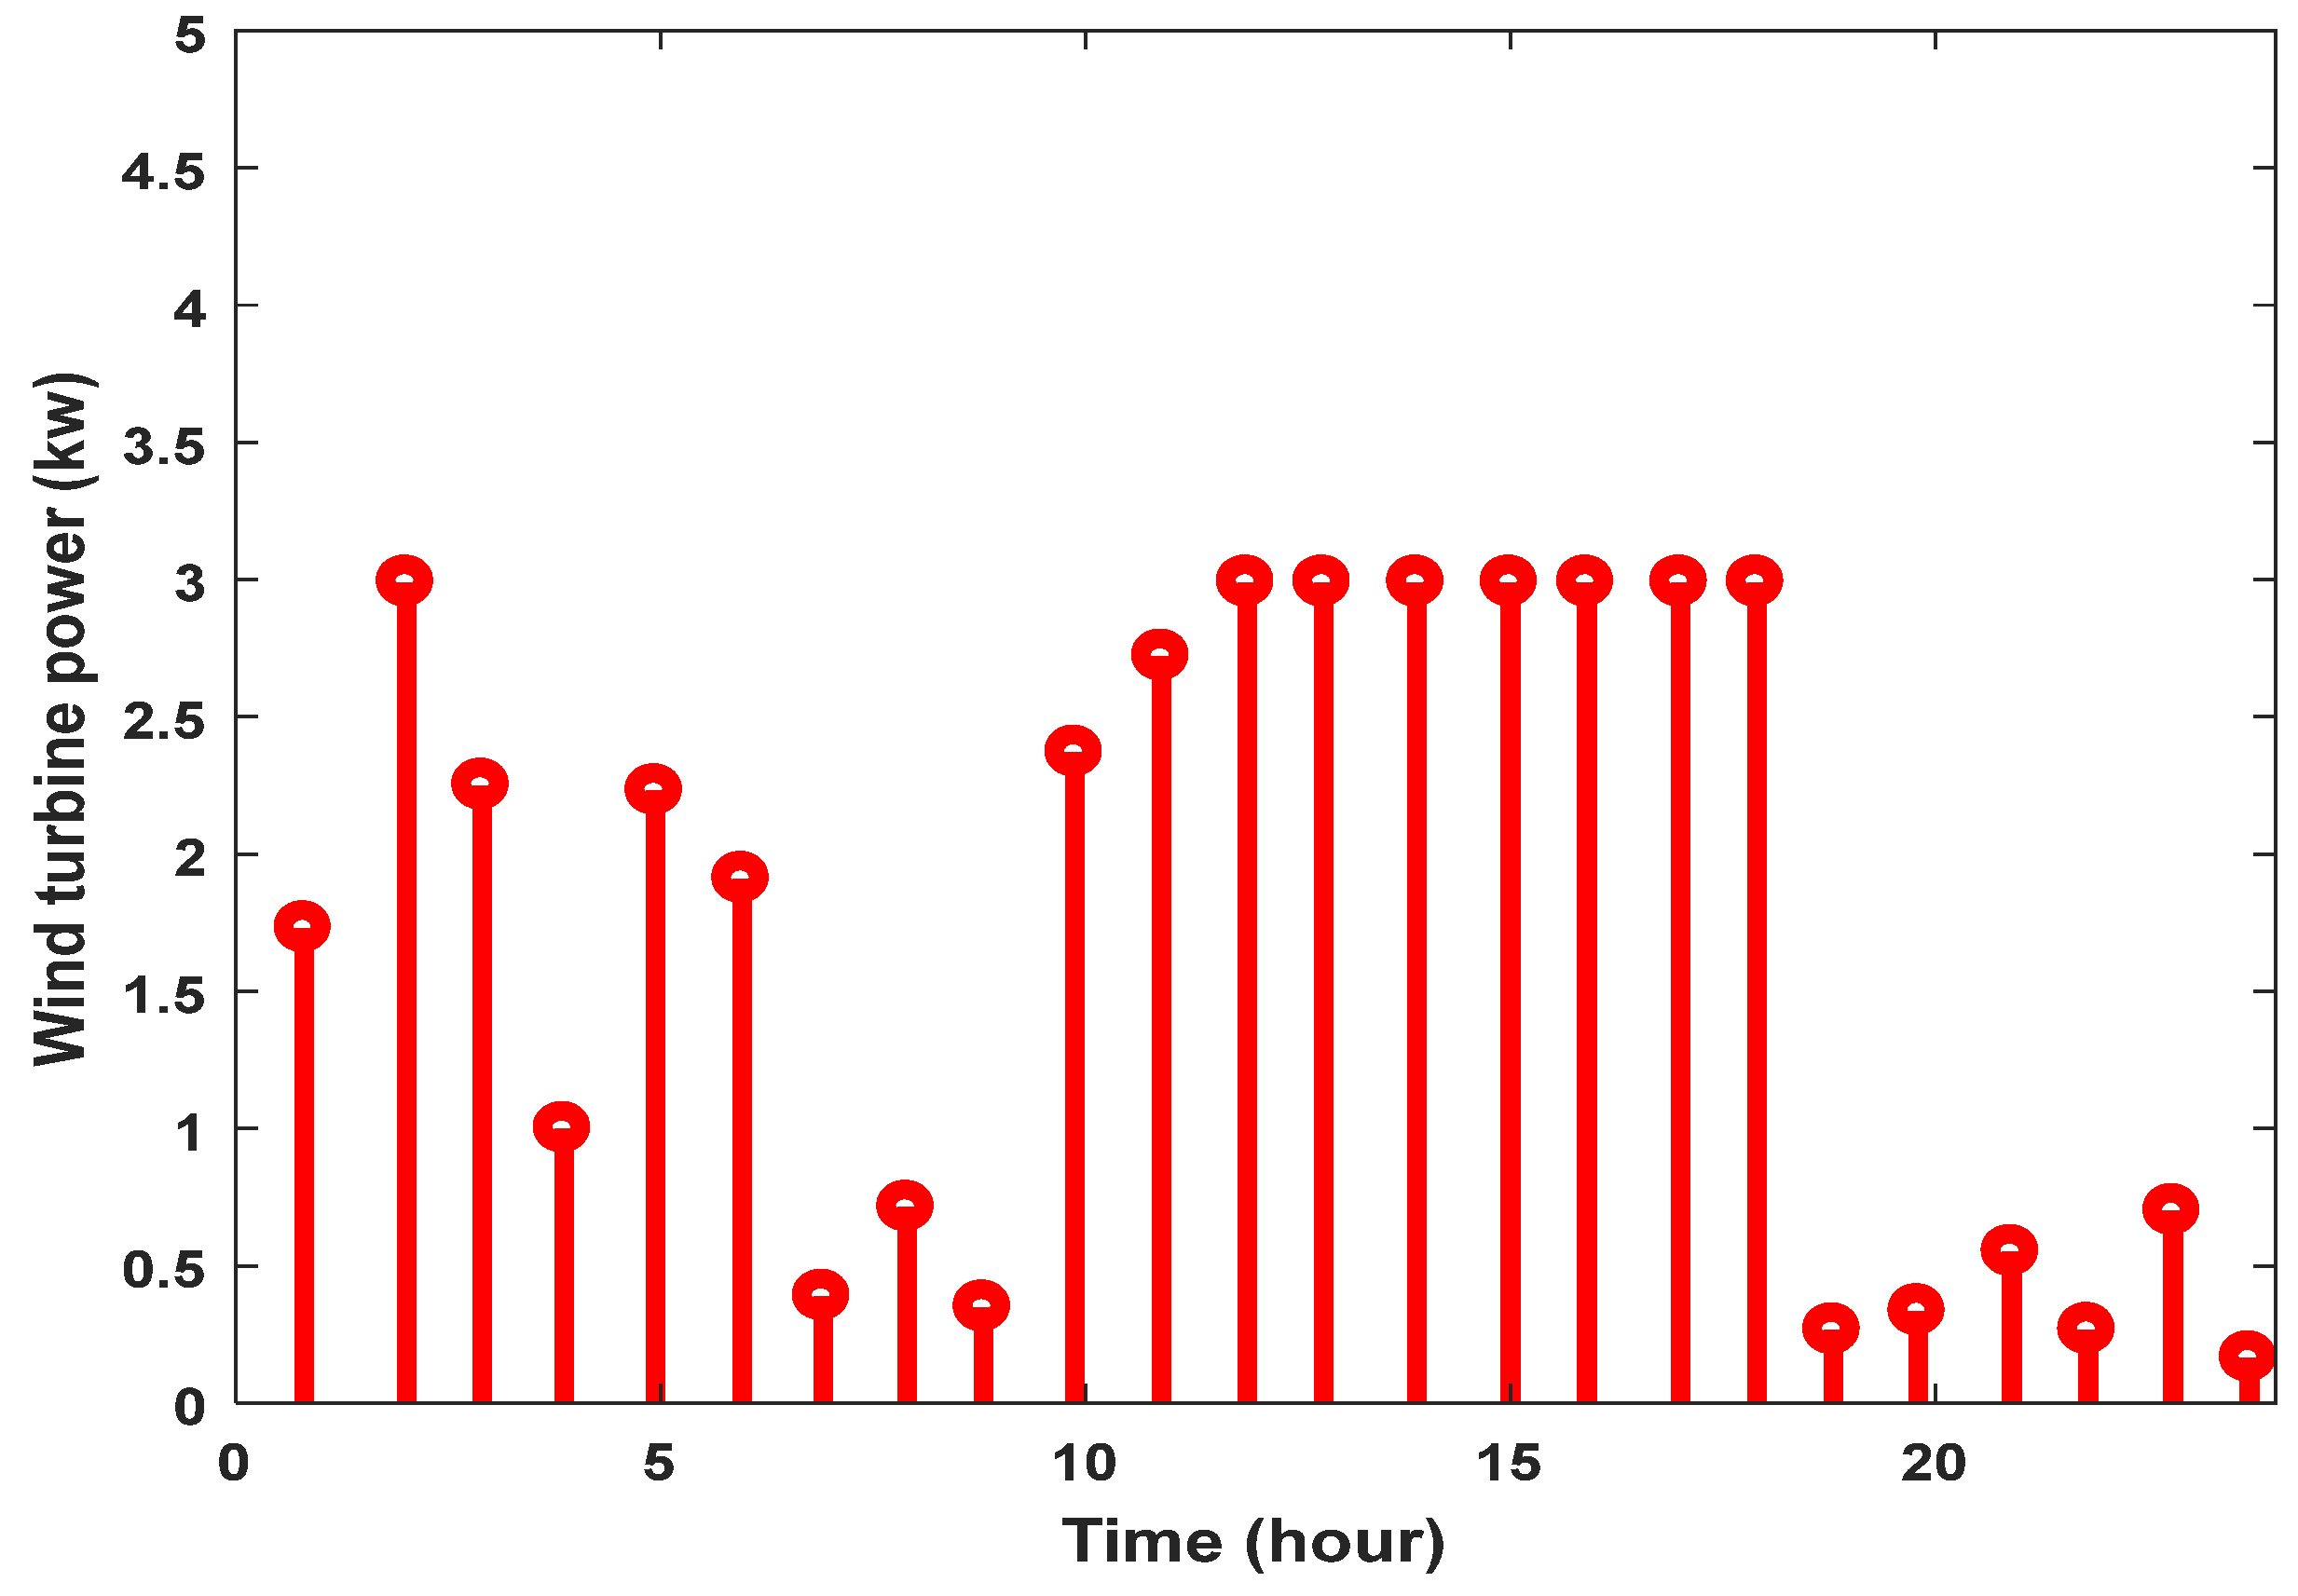
3.2. Wind Turbine
3.3. Operation of Electric Vehicles
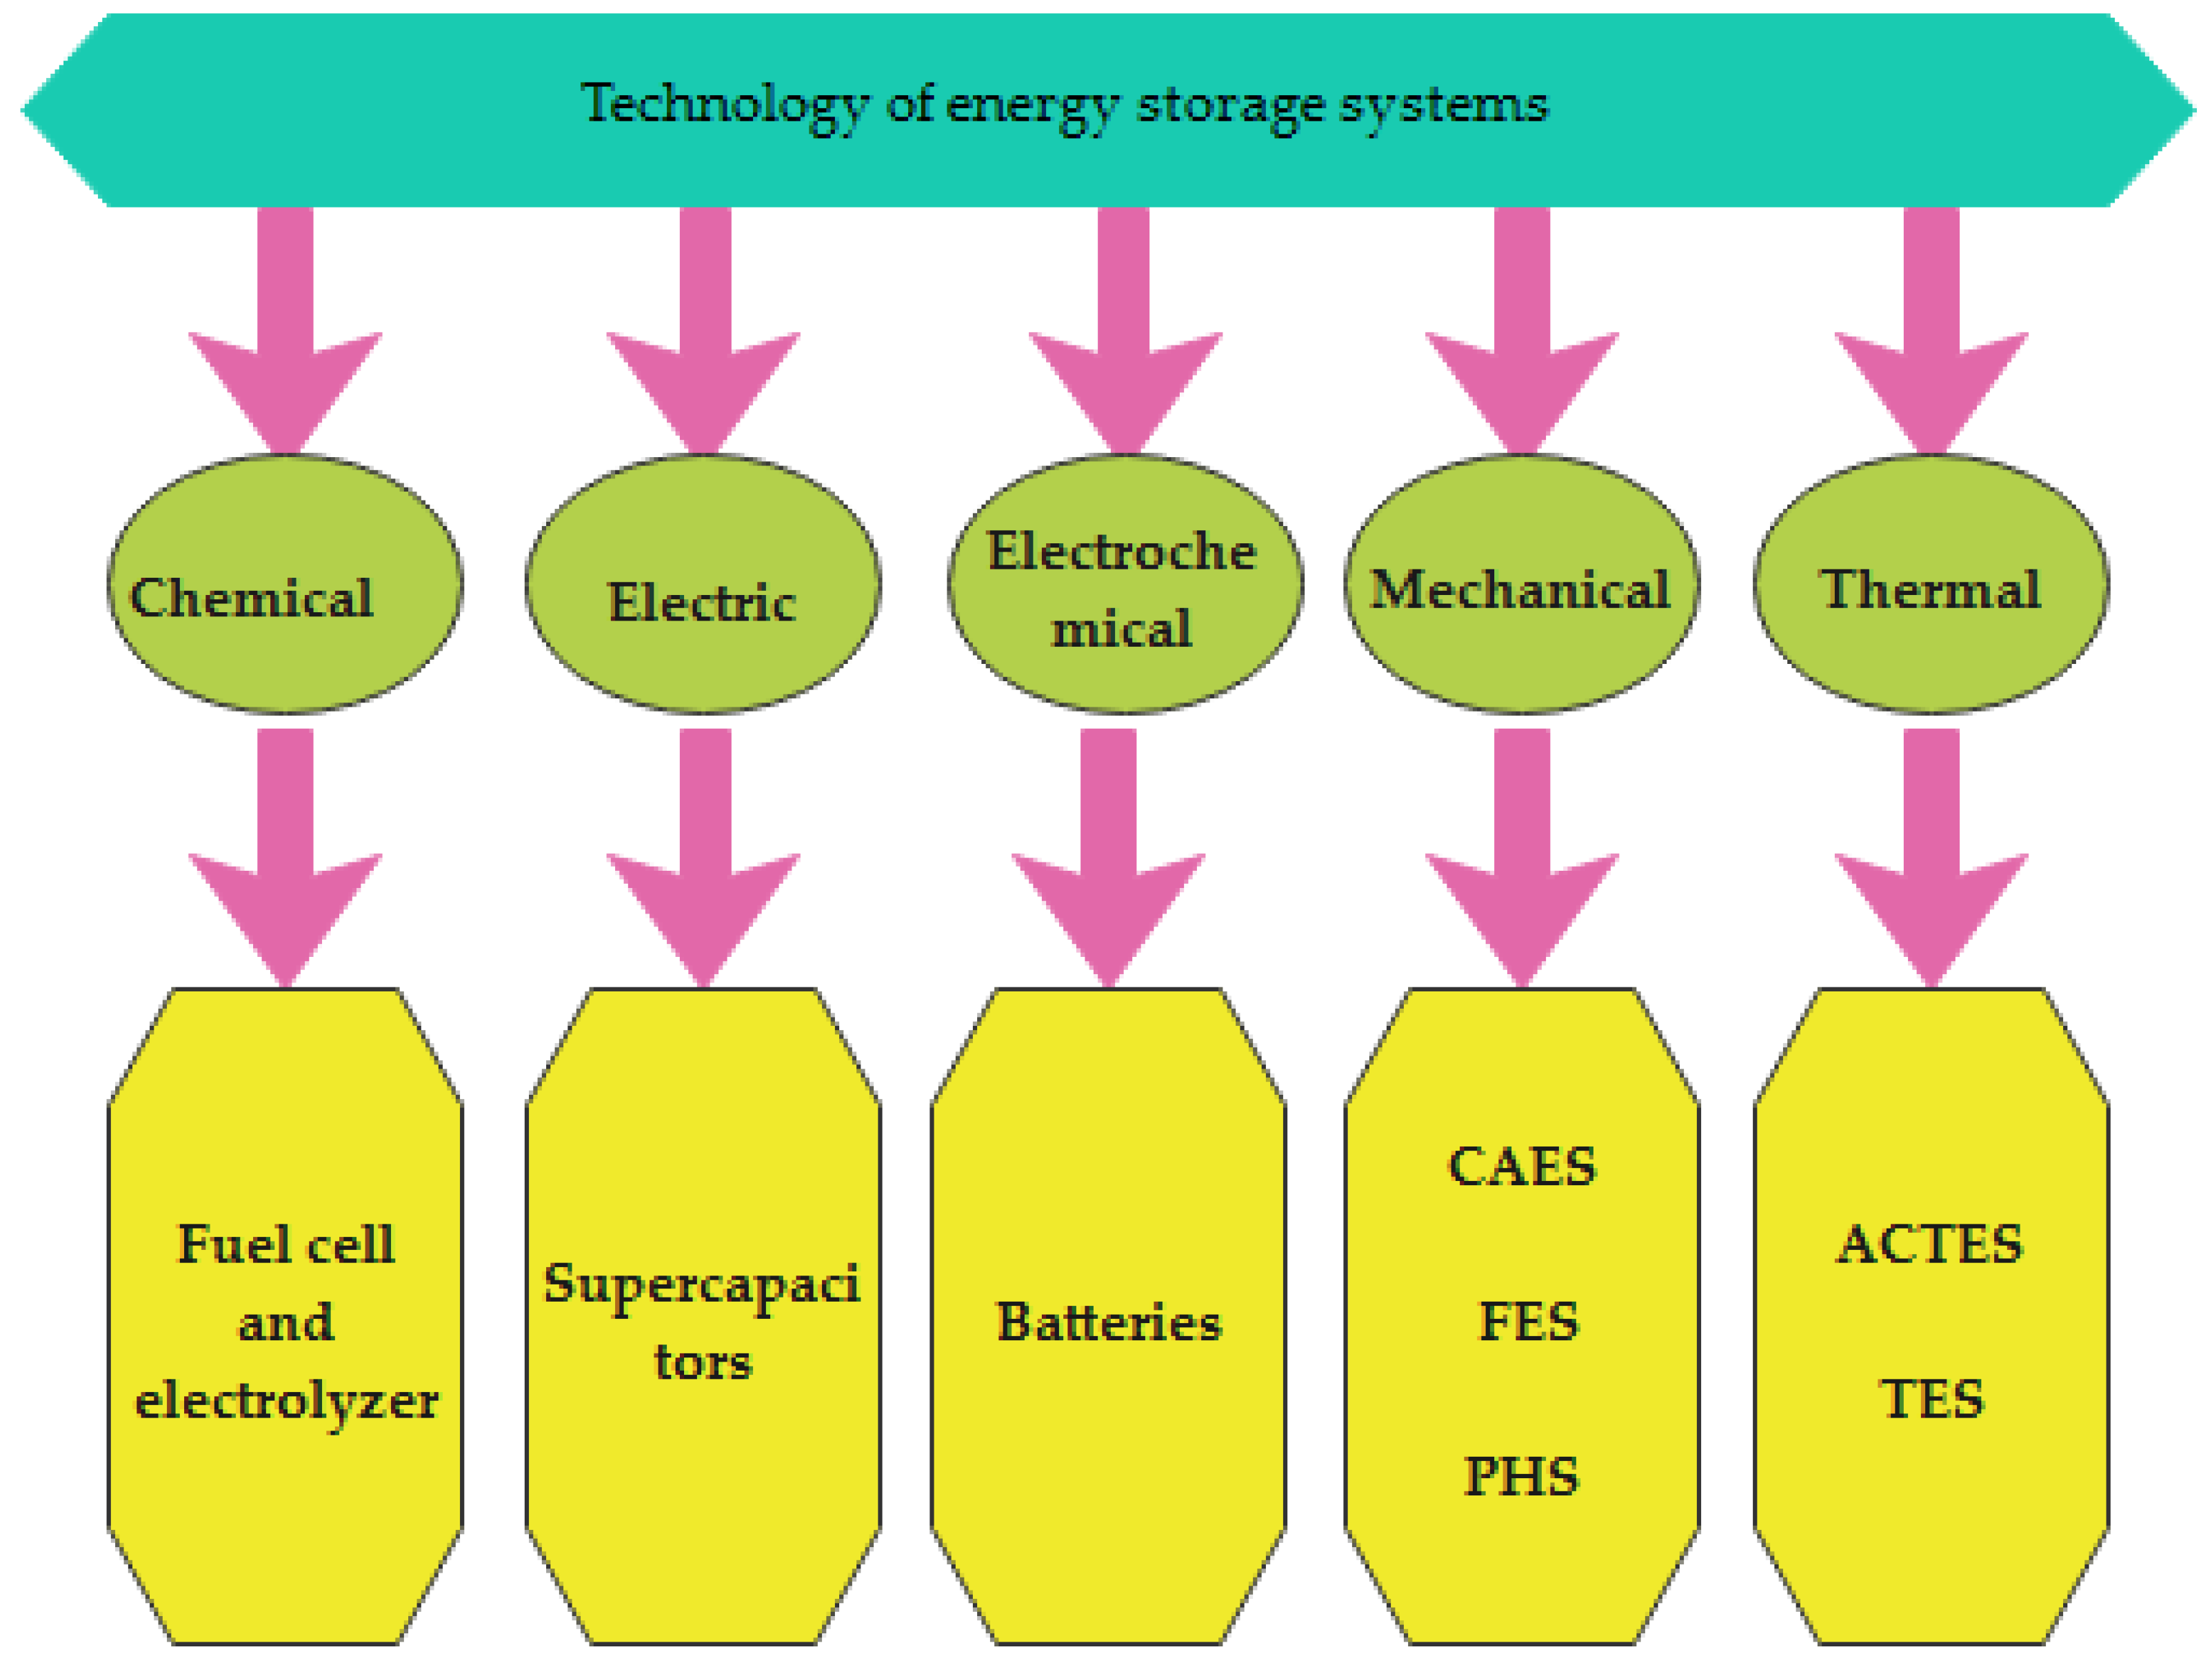
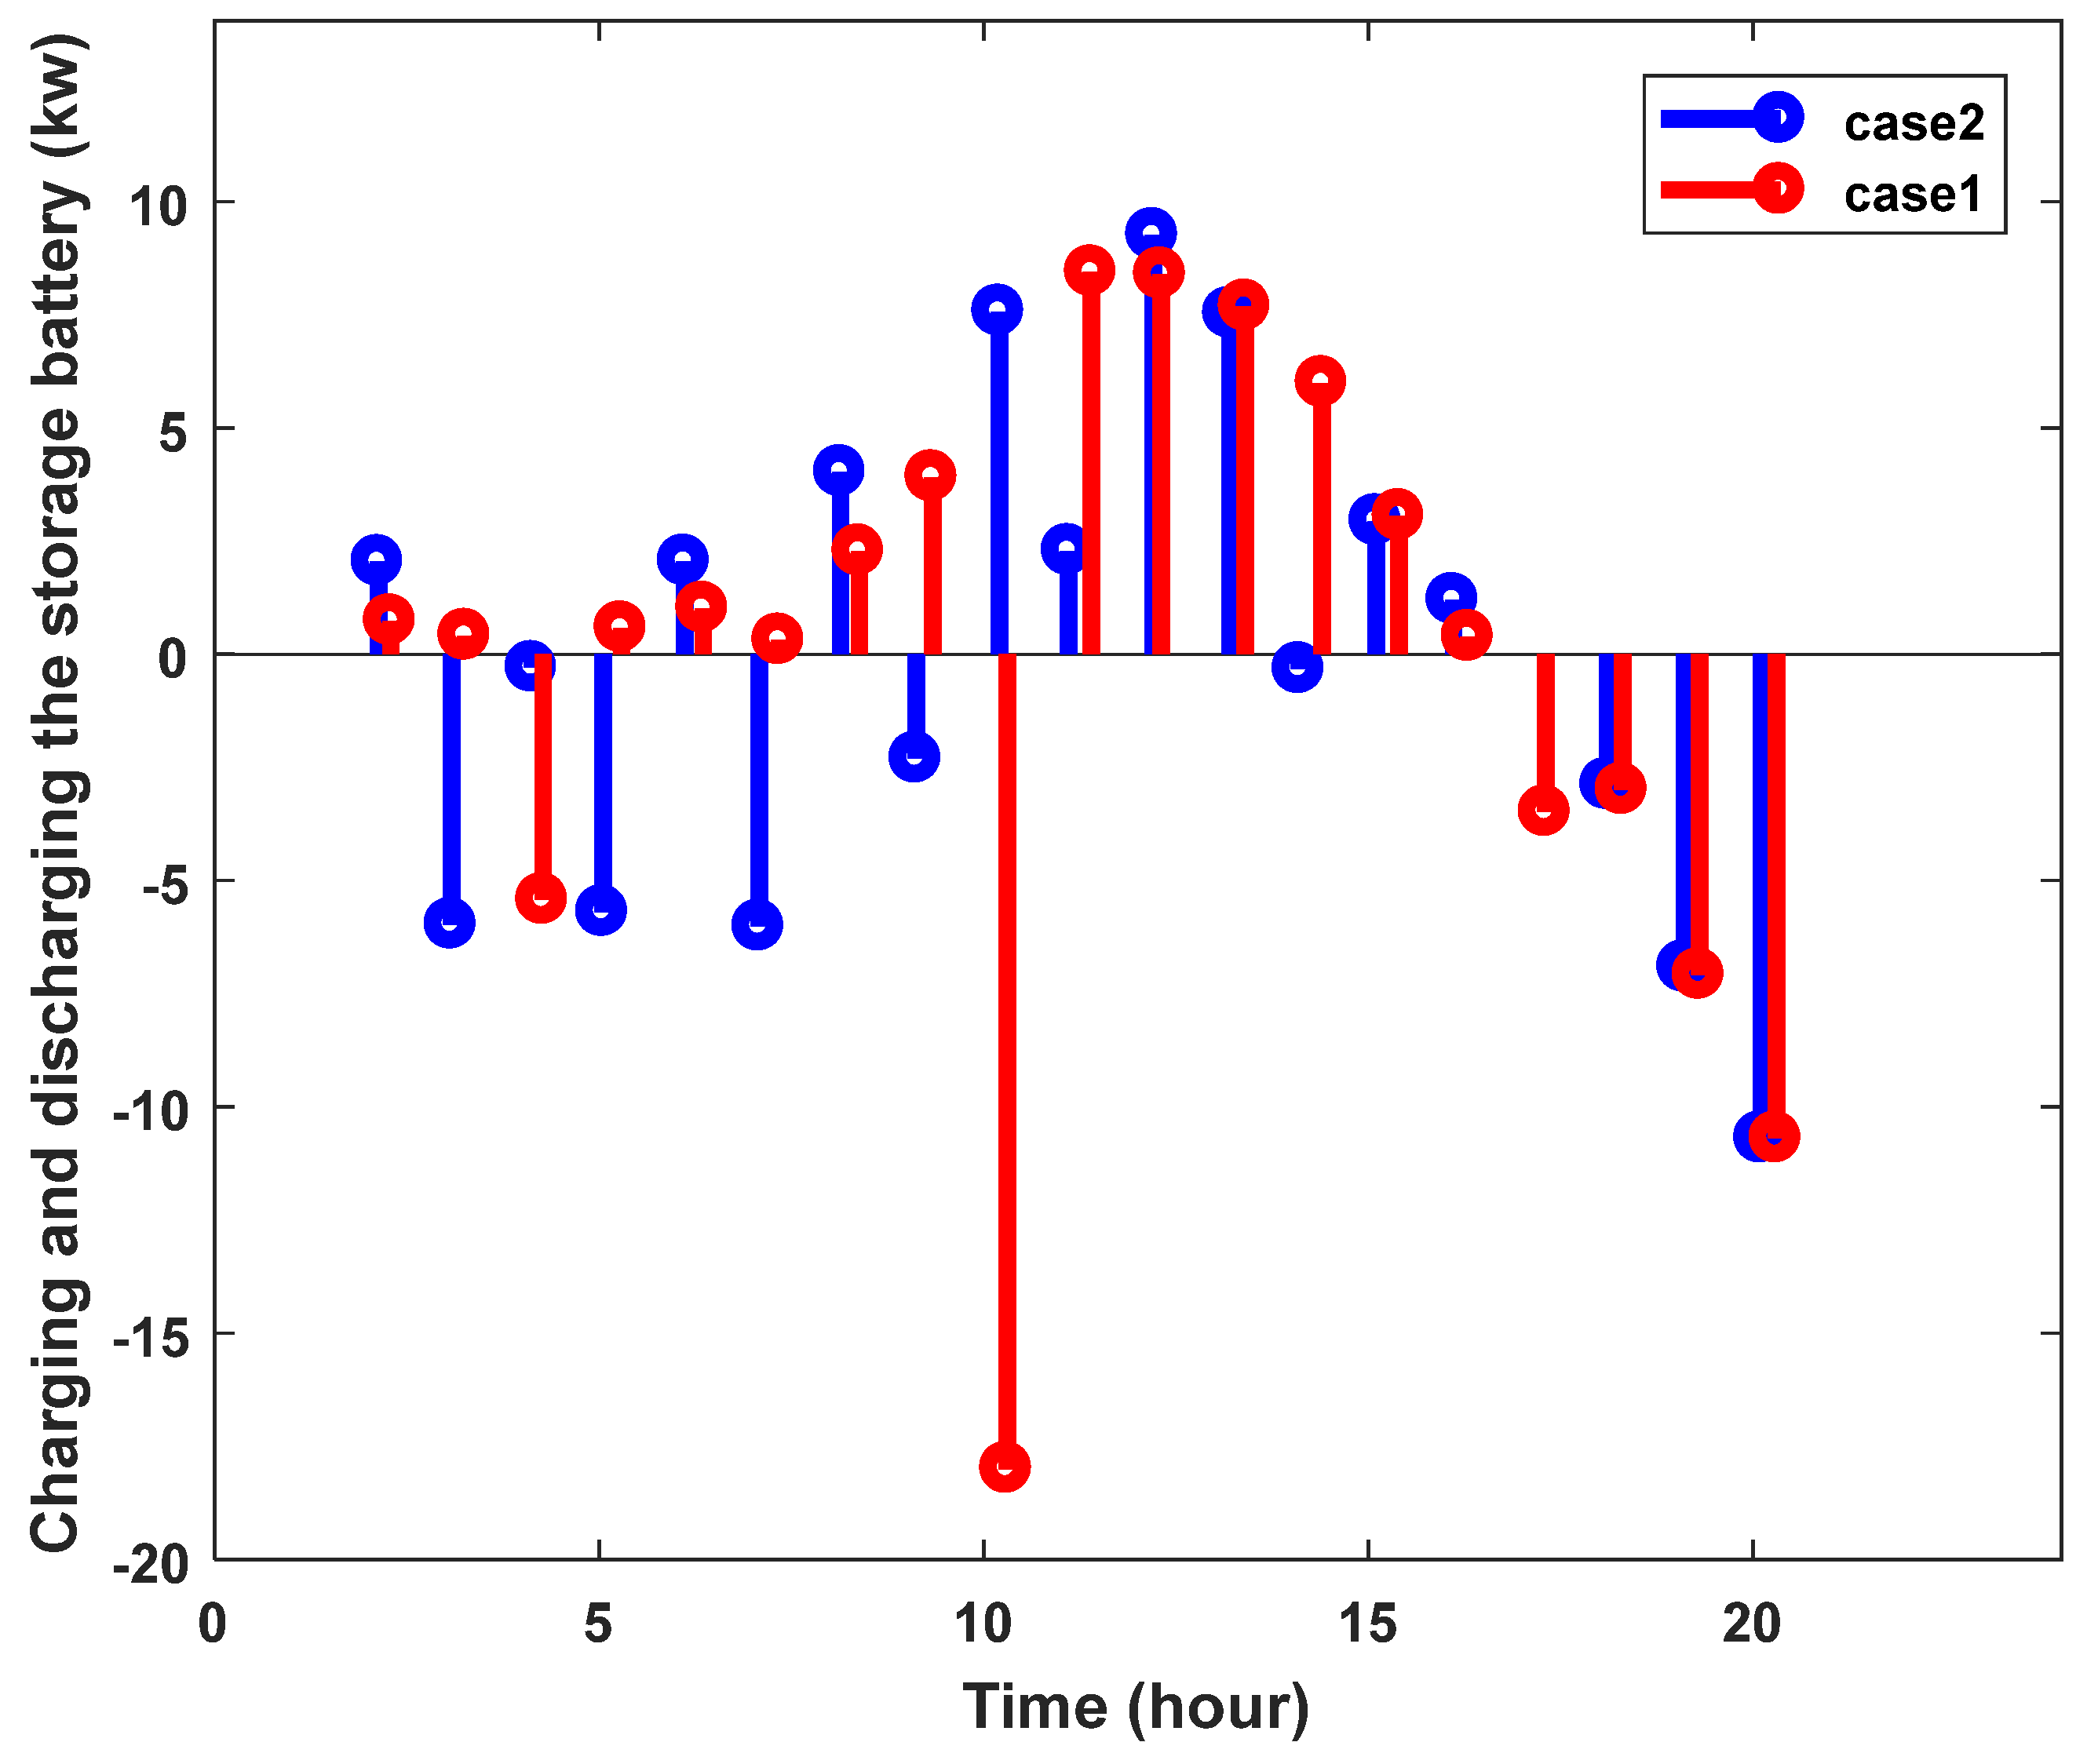
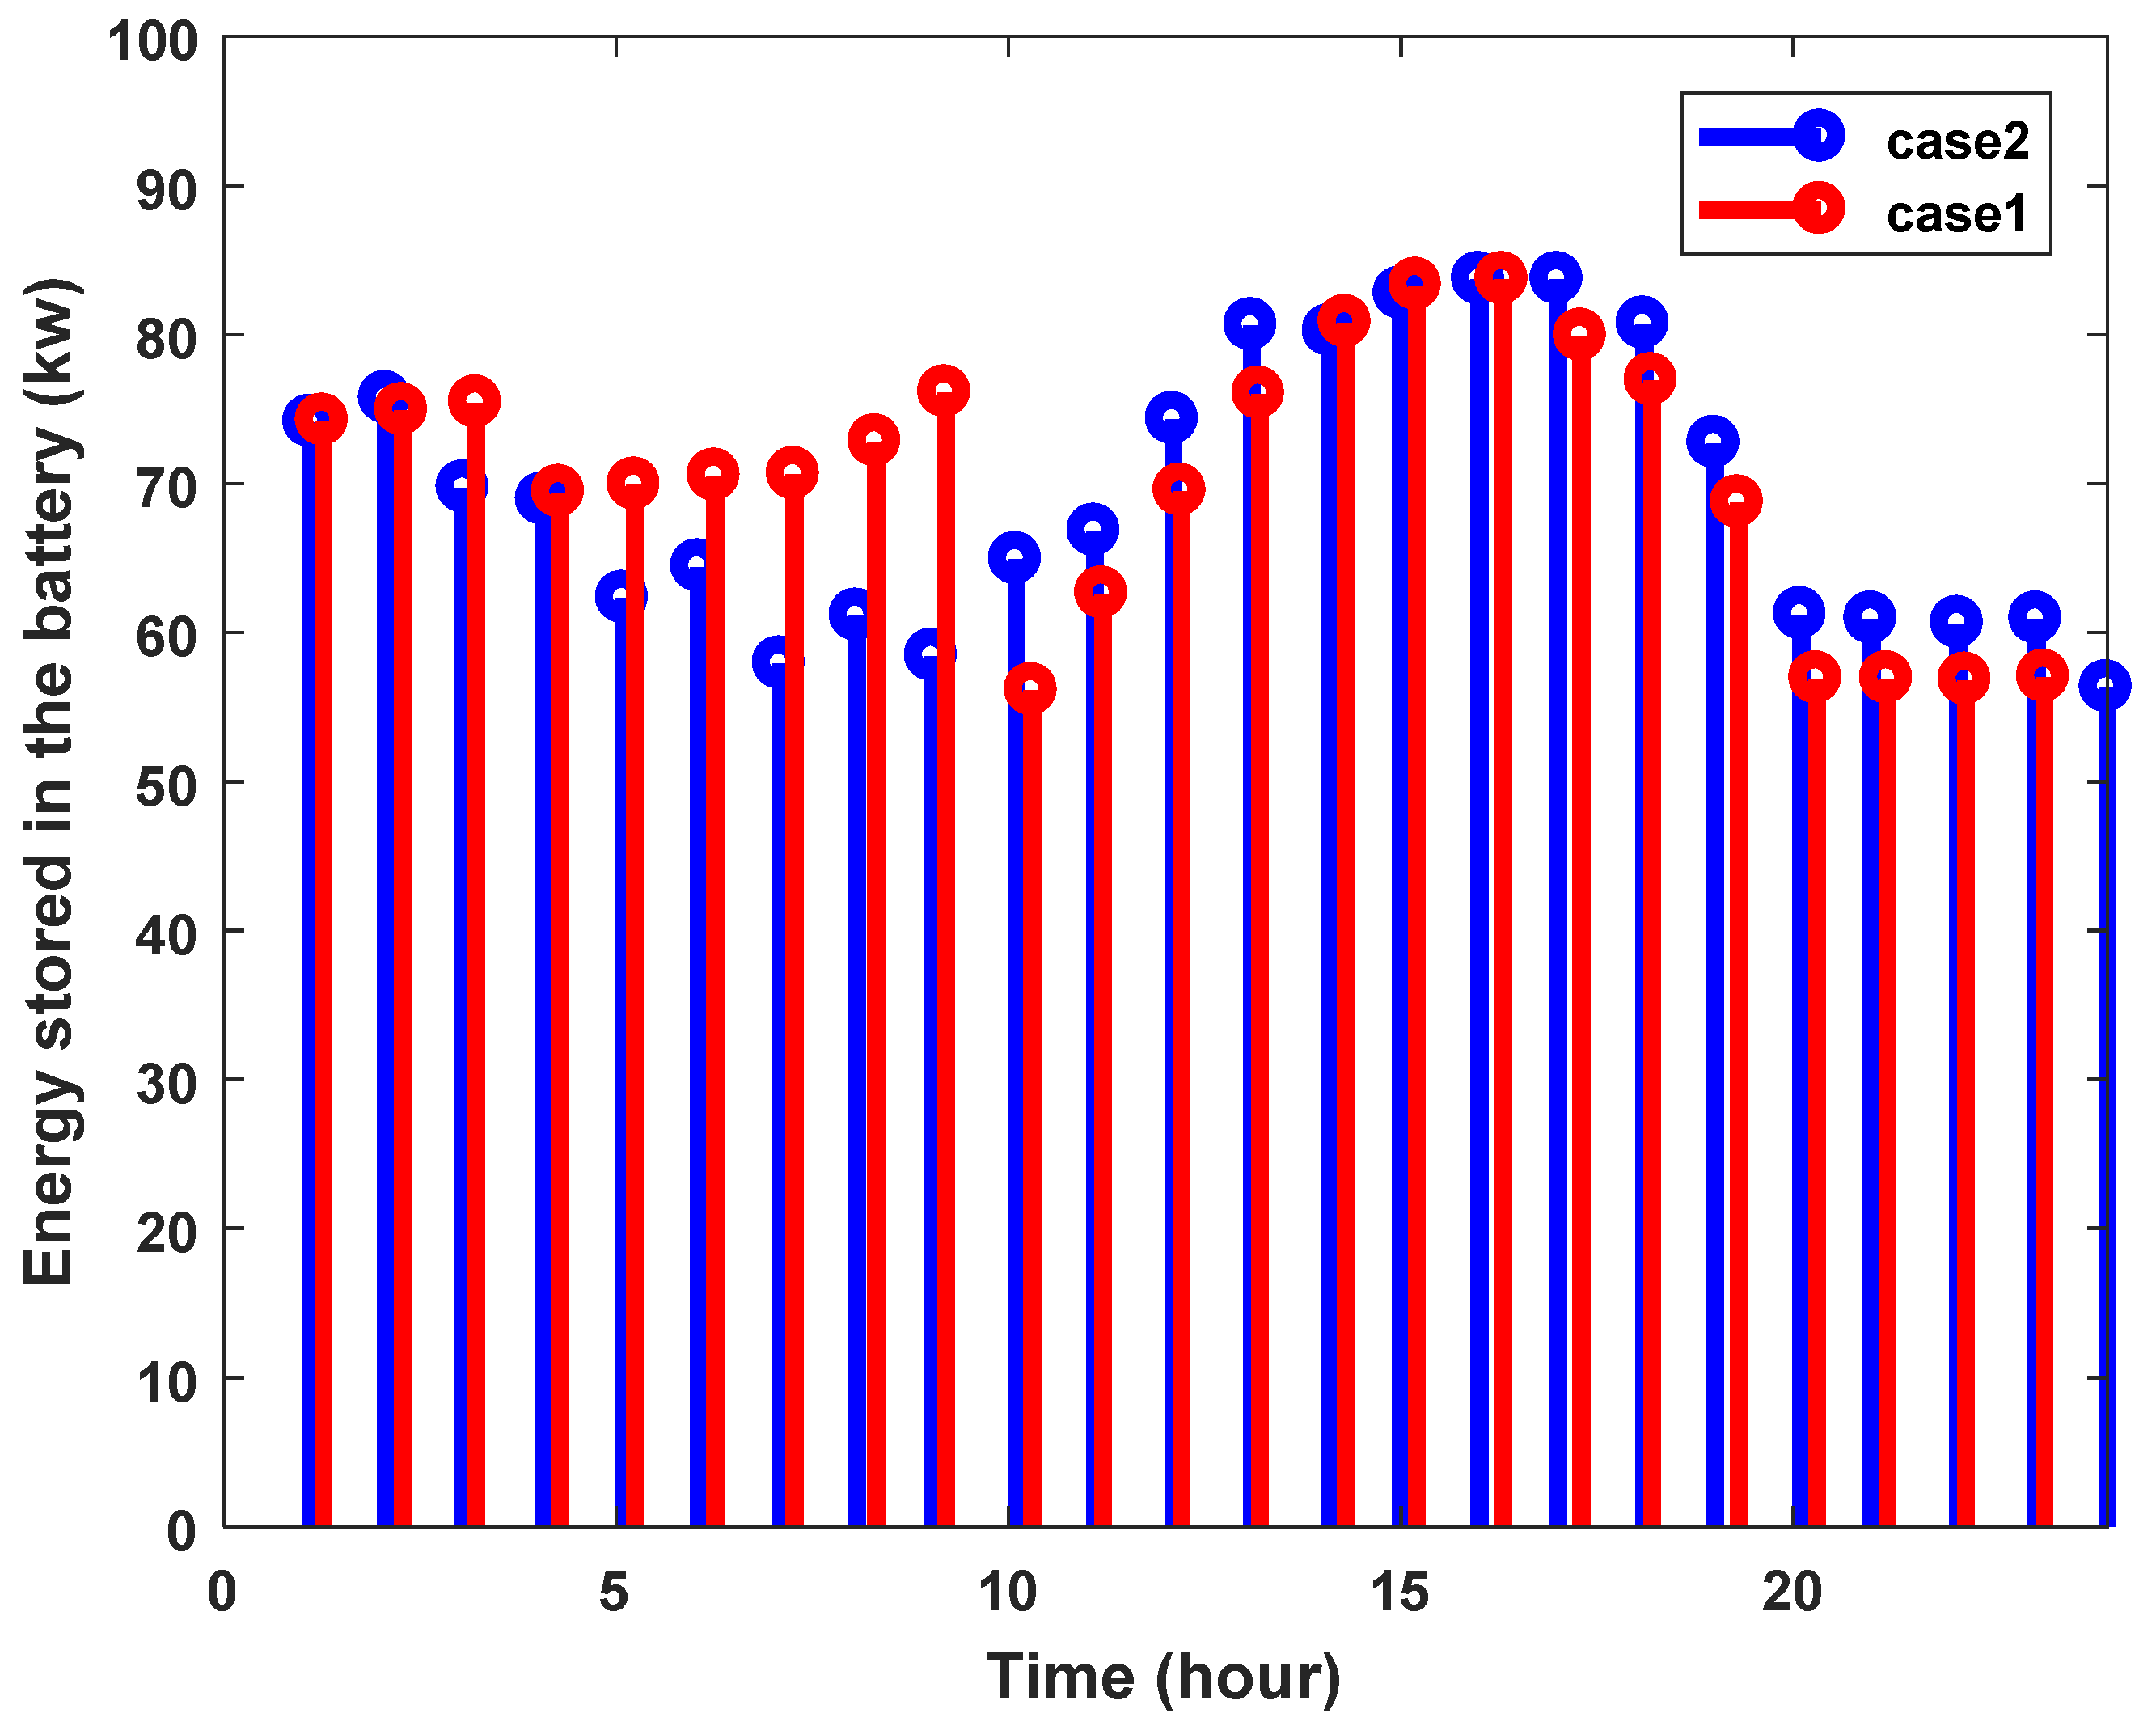
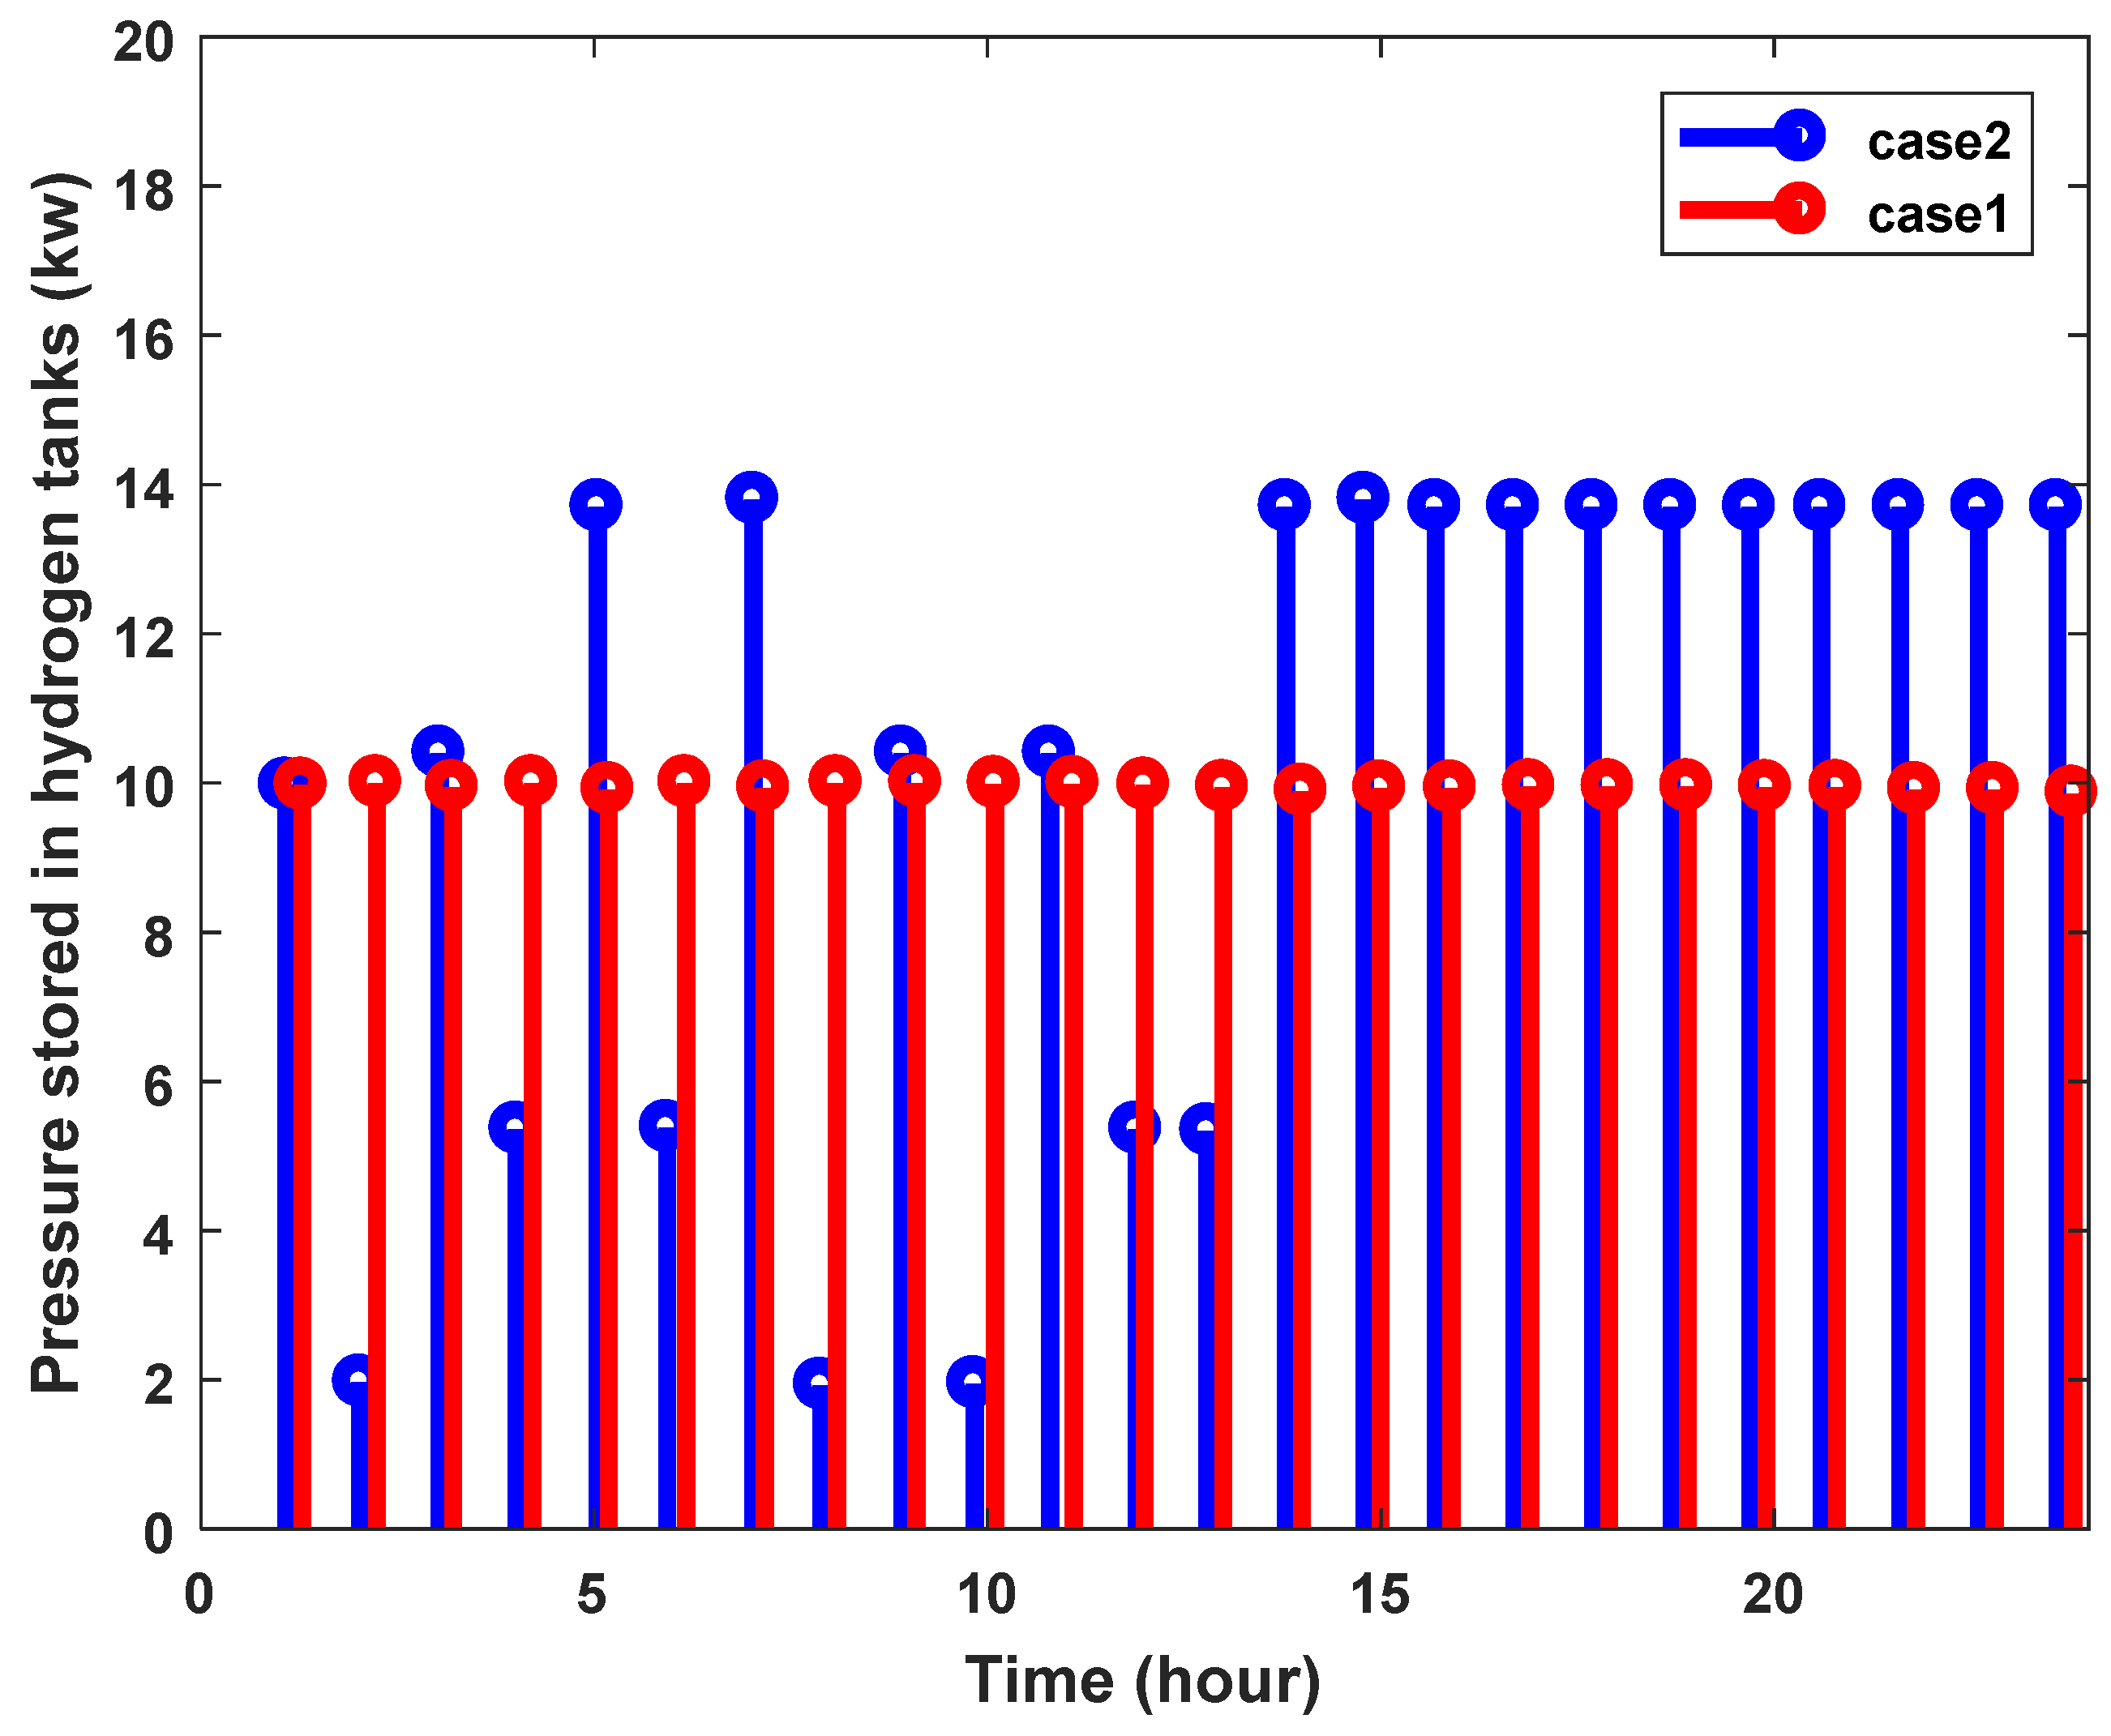
3.4. Constraints of Energy Storage Systems
3.5. Operation Costs
3.6. PSO and IHS Algorithm
- Step 1:
- (Initialization): Set the timer to t = 0 and generate n random chromosomes. [xj(0), j = 1, …, n], where xj(0) = [xj,1(0), xj,2(0), …, xj,m(0)]. xj,k(0) is generated in each state space [xkmin, xkmax]. Vj(0) is generated to test the objective function. For each particle, set xj*(0) = xj(0) and j*j = jj, j = 1, 2, …, n.
- Step 2:
- (time update): update the time counter t = t + 1.
- Step 3:
- (Weight Update): update the inertial weight.
- Step 4:
- (velocity update): an update using the global best and the individual best, and the particle velocity uses Eqs.
- Step 5:
- (update the position): Based on the updated speed, each particle has its own position. If the particle exceeds its positional limits in any dimension, adjust its position to its appropriate limits.
- Step 6:
- Each particle is evaluated according to its updated position.
- Step 7:
- Now find the minimum value.
- Step 8:
- If one of the stop conditions is met, then stop; otherwise, go to step 2.
- Initialization of the optimization problem and initial parameters.
- Setting the harmonious memory.
- Creating a new and improved harmony.
- Updating the harmonious memory.
- Repeating steps 3 and 4 until the final condition is satisfied or the repetitions are finished.
4. The System under Test
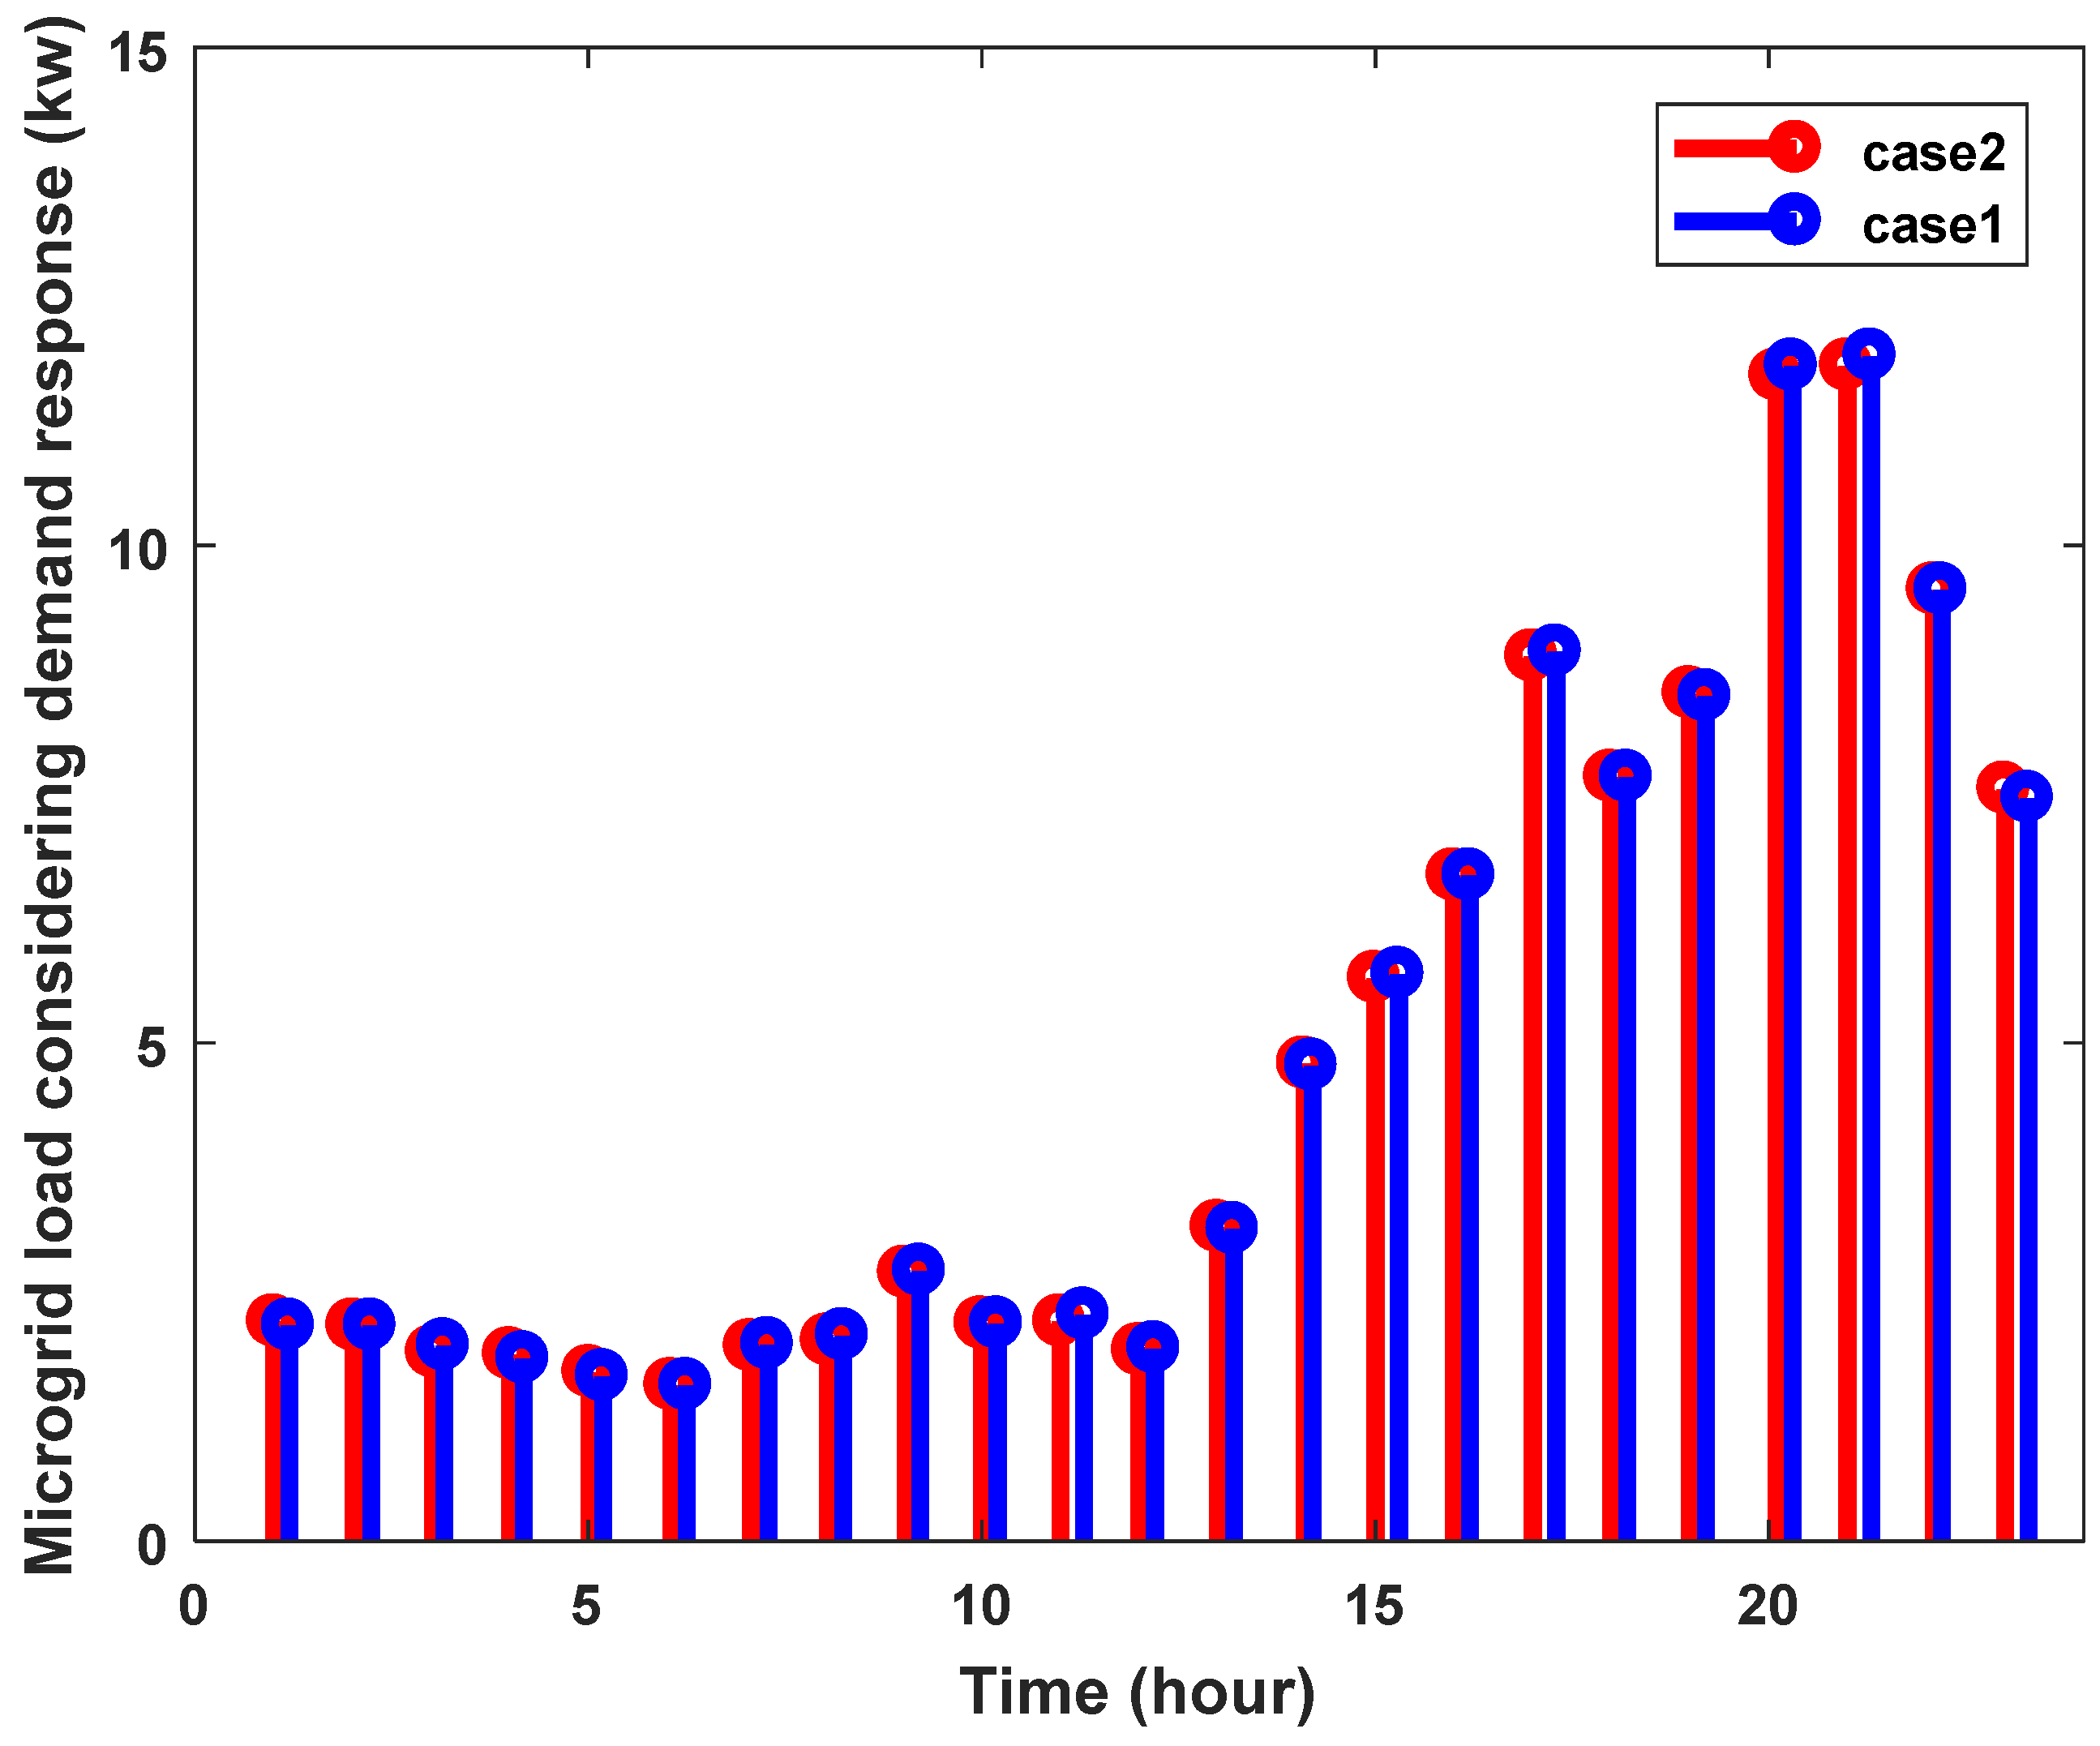
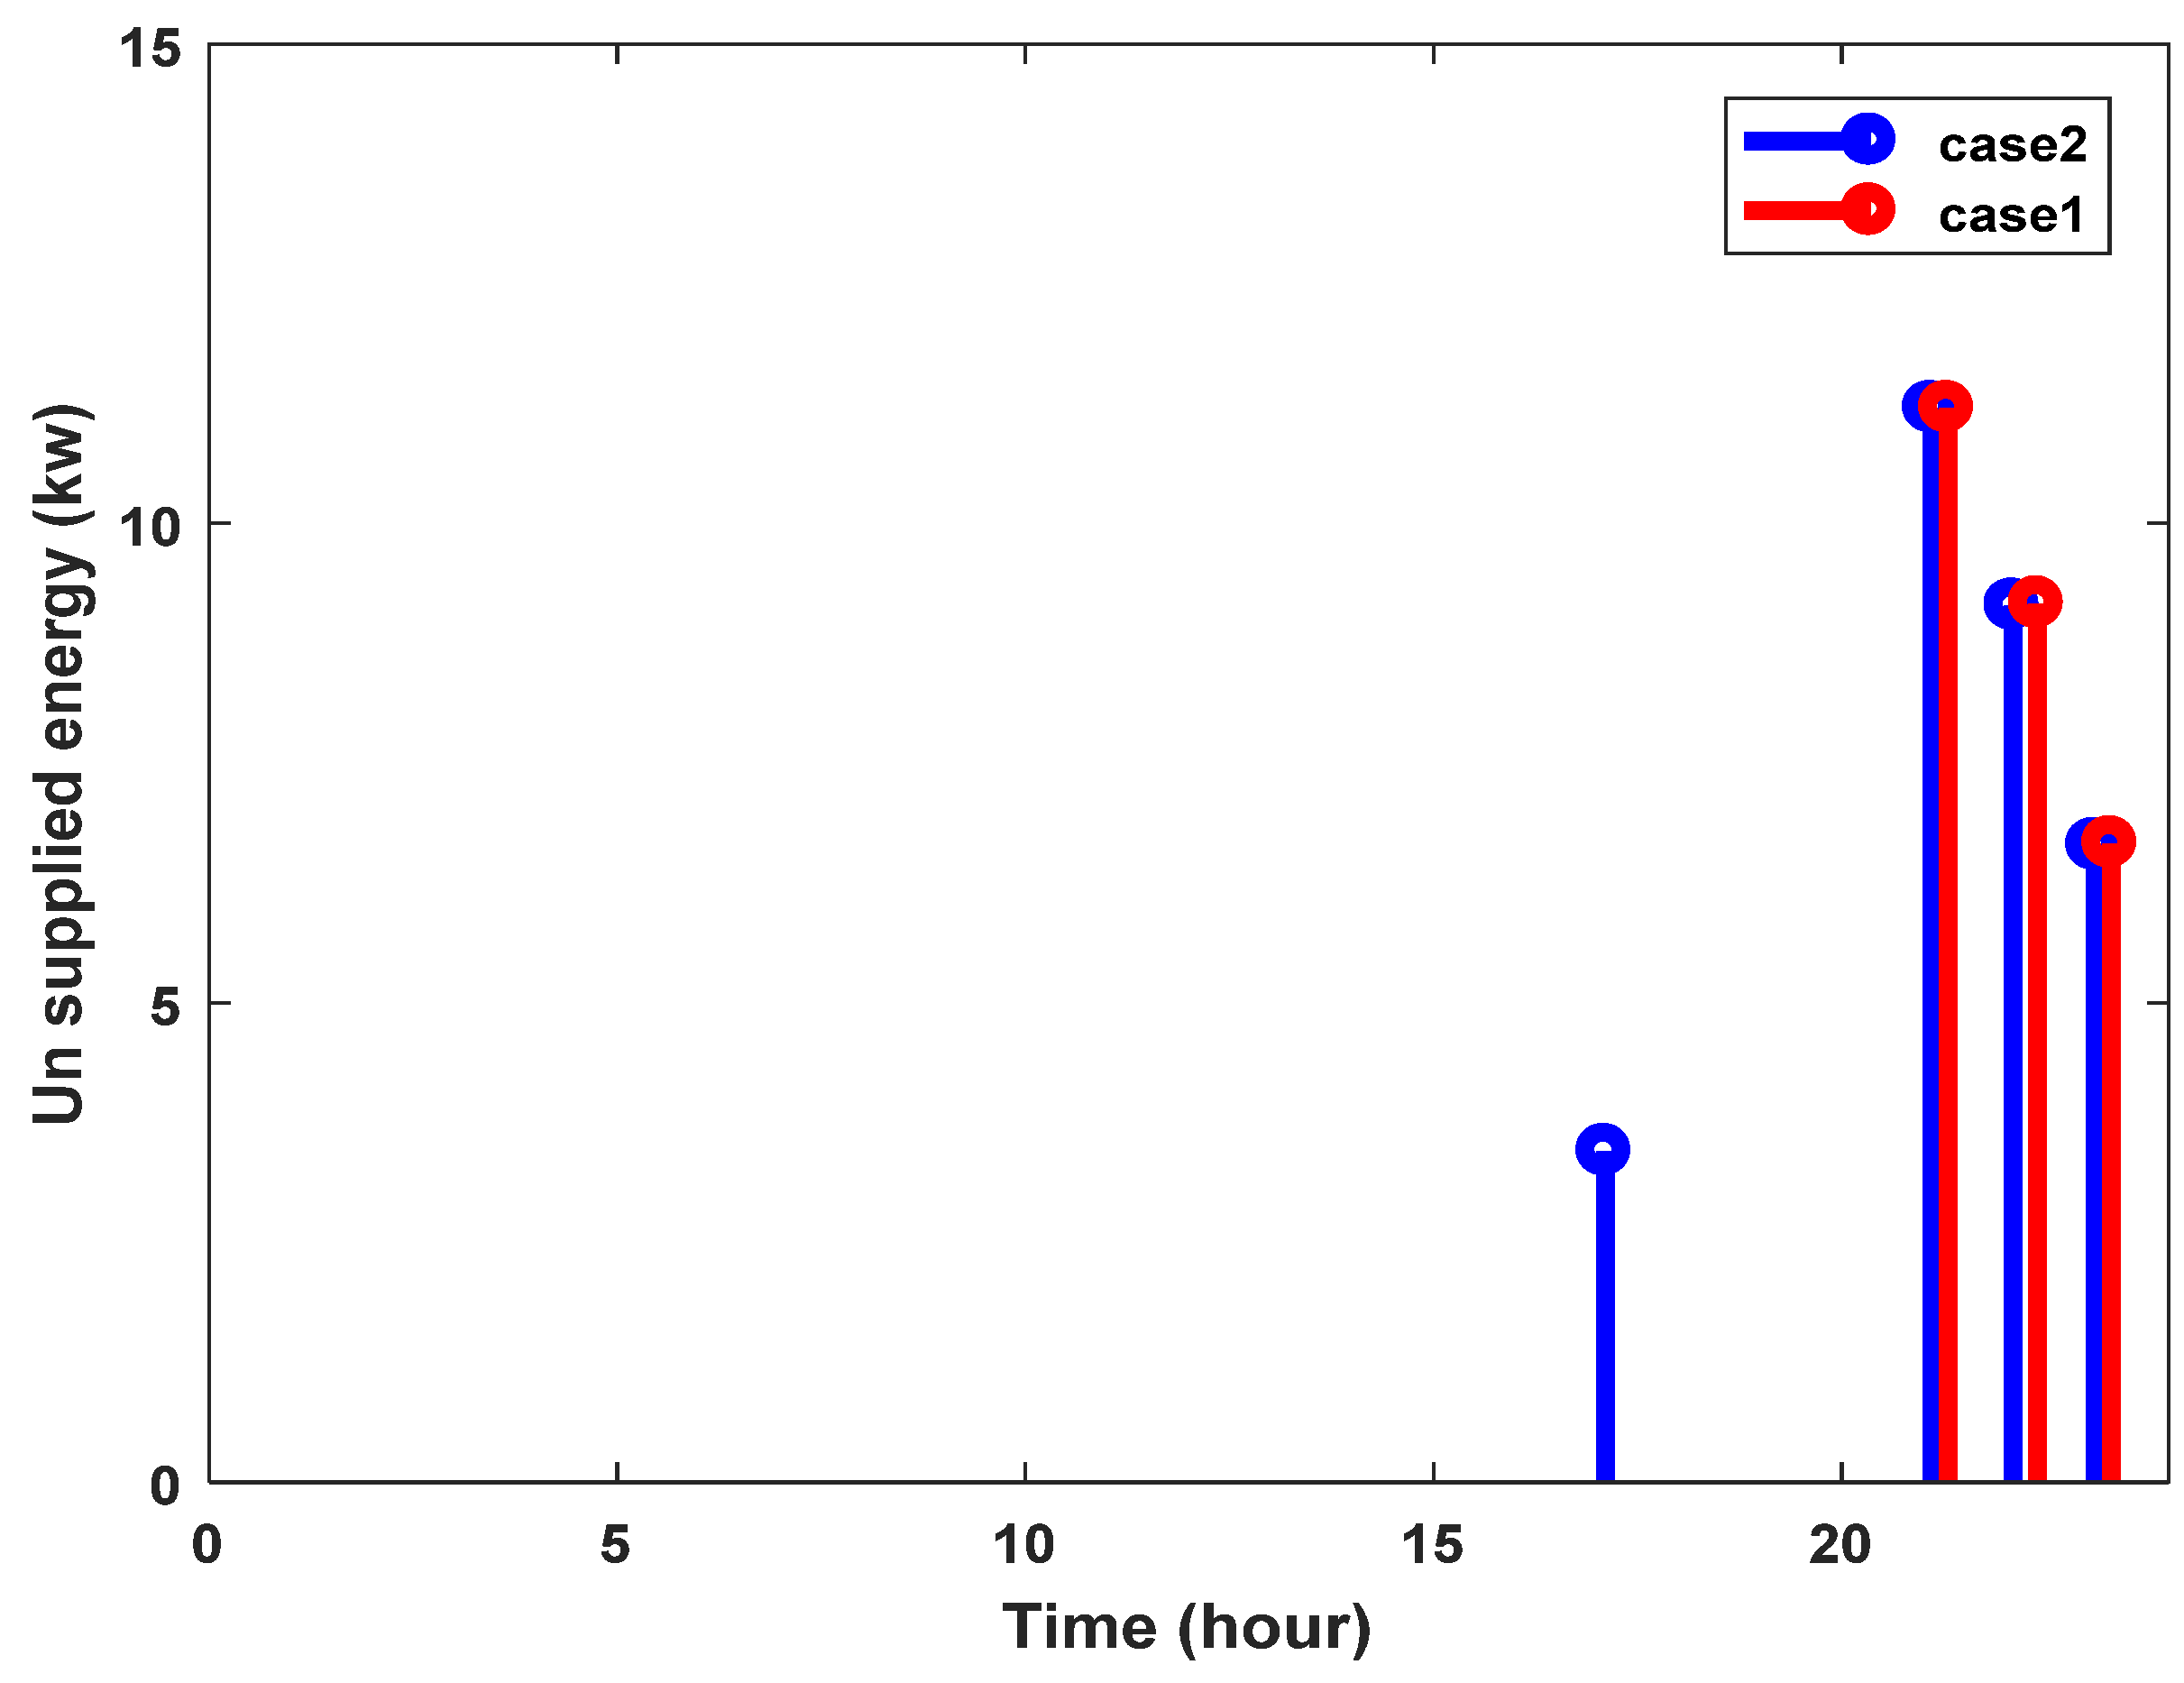
- Planning a microgrid DR without considering CAES;
- Planning a microgrid and DR considering CAES.
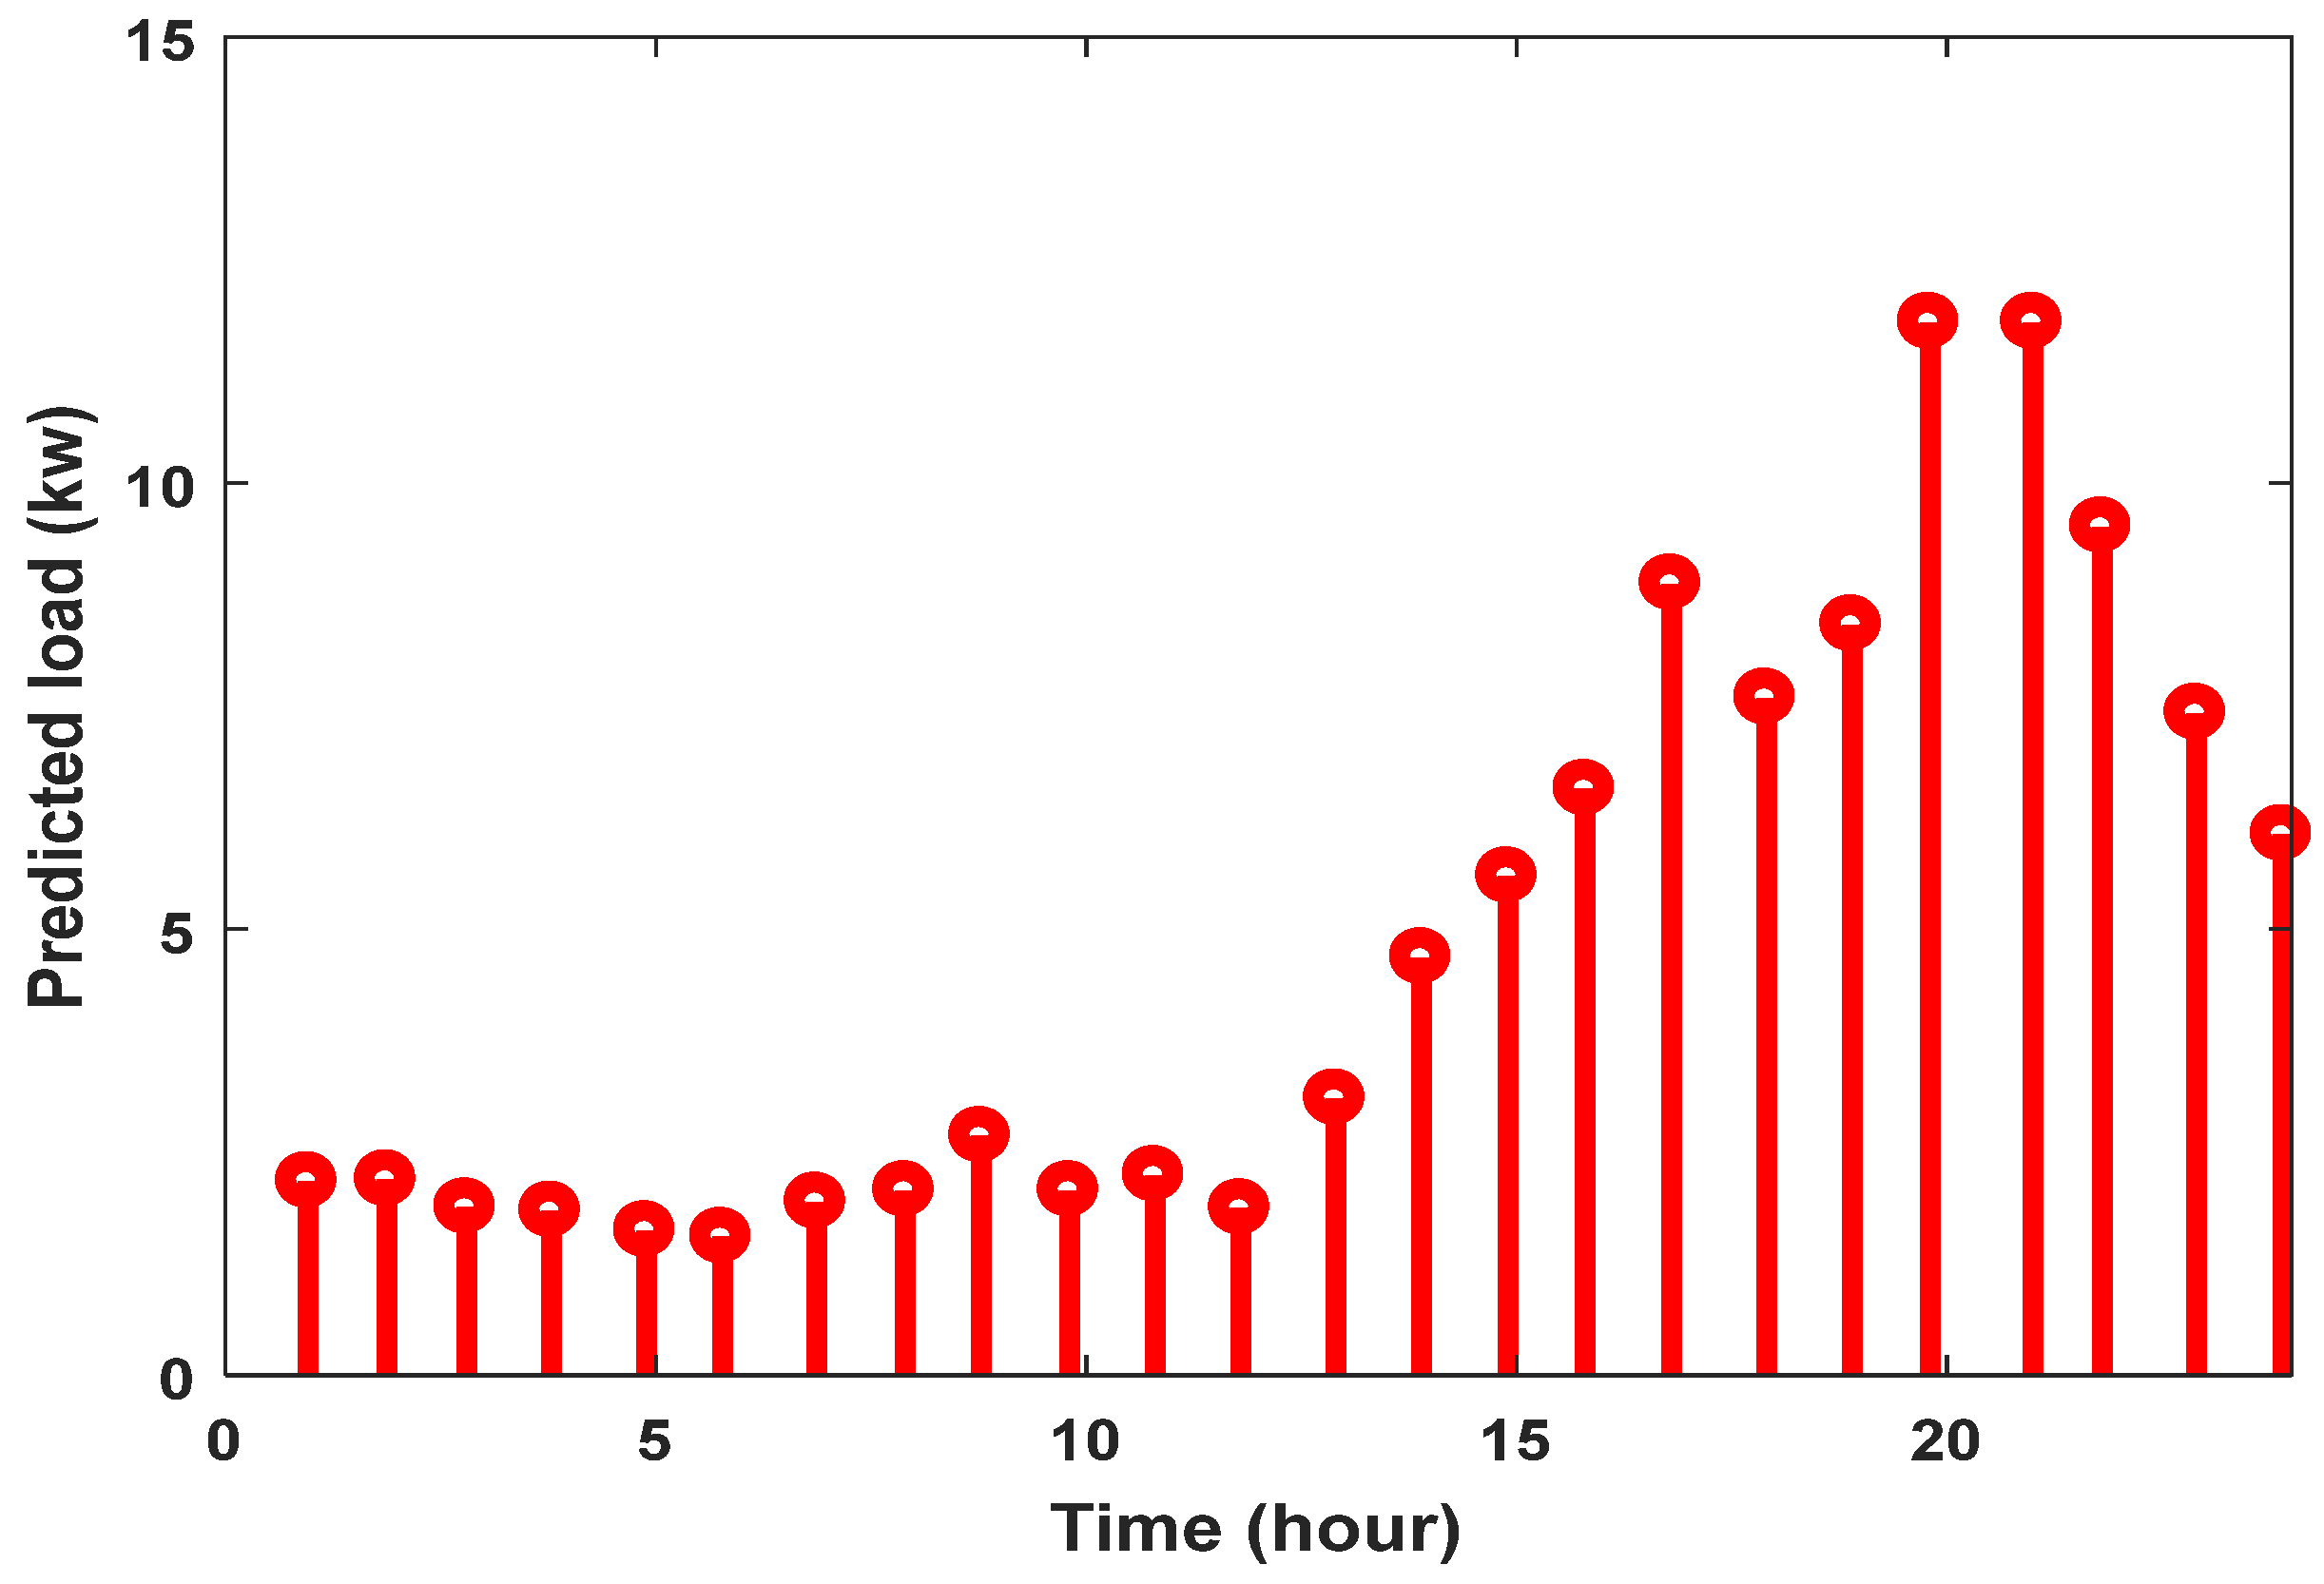
5. Simulation Results
6. Conclusions
- Strategy and concurrent management of ACES load response, with new algorithms.
- Using resources such as diesel generators in the model.
- Power system models with many buses.
Author Contributions
Funding
Data Availability Statement
Conflicts of Interest
References
- Hirsch, A.; Parag, Y.; Guerrero, J. Microgrids: A review of technologies, key drivers, and outstanding issues. Renew. Sustain. Energy Rev. 2018, 90, 402–411. [Google Scholar] [CrossRef]
- Grisales-Noreña, L.F.; Ocampo-Toro, J.A.; Rosales-Muñoz, A.A.; Cortes-Caicedo, B.; Montoya, O.D. An Energy Management System for PV Sources in Standalone and Connected DC Networks Considering Economic, Technical, and Environmental Indices. Sustainability 2022, 14, 16429. [Google Scholar] [CrossRef]
- Maanavi, M.; Najafi, A.; Godina, R.; Mahmoudian, M.; Rodrigues, E.M.G. Energy Management of Virtual Power Plant Considering Distributed Generation Sizing and Pricing. Appl. Sci. 2019, 9, 2817. [Google Scholar] [CrossRef] [Green Version]
- Zhu, W.; Guo, J.; Zhao, G. Multi-Objective Dispatching Optimization of an Island Microgrid Integrated with Desalination Units and Electric Vehicles. Processes 2021, 9, 798. [Google Scholar] [CrossRef]
- Nazari-Heris, M.; Mirzaei, M.A.; Asadi, S.; Mohammadi-Ivatloo, B.; Zare, K.; Jebelli, H. A hybrid robust-stochastic optimization framework for optimal energy management of electric vehicles parking lots. Sustain. Energy Technol. Assess. 2021, 47, 101467. [Google Scholar] [CrossRef]
- Aluisio, B.; Dicorato, M.; Forte, G.; Trovato, M. An optimization procedure for Microgrid day-ahead operation in the presence of CHP facilities. Sustain. Energy Grids Netw. 2017, 11, 34–45. [Google Scholar] [CrossRef]
- Akbari, E.; Shafaghatian, N.; Zishan, F.; Montoya, O.D.; Giral-Ramirez, D.A. Optimized Two-Level Control of Islanded Microgrids to Reduce Fluctuations. IEEE Access 2022, 10, 95824–95838. [Google Scholar] [CrossRef]
- Montoya, O.D.; Zishan, F.; Giral-Ramírez, D.A. Recursive Convex Model for Optimal Power Flow Solution in Monopolar DC Networks. Mathematics 2022, 10, 3649. [Google Scholar] [CrossRef]
- Connolly, D.; Lund, H.; Mathiesen, B. Smart Energy Europe: The technical and economic impact of one potential 100% renewable energy scenario for the European Union. Renew. Sustain. Energy Rev. 2016, 60, 1634–1653. [Google Scholar] [CrossRef]
- Pazouki, S.; Haghifam, M.-R. Optimal planning and scheduling of energy hub in presence of wind, storage and demand response under uncertainty. Int. J. Electr. Power Energy Syst. 2016, 80, 219–239. [Google Scholar] [CrossRef]
- Ma, T.; Wu, J.; Hao, L. Energy flow modeling and optimal operation analysis of the micro energy grid based on energy hub. Energy Convers. Manag. 2017, 133, 292–306. [Google Scholar] [CrossRef]
- del Real, A.J.; Arce, A.; Bordons, C. Optimization strategy for element sizing in hybrid power systems. J. Power Source 2009, 193, 315–321. [Google Scholar] [CrossRef]
- Bilil, H.; Aniba, G.; Maaroufi, M. Probabilistic Economic Emission Dispatch Optimization of Multi-sources Power System. Energy Procedia 2014, 50, 789–796. [Google Scholar] [CrossRef] [Green Version]
- Siano, P. Demand response and smart grids—A survey. Renew. Sustain. Energy Rev. 2014, 30, 461–478. [Google Scholar] [CrossRef]
- Vytelingum, P.; Voice, T.D.; Ramchurn, S.D.; Rogers, A.; Jennings, N.R. Agent-based micro-storage management for the smart grid. In Proceedings of the 9th International Conference on Autonomous Agents and Multiagent Systems, Toronto, ON, Canada, 10–14 May 2010. [Google Scholar]
- Akhil, A.A.; Huff, G.; Currier, A.B.; Hernandez, J.; Bender, D.A.; Kaun, B.C.; Rastler, D.M.; Chen, S.B.; Cotter, A.L.; Bradshaw, D.T.; et al. DOE/EPRI 2013 Electricity Storage Handbook in Collaboration with NRECA; Sandia National Laboratories: Albuquerque, NM, USA, 2013; Volume 1, p. 340.
- Tightiz, L.; Yang, H.; Piran, M.J. A survey on enhanced smart micro-grid management system with modern wireless technology contribution. Energies 2020, 13, 2258. [Google Scholar] [CrossRef]
- Becker, T.A.; Sidhu, I.; Tenderich, B. Electric Vehicles in the United States: A New Model with Forecasts to 2030; Center for Entrepreneurship and Technology, University of California: Berkeley, CA, USA, 2009; p. 24. [Google Scholar]
- Lee, J.; Lee, H. A New HEV Power Distribution Algorithm Using Nonlinear Programming. Appl. Sci. 2022, 12, 12724. [Google Scholar] [CrossRef]
- Almughram, O.; Ben Slama, S.; Zafar, B. Model for Managing the Integration of a Vehicle-to-Home Unit into an Intelligent Home Energy Management System. Sensors 2022, 22, 8142. [Google Scholar] [CrossRef]
- Dominguez-Jimenez, J.; Campillo, J.; Montoya, O.; Delahoz, E.; Hernández, J. Seasonality Effect Analysis and Recognition of Charging Behaviors of Electric Vehicles: A Data Science Approach. Sustainability 2020, 12, 7769. [Google Scholar] [CrossRef]
- Clement-Nyns, K.; Haesen, E.; Driesen, J. The impact of vehicle-to-grid on the distribution grid. Electr. Power Syst. Res. 2011, 81, 185–192. [Google Scholar] [CrossRef]
- Dyke, K.J.; Schofield, N.; Barnes, M. The Impact of Transport Electrification on Electrical Networks. IEEE Trans. Ind. Electron. 2010, 57, 3917–3926. [Google Scholar] [CrossRef]
- Tightiz, L.; Mansouri, S.; Zishan, F.; Yoo, J.; Shafaghatian, N. Maximum Power Point Tracking for Photovoltaic Systems Operating under Partially Shaded Conditions Using SALP Swarm Algorithm. Energies 2022, 15, 8210. [Google Scholar] [CrossRef]
- Hartmann, N.; Özdemir, E. Impact of different utilization scenarios of electric vehicles on the German grid in 2030. J. Power Source 2011, 196, 2311–2318. [Google Scholar] [CrossRef]
- Mohiti, M.; Monsef, H.; Lesani, H. A decentralized robust model for coordinated operation of smart distribution network and electric vehicle aggregators. Int. J. Electr. Power Energy Syst. 2018, 104, 853–867. [Google Scholar] [CrossRef]
- Liu, C.; Chau, K.T.; Wu, D.; Gao, S. Opportunities and Challenges of Vehicle-to-Home, Vehicle-to-Vehicle, and Vehicle-to-Grid Technologies. Proc. IEEE 2013, 101, 2409–2427. [Google Scholar] [CrossRef] [Green Version]
- Cleary, B.; Duffy, A.; O’Connor, A.; Conlon, M.; Fthenakis, V. Assessing the Economic Benefits of Compressed Air Energy Storage for Mitigating Wind Curtailment. IEEE Trans. Sustain. Energy 2015, 6, 1021–1028. [Google Scholar] [CrossRef] [Green Version]
- Le, H.T.; Santoso, S. Operating compressed-air energy storage as dynamic reactive compensator for stabilising wind farms under grid fault conditions. IET Renew. Power Gener. 2013, 7, 717–726. [Google Scholar] [CrossRef]
- Shafiee, S.; Zareipour, H.; Knight, A.M.; Amjady, N.; Mohammadi-Ivatloo, B. Risk-Constrained Bidding and Offering Strategy for a Merchant Compressed Air Energy Storage Plant. IEEE Trans. Power Syst. 2016, 32, 946–957. [Google Scholar] [CrossRef]
- Krupke, C.; Wang, J.; Clarke, J.; Luo, X. Modeling and Experimental Study of a Wind Turbine System in Hybrid Connection With Compressed Air Energy Storage. IEEE Trans. Energy Convers. 2016, 32, 137–145. [Google Scholar] [CrossRef] [Green Version]
- Li, N.; Hedman, K.W. Economic Assessment of Energy Storage in Systems With High Levels of Renewable Resources. IEEE Trans. Sustain. Energy 2014, 6, 1103–1111. [Google Scholar] [CrossRef]
- Pirouzi, S.; Aghaei, J. Mathematical modeling of electric vehicles contributions in voltage security of smart distribution networks. Simulation 2019, 95, 429–439. [Google Scholar] [CrossRef]
- Pirouzi, S.; Aghaei, J.; Shafie-Khah, M.; Osório, G.J.; Catalão, J.P.S. Evaluating the security of electrical energy distribution networks in the presence of electric vehicles. In Proceedings of the 2017 IEEE Manchester PowerTech, Manchester, UK, 18–22 June 2017; pp. 1–6. [Google Scholar]
- Norouzi, M.; Aghaei, J.; Pirouzi, S.; Niknam, T.; Fotuhi-Firuzabad, M.; Shafie-Khah, M. Hybrid stochastic/robust flexible and reliable scheduling of secure networked microgrids with electric springs and electric vehicles. Appl. Energy 2021, 300, 117395. [Google Scholar] [CrossRef]
- Pirouzi, A.; Aghaei, J.; Pirouzi, S.; Vahidinasab, V.; Jordehi, A.R. Exploring potential storage-based flexibility gains of electric vehicles in smart distribution grids. J. Energy Storage 2022, 52, 105056. [Google Scholar] [CrossRef]
- Alayi, R.; Zishan, F.; Mohkam, M.; Hoseinzadeh, S.; Memon, S.; Garcia, D.A. A sustainable energy distribution configuration for microgrids integrated to the national grid using back-to-back converters in a renewable power system. Electronics 2021, 10, 1826. [Google Scholar] [CrossRef]
- Akbari, E.; Shabestari, S.F.M.; Pirouzi, S.; Jadidoleslam, M. Network flexibility regulation by renewable energy hubs using flexibility pricing-based energy management. Renew. Energy 2023, 206, 295–308. [Google Scholar] [CrossRef]
- Zishan, F.; Akbari, E.; Montoya, O.D.; Giral-Ramírez, D.A.; Nivia-Vargas, A.M. Electricity retail market and accountability-based strategic bidding model with short-term energy storage considering the uncertainty of consumer demand response. Results Eng. 2022, 16, 100679. [Google Scholar] [CrossRef]
- Sheikhi, A.; Rayati, M.; Ranjbar, A.M. Demand side management for a residential customer in multi-energy systems. Sustain. Cities Soc. 2016, 22, 63–77. [Google Scholar] [CrossRef]
- Wasilewski, J. Integrated modeling of microgrid for steady-state analysis using modified concept of multi-carrier energy hub. Int. J. Electr. Power Energy Syst. 2015, 73, 891–898. [Google Scholar] [CrossRef]
- Saleem, M.U.; Usman, M.R.; Shakir, M. Design, Implementation, and Deployment of an IoT Based Smart Energy Management System. IEEE Access 2021, 9, 59649–59664. [Google Scholar] [CrossRef]
- Huang, W.; Zhang, N.; Kang, C.; Li, M.; Huo, M. From demand response to integrated demand response: Review and prospect of research and application. Prot. Control Mod. Power Syst. 2019, 4, 12. [Google Scholar] [CrossRef] [Green Version]
- Grisales-Noreña, L.F.; Montoya, O.D.; Cortés-Caicedo, B.; Zishan, F.; Rosero-García, J. Optimal Power Dispatch of PV Generators in AC Distribution Networks by Considering Solar, Environmental, and Power Demand Conditions from Colombia. Mathematics 2023, 11, 484. [Google Scholar] [CrossRef]
- Mansouri, S.; Zishan, F.; Montoya, O.D.; Azimizadeh, M.; Giral-Ramírez, D.A. Using an intelligent method for microgrid generation and operation planning while considering load uncertainty. Results Eng. 2023, 17, 100978. [Google Scholar] [CrossRef]
- Hajiamoosha, P.; Rastgou, A.; Bahramara, S.; Sadati, S.M.B. Stochastic energy management in a renewable energy-based microgrid considering demand response program. Int. J. Electr. Power Energy Syst. 2021, 129, 106791. [Google Scholar] [CrossRef]
- Soroudi, A.; Keane, A. Risk averse energy hub management considering plug-in electric vehicles using information gap decision theory. In Plug in Electric Vehicles in Smart Grids; Springer: Singapore, 2015; pp. 107–127. [Google Scholar]
- Doosti, R.; Sedighizadeh, M.; Sedighizadeh, D.; Sheikhi Fini, A. Robust stochastic optimal operation of an industrial building including plug in electric vehicle, solar-powered compressed air energy storage and ice storage conditioner: A case study in the city of Kaveh, Iran. IET Smart Cities 2022, 4, 56–77. [Google Scholar] [CrossRef]
- Sedighizadeh, M.; Esmaili, M.; Jamshidi, A.; Ghaderi, M.-H. Stochastic multi-objective economic-environmental energy and reserve scheduling of microgrids considering battery energy storage system. Int. J. Electr. Power Energy Syst. 2019, 106, 1–16. [Google Scholar] [CrossRef]
- Haghi, E.; Raahemifar, K.; Fowler, M. Investigating the effect of renewable energy incentives and hydrogen storage on advantages of stakeholders in a microgrid. Energy Policy 2018, 113, 206–222. [Google Scholar] [CrossRef]
- Alayi, R.; Zishan, F.; Seyednouri, S.R.; Kumar, R.; Ahmadi, M.H.; Sharifpur, M. Optimal Load Frequency Control of Island Microgrids via a PID Controller in the Presence of Wind Turbine and PV. Sustainability 2021, 13, 10728. [Google Scholar] [CrossRef]
- Zishan, F.; Akbari, E.; Montoya, O.D.; Giral-Ramírez, D.A.; Molina-Cabrera, A. Efficient PID Control Design for Frequency Regulation in an Independent Microgrid Based on the Hybrid PSO-GSA Algorithm. Electronics 2022, 11, 3886. [Google Scholar] [CrossRef]
- Wang, D.; Tan, D.; Liu, L. Particle swarm optimization algorithm: An overview. Soft Comput. 2018, 22, 387–408. [Google Scholar] [CrossRef]
- Mahdavi, M.; Fesanghary, M.; Damangir, E. An improved harmony search algorithm for solving optimization problems. Appl. Math. Comput. 2007, 188, 1567–1579. [Google Scholar] [CrossRef]


| Reference | Electric Vehicles | CAES | DR | Energy Storage | Uncertainty Resources |
|---|---|---|---|---|---|
| [10] | ✓ | ✓ | |||
| [19] | ✓ | ✓ | |||
| [28] | ✓ | ✓ | ✓ | ||
| [29] | ✓ | ✓ | |||
| [31] | ✓ | ✓ | |||
| [40] | ✓ | ✓ | |||
| [44] | ✓ | ✓ | ✓ | ||
| suggested method | ✓ | ✓ | ✓ | ✓ | ✓ |
| Wind Turbine | |
|---|---|
| Parameter | Value |
| (kW) | 3 |
| (m/s) | 14 |
| (m/s) | 25 |
| (m/s) | 2 |
| Solar Cell | |
|---|---|
| Parameter | Value |
| (w) | 220 |
| 18.1 | |
| Open circuit voltage | 22.9 |
| The maximum power voltage | 26.3 |
| Short circuit current | 8.21 |
| Storage Battery | |
|---|---|
| Parameter | Value |
| (w) | 12 |
| Rated capacity (Ah) | 240 |
| Number of batteries | 32 |
| SOCmax | 90% |
| SOCmin | 60% |
| SOCinitial | 80% |
| Pcharge(max) | 180 |
| Pcharge(min) | 0 |
| 82% | |
| 90% | |
| CAES | |
|---|---|
| Parameter | Value |
| (w) (max) | 6.2 kW |
| (w) (min) | 1.5 kW |
| 50% | |
| 40% | |
| 6 kW | |
| 0.5 kW | |
| Costs ($) | The First Study | The Second Study |
|---|---|---|
| The cost of charging the battery | 6.30 | 5.64 |
| The cost of discharging the battery | 5.81 | 5.11 |
| The cost of charging CAES | 0 | 76.20 |
| The cost of discharging CAES | 0 | 7.52 |
| Unsupplied energy costs | 176.14 | 161.24 |
| Surplus energy cost | 142.25 | 9.21 |
| Total cost of operation | 330.50 | 264.92 |
| The Cost of the Electricity Company (Dollars) | Daily Losses (MW) | Daily Voltage Deviation (PU) | |
|---|---|---|---|
| IHS | 1,448,985 | 5.216 | 40.88 |
| PSO | −1,274,026 | 6.214 | 50.02 |
| Hour | Bus 2 | Bus 3 | Bus 4 | Bus 5 | Bus 6 | Bus 7 | Bus 8 | Bus 9 |
|---|---|---|---|---|---|---|---|---|
| 1 | −0.203949 | −0.04937 | 0.207117 | 0.072334 | 0.401745 | 0.163183 | 0.149927 | 0.124387 |
| 2 | −0.24253 | 0.0729 | −0.04012 | 0.263437 | 0.363042 | 0.173938 | −0.01371 | 0.08419 |
| 3 | 0.01042 | 0.14861 | −0.4001 | 0.110689 | 0.361972 | −0.01498 | 0.0480303 | 0.042121 |
| 4 | 0.340911 | 0.484103 | −0.18485 | −0.30222 | 0.325129 | 0.16081 | 0.004849 | −0.06615 |
| 5 | 0.065834 | −0.49816 | −0.39088 | 0.398001 | 0.2640030 | 0.107689 | 0.21215 | 0.079658 |
| 6 | −0.07177 | −0.21295 | −0.06469 | −0.3547 | 0 | 0.125458 | 0.016507 | −0.19675 |
| 7 | 0.265884 | 0.191692 | −0.16909 | −0.40229 | 0 | −0.03688 | 0.0335905 | 0.579884 |
| 8 | −0.22318 | 0 | −0.32062 | 0 | 0.419039 | 0 | 0 | 0 |
| 9 | −0.37506 | 0 | 0.037676 | 0.13145 | 0.243154 | 0.17718 | 0.229969 | −0.23253 |
| 10 | 0.371754 | 0.174604 | −0.04403 | −0.21709 | 0.554874 | 0.266126 | 0.090625 | 0 |
| 11 | 0.332572 | 0.409071 | −0.23287 | 0.325205 | 0.32205 | 0.143872 | 0.391532 | 0.256686 |
| 12 | 0.176556 | 0 | −0.31477 | 0.295431 | 0.295431 | 0.444412 | 0.107212 | 0.117152 |
| 13 | 0 | 0 | 0.18944 | 0.607727 | 0.607727 | 0 | 0.253204 | 0.30385 |
| 14 | 0.437693 | −0.08883 | −0.5498 | 0.44691 | 0.471066 | 0 | 0.460542 | 0.011372 |
| 15 | −0.06834 | 0.268593 | 0 | 0.1408 | 0 | 0.345404 | 0.332172 | −0.45478 |
| 16 | −0.0.286554 | −0.06765 | −0.06849 | 0.190355 | 0 | 0.031948 | 0 | 0.460968 |
| 17 | −0.22902 | 0.031767 | 0 | 0.0187853 | 0.338051 | 0.174974 | 0.362333 | 0 |
| 18 | −0.37536 | 0.152148 | 0.008893 | 0 | 0.283249 | 0.073157 | 0.254523 | 0 |
| 19 | −0.00954 | 0 | −0.10208 | −0.26847 | 0.20972 | 0 | 0.238312 | 0.128627 |
| 20 | 0.287311 | 0 | 0.005446 | −0.04548 | 0.370011 | 0.074291 | −0.13023 | −0.31137 |
| 21 | 0.090822 | −0.19068 | 0.199705 | −0.17544 | 0.341616 | 0 | 0.298338 | 0.263416 |
| 22 | 0.279221 | 0.045887 | 0.007725 | −0.015 | 0.581751 | 0.01244 | 0.264084 | 0.016971 |
| 23 | 0.0460825 | 0.054172 | 0.250793 | 0.061933 | 0.501601 | 0.354406 | 0.359602 | 0.05852 |
| 24 | −0.10182 | −0.27968 | 0.145563 | 0.281277 | 0.340406 | 0.517129 | 0.372365 | 0.13524 |
| Hour | Bus 10 | Bus 11 | Bus 12 | Bus 13 | Bus 14 | Bus 15 | Bus 16 | Bus 17 |
| 1 | −0.2172 | −0.1151 | 0.340538 | −0.28858 | 0.13397 | 0.215 | 0.509886 | 0.0296391 |
| 2 | −0.48069 | −0.29731 | 0.261252 | 0.228911 | 0.291982 | −0.07889 | 0.747164 | −0.1629 |
| 3 | −0.30994 | −0.11412 | 0.42172 | 0.082115 | −0.05983 | 0.262531 | 0.433044 | −0.19196 |
| 4 | −0.02283 | −0.38287 | 0.251726 | 0.025115 | 0.060952 | 0.000117 | 0.470921 | 0.592725 |
| 5 | −0.04582 | 0.232496 | 0.266468 | 0.212757 | 0.242039 | 0.057211 | 0.636258 | 0.0373539 |
| 6 | 0.206411 | −0.13927 | 0.162261 | −0.28581 | −0.2199 | 0.109305 | 0.494137 | −0.1691 |
| 7 | 0 | 0 | 0 | −0.05847 | −0.29067 | 0.023746 | 0.564915 | 0.138637 |
| 8 | 0 | 0.499138 | 0.214762 | −0.41379 | 0 | −0.46763 | 0 | −0.14096 |
| 9 | 0.41909 | −0.1038 | −0.15531 | −0.01952 | 0.256453 | 0.219961 | 0 | −0.00244 |
| 10 | 0.080388 | 0.030835 | −0.03662 | 0.347494 | −0.30092 | −0.04624 | 0.343626 | 0 |
| 11 | 0.23086 | −0.24074 | 0.574301 | −0.10117 | 0 | −0.22682 | 0.513629 | −0.07183 |
| 12 | −0.40219 | 0.019415 | 0.216366 | 0.179 | 0 | 0 | 0 | −0.15631 |
| 13 | −0.47158 | −0.57507 | 0.143105 | −0.01213 | 0.187238 | 0 | 0 | 0 |
| 14 | −0.1416 | 0.033491 | 0.170398 | 0 | 0 | 0.135393 | 0.43174 | 0.420412 |
| 15 | −0.19975 | −0.14902 | 0 | 0 | 0.140293 | −0.03003 | 0.523137 | 0.123951 |
| 16 | −0.43673 | −0.01715 | 0.031523 | 0 | 0.0323822 | 0 | 0.354602 | 0 |
| 17 | −0.28284 | 0 | 0 | 0.007066 | −0.10133 | 0 | 0.51713 | 0 |
| 18 | 0 | 0 | 0.225536 | −0.30457 | 0 | 0 | 0 | 0 |
| 19 | −0.25187 | 0.051541 | 0.022455 | 0.180663 | 0 | 0.192109 | 0.673497 | 0.33373 |
| 20 | −0.07334 | −0.41833 | 0.586493 | 0.151788 | 0.357167 | 0.392503 | 0.404807 | −0.25816 |
| 21 | −0.03598 | 0.002444 | 0.171143 | −0.20991 | 0.245613 | 0.119169 | 0.55136 | −0.09427 |
| 22 | −0.10944 | −0.13339 | 0.34417 | −0.11676 | −0.01339 | 0.056928 | 0.512181 | −0.45705 |
| 23 | −0.178767 | 0.067427 | 0.357452 | 0.185385 | 0.121004 | 0.048119 | 0.723733 | 0.531025 |
| 24 | −0.02946 | 0.211197 | 0.08026 | −0.08251 | −0.00704 | 0.30513 | −0.08473 | 0.402817 |
| Hour | Bus 18 | Bus 19 | Bus 20 | Bus 21 | Bus 22 | Bus 23 | Bus 24 | Bus 25 |
| 1 | 0.651439 | −0.05569 | 0.38926 | 0.261946 | 0.375847 | −0.33155 | −0.53184 | −0.34245 |
| 2 | 0.586311 | 0.107974 | −0.20054 | −0.00791 | 0.258296 | −0.23722 | −0.37175 | −0.36514 |
| 3 | 0.491395 | −0.04992 | −0.30449 | 0.09066 | 0.407295 | 0.046916 | −0.40595 | −0.28248 |
| 4 | 0.312905 | −0.21274 | −0.2545 | 0.168318 | 0.383174 | −0.08508 | −0.48565 | −0.43131 |
| 5 | 0.358369 | −0.35149 | −0.37688 | −0.0402 | 0.288562 | −0.14052 | −0.28618 | −0.32766 |
| 6 | 0.444779 | −0.31761 | −0.31283 | 0 | 0 | 0 | −0.43382 | −0.57932 |
| 7 | 0.282577 | 0.151033 | 0 | 0.262387 | 0 | −0.27239 | −0.48589 | −0.44734 |
| 8 | 0 | −0.26157 | 0 | 0.037639 | 0 | 0 | −0.27377 | −0.44177 |
| 9 | 0.369557 | −0.24129 | −0.17753 | 0.165351 | 0.512028 | −0.34309 | −0.41525 | 0 |
| 10 | 0.469584 | 0 | −0.56927 | −0.08343 | 0.63421 | −0.13411 | −0.40694 | −0.34227 |
| 11 | 0.330625 | 0 | −0.18361 | −0.14442 | 0.155257 | −0.340301 | −0.489 | −0.59589 |
| 12 | 0.353939 | 0.340993 | −0.3735 | 0 | 0.492698 | −0.23288 | −0.47008 | 0 |
| 13 | 0.651421 | −0.36893 | −0.36278 | 0.0901198 | 0.44566 | 0 | 0 | −0.037478 |
| 14 | 0.401976 | −0.36893 | −0.31686 | −0.11612 | 0.247802 | 0 | −0.50581 | 0 |
| 15 | 0.466945 | 0.156724 | −0.19768 | 0.164742 | 0.040224 | −0.35577 | −0.62309 | −0.36613 |
| 16 | 0.214875 | 0.357695 | −0.06306 | 0.104369 | 0 | 0 | 0 | −0.46353 |
| 17 | 0 | 0.372549 | 0 | 0.118784 | 0 | −0.31297 | −0.46577 | −0.530547 |
| 18 | 0.448936 | 0.373463 | 0 | 0 | 0.351668 | −0.11008 | −0.39909 | 0 |
| 19 | 0.378952 | −0.20447 | −0.22115 | 0 | −0.0009 | −0.33243 | −0.32844 | 0.38857 |
| 20 | 0.60299 | −0.08439 | −0.35351 | −0.28189 | 0.434581 | −0.385 | −0.73094 | −0.6762 |
| 21 | 0.151932 | −0.04669 | −0.47751 | 0.002604 | 0.537381 | −0.00567 | −0.16216 | −0.182205 |
| 22 | 0.31492 | 0.18192 | −0.3046 | −0.37766 | 0.008083 | −0.20462 | −0.19482 | −0.23413 |
| 23 | 0.421401 | 0.18192 | −0.17169 | 0.144835 | 0.260384 | −0.15718 | −0.35868 | −0.46065 |
| 24 | 0.35647 | −0.15452 | 0.226561 | 0.255988 | 0.023404 | −0.46672 | −0.3653 | 0.270348 |
| Hour | Bus 26 | Bus 27 | Bus 28 | Bus 29 | Bus 30 | Bus 31 | Bus 32 | Bus 33 |
| 1 | 0.428738 | −0.01673 | −0.2551 | 0.502791 | 0.237749 | 0.0241 | 0.16671 | 0.110723 |
| 2 | 0.313738 | 0.048147 | −0.28766 | 0.440024 | −0.08471 | −0.0522 | 0.032277 | −0.21656 |
| 3 | 0.394222 | 0.268914 | −0.51718 | 0.043121 | 0.096542 | 0.274971 | −0.08428 | 0.180439 |
| 4 | 0.438966 | 0.036082 | −0.44733 | 0.153678 | −0.46993 | −0.30151 | −0.2651 | 0.047526 |
| 5 | 0.443398 | −0.13357 | −0.54546 | −0.01295 | 0.197977 | 0.103994 | −0.17329 | 0.320062 |
| 6 | 0.38228 | −0.42829 | −0.53531 | −0.0517 | −0.27115 | 0.158869 | −0.04302 | 0.11763 |
| 7 | 0.490751 | 0.177673 | 0 | −0.1409 | −0.01322 | 00 | −0.26453 | 0.117637 |
| 8 | 0.350049 | 0 | 0 | 0.109954 | 0 | 0.169267 | 0 | 0.401753 |
| 9 | 0.408608 | 0 | −0.52508 | 0.085141 | 0 | −0.02846 | −0.1121 | −0.56215 |
| 10 | 0.386839 | 0 | −0.2563 | −0.0905 | 0 | 0.177404 | −0.10418 | −0.1031 |
| 11 | 0.227575 | 0.161259 | −0.17463 | 0.090592 | −0.17413 | −0.10196 | −0.09633 | 0.218871 |
| 12 | 0 | −0.07162 | −0.48442 | 0 | −0.19635 | −0.11147 | 0.340564 | −0.05679 |
| 13 | 0 | −0.42522 | −0.67722 | 0.228503 | −0.21542 | −0.31411 | 0.131029 | 0.094435 |
| 14 | 0.547113 | −0.03325 | −0.29095 | 0.201797 | 0 | 0.330721 | −0.099 | −0.03332 |
| 15 | 0.127924 | 0 | −0.19762 | −0.03345 | 0 | 0.136872 | 0.13808 | −0.31831 |
| 16 | 0.467619 | 0 | −0.31258 | −0.31073 | 0.056218 | 0 | −0.36914 | −0.07377 |
| 17 | 0.377401 | −0.14891 | 0 | −0.02462 | 0.207091 | 0 | 0 | −0.08038 |
| 18 | 0.35931 | 0.006437 | 0 | −0.19014 | 0.270689 | −0.05019 | 0.406462 | 0 |
| 19 | 0.365355 | −0.16547 | −0.54107 | 0.248037 | 0 | −0.29154 | −0.02945 | −0.22178 |
| 20 | 0.56139 | 0.060062 | −0.35307 | −0.16436 | 0 | 0.0627286 | 0.078289 | 0.1006 |
| 21 | 0.327704 | 0.055049 | −0.67088 | 0.401693 | −0.26853 | 0.05126 | 0.21737 | 0.023826 |
| 22 | 0.695965 | −0.2506 | −0.56763 | 0.053874 | −0.34784 | 0.022541 | 0.161653 | 0.209788 |
| 23 | 0.449066 | 0.012106 | −0.55343 | 0.206588 | 0 | 0.05905 | −0.32029 | 0.064532 |
| 24 | 0.111256 | −0.59539 | −0.05267 | 0.392084 | −0.30073 | 0.072399 | −0.10285 | −0.08514 |
Disclaimer/Publisher’s Note: The statements, opinions and data contained in all publications are solely those of the individual author(s) and contributor(s) and not of MDPI and/or the editor(s). MDPI and/or the editor(s) disclaim responsibility for any injury to people or property resulting from any ideas, methods, instructions or products referred to in the content. |
© 2023 by the authors. Licensee MDPI, Basel, Switzerland. This article is an open access article distributed under the terms and conditions of the Creative Commons Attribution (CC BY) license (https://creativecommons.org/licenses/by/4.0/).
Share and Cite
Doosti, R.; Rezazadeh, A.; Sedighizadeh, M. Power and Energy Management Strategies for a Microgrid with the Presence of Electric Vehicles and CAES Considering the Uncertainty of Resources. Processes 2023, 11, 1156. https://doi.org/10.3390/pr11041156
Doosti R, Rezazadeh A, Sedighizadeh M. Power and Energy Management Strategies for a Microgrid with the Presence of Electric Vehicles and CAES Considering the Uncertainty of Resources. Processes. 2023; 11(4):1156. https://doi.org/10.3390/pr11041156
Chicago/Turabian StyleDoosti, Reza, Alireza Rezazadeh, and Mostafa Sedighizadeh. 2023. "Power and Energy Management Strategies for a Microgrid with the Presence of Electric Vehicles and CAES Considering the Uncertainty of Resources" Processes 11, no. 4: 1156. https://doi.org/10.3390/pr11041156