
Effect of Rosehip Powder Addition on Dough Extensographic, Amylographic and Rheofermentographic Properties and Sensory Attributes of Bread

Abstract
: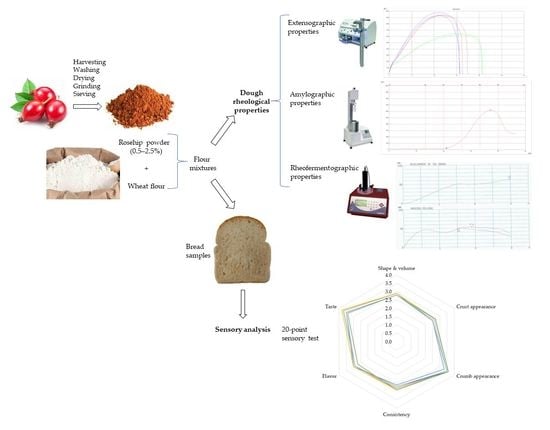
1. Introduction
2. Materials and Methods
2.1. Materials
2.2. WF-Rp Mixtures Preparation
2.3. Extensographic Measurements
2.4. Amylographic Measurements
2.5. Rheofermentographic Measurements
2.6. Breadmaking Procedure
2.7. Sensory Analysis
2.8. Statistical Analysis
3. Results and Discussion
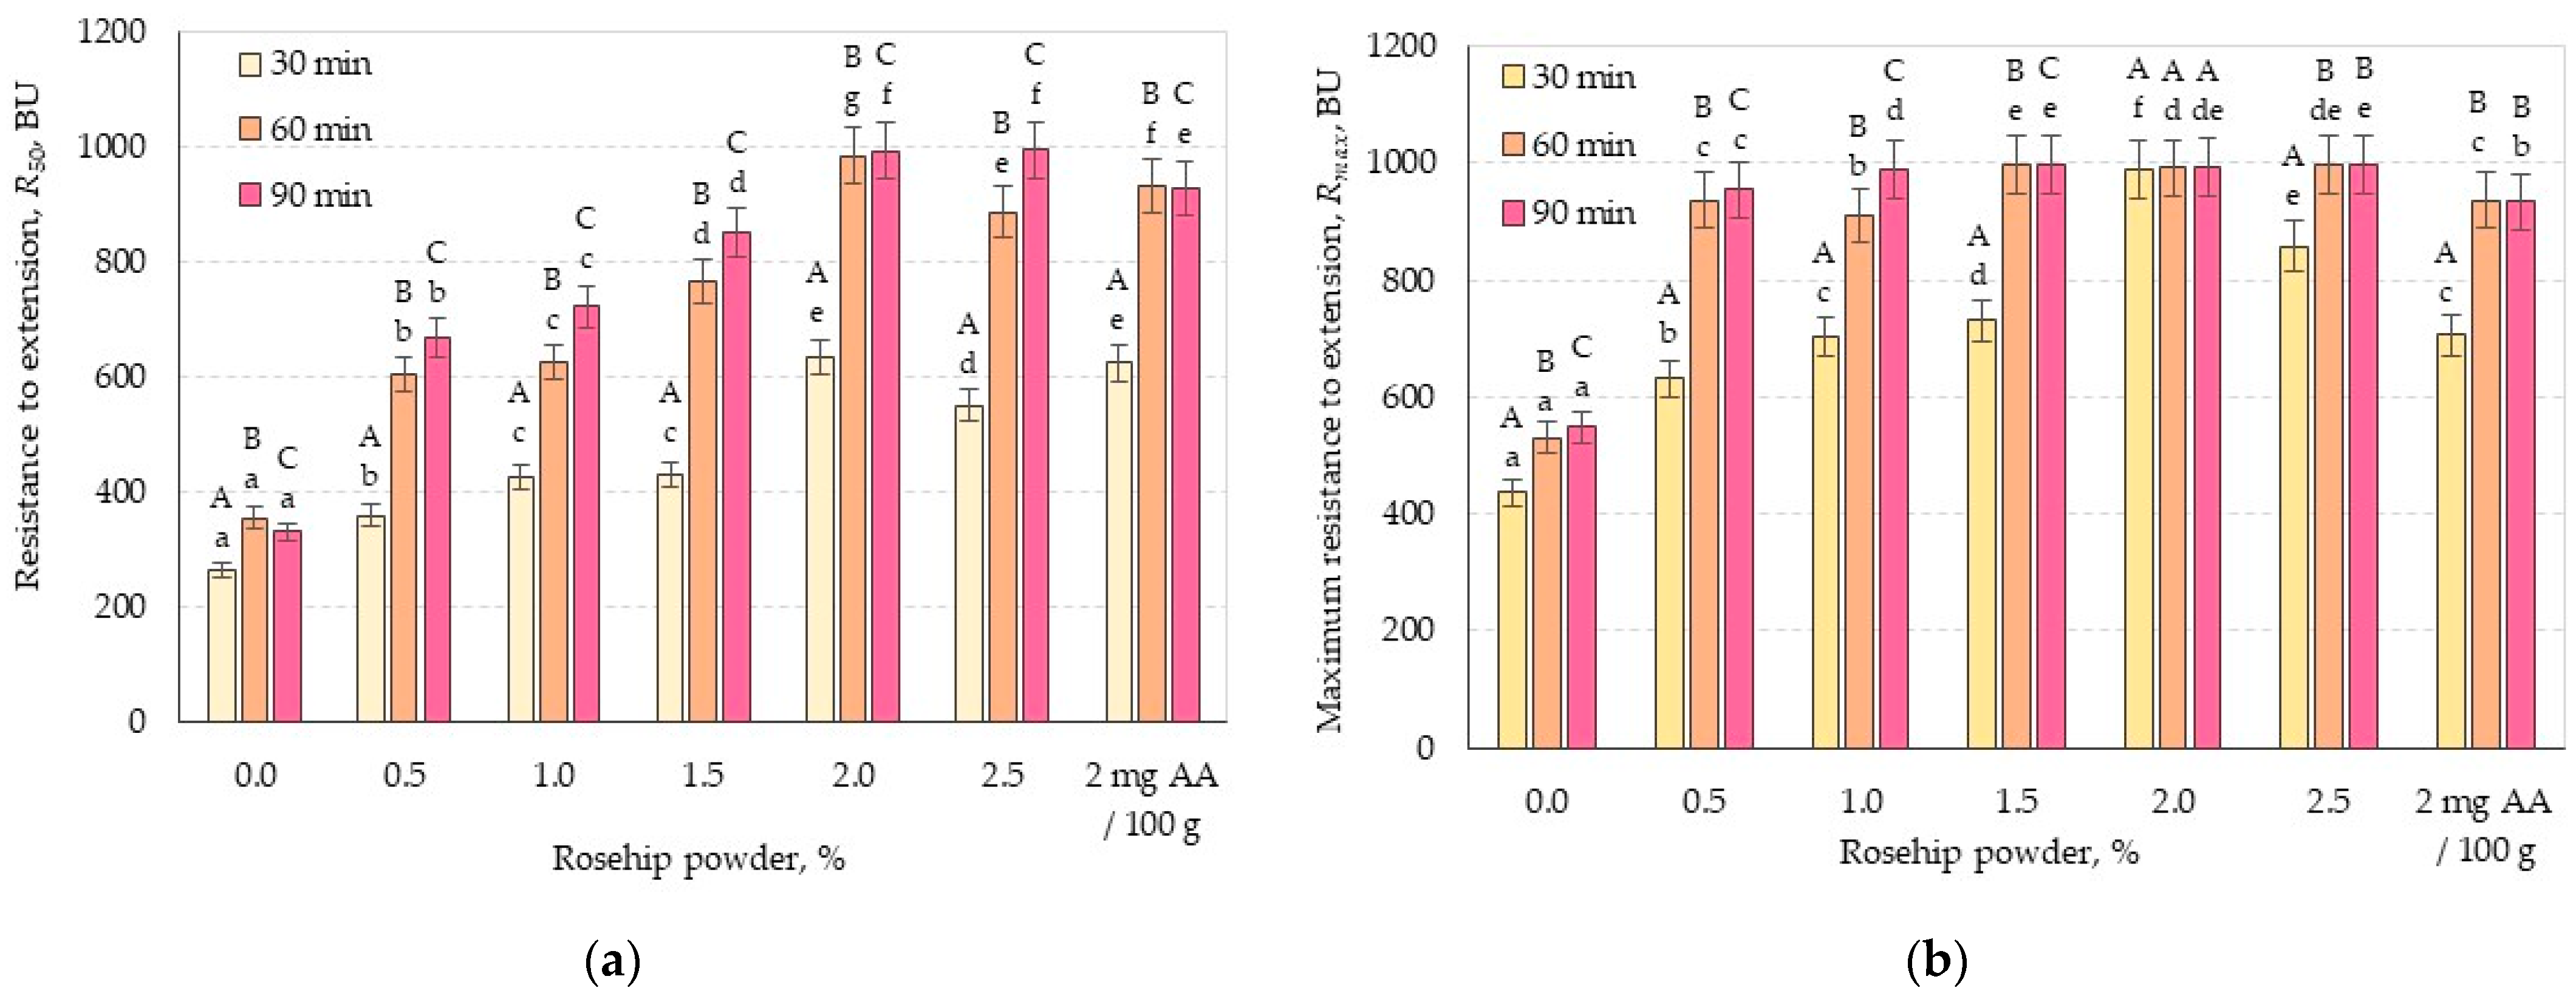
3.1. Extensographic Properties
3.1.1. Resistance to Extension
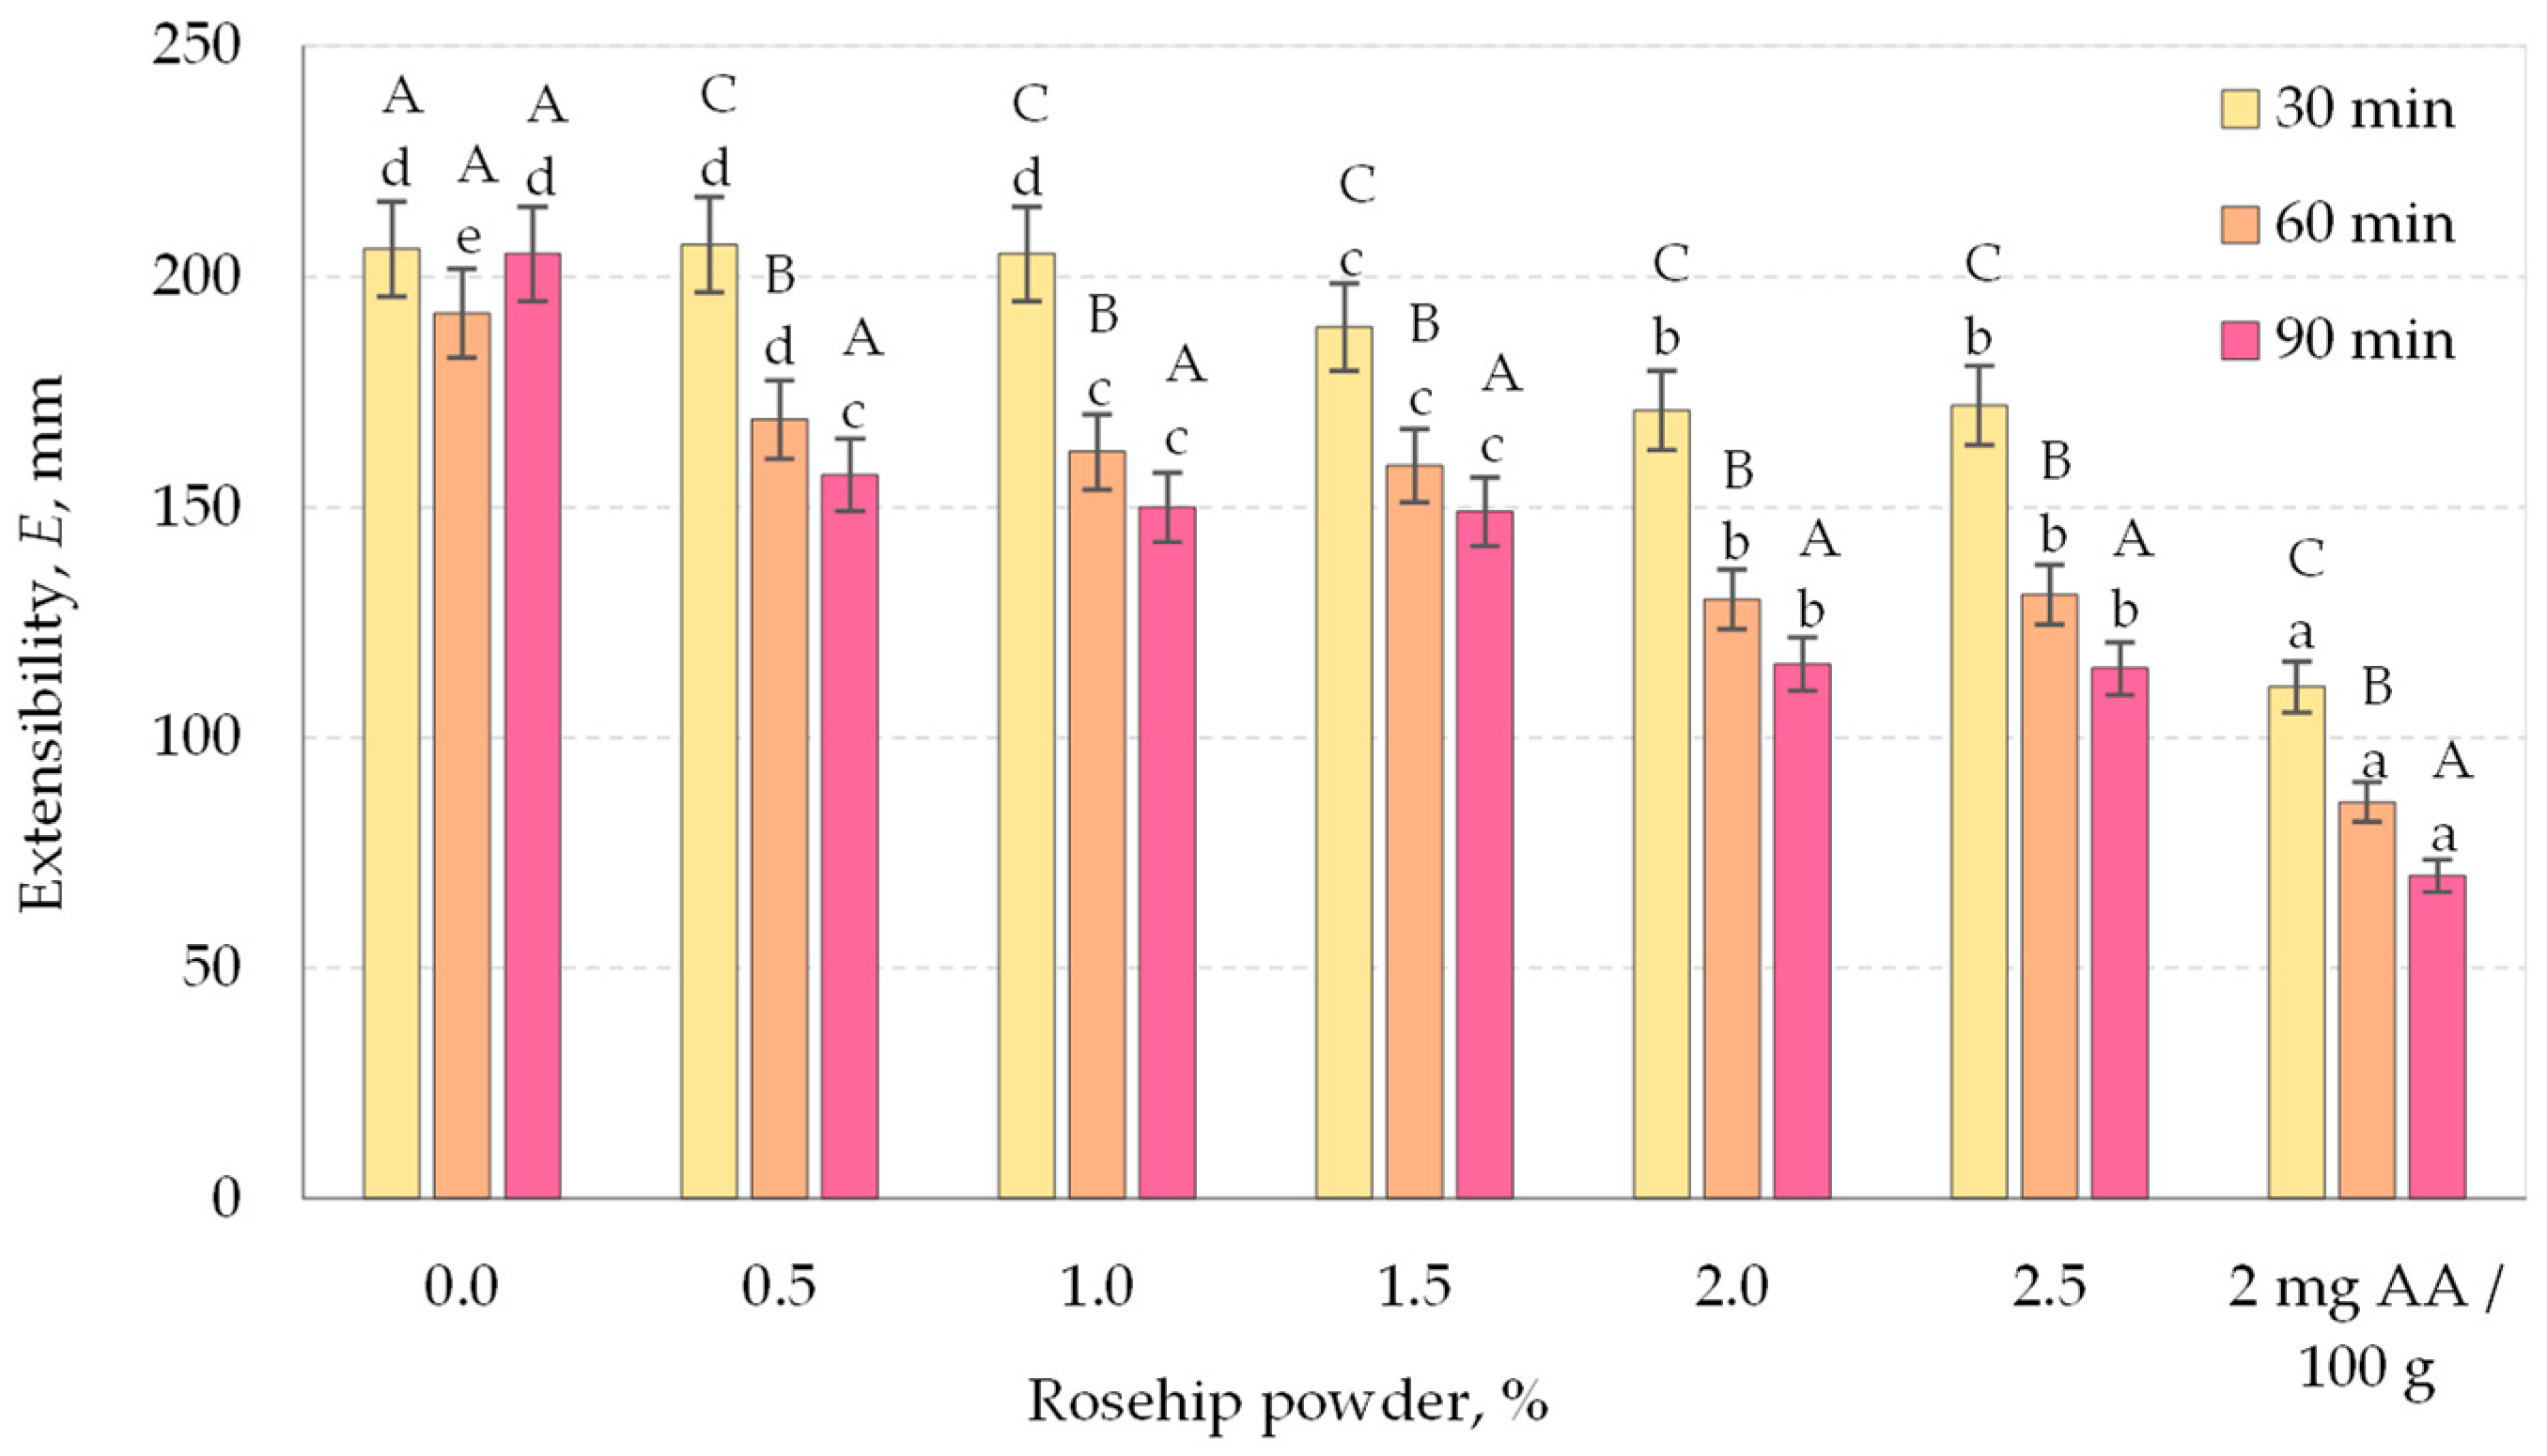
3.1.2. Extensibility
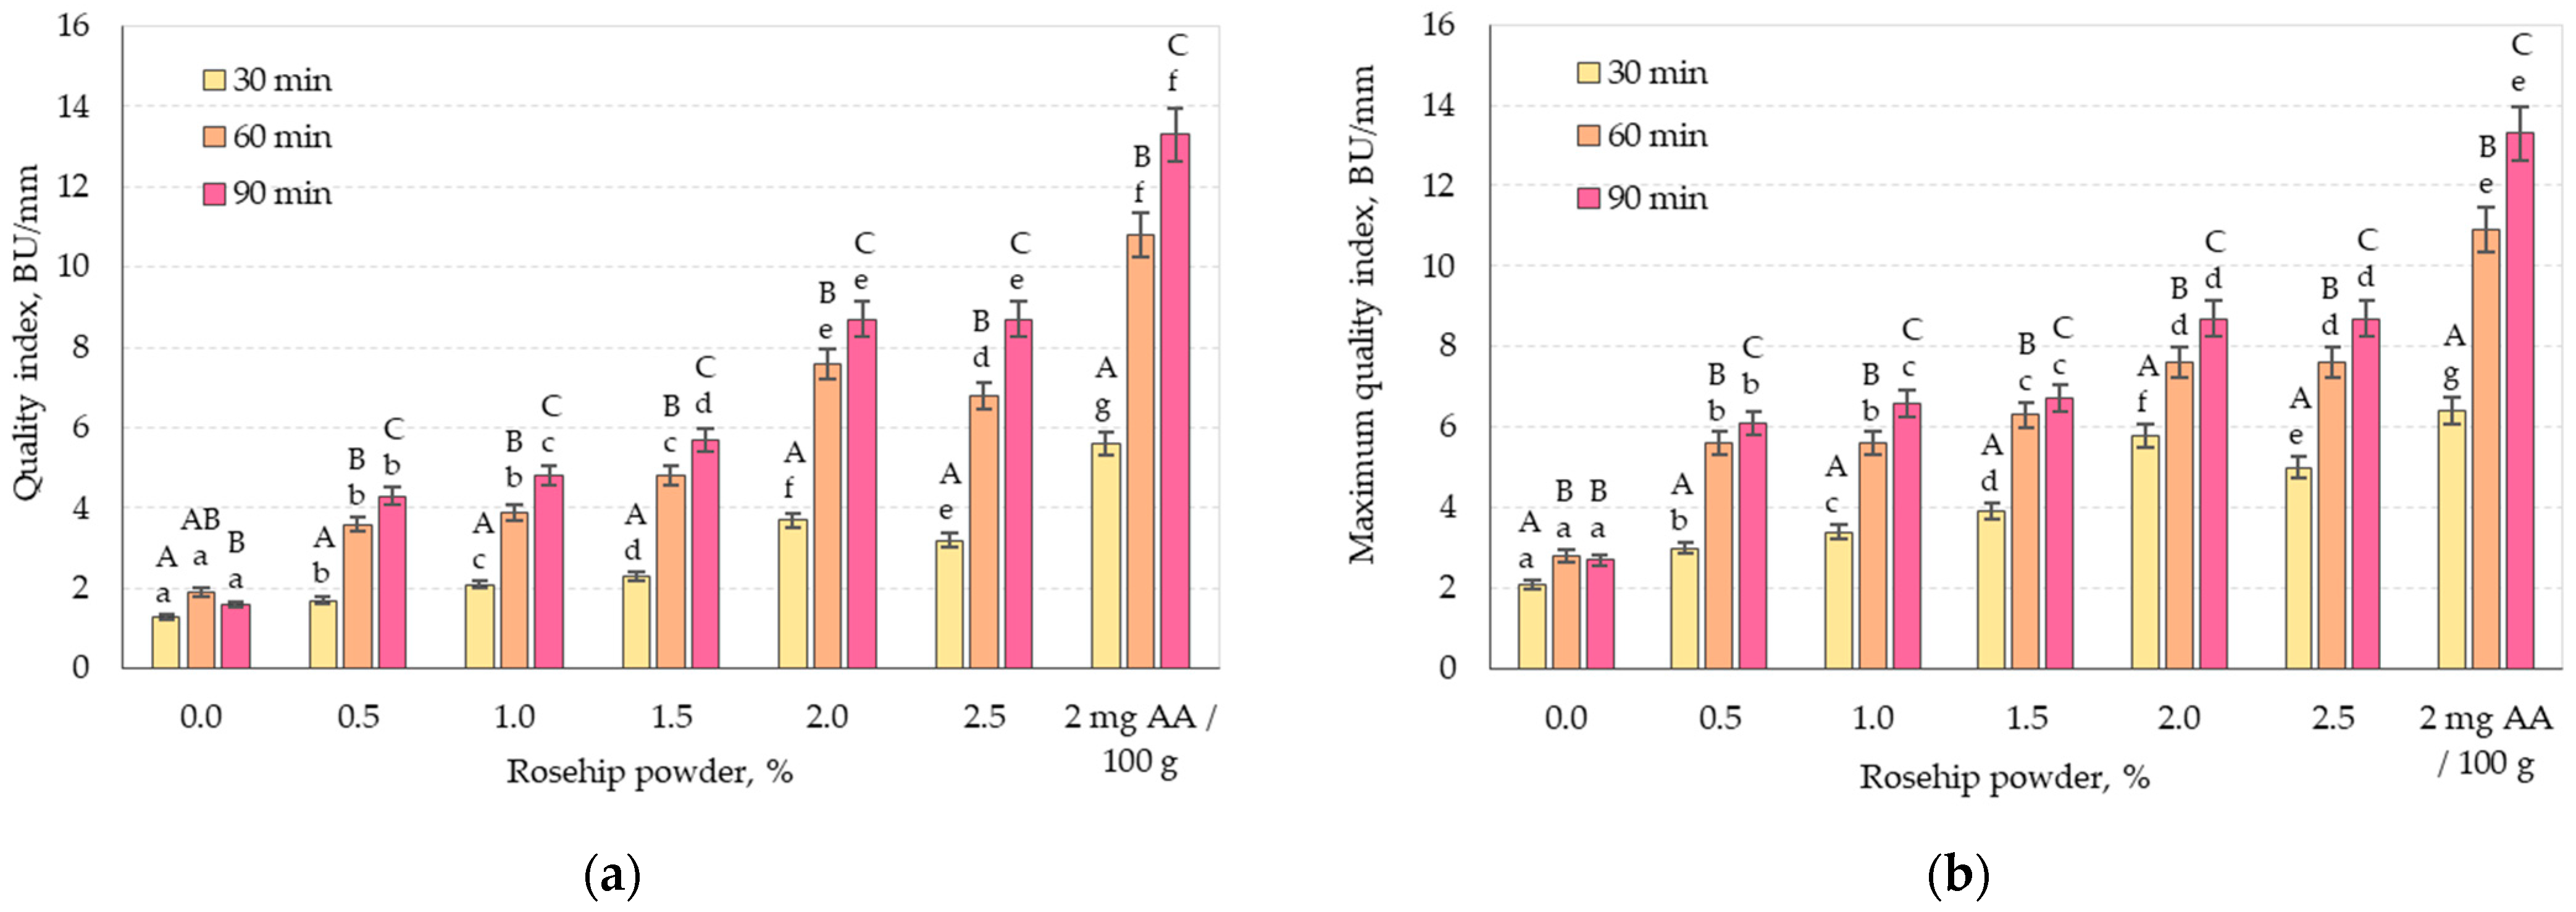
3.1.3. Ratio Numbers
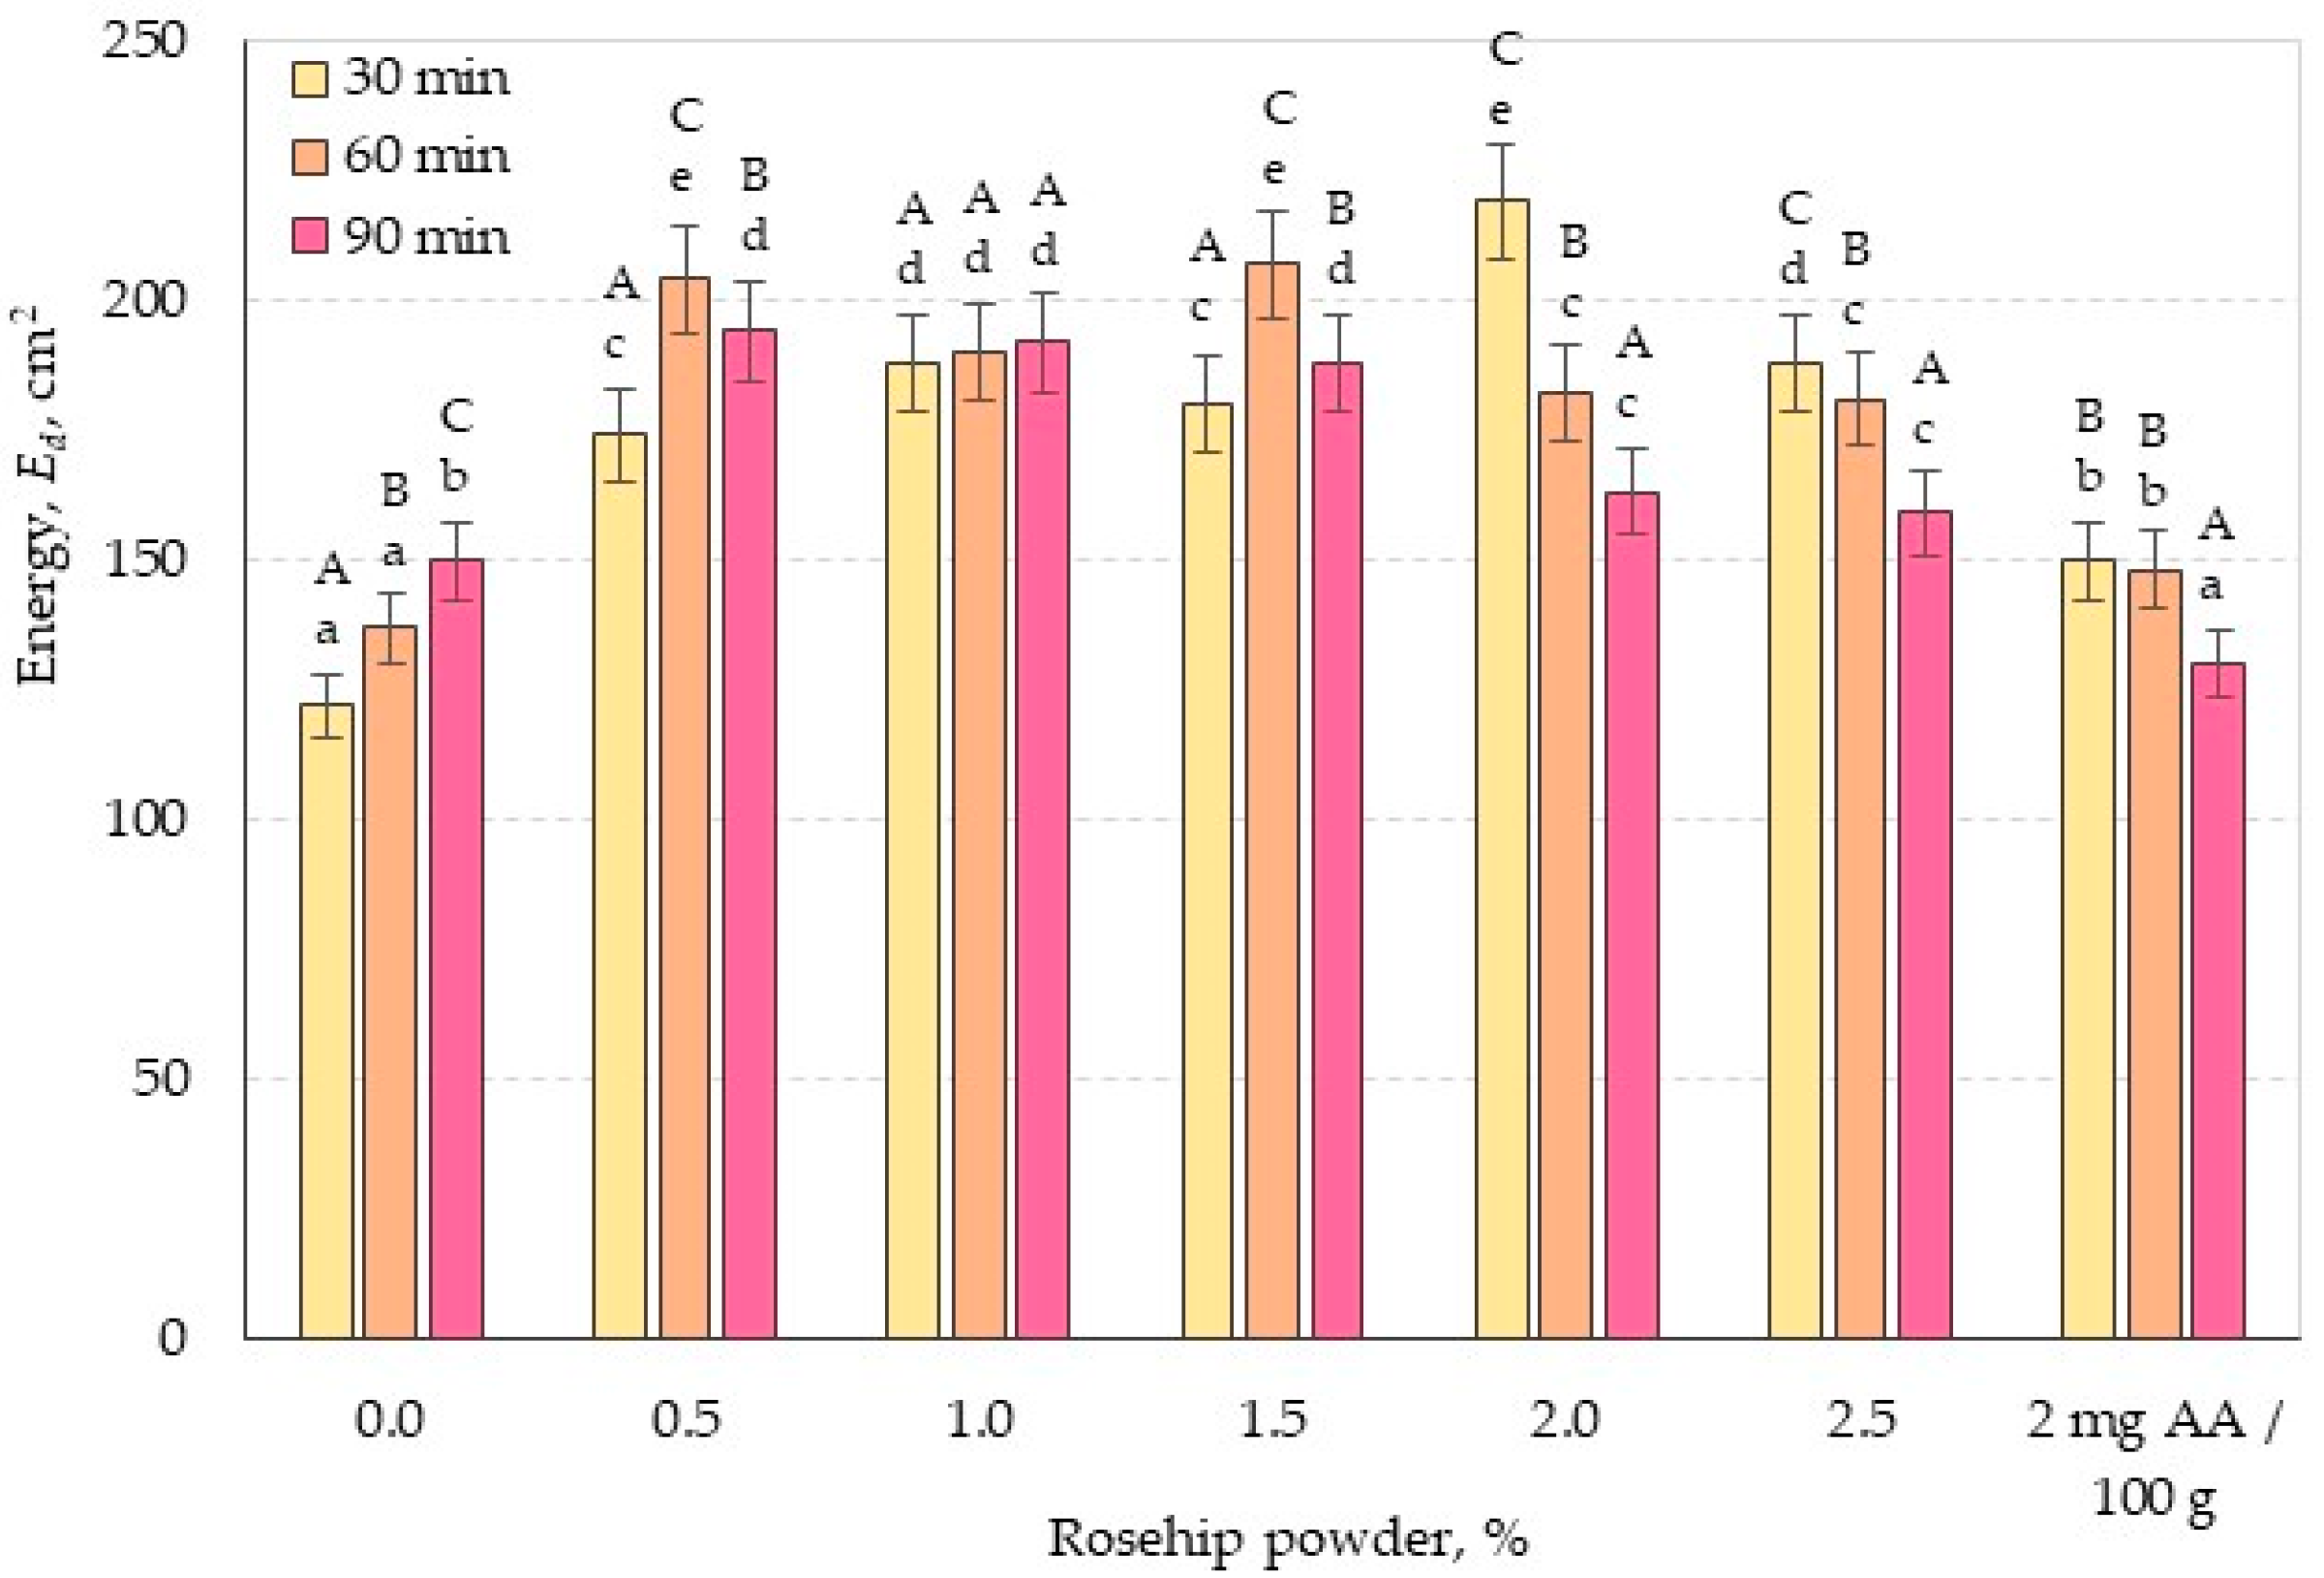
3.1.4. Dough Energy
3.2. Amylographic Properties
3.3. Rheofermetographic Properties
3.3.1. Properties from the Dough Development Curve
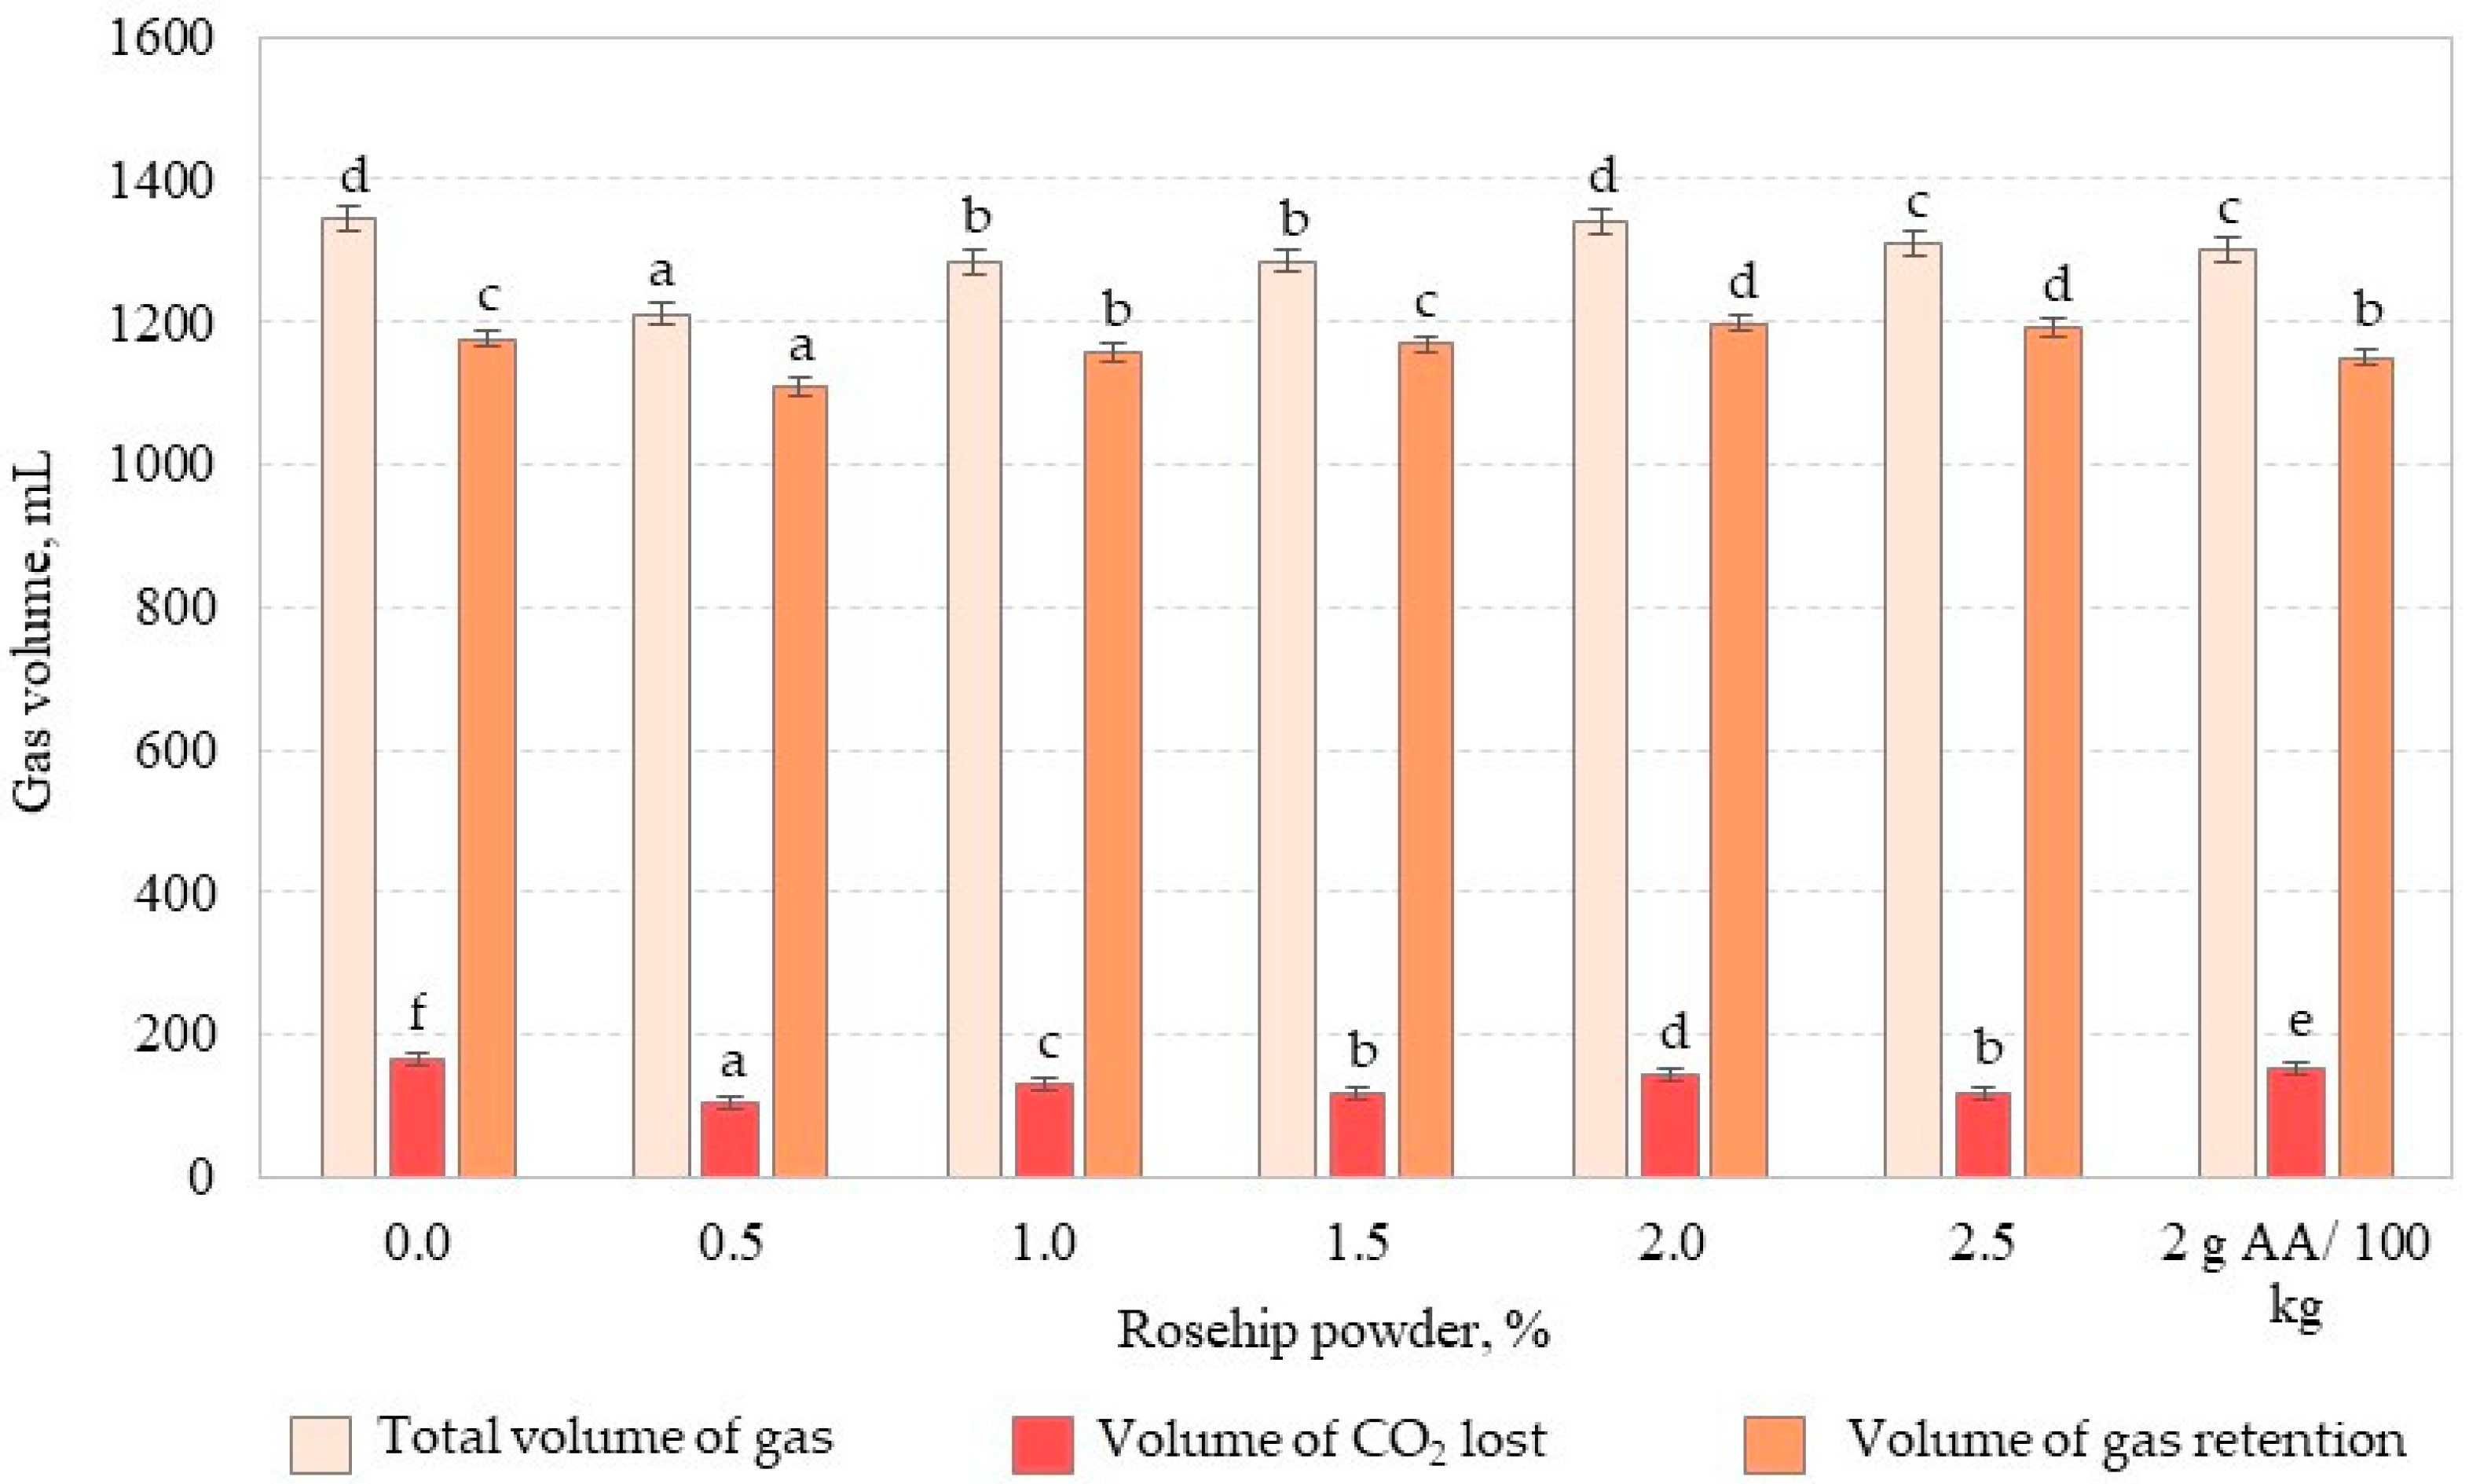
3.3.2. Properties from the Gas Production Curve
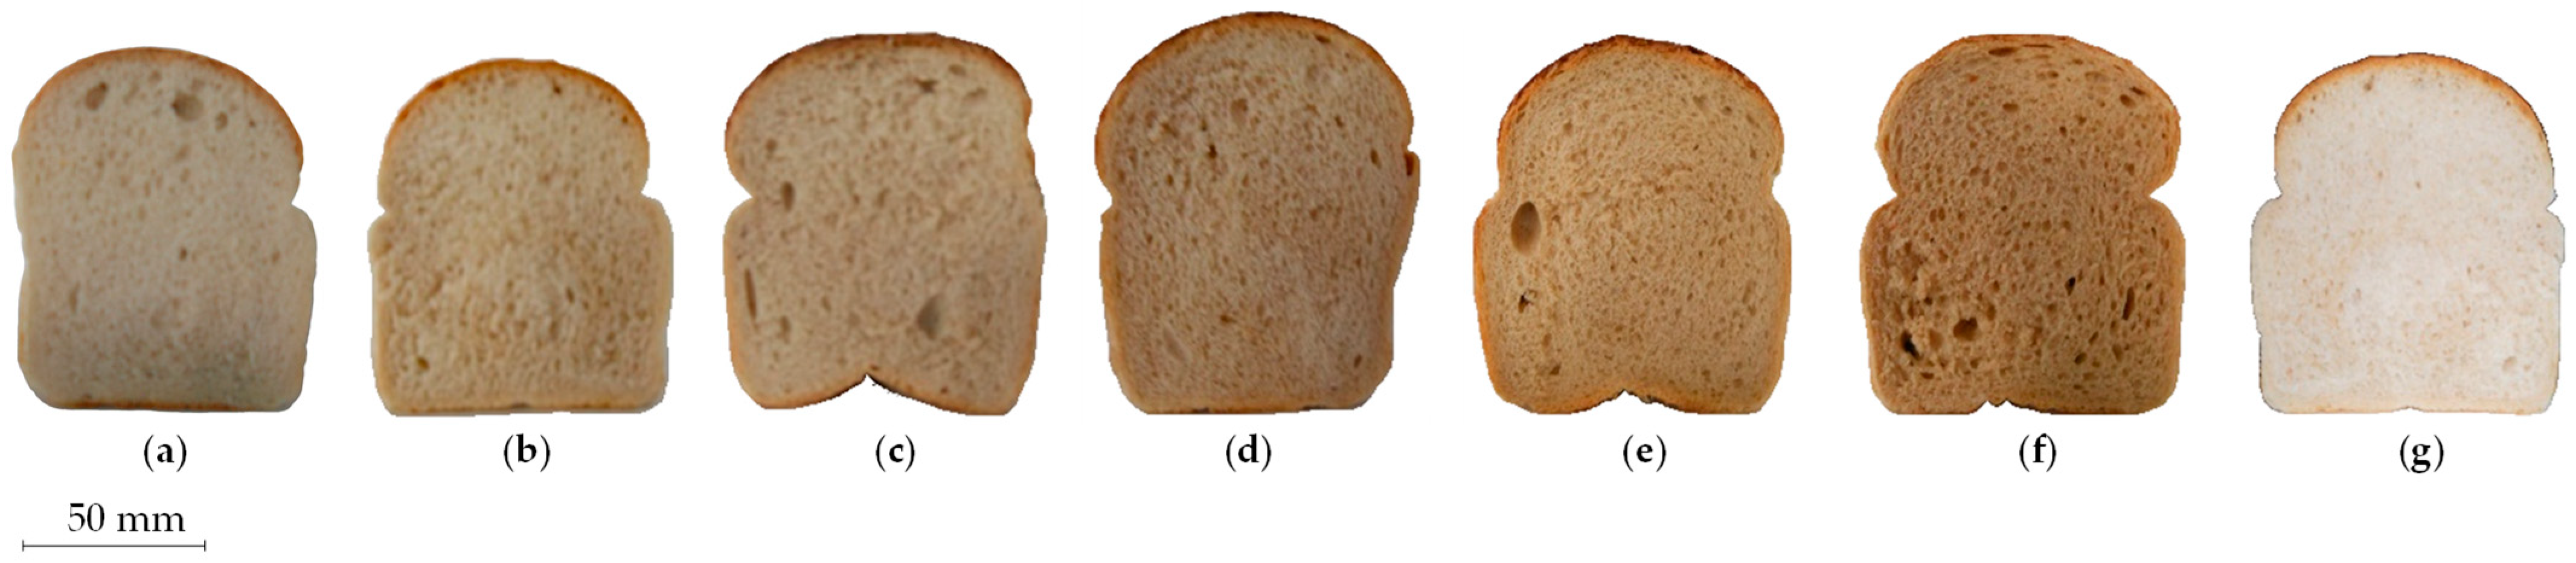
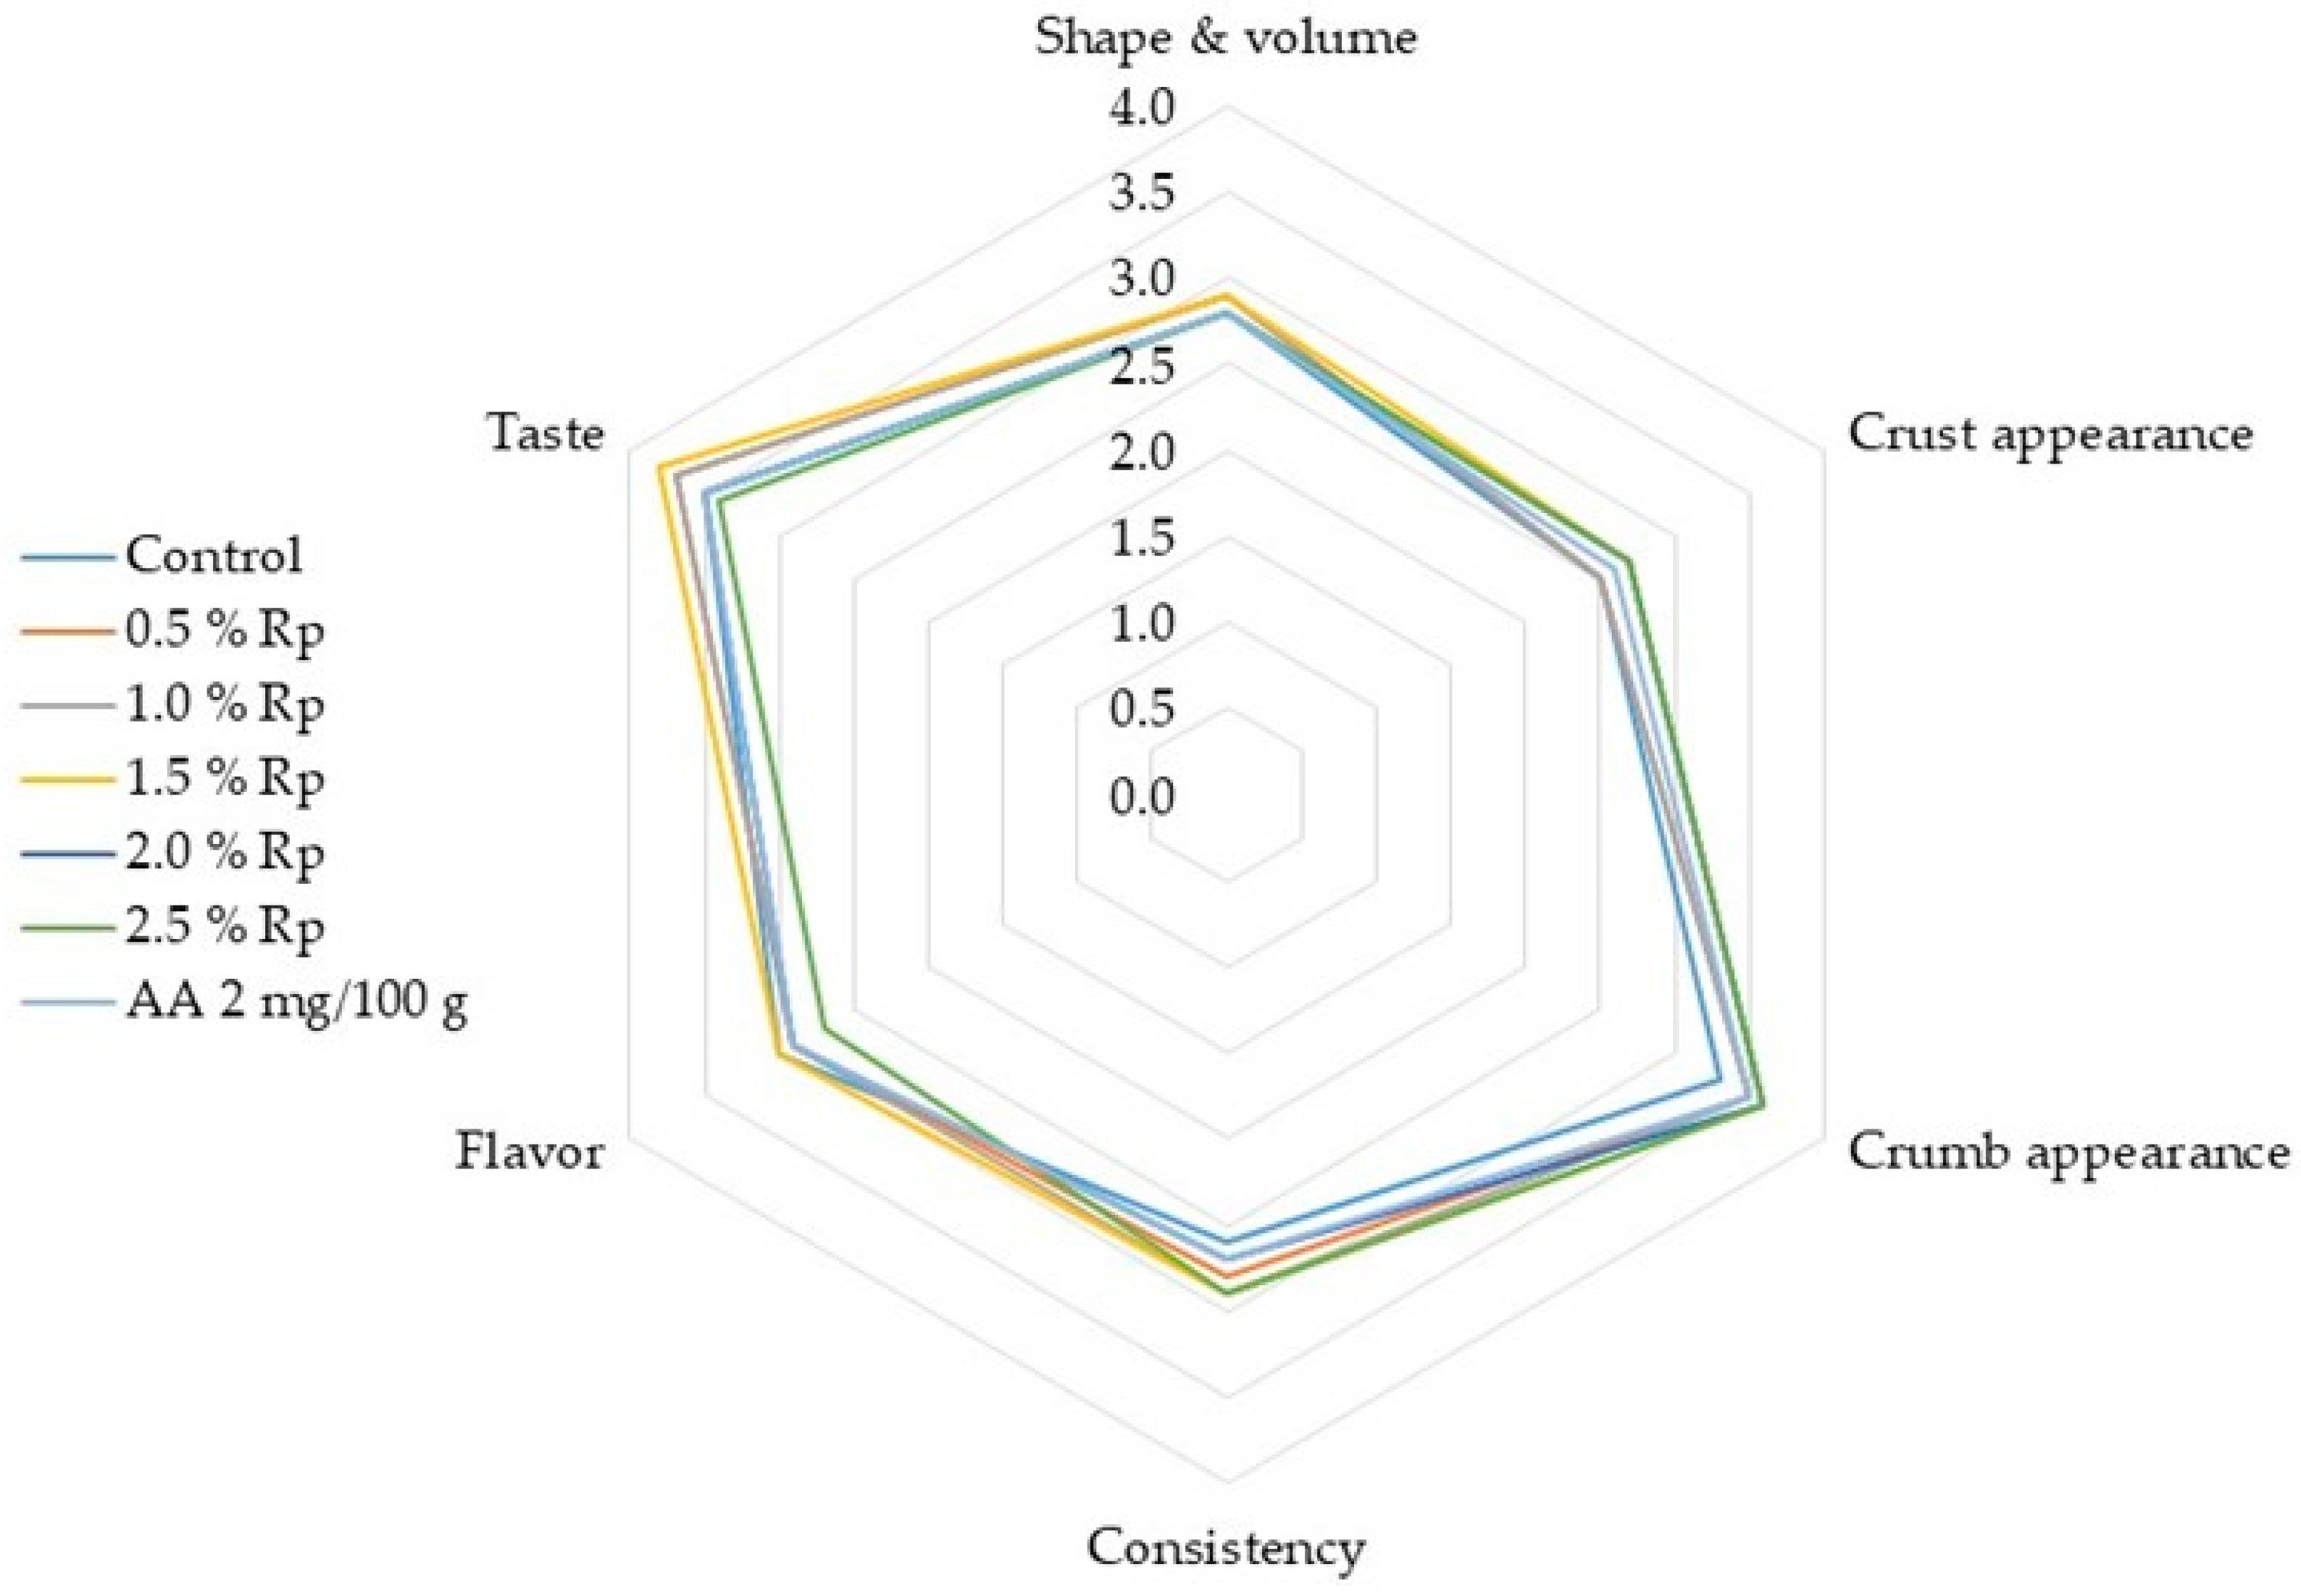
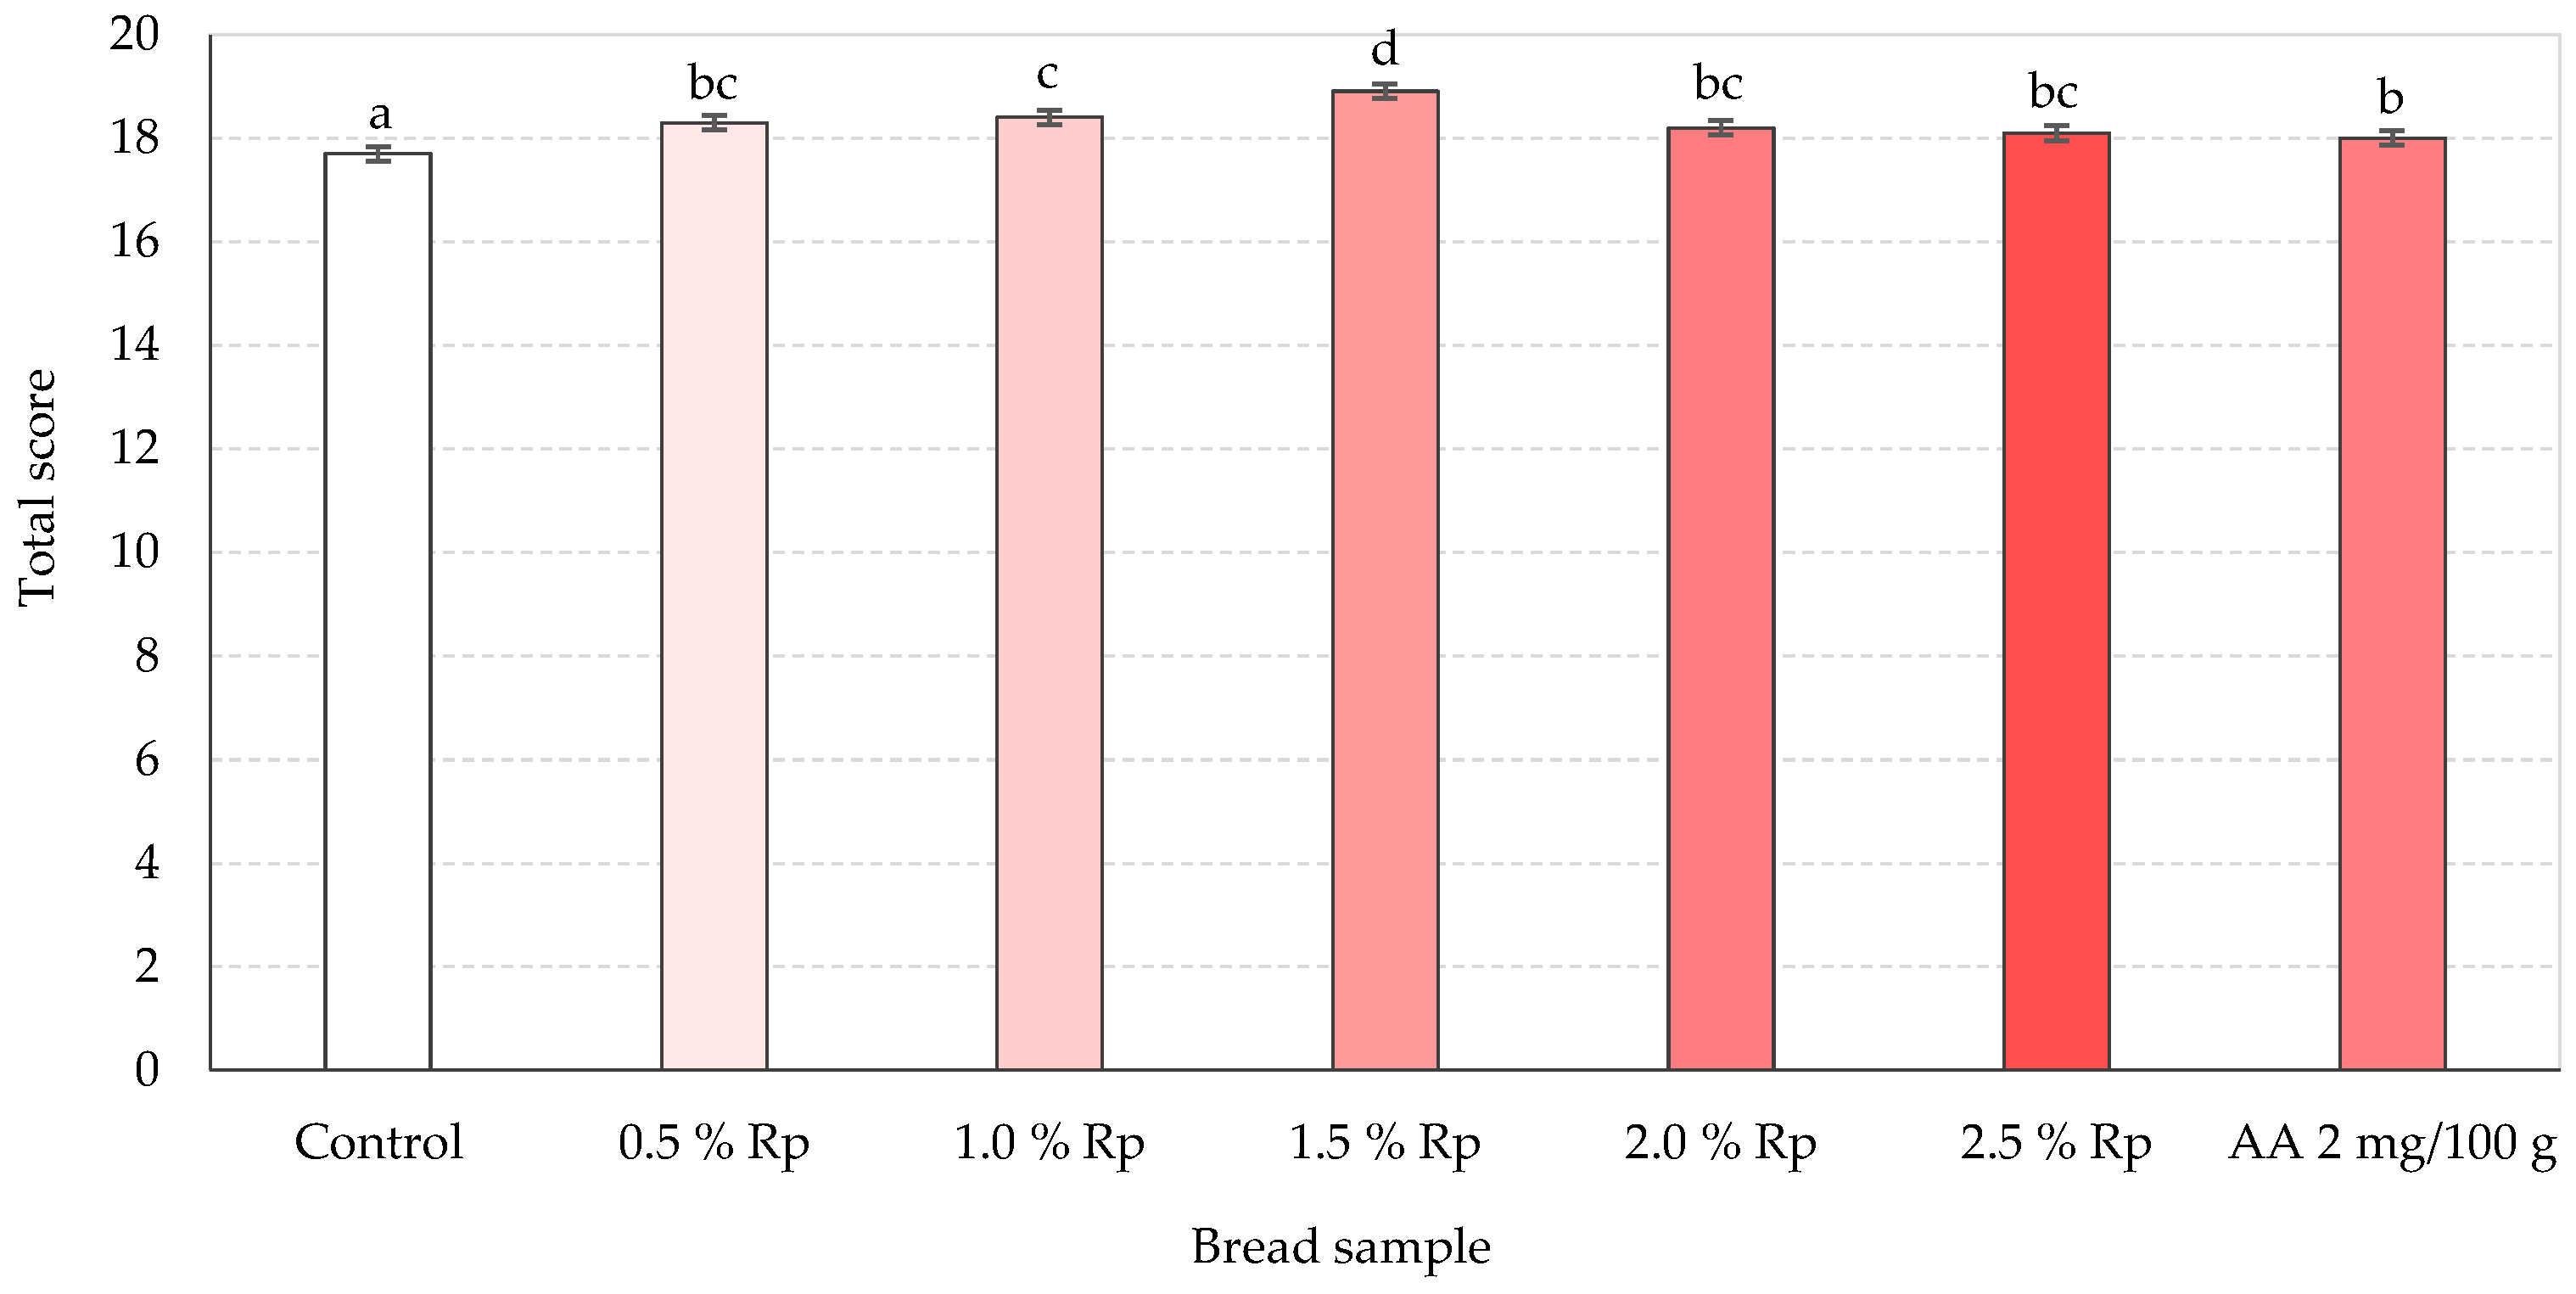
3.4. Sensory Analysis of Bread
4. Conclusions
5. Patents
Author Contributions
Funding
Institutional Review Board Statement
Data Availability Statement
Acknowledgments
Conflicts of Interest
References
- Smirnoff, N. Ascorbic acid metabolism and functions: A comparison of plants and mammals. Free Radic. Biol. Med. 2018, 122, 116–129. [Google Scholar] [CrossRef]
- Hon, S.L.; Vitamin, C. Encyclopedia of Toxicology, 3rd ed.; Wexler, P., Ed.; Elsevier: Amsterdam, The Netherlands; Academic Press: London, UK, 2014; Volume 4, pp. 962–963. [Google Scholar]
- Chang, S.K.; Ismail, A.; Daud, Z.A.M. Ascorbic Acid: Properties, Determination and Uses. In Encyclopedia of Food and Health; Caballero, B., Finglas, P.M., Toldrá, F., Eds.; Elsevier: Amsterdam, The Netherlands; Academic Press: Oxford, UK, 2016; pp. 275–284. [Google Scholar]
- Carr, A.C.; Vissers, M.C.M. Synthetic or food-derived vitamin C—Are they equally bioavailable? Nutrients 2013, 5, 4284–4304. [Google Scholar] [CrossRef] [Green Version]
- Verbruggen, R. Food additives in the European Union. In Food Additives, 2nd ed.; Branen, A.L., Davidson, P.M., Salminen, S., Thorngate, J.H., III, Eds.; Marcel Dekker: New York, NY, USA, 2002; pp. 109–197. [Google Scholar]
- Commission Regulation (EU) No 1129/2011 of 11 November 2011 amending Annex II to Regulation (EC) No 1333/2008 of the European Parliament and of the Council by establishing a Union list of food additives. Off. J. Eur. Union 2011, L295, 1–177. Available online: https://eur-lex.europa.eu/legal-content/EN/TXT/PDF/?uri=CELEX:32011R1129&from=EN (accessed on 17 March 2023).
- US Food and Drug Administration. Food Additive Status List. 2012. Available online: https://web.archive.org/web/20120117060614/https://www.fda.gov/Food/FoodIngredientsPackaging/FoodAdditives/FoodAdditiveListings/ucm091048.htm (accessed on 17 March 2023).
- Health Canada. List of Permitted Preservatives (Lists of Permitted Food Additives). Government of Canada. 2006. Available online: https://www.canada.ca/en/health-canada/services/food-nutrition/food-safety/food-additives/lists-permitted/11-preservatives.html (accessed on 17 March 2023).
- Australia New Zealand Food Standards Code–Revocation and Transitional Variation 2015 (Application A1101–Commencement of Dietary Fibre Claim Provisions–Consequential). Commonwealth of Australia Gazette. 2015, FSC 99. Available online: https://www.legislation.gov.au/Details/F2015L01391 (accessed on 17 March 2023).
- Duarte, A.; Caixeirinho, D.; Miguel, M.G.; Sustelo, V.; Nunes, C.; Mendes, M.; Marreiros, A. Vitamin C content of citrus from conventional versus organic farming systems. Acta Hortic. 2010, 868, 389–394. [Google Scholar] [CrossRef]
- US NIH ODS.; Vitamin, C. Fact Sheet for Health Professionals. Office of Dietary Supplements, US National Institutes of Health. 26 March 2021. Available online: https://ods.od.nih.gov/factsheets/VitaminC-HealthProfessional/ (accessed on 12 October 2022).
- USDA National Nutrient Database for Standard Reference Legacy: Vitamin C. United States Department of Agriculture, Agricultural Research Service. 2018. Available online: https://www.nal.usda.gov/sites/www.nal.usda.gov/files/vitamin_c.pdf (accessed on 12 October 2022).
- Cauvain, S.P. Improving the texture of bread. In Texture in Food; Kilcast, D., Ed.; CRC Press: Boca Raton, FL, USA, 2004; Volume 2, pp. 432–450. [Google Scholar] [CrossRef]
- Wieser, H. The use of redox agents in breadmaking. In Breadmaking: Improving Quality, 2nd ed.; Cauvain, S.P., Ed.; Woodhead Publishing: Oxford, UK, 2012; pp. 447–469. [Google Scholar]
- Belitz, H.-D.; Grosch, W.; Schieberle, P. Food Chemistry, 4th ed.; Springer: Berlin/Heidelberg, Germany, 2009; pp. 716–718. [Google Scholar]
- Campbel, G.M.; Martin, P.J. Bread aeration and dough rheology: An introduction. In Breadmaking: Improving Quality, 2nd ed.; Cauvain, S.P., Ed.; Woodhead Publishing: Oxford, UK, 2012; pp. 299–336. [Google Scholar]
- Vidit, G.; Roshan, D. Ascorbic Acid Market. Global Opportunity Analysis and Industry Forecast, 2021–2031. Report Code: A07444. Allied Market Research, 2022, 370 Pages. Available online: https://www.alliedmarketresearch.com/ascorbic-acid-market-A07444, (accessed on 18 March 2023).
- Ascorbic acid, L-(300). Food Additive Details. GSFA Online. Codex Alimentarius, FAO/WHO Food Standards. 2021. Available online: https://www.fao.org/gsfaonline/additives/details.html?d-3988876-o=2&id=241 (accessed on 18 March 2023).
- Mesías, F.J.; Martín, A.; Hernández, A. Consumers’ growing appetite for natural foods: Perceptions towards the use of natural preservatives in fresh fruit. Food Res. Int. 2021, 150 Pt A, 110749. [Google Scholar] [CrossRef]
- Allende, A.; Tomás-Barberán, F.A.; Gil, M.I. Minimal processing for healthy traditional foods. Trends Food Sci. Technol. 2006, 17, 513–519. [Google Scholar] [CrossRef]
- Lavilla, M.; Gayán, E. Consumer acceptance and marketing of foods processed through emerging technologies. In Innovative Technologies for Food Preservation; Barba, F.J., Sant’Ana, A.S., Orlien, V., Koubaa, M., Eds.; Elsevier: Amsterdam, The Netherlands; Academic Press: London, UK, 2018; pp. 233–253. [Google Scholar] [CrossRef]
- Sahi, S.S. Applications of natural ingredients in baked goods. In Natural Food Additives, Ingredients and Flavourings; Baines, D., Seal, R., Eds.; Woodhead Publishing: Oxford, UK, 2012; pp. 318–332. [Google Scholar]
- Bourekoua, H.; Gawlik-Dziki, U.; Rozył, R.; Zidoune, M.N.; Dziki, D. Acerola fruit as a natural antioxidant ingredient for gluten-free bread: An approach to improve bread quality. Food Sci. Technol. 2020, 27, 13–21. [Google Scholar] [CrossRef]
- Franco, M.; Belorio, M.; Gómez, M. Assessing acerola powder as Substitute for Ascorbic Acid as a Bread Improver. Foods 2022, 11, 1366. [Google Scholar] [CrossRef]
- Ropciuc, S.; Cenușă, R.; Căpriță, R.; Crețescu, I. Study on the ascorbic acid content of rose hip fruit depending on stationary conditions. Sci. Pap. Anim. Sci. Biotechnol. 2011, 44, 129–132. [Google Scholar]
- Worrall, R. Rosy Outlook for Sweet Briar. New Zealand Geographic, April–June 1998, Issue 038. Available online: https://www.nzgeo.com/stories/rosy-outlook-for-sweet-briar/ (accessed on 14 October 2022).
- Chrubasik, C.; Roufogalis, B.D.; Müller-Ladner, U.; Chrubasik, S. A systematic review on the Rosa canina effect and efficacy profiles. Phytother. Res. 2008, 22, 725–733. [Google Scholar] [CrossRef]
- Ziegler, S.J.; Meier, B.; Sticher, O. Fast and Selective Assay of l-Ascorbic Acid in Rose Hips by RP-HPLC Coupled with Electrochemical and/or Spectrophotometric Detection. Planta Med. 1986, 52, 383–387. [Google Scholar] [CrossRef]
- Czyzowska, A.; Klewicka, E.; Pogorzelski, E.; Nowak, A. Polyphenols, vitamin C and antioxidant activity in wines from Rosa canina L. and Rosa rugosa Thunb. J. Food Compost. Anal. 2014, 39, 62–68. [Google Scholar] [CrossRef]
- SwedishFood. Rosehips. Nypon. 2021. Available online: https://www.swedishfood.com/rosehips (accessed on 14 October 2022).
- Winther, K.; Campbell-Tofte, J. Bioactive ingredients of rose hip (Rosa canina L.) with special reference to antioxidative and anti-inflammatory properties–in vitro studies. Botanics 2015, 5, 1–13. [Google Scholar] [CrossRef] [Green Version]
- Marstrand, K.; Campbell-Tofte, J. The role of rose hip (Rosa canina L.) powder in alleviating arthritis pain and inflammation–part II animal and human studies. Botanics 2016, 6, 59–73. [Google Scholar] [CrossRef] [Green Version]
- Hua, L. Beauty-Maintaining Bread by Utilizing Roses and Chayote and Preparation Method Thereof. Patent CN 105341087 A, 24 February 2016. [Google Scholar]
- Kaiyun, L. Eye-Protecting Anti-Radiation Pineapple Bread and Preparation Method Thereof. Patent CN 105341087 A, 13 April 2016. [Google Scholar]
- Krolevets, A.A. Bread Production Method Comprising Nanostructured Extract of Dry Rosehip. Patent No. RU-2630250-C1, 9 September 2017. [Google Scholar]
- Martínez-Romero, D.; Zapata, P.J.; Guillén, F.; Paladines, D.; Castillo, S.; Valero, D.; Serrano, M. The addition of rosehip oil to Aloe gels improves their properties as postharvest coatings for maintaining quality in plum. Food Chem. 2017, 217, 585–592. [Google Scholar] [CrossRef]
- Paladines, D.; Martínez-Romero, D. The addition of rosehip oil improves the beneficial effect of Aloe vera gel on delaying ripening and maintaining postharvest quality of several stonefruit. Postharvest Biol. Technol. 2014, 92, 23–28. [Google Scholar] [CrossRef]
- Vartolomei, N.; Turtoi, M. The influence of the addition of rosehip powder to wheat flour on the dough farinographic properties and bread physico-chemical characteristics. Appl. Sci. 2021, 11, 12035. [Google Scholar] [CrossRef]
- AOAC. Official Methods of Analysis of the Association of Official Analytical Chemists, 15th ed.; Methods 920.183, 967.21, 983.23; Helrich, K., Ed.; Association of Official Analytical Chemists: Arlington, VA, USA, 1990. [Google Scholar]
- AACC International. Approved Methods of Analysis, 11th ed.; Methods 22-10, 46-11.02, 54-21, 54-10.01; American Association of Cereal Chemists International: St. Paul, MN, USA, 2000. [Google Scholar]
- ASRO. Romanian Standards Catalog for Cereal and Milling Products Analysis; SR 90:2007, SR 91:2007, SR EN ISO 20483:2014, SR EN ISO 21415-1:2007, SR EN ISO 21415-3:2007, SR EN ISO 2171:2010, SR EN ISO 5530-2:2015, and SR EN ISO 7973:2016; ASRO: Bucharest, Romania, 2018. [Google Scholar]
- Extensograph-E. Reliably Determine Rheological Dough Properties via Stretch Resistance Using the Extensograph-E. Available online: https://www.brabender.com/en/food/products/rheometers/inspect-rheological-dough-properties-extensograph-e/ (accessed on 18 October 2022).
- Amylograph-E Brabender. Show Enzyme Activity in Flours and Whole Grains–Amylograph-E. 2020. Available online: https://www.brabender.com/en/food/products/viscometers/analyse-enzyme-activity-amylograph-e/ (accessed on 18 October 2022).
- Rheo F4 2020. Rheo F4. Measures the Characteristics of Dough during Proofing. Available online: https://assets-global.website-files.com/60248b8cec3ecd4ab5d61984/606bbfb36a107c5906627926_RHEOF4_leaflet_EN_20170511.pdf (accessed on 11 March 2023).
- Gómez, M.; Ronda, F.; Blanco, C.; Caballero, P.; Apesteguia, A. Effect of dietary fibre on dough rheology and bread quality. Eur. Food Res. Technol. 2003, 216, 51–56. [Google Scholar] [CrossRef]
- Koletta, P.; Irakli, M.; Papageorgiou, M.; Skendi, A. Physicochemical and technological properties of highly enriched wheat breads with wholegrain non wheat flours. J. Cereal Sci. 2014, 60, 561–568. [Google Scholar] [CrossRef]
- Mohammed, I.; Ahmeda, A.R.; Senge, B. Dough rheology and bread quality of wheat-chickpea flour blends. Ind. Crops Prod. 2012, 36, 196–202. [Google Scholar] [CrossRef]
- Nikolić, N.; Saka, M.; Mastilovi, J. Effect of buckwheat flour addition to wheat flour on acylglycerols and fatty acids composition and rheology properties. LWT-Food Sci. Technol. 2011, 44, 650–655. [Google Scholar] [CrossRef]
- Maforimbo, E.; Nguyen, M.; Skurray, G.R. The effect of L-ascorbic acid on the rheological properties of soy–wheat dough: A comparison of raw and physically modified soy flours. J. Food Eng. 2006, 72, 339–345. [Google Scholar] [CrossRef]
- Yoo, K.H.; Kim, S.O.; Yoo, S.J.; Oh, H.T.; Ham, S.S. Dough characteristics and biological effects of mixed flour of buckwheat and wheat. J. Korean Soc. Food Sci. Nutr. 2007, 2, 143–148. [Google Scholar] [CrossRef]
- Gomathi, G.K.; Parameshwari, S. Evaluation of buckwheat flour addition on the sensory, nutritional and materialistic properties analysis of Indian flat bread. Mater. Today 2022, 66 Pt 3, 988–995. [Google Scholar] [CrossRef]
- Nikolić, N.Č.; Stojanović Krasić, M.; Šimurina, O.; Cakić, S.; Mitrović, J.; Pešić, M.; Karabegović, I. Regression analysis in examination the rheology properties of dough from wheat and Boletus edulis flour. J. Food Compost Anal. 2022, 115, 105022. [Google Scholar] [CrossRef]
- Cao, Y.; Zhang, H.; Yang, Z.; Zhang, M.; Guo, P.; Li, L.H. Influence of the fermentation time and potato pulp addition on the technological properties and volatile compounds of wheat dough and steamed bread. LWT-Food Sci. Technol. 2020, 128, e109377. [Google Scholar] [CrossRef]
- Huang, W.; Kim, Y.; Li, X.; Rayas-Duarte, P. Rheofermentometer parameters and bread specific volume of frozen sweet dough influenced by ingredients and dough mixing temperature. J. Cereal Sci. 2008, 48, 639–646. [Google Scholar] [CrossRef]
- Pasqualone, A.; Caponio, F.; Pagani, M.A.; Summo, C.; Paradiso, V.M. Effect of salt reduction on quality and acceptability of durum wheat bread. Food Chem. 2019, 289, 575–581. [Google Scholar] [CrossRef]
- Hackenberg, S.; Verheyen, C.; Jekle, M.; Becker, T. Effect of mechanically modified wheat flour on dough fermentation properties and bread quality. Eur. Food Res. Technol. 2017, 243, 287–296. [Google Scholar] [CrossRef]
- Sun, X.; Ma, L.; Zhong, X.; Liang, J. Potential of raw and fermented maize gluten feed in bread making: Assess of dough rheological properties and bread quality. LWT-Food Sci. Technol. 2022, 162, 113482. [Google Scholar] [CrossRef]
- Liu, X.-L.; Mu, T.-H.; Sun, H.-N.; Zhang, M.; Chen, J.-W. Influence of potato flour on dough rheological properties and quality of steamed bread. J. Integr. Agric. 2016, 15, 2666–2676. [Google Scholar] [CrossRef] [Green Version]
- Xu, X.; Xu, Y.; Wang, N.; Zhou, Y. Effects of superfine grinding of bran on the properties of dough and qualities of steamed bread. J. Cereal Sci. 2018, 81, 76–82. [Google Scholar] [CrossRef]
- Steffolani, E.; Martinez, M.M.; Leon, A.E.; Gomez, M. Effect of pre-hydration of chia (Salvia hispanica L.), seeds and flour on the quality of wheat flour breads. LWT-Food Sci. Technol. 2015, 61, 401–406. [Google Scholar] [CrossRef]
- Mohammed, M.I.O.; Mustafa, A.I.; Osman, G.A.M. Evaluation of wheat breads supplements with Teff (Eragrostis tef ZUCC. Trotter) grain flour. Aust. J. Crop Sci. 2009, 3, 207–212. [Google Scholar]
- Alaunyte, I.; Stojceska, V.; Plunkett, A.; Ainsworth, P.; Derbyshire, E. Improving the quality of nutrient-rich Teff (Eragrostis tef) breads by combination of enzymes in straight dough and sourdough breadmaking. J. Cereal Sci. 2012, 55, 22–30. [Google Scholar] [CrossRef]
- Ben-Fayed, E.; Ainsworth, P.; Stojceska, V. The incorporation of Teff (Eragrostis tef) in bread-making technology. Cereal Food World 2008, 53, A84. [Google Scholar]
- Bernaert, N.; Debonne, E.; De Leyn, I.; Van Droogenbroeck, B.; Van Bockstaele, F. Incorporation of leek powder (Allium ampeloprasum var. porrum) in wheat bread: Technological implications, shelf life and sensory evaluation. LW-Food Sci. Technol. 2022, 153, 112517. [Google Scholar] [CrossRef]
- Özcan, M.M. The effect of ginger (Zingiber officinale) powders at different concentrations on bioactive compounds, antioxidant activity, phenolic constituents, nutrients and sensory characteristics of wheat bread. Int. J. Gastron. Food Sci. 2022, 28, 100532. [Google Scholar] [CrossRef]


| Parameters | Temperature at the Beginning of Gelatinization, T °C | Maximum Temperature of Gelatinization, Tmax °C | Maximum Gelatinization Viscosity, AU | |
|---|---|---|---|---|
| Samples | ||||
| WF (Control) | 61.00 ± 0,00 a | 84.25 ± 0.00 a | 556.0 ± 2.0 b | |
| WF–Rp 0.5% w/w | 61.50 ± 0.10 a,b | 85.70 ± 0.10 b | 617.5 ± 1.5 d | |
| WF–Rp 1.0% w/w | 61.55 ± 0.05 a,b | 85.85 ± 0.00 b,c | 584.0 ± 1.0 c | |
| WF–Rp 1.5% w/w | 61.60 ± 0.10 b | 86.05 ± 0.00 b,c,d | 566.0 ± 2.0 b | |
| WF–Rp 2.0% w/w | 62.35 ± 0.05 c | 86.25 ± 0.00 c,d | 537.5 ± 1.5 a | |
| WF–Rp 2.5% w/w | 62.90 ± 0.10 c | 86.40 ± 0.00 d | 534.0 ± 1.0 a | |
| WF–AA 2 mg/100 g | 61.55 ± 0.05 a,b | 86.10 ± 0.10 b,c,d | 573.5 ± 2.5 e | |
| Parameters | Maximum Development (Dough Height), Hm, mm | Time Required to Reach Hm, T1, min | Time of Relative Stabilization | Final Height of the Dough, h, mm | Percentage of Fall (Hm − h)/Hm, % | ||
|---|---|---|---|---|---|---|---|
| Samples | T2, min | T2′, min | |||||
| WF (Control) | 64.6 ± 0.14 b | 96 ± 1.41 a | 147 ± 1.41 | 67 ± 1.41 | 60.9 ± 0.14 a | 5.73 ± 0.01 c | |
| WF–Rp 0.5% w/w | 61.4 ± 0.14 a | 178 ± 1.41 b | – | – | 61.3 ± 0.14 a | 0.16 ± 0.00 a | |
| WF–Rp 1.0% w/w | 65.3 ± 0.14 b | 178 ± 1.41 b | – | – | 65.2 ± 0.14 b | 0.15 ± 0.00 a | |
| WF–Rp 1.5% w/w | 70.0 ± 0.14 e | 180 ± 0.00 b | – | – | 70.0 ± 0.14 d | 0 a | |
| WF–Rp 2.0% w/w | 71.3 ± 0.14 f | 180 ± 0.00 b | – | – | 71.3 ± 0.14 e | 0 a | |
| WF–Rp 2.5% w/w | 69.1 ± 0.14 d | 180 ± 0.00 b | – | – | 69.1 ± 0.14 d | 0 a | |
| WF–AA 2 mg/100 g | 67.6 ± 0.14 c | 176 ± 1.41 b | – | – | 66.5 ± 0.28 c | 1.63 ± 0.21 b | |
| Parameters | Maximum Height, Hm′, mm | Time to Reach Hm′, T1′, min | Time of Porosity Appearance, Tx, min | Coefficient of Retention, CR, % | |
|---|---|---|---|---|---|
| Samples | |||||
| WF (Control) | 53.6 ± 0.14 a | 100 ± 1.41 a | 69.0 ± 1.41 a | 87,6 ± 0.08 b | |
| WF–Rp 0.5% w/w | 53.9 ± 0.14 a,b | 114 ± 1.41 b,c | 71.0 ± 1.41 a,b | 91.5 ± 0.09 f | |
| WF–Rp 1.0% w/w | 55.4 ± 0.14 b,c | 115 ± 2.10 b,c | 79.0 ± 0.70 c | 90.0 ± 0.21 d | |
| WF–Rp 1.5% w/w | 56.7 ± 0.14 c,d | 118 ± 0.70 c,d | 83.0 ± 0.00 c | 91.0 ± 0.01 e | |
| WF–Rp 2.0% w/w | 57.5 ± 0.70 d | 121 ± 0.70 d,e | 78.0 ± 1.41 b,c | 89.3 ± 0.08 c | |
| WF–Rp 2.5% w/w | 56.6 ± 0.14 c,d | 123 ± 1.41 d,e | 76.5 ± 2.10 a,b,c | 91.0 ± 0.09 e | |
| WF–AA 2 mg/100 g | 54.9 ± 0.14 a,b | 119 ± 0.70 c,d | 80.0 ± 1.41 c | 88.3 ± 0.07 a | |
Disclaimer/Publisher’s Note: The statements, opinions and data contained in all publications are solely those of the individual author(s) and contributor(s) and not of MDPI and/or the editor(s). MDPI and/or the editor(s) disclaim responsibility for any injury to people or property resulting from any ideas, methods, instructions or products referred to in the content. |
© 2023 by the authors. Licensee MDPI, Basel, Switzerland. This article is an open access article distributed under the terms and conditions of the Creative Commons Attribution (CC BY) license (https://creativecommons.org/licenses/by/4.0/).
Share and Cite
Vartolomei, N.; Turtoi, M. Effect of Rosehip Powder Addition on Dough Extensographic, Amylographic and Rheofermentographic Properties and Sensory Attributes of Bread. Processes 2023, 11, 1088. https://doi.org/10.3390/pr11041088
Vartolomei N, Turtoi M. Effect of Rosehip Powder Addition on Dough Extensographic, Amylographic and Rheofermentographic Properties and Sensory Attributes of Bread. Processes. 2023; 11(4):1088. https://doi.org/10.3390/pr11041088
Chicago/Turabian StyleVartolomei, Nicoleta, and Maria Turtoi. 2023. "Effect of Rosehip Powder Addition on Dough Extensographic, Amylographic and Rheofermentographic Properties and Sensory Attributes of Bread" Processes 11, no. 4: 1088. https://doi.org/10.3390/pr11041088