

A Laborer’s Mask-Wearing Behavior Detection Approach in the Manufacturing Field

Department of Industrial Engineering and Management, National Yunlin University of Science and Technology, Yunlin 64002, Taiwan
Processes 2023, 11(4), 1086; https://doi.org/10.3390/pr11041086
Submission received: 27 January 2023
/
Revised: 28 March 2023
/
Accepted: 29 March 2023
/
Published: 4 April 2023
(This article belongs to the Special Issue 10th Anniversary of Processes: Women's Special Issue Series)
Abstract
:Industry 4.0 has considerably advanced multiple manufacturing fields through digitalization and intelligentization. Many technologies, such as supervisory control, data acquisition, and data analytics, have been used widely in manufacturing sites to enhance production efficiency. Therefore, this created a cloud-based anomaly detection module for epidemic prevention at the manufacturing site. Image process technologies, deep learning algorithms, and cloud computing were employed in the proposed module to automatically identify labor anomaly behavior in the manufacturing site and prevent the epidemic. This study used image processing technologies and deep learning to recognize and train the manufacturing site image. Accordingly, the analyzed result could be incorporated into the cloud system using the Message Queuing Telemetry Transport (MQTT) protocol. Therefore, the administrators and laborers can be notified regarding the anomaly behavior. The author used the image data obtained from the cylinder head process site as a data source for DA. As per the experimental results, the proposed method has an accuracy of 90%. Therefore, deep learning algorithms provide a practical approach to anomaly detection for epidemic prevention. Furthermore, this study’s primary contributions are designing an improved approach and connecting the manufacturing site to the cloud side using the proposed module.
1. Introduction
The World Health Organization (WHO) stated that the infected patients might exhibit persistent symptoms known as “Long COVID” [1]. Other studies support this viewpoint; a recent study reported that >20% and 30% of infected patients experience cognitive impairment and fatigue three months after diagnosis, respectively [2]. Note that millions of patients with COVID-19 exhibited long-haul symptoms after infection. Consequently, the “Long COVID” significantly impacts the human power at the manufacturing site. The infected laborers cannot work, and their lingering symptoms obstruct their work even if they have recovered because of chronic health issues. As per the data analysis, 1.6 million recovered patients are not working full-time because their behavior is affected by lingering symptoms [3]. Therefore, the global manufacturing industry suffers from a labor shortage. The International Labour Organization (ILO) assessed the current labor market. It indicated that COVID-19 constrains the global labor market and that the global working hours in the fourth quarter of 2020 declined by 5% [4]. The ILO study discovered that global labor productivity has negative growth in lower- and low-middle-income countries [5]. The COVID-19 epidemic disproportionately harmed low-productivity enterprises, and the epidemic in the first half of 2021 limited the labor market [5]. In 2022, 8.8 million people from the U.S. workforce had to stay home because they became infected or had to care for someone who became infected, as per a report by Statista Inc. Furthermore, the labor market experienced an enormous workforce shortage after the pandemic outbreak [6]. Therefore, labor management is essential for manufacturing sites during a labor shortage because the infected workforce may increase manufacturing costs because of the interrupted manufacturing process.
1.1. Effect of Workplace Safety in the Labor Marketplace
The global labor marketplace experienced an unprecedented, massive labor health crisis during the COVID-19 pandemic. UKONS’s report revealed that the occupation nature significantly contributes to the potential of becoming infected with illness [7]. The data from the U.S. Centers for Disease Control and Prevention (CDC) demonstrated that many other workers, including workers in factories, warehouses, and stores, were infected during the pandemic. Workers initially deemed important are the disproportionately racial or ethnic minorities and those who are paid low wages and cannot work from home. Working in close physical proximity to people may increase the risk of infection [8]. Furthermore, the laborers’ workplaces may be a primary source of epidemic exposure. Laborers may have limited personal protective equipment and must be at the manufacturing site to conduct physical operations. However, the facility design in the workplace needs to adhere to the social distance or the employing labor in an adequately ventilated environment [9,10,11]. Chen et al. discovered that there was a difference in pandemic-related excess mortality in the occupational sector [11]. Furthermore, the laborers who work in agriculture, food, logistics, transportation, manufacturing, and facilities have higher pandemic-related excess mortality than those in the other sectors [11].
Certain studies have reported the importance of epidemic prevention for the enterprise, e.g., a study from Burdorf highlighted that the workplace and living environment are strongly intertwined [8]. Note that personal protection can lower the risk of infection, mitigating the COVID-19 epidemic [7]. Therefore, employers should protect all workers in the workplace, and the protected workers reduce the probability of spreading the virus from work to their communities and homes [7,9]. Furthermore, protecting the workplace can reduce mortality and morbidity, reduce the spread of infection, and then rebuild the economy [9]. A study revealed that increased labor mortality impacts specific occupational sectors in the pandemic, and face-to-face working conditions may influence widespread COVID-19 [11]. The Occupational Safety and Health Administration (OSHA), ILO, and CDC significantly contributed to controlling the spread of COVID-19 and protecting the workers and their workspace [4,5,7,9]. However, the government still needs to fully use public safety authority to mitigate the risk of COVID-19 [9,11], thus leading to employers requesting laborers to follow the guidelines for epidemic prevention becoming more complex. For example, it is challenging for laborers to wear masks and maintain social distancing all day while performing manufacturing at a high-temperature and humidity manufacturing site. Therefore, ensuring a safe workplace through the strict enforcement of health protocols in workplace settings and vaccination is essential for the stable productivity of an enterprise [11]. Furthermore, if the employers have practical enforcement tools and procedures to guarantee compliance, the employer may effectively manage the workspace.
1.2. Anomaly Detection of Epidemic Prevention
Anomaly detection evaluates abnormalities at the early stages of manufacturing and notifies the manager to address this issue. It is considered an efficient concept for determining abnormal events, objects, items, observations, or data that significantly vary from the normal. For Industry 4.0, anomaly detection is essential for enhancing reliability and resiliency in the manufacturing process [12]. Certain studies identify people’s anomaly behavior to prevent a viral pandemic [13,14]. Furthermore, crowd flow [13], abnormal human posture [14], and physiological parameters (e.g., pulse rate, heart rate [15,16]) can be supervised to prevent the spread of the virus or people’s infection. Moreover, data mining, machine learning (ML), and statistical methods are employed to identify these anomalies.
1.3. Applications of the Internet of Things in the Manufacturing Field
Section 1.2 highlights the data analytics (DA) approach applied to anomaly detection. Because the Internet of Things (IoT) is a large platform for implementing various services, DA may be incorporated into developing IoT applications. Furthermore, IoT describes a network of interrelated physical objects, such as machines, device objects, or users, with unique identifiers and the capability to transfer information over a network to realize human-to-machine or machine-to-machine communication. Recently, IoT-related technologies have been deemed to be efficient tools for COVID-19 management [17]. The industrial IoT (IIoT) is the predominant use of the IoT in industrial sectors and applications. Interestingly, 5G communication technology was employed for IIoT communication [18]. Presently, certain researchers employ the DA approach to co-create the value of IIoT. DA is crucial in successfully realizing IoT systems and services [15]. Learning from the manufacturing data is an efficient and economical approach to enabling equipment or management to become intelligent. DA is widely applied in anomaly detection; e.g., deep learning was used to identify anomaly postures [14]. Interestingly, 5G and DA are key technologies that can assist the digital transformation for Industry 4.0. However, in the short term, many manufacturing industries are experiencing an existential shortage of labor crisis and are scrambling to limit the number of infected workers. Certain studies have demonstrated how digital transformation could boost manufacturing resiliency and preparedness while mitigating manufacturing risk [14,19].
The previous section describes the current research background and challenge. This study highlights the significance of anomaly detection, workplace safety, and epidemic prevention. This study assessed how IIoT-related technologies were applied to detect the anomaly objects to resolve the challenges of effectively managing epidemic prevention in the manufacturing site. Furthermore, this study’s objective is expressed in the following two aspects: image DA and IoT system design. First, using a cylinder-head assembly workplace as a case study, image processing and deep learning were used to identify the anomaly image adhering to the standard DA procedure. Then, the author proposed a cloud-automated anomaly detection system (CAADS) that incorporates the supervisory control and data acquisition, visualization, and the analyzed model depending on IIoT-related systems that can use and connect massive important data at the manufacturing site. The study contributions were listed as follows:
- To determine the anomaly events using You Only Look Once (YOLO) and the reinforcement training mechanism to enhance detection accuracy.
- To provide a CAADS to aid anomaly detection.
- To enable an intuitive and economical approach by integrating DA and the system.
In Section 2, we review the literature on industrial image processing; Section 3 outlines the DA techniques, the key ML algorithms, the dataset and evaluation criteria, and the findings of our analyses; Section 4 discusses the system design; and Section 5 concludes this study by discussing its significance.
2. Related Work
This study first explored and highlighted current research efforts for image processing methods and applications to survey the literature related to image processing technologies in manufacturing. Initially, we used the Publish or Perish (PoP) system to acquire all related studies, retrieved 998 relevant studies between 2017 and 2022, and analyzed the time trend and disciplinary distribution of emerging anomaly detection-related topics. Overall, 36,631 total citations of the relevant studies were procured in six years, of which the average citations per year and per paper are 7326.2 and 36.7, respectively. Next, we manually distinguished the studies as per their average and total citations per year and surveyed the relevant papers. “Deep learning”, “additive manufacturing”, “computer vision”, and “internet of things” are the high-frequency keywords for image processing-related topics linked to the manufacturing image issue. Table 1 describes the current approach for manufacturing image data processing. The relevant image processing approach was divided into two types: hardware (e.g., sensor, network transmit, tomography device) and software (e.g., mathematical method, feature extraction, DA). Based on the hardware-related approaches, certain studies have proposed a framework for transmitting images for manufacturing process monitoring and manipulation [20,21]. Du Plessis et al. summarized the X-ray microcomputed tomography employed to analyze additively manufactured parts [22]. From the viewpoint of software-related approaches, the related literature indicates that ML, data mining, mathematical techniques, and deep learning approaches were used to process image data from manufacturing (Table 1). A discrete probability model and the deep autoregressive module were used in image anomaly detection [23] and image compression and convolutional filtering methods to create IIoT [24]. Artificial intelligence has been widely adopted in image processing for manufacturing systems [25]. Nixon and Aguado examined feature extraction to identify the image edge, background, and object [26]. A study surveyed the deep learning approaches to detect image features (e.g., edge and contour) [23]. A survey demonstrated that artificial intelligence and ML approaches in image analytics [27] and deep learning approaches considerably enhanced the efficiency of image mining [28]. Generative adversarial networks (GAN) were employed to visually inspect for anomaly detection [29] and recognize anomalous contaminated image data [30]. Wang et al. discussed the ML approaches and noted the instance of using a convolutional neural network (CNN) to process the image [31]. The framework of the CNN extracts the features of the cell image via a self-learning capability. Furthermore, CNN was employed to evaluate the image, a bi-stream deep CNN-based model to identify a defective image, and a deep CNN to recognize the irregular surface [32,33,34]. Certain studies used a CNN-related approach for target classification; after attaching an image, the related approach can automatically determine whether it belongs to a predetermined category [34]. The deep autoregressive model was applied in the image analytics, and the result showed that the proposed method has good computing performance [35].
Some image process approaches are employed in anomaly detection [33], predictive maintenance [34], production assistance [21], and manufacturing process maintenance [36]. Furthermore, the results revealed that product and equipment images were widely applied in DA for further usage. In summary [32], most results expressed that CNN-related approaches are the core approaches that incentivize research associated with image processing [23]. Furthermore, the abovementioned studies confirmed that deep learning approaches achieve state-of-the-art image processing performance. Furthermore, this study employed the CNN-related approach and the YOLO network to detect the anomaly behavior from image data and developed a cloud system for image application.
3. Materials and Methods
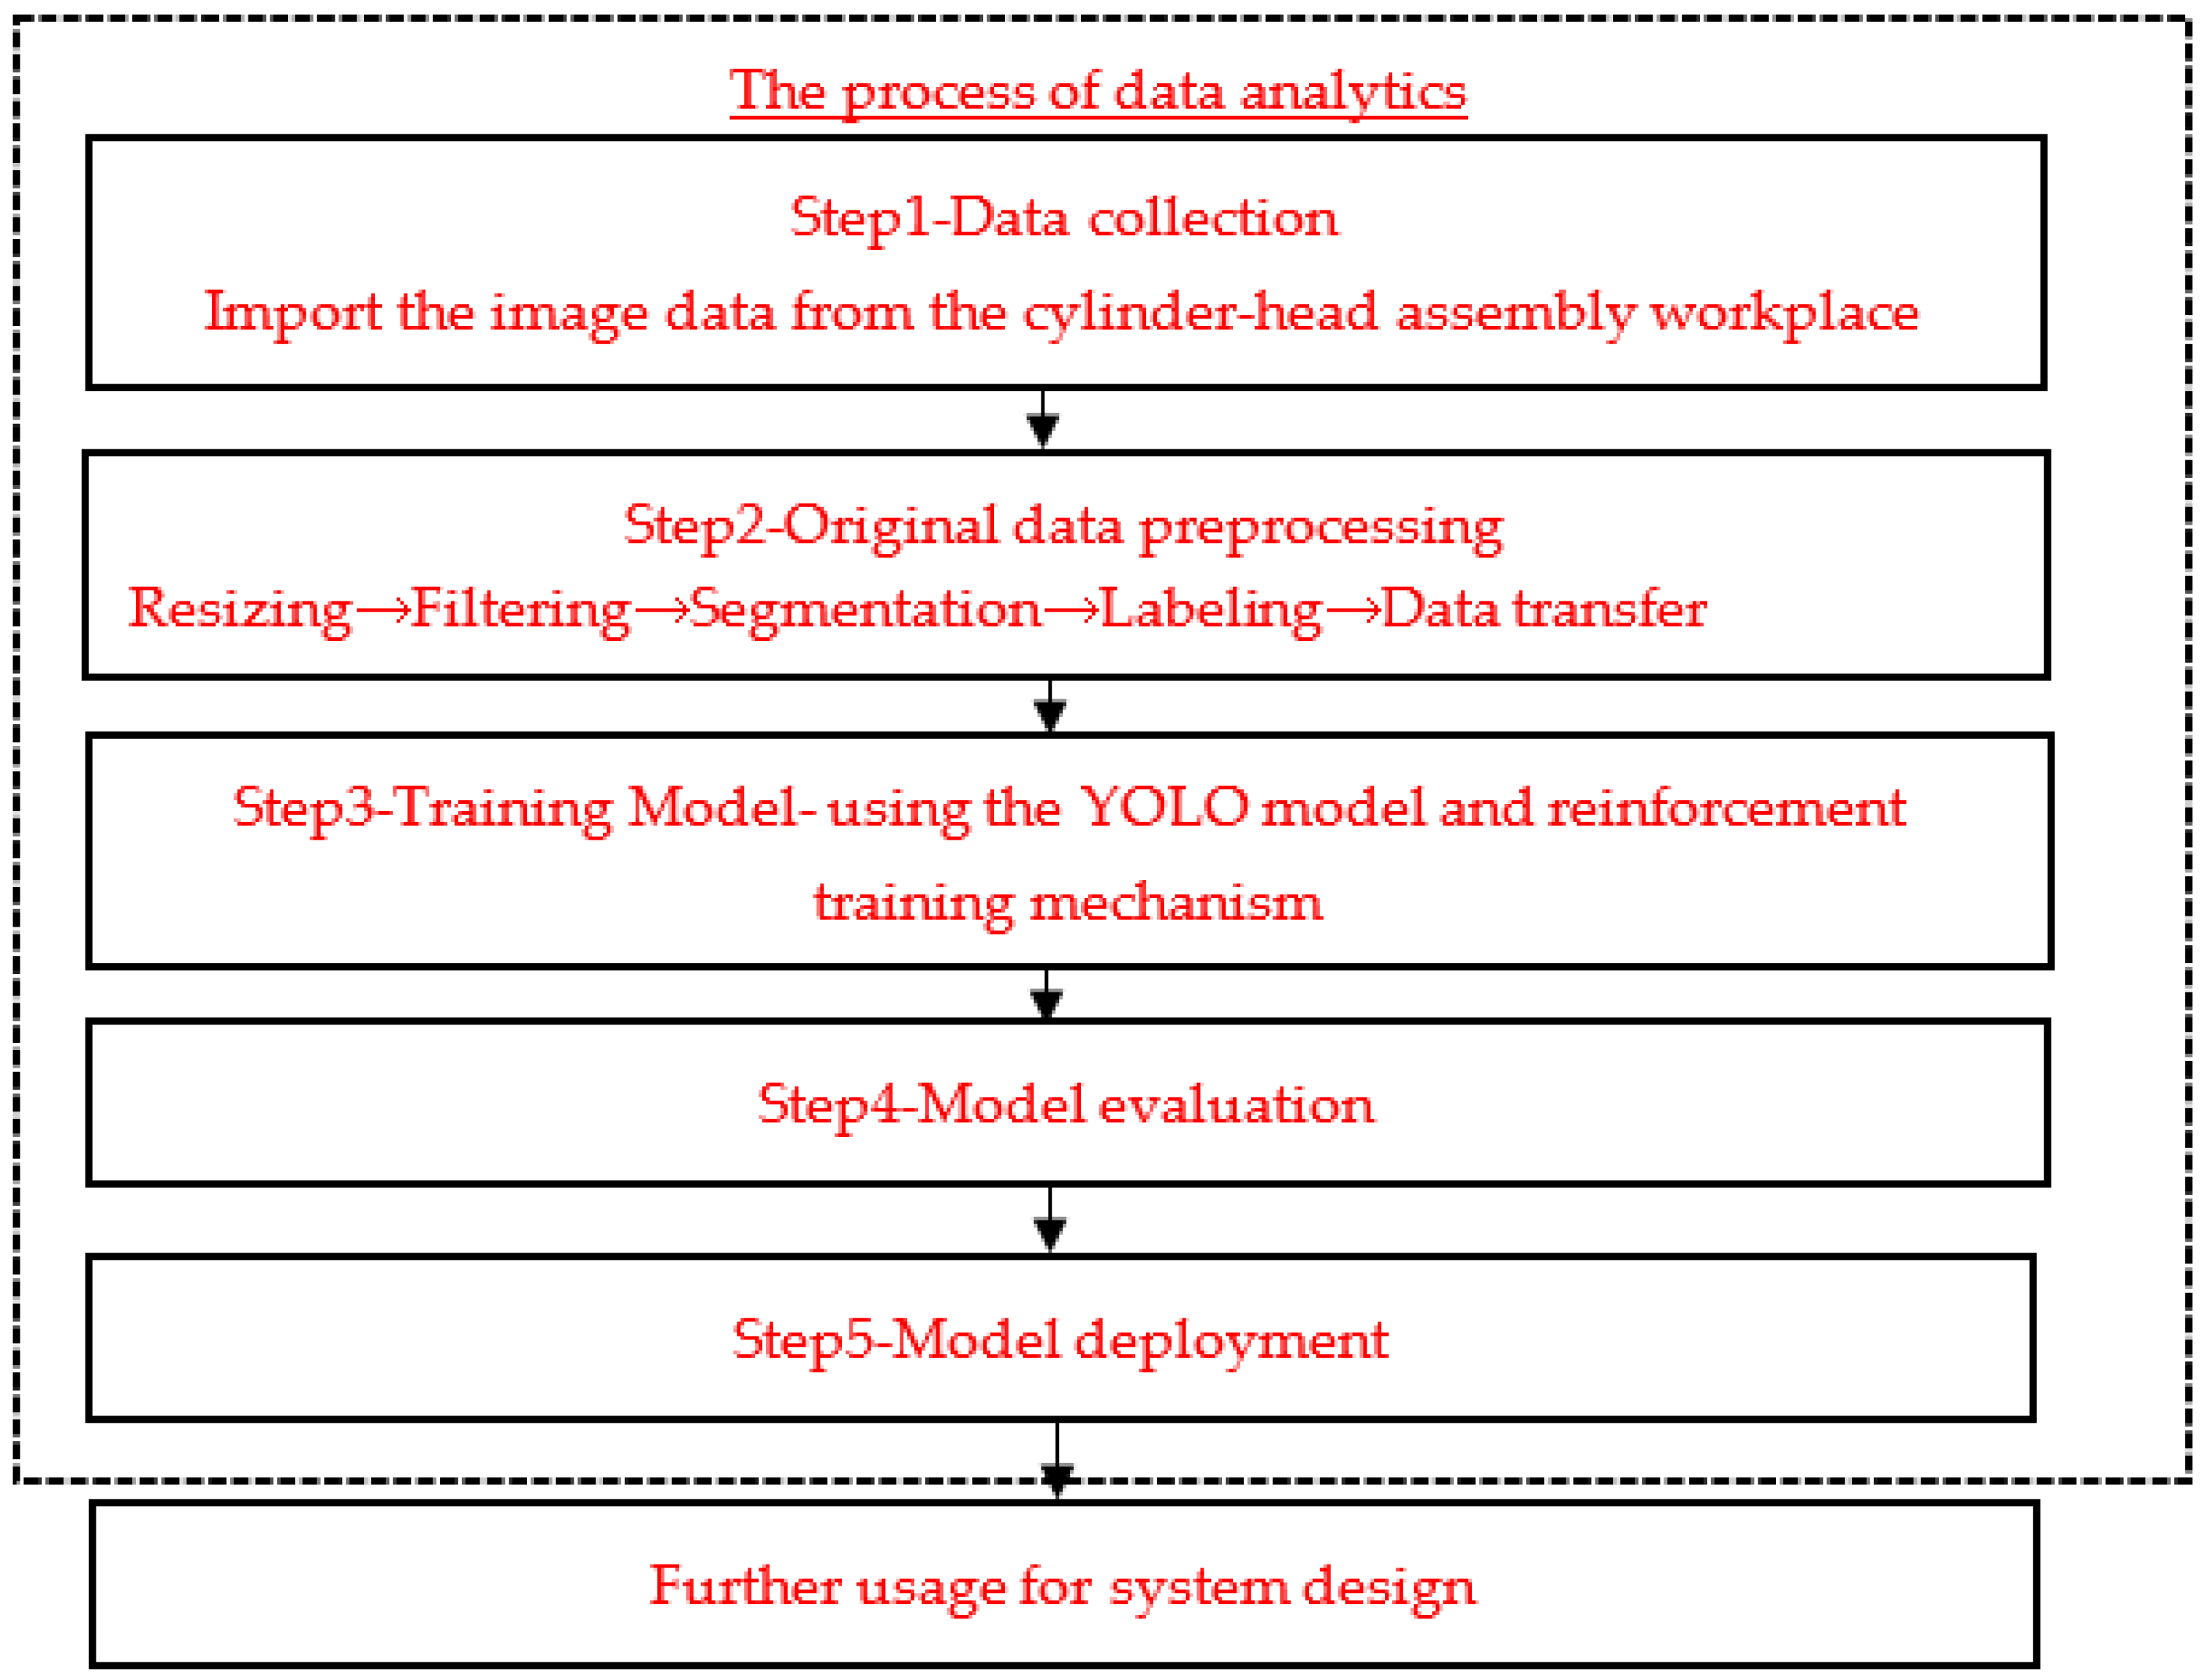
The knowledge-discovery-in-database (KDD) is a standard workflow process for acquiring valuable information from imported data. It entails data collection and preprocessing, modeling, model evaluation, and knowledge deployment (Figure 1). The KDD process is a rigorous and efficient workflow process, and most studies assess the data using the KDD process [37,38]. Furthermore, the KDD process was prevalently applied in manufacturing DA using different DA methods (e.g., deep learning [38]) in multiple stages of KDD. Therefore, it can provide a better perception of processes that allows the exploration of valuable information from imported data. This study processes the laborers’ image data following the standard KDD workflow. The detailed process description is in the following sub-section.
3.1. Use Case and Data Collection
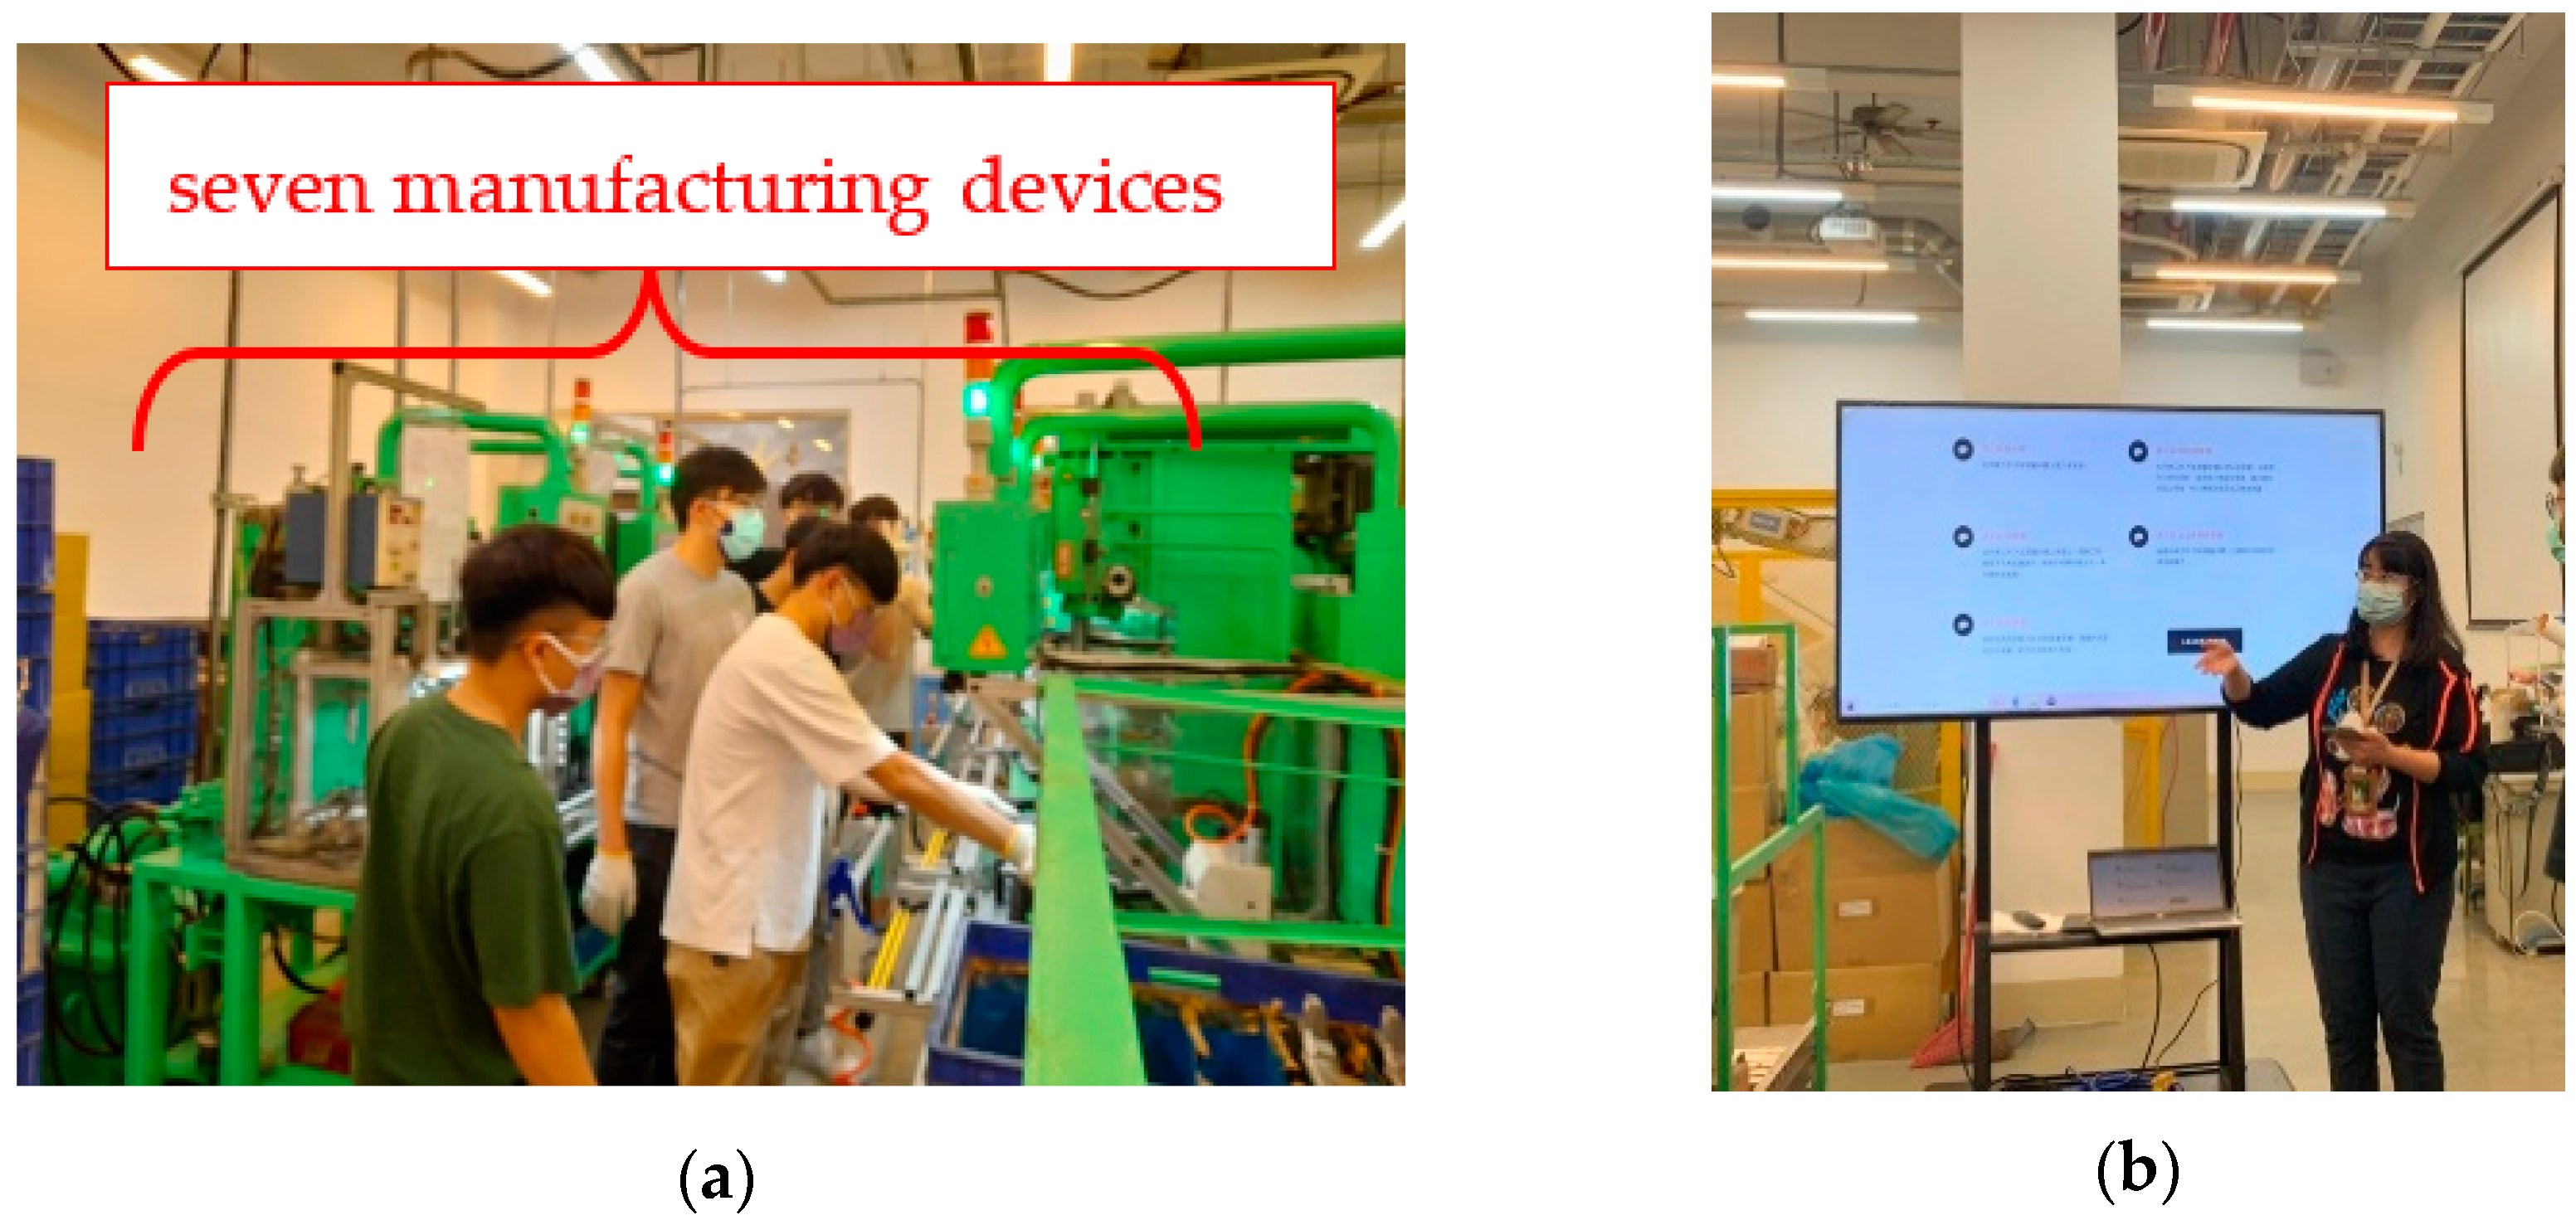
Most advanced devices with network communication, embedded sensors, and intelligence computing existed in the framework of Industry 4.0. However, different enterprises still apply traditional devices because it is cheap and readily accessible. The high cost of device replacement complicates digital transfer as industry 4.0 for the enterprise. Therefore, developing methods to digitalize and populate the manufacturing sites with economic techniques is important for the enterprise to achieve Industry 4.0. This study applied economical way-software, such as system design and ML technologies, adding value to the existing device to address these issues. The author chose a traditional cylinder-head assembly workplace as the use case, a conventional assembly factory comprising seven manufacturing devices. As the target dataset, 1000 images were collected from the cylinder-head manufacturing site. The image data were acquired from different filming angles and different backgrounds. Figure 2 shows the original dataset this study used.
3.2. Original Data Preprocessing
Data preprocessing is the first step before model construction; however, several data require preprocessing with a distinct method. For example, image data require preprocessing to determine the valuable content. The image data preprocessing improves the image data by suppressing unwanted distortions or enhancing certain image features relevant for further processing and model training. Therefore, the original image data required preprocessing in this study.
3.2.1. Resizing
The size of the image is determined using the image’s pixel dimensions, which comprise the number of pixels along the image’s width and height. The total size of an image is the width multiplied by the height (Equation (1)).
Resizing is a typical preprocessing procedure in image processing that entails reducing the number of pixels and proportionally adjusting the image size. For example, the image height is adjusted to the same proportion (Aspect ratio), while the image width is modified (Equation (2)). Therefore, adequate image size selection is important for the computation efficiency of the ML model.
3.2.2. Image Filtering
Image filtering adjusts image properties to retrieve valuable information from the image, such as edges. The kernel is a matrix associated with each pixel and its neighbors within an image. It is applied in edge detection, blurring, and sharpening. Intriguingly, the kernel can impact the image properties in multiple ways. Filtering is determined by a kernel and established by a convolution between the kernel and the image.
3.2.3. Image Segmentation
Image segmentation partitions an image into several parts or regions depending on the characteristics of the pixels in the image. Image segmentation includes semantic segmentation, instance segmentation, and panoramic segmentation. Semantic segmentation is a clustering method that clusters regions of pixels based on regularities in color or shape to separate the foreground from the background. Moreover, it is used for background processing by classifying each image’s pixel belonging to a specific class. After the pixel classifier is trained, the corresponding pixels with the label matching the background class are assigned a shade of pure color, and the foreground image is retained as the original one. We employed semantic segmentation to separate the manufacturing site background and the target foreground.
3.2.4. Labeling
Labeling is the preprocessing of predefined raw data from different data, such as images, by adding the target labels. The label is used to offer core information for the model to learn from the model training. For example, labels can signify whether an image contains a specified object. Labeling is required for several use cases, including image preprocessing and machine vision. Images with the correct label can ensure that the image details are accurately identified. However, accurate labeling is difficult for image processing because image labeling involves different aspects of an image, such as a wide angle, the image background, and the foreground. This study labeled the image data with the following attributes to define the status of labor’s mask-wearing: abnormal and normal.
3.2.5. Data Transfer
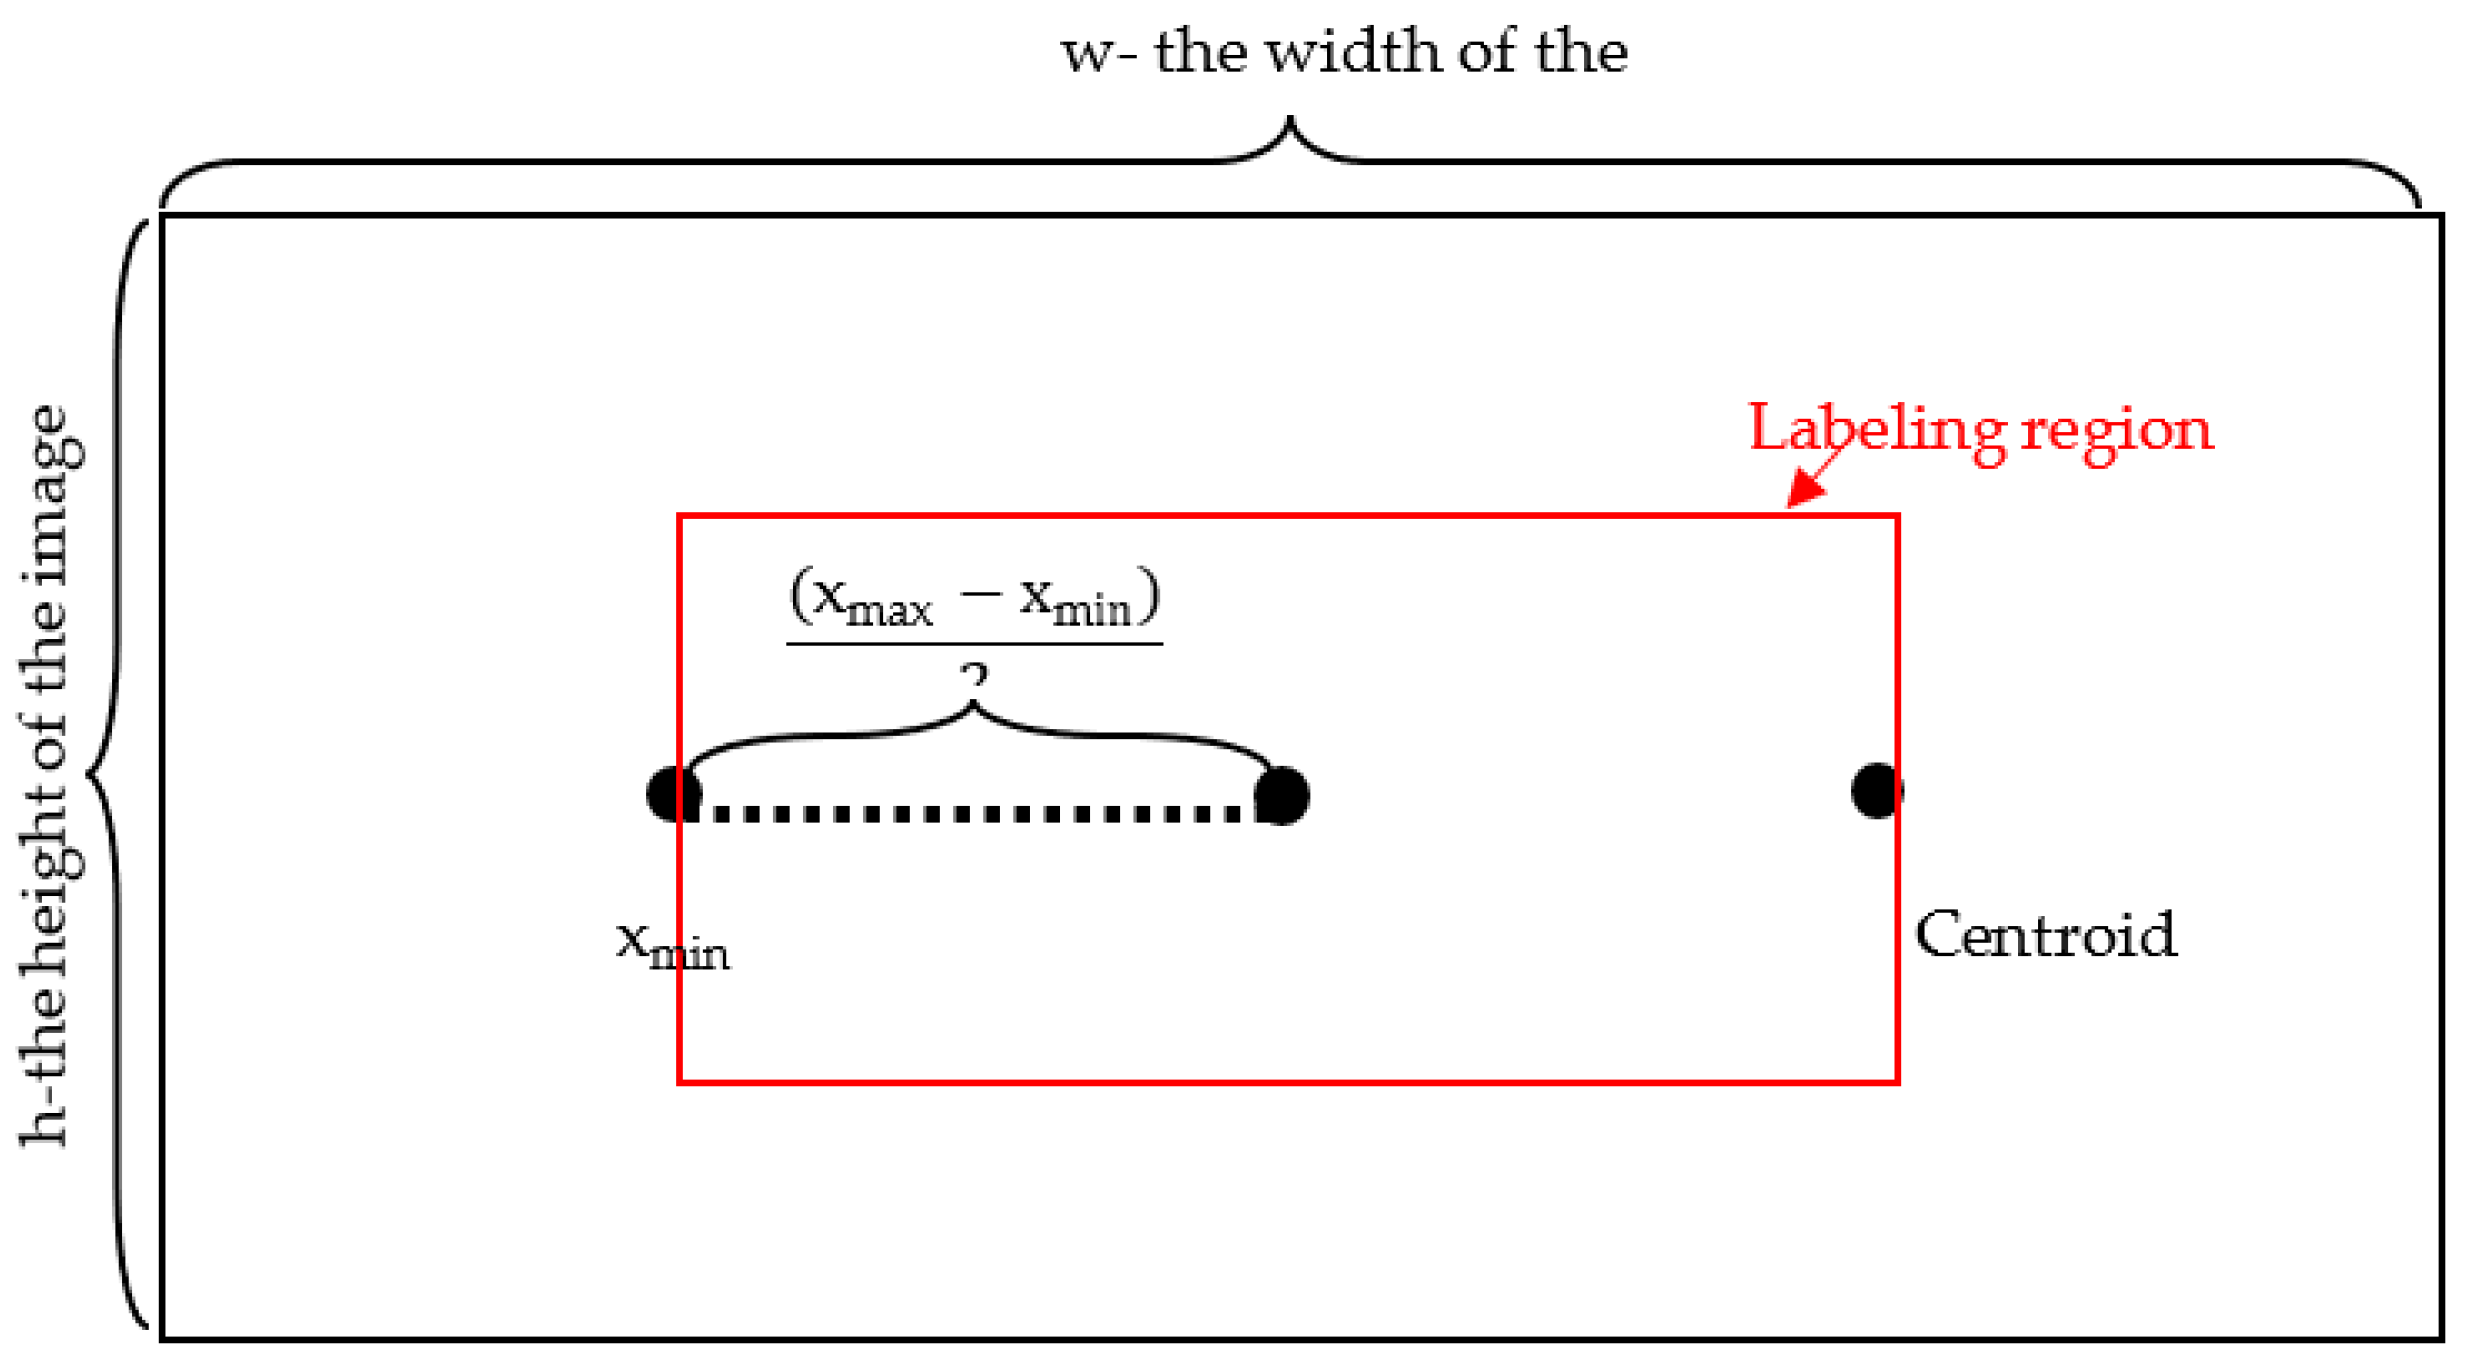
In this study, the labeled data is the XML format, which should be extracted and recomputed for transforming in the YOLO import format. Equations (3)–(6) is the transformation formula.
Figure 3 shows the image and label regions. Where xmin, ymin, xmax, and ymax are the coordinates of the centroid in the labeling region, w is the image’s width, and h is the image’s height. The width Ratio is the ratio of the labeling region’s width to the image’s width. However, the Height Ratio is the ratio of the labeling region’s height to the image’s height.
3.3. Training Model for Anomaly Detection
3.3.1. Preliminary Model—YOLO Model
Computer vision involves identifying various objects in digital videos and images. Certain objects identified included products, people, devices, buildings, and facilities. Redmon et al. recommended an improved deep-learning algorithm called YOLO [39]. YOLO is an algorithm based on the framework of deep learning networks; thus, CNNs are employed in YOLO for object detection. Note that the YOLO algorithm is based on detecting objects. As the name suggests, only a single forward propagation neural network was employed in the algorithms to detect objects. The YOLO algorithm has garnered considerable attention for digital image processing because of its superior performance, such as speed and accuracy. It increases the detection speed because it can accurately predict objects. However, YOLO provides accurate results with minor background errors by a loss function, thus outperforming learning capabilities by learning the representations of objects and extensively applying them in object detection. Image analytics with YOLO is straightforward. The YOLO process entails resizing the input image, executing a CNN on the image, and threshold the corresponding detection using the model’s confidence [39]. YOLO comprises the convolutional layers, connected layer, and loss function. Furthermore, the final layer forecasts the coordinates of the bounding box and the probability of the class. Moreover, the image width and height can normalize the bounding box width and height.
3.3.2. The Reinforcement Training Mechanism
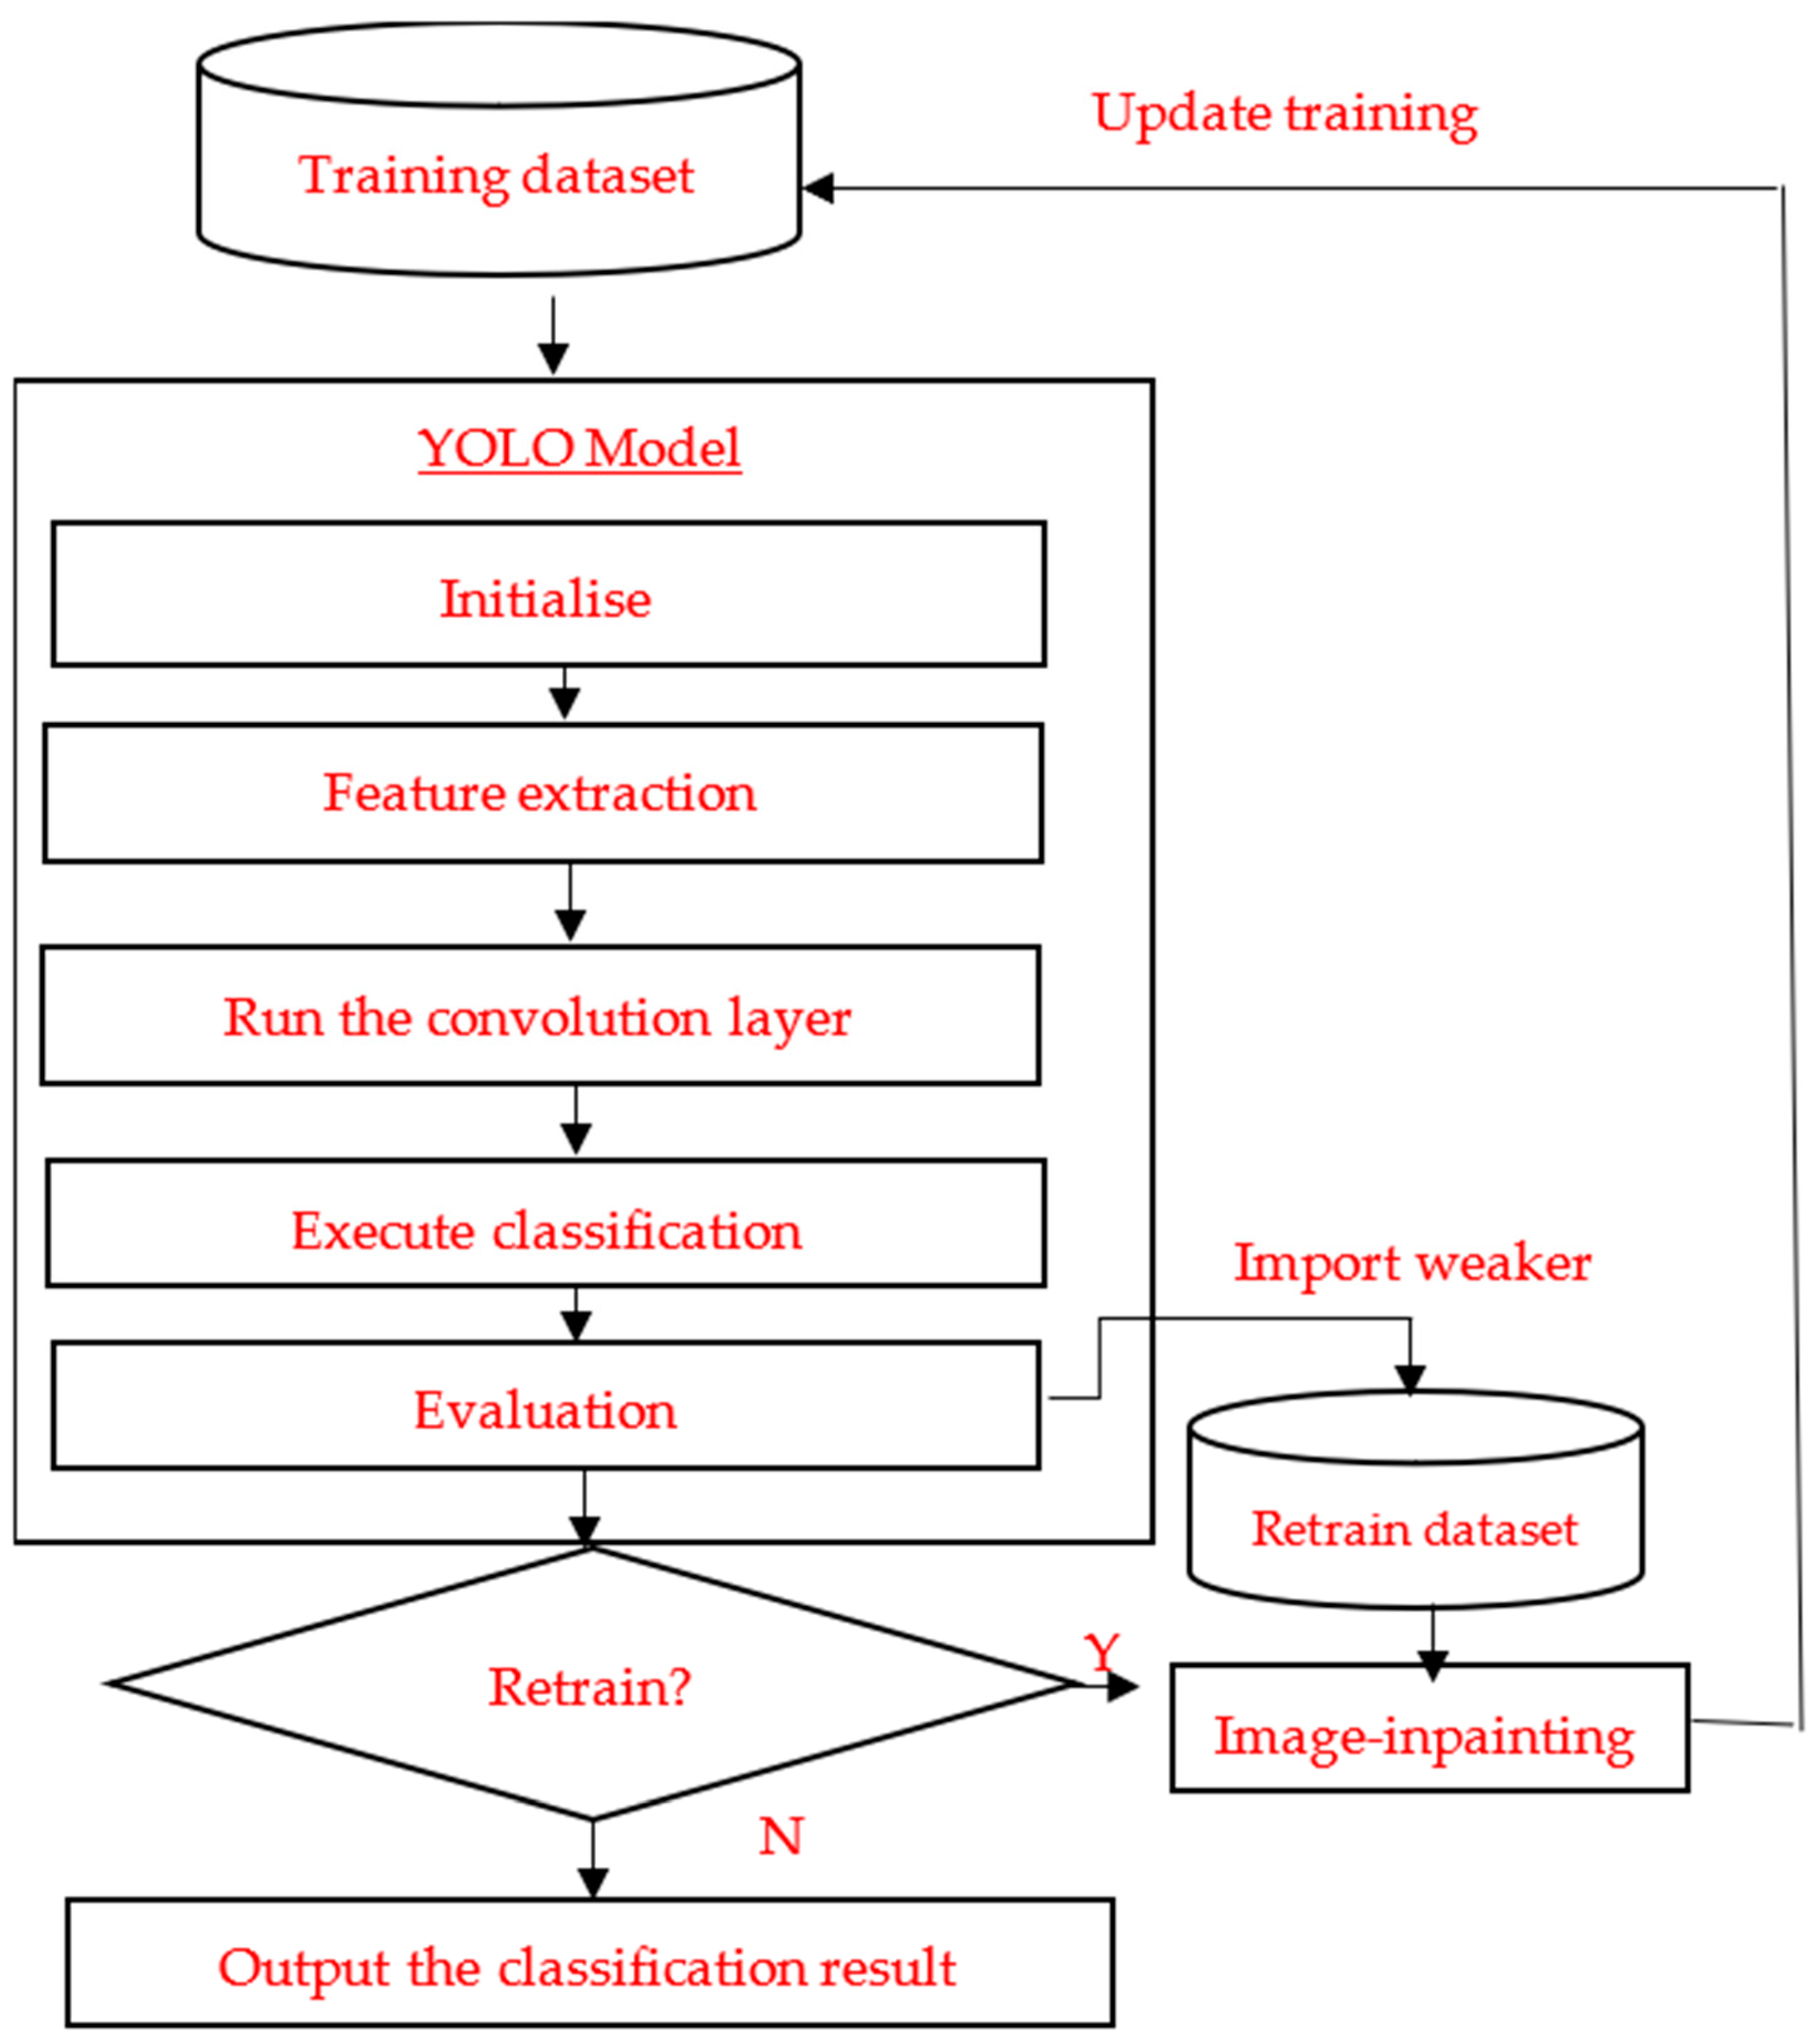
The enforced learning can adjust the trained result to execute the additional processing. This study uses a reinforcement-learning mechanism to reprocess and retrain the image with an incorrect label. The image data with inaccurate prediction results during the model training is defined as a weaker pattern, which may have microscopic defects that may reduce the prediction accuracy. The weaker patterns could be corrected using image-inpainting technology, a conservation process for reconstructing an image’s damaged, missing, and deteriorating regions. The image after inpainting was retrained in the model for reinforcement training. It enhances the prediction performance by expanding the solution space for assessing the revised weaker pattern. Figure 4 shows the reinforcement training mechanism.
3.4. Model Evaluation
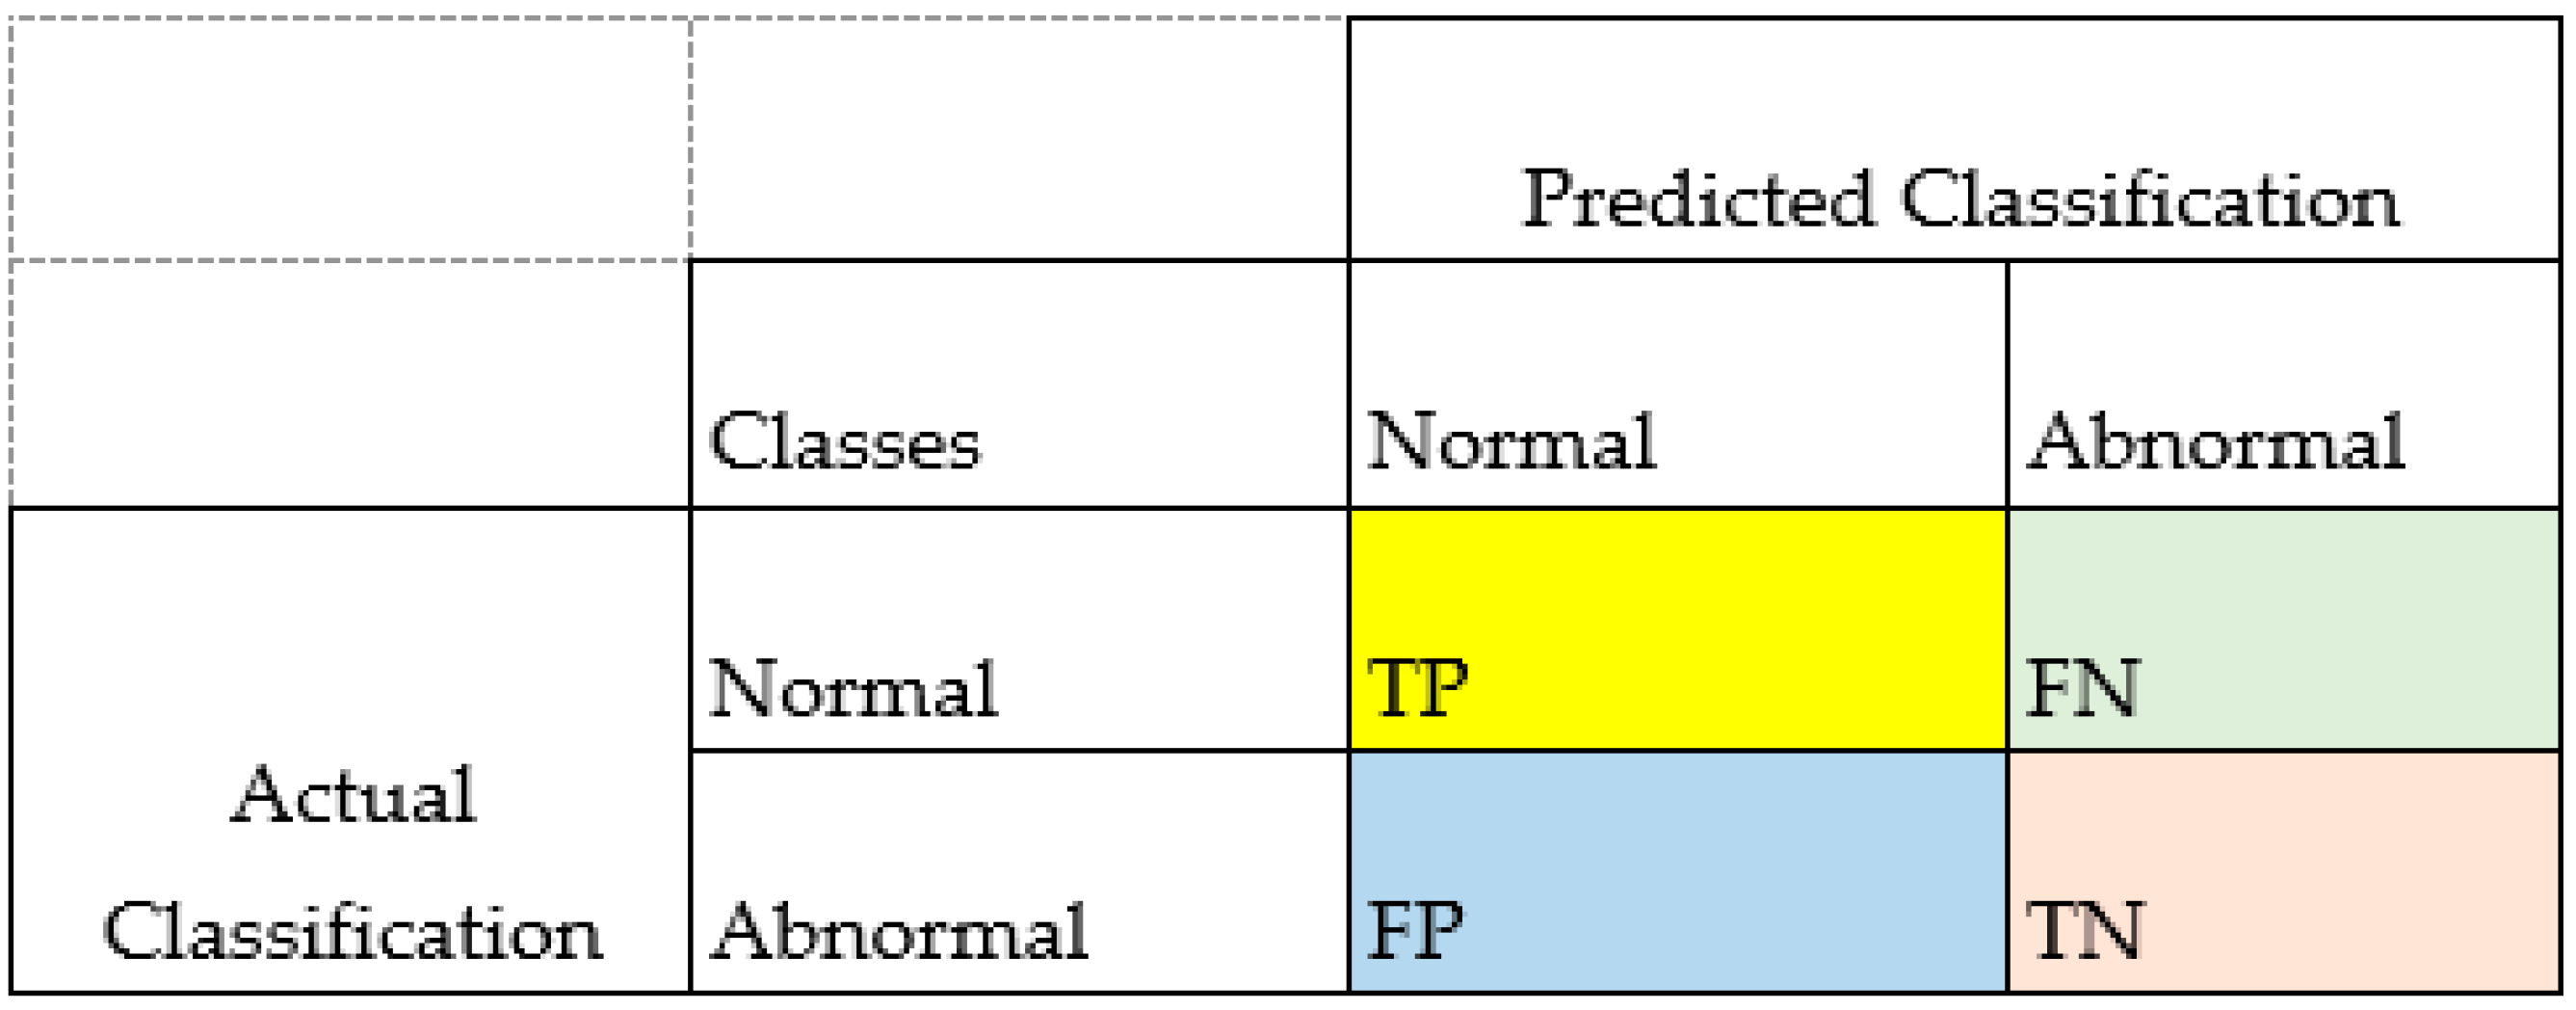
We used accuracy, recall rate, precision rate, F1-score, and Matthews correlation coefficient (MCC) to assess the classification performance. Each criterion is highlighted below (Figure 5). The confuse matrix this study employed has four types: True Negative (TN), True Positive (TP), False-Negative (FN), and False-Positive (FP). TP indicates that the model-given prediction is “Normal”, and the real or actual value was “Normal”. TN indicates that the model-given prediction was “Abnormal”, and the real or actual value was “Abnormal”. FP indicates that the model-given prediction is “Normal”, and the real or actual value is “Abnormal”. FN indicates that the model-given prediction is “Abnormal”, and the real or actual value is “Normal”.
3.4.1. Accuracy
Accuracy is used to assess ML performance by calculating the closeness of the predicted value to the actual value. The parameters of the accuracy formula are the quantities of false negative (QFN) and true negative (QTN) and that of false positive (QFP) and true positive (QTP). The accuracy value is estimated using the aggregation of correct assessments divided by the number of assessments (Equation (7)).
3.4.2. Recall Rate (Sensitivity)
The recall rate is a statistical measure of the classification function performance. The recall rate value is determined using the ratio of actual positives correctly identified in the sum of the true positives and false negatives, while QFN and QTP signify the number of false negatives and true positives, respectively (Equation (8)).
3.4.3. Precision Rate
The precision value is determined by the ratio of actual positives correctly identified in the overall positive dataset. The formulas of precision rate are presented as Equation (9), where QTP and QFP are the quantity of true positive and false positive, respectively.
3.4.4. F1-Score
F1-score is an important model evaluation criterion estimated from the recall and precision rates; thus, it comprises the true positive, false negative, and false positive. The formulas of precision rate are presented as Equation (10), where QTP, QFN, and QFP are the quantity of true positive, false negative, and false positive, respectively. F1-score ranges between 0 and 1. The value of 1 indicates that a model perfectly classifies each observation into the correct class. However, a value of 0 indicates a model that cannot classify any observation into the correct class.
3.4.5. Matthews Correlation Coefficient
MCC is the criterion for classifying confused matrix performance using actual and predicted values to calculate Pearson’s product–moment correlation coefficient. The formulas of precision rate are depicted as Equation (11). The range of the MCC value is from −1 to 1, where −1 and 1 are significant disagreements and agreements between actual and predicted values, respectively.
The abovementioned evaluation criteria were used in the model evaluation, and the experimental result will be presented in Section 5.
3.5. Model Deployment
The model deployment is the final stage of the KDD procedure in which a model can be deployed in distinct types, such as plug-in libraries. The libraries comprised pre-compiled routine functions. Most trained models were prepared as a standard module for users to use. The users can use the functions of the plug-in module to access the analytics result. Therefore, to boost the application of the developed, trained model, this study used Flask to develop the API router, and the analytics results can be deployed as API incorporated into the proposed system.
4. System Design
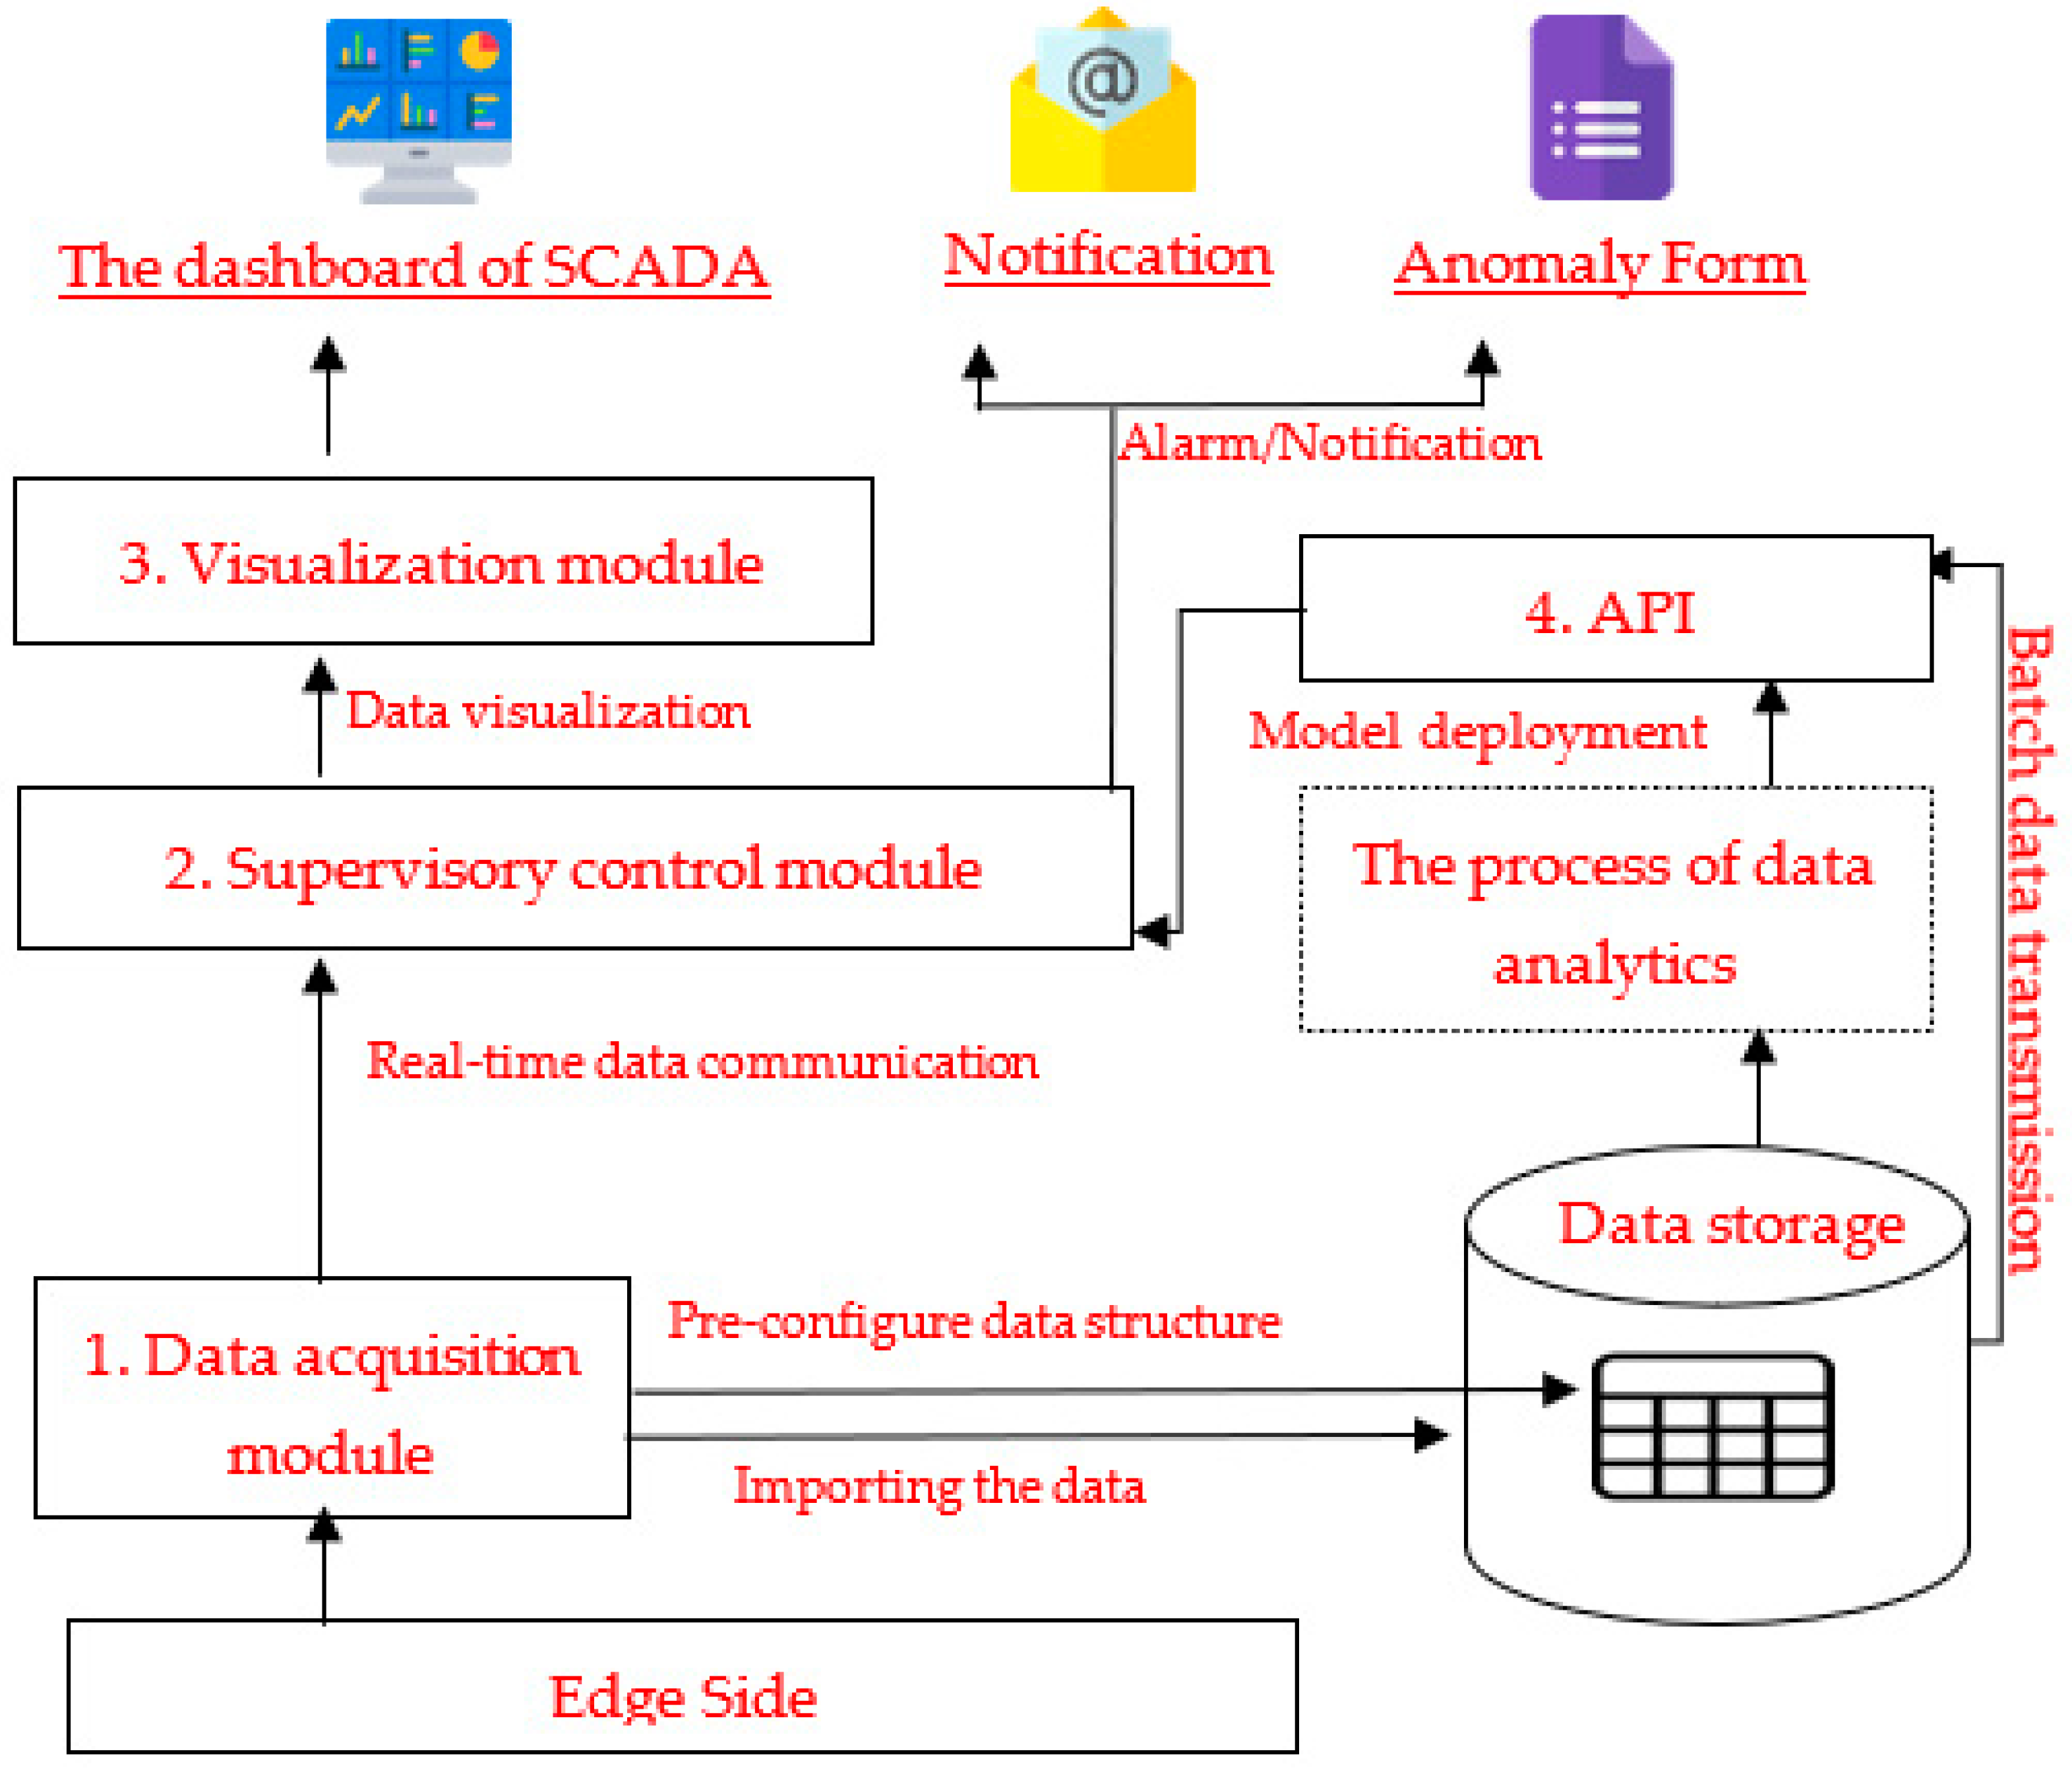
This study presented a CAADS involving four modules from the edge (manufacturing site) to the cloud sides to attain the aim of real-time SCADA for anomaly detection (Figure 6). The bottom module is the data acquisition module. The image data can connect to the cloud and be retrieved into a customized database in the data acquisition module. The supervisory control module executes a real-time alarm and notification using the customized protocol. It provides the export of a form, such as a list of employee workplace violations for epidemic prevention. The trained model described in the previous section was applied in the data analysis module to evaluate the laborers’ mask-wearing behavior while receiving the image data. Furthermore, the top module is the data visualization module, where the statistical outcomes are illustrated on the visualization dashboard for the user to monitor and determine the current status.
4.1. Data Acquisition Module
The proposed module can receive the image and data in multiple formats (e.g., CSV, JSON, raw data) to meet the increasing demand for manufacturing process changeability and flexibility. Because each user has a distinct data retrieval requirement, this study offers three-layer data management for users to design and manage their projects on the system. Furthermore, each project has one project node, each project node has its source node, and each source node has its own data node. Customization is the main characteristic of CAADS, where users can design a personalized data schema using a module based on their requirements for data retrieval. Users can develop their projects and previously configure the project node and source nodes. The data node is stored in the database with a customized schema. After each user completes their project setting, the data with a distinct format from the edge side (manufacturing site) is automatically transferred to the cloud project and is transmitted into the customized data schema. The percentage of historical or real-time data from the manufacturing site, with functionalities, such as current laborers’ correct mask-wearing status and current social distance, can be imported into the customized project for a different supervisor handling the laborers’ resource management. After users complete the project management setting and the customized database schema on the cloud platform using the data acquisition module, the data can be uploaded to the cloud database using the supervisory control module. However, the user can use the supervisory control module to provide the control instructions to the cloud platform.
4.2. Supervisory Control Module (MQTT)
The supervisory control module’s major functions are connecting and monitoring. Furthermore, the supervisory control module is the medium between the data acquisition module and other modules using a customized communicating protocol considering the connecting function. This study employed the Message Queuing Telemetry Transport (MQTT) protocol to create a specification format for communicating modules by messaging the protocol instruction from the supervisory control module. The MQTT is an IBM-developed messaging protocol that is an ISO standard (ISO/IEC PRF 20922) for using objects, devices, and sensors attached to the Transmission Control Protocol/Internet Protocol (TCP/IP). MQTT is employed to determine the connecting environment using the broker as a hub for sending and receiving the message to the client. It offers flexible content for users to develop their topics and messages. The MQTT Broker receives several messages with different topics from different client-side. The MQTT client sends the message using the “publish” instruction and receives the message by subscribing to the MQTT topic. The broker filters the messages and distributes them as per the topic. Furthermore, each message must include a topic the broker will use to forward the message to the clients who subscribe to this topic. Here, each module has its topic and message content in JavaScript Object Notation (JSON) format, and the module connects via the MQTT broker. Based on the monitoring function, the supervisory control module transfers the real-time data to the analytics and visualization module for further value-add application. Furthermore, the supervisory control module incorporates customized decision information. The user can customize the threshold value of information; if the value surpasses the threshold value, the module will send an alarm notification, such as an Email and an anomaly reminder message to the visualization model. Although different users have their alarm or notify the threshold value for making the decision, the current status of the manufacturing site can be monitored using the supervisory control module.
4.3. Visualization Module
Exploratory data analysis (EDA) is a technique that examines the data using various eliminates. EDA offers insight into a data set, detects anomalies, and determines the relationships among the explanatory variables. Visualization is one of the primary methods for EDA. Here, the visualization module achieves the goal of EDA. Different graphics are employed in the visualization module to summarize their major characteristics, such as the percentage of laborers violating the epidemic prevention directive. The key information on the manufacturing site can be expressed in a diverse chart through visualization technology. The D3.js support data binds to the Document Object Model (DOM) and then applies data-driven transformations to the document. D3.js can effectively manipulate documents based on data to avoid proprietary representation and affords extraordinary flexibility, thus revealing the full capabilities of web standards, such as SVG, HTML5, and CSS. D3.js is extremely fast with minimal overhead, supporting large datasets and dynamic behavior for interaction and animation. It can be used to construct an interactive SVG bar chart with smooth transitions and interaction or to generate an HTML table from a set of numbers. Furthermore, the visualization module outlines and summarizes the anomaly information using D3.js. Furthermore, users can contextualize the visualization module and visualize real-time and historical information to create a situation room. Therefore, they can acquire significant information and efficient management for epidemic prevention.
4.4. The Utilization of API
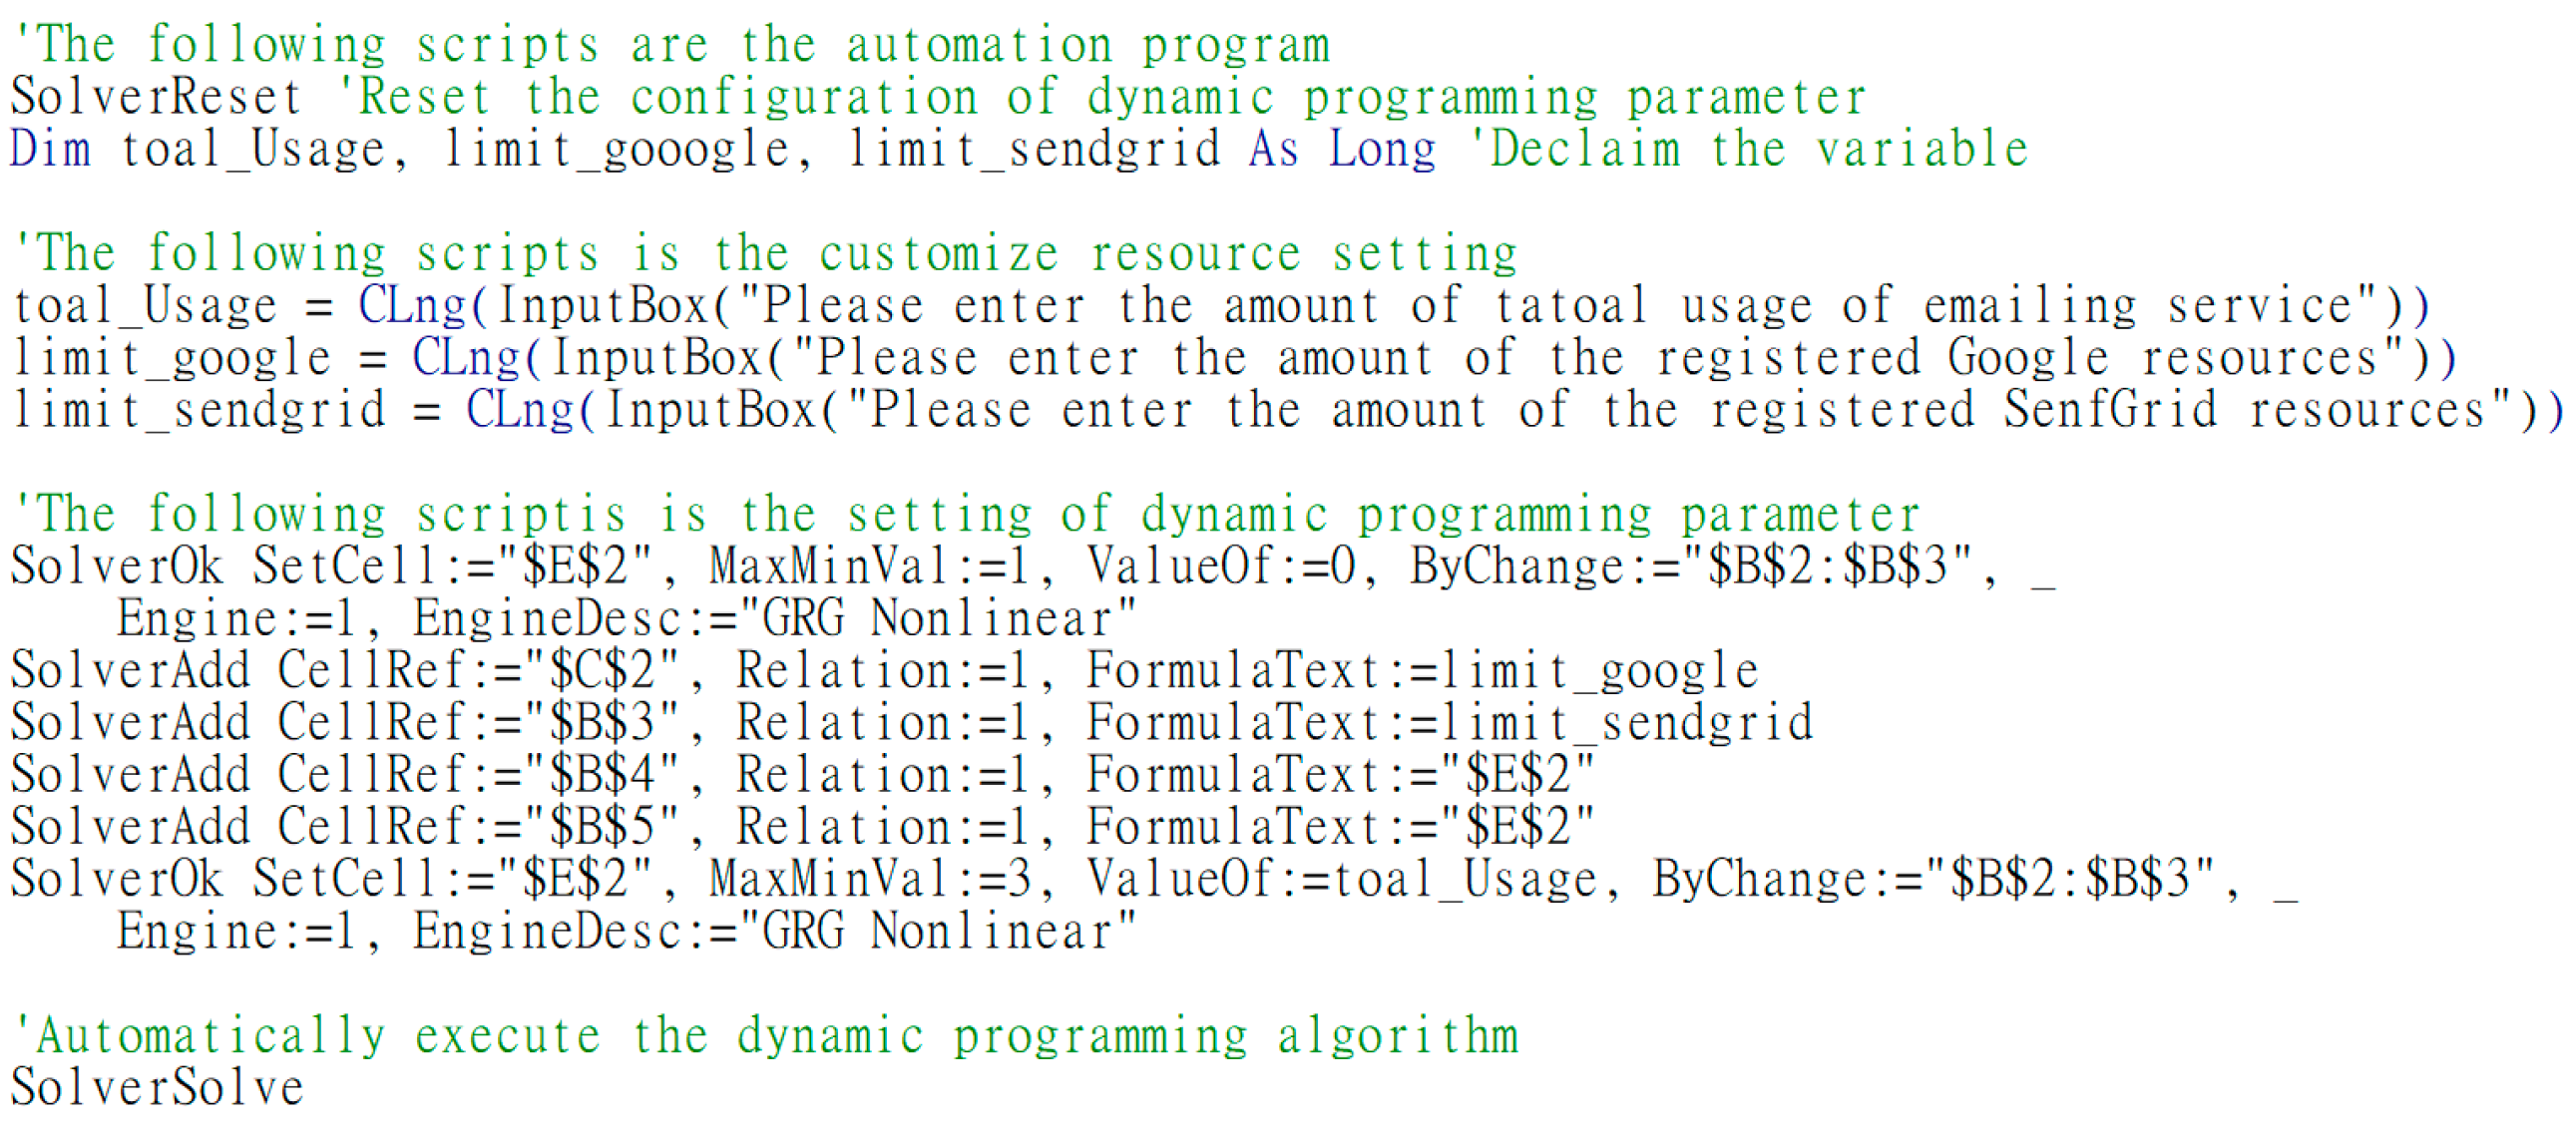
This study uses the Representational State Transfer Application Programming Interface (Restful API) to construct an analytics module. The Restful API is the API that is based on the Restful architecture. The Restful, which indicates representational state transfer, presents the architecture of communications, usually applied in the access of third-party services. The API is the middleware between the user and the service. Subsequently, the Restful API can access the web service by sending HTTP requests. This study develops the API Server and creates the query argument and response content. The trained model after DA is deployed as an API, while the real-time data or batch data is imported into the trained model using the API. After the user pre-configures the cloud data project using the data acquisition module, the data is automatically retrieved into the cloud data storage using the supervisory control model. While receiving client-side queries, the trained model is presented as a core service for API calls. The MQTT message sent by the supervisory control mode can be parsed as real-time data, which can import the trained model by calling the API. Here, the received argument while calling the API and the response result of the API must separately encode and decode using Message-Digest algorithm 5 (MD5). Therefore, the API connectivity and communicating content can be protected based on MD5 encryption and decryption. This analysis used a third-party service to send the anomaly notification to the user. The third-party services offered the users a limited amount of services for each registered resource account. This study elucidated the objective function and non-linear constraint (Equation (12)). The GRG non-linear solving method is used to calculate the number of optimal resources. The automatic program was employed to dynamically run the GRG non-linear solving method to assign the resources and use the third-party service via an API (Figure 7).
where TQSpecified is the total amount of email service users specified. Q is the amount of email service per resource provided, and R is the number of resources. LimitR means the upper limit of resources per type.
Objective function:
QGoogle × RGoogle + QSendgrid × RSendgrid = TQSpecified
Subject to:
QGoogle × RGoogle ≤ TQSpecified
QSendgrid × RSendgrid ≤ TQSpecified
RGoogle ≤ LimitRGoogle
RSendgrid ≤ LimitRSendgrid
QGoogle × RGoogle + QSendgrid × RSendgrid = TQSpecified
Subject to:
QGoogle × RGoogle ≤ TQSpecified
QSendgrid × RSendgrid ≤ TQSpecified
RGoogle ≤ LimitRGoogle
RSendgrid ≤ LimitRSendgrid
5. Result
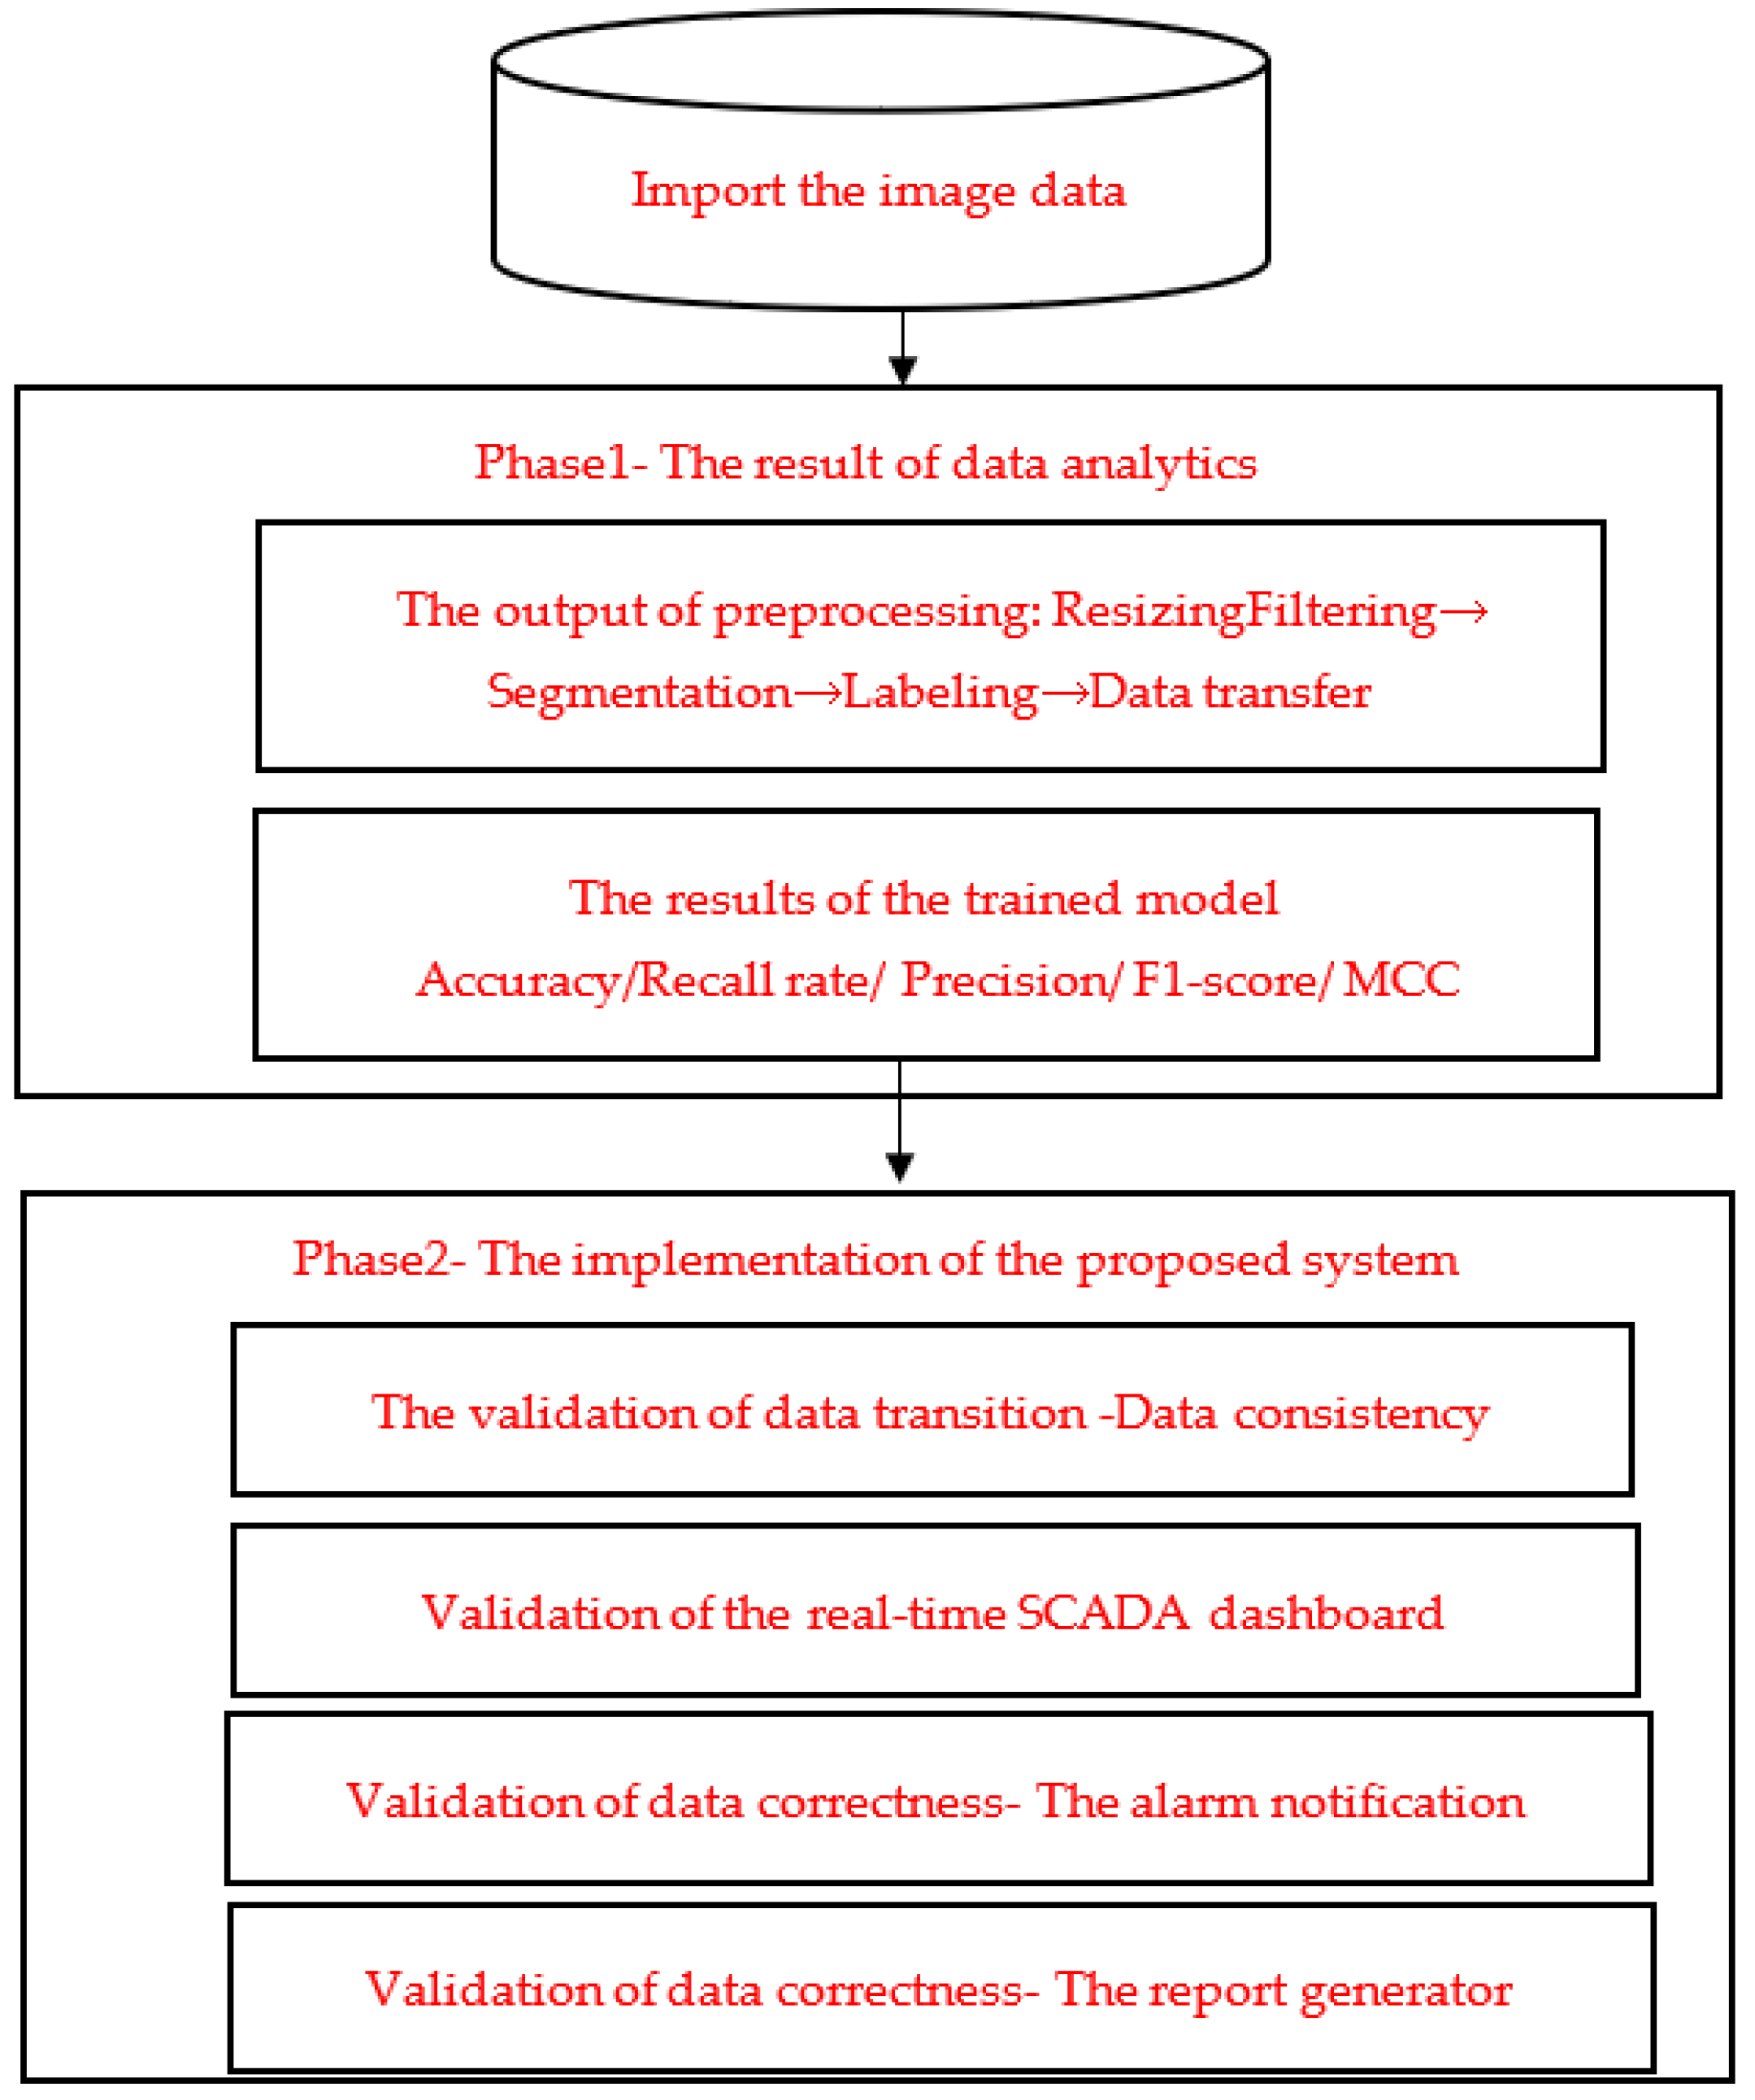
This study used the image data from the cylinder-head assembly workplace as a training example. Figure 8 shows the photographic tool, and Figure 9 shows the flow of the experiment. The image dataset has to be resized, filtered, labeled, and segmented sequentially; the preprocessed data were imported into the YOLO-based model. Finally, the results and data are incorporated into the proposed system for further use, such as alarm notification, automatic report generation, and SCADA-related applications.
5.1. The Results of Data Analytics
This study’s experimental data is the image-type data. Therefore, it requires a collaborative application with the Graphics Processing Unit (GPU) rather than a single-use Central Processing Unit (CPU). Furthermore, the image data require a larger physical space and cache size; thus, specified Random Access Memory (RAM) and the Hard disk (HD) were used to supplement the DA. Table 2 presents the specification of the experimental environment. The experiment was run in an environment comprising the processing, storage, and graphic process units (Table 2).
5.1.1. The Output of Pre—Preprocessing
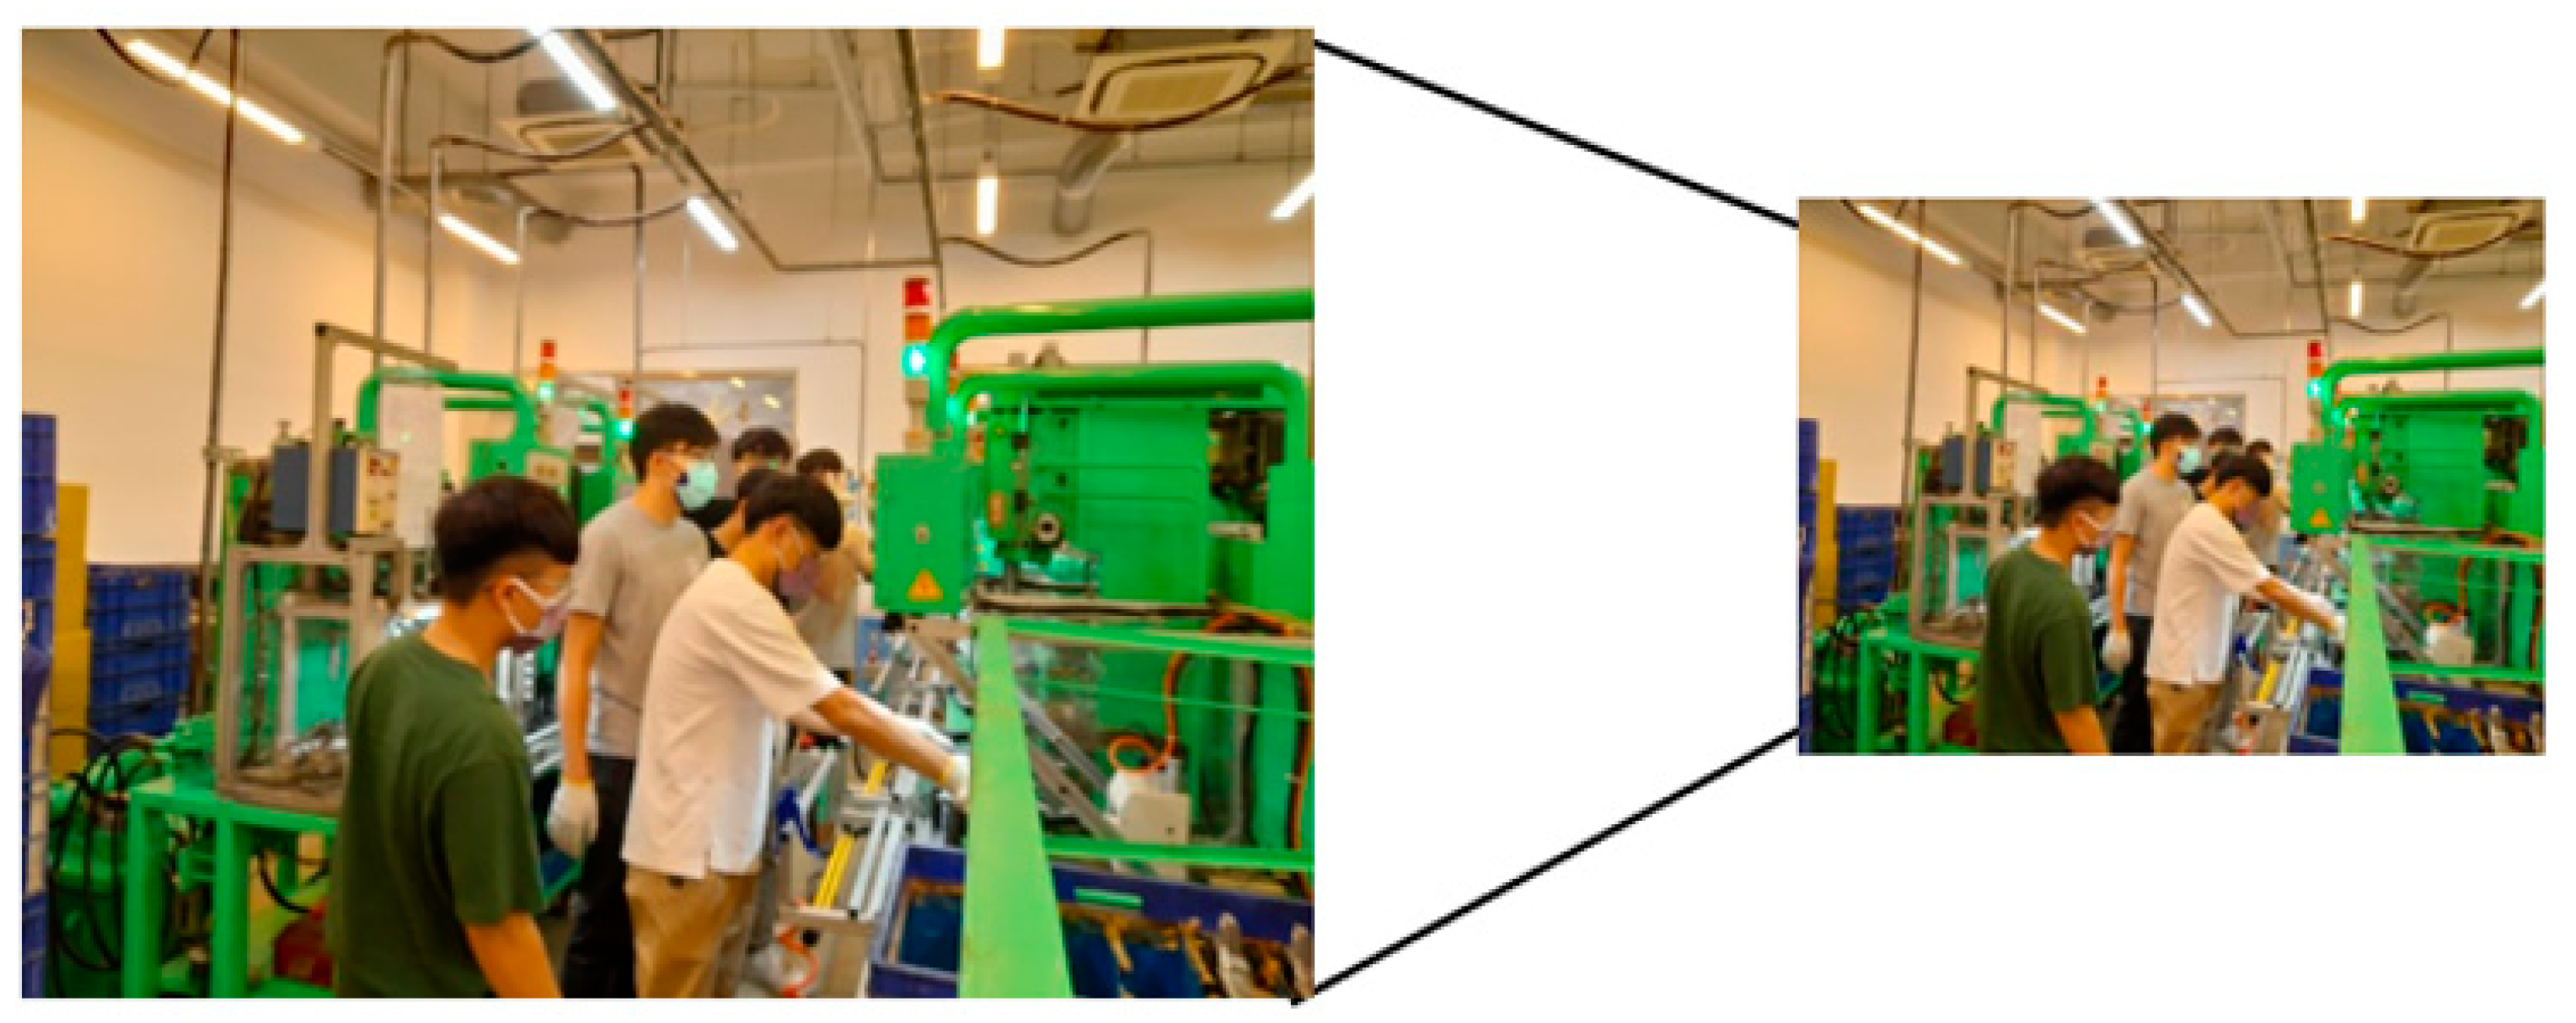
The bigger image sizes may cause longer computation time and more memory requirements. Therefore, this study obtained image data of various sizes, including “1831 × 1373”, “1373 ×1831”, “1478 × 1108”, and “1108 × 1478”. These collected data were resized as the similar original width and height proportionally. Figure 10 shows the resulting image resizing.
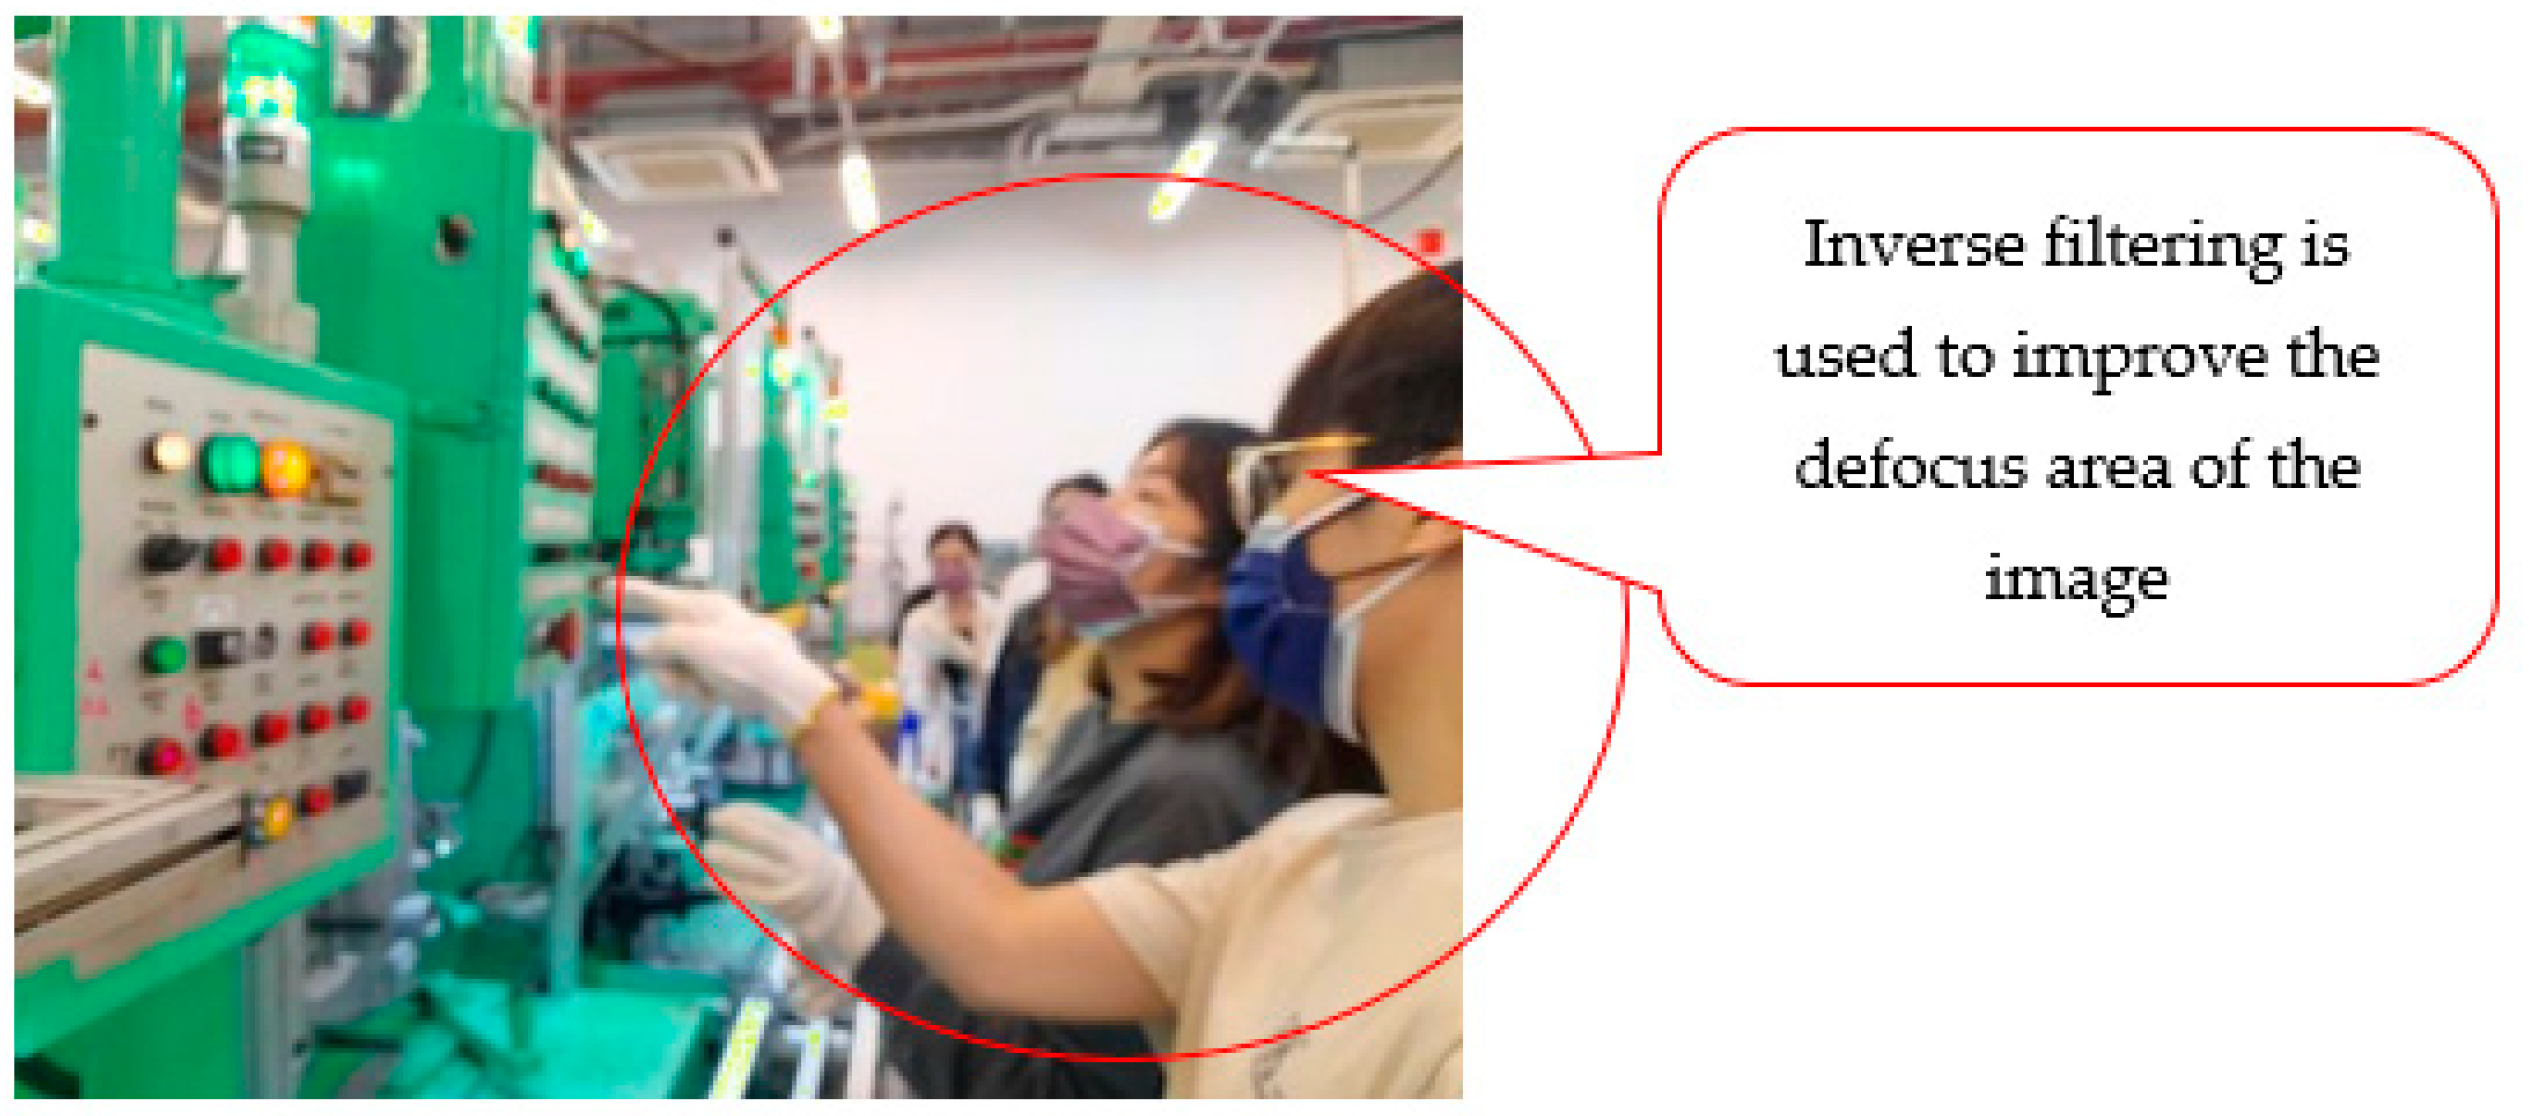
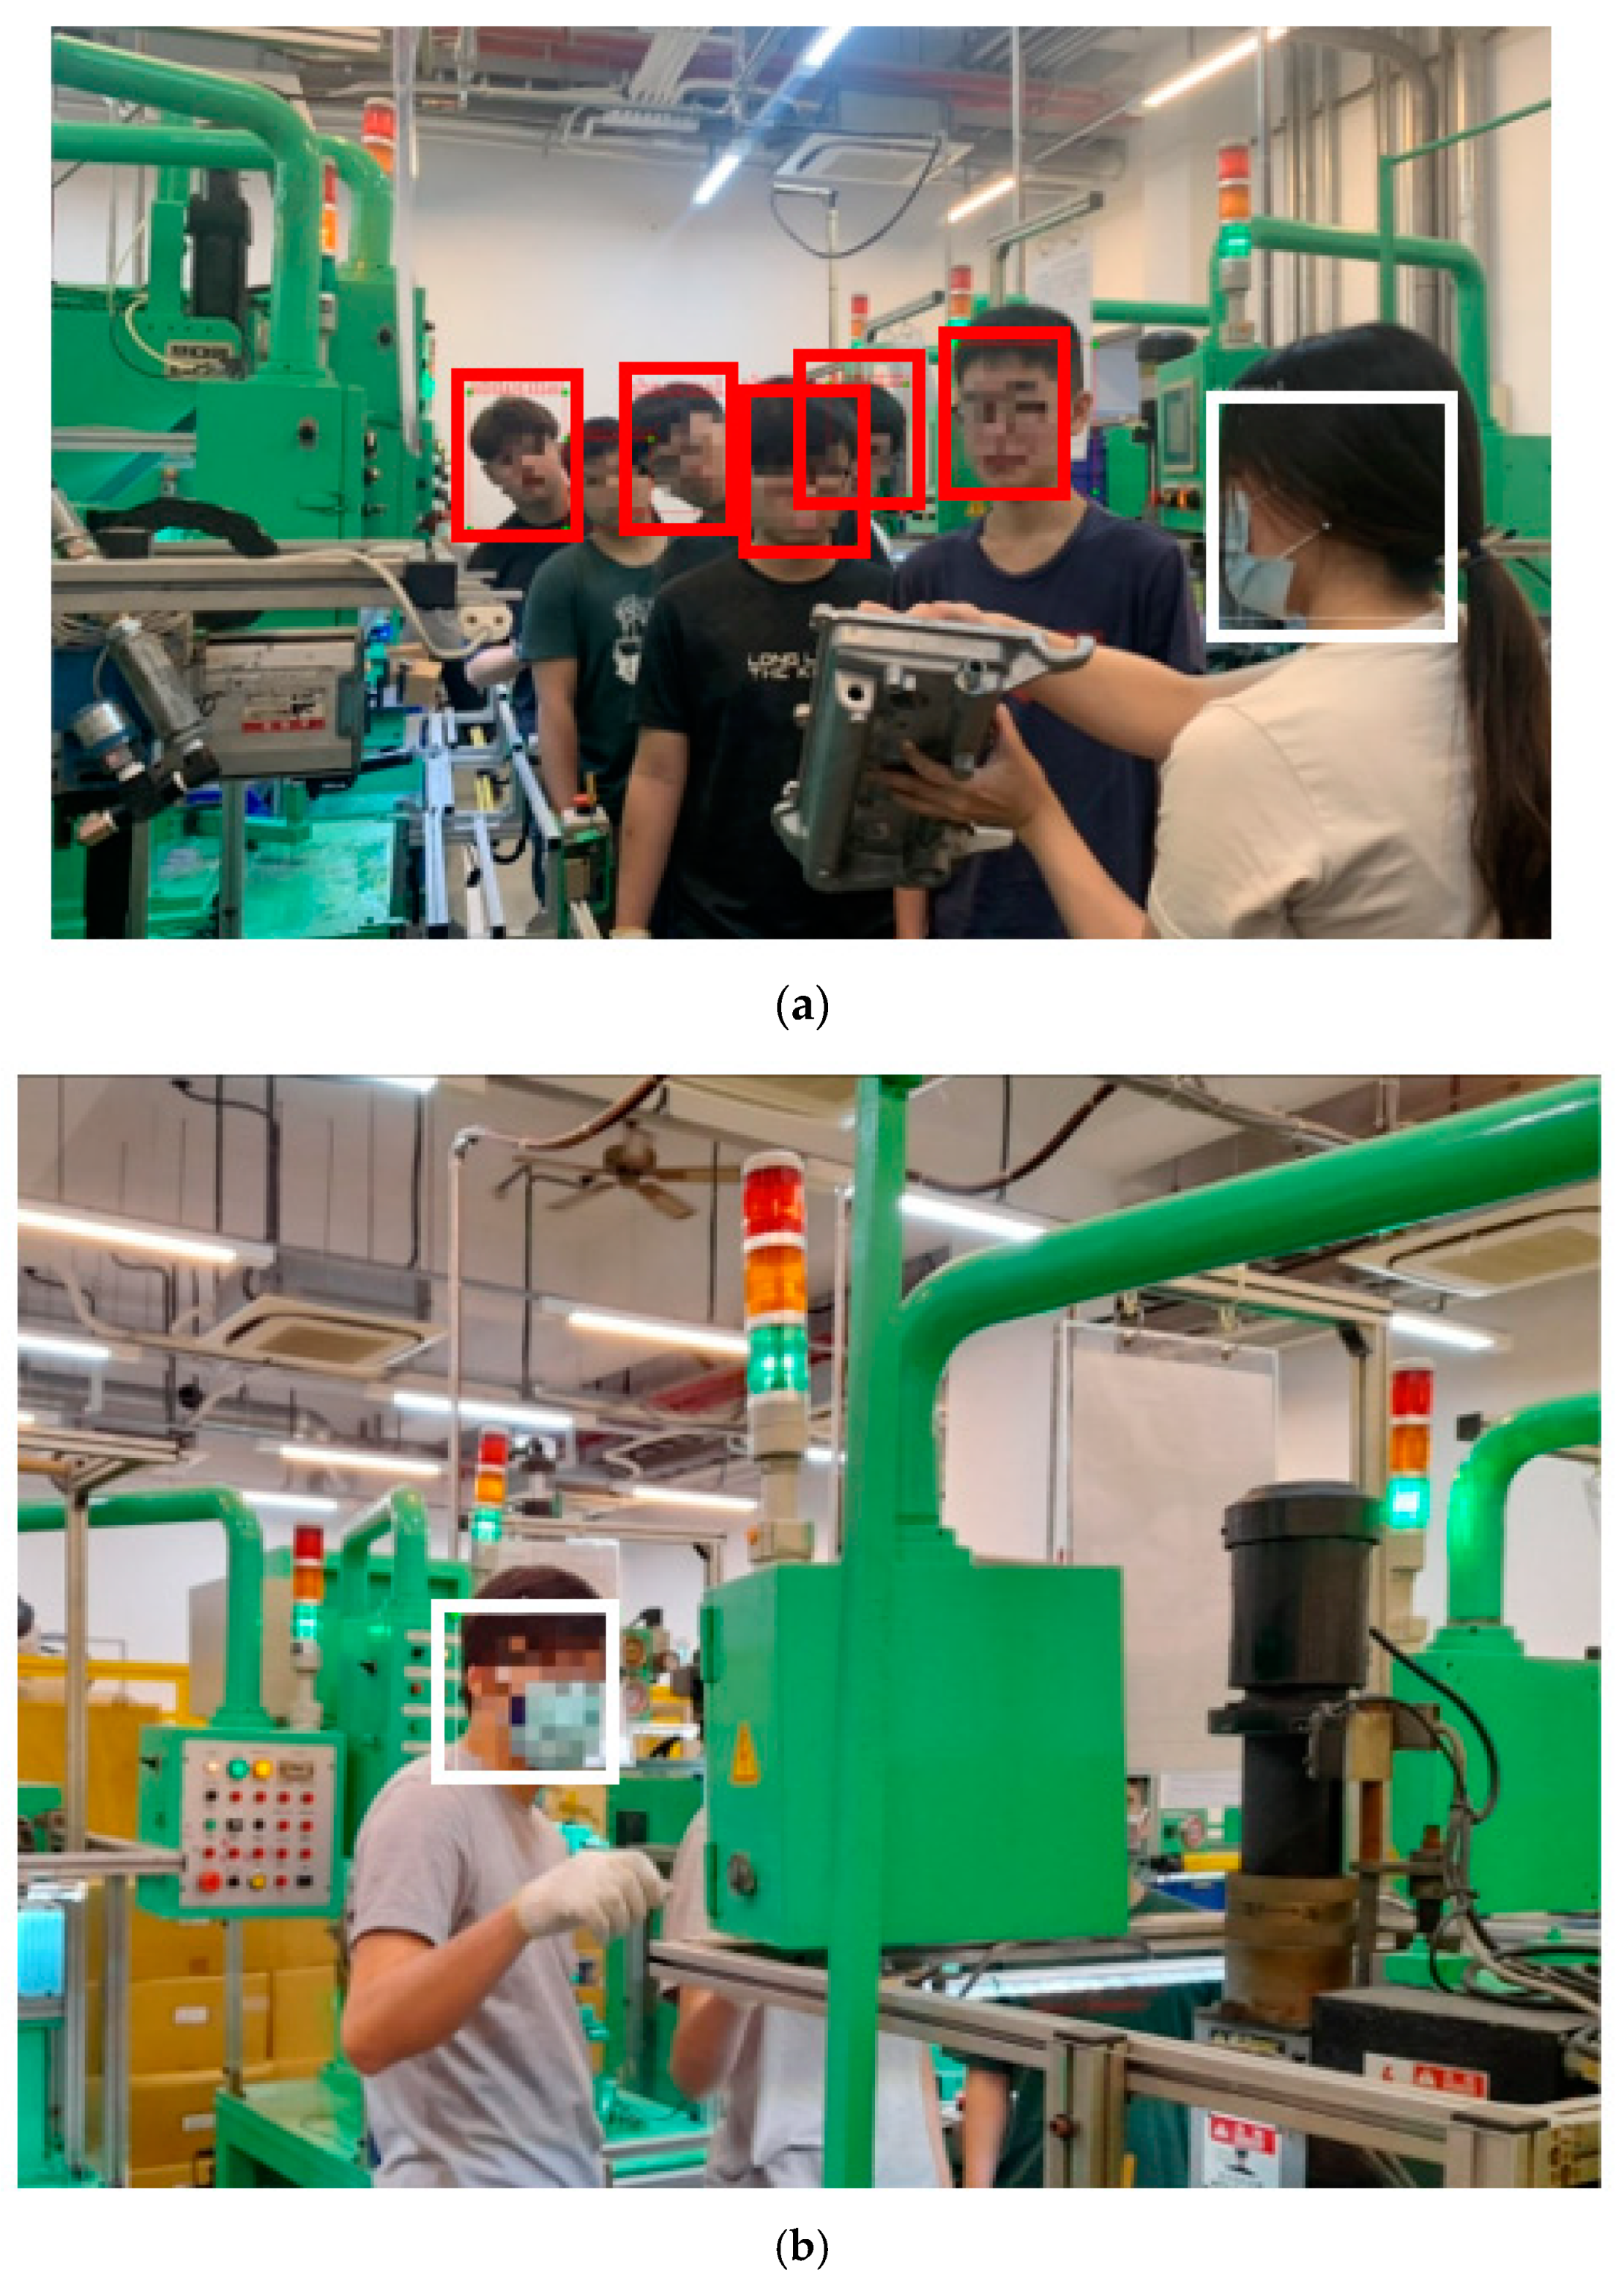
However, the resized data require another process if the image is blurry. Figure 11 shows the output of filtering. Furthermore, the inverse filter is used for image restoration, and the preprocessed data are labeled. Figure 12 illustrates the output of image labeling. The labeled data is in the XML format and could be extracted and recomputed for transforming as the YOLO import format.
5.1.2. The Results of the Trained Model
Note that 70% of the dataset is employed as a training dataset, and 30% of the dataset is used as a test dataset. Table 3 illustrates the evaluations of the YOLO model and the proposed reinforcement training model. The average value for both algorithms is 0.84. The operator operating a machine in the manufacturing processing has diverse behavior, and it is difficult to capture the frontal aspect of the body; therefore, the accuracy of the use case may be limited by complex filming angles and different backgrounds. The results indicate that the proposed reinforcement training approach has better accuracy and precision than the result of single-use YOLO. Intriguingly, the experimental result indicated that YOLO has good predictability in the use case. The average precision and recall rates for both algorithms are 0.87 and 0.92, respectively. In addition, the high recall rate represents that the model returns the most accurate results. MCC values for YOLO and the proposed reinforcement training are 0.74 and 0.80, respectively, with a result near 1, inferring a model with significant classification. The average value of the F1-Score is 0.85, indicating that the model is well classified in the positive category (normal class).
5.2. The Implementation of the CAADS
5.2.1. Validation of Data Transmission-Data Consistency
Data consistency is a crucial factor for IIoT at the manufacturing site. Therefore, this study verified the data consistency by simulating the network’s unexpected interruption. Here, the MQTT broker server stops and restarts to disconnect and reconnect the data transmission network. The number of real-time anomalies event counters correctly transmitting to the cloud while the network of the MQTT client is reconnected to the MQTT broker. The last value of the anomaly event counter is 23 after the network is disconnected, and the new value of 24 is uploaded when the network is reconnected (Figure 12). The data in the interrupted network are successfully re-messaged to the cloud MQTT broker when the network is reconnected; thus, the data can constantly transmit between the client and broker server sides.
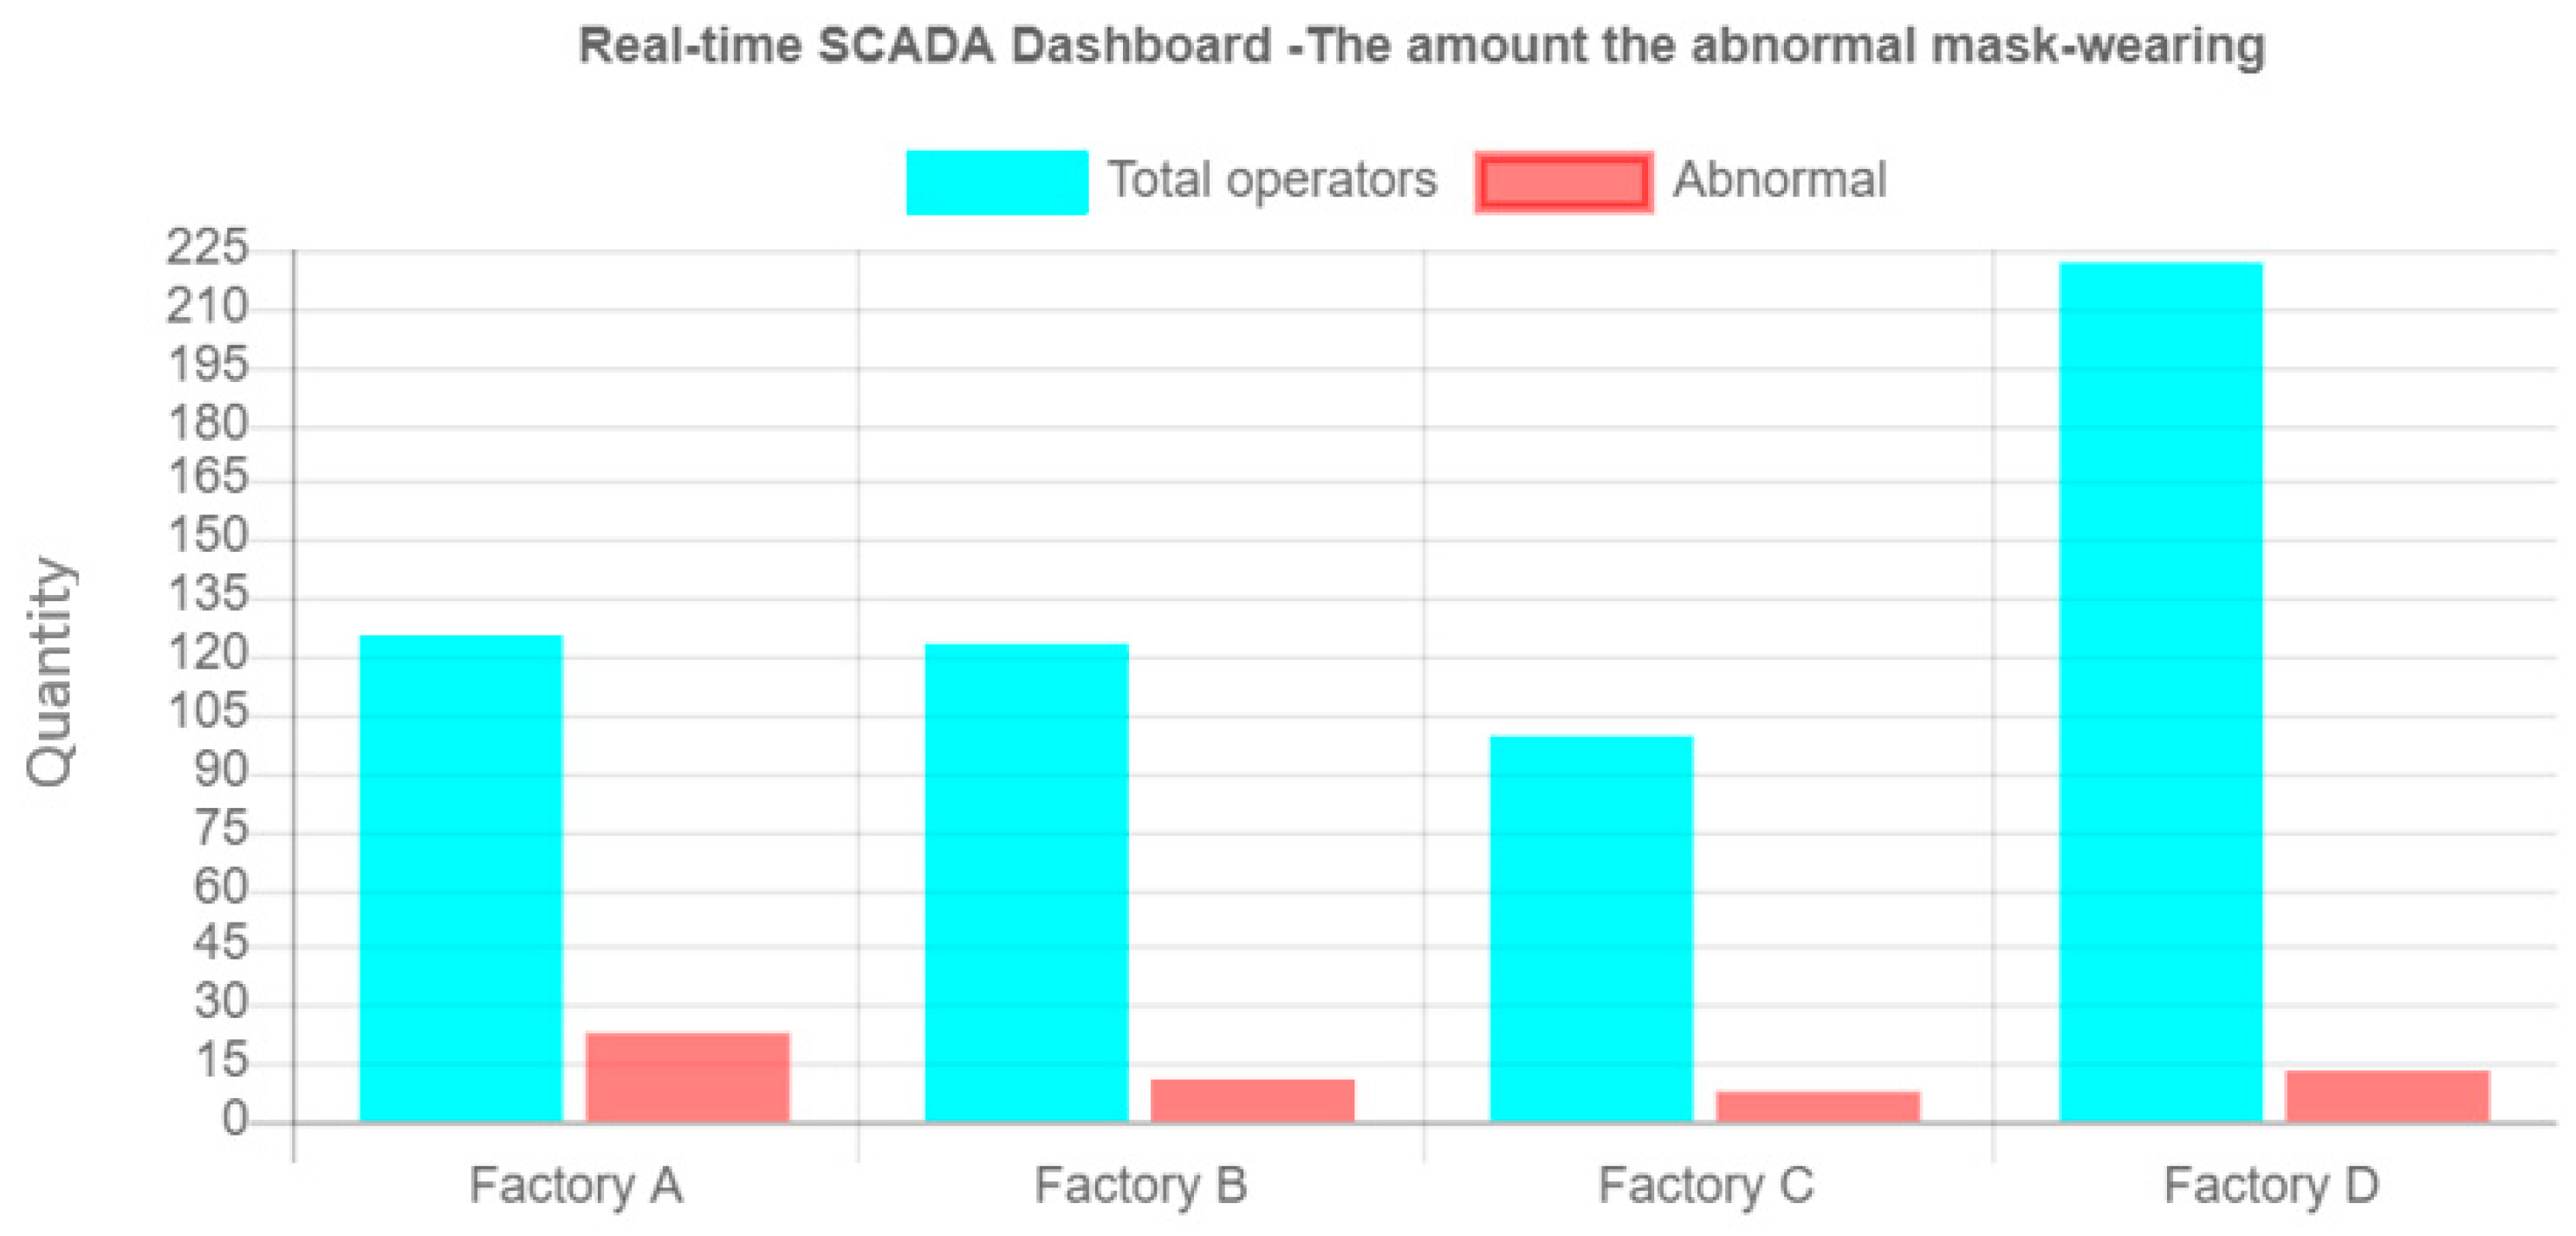
5.2.2. Validation of the Real-Time SCADA Dashboard
The proposed system provides a flexible format for the user to design the data structure and transmission format. Users can construct their own data objects and the property name for a customized data structure. For customized data transmission, users can create their MQTT-messaging content and topic. The customized data content can be retrieved from the cloud data storage based on the customized data structure. Furthermore, the real-time data can be calculated and presented on the dashboard, while SCADA receives a real-time message from the transmission network. Figure 13 depicts the real-time SCADA dashboard result with the one per million-second update frequency. Finally, the data can be accurately updated and displayed on the SCADA dashboard.
5.2.3. Validation of Data Correctness—The Alarm Notification
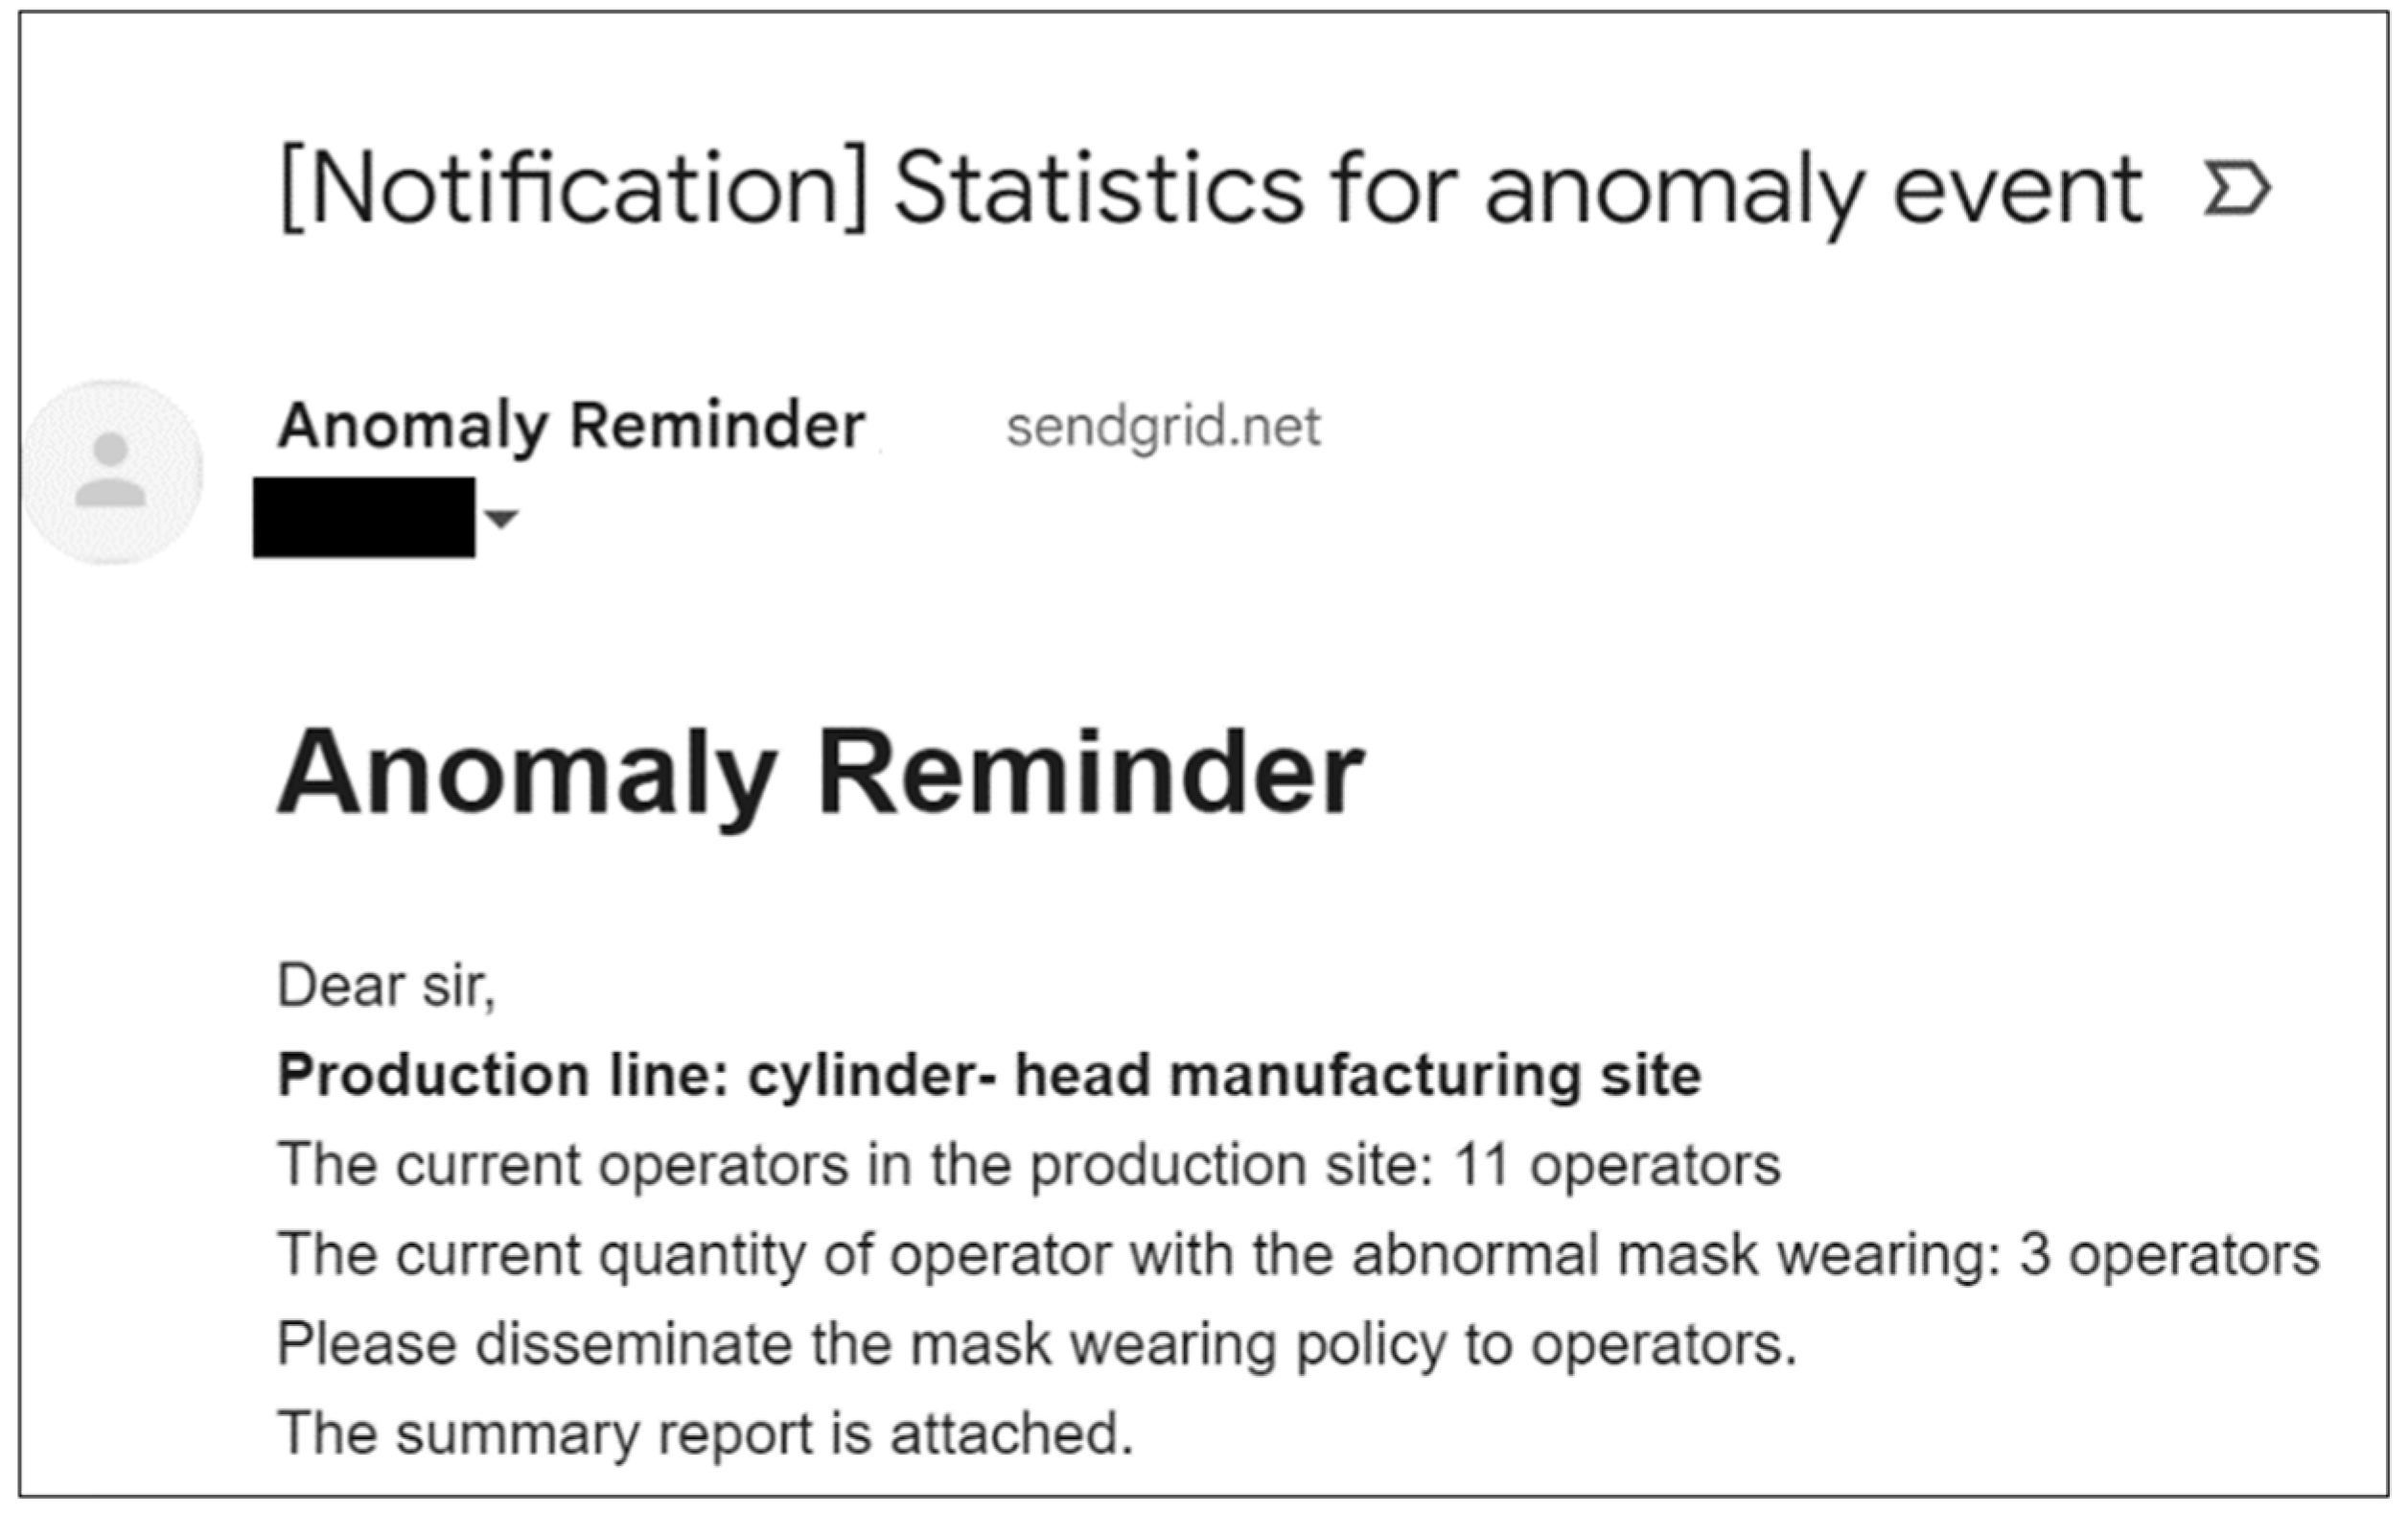
The proposed system provides users with a reminder mechanism by setting the customized threshold value of notification. The automatic notification is activated when the real-time value surpasses the threshold value. While the real-time value achieves the threshold value, the system automatically produces the anomaly report and sends the alarm notification via the SendGrid emailing API (Figure 14).
5.2.4. Validation of Data Correctness—The Form Generator
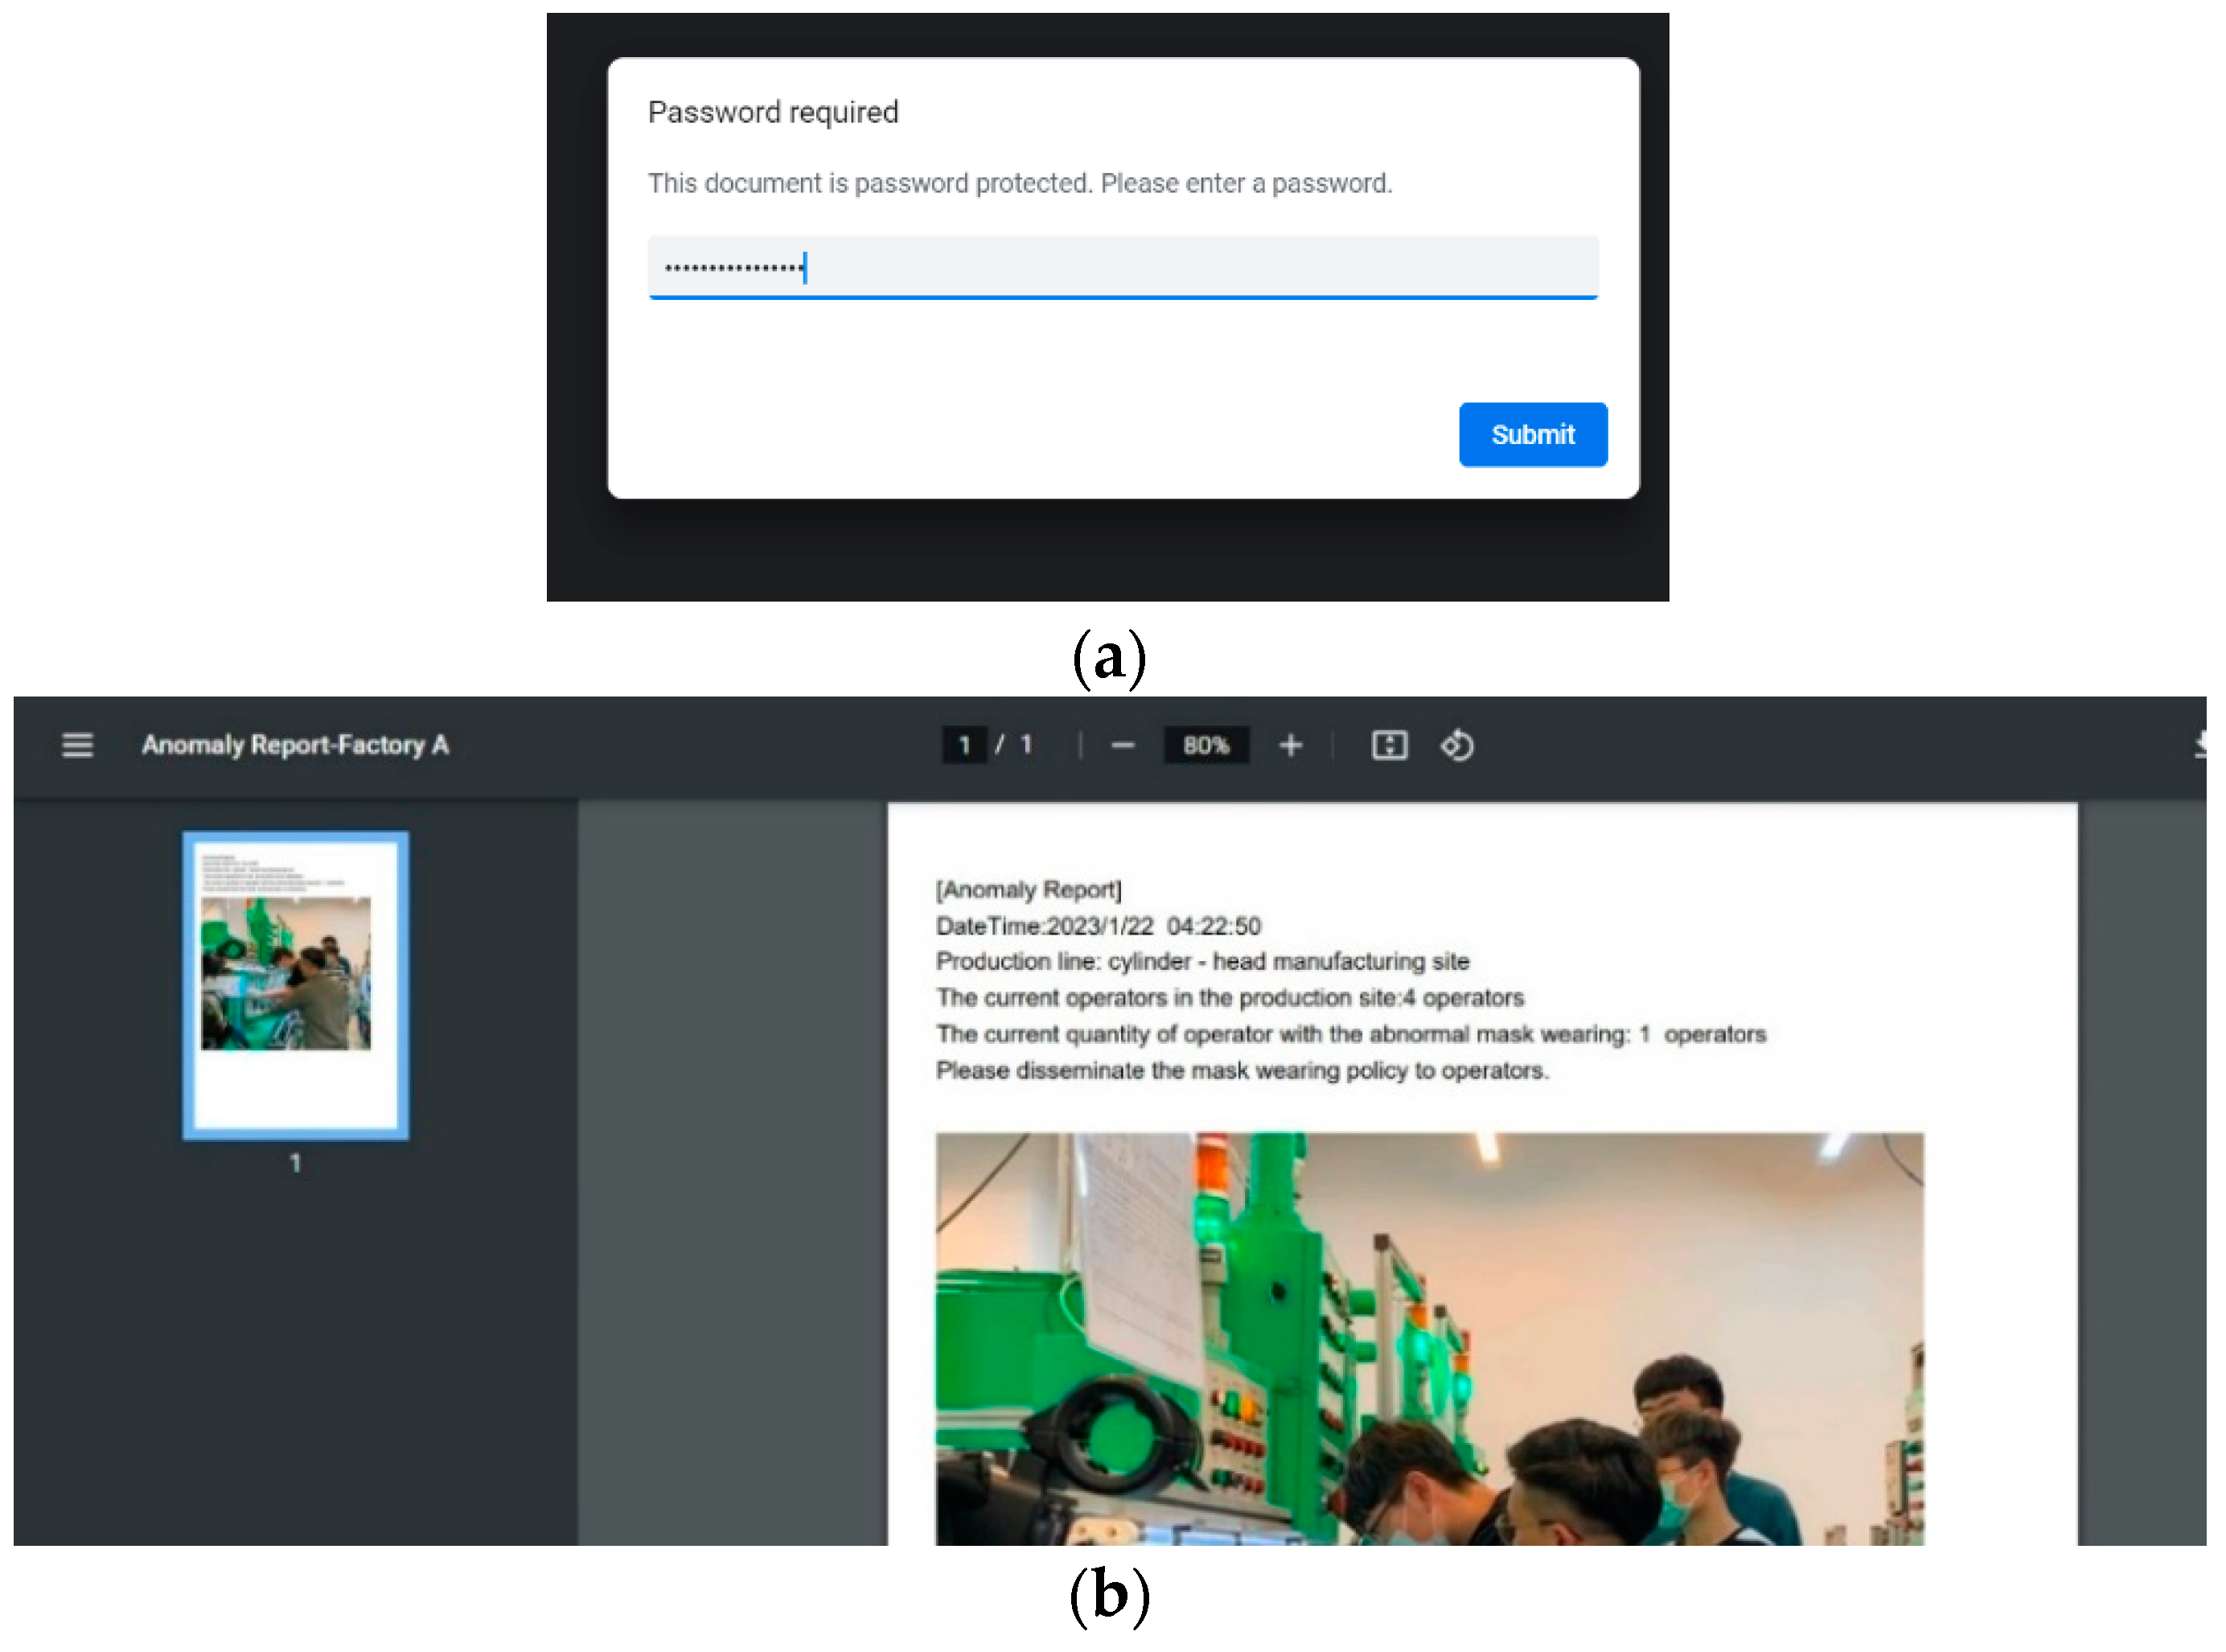
The real-time information cannot be revealed on the SCADA dashboard and can be automatically generated as a form. The result expressed that the encoded message over the MQTT transition could accurately be decoded as human-readable information for generating the form for users to read. Figure 15 shows the results of the anomaly report. The anomaly report has the current information and image. The employee ID number is encrypted as a password to protect the access privileges of the report.
6. Conclusions
Learning from manufacturing data offers an economical way to achieve digital transfer using the software rather than purchasing the hardware. This article introduces a cost-effective method for laborer anomaly behavior detection using DA and cloud technologies. According to DA, the author preprocessed the image data, then applied the preprocessed data in the YOLO model and the proposed reinforcement training mechanism to identify the incorrect face-mask-wearing behavior. Both the YOLO-related models have classification results in the use case. The prior study revealed that YOLO has a good performance on Pascal VOC 2007 data [39]; the result demonstrated that YOLO capitalizes on its accuracy. Some studies have demonstrated that YOLO has good precision [40,41]. This study evaluated the correlation between the proposed reinforcement training and classification performance, indicating that the reinforcement training mechanism can boost accuracy. Through the reinforcement training mechanism, the pattern with lower accuracy had an issue of unclear content; thus, this study used image inpainting to restructure the original data. After reprocessing the weak pattern and retraining in the YOLO model, the accuracy and precision were enhanced. Based on the system design, this study suggests an anomaly detection system. Furthermore, this paper proposes a CAADS system to detect the laborers’ wear masking abnormal behavior using the IoT framework. First, considering all the supervisor management requirements, the user can set up the customized project, including the data node and data schema. Then, the manufacturing site image or other data can be transferred to the customized database storage following the customized project setting. The image data can be employed in the analytics, and abnormal behavior can be detected using the trained YOLO algorithm. The laborer or supervisor can be notified when the anomaly wearing-mask behavior occurs. Finally, the analytics outcome or the data overview can be visualized on the cloud dashboard and exported as any report for the supervisor conduct situation room. Conclusively, this study discussed the efficiency of the YOLO model in image DA and developed a cloud system for the early detection of laborers’ behavior. This study focused on reinforcement learning for the YOLO model, and the experiment is not compared with algorithms. Besides, it was difficult to obtain a sufficient amount of anomaly data from the manufacturing site. The model comparison and limited amount of image datasets served as limitations in this study. Nevertheless, this study demonstrated the entire workflow from data analytics to system design. Therefore, in future studies, an enlarged sample size of images and more model comparison can help extensively explore more valuable information for anomaly detection.
Funding
This research was funded by the National Science and Technology Council grant number no. 111-2221-E-224-033-MY2 and MOE “Teaching Practice Research” Subsidies Program grant number PBM1110139.
Institutional Review Board Statement
Not applicable.
Informed Consent Statement
Not applicable.
Conflicts of Interest
The authors declare no conflict of interest.
References
- World Health Organization. A Clinical Case Definition of Post COVID-19 Condition by a Delphi Consensus, 6 October 2021. 2021. Available online: https://www.who.int/publications/i/item/WHO-2019-nCoV-Post_COVID-19_condition-Clinical_case_definition-2021.1 (accessed on 13 March 2022).
- Ceban, F.; Ling, S.; Lui, L.M.; Lee, Y.; Gill, H.; Teopiz, K.M.; Rodrigues, N.; Subramaniapillai, M.; Di Vincenzo, J.; Cao, B.; et al. Fatigue and Cognitive Impairment in Post-COVID-19 Syndrome: A Systematic Review and Meta-Analysis. Brain Behav. Immun. 2022, 101, 93–135. [Google Scholar] [CrossRef]
- Bach, K. Is “Long COVID” Worsening the Labor Shortage? Report, the Brookings Institution: Washington, DC, USA, 2022. [Google Scholar]
- International Labour Organization. ILO Monitor: COVID-19 and the World of Work. Updated Estimates and Analysis, 7th ed.; International Labour Organization: Geneva, Switzerland, 2020. [Google Scholar]
- International Labour Organization. ILO Monitor: COVID-19 and the World of Work. Updated Estimates and Analysis, 8th ed.; International Labour Organization: Geneva, Switzerland, 2021. [Google Scholar]
- Zandt, F. Omicron Winter Causing Record Workforce Shortage; Statista: Hamburg, Germany, 2022. [Google Scholar]
- Windsor-Shellard, B.; Rabiya, N. Coronavirus (COVID-19) Related Deaths by Occupation, England and Wales: Deaths Registered up to and Including 20 April 2020. Statistical Bulletin. London: Office for National Statistics. Available online: http://www.cgas.ch/SPIP/IMG/pdf/coronavirus_covid-19_related_deaths_by_occupation_england_and_wales_deaths_registered_up_to_and_including_20_april_2020.pdf (accessed on 17 March 2022).
- Burdorf, A.; Porru, F.; Rugulies, R. The COVID-19 pandemic: One year later–an occupational perspective. Scand. J. Work. Environ. Health 2021, 47, 245–247. [Google Scholar] [CrossRef] [PubMed]
- Michaels, D.; Wagner, G.R. Occupational Safety and Health Administration (OSHA) and worker safety during the COVID-19 pandemic. JAMA 2020, 324, 1389–1390. [Google Scholar] [CrossRef]
- Gould, E.L.; Rawlston-Wilson, V. Black Workers Face Two of the Most Lethal Preexisting Conditions for Coronavirus—Racism and Economic Inequality: Report; Economic Policy Institute: Washington, DC, USA, 2020. [Google Scholar]
- Chen, Y.H.; Glymour, M.; Riley, A.; Balmes, J.; Duchowny, K.; Harrison, R.; Matthay, E.; Bibbins-Domingo, K. Excess mortality associated with the COVID-19 pandemic among Californians 18–65 years of age, by occupational sector and occupation: March through November 2020. PLoS ONE 2021, 16, e0252454. [Google Scholar] [CrossRef] [PubMed]
- Pittino, F.; Puggl, M.; Moldaschl, T.; Hirschl, C. Automatic anomaly detection on in-production manufacturing machines using statistical learning methods. Sensors 2020, 20, 2344. [Google Scholar] [CrossRef] [PubMed] [Green Version]
- Shi, Y.; Wang, D.; Chen, Y.; Chen, B.; Zhao, B.; Deng, M. An anomaly detection approach from spatio distributions of epidemic based on adjacency constraints in flow space. Cehui Xuebao/Acta Geod. Cartogr. Sin. 2021, 50, 777–788. [Google Scholar]
- Samani, H.; Yang, C.Y.; Li, C.; Chung, C.L.; Li, S. Anomaly Detection with Vision-Based Deep Learning for Epidemic Prevention and Control. J. Comput. Des. Eng. 2022, 9, 187–200. [Google Scholar] [CrossRef]
- Ukil, A.; Bandyoapdhyay, S.; Puri, C.; Pal, A. IoT healthcare analytics: The importance of anomaly detection. In Proceedings of the 2016 IEEE 30th International Conference on Advanced Information Networking and Applications (AINA), Crans-Montana, Switzerland, 23–25 March 2016; IEEE: Piscataway Township, NJ, USA; pp. 994–997. [Google Scholar]
- Sunny, J.S.; Patro, C.P.K.; Karnani, K.; Pingle, S.C.; Lin, F.; Anekoji, M.; Jones, L.; Kesari, S.; Ashili, S. Anomaly Detection Framework for Wearables Data: A Perspective Review on Data Concepts, Data Analysis Algorithms and Prospects. Sensors 2022, 22, 756. [Google Scholar] [CrossRef]
- Salih, K.O.M.; Rashid, T.A.; Radovanovic, D.; Bacanin, N. A Comprehensive Survey on the Internet of Things with the Industrial Marketplace. Sensors 2022, 22, 730. [Google Scholar] [CrossRef]
- Cheng, J.; Chen, W.; Tao, F.; Lin, C.L. Industrial IoT in 5G environment towards smart manufacturing. J. Ind. Inf. Integr. 2018, 10, 10–19. [Google Scholar] [CrossRef]
- Wuest, T.; Kusiak, A.; Dai, T.; Tayur, S.R. Impact of COVID-19 on Manufacturing and Supply Networks—The Case for AI-inspired Digital Transformation. 2020. Available online: https://papers.ssrn.com/sol3/papers.cfm?abstract_id=3593540 (accessed on 15 April 2022).
- Alhayani, B.; Abdallah, A.A. Manufacturing intelligent Corvus corone module for a secured two way image transmission under WSN. Eng. Comput. 2020, 38, 1751–1788. [Google Scholar] [CrossRef]
- Alhayani, B.S. Visual sensor intelligent module based image transmission in industrial manufacturing for monitoring and manipulation problems. J. Intell. Manuf. 2021, 32, 597–610. [Google Scholar] [CrossRef]
- Du Plessis, A.; Yadroitsev, I.; Yadroitsava, I.; Le Roux, S.G. X-ray microcomputed tomography in additive manufacturing: A review of the current technology and applications. 3D Print. Addit. Manuf. 2018, 5, 227–247. [Google Scholar] [CrossRef] [Green Version]
- Wang, J.; Ma, Y.; Zhang, L.; Gao, R.X.; Wu, D. Deep learning for smart manufacturing: Methods and applications. J. Manuf. Syst. 2018, 48, 144–156. [Google Scholar] [CrossRef]
- Li, C.; Hu, M.; Li, Y.; Jiang, H.; Ge, N.; Montgomery, E.; Zhang, J.; Song, W.; Dávila, N.; Graves, C.E.; et al. Analogue signal and image processing with large memristor crossbars. Nat. Electron. 2018, 1, 52–59. [Google Scholar] [CrossRef]
- Lee, J.; Davari, H.; Singh, J.; Pandhare, V. Industrial Artificial Intelligence for industry 4.0-based manufacturing systems. Manuf. Lett. 2018, 18, 20–23. [Google Scholar] [CrossRef]
- Nixon, M.; Aguado, A. Feature Extraction and Image Processing for Computer Vision; Academic Press: Cambridge, MA, USA, 2019. [Google Scholar]
- Qi, X.; Chen, G.; Li, Y.; Cheng, X.; Li, C. Applying neural-network-based machine learning to additive manufacturing: Current applications, challenges, and future perspectives. Engineering 2019, 5, 721–729. [Google Scholar] [CrossRef]
- Lee, J.; Azamfar, M.; Singh, J.; Siahpour, S. Integration of digital twin and deep learning in cyber-physical systems: Towards smart manufacturing. IET Collab. Intell. Manuf. 2020, 2, 34–36. [Google Scholar] [CrossRef]
- Deecke, L.; Vandermeulen, R.; Ruff, L.; Mandt, S.; Kloft, M. Image anomaly detection with generative adversarial networks. In Proceedings of the Joint European Conference on Machine Learning and Knowledge Discovery in Databases, Dublin, Ireland, 10–14 September 2018; Springer: Cham, Switzerland; pp. 3–17. [Google Scholar]
- Berg, A.; Ahlberg, J.; Felsberg, M. Unsupervised learning of anomaly detection from contaminated image data using simultaneous encoder training. arXiv 2019, arXiv:1905.11034. [Google Scholar]
- Wang, C.; Tan, X.P.; Tor, S.B.; Lim, C.S. Machine learning in additive manufacturing: State-of-the-art and perspectives. Addit. Manuf. 2020, 36, 101538. [Google Scholar] [CrossRef]
- Zhang, Y.; Hong, G.S.; Ye, D.; Zhu, K.; Fuh, J.Y. Extraction and evaluation of melt pool, plume and spatter information for powder-bed fusion AM process monitoring. Mater. Des. 2018, 156, 458–469. [Google Scholar] [CrossRef]
- Caggiano, A.; Zhang, J.; Alfieri, V.; Caiazzo, F.; Gao, R.; Teti, R. Machine learning-based image processing for on-line defect recognition in additive manufacturing. CIRP Ann. 2019, 68, 451–454. [Google Scholar] [CrossRef]
- Hou, Y.; Li, Q.; Zhang, C.; Lu, G.; Ye, Z.; Chen, Y.; Wang, L.; Cao, D. The state-of-the-art review on applications of intrusive sensing, image processing techniques, and machine learning methods in pavement monitoring and analysis. Engineering 2021, 7, 845–856. [Google Scholar] [CrossRef]
- Wang, L.; Zhang, D.; Guo, J.; Han, Y. Image anomaly detection using normal data only by latent space resampling. Appl. Sci. 2020, 10, 8660. [Google Scholar] [CrossRef]
- Petrou, M.M.; Kamata, S.I. Image Processing: Dealing with Texture; John Wiley & Sons: Hoboken, NJ, USA, 2021. [Google Scholar]
- Benabdellah, A.C.; Benghabrit, A.; Bouhaddou, I.; Zekhnini, K. Knowledge Discovery for Sustainability Enhancement Through Design for Relevance. In Networking, Intelligent Systems and Security; Springer: Singapore, 2022; pp. 705–722. [Google Scholar]
- Chauhan, R.; Kaur, H. Knowledge Framework for Deep Learning: Congenital Heart Disease. In Deep Learning in Data Analytics; Springer: Cham, Switzerland, 2022; pp. 61–74. [Google Scholar]
- Redmon, J.; Divvala, S.; Girshick, R.; Farhadi, A. You only look once: Unified, real-time object detection. In Proceedings of the IEEE Conference on Computer Vision and Pattern Recognition, Las Vegas, NV, USA, 27–30 June 2016; pp. 779–788. [Google Scholar]
- Chang, C.; Siagian, C.; Itti, L. Mobile robot vision navigation & localization using Gist and Saliency. In Proceedings of the 2010 IEEE/RSJ International Conference on Intelligent Robots and Systems, Taipei, Taiwan, 18–22 October 2010; pp. 4147–4154. [Google Scholar]
- He, W.; Huang, Z.; Wei, Z.; Li, C.; Guo, B. TF-YOLO: An improved incremental network for real-time object detection. Appl. Sci. 2019, 9, 3225. [Google Scholar] [CrossRef] [Green Version]
Figure 1.
The flowchart of the data analytics in this study.

Figure 2.
The image data this study used. (a) Side view. (b) front view.

Figure 3.
The image and labeling region.

Figure 4.
The procedures of the proposed method.

Figure 5.
The confusing matrix this study used.

Figure 6.
The structure of the proposed CAADS system.

Figure 7.
The automatic script runs the GRG non-linear solving method.

Figure 8.
The photographic tool.

Figure 9.
The flowchart of the experiment.

Figure 10.
The output of image resizing (from 1831 × 1373 to 416 × 312).

Figure 11.
The output of image inverse filtering from the defocus image.

Figure 12.
The output of image labeling (The red box line is labeled as an abnormal class/white box line is labeled as a normal class). (a) The pictorial diagram- multiple operators (The operators’ faces were pixelated). (b) The pictorial diagram- single operator (The operator’s face was pixelated).

Figure 13.
Real-time anomaly detection SCADA dashboard.

Figure 14.
The result of anomaly notification via email using the SendGrid API.

Figure 15.
The result of the auto-generated form. (a) Each report has an encrypted password. (b) The content of the decrypted report.
Figure 15.
The result of the auto-generated form. (a) Each report has an encrypted password. (b) The content of the decrypted report.


Table 1.
The primary image processing approach from the related studies.
| Type | Method | Studies |
|---|---|---|
| Hardware | Image transmission | [20,21] |
| X-ray microcomputed tomography | [22] | |
| Software application | Feature extraction | [26,36] |
| Deep learning | [25,27,29,30,31,32,33,34] | |
| Artificial intelligence | [25,27,28,31] | |
| Image statistics | [35,36] | |
| Image compression and convolutional filtering | [24] |
Table 2.
The description of the experimental environment.
| Main Part | Specification |
|---|---|
| Central Processing Unit | AMD (8-Core) 4.7 G |
| Main Board | Asus TUF X570-PLUS(ATX) |
| Random Access Memory | Kingston 128 GB |
| Hard disk | WD SN750SE 500 G/Gen4 |
| Graphics Processing Unit | NVIDIA RTX3080-10 G |
| Power supply unit | Asus ROG STRIX 1000 W |
Table 3.
Results of the trained model.
| Approach | YOLO | YOLO + The Proposed Reinforcement Training | Average |
|---|---|---|---|
| Accuracy | 0.87 | 0.90 | 0.89 |
| Precision | 0.85 | 0.90 | 0.87 |
| Recall rate | 0.92 | 0.93 | 0.92 |
| F1-Score | 0.88 | 0.91 | 0.90 |
| MCC | 0.74 | 0.80 | 0.77 |
Disclaimer/Publisher’s Note: The statements, opinions and data contained in all publications are solely those of the individual author(s) and contributor(s) and not of MDPI and/or the editor(s). MDPI and/or the editor(s) disclaim responsibility for any injury to people or property resulting from any ideas, methods, instructions or products referred to in the content. |
© 2023 by the author. Licensee MDPI, Basel, Switzerland. This article is an open access article distributed under the terms and conditions of the Creative Commons Attribution (CC BY) license (https://creativecommons.org/licenses/by/4.0/).
Share and Cite
MDPI and ACS Style
Hung, Y.-H. A Laborer’s Mask-Wearing Behavior Detection Approach in the Manufacturing Field. Processes 2023, 11, 1086. https://doi.org/10.3390/pr11041086
AMA Style
Hung Y-H. A Laborer’s Mask-Wearing Behavior Detection Approach in the Manufacturing Field. Processes. 2023; 11(4):1086. https://doi.org/10.3390/pr11041086
Chicago/Turabian StyleHung, Yu-Hsin. 2023. "A Laborer’s Mask-Wearing Behavior Detection Approach in the Manufacturing Field" Processes 11, no. 4: 1086. https://doi.org/10.3390/pr11041086
Note that from the first issue of 2016, this journal uses article numbers instead of page numbers. See further details here.