Article

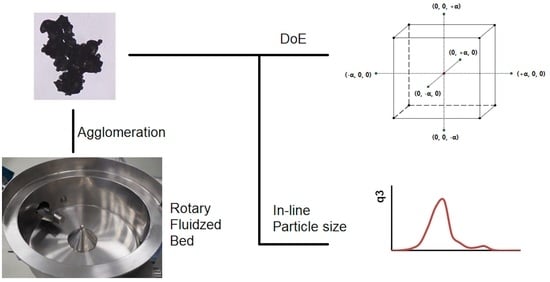
Statistical Investigation of Rotary Fluidized Bed Agglomeration Process with Tangential Spray and In-Line Particle Size Measurement for PAT Process Control

Department of Applied Biosciences and Process Engineering, Anhalt University of Applied Sciences, Strenzfelder Allee 28, 06406 Bernburg, Germany
*
Author to whom correspondence should be addressed.
Processes 2023, 11(4), 1066; https://doi.org/10.3390/pr11041066
Submission received: 26 February 2023 / Revised: 29 March 2023 / Accepted: 31 March 2023 / Published: 2 April 2023
(This article belongs to the Special Issue Computational and Experimental Study of Granulation in Fluidized Beds)

Abstract

:
A statistical design of experiments for a rotary fluidized bed agglomeration process is performed to improve both the knowledge of the process and the influence of the process parameters. Agglomerates of a pharmaceutical formulation are manufactured in a laboratory fluidized bed rotor apparatus with a tangential spray nozzle. Particle size is measured in-line over the entire agglomeration process with a spatial filter velocimetry probe installed directly in the process chamber and off-line with dynamic image analysis for comparison. The influence of the process parameters spray rate, spray pressure, rotor speed, and process air temperature on the fluidized bed is investigated using a central composite design. In-line measurement of particle size is possible over the entire rotor process. Spray pressure, spray rate, square of process air temperature, and some interactions proved to be statistically significant. Particle size measured with spatial filter velocimetry and dynamic image analysis indicates good agreement and a similar trend. The successful application of particle size measurement in a fluidized bed rotor agglomeration at a laboratory scale using spatial filter velocimetry to improve process control and reduce the risk of failed batches serves as the basis for transferring to a production scale.

Graphical Abstract

1. Introduction

Fluidized bed technology has a proven history in the pharmaceutical industry in the production of agglomerates, coating of granulates and pellets, and drying of wet granules and powders [1,2,3,4,5,6]. The application of rotary fluidized bed agglomeration with tangential spraying of the binder solution for drug formulation is currently under investigation [7,8,9,10,11,12,13] but is not yet widely used. The reason could be the special character of the helical nature of the rotary fluidized bed. Compared to the vertical fluidized beds of top spray agglomeration and bottom spray coating with a Wurster inlet, it is characterized by strong centrifugal forces. Particle size and particle size distribution play an important role in the quality of particulate products such as powders, agglomerates, granules, and pellets intended for further processing as filling material for hard capsules or for compression into tablets. Multiparticulate units such as tablets and capsules disintegrate into single units after peroral administration. The release rate of the drug substance, the retention time in the stomach, and the transit time through the intestine depend on the particle size and the particle size distribution of the single units. Therefore, process control and product quality at a high level according to the demands of pharmacopoeias and authorities should be ensured by the concept of process analytical technology (PAT) [14] and Industry 4.0 [15] in the pharmaceutical industry.
In-line particle size measurement with spatial filter velocimetry (SFV) has been successfully applied in fluidized bed agglomeration, drying, and coating [16,17,18,19,20,21,22,23]. Recently, studies on the application of the SFV probe in rotary fluidized bed agglomeration with tangential spray have been conducted [24]. Further studies on this special field are not known to date [25,26]. The installation of the probe in the rotor chamber of the fluidized bed apparatus turned out to be challenging, since the probe’s position has an influence on the measuring results, especially with increasing volume of the fluidized bed. Nevertheless, the measured particle size values of the SFV were in good agreement and with a similar trend with those of the dynamic image analysis (DIA). The process parameters spray rate, spray pressure, rotor disk velocity, and batch size were found to be significant using a Plackett–Burman design [24].
In the present study, the investigation of the rotary fluidized bed agglomeration process with a tangential spray at a laboratory scale was continued to obtain more solid information about the conditions for reproducible particle size measurement with SFV. A successful implementation of the in-line particle size measurement at a laboratory scale should create the prerequisite for the application at a production scale. The influences of the process parameters of the rotary fluidized bed agglomeration on the product quality are investigated for further development of PAT. For this purpose, a response surface design (central composite design, CCD) was performed and evaluated. The reproducibility of the particle size measurement was once more verified by comparison with off-line results from DIA [24].

2. Materials and Methods

2.1. Materials

Microcrystalline cellulose (Avicel® PH101, FMC International, Cork, Ireland, median 110 μm) is used as a solid material and filling agent in the agglomeration process. The agglomeration fluid is prepared with three components dissolved in purified water (Table 1). The model drug substance (API) and preservative sodium benzoate (S3 Chemicals, Bad Oeynhausen, Germany) shows several advantages for the experimental program. It is easily soluble in water and simple methods such as UV-VIS spectroscopy can be used for chemical analysis. The binders polyvinylpyrrolidone (Povidon K 25, Carl Roth, Karlsruhe, Germany) and macrogol 6000 (polyethylene glycol 6000, Clariant, Muttenz, Switzerland) guarantee suitable agglomeration and formation of a stable granulate known from earlier investigations. All substances refer to European Pharmacopoeia quality [27].

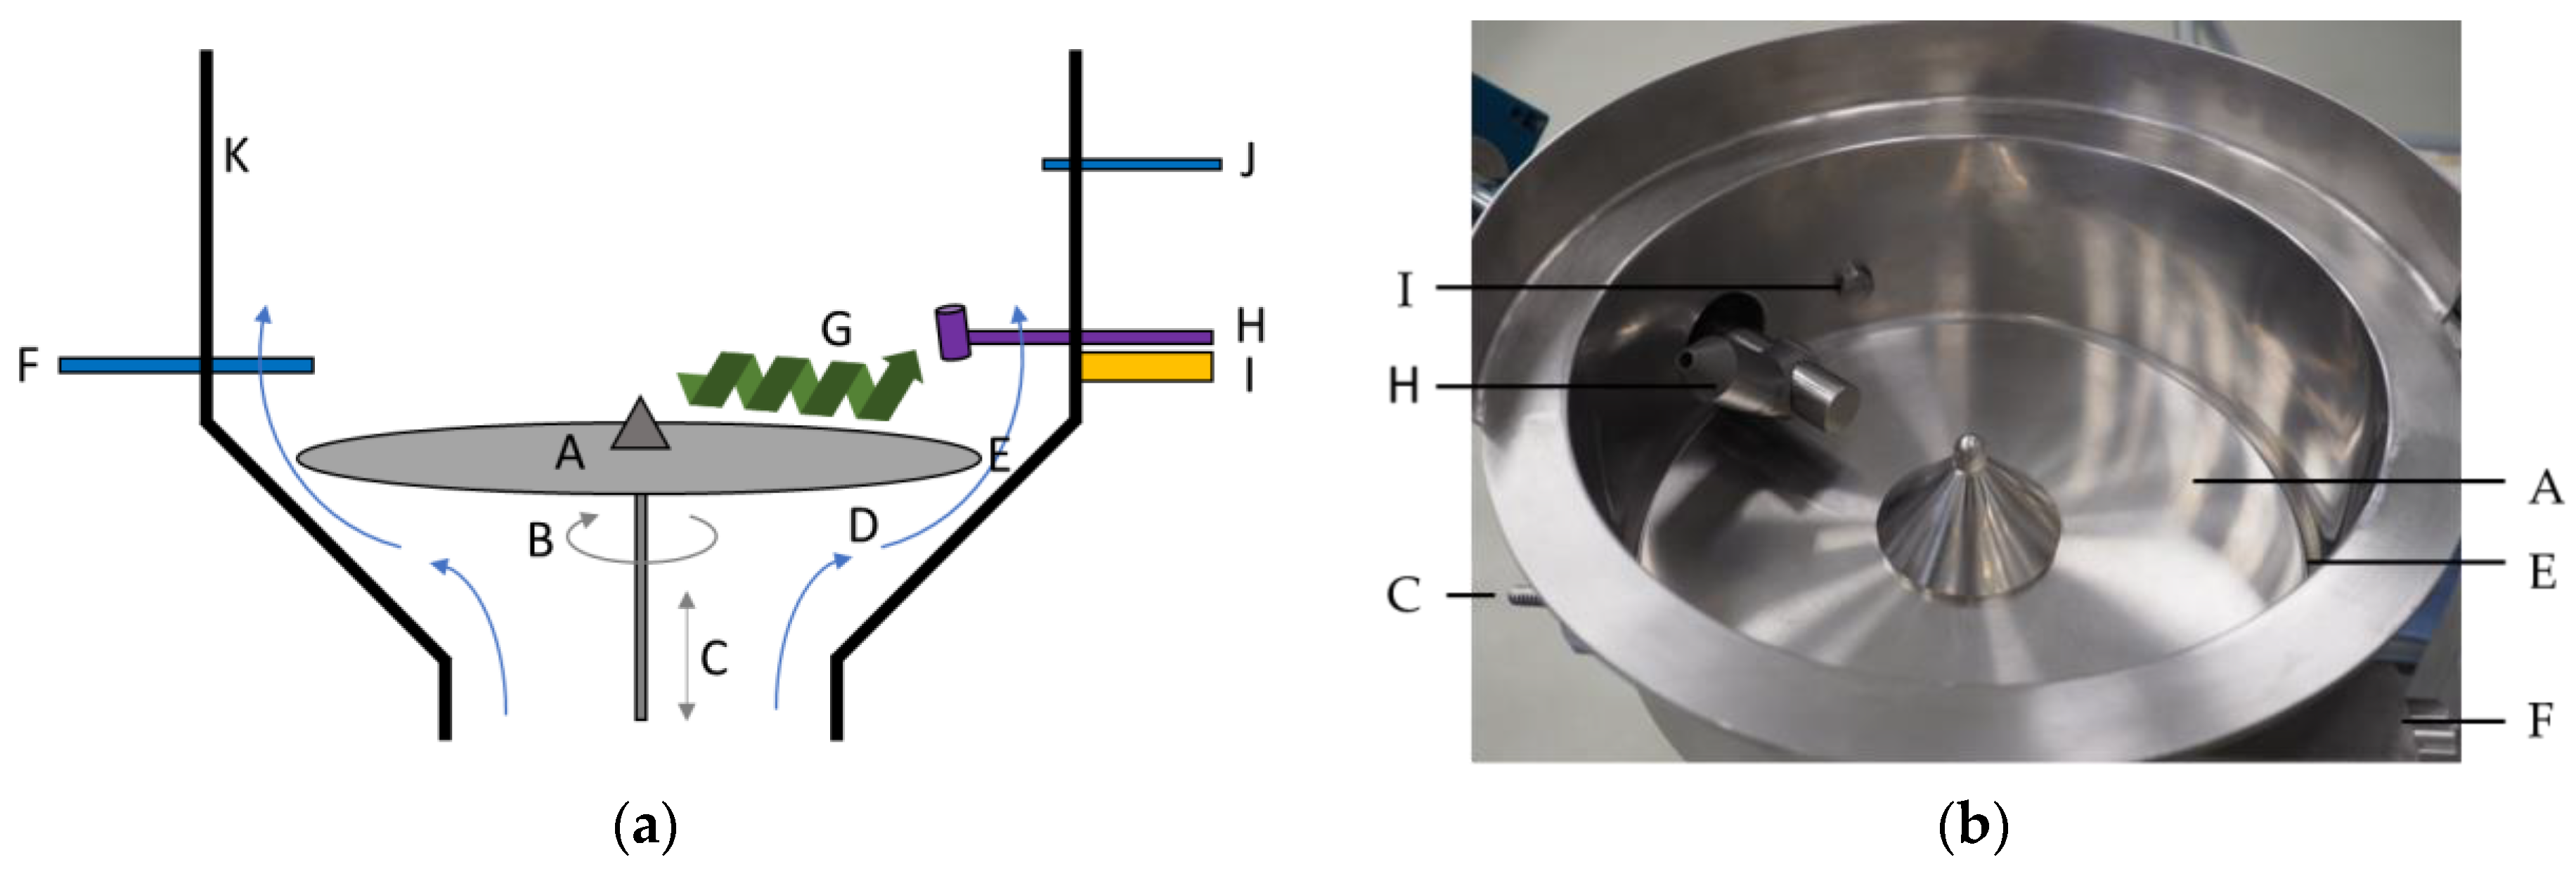
2.2. Rotary Fluidized Bed Process

The agglomeration was performed in a batch laboratory fluidized bed apparatus with rotor insert (GPCG 1.1, Glatt, Binzen), tangential spray binary nozzle, and the SFV probe installed directly into the process chamber above the rotor disk (Figure 1). MCC was fed into the process chamber and agglomerated with an aqueous solution of sodium benzoate, polyethylene glycol 6000, and polyvinylpyrrolidone [24]. Agglomeration occurs under the action of three forces: process air volumetric flow from the bottom to the top of the process chamber, centrifugal force of the rotor disk, and gravitation force generating a helical movement of the material. The whole process is controlled by in-line particle size measurement with the SFV probe, resulting in a new quality in the implementation of PAT requirements. The fluidized bed apparatus itself enables continuous measurement of the process parameters product temperature in the process chamber and air differential pressure above the rotor disk for process control according to PAT.
Agglomeration process parameters are shown in Table 2. The process air volumetric flow could not be fixed over the whole process and had to be adapted to the increasing particle size of the granules during the agglomeration process in the range of 35–60 m3/h. The product temperature in the process chamber results from the interaction of different settings of process parameters.

2.3. Central Composite Design

A central composite design (CCD) is a response surface model for the evaluation of square effects and for the improvement of the process response. The core is a two-fold factorial design (2m or 2m-q) expanded by additional central points and star points (α). A CCD was performed with 30 batches including 5 replicates at the central point (Table 3). The levels of the process parameters (factors) spray rate, spray pressure, rotor speed, and process air temperature were varied over a wide range. The product properties sphericity, particle size median (x50.3), and coefficient of variation of the median (CoV of x50.3) as a measure for the width of the chord length distribution (CLD) were selected as responses for the statistical evaluation of the CCD. The general factor adjustment is described in Table 3. The factor setting of each batch and the corresponding results in terms of sphericity, median (x50.3), and COV (x50.3) are presented in the supplemental data (Table S1). The Design Expert software (version 13) was used for the development and evaluation of the experimental design.

2.4. Particle Size Measurement

Particle size and CLD were measured in-line with the SFV probe as a PAT tool (IPP 70, Parsum GmbH, Chemnitz, Germany) over the entire rotor agglomeration process. The process parameters of the SVF probe are listed in Table S2 of the supplementary data. Depending on the density of the spiral fluidized bed, the angle of the disperser should be varied [24]. Data were collected using Parsum software V801_Built 2016_03_28 and later evaluated with the Parsum LogAnalyzer v03-09.11.2018 rel. 19.06.2020.
For comparison, particle size and CLD were measured off-line with dynamic image analysis (DIA, Camsizer® P4, Retsch, Haan, Germany). The particle size of the DIA was determined from the minimal chord length of the particle projection (xc_min). The measuring principles of both methods were described elsewhere [24,25].

3. Results and Discussion

3.1. Statistical Evaluation of CCD

Thirty batches were prepared with the sodium benzoate formulation (Table 1) and the influence of the main effects, two-way interactions, and quadratic effects of spray pressure, spray rate, process air temperature, and rotor speed on the process responses of median (x50.3), CoV (x50.3), and sphericity were investigated. The selection and setting of the factors were based on their significant effect in the screening design [24]. The product yield is high and ranges from 87 to 93%. A small spray pressure range was chosen for the CCD (1.6–2.0 bar) compared to the screening design (1.4–2.2 bar, [24]). For this reason, the scatter of median (x50.3) and CoV (x50.3) is low (Table 4). No suitable model for sphericity could be found (R2 = 0.34, Table 4), and therefore it was not statistically evaluated in this study. The batches of the CCD are not spherical as indicated by the sphericity of 0.77–0.82.
Statistical analysis of the process responses median (x50.3) and CoV (x50.3) reveal significant factors based on p-values, standard regression parameters, and associated 95% confidence intervals (Table 5). The models are highly significant for both process responses (p < 0.001).

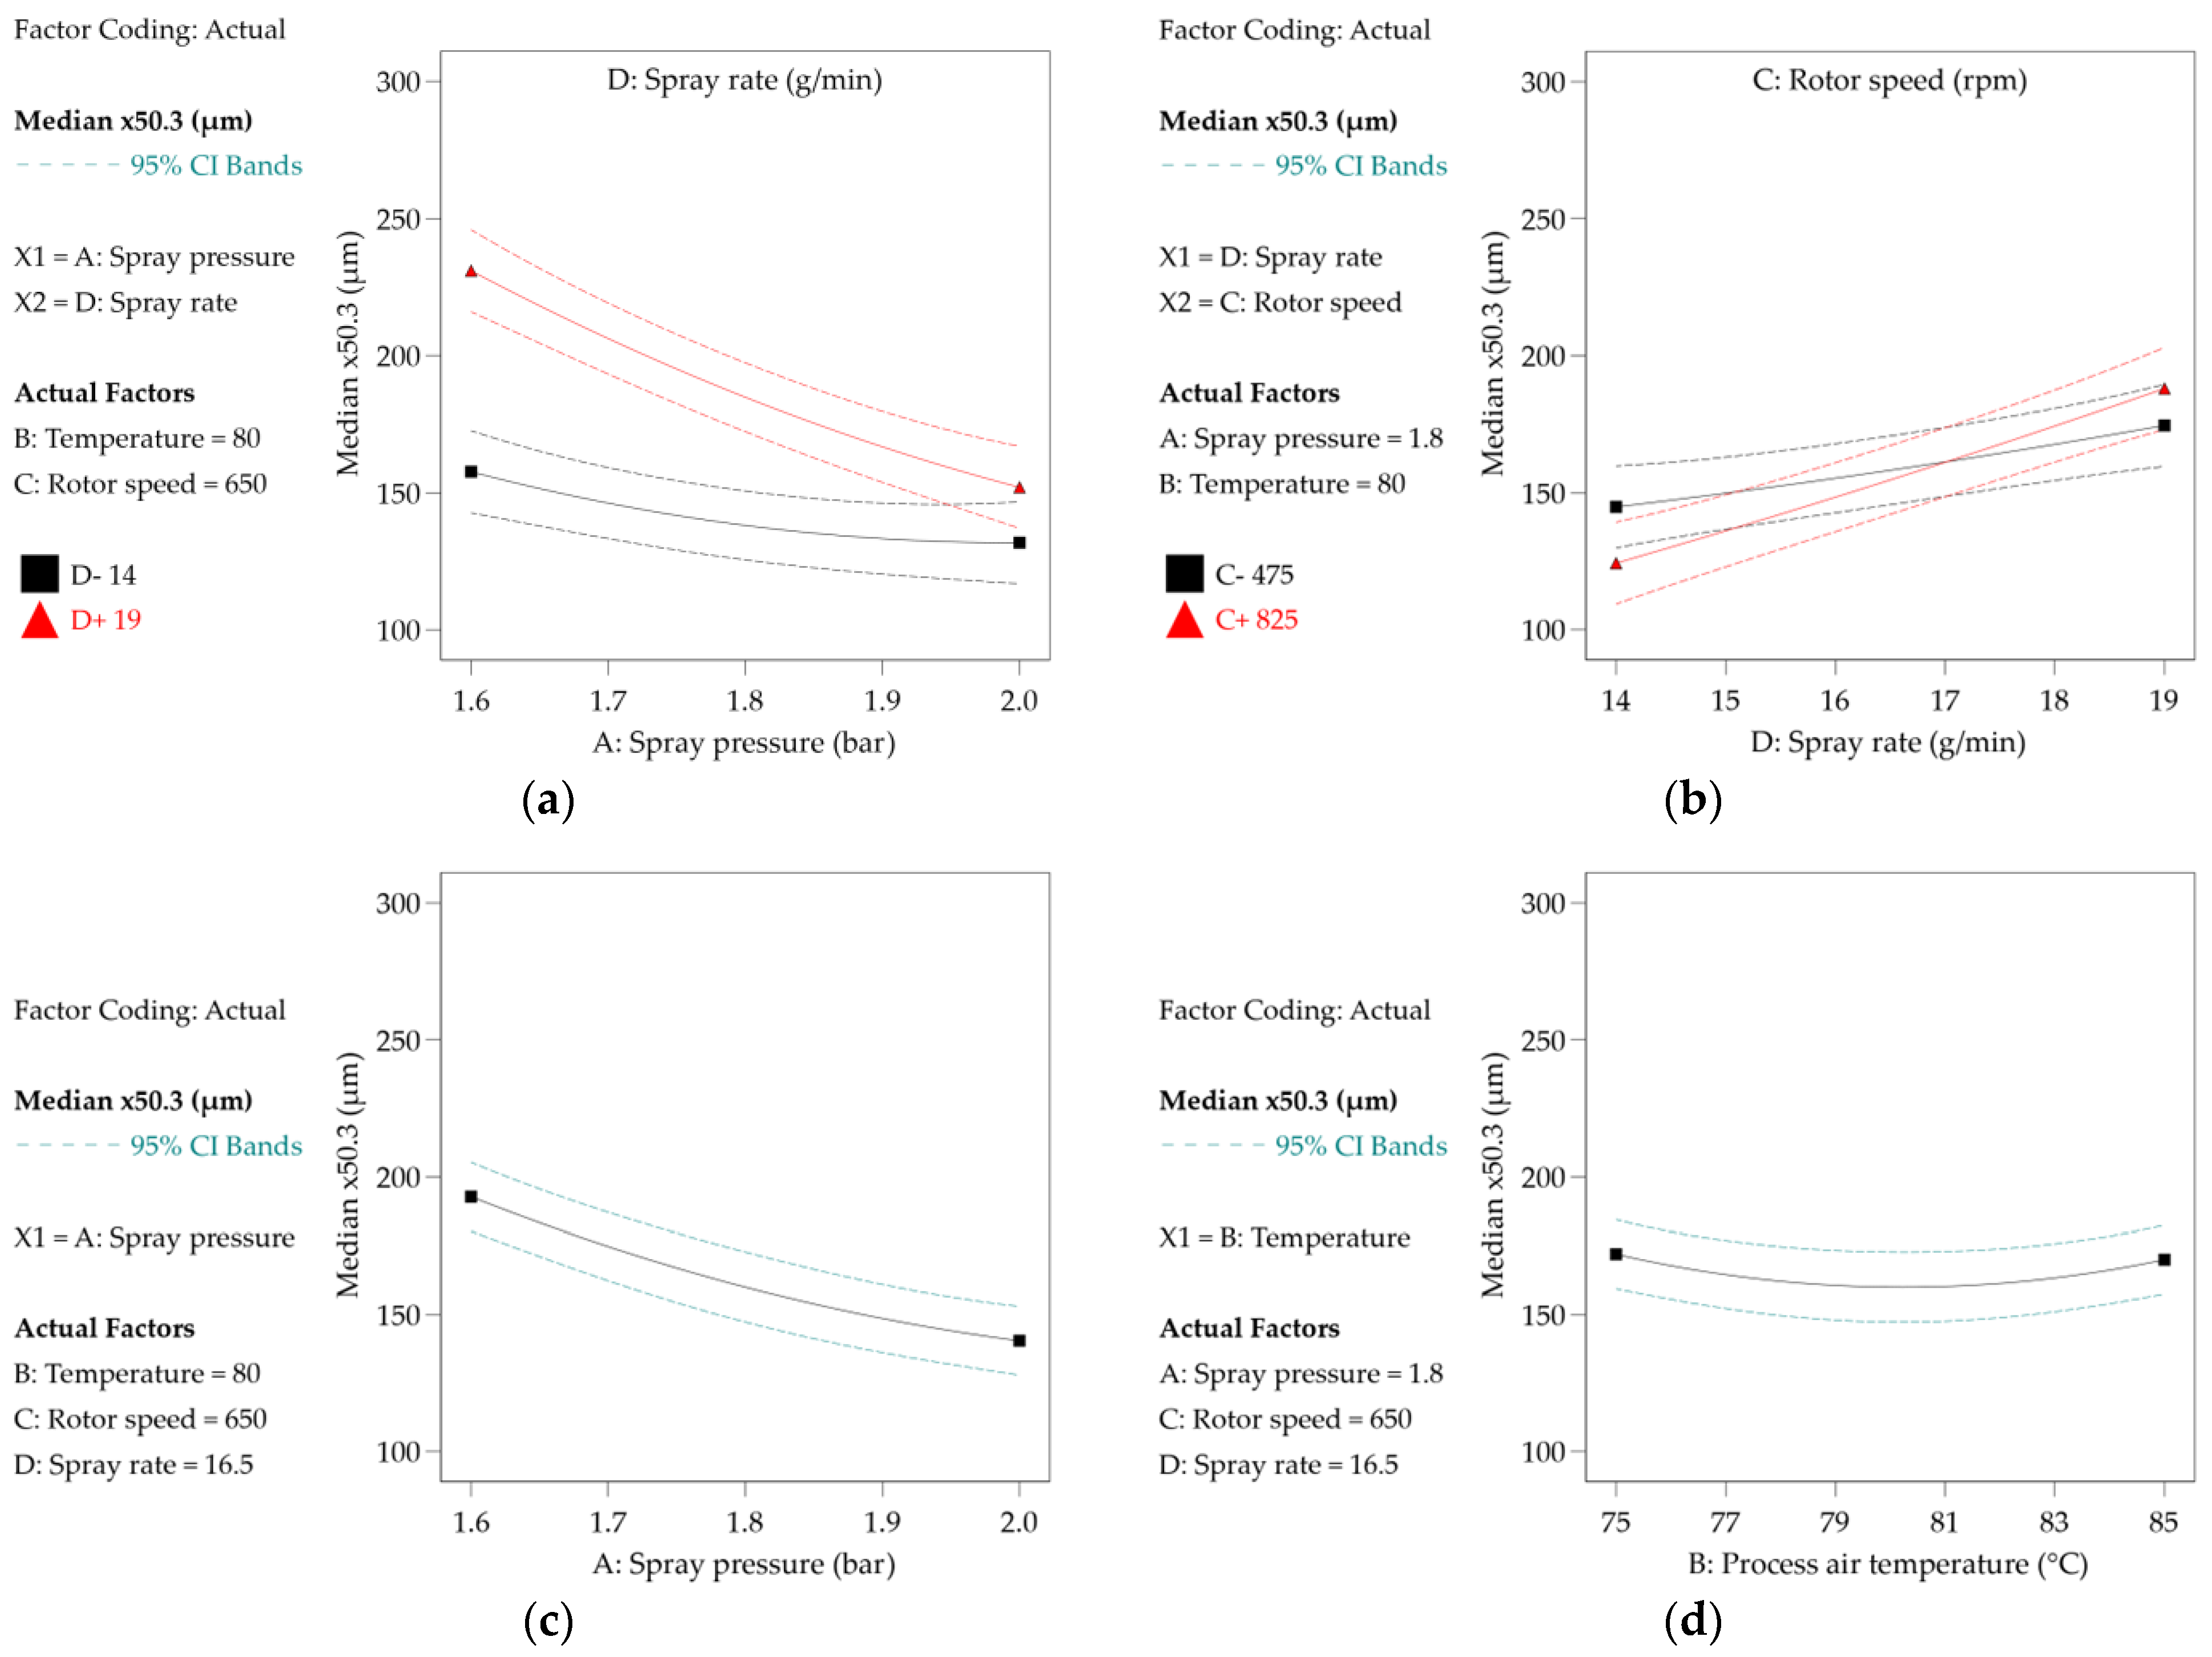
3.1.1. Statistical Evaluation of Median (x50.3)

The median shows highly significant results for spray rate and spray pressure (Table 5, A and D, column 2), confirming the results from the screening design. In addition, significant effects of the interactions of spray pressure and spray rate, rotor speed and spray rate, and the quadratic effects of spray pressure and process air temperature are evident. A separate investigation and discussion of the main effects is no longer trivial and may be impossible in the case of significant interactions. The effects are discussed below using graphs. The corresponding response surface models (Figure S1) are attached to the supplementary data for further visual evaluation of the data and for the determination of local minima and maxima in terms of the median (x50.3).
There is an ordinal interaction between the spray rate and the spray pressure, which allows the separate interpretation of both main effects (Figure 2a). An ordinal interaction is characterized by the fact that the graphs do not cross, and both graphs have either a positive or negative slope [28]. In the present case, the median increases with increasing spray rate and decreasing spray pressure, confirming the results of the screening design. A high spray rate, in combination with a low spray pressure, produces large droplets which, due to their small specific surface area, evaporate more slowly, promote higher product moisture, and greater formation of liquid bridges, leading to large agglomerates and a broad CLD.
The interaction of rotor speed and spray rate (Figure 2b) is significant at the 95% confidence level (Table 5, CD, column 2, p = 0.035), although the main effect of rotor speed does not indicate significance (p = 0.57). This is a semi-disordinal effect due to a positive slope of two crossing curves [28]. Small median values are obtained at a low spray rate and a high rotor speed. Presumably, the low spray rate produces dry, brittle agglomerates that are mechanically stressed by increasing rotor speed, causing them to break down into smaller subunits and keeping the particle size small. The largest median value is observed at a high spray rate in combination with a likewise high rotor speed (Figure 2b). Wet particles lead to liquid–liquid collisions and the formation of agglomerates, which is exacerbated by the strong mixing of the product. Above a certain moisture content, the powder bed becomes plastically deformable, with an increase in rotor speed leading to greater compaction and mechanically more stable agglomerates, which is why the particle size increases.
The spray pressure (Figure 2c) has a quadratic effect on the median (Table 5, A2, column 2, p = 0.032). The curve flattens with increasing spray pressure. The reason is probably that the extent of droplet size reduction is not proportional to the increasing spray pressure. Above a certain droplet size, such a high energy is required for further atomization that increasing the spray pressure only produces a marginal effect.
The squared effect of process air temperature (Figure 2d) is highly significant (Table 5, B2, column 2, p = 0.001), while the main effect is not significant (B, p = 0.744). The plot of the median as a function of process air temperature shows an unexpected parabolic behavior. An increasing particle size with increasing process air temperature does not seem plausible. Instead, at high evaporation rates, a decreasing particle size is expected due to a lower agglomeration probability. The reason for this could be a change in viscosity of the granulating fluid at a high temperature caused by polyvinylpyrrolidone that is associated with sticking. Therefore, the validity of the high significance of the quadratic effect of process air temperature should be questioned.

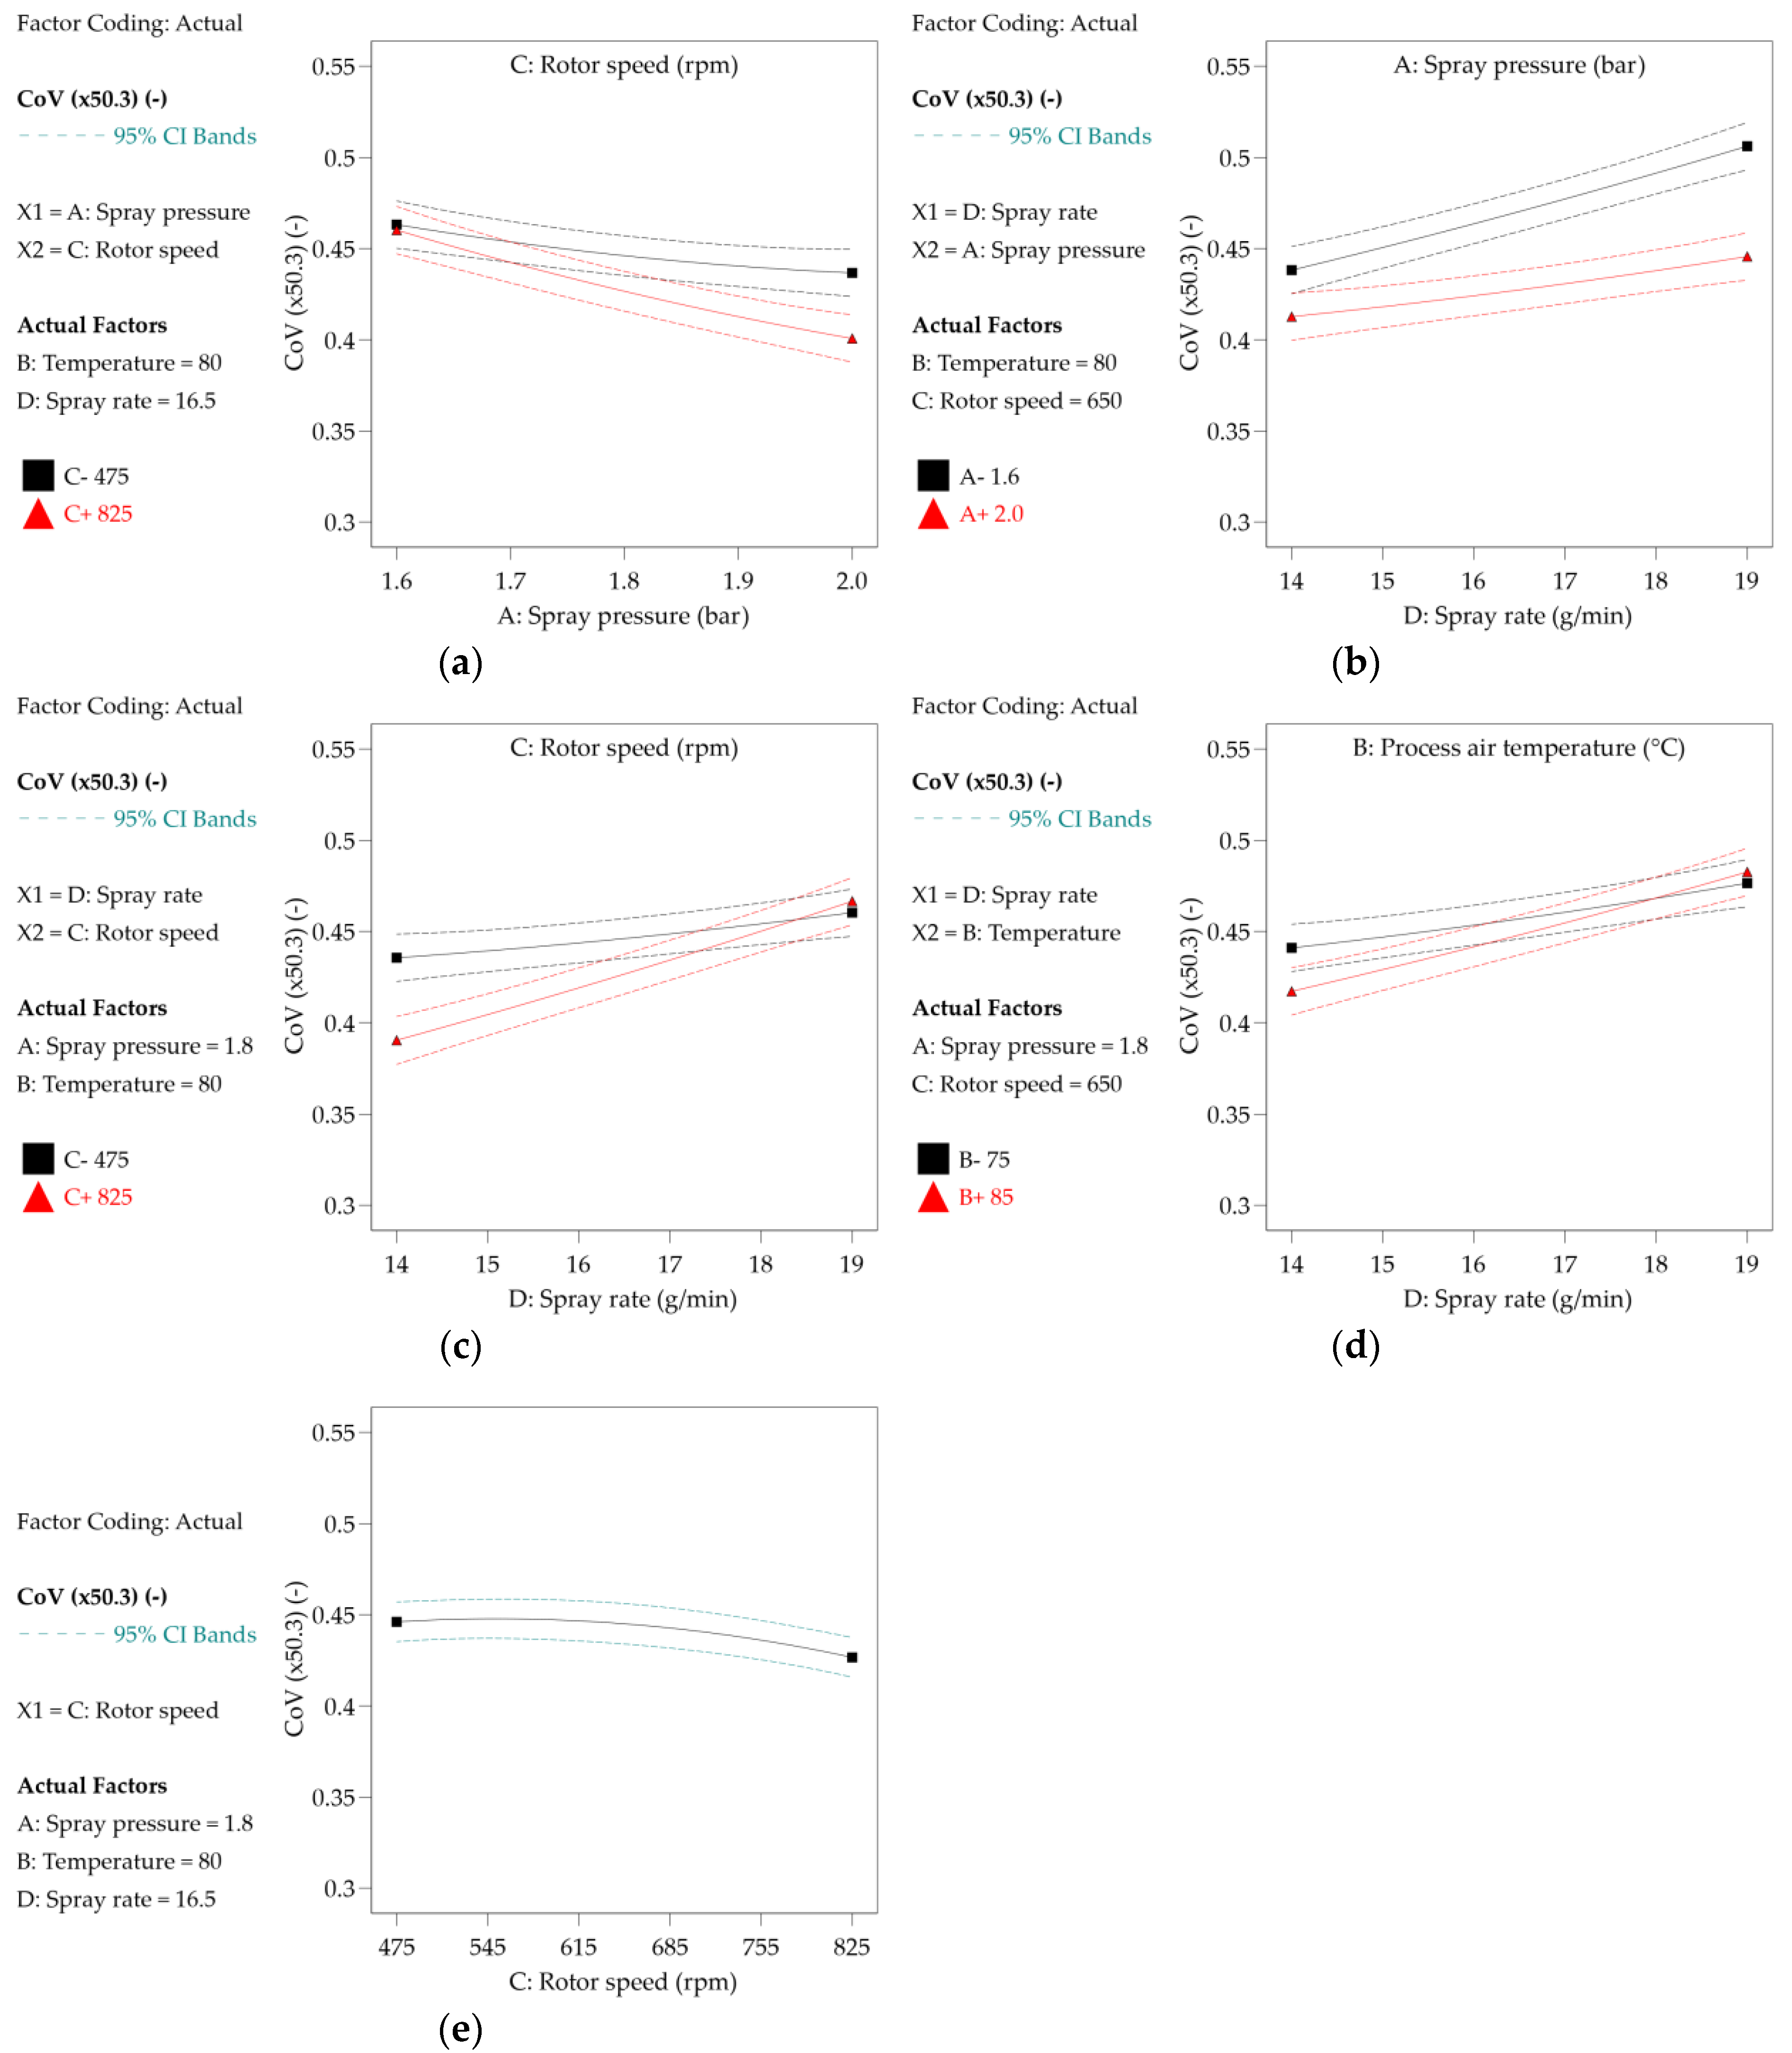
3.1.2. Statistical Evaluation of CoV (x50.3)

CoV of the median of the volume density distribution gives information about the width of the particle size distribution. Even a small proportion of large particles (agglomerates) shifts the particle size to large values, while a higher proportion of small particles does not affect the particle size distribution. Only the volume density distribution and the associated median are suitable for controlling the agglomeration process to prevent the formation of undesirable large agglomerates. The opposite is true for the number density distribution: a small proportion of large particles is not detected in the presence of many small particles due to their high number.
Significant effects on the CoV (x50.3) and, therefore, on the CLD are shown by the main effects of spray pressure, rotor speed, and spray rate; the interactions of spray pressure and rotor speed, spray pressure and spray rate, process air temperature and spray rate, rotor speed and spray rate; and the quadratic effects of process air temperature and rotor speed (Table 5, column 6, p ≤ 0.05). The corresponding response surface models (Figure S2) are attached to the supplementary data for further visual evaluation of the data and for the determination of local minima and maxima in terms of the COV (x50.3).
The effect of the interaction of rotor speed and spray pressure on the CoV (x50.3) is ordinal (Figure 3a). A higher spray pressure or rotor speed results in a smaller CoV (x50.3). A high spray pressure leads to smaller droplets, which allow a more uniform distribution in the powder bed and cause less over-wetting, which in turn leads to a narrow CLD. The higher the rotor speed, the narrower the CLD, since coarse agglomerates are broken up, especially by a strong mechanical load, before liquid bridges harden or crystallize and stable solid particles are formed. At a high rotor speed and high spray pressure, the PGV is particularly narrow, with the reason probably being that less agglomeration was performed with small droplets and strong mechanical stress, and the narrow CLD of the starting material MCC hardly changed.
The interaction of spray pressure and spray rate is also ordinal (Figure 3b). As the spray rate increases and the spray pressure decreases, the CoV (x50.3) increases and the CLD broadens, as expected (lower atomization, large droplets lead to strong local moisturing and formation of few large agglomerates). At a low spray rate, the small droplets can only be broken up insignificantly as the spray pressure increases. A high spray rate in combination with a high spray pressure leads to local over-wetting, uncontrolled agglomeration, and a high CoV (x50.3).
The interaction of spray rate and rotor speed has a semi-disordinal effect on the CoV (x50.3) (Figure 3c). The CoV (x50.3) is lowest at the combination of a low spray rate and high rotor speed and has only a small increase in the median (130 µm, Figure 2b), which is due to the low product moisture and the strong mechanical forces, and thus hardly any formation of agglomerates occurs. At a high spray rate, the effect of rotor speed on CoV (x50.3) is negligible.
The interaction between the process air temperature and the spray rate has a semi-disordinal effect on the CoV (x50.3) (Figure 3d). At a low spray rate, a high temperature leads to a low CoV (x50.3), since the rapid evaporation of the small amount of spray liquid hardly allows the formation of liquid bridges and thus agglomerate growth. At a high temperature, the CLD broadens, and the effect of the spray rate becomes more and more negligible, where viscosity-increasing properties of the binder solution might play a role (see also Figure 2d).
The quadratic effect of rotor speed on the CoV (x50.3) is relatively weak and only visible at high values (Figure 3e). It is possible that a breakup of more stable agglomerates is only noticeable at higher mechanical forces (high rotor speed).
Overall, based on the standard regression parameters, the effects of interactions and quadratic effects are smaller than the main effects of spray pressure and spray rate on the CoV (x50.3) by a factor of 2 to 4 (Table 5, column 7).

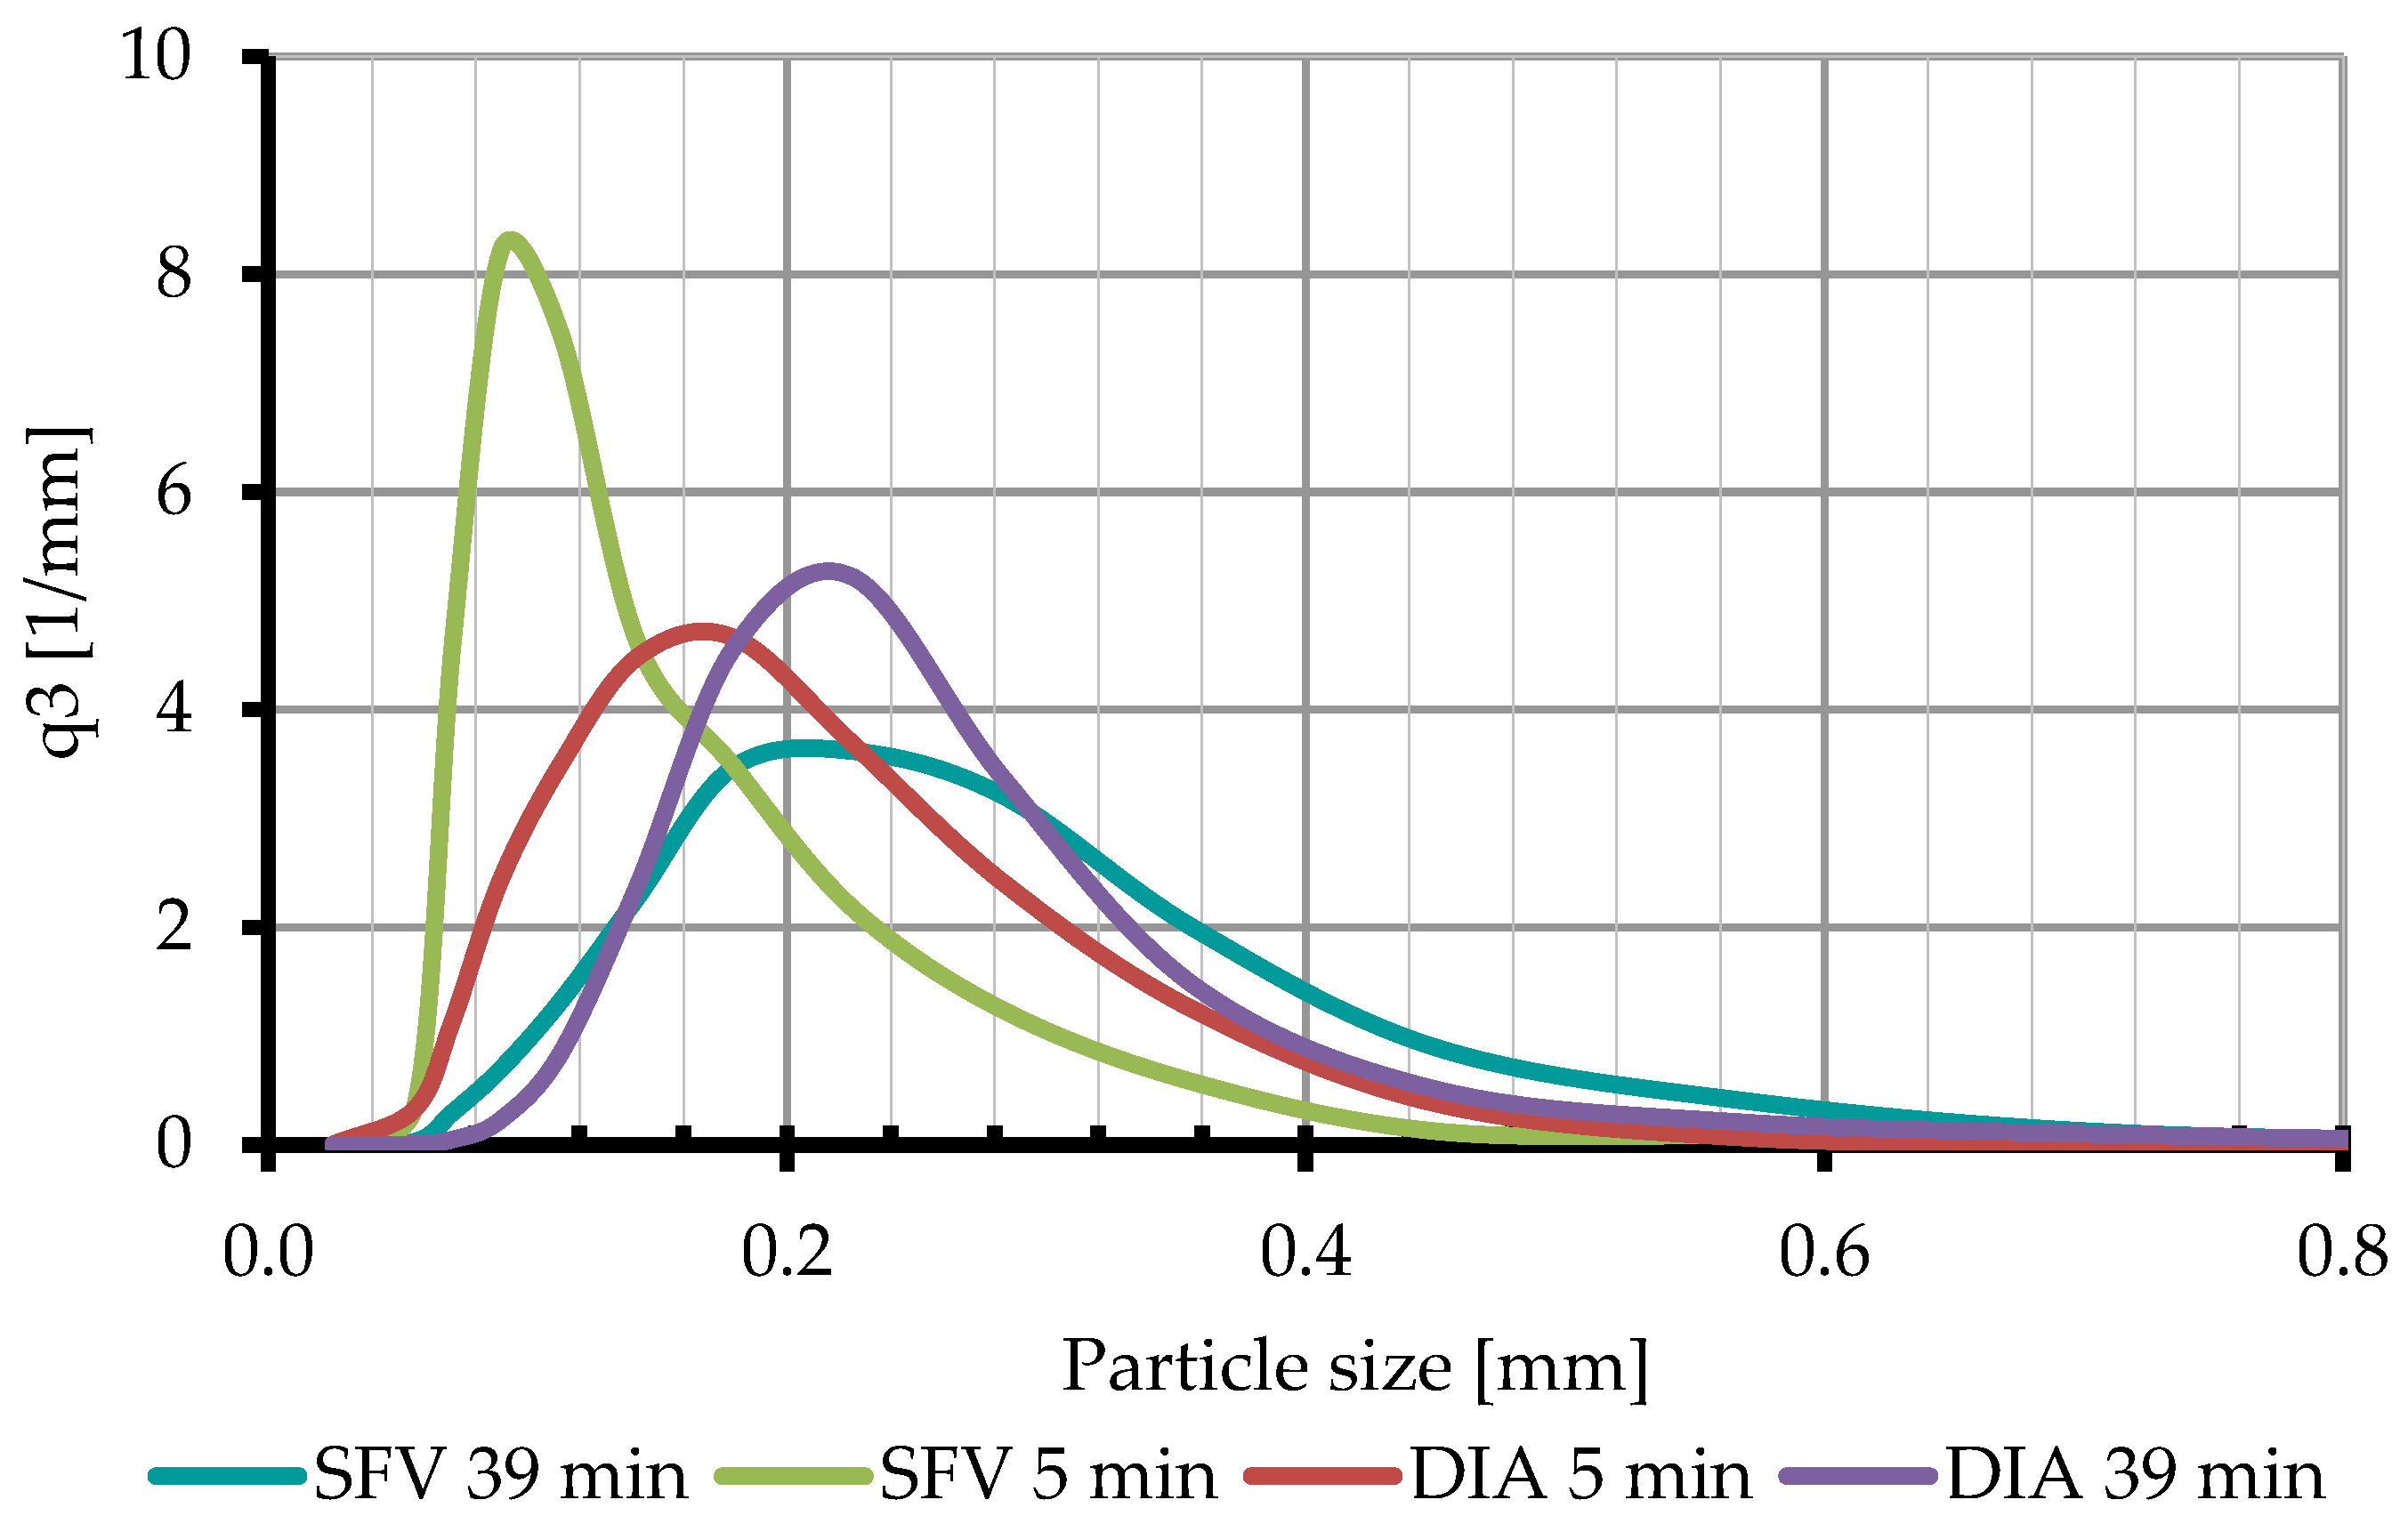
3.2. Comparison of Particle Size Measurements

A plot of the median (x50.3) values of SFV (in-line data) and DIA (off-line data) at the end of the process shows a good overall agreement and a similar trend (Figure 4). The correlation coefficient of x50.3 from DIA versus SFV is very high at 0.98. The DIA off-line data confirm the accuracy of the in-line SFV data and the usability for PAT process control. The in-line particle size measurement in the rotor agglomeration without a time delay allows the intervention in the process and to change the process parameters accordingly or to stop the process if the agglomerates are too large.
Up to a particle size of about 200 µm, the median values measured with SFV are smaller or almost identical (Figure 4), but with further increase of the particle size, the median values become larger compared to DIA. The reason for this is that the vibration of the feeding tray during transport of the particles into the measuring shaft of the DIA apparatus is not sufficient to separate the particles from each other, which have formed loose agglomerates due to Van der Waals forces. As the particle size increases, the effect of the weight force outweighs the Van der Waals forces, and the loose agglomerates are separated from each other by the vibration as they fall through the measuring shaft. Figure 5 confirms that the particle size measured with DIA increases less during the process, because the CLD is already broader at the beginning due to the loose agglomerates compared to SFV. At the process end, the CLD from the SFV is slightly broader.
Another reason for the difference in the median values is that the DIA determines the minimum chord length, which is especially important in the case of non-spherical particles, whereas the SFV determines a random chord length depending on the trajectory and orientation of the particle.

4. Conclusions

Earlier investigations [24] on the application of the SFV probe in a rotary fluidized bed with tangential spray have been continued by conducting a central composite design to gain further insight about the influence of the process parameters spray rate, spray pressure, process air temperature, and rotor speed on the process responses of the agglomeration process: median (x50.3), coefficient of variation (x50.3), and sphericity. The main effects of spray pressure and spray rate; the interactions of spray pressure and spray rate, rotor speed and spray rate; and the quadratic effects of spray pressure and process air temperature prove to be significant. Overall, the influence of main effects on the median (x50.3) and coefficient of variation (x50.3) was higher than that of interaction effects and quadratic effects by a factor of 2 to 4. Within the scope of this study, no suitable model for sphericity could be identified, so that further investigations were necessary [25].
The measured particle size values of the spatial filter velocimetry probe agreed well with those of dynamic image analysis and showed a similar trend, confirming previous studies [24]. The SFV measurement leads to reproducible results in the rotary fluidized bed with tangential spray and can be used as a process analytical tool for improved process control through in-line particle size measurement and determination of chord length distribution, minimizing the risk of failed batches in the pharmaceutical industry. Further studies are needed for the implementation of SFV measurement in rotary fluidized beds at a production scale.

Supplementary Materials

The following supporting information can be downloaded at: https://www.mdpi.com/article/10.3390/pr11041066/s1, Figure S1: Response surface models for median (x50.3) for different factor combinations: (a) spray pressure vs spray rate, (b) process air temperature vs. spray rate, (c) rotor speed vs. spray rate, (d) process air temperature vs. spray pressure, (e) rotor speed vs. spray pressure, (f) rotor speed vs process air temperature. All independent variables that are not included in the graphs are set to the central point. Figure S2: Response surface models for COV (x50.3) for different factor combinations: (a) spray pressure vs spray rate, (b) process air temperature vs. spray rate, (c) rotor speed vs. spray rate, (d) process air temperature vs. spray pressure, (e) rotor speed vs. spray pressure, (f) rotor speed vs process air temperature. All independent variables that are not included in the graphs are set to the central point. Table S1: Factor setting of the 30 batches performed in the CCD and their corresponding results in terms of sphericity, median (x50.3) and COV (x50.3). Table S2: SFV parameters in the rotary fluidized bed agglomeration process.

Author Contributions

Conceptualization and methodology, B.W. and M.L.; investigation, M.L. and B.Z.; resources, B.W.; data curation, M.L.; writing—original draft preparation, M.L.; writing—review and editing, F.P. and B.W.; supervision, B.W.; project administration, B.W. and M.L. All authors have read and agreed to the published version of the manuscript.

Funding

This research received no external funding.

Data Availability Statement

The data presented in this study are available within the article or supplementary material.

Acknowledgments

The authors want to thank Parsum GmbH, Chemnitz for generous disposal of the SFV probe.

Conflicts of Interest

The authors declare no conflict of interest.

Abbreviations

APIactive pharmaceutical ingredient
CCDcentral composite design
CLDchord length distribution
CoV (x50.3)coefficient of variation of median
DIAdynamic image analysis
GPCGGlatt pelletization, coating, and granulating apparatus
MCCmicrocrystalline cellulose
PATprocess analytical technology
SD
SFV
standard deviation
spatial filter velocimetry
x50.3median of particle size distribution

References

  1. Parikh, D.M. Handbook of Pharmaceutical Granulation Technology, 2nd ed.; Taylor & Francis: Boca Raton, FL, USA, 2005. [Google Scholar]
  2. Priese, F.; Wolf, B. Development of high drug loaded pellets by Design of Experiment and population balance model calculation. Powder Technol. 2013, 241, 149–157. [Google Scholar] [CrossRef]
  3. Uhlemann, H.; Mörl, L. Wirbelschicht—Sprühgranulation, 1st ed.; Springer: Berlin, Germany, 2014. [Google Scholar]
  4. Priese, F.; Frisch, T.; Wolf, B. Comparison of film—Coated retarded release pellets manufactured by layering technique or by bed rotor pelletization. Pharm. Dev. Technol. 2015, 20, 417–424. [Google Scholar] [CrossRef] [PubMed]
  5. Serno, P.; Kleinebudde, P.; Knop, K. Granulieren: Grundlagen, Verfahren, Formulierungen, 2nd ed.; ECV Editio Cantor Verlag: Aulendorf, Germany, 2016. [Google Scholar]
  6. Parikh, D.M. How to Optimize Fluid Bed Processing Technology: Part of the Expertise in Pharmaceutical Process Technology Series; Elsevier Academic Press: London, UK; San Diego, CA, USA; Cambridge, MA, USA; Oxford, UK, 2017. [Google Scholar]
  7. Gajdos, B. Rotorgranulatoren—Verfahrenstechnische Bewertung der Pelletherstellung mit Hilfe der faktoriellen Versuchsplanung. Pharm. Ind. 1983, 45, 722–728. [Google Scholar]
  8. Vertommen, J.; Kinget, R. The Influence of Five Selected Processing and Formulation Variables on the Particle Size, Particle Size Distribution and Friability of Pellets Produced in a Rotary Processor. Drug Dev. Ind. Pharm. 1997, 23, 39–46. [Google Scholar] [CrossRef]
  9. Kristensen, J.; Schæfer, T.; Kleinebudde, P. Direct Pelletization in a Rotary Processor Controlled by Torque Measurements. I. Influence of Process Variables. Pharm. Dev. Technol. 2000, 5, 247–256. [Google Scholar] [CrossRef] [PubMed]
  10. Pisek, R.; Planinsek, O.; Tus, M.; Srcic, S. Influence of Rotational Speed and Surface of Rotating Disc on Pellets Produced by Direct Rotor Pelletization. Pharm. Ind. 2000, 62, 312–319. [Google Scholar]
  11. Bouffard, J.; Dumont, H.; Bertrand, F.; Legros, L. Optimization and scale-up of a fluid bed tangential spray rotorgranulation process. Int. J. Pharm. 2006, 335, 54–62. [Google Scholar] [CrossRef] [PubMed]
  12. Pašić, M.; Betz, G.; Hadžidedić, Š.; Kocova El-Arini, S.; Leuenberger, H. Investigation and development of robust process for direct pelletization of lansoprazole in fluidized bed rotary processor using experimental design. J. Drug Deliv. Sci. Technol. 2010, 20, 367–376. [Google Scholar] [CrossRef]
  13. Neuwirth, J.; Antonyuk, S.; Heinrich, S.; Jacob, M. CFD-DEM study and direct measurement of the granular flow in a rotor granulator. Chem. Eng. Sci. 2013, 86, 151–163. [Google Scholar] [CrossRef]
  14. Food and Drug Administration, Guidance for Industry: PAT—A Framework for Innovative Pharmaceutical Development, Manufacturing, and Quality Assurance Guidance for Industry. Rockville, October 2004. Available online: https://www.fda.gov/media/71012/download (accessed on 30 March 2023).
  15. Bundesministerium für Forschung und Bildung. Industrie 4.0, Innovationen im Zeitalter Der Digitalisierung; Bundesministerium für Forschung und Bildung: Berlin, Germany, 2020; Available online: https://www.bmbf.de/SharedDocs/Publikationen/de (accessed on 30 March 2023).
  16. Aizu, Y.; Asakura, T. Spatial Filtering Velocimetry: Fundamentals and Applications; Springer: Berlin, Germany, 2006. [Google Scholar]
  17. Fischer, C.; Peglow, M.; Tsotsas, E. Restoration of particle size distributions from fiber-optical in-line measurements in fluidized bed processes. Chem. Eng. Sci. 2011, 66, 2842–2852. [Google Scholar] [CrossRef]
  18. Petrak, D.; Dietrich, S.; Eckardt, G.; Köhler, M. In-line particle sizing for real-time process control by fibre-optical spatial filtering technique (SFT). Adv. Powder Technol. 2011, 22, 203–208. [Google Scholar]
  19. Silva, A.F.T.; Burggraeve, A.; Denon, Q.; van der Meeren, P.; Sandler, N.; van den Kerkhof, T.; Hellings, M.; Vervaet, C.; Remon, J.P.; Lopes, J.A.; et al. Particle sizing measurements in pharmaceutical applications: Comparison of in-process methods versus off-line methods. Eur. J. Pharm. Biopharm. 2013, 85, 1006–1018. [Google Scholar] [CrossRef] [PubMed]
  20. Kukec, S.; Hudovornik, G.; Dreu, R.; Vrečer, F. Study of granule growth kinetics during in situ fluid bed melt granulation using in-line FBRM and SFT probes. Drug Dev. Ind. Pharm. 2014, 40, 952–959. [Google Scholar] [CrossRef] [PubMed]
  21. Wiegel, D.; Eckardt, G.; Priese, F.; Wolf, B. In-line particle size measurement and agglomeration detection of pellet fluidized bed coating by Spatial Filter Velocimetry. Powder Technol. 2016, 301, 261–267. [Google Scholar] [CrossRef]
  22. Schaeper, M.; Damaschke, N. Fourier-based layout for grating function structure in spatial filtering velocimetry. Meas. Sci. Technol. 2017, 28, 55008. [Google Scholar] [CrossRef]
  23. Petrak, D.; Eckardt, G.; Dietrich, S.; Köhler, M.; Wiegel, D.; Wolf, B.; Priese, F.; Jacob, M. Inline-Messung von Schicht-dicke, Agglomeratanteil und Sprühtrocknung beim Pelletcoating in der Wirbelschicht. Einsatz einer In-line-Partikelsonde als PAT-Instrument zur Echtzeit-Überwachung. Pharm. Ind. 2018, 80, 262–270. [Google Scholar]
  24. Langner, L.; Kitzmann, I.; Ruppert, A.-L.; Wittich, I.; Wolf, B. In-line particle size measurement and process influences on rotary fluidized bed agglomeration. Powder Technol. 2020, 364, 673–679. [Google Scholar] [CrossRef]
  25. Langner, M. Inline-Partikelgrößenbestimmung auf Basis der Ortsfilteranemometrie im Rotor-Wirbelschichtprozess. Ph.D. Thesis, Otto-von-Guericke-Universität, Magdeburg, Germany, 25 April 2022. [Google Scholar]
  26. Dietrich, S.; Köhler, M. Personal Communication; Parsum GmbH.: Chemnitz, Germany, 2017. [Google Scholar]
  27. Grundwerk, Bundesinstitut für Arzneimittel und Medizinprodukte. Europäisches Arzneibuch. Amtliche Deutsche Ausgabe, 9th ed.; Deutscher Apotheker Verlag: Stuttgart, Germany, 2019. [Google Scholar]
  28. Rasch, B. Quantitative Methoden 1: Einführung in Die Statistik; Springer Medizin Verlag Heidelberg: Berlin/Heidelberg, Germany, 2006. [Google Scholar]
Figure 1. (a) Schematic representation of the rotary fluidized bed agglomeration process with tangential spray and in-line particle size measurement; (b) image of the rotor insert with installed SFV probe, (A) rotor disk with central cone, (B) rotor speed adjustment, (C) rotor disk height adjustment, (D) process air volumetric flow, (E) air gap, (F) spray nozzle, (G) helical flow pattern of the fluidized bed, (H) SFV probe with attached disperser, (I) sample chute for off-line particle size measurement, (J) process air temperature probe, (K) product chamber wall.
Processes 11 01066 g001
Figure 2. Plot of median (x50.3) versus the factors of (a) spray pressure and two different spray rates, (b) spray rate and two different rotor speeds, (c) spray pressure, (d) process air temperature.
Processes 11 01066 g002
Figure 3. Plot of COV (x50.3) versus the factors of (a) spray pressure and two different rotor speeds, (b) spray rate and two different spray pressures, (c) spray rate and two different rotor speeds, (d) spray rate and two different process air temperatures, (e) rotor speed.
Processes 11 01066 g003
Figure 4. Values of x50.3 of all batches of the CCD measured with SFV and DIA by ascending particle size (SFV).
Processes 11 01066 g004
Figure 5. CLD of SFV and DIA after 5 and 39 min (batch 15).
Processes 11 01066 g005
Table 1. Sodium benzoate formulation.
Content [w/w]
Sodium benzoate56.4
Microcrystalline cellulose28.6
Polyvinylpyrrolidone5.0
Polyethylene glycol 600010.0
100.0
Table 2. Process parameters of the rotary fluidized bed agglomeration process.
Process ParameterSetting
Spray rate (g/min)11.5–21.5
Spray pressure (bar)1.4–2.2
Rotor speed (rpm)300–1000
Process air temperature (°C)70–90
Process air volumetric flow (m3/h)35–60
Difference pressure above rotor disk (Pa)450
Spray nozzle diameter (mm)1.0
Position of spray nozzle cap (scales)2
Distance of spray nozzle (cm)3
Batch size (g)350
Table 3. Factor adjustment of CCD.
FactorLevel Adjustment
−αLow (−)Central PointHigh (+)
Level distance−2−10+1+2
Spray rate (g/min)11.514.016.519.021.5
Spray pressure (bar)1.41.61.82.02.2
Rotor speed (rpm)3004756508251000
Process air temperature (°C)7075808590
Table 4. Model parameters of the CCD.
Median (x50.3)CoV (x50.3)Sphericity
SD14.70.010.04
Mean172.40.450.78
CoV %8.52.844.99
R20.920.940.34
Table 5. Statistical evaluation of the CCD. p-values: highly significant (p ≤ 0.01) highlighted in green and significant (p ≤ 0.05) highlighted in blue.
Median (x50.3)CoV (x50.3)
p-ValueSt. Reg. Par.95% CI Low95% CI Highp-ValueSt. Reg. Par.95% CI Low95% CI High
Model<0.001---<0.001---
Constant-160.0147.2172.7-0.4450.4340.456
A Spray pressure<0.001−26.2−32.6−19.8<0.001−0.021−0.027−0.016
B Proc. air temp.0.744−1.0−7.45.40.113−0.004−0.0100.001
C Rotor speed0.565−1.8−8.14.60.002−0.010−0.015−0.004
D Spray rate<0.00123.417.029.7<0.0010.0250.0200.030
AB0.829−0.8−8.67.00.921−0.000−0.0070.006
AC0.123−6.0−13.81.80.022−0.008−0.015−0.001
AD0.003−13.3−21.1−5.50.011−0.009−0.016−0.002
BC0.4982.5−5.310.40.836−0.001−0.0070.006
BD0.2874.0−3.811.90.0360.0070.0010.014
CD0.0358.50.716.30.0010.0130.0060.019
A20.0326.60.712.60.1170.004−0.0010.009
B20.00111.05.016.90.0070.0080.0020.013
C20.222−3.6−9.52.40.002−0.009−0.014−0.004
D20.6031.5−4.57.50.4300.002−0.0030.007
Residual--------
Lack of Fit0.150---0.211---
Disclaimer/Publisher’s Note: The statements, opinions and data contained in all publications are solely those of the individual author(s) and contributor(s) and not of MDPI and/or the editor(s). MDPI and/or the editor(s) disclaim responsibility for any injury to people or property resulting from any ideas, methods, instructions or products referred to in the content.

