Review

Challenges in the Simulation of Drying in Fluid Bed Granulation

by
Maryam Askarishahi
1,*,
Mohammad-Sadegh Salehi
1,2 and
Stefan Radl
2
1
Research Center Pharmaceutical Engineering GmbH, Inffeldgasse 13/I, 8010 Graz, Austria
2
Institute of Process and Particle Engineering, Graz University of Technology, Inffeldgasse 13/III, 8010 Graz, Austria
*
Author to whom correspondence should be addressed.
Processes 2023, 11(2), 569; https://doi.org/10.3390/pr11020569
Submission received: 13 January 2023 / Revised: 2 February 2023 / Accepted: 8 February 2023 / Published: 13 February 2023
(This article belongs to the Special Issue Computational and Experimental Study of Granulation in Fluidized Beds)

Abstract

:
Fluid bed granulation is faced with a high level of complexity due to the simultaneous occurrence of agglomeration, breakage, and drying. These complexities should be thoroughly investigated through particle–particle, particle–droplet, and particle–fluid interactions to understand the process better. The present contribution focuses on the importance of drying and the associated challenges when modeling a granulation process. To do so, initially, we will present a summary of the numerical approaches, from micro-scale to macro-scale, used for the simulation of drying and agglomeration in fluid bed granulators. Depending on the modeled scale, each approach features several advantages and challenges. We classified the imposed challenges based on their contributions to the drying rate. Then, we critically scrutinized how these challenges have been addressed in the literature. Our review identifies some of the main challenges related to (i) the interaction of droplets with particles; (ii) the drying kinetics of granules and its dependence on agglomeration/breakage processes; as well as (iii) the determination of drying rates. Concerning the latter, specifically the surface area available for drying needs to be differentiated based on the state of the liquid in the granule: we propose to do this in the form of surface liquid, pore liquid, and the liquid bridging the primary particles.

1. Introduction

Wet granulation processes include the agglomeration of primary particles to form a large granule with controlled properties. In wet granulation, particle growth is realized by adding a liquid binder to primary powders. In fact, a binder solution is sprayed over the particles in the form of droplets. The wet particles are brought to each other via mechanical agitation (in the case of high-shear and twin screw granulation) or hydrodynamically generated agitation (in fluid bed granulation; FBG). To form a permanent granule, the binder solution’s volatile components must be removed to increase the strength of the granule. This is typically realized via drying, either simultaneously beside spraying (e.g., as in FBG [1]) or in a subsequent downstream drying unit operation (as this is necessary for twin screw granulation) [2].
For instance, FBGs are widely used to produce agglomerates in industrial sectors due to their high heat and mass transfer rate and efficient mixing [1]. Moreover, FBGs have the advantage of integrating several processes, such as wetting, drying, particle shaping, and size enlargement, into one process unit, which can lead to the homogenization of the product. In FBGs, particle agglomeration is successful when the kinetic energy of the colliding particles is dissipated via the binder’s ability to form a liquid bridge. This condition can be quantified through a critical Stokes Number as described by Ennis et al. [3]. In such equipment, heat and mass transfer, besides fluidization, are highly coupled and should be controlled to achieve desired granule properties. Such controlling needs a systematic understanding of how these phenomena occur and how strongly they are interconnected.
In some processes, the formation of agglomerates is undesired. For instance, particle agglomeration in the coating process must be prevented by choosing appropriate operating conditions. Another example is the blockage of transfer lines in continuous drug manufacturing due to sticking agglomerates to the equipment or forming large granules. For instance, in a ConsiGma continuous production line, a drying unit must be used to dry granules after a twin-screw granulator. The transfer line can be clogged if the granules’ moisture level is too high. This highlights that the drying rate—besides fluidization and spraying rates—should be controlled so that the colliding particles can rebound after the impact and not stick to each other.
As mentioned above, it is crucial to control the heat and mass transfer rate in FBGs, FBDs, and fluid bed coaters (FBCs) to realize optimum process performance. Depending on the combination of influencing parameters, the liquid bridging can affect the product quality, the most important of which are the size and morphology of formed agglomerates, the moisture content level, and the final product’s temperature. In extreme cases, over-wetting (or spraying) can lead to channeling or de-fluidization in FBGs or FBCs, which is highly undesired from the hydrodynamic perspective. Therefore, this again highlights the need for (i) a mechanistic understanding of how different parameters affect the process and product attributes and (ii) how to control them. Obtaining such knowledge is virtually impossible via experimentation since the heat and mass transfer are tightly coupled, and it is complicated to distinguish the effect of individual mechanisms on process performance experimentally [1].
On the other hand, simulation approaches and numerical methodologies can significantly help to investigate the contribution of individual phenomena and provide a better understanding of the factors influencing the granulation processes. Several researchers attempted to simulate wet fluidized bed systems in recent years, including drying. However, a systematic review of recent research studies is still lacking. Hence, the present contribution attempts to review and compare different numerical approaches for the simulation of FBGs and post-granulation FBDs, as well as partially of FBCs. Moreover, the remaining challenges will be identified such that they can be addressed in the future.

Goals

Based on the description above, the main goals of our present study are
  • A focused review of drying-related models in mainly CFD, DEM, and PBM models for a pilot to large-scale fluid bed granulators, i.e., drying of agglomerates experiencing size change simultaneously;
  • A summary of methodologies for the simulation and modeling of simultaneous agglomeration and drying;
  • A summary of the challenges imposed upon the simulation of drying in fluid bed granulation systems.
It should be noted that the detailed review of drying in coating processes is outside the scope of the present review study. In these coating processes, drying of relatively large (i.e., >500 µm; very often tablets), typically non-porous particles occur (exceptions are coating processes in the food industry [4,5]). Thus, there is no intra-particle vapor or liquid transport, and drying modeling is relatively simple for such coating processes. Nevertheless, we have summarized some findings from the field of coating that could be helpful in Section 5, where we identify gaps to improve granulation models.
The structure of our present study will be as follows: initially, we explain the importance of drying in granulation and the different drying mechanisms (Section 2.2). Afterward, we discuss the influence parameters playing a pivotal role in fluid bed granulation and drying performance (Section 3). Next, we will summarize numerical approaches used in the literature to simulate such systems (Section 4). Section 5 will discuss the main challenges associated with simulating simultaneous granulation and drying in FBGs. Eventually, some helpful studies will be listed, which can be used to validate numerical codes in Section 6.

2. Background

2.1. Why Drying Influences the Agglomeration Rate

We first focus on the key reason why it is necessary to understand drying processes during wet granulation. It is generally accepted that the tendency of agglomeration increases with the liquid content of granules [6]. For example, it is well known that an increase in the gas inlet temperature reduces the rate of agglomeration [7]: a higher inlet temperature accelerates the drying rate from the sessile droplets deposited on the granule surface. This means that smaller droplets have less capability to dissipate the kinetic energy of colliding particles, slowing down the agglomeration process. In addition, drying reduces the number of wet sites available on the granule surface, which decreases the probability of a successful (i.e., sticking) collision [8]. This indicates that drying can negatively influence the agglomeration process.
Apart from this, drying can also change the viscosity of the binder solution in two ways: (i) by changing the liquid’s temperature and (ii) removing volatile components and increasing the binder concentration [8]. Therefore, drying influences the strength of liquid bridges via increased dissipation of the kinetic energy of the colliding particles, consequently changing the agglomeration rate. According to Tsotsas [7], drying of binder solution pushes the Stokes number below the critical value by thickening the solution and thus accelerating the agglomeration rate.
Drying affects not only the rate of agglomeration but also the agglomeration mechanism and, consequently, the formed agglomerates’ properties. Our previous study [9,10] demonstrated that the net rate of liquid addition to the granule could highly influence the granule morphology. This can be quantified by the degree of wetness, D o W , defined as the ratio of the required enthalpy for spray evaporation to a typical enthalpy of the fluidization gas. Consequently, a batch with a high degree of wetness D o W   1 is indicated as a wet batch, and the one with a low degree of wetness D o W   1 is indicated as a dry batch. As shown in Figure 1, when the rate of drying is high compared to the rate of liquid addition (i.e., a low saturation level and a low D o W prevails), the formation of an elongated granule is favored. This behavior can be explained by the fact that when a batch is (too) dry, a smaller number of wet spots are available on the particles. Therefore, the granule can grow only from these sites, reducing the probability of agglomeration. In contrast, granules can easily grow from different angles, forming a more spherical granule for wet batches with a large number of wet spots.
The final LoD and D 50 for these experiments are shown in Figure 2. As discerned from this figure, a higher liquid addition rate to the granule does not necessarily result in a larger granule size. This means that for batches with very high D o W , the binder liquid cannot keep the particles attached to the agglomerate. Therefore, the granules can break above a certain level of liquid content. As a result, the rate of particle drying also plays an essential role in the granule’s consolidation and strength. The experimental data of Diez et al. [11] also highlights the importance of drying for the granule properties. Their experimental results showed that a reduction in the spray rate and an increase in the drying temperature result in the formation of smoother product granules.

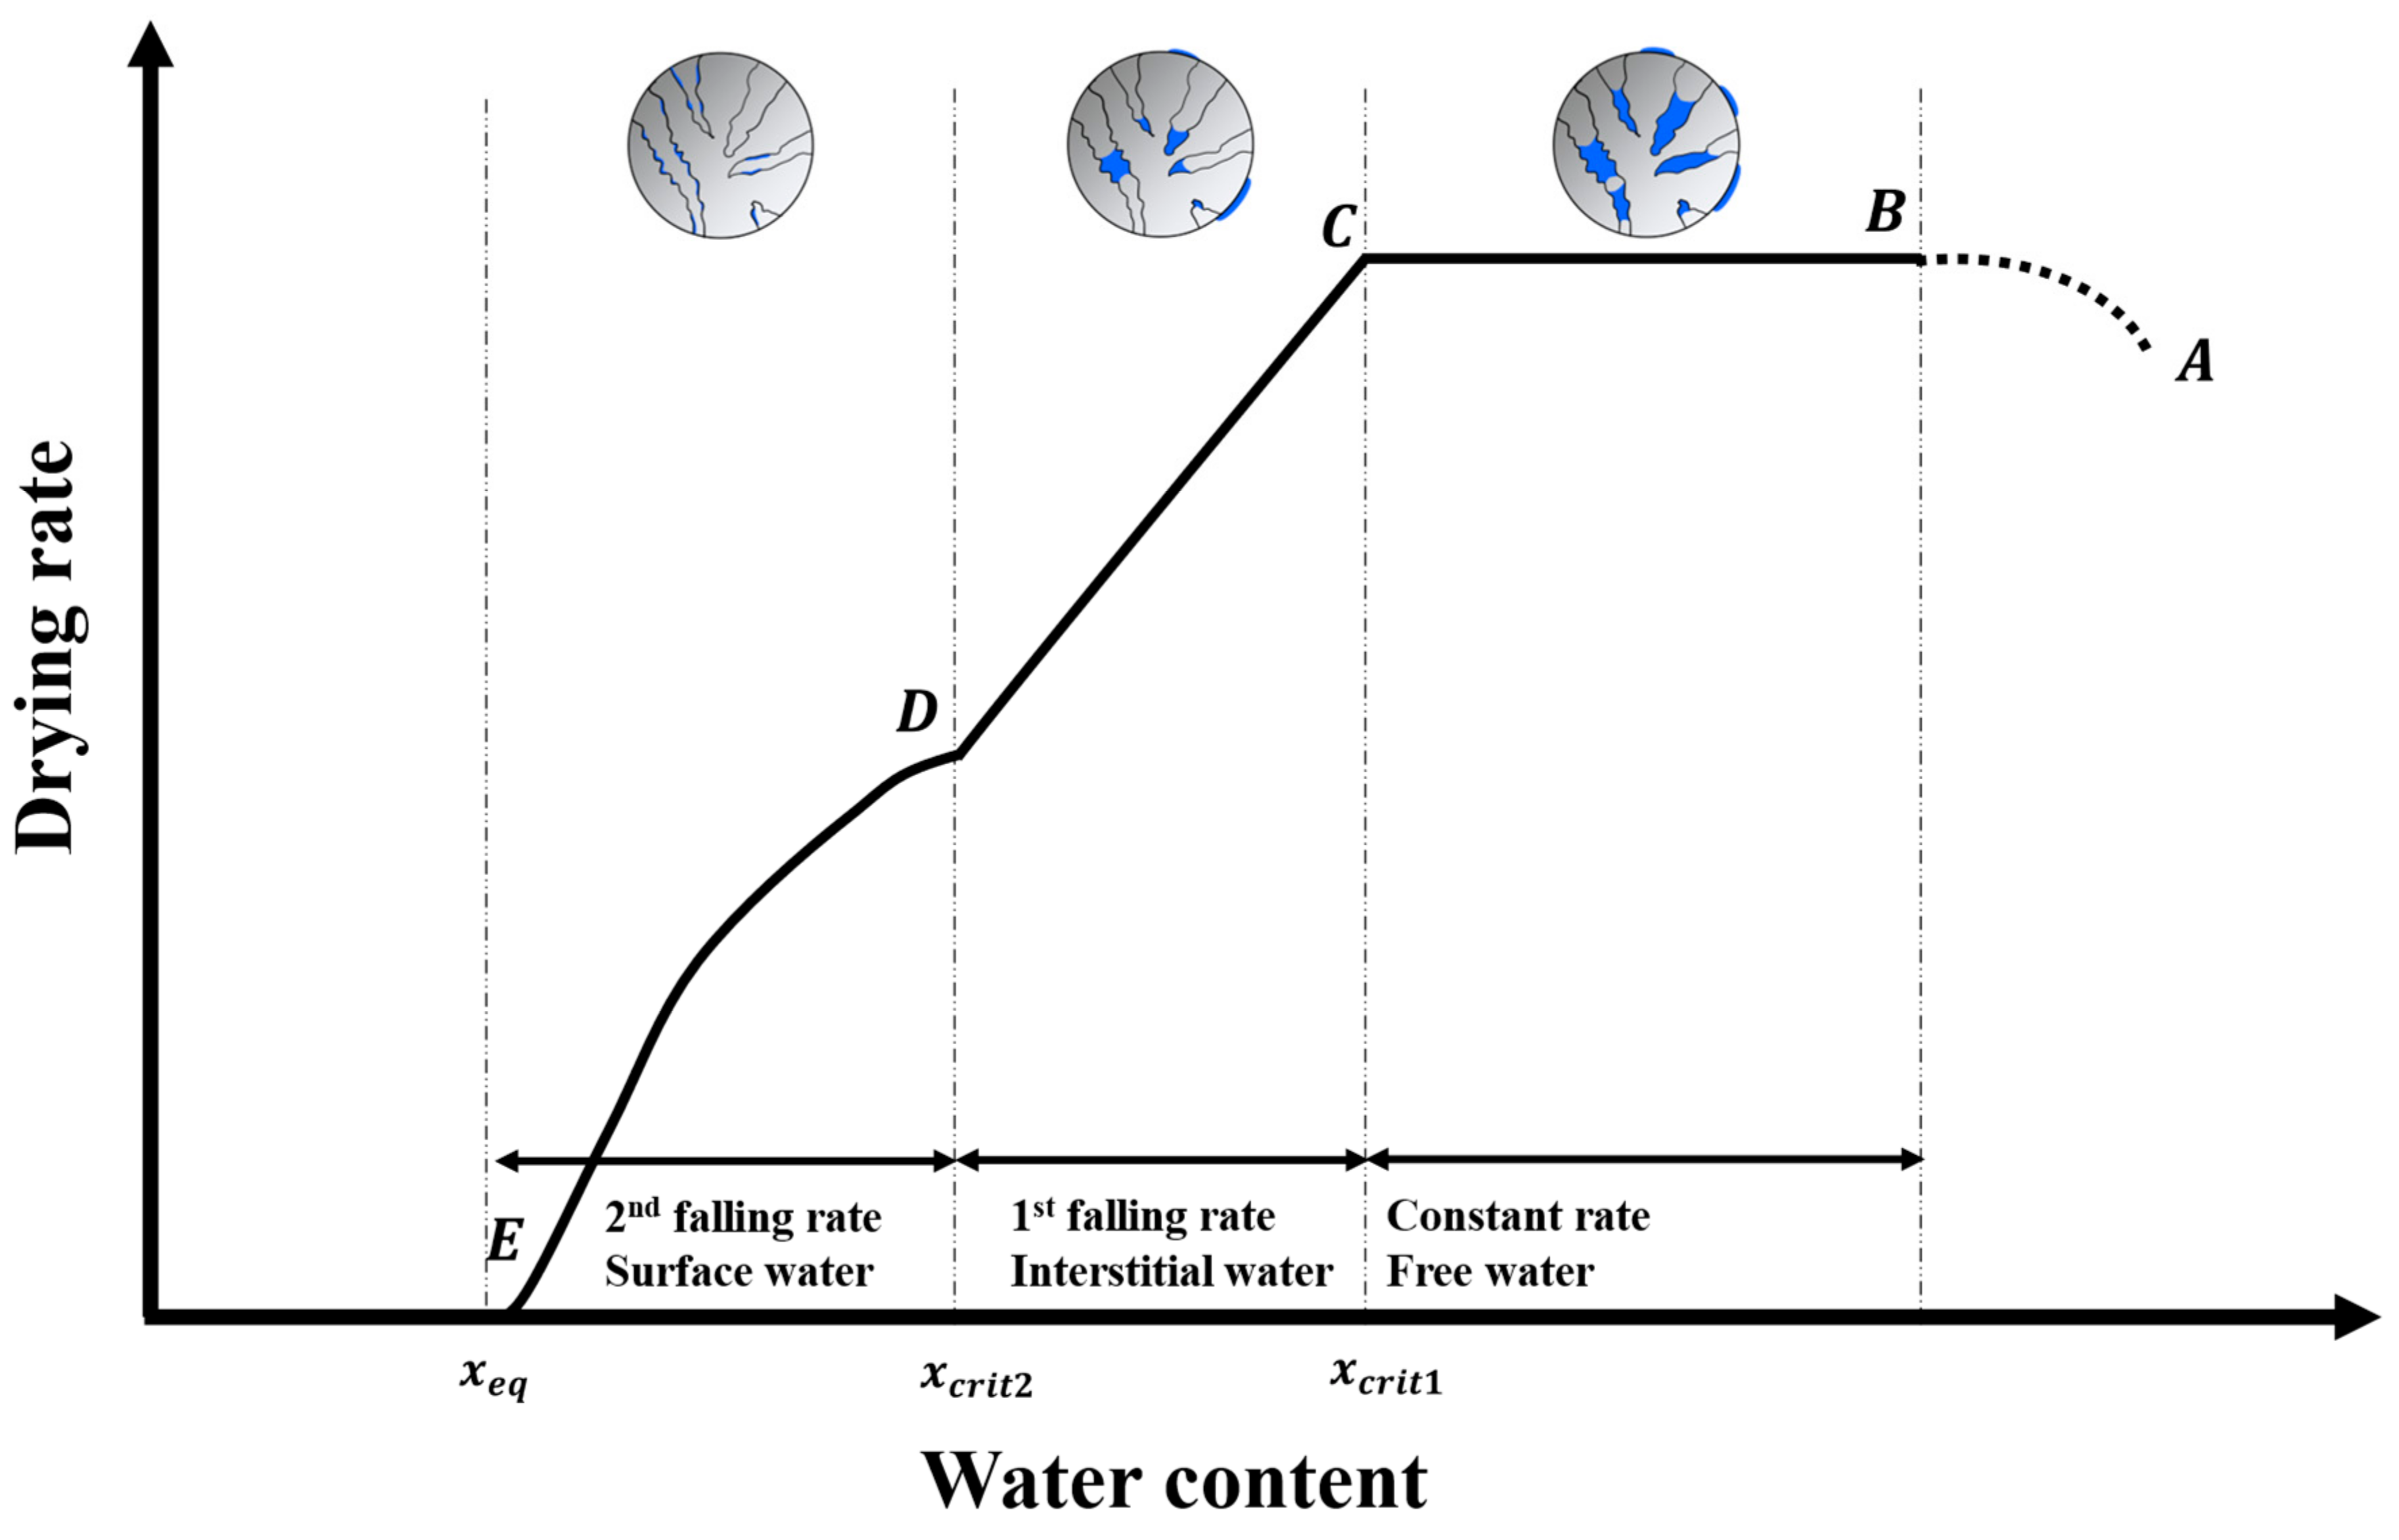
2.2. Mechanisms of Drying in Fluid Bed Granulation

In what follows, we introduce background knowledge from the drying field to familiarize the reader with the nomenclature used in our review. Therefore, we first illustrate the typical temporal evolution of the particles’ Loss of Drying (LoD) and temperature in a fluid bed granulation process in Figure 3. The powders are heated up during the pre-heating phase to reach the gas temperature. Then, the binder solution is sprayed over the particles as droplets. During this phase of granulation and drying, the granule LoD increases continuously while the temperature relaxes to the wet-bulb temperature. After stopping liquid injection, i.e., during the drying phase, the granule LoD starts decreasing, initially at a constant rate followed by a falling-rate period (See Figure 4 for more detail). In the latter, the granule temperature increases due to heat exchange with the hot fluidization gas and the lower drying rate.
McCabe et al. [12] explain that in porous solids, the moisture flows through the pores due to capillarity and, to some extent, by surface diffusion. A porous material consists of a network of interconnected pores and channels whose cross-sections can vary. When the water is removed due to evaporation, a meniscus forms in each pore, causing capillary forces between the water and the pore wall due to surface tension. The direction of this force at the interface determines whether the liquid can move upward or not. In addition, the strength of the capillary pressure in each pore depends on the curvature of the meniscus and the pore cross-section. In detail, smaller pores feature greater capillary forces than larger ones. This means that small pores can draw the water out of larger pores when the water at the surface is depleted. As a result, larger pores tend to empty first. Upon drying on the pore level, the water is replaced with air through the mouth of the pore at the drying surface.
In summary, the mechanism of drying in porous materials can be categorized as follows:
i.
Constant-rate drying: The delivery of the water from the interior to the surface is sufficient to keep the surface completely wet; hence, the drying rate is constant. The pores are progressively depleted of water.
ii.
Falling-rate drying: The surface layer of water starts to deplete inside the solid. Two mechanisms are expected based on the amount of liquid available inside the pores:
  • First falling-rate drying: Initially, the liquid is dragged from the larger pores to the solid surface; the primary drying mechanism is the same as in the constant-rate mechanism. The only difference is that the wetted surface area reduces over time. The water inside the pore is the continuous phase, while the air is the dispersed one. It should be noted that the rate of drying in the first falling-rate period is typically linear (see Figure 5 for a visualization).
  • Second falling-rate drying: Progressive water removal from the solid gives rise to the air volume fraction inside the pore. A continuous liquid film cannot be maintained inside the pores below a specific moisture level. Consequently, air will fill the pore, forming the continuous phase. Therefore, the remaining water is relegated to small, isolated pools in the corners and interstices of the pores, resulting in a sudden drop in the drying rate, as illustrated in Figure 5.
The drying rate in the second falling-rate stages is independent of the ambient air velocity because the water must diffuse through the solid. The heat of vaporization must be transmitted due to conduction through the solid. Therefore, temperature gradients may be expected in the solid. For example, Ceaglske and Hougen [13] proposed a diffusion equation with a varying diffusion coefficient depending on moisture, temperature, material, and drying history to account for the effect of capillarity.
Based on the description above, one can conclude that there are three types of moisture in a granule, as shown in Figure 5.
i.
Free surface moisture: The liquid covering the outer surface of the granule. Drying of this type of moisture follows the evaporation from free liquid (wet-bulb evaporation).
ii.
Inter-particle moisture: The liquid bridging the primary particles inside the granule.
iii.
Intra-particle moisture: The liquid trapped inside the pores of each primary particle. Drying of this type of moisture is governed by the internal drying resistance.

3. Key Influence Parameters

A fluid bed granulator’s performance is influenced by operating conditions and the fluidization gas, spray, and particle properties [14]. These quantities can be categorized into two groups: (i) the parameters primarily influencing the mechanical (i.e., agglomeration) performance and (ii) the parameters primarily influencing the thermal (i.e., drying) performance. The list of these parameters is presented in Table 1.

4. Simulation Approaches

Various simulation approaches can be employed to simulate granulation and drying in FBGs. The numerical methods can be categorized regarding the level of interactions and phenomena which are resolved (and hence directly simulated) as follows:
  • Micro-scale numerical approaches: in these approaches, the particles and droplets are resolved to a sub-particle/droplet level. For deterministic approaches, the balance equations for momentum, heat, and mass transfer are solved in the intra-particle or intra-droplet domain. One example of this approach is a direct numerical simulation (DNS). Metzger [18] considered a pore-network model as an example of this group of approaches. Another group of micro-scale methods is based on stochastics and probabilities. One example of stochastic micro-models is the Monte Carlo method: According to Terrazas-Velarde [19,20,21], in this approach, a limited number of particles are simulated to extract the agglomeration kernel. As described in Section 4.3, the advantage of this approach is that the deposited liquid’s distribution and thickness can be captured on the particle. This is advantageous in investigating the effect of liquid drying on the agglomeration rate. However, the computational cost is too high to study a whole process.
  • Meso-scale numerical approaches: The balance equations are resolved down to the single particle level (as in the Discrete Element Method, CFD-DEM) or a continuum level (as in the Two-Fluid Model, TFM, and the Multi-Fluid Model, MFM). Newton’s second law is solved for each particle in the CFD-DEM approach. In contrast, in the TFM and MFM approach, solid particles are considered as one or several continua, respectively. In this manner, one needs to define the solids rheology, including solids viscosity, pressure, and granular temperature, for TFM or MFM approaches.
  • Macro-scale modeling approaches: The FBs are divided into several well-mixed compartments. In each compartment, a specific phenomenon dominates. The exchange rate between different compartments needs to be defined a priori or determined using detailed simulations, e.g., mesoscale or micro-scale approaches. The population balance model (PBM) is typically used to model the granule growth.
The typical length and time scale simulated by these approaches have been illustrated in Figure 6.
Since the present study mainly focuses on the challenges in the simulation of drying in FBGs, we will briefly summarize the most widely used approaches applied for drying and agglomeration in fluidized beds. Readers interested in the details of these numerical approaches are referred to two comprehensive reviews: Suresh et al. [22] summarized various numerical techniques for modeling different granulation equipment. In another study, Alobaid et al. [23] summarized the numerical methods used to simulate gas–solid flow.

4.1. Two-Fluid Models

The two-fluid model (TFM) approach is a Euler–Euler methodology in which the gas and solids’ phases are considered interpenetrating continua. TFMs can be regarded as the extension of the kinetic theory of gas to gas–particle systems. To close the governing equations, we need to consider constitutional equations for the solid’s rheology (i.e., solids viscosity, pressure, and granular temperature representing the particle fluctuative velocity). These equations can be obtained through empirical equations [24,25,26,27] or derived from DNS [28] or DEM simulations [29].
In TFM approaches, the solid physical properties, such as particle size and density, are assumed constant. However, in fluid bed granulations, the size and structure of granules change over time due to granulation and drying. Therefore, applying the TFM is faced with the challenge of predicting granule size. In this regard, researchers have adopted different strategies upon using the TFM approach for FBG simulations, as detailed below and summarized in Figure 7. In Table 2, we listed a summary of important phenomena that need to be considered in the literature for drying simulation in FBG using TFM/MFM approaches. Note that some terms in Table 2 (e.g., “surface coverage” or “Stefan diffusion”) will be closer defined in Section 4.2.

4.1.1. No Agglomeration Models

The first group of researchers neglected the effect of granule growth in the FBG and focused on drying. For instance, Wang et al. [30] used a TFM and a mathematical model based on a three-phase model to investigate drying in a fluid bed granulator. They did not simulate particle growth due to agglomeration. However, they assumed that the granular diameter shrinks during the constant-rate drying period due to evaporation from the outer surface. It should be noted that both constant-rate and falling-rate periods were considered in their simulations. In detail, the saturation moisture content for the falling-rate period ( X smaller than the critical moisture content) was modified by a correction factor as a function of moisture content X n X n + K .
Tu et al. [31] conducted a TFM study on granule drying in a fluid bed dryer. Moreover, they neglected the granule growth effect. Using the experimental drying curve, they considered the drying kinetic for both constant-rate and falling-rate periods. They evaluated the effect of particle moisture on fluidization behavior and bubble properties. Their simulation results showed that the minimum fluidization velocity decreases, and the bubble rising velocity increases when the particle moisture level falls.

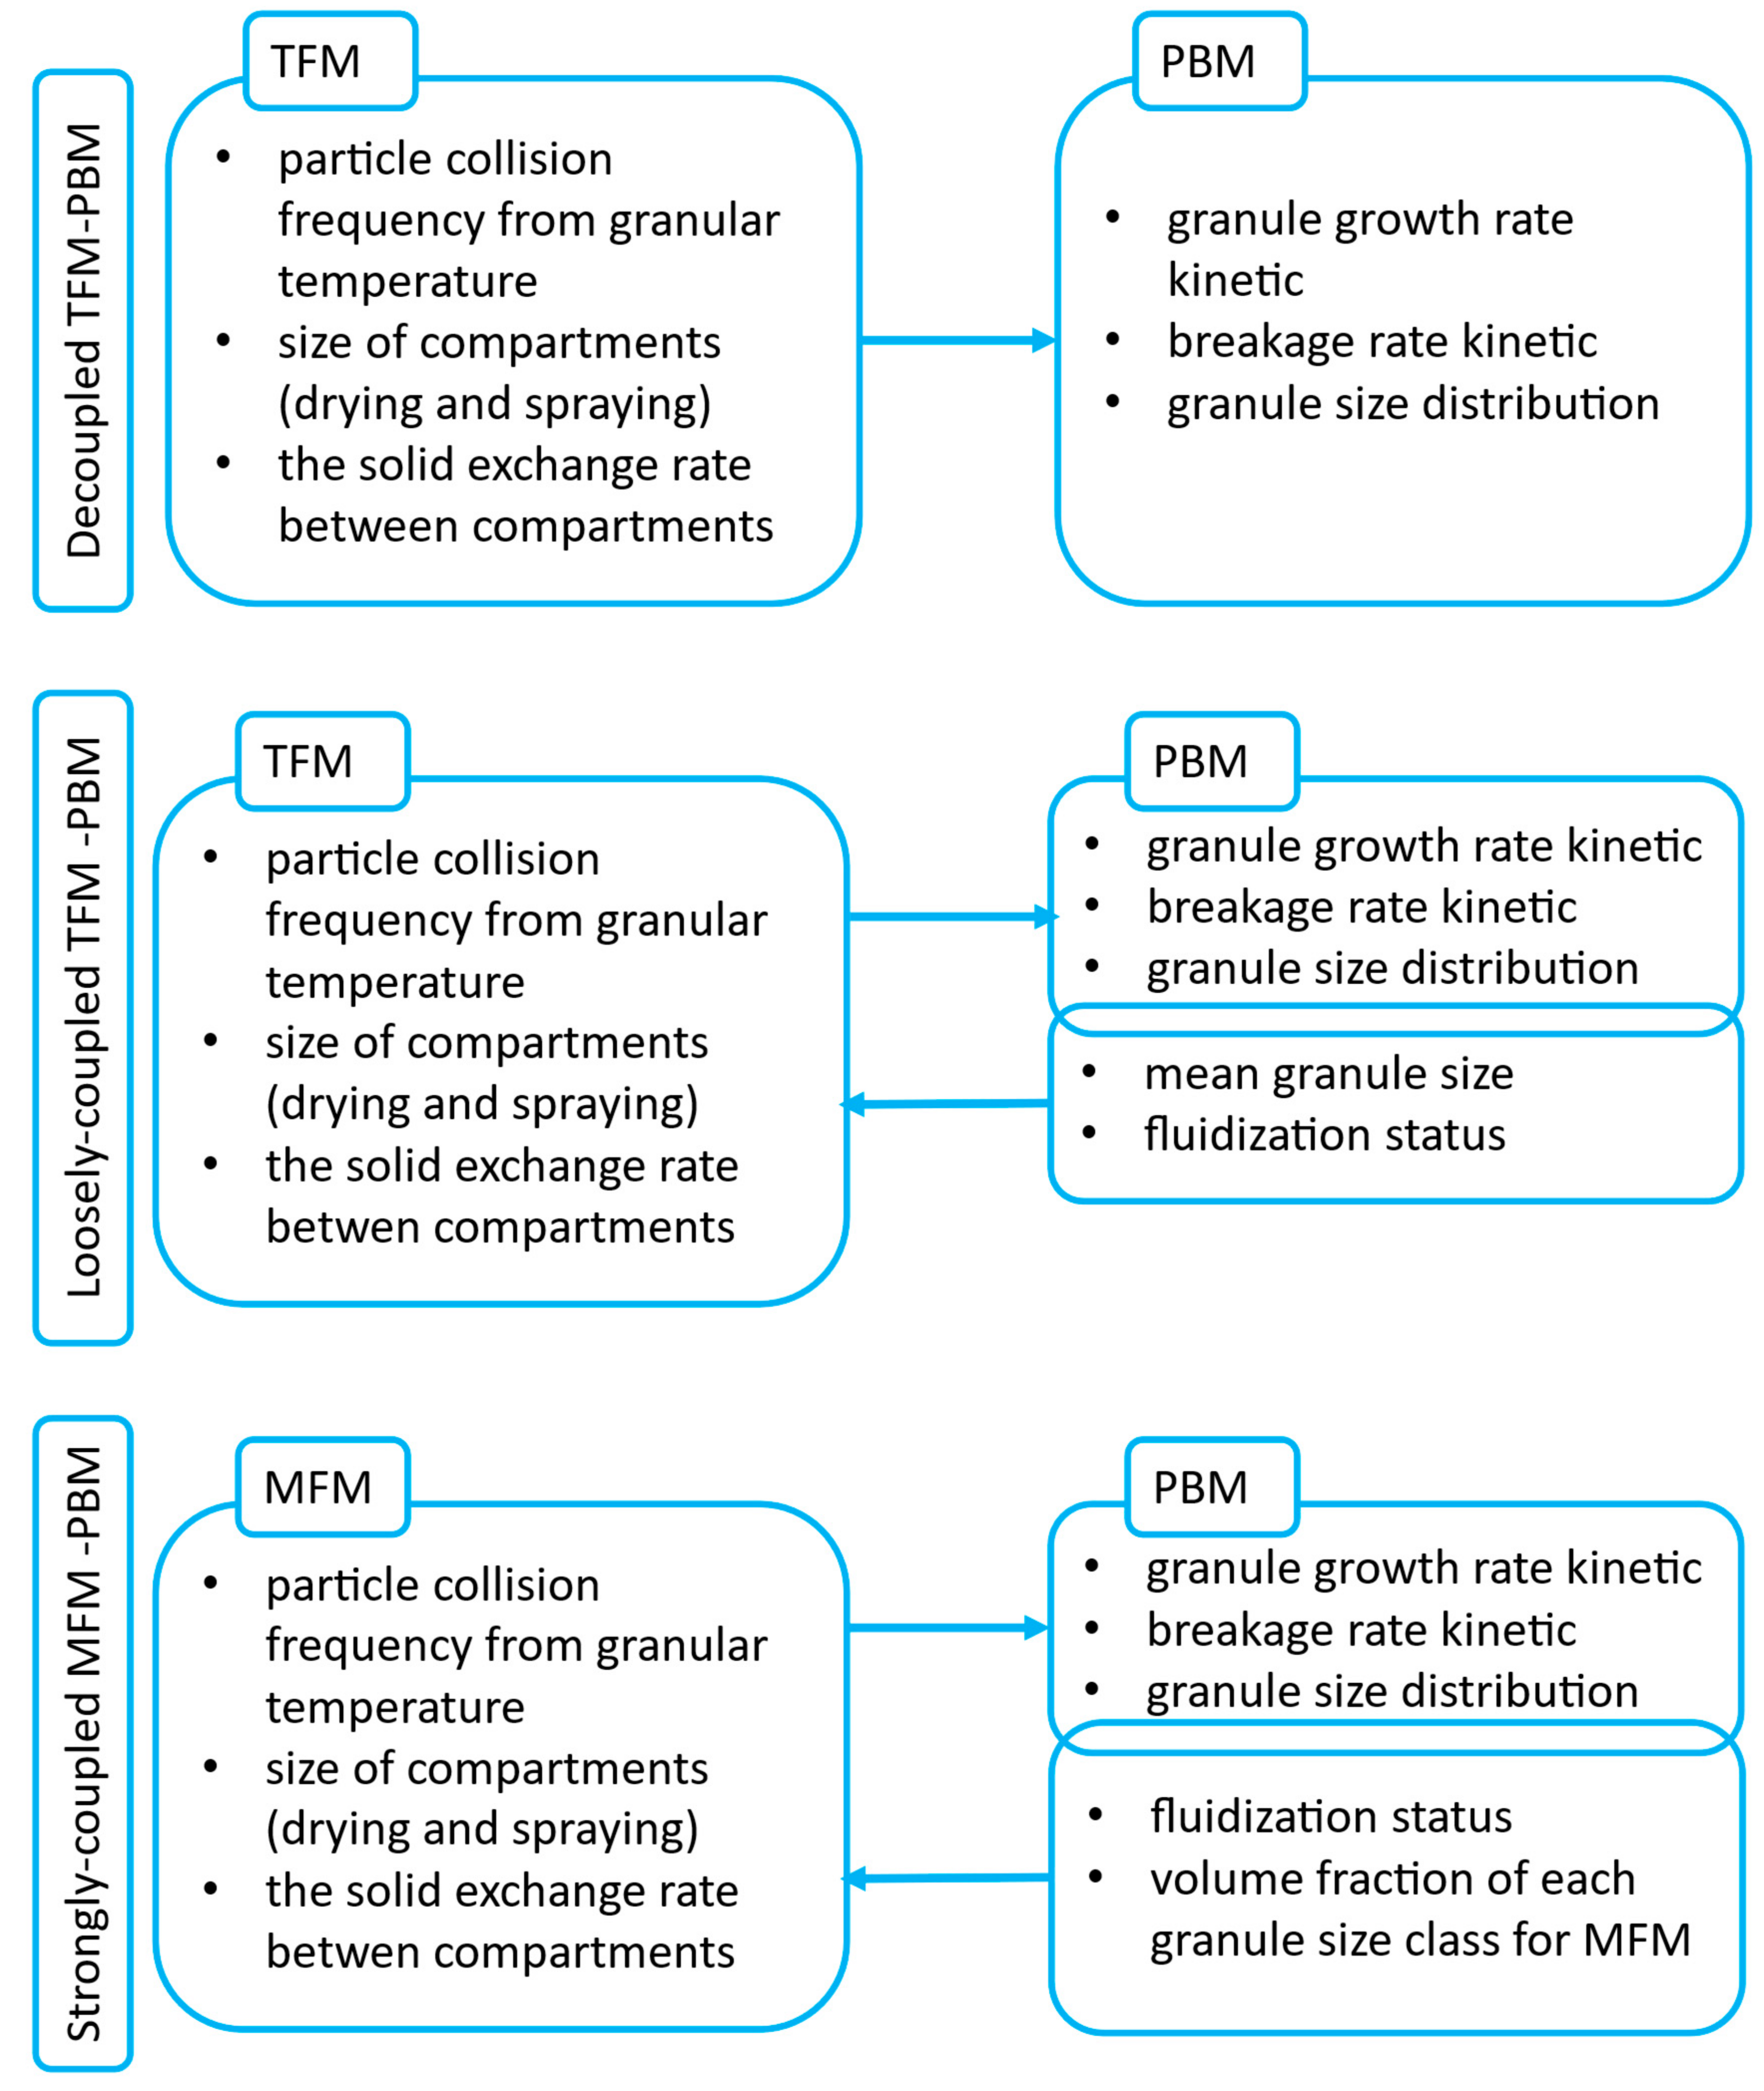
4.1.2. Decoupled TFM-PBM

In this approach, the TFM is used to introduce the input parameters for a PBM approach. In detail, the size of the compartments (drying and wetting) and the solid exchange rate between the two compartments are computed using the TFM approach. Subsequently, these pieces of information are used as inputs for a PBM-based model.
For instance, Liu and Li [32] employed the TFM approach to develop a compartmental model for a fluid bed granulator. In detail, through TFM, they obtained (i) the solid exchange rate at the steady-state mass flow rate between the drying and spray compartments (zones) and (ii) the total volume of particles in the two compartments. They pre-set the size of the wetting and drying zones to 30% and 70% (volumetric), respectively. However, the size of these zones depends on the atomization and fluidization behavior of the bed [33,34]. They also limited the agglomeration to the spray (wetting) zone and the breakage to the drying zone. To simulate granule growth, they used the PBM approach proposed by Hounslow et al. [35,36]. However, no model for drying was considered in their study.
Li et al. [37] used a decoupled TFM-PBM approach to simulate drying and dust integration in an FBG. In detail, the TFM was employed to solve the drop deposition rate and the rate of dust integration based on the inertia deposition model of Löffler [38]. Subsequently, the extracted growth kinetic was used in the PBM approach to track the particle size distribution. Their study showed that an increase in the air temperature reduces the dust-integration rate because the wetted surface area decreases due to the evaporation from the particle surfaces.
Askarishahi et al. [39,40,41] conducted a muti-scale study using a TFM and a drying model of a top-spray fluidized bed. They evaluated the uniformity of particle moisture content in the fluidized bed to identify well-mixed compartments in the FB. It should be noted that they also ignored the particle agglomeration upon identifying the compartments. Subsequently, they developed a multi-compartment model for drying simulation in top-spray FBGs. They reported that the multi-compartmental model could predict the performance of wet FB very well as long as the bed is not shallow and the mixing in the dense bed is efficient. Later, they extended the proposed multi-compartment model to simulate the agglomerate growth using the PBM approach [9,10].

4.1.3. Loosely Coupled TFM-PBM

In this approach, a single solids phase (i.e., one size class) is considered for the granules. However, the diameter of granules in this single solids phase is updated by solving a population balance equation for the granule size. This means that in the TFM approach, only a dynamically updated mean size of the granules is used to predict the flow behavior. This approach cannot accurately predict the fluidization behavior range for the particles/granules as influenced by drying and agglomeration. For instance, due to drying and liquid loss, the minimum fluidization velocity of over-dried granules can decrease while that of over-wetted granules increases. The latter may result in partial defluidization of the fluid bed. In addition, the surface area available for drying cannot be estimated accurately. To the best of our knowledge, there is no study in the literature using this approach.

4.1.4. Strongly Coupled MFM-PBM

In this approach, one may consider several solids’ phases with different particle sizes representing different granule size classes. This method is an extension of TFM known as MFM, reflecting that multiple solid phases are considered. In this regard, constitutive equations are required for the rate of particle exchange between different classes of granule size, which can be realized through the PBM. This means particle–particle interactions are considered through the agglomeration and breakage kernels in the population balance equations (PBEs). This requires that the volume fraction of particles in each solids phase is updated at each coupling time step based on the exchange rate between different classes. To do so, one needs to solve a transport equation for every size class of this solids phase in every bin of the CFD model [42]. This results in higher accuracy at the expense of higher computational costs.
Li et al. [43] adopted an MFM-PBE multiscale approach to describe a continuously operated fluidized bed spray granulation process. Their MFM model considered two granule phases, two dust phases, and one droplet phase (with a constant density for granule phases). They considered two population balance equations for the dust phase (i.e., fine particles smaller than 120   μ m ) and the granular phase due to different circulation times. They used CFD to obtain the kinetics of growth for the granules and dust for short process times for the process-relevant mechanisms (i.e., droplet deposition, drying, dust integration, and internal nucleation). Precisely, with the help of CFD, they calculated the number of oversprays, dust integration, and collisional frequency. Subsequently, they implemented the growth kinetic in a one-dimensional PBE to enable the simulation of long process times. To solve the PBE for the dust particles, they adopted a Direct Quadrature Method of Moments (DQMOM) approach in their CFD simulation. The growth in the dust particles’ size class stems from the collision with the droplet and self-agglomeration, i.e., overspray and dust integration. They made several simplifications in calculating the agglomeration kernel: (i) the rate of agglomeration and growth of dust are size-independent, (ii) every collision is assumed to be successful. However, the latter may lead to over-prediction of agglomerate growth rate because the success factor of a collision depends on the impact velocity and the properties of the binder solution. They used the wet-bulb phenomenon principle for particle drying and droplet evaporation to consider drying.

4.1.5. Modified Solids Rheology

In the last and most rigorous approach, the rheology of the solids phase is modified to account for the change in the inter-particle forces due to agglomeration and drying. To realize this, the solids’ pressure, viscosity, and granular energy must be expressed as a function of granule liquid content and binding liquid properties. This is typically performed through particle Bond and capillary numbers, which can change by drying and agglomeration phenomena. The advantage of this model is that it does not require fitting parameters similar to the kernels in the TFM-PBM approaches. Unfortunately, a rigorous, robust model is still lacking in the literature, to the best of the authors’ knowledge. Only recently, Gu et al. [29] developed a KTGF-based solids rheology model for cohesive powders in the presence of van der Waals forces using DEM. Askarishahi et al. [44] implemented this model in a TFM-based simulation platform to develop a regime map of fluidization for cohesive powders. Their simulation results demonstrated the formation of particle clusters and agglomeration in the fluidized bed. This highlights that the TFM approach can predict the granule formation if the necessary constitutive equations can be developed based on DEM or DNS approach, as performed by Gu et al. [29] for van der Waals forces.
Table 2. Phenomena involved in fluid bed granulation which need to be addressed in the TFM approach.
Phenomena ConsideredNumber of PapersReferences
Granulation and drying2Li et al. [37], Li et al. [43]
Breakage1Liu and Li [32]
The success factor of collision0-
Cohesion force0-
Accounting for surface coverage1Askarishahi et al. [39]
Intra-particle layer thickness variability0-
Stefan diffusion effects in evaporation (Spalding mass transfer numbers)0-
Falling rate drying2Wang et al. [30], Tu et al. [31]
Modified solids rheology0-

4.2. CFD-DEM-Based Models

The review of Yeom et al. [45]—that documents DEM-based model applications in the pharmaceutical industry—reveals the following for drying modeling: DEM-based models were mainly used for high-shear granulator modeling (10 out of 18 studies), then for FBG modeling (5 out of 18), and only three studies were focused on twin screw granulators. However, most of these studies (even recent ones, e.g., Tamrakar et al. [46]) in the field of high-shear granulation did not model drying. This is also the case for twin screw granulator-based studies. Only studies using the DEM in the area of FBGs involved some kind of drying models. These studies are discussed in the next section.
We note in passing that we have excluded the numerous studies that focused on analyzing particle motion and the residence time distribution in various zones only. For instance, this group of studies includes the work of Farivar et al. [47], who focused on the effect of particle shape (spheres and cylinders) for mm-sized particles and used an accurate modeling of the droplet cloud; or the early studies of the Heinrich group, e.g., Fries et al. [48]. While these DEM-based studies are frequently found in the literature, they cannot provide direct data on the evolution of drying or a coating layer on particles.

4.2.1. Drying in the Context of Granulation Research

The early study of Kafui and Thornton [49] from 2008 introduced CFD-DEM simulations in the field of granulator simulation. A narrow particle size distribution of around 50   µ m was used, and a small size of the simulation domain and small time span was selected due to the enormous computational demand relative to computer power at these early times. Remarkable is the high level of physical models used in this early study:
  • A particle located in the spray zone at a certain distance from the spray source accumulates “wet surface energy” (i.e., the ability to build cohesive forces) based on an exponential function of residence time in the spray zone.
  • Drying of the deposited liquid initially increases and subsequently decreases particle–particle cohesive forces (i.e., the binder is assumed to become more viscous at the initial phase of drying and then solidifies)
  • The liquid in a particle–particle bond is also dried based on an exponential function of the liquid bond age. The surface energy (i.e., the strength of the cohesive force) is increased based on a “dry-out factor” that quantifies the final (i.e., dry) strength of the bond. This considers the well-known fact that solidified liquid bridges can withstand substantial forces [50].
Askarishahi et al. [51] employed the CFD-DEM approach to simulate droplet deposition and particle drying in a top-spray fluidized bed. They used the filtration model of Kolakaluri et al. [52] for droplet deposition and the model of Kariuki et al. [53] for particle surface coverage. To validate their drying implementation, they [54] proposed an analytical solution. Their results demonstrated the importance of particle surface coverage in predicting drying rates in a top-spray fluidized bed. In detail, they reported that the assumption of the formation of a continuous film on the particle’s outer surface can highly over-predict the drying rate in the FB. They [55,56] later proposed a voidage-correction approach to improve the accuracy of heat transfer in such system using coarse-graining and filtering approach.
Tamrakar and Ramachandran [46] used a PBM-CFD-DEM-based model for agglomeration. Flow and temperatures were computed in the CFD-DEM part of their model (heat transfer rates were used to conclude back on drying rates, but no direct simulation of drying was performed). Spraying and drying were modeled only in their two-compartment PBM part of the model and not in the flow model (i.e., CFD-DEM part). The particle size was scaled by a factor of 4.35 to yield a parcel size of 3.85   mm . The assumption that liquid is spread uniformly in the entire compartment was adopted. To the best of our knowledge, this study is the only one that attempted to couple the PBM with a CFD-DEM-based approach on the fly.
Aziz et al. [57] simulated heat and mass transfer and thus attempted to predict drying rates directly. Cohesion was modeled (via liquid bridges), and a pseudo-two-dimensional setup motivated by earlier experimental work was investigated (i.e., lactose, starch, and PVP were considered as in the study of Briens and Bojarra [58]). Aziz et al. [57] picked the particle size for numerical reasons (just to reduce the number of particles to be simulated!). Specifically, they used very large particles (i.e., 2.4 mm) that were not allowed to change size. Thus, the agglomerates were simulated, not the primary particles. Only indirect validation was performed, i.e., data were normalized before the comparison with the experiment due to significant differences in particle size and size distribution. The effect of the local particle volume fraction on the Nusselt number was considered for realistic modeling of heat transfer rates. When estimating the drying rates, the total particle surface area was considered, not the wetted area. The effect of the local particle volume fraction on the Sherwood number was not considered. However, they considered the saturation moisture content when calculating the driving concentration difference (involving an Arrhenius-type of expression) based on the “reaction engineering approach” of Putranto and Chen [59]. Aziz et al. [57] mentioned the importance of coarse-graining methods that need to be established to enable future research.
Kieckhefen et al. [60] considered heat and mass transfer rates. Specifically, the Gunn equation for the Nusselt and Sherwood numbers was used. To compute the particle surface coverage, they followed the work of Askarishahi et al. [51] based on the fraction of wetted particle area calculated by the model proposed by Kariuki et al. [53]. Very low coefficients of restitution (i.e., 0.051 ), but no cohesion force model was used in this study. The particle size was considered in line with the experimental material (i.e., 650   µ m ). However, a coarse-graining ratio of 4 was employed, resulting in an effective parcel diameter of 2.6   mm . The results of Kieckhefen et al. [60] indicate extreme gradients in gas and particle temperature, local vapor concentration, and heat (and mass) transfer rates.

4.2.2. Drying in the Context of Coating

In 2011, Fries et al. [61] performed CFD-DEM simulations, including evaporation effects considering particles with a diameter of 2   mm ; however, under the absence of cohesive forces. Partial surface coverage was considered by assuming a fixed liquid film thickness of 0.1   mm .
Jiang et al. [62] used CFD-DEM to investigate a Wurster fluidized bed coater’s residence time and collision velocity in different processing zones. They used relatively large particles ( 1.75   mm , monodisperse), accounted for liquid-bridge induced cohesion forces, details of droplet deposition, and evaporation (first drying period only). Jiang et al. [62] made the significant assumption that the vapor mass fraction in the bulk is identical to the steady-state vapor concentration under well-mixed conditions. Moreover, the temperature distribution was not tracked in the system, and Sherwood number correlations of isolated particles were used, entirely neglecting increased mass transfer rates in dense granular systems. This work used a detailed Monte-Carlo-based droplet and layer formation model and was able to unveil intra-particle coating layer variability. Effects of cohesion on product particle properties were found to be significant.
Che et al. [63] employed CFD-DEM to study particle coating in a Wurster coater. Moreover, cohesive forces due to liquid bridges were included. However, they did not study particle agglomeration statistics or the agglomerate size distribution. Nusselt and Sherwood number correlations were used without considering the local particle volume fraction. For modeling droplet–particle collisions, they defined a spray zone. Particles were scaled such that a smaller number of parcels with a diameter ranging between 1.2 and 2.25   mm was simulated (i.e., coarse-graining factors between 1.4 and 2.6 were considered). Che et al. [63] revealed significant gradients in the relative humidity and evaporation rate field.
Li et al. [64] considered a cohesion model and evaporation and heat transport (a Nusselt correlation for isolated particles was used; the Sherwood number correlation was not stated, and no liquid surface coverage was considered). Cohesion induced by liquid bridges was considered using the classical Mikami et al. [65] models. A particle diameter of 1.3   mm in their drying validation case and 1   mm in the pseudo-two-dimensional case of their Wurster fluidized bed were considered. Their results indicate significant gradients in the vapor and liquid content distribution. The study of Li et al. [66] is similar to that of Li et al. [64]: no improvement of models for heat and mass transfer rates was made. However, this study analyzed different geometries. They considered a particle diameter of 1   mm , and a pseudo-two-dimensional setup was studied. No dedicated cohesion model and no liquid surface coverage model were considered in their evaporation model.
Madlmeir and Radl [67] focussed on consistent coarse-graining, especially for the spray deposition part. An advanced evaporation model accounting for Stefan-Diffusion effects (based on the Spalding mass transfer number) was considered. The particle diameter was 1 mm, and coarse-graining ratios of up to 10 were investigated. Extremely thin regions in which particles were wet were observed, and methods to retain the predictive power with respect to these high gradients were discussed. Earlier work of this group [62] focused on evaporation rates, including multi-component evaporation.
Table 3 summarizes important phenomena which should be considered in CFD-DEM simulations of agglomeration and drying. In this table, a number of available studies addressing these phenomena have been listed.

4.3. Stochastic Models

Stochastic models are micro-scale models based on the random realization of events, which can be used to simulate FBGs by including multiple mechanisms (agglomeration, breakage, drying, etc.). Compared to the PBM, the main advantage of statistical approaches is the elimination of complexities related to solving multivariate population balance equations [69]. In addition, stochastic approaches can be employed to extract the kinetic kernels required for macroscopic approaches (e.g., the PBM) [70,71]. However, stochastic models such as the Monte Carlo approach can only be applied to a small ensemble of particles/droplets due to their high computational cost. This means that such approaches cannot be used for process control purposes [70,71]. In this section, we review the studies that use statistical approaches to simulate drying and agglomeration in FBGs.
The Monte-Carlo method (MC) has been widely applied in the simulation of granulation systems [8,21,69,70,71,72,73,74,75,76,77,78,79]. According to Terrazas-Velarde et al. [19], for granulation and drying, the procedure of MC simulation is as follows: Initially, droplets are deposited on the particles based on their surface energy and contact angle (typically fixed). Afterward, droplet drying starts as soon as droplet deposition occurs. One can compute the properties for the next event based on the agglomeration, breakage, and rebound.
Terrazas-Velarde et al. [20,21] used a constant volume MC (CVMC) method to simulate a scaled-down FBG by considering continuous binder addition and simultaneous drying of deposited droplets. In detail, they considered the dependency of the binder viscosity on drying and its effect on the formation of agglomerates from non-porous particles. Their results demonstrated that drying of the deposited droplets does not change the process significantly. This marginal influence was related to a much shorter time scale for particle collisions than the time scale for drying based on their studied range of operation conditions. However, several researchers reported that binder viscosity and the presence of solid binders in the solution affect the drying rate and, consequently, the agglomeration rate [69,71,74,75,76]. Another disadvantage of their approach is assuming mono-sized droplets and primary particles. They also considered a well-mixed condition to calculate the bulk air moisture content, constant collisional velocities, and mass transfer coefficient, which are not necessarily correct in all operating conditions. Moreover, they did not consider the breakage mechanism and imbibition of binder droplets in particles, which can affect the drying rate.
Later, Terrazas-Velarde et al. [19] extended their MC approach by including the droplet penetration mechanism into the substrates’ pores and developed a combined imbibition-drying model. They reported that by the inclusion of imbibition and drying, the predicted results come closer to the ones observed in the experiments. Their results also showed that the agglomeration rate of porous particles is dramatically lower than non-porous particles. According to their results, the deposited droplet drying effect on the agglomeration becomes more significant at higher binder viscosities. Nevertheless, their model suffers from applying simple models for estimation of the fluid flow dynamics, lack of evaporation of droplets before deposition, and simple models to estimate the mass transfer coefficient needed for computation of drying rate.
Dernedde et al. [79] developed a novel algorithm that accounts for the unrestricted spatial development of agglomerates in 3D. This approach can track the evolution of particle morphology; however, the computational cost is too high, and this approach typically predicts too porous agglomerates. Later, in another study, Dernedde et al. [74] improved the MC model by considering the solid binder content effect on droplet drying and pre-drying of droplets before deposition. In detail, they modified the drying rate based on crust formation due to the evolving binder concentration and its gradient in the drops. Comparing their numerical results and experimental data highlights the importance of the diffusion mechanism of volatile components in the binder solution that affects the drying rate. The main drawback of their method is estimating the water vapor content in the bulk gas. Remarkably, they considered the steady-state water vapor content for the bulk: the summation of inlet water vapor content and evaporation of the total injected water via the nozzle. However, this assumption can highly over-predict the vapor content of the air.
Recently, Du et al. [76] used the MC method to extract the kinetic kernels to simulate continuous spray fluidized beds. They used the methodology developed by Terrazas-Velarde et al. [19] to estimate the drying rate. In detail, the height of the spherical caps of the deposited droplets shrinks until they solidify. At each event, the possibility of the formation of agglomerates is calculated based on the available liquid on the surface of the particle (represented as the height of the spherical cap). This means the drying rate implicitly affects the growth rate in the granulation process. They also considered a breakage model and preserved the liquid in the bridge to calculate the drying rate after the breakage until another collision or the binder liquid vanishes. They stated that the proposed model should be improved by considering the crust formation in drops and investigating a more comprehensive range of operating conditions.
In Table 4, we presented a summary of important phenomena which are required to be considered in stochastic modeling of agglomeration and drying. In this table, one can also find a number of available studies in which these phenomena have been addressed.

4.4. Compartment Models

Compartmental modeling is another approach for simulating drying and agglomeration in FBGs. In this approach, the fluid bed is divided into well-mixed compartments based on the dominant phenomenon, such as agglomeration, drying, and spraying. The main advantage of this approach is the significantly lower computational cost compared to detailed simulation methods such as stochastic models, TFMs, and CFD-DEM-based models. This is simply because the interaction between different media (fluid, particle, and droplets) is not resolved. In addition, the non-linear Navier–Stokes equations, as the most computationally expensive parts, are not solved. The resulting disadvantage of the compartmental approach is the inability to simulate the flow in the process directly—this information must be provided as inputs for such models.
In the compartmental model, the population balance model is typically used to track the agglomeration growth and breakage, which requires constitutive equations for the agglomeration and breakage kernels. These kernels can be obtained either empirically or numerically (e.g., from stochastic models). In granulation, drying can influence the liquid content of particles and, consequently, the rate of agglomeration and breakage. Therefore, the effect of drying must be incorporated into the agglomeration/breakage kernels.
Various researchers used a compartmental modeling approach to simulate fluid bed granulation. Some of these studies neglected the effect of drying. For instance, Liu and Li [32] developed two-compartmental PBM for a pulsed top-spray FBG. They divided the bed into well-mixed compartments by performing CFD-based simulations. They assumed a predefined fixed size for the spray and drying zone. However, the role of granule drying was neglected in their study.
Heinrich et al. [81] developed a compartmental model for drying (constant-rate period only) in fluid bed granulation systems. They used the “Two-Phase” model of Kunii and Levenspiel [82] for the hydrodynamics. In this approach, the solids phase is considered a well-mixed compartment, while the gas phase is considered a plug flow. To simulate the droplet–particle interaction, they used the inertial drop deposition model of Löffler [38]. In this model, the deposition efficiency of a single particle is calculated based on the impingement efficiency and the adhesion probability [38]; the impingement efficiency was calculated based on Stokes Number as proposed by Schush et al. [83]. However, they did not model agglomeration and did not consider the falling drying rate periods.
Later, 2007 Peglow et al. [84] proposed a more advanced model by including the PBM approach to predict particle size enlargement by modified two-phase-fluidized bed model from Burgschweiger et al. [85]. They considered agglomeration and the simultaneous drying of particles. Through a PBM approach, they predict the granules’ size distribution, moisture content, and temperature.
In a series of studies, Hussain et al. [86,87,88] proposed a more rigorous model by combining the Monte Carlo approach with compartmental modeling to develop a PBM approach for fluid bed granulation. They modeled the average wet surface coverage fraction per wet particle and the average success fraction concerning the dissipation of kinetic energy on a macroscopic scale Hussain et al. [87]. Their model can predict the particle size distribution, the total number of agglomerates, the total number of droplets, and the total number of wet particles in the system.
Later in 2015, Hussain et al. [89] extended their PBM approach by focusing on the critical micro-scale phenomena of sessile droplet drying and the efficiency of collisions in fluid bed granulator simulation. Their model requires two input parameters: (i) the drying time of sessile droplets (needs to be calculated in advance), and (ii) the pre-factor in an equation which correlates particle collision frequency with fluidized bed expansion. They reported that the PBM approach is almost predictive for a wide range of operating conditions.
Chen et al. [90] used single-particle drying kinetic to simulate a horizontal fluid bed dryer. In detail, they combined back-mixing theory with PBM. However, they pointed out that the residence time of particles in the bed should be considered. To do so, Chen et al. [91] employed the CFD approach to estimate the residence time of particles and incorporated that in their PBM.
Das and Kumar [75] extended the work of Hussain et al. [89]. They estimated the death rate of binder droplets due to drying using a PBM for the total number of available droplets and the distribution of wet particles. They used a Monte Carlo model to extract the required quantities for calculating the agglomeration kernel in the PBM approach (i.e., the volume and time-dependent probability of successful wet position collisions and death rate of wet particles due to the drying mechanism). The disadvantage of their PBM approach is that it relies on a fitting parameter for the probability of successful wet-position collisions.
Askarishahi et al. [9,10] developed a compartment model for the simulation of agglomeration and drying in a top-spray fluidized bed. They considered both drying and agglomeration. They used several fitting parameters for the agglomeration kernel. To consider drying, they simulated both constant-rate and falling-rate periods. One of the main advantages of their work was considering a drying curve model which needs only one fitting parameter. Different operating conditions lead to different granule morphologies, so the drying curve parameter should be estimated for each experiment. To evaluate the predictability of their model, they conducted a set of experiments and divided them into two groups. Using the first group of experiments, they developed a set of correlations for the model parameters as a function of operating conditions and particle and spray properties. Then, another group of experimental data were used to validate the developed model. Their model shows good predictability for the studied range of particle, spray, and gas properties. Recently, Arthur et al. [92] used the same flowsheet modeling approach as Askarishahi et al. [9,10] to simulate drying in an FBG, utilizing the drying model of Burgschweiger et al. [85].
Several other studies conducted in the field (Burgschweiger et al. [85,93], Börner et al. [34,94], Peglow et al. [84,95], and many others) used a compartmental approach for the simulation of fluid bed granulation. For the sake of conciseness, we will discuss these studies later in the section describing the challenges in the simulation (Section 5).
Based on the above review, it can be concluded that most compartmental modeling studies do not consider granulation and drying. There are a few exceptions, as listed in Table 5. Other two essential aspects are (i) calculating the surface coverage of particles with droplets and (ii) the rate of droplet deposition, which are typically neglected. Ignoring the contribution of these two aspects can result in overprediction of drying from the particle surface. Section 5.1 and Section 5.2 will discuss these aspects in more detail.

5. Challenges in the Simulation of Drying in Granulation

As already documented in the review of Ramachandran et al. [97], drying simulation in fluid bed granulation systems is faced with several challenges. This is due to the high level of complexity associated with the following phenomena:
i.
Droplet tracking and droplet–particle interactions;
ii.
Particle–particle interactions, agglomerate growth, and breakage during spraying and drying;
iii.
The flow of the granules in the fluidized bed [98,99,100];
iv.
Multi-component liquid evaporation and binder effect on drying and consolidation (e.g., dependency of binder solution viscosity on the shear rate and temperature due to non-Newtonian behavior);
v.
Possible dissolution of solid powders in the liquid phase;
vi.
Primary particles’ pore network (intra-particle voidage) and the changing granule pore structure (inter-particle voidage inside a granule) during the process;
vii.
Redistribution of liquid among primary particles upon collision and agglomerate formation;
viii.
Drying rates as affected by surface moisture and internal moisture;
ix.
The contribution of various phenomena to drying, including:
  • Hydrodynamics (e.g., surface tension force-driven drying in a pore, immigration of pore liquid to the surface due to capillary);
  • Mass transfer (e.g., wet-bulb phenomenon and saturation of fluid, diffusion-driven drying in the pore);
  • Heat transfer (e.g., temperature effect on fluid phase capacity to carry vapor).
x.
The high computational cost for detailed simulations due to the high number of particles and droplets involved.
Consequently, upon simulating drying phenomena in fluid bed granulators, we will be faced with challenges to
  • Simulate the droplet flow and their interaction with particles/granules (Section 5.1);
  • Predict the evaporation of liquid from the outer surface, inside the pores, and binding liquid. For this purpose, we need to obtain/compute the drying surface area, drying kinetic, and driving force for drying (Section 5.2, Section 5.3, Section 5.4);
  • Accurately predict the contribution of droplet evaporation and particle drying to generating liquid vapor (Section 5.4.3);
  • Consider the inter-relation of drying and change in granule size (Section 5.6).
In the remaining part of our present review study, the main focus is given to (i) the challenges associated with these complexities, (ii) how these challenges have been addressed in the literature, (iii) the drawbacks and limitations of the previously used methodologies, and (iv) the gaps which still exist.

5.1. Droplet Tracking and Droplet–Particle Interaction

5.1.1. Droplets as Lagrangian Points

The most detailed but computationally demanding method to predict the droplet distribution is to track them as Lagrangian points. This method is conceptually comparably simple to implement (i.e., a Lagrangian phase is added to the overall simulation model). However, the computational expense inherent to this method is justified only in the following situations:
(1)
It is not clear whether evaporating droplets follow the gas flow (i.e., the limit of zero Stokes number is reached, i.e., small droplets) or have enough inertia to simply pierce the gas flow and follow predominantly straight trajectories (i.e., the limit of infinite Stokes number applies, i.e., large droplets);
(2)
A wide droplet size distribution is present, such that the droplet Stokes number covers a wide range such that criterium (1) becomes relevant;
(3)
Droplets change their properties (i.e., diameter, composition) significantly during their journey through the gas phase as a result of drying;
(4)
The droplet impact speed on particles or walls is of central interest, e.g., to account for phenomena such as splashing.
The fact that a Lagrangian simulation model is available, e.g., as is the case in CFD-DEM-type models, is also an indicator that one may want to track droplets directly. Indeed, all studies discussed below were based on DEM-based particle simulations. The following chapters will discuss an alternative class-wise or a method of moments-based Eulerian modeling. Unfortunately, such a Euler-based approach comes at a significant additional complexity, with consequences for, e.g., the implementation of computer codes. Similar considerations are valid for simple ray tracing methods [67] which do not account for particle–droplet interaction physics. Thus, a Lagrangian tracking of droplets might also act as a compromise in case this additional complexity should be avoided.
Examples of studies that tracked individual droplets include the following:
  • The early study of Goldschmidt [101,102] and co-workers considered droplets as discrete entities in addition to the particles. Drying was absent since they focused on a melt granulation process in a two-dimensional setup. Droplets were injected into a spray zone, allowing for randomized droplet velocities. The collision of particles and droplets leads to wetted particles (“coalescence”), and the collision of wet particles can result in the formation of granules (“agglomeration”). Even the “masking” of the wetted surface inside a granule was considered. Since they used a hard-sphere approach, their model did not allow consideration of multiple contacts.
  • Barrasso and Ramachandran [103] performed 3D flow simulations in an unrealistically small domain (a “drum” with a diameter of 40 mm and a length of 60 mm) and huge primary particles (1 mm diameter). Liquid droplets were considered to have the same size and composition as the solid particles. A cylindrical region (diameter of 8 mm, full drum length) was considered as the liquid addition zone. No cohesive interactions or drying model were characteristics of this conceptual study to demonstrate how the coupling between the DEM and the PBM can be achieved.
  • In the studies of Jiang et al. [62,77], solid-like droplets are considered to directly investigate the droplet deposition rate in the spray zone. In detail, they considered droplet–particle impacts and analyzed their outcome depending on the Weber and Reynolds number (“depositing” or “splashing”) [77]. This study is one of the few articles in which intra-particle variations of the coating layer were considered.
  • In the CFD-DEM study of Grohn et al. [104] for layering granulation, the droplets are generated as a second particulate phase in the DEM part of the code. A “loading coefficient” of the liquid α, is introduced to consider the solid concentration in a solution used for coating. This hence enabled advanced consideration of the coating process of individual particles. This study considered a fixed global drying rate. Moreover, droplet drying (in flight) has not been studied in detail.

5.1.2. Spray Zone Approach

Simultaneous granulation and drying in fluid bed granulators impose a high level of complexity in the simulation of drying in such systems. To meet this challenge, a group of researchers tried to decouple these two phenomena by limiting them to a specific region of the FBG. In detail, they attempted to divide the bed into a number of compartments based on the dominant phenomenon occurring in that specific compartment, as already discussed in Section 4.1.2. Generally speaking, a spray zone is defined as a region with a high probability of particle–droplet collision. In contrast, the drying zone is defined as the region in which particles/granules are away from the droplet source and are in contact with the hot gas. This approach can simplify the simulation by limiting drying and agglomeration to just one compartment and decoupling these two phenomena. However, drying a freely flowing droplet in the spray zone is expected and should be considered in the modeling.

Identification of the Spray Zone

Identifying these zones is typically performed through experimental or numerical studies. For instance, Ronsse et al. [105,106,107] used the CFD-PBM approach and reported the formation of phenomenon-dominant zones in a top-spray coater as follows:
i.
Spray (or wetting) zone: the region close to the nozzle where droplet formation, droplet/particle collision, and spreading droplets on the particle surface occur. This region features high humidity and low temperature.
ii.
Drying zone: the region below the spray zone, identified by high fluctuation in temperature and humidity.
iii.
Heat transfer zone: the region above the distributor where there is significant heat exchange between fluidization air and particles. This region features high temperatures and constant humidity.
iv.
Non-active zone: the region between the heat transfer and drying zones, featuring constant temperature and humidity.
Börner et al. [34,94] conducted experimental and numerical studies to demarcate the spray zone in a top-spray fluid bed granulator to identify these zones. They reported that spray penetrates the particle bed, consequently leading to particle wetting. This leads to a process separation into two characteristic phenomenon-dominant compartments. In their study, the wetting compartment (i.e., the spray zone) is demarcated as the region where active binder droplets present and collide with particles. The typical layout of different zones has been illustrated in Figure 8.
In addition to experimentation, they got help from a CFD-DEM-based model to obtain more detailed information on the local particle wetting, droplet distribution, droplet lifetime, and the fraction of over-sprayed droplets. Goldschmidt [101] used the same approach to define the spray zone in their DEM simulation.
Börner et al. [34,94] showed that the compartment separation and the wetting procedure are highly influenced by the nozzle pressure, position, and fluidization intensity. However, the sizes of these zones were set a priori in several studies [32,86,108]. Such a pragmatic approach may limit the application of the spray zone concept, for instance, for the binder solutions having a high viscosity.
Askarishahi et al. [40] used the TFM approach to identify the well-mixed zone in a wet fluidized bed by visualizing and quantifying the rate of particle drying, as well as droplet deposition and droplet evaporation (see Figure 9). In addition to identifying the zones, the communication and the exchange between the compartments and their properties need to be determined quantitatively. Börner et al. [109] derived the parameters (compartment size and the particle residence time) for the two-compartment PBM approach for a Wurster coater. They used a simple gas–particle flow model and validated it using Particle Image Velocimetry (PIV, and image analysis. It should be noted that they did not consider any drying model. Their study revealed that the particle size distribution (PSD) of the product is influenced by the existence of two compartments and the particle-size-dependent residence time in the spray compartment.
The concept of a spray zone has been widely used to simulate granule growth in FBGs. In this regard, numerical simulations were performed to obtain the solids exchange rate between the compartments and the residence time of particles in each compartment. To do so, different approaches have been adapted to simulate the particle–droplet and particle–particle interactions.

No Interaction (Droplet–Particle Interaction Lumped into the Agglomeration Kernel)

In the simplest approach, no model is considered for the particle–droplet interaction and particle drying. Instead, all these phenomena are lumped into the agglomeration kernel.
Hussain et al. [86] considered two zones for wetting (spray) and drying in a top-spray FBG. The size of the zones has been set a priori. However, the size of the zones should be defined based on the spray and fluidization characteristics, as reported by Börner et al. [33,34]. Hussain et al. [86] evaluated the effect of spray zone size and different agglomeration kernels on the agglomeration rate constant. However, they did not model particle wetting and drying. Instead, they tried to extract the rate constants in the agglomeration kernel from experimental data and vary the size of the zones. The main disadvantage of this approach is the need for parameter fitting and experimental data. The results of Hussain et al. [86] demonstrated that the existence of two zones is one of the main reasons for the complex time-dependent behavior of the aggregation rate constant. They assumed that the agglomeration process occurs in the spray zone and the drying process occurs in the drying zone of the fluidized bed. Therefore, a temporal change in the number density of granules occurs only in the spray zone. In their study, the residence time of particles in each zone depends on the number of density distributions in the spray and drying zones and the particle flux between them.

Uniformly Distributed Droplet Deposition on Particles

In a more complex but still simple approach, droplets are assumed to be uniformly distributed over the particles in the spray zone. For instance, following the work of Ronsse et al. [105,106,107] for four well-mixed zones, Hede et al. [110] assumed a uniform distribution of droplets over the particles in a layering granulation (coating) process. In other words, all particles in the spray zone receive an equal amount of liquid per unit of time. The main drawback of this approach is neglecting the droplet–particle interaction, as the rate of particle wetting depends on the particle and droplet properties and their relative velocity. The study of Hede et al. [110] showed that the region with low temperatures and high humidity increases the agglomeration rate, attributing to the viscous Stokes theory of Ennis et al. [3] for wet particle collision.
Tamrakar and Ramachandran [46] predefined their spray zone based on a top-spray FBG experiment. They used the same approach as Hede et al. [110] and they assumed that the total amount of liquid injected into the spray zone was uniformly distributed among the particle in this compartment. They used the CFD-DEM to
i.
Track the particle residence time in the spray zone. This was performed by tracking the time particles needed to pass the spray zone. In this manner, higher residence time means higher liquid content of the particle;
ii.
Obtain the exchange rate of particles between different compartments (inter-compartmental particle transfer) and particle distribution in each compartment;
iii.
Obtain particle collision dynamics, including the collision frequency and collision energy.
They showed that the residence time of particles in both compartments is homogeneous. Their numerical and experimental results revealed that an increase in the spray rate and reduction in the air temperature increase granule size.
Neugebauer et al. [108] assumed that the sprayed liquid is uniformly distributed among all particles in the spray zone, following the work of Mörl [111] and Vreman et al. [112]. Neugebauer et al. [108] proposed a dynamic two-zone model to address the formation of granulation and drying zones in top-spray fluidized bed layering granulation. In detail, they assumed a constant volume for the granulation (spray) zone but a variable overall volume for the fluidized bed. It should be noted that they did not simulate the drying of granules in their study and only focused on the agglomeration, as also carried out by Bachmann et al. [113] and Kaur et al. [114].

Calculated Rate of Deposition

In more physics-based approaches, the rate of deposition of droplets on the particles is calculated either using a continuum approach or by considering droplets as discrete entities similar to DEM. Below, we will describe the detail of these approaches.
Heinrich et al. [81] conducted a numerical study on the simulation of a top-spray fluidized bed. They considered a conical spray region close to the nozzle. They calculated the deposition rate based on the impingement efficiency and probability of adhesion. Their simulation results demonstrated that there is an equilibrium between spraying, deposition, evaporation, heat transfer, and dispersion, which may lead to a constant average temperature in the bed.
Very recently, the spray-zone approach was also used by Che et al. [63]. In their CFD-DEM simulation, layering granulation in a Wurster coater was studied as previously performed by Maharjan and Jeong [115]. When modeling droplet–particle collisions, they considered a bi-conical spray zone whose dimensions are determined from high-resolution spray zone pictures. The amount of liquid deposited on the particles depends on the surface area of the particles and the residence time of particles in the spray zone. Particle adhesion was simulated through liquid bridge forces; however, they did not consider granule consolidation due to drying. They calculated the rate of drying based on the wet-bulb phenomenon and the wetted surface area of particles. Their simulation results revealed three modes of drying in a Wurster coater: (i) drying of wet particles in the fountain and coating region; (ii) drying in the upper part of the annulus region, stopping before re-entering the spray region; and (iii) occupation of whole fluidized bed chamber by the wet particles due to over-spray.
Askarishahi et al. [39] obtained the spray and drying zones in their TFM simulation of a top-spray fluidized bed. They used these two zones to develop their compartment model, as shown in Figure 9, based on the distribution of spray rate, drying rate, and deposition rate. They calculated the droplet deposition rate on the particle using the filtration approach of Kolakaluri et al. [52] (for details see Section 5.1.4). It should be noted that they limited the rate of deposition and droplet evaporation to the spray zone. In their compartmental simulation, Askarishahi et al. [9,10] defined the spray zone based on the droplet’s penetration depth and calculated the droplet evaporation rate based on its residence time in the spray zone.

5.1.3. Surface Energy Pick-Up Concept

A pragmatic approach to calculate the rate of deposition and drying is proposed by Kafui and Thornton [49]. In detail, they used the “surface energy” concept based on the theory of Johnson et al. [116] for the binding mechanism. They used three concepts of wetting, drying, and wet surface energy as follows:
i.
Wetting: “surface of particle becoming ‘active’ as a result of picking up surface energy in the spray zone”.
ii.
Drying: “increase in surface energy or adhesion energy value with time”.
iii.
Wet surface energy: “surface energy that can still form bonds and has not reached some terminal dried-out value”.
In detail, in this approach, a particle located in the spray zone at a distance from the spray source accumulates wet surface energy based on an exponential function of residence time in the spray zone, t s , and a linear function of the limiting surface energy of the spray, γ w m a x
γ w = γ w m a x e s 1 e t s
The liquid in a particle–particle bond is also dried based on an exponential function of bond age. The “wet” surface energy is dried in the drying zone, which results in an increase in active “wet” surface energy depending on the time spent in the drying zone after leaving the spray zone,
γ w = γ w 0 e s 1 + e 1 t s 0 t d s
For particle–particle adhesion, the surfaces energy increase is evaluated with the bond age, t b , and dry-out factor, d f a c (was set a priori to 2) as
γ d = γ w [ 1 + d f a c 1 1 e t b
Kafui and Thornton [49] observed a fast growth rate for the largest granule and attributed that to the surface energy value for the spray zone and low fluidization velocity. This approach has the advantage of estimating the drying rate based on the granule liquid content and differentiating the liquid on the surface and the liquid binding the particles.

5.1.4. Continuum Spray Filtration Model

The spray nozzles generate a large number of droplets with a range of droplet sizes. Therefore, the simulation of individual droplets and their interaction with particles increases the computational cost. To resolve this issue, a group of researchers employed a continuum approach to simulate the particle–droplet interaction in fluid bed granulators. For instance, Askarishahi et al. [39,40,51] calculated the droplet deposition rate on the particle using a clean-bed filter model developed by Kolakaluri et al. [52]. Using direct numerical simulation (DNS) of flow through a packed bed, Kolakaluri et al. [52] developed a correlation for the filtration coefficient as a function of the particle Reynolds Number, the droplet Stokes Number, and the solid volume fraction. In their model, the droplet deposition rate is calculated as
S d ˙ = λ u d u p μ l i q φ f ρ f
where u d u p is the slip velocity between the fluid phase and the particle. μ l i q is the droplet mass loading in the airflow. This means that droplet is considered as a component of humid air. The filtration coefficient is then given by
λ = η s 3 2 φ p D p
In which η s is single collector efficiency, which is a function of effective Stokes number, S t e f f * and is given by
η s = S t e f f * 3.2 4.3 + S t e f f * 3.2
S t e f f * = A φ p + 1.14 R e m 1 5 1 φ p 3 / 2 S t 2
The effective Stokes number is expressed as a function of particle volume fraction in the form of A φ p , and Stokes number, S t , and mean Reynold number, R e m , as follows:
A φ p = 6 6 φ p 5 3 6 9 φ p 1 3 + 9 φ p 5 3 6 φ p 2
S t = u f u p d d 2 ρ d 18 D p ν f φ f
R e m = u f u p 1 φ p ρ f d p ν f φ f
This approach features low computational cost with reasonable accuracy as there is no need to track individual droplets.
Li et al. [37,43] used an inertial drop deposition model following the work of Löffler [38]. The deposition efficiency, η , is a function of (i) the impingement efficiency, φ , and (ii) the adhesion probability h a d . The impingement efficiency describes the ratio of the number of drops, with a specific size, colliding with the particle to the number of these droplets in the projection area of the particle. The impingement efficiency can be expressed as a function of the Stokes number and Reynolds number. A similar approach was used by Heinrich et al. [81].
The disadvantage of the continuum approach is that the droplets are not modeled individually. Therefore, one cannot easily consider the droplet size distribution. In addition, the droplet interaction with the surrounding fluid was previously neglected.

5.1.5. Droplets in Stochastic Models

Stochastic models are another approach that can be employed to simulate droplet deposition on the particle. In this approach, the surface of the particle is divided into a number of sectors on one of whose positions the droplets can deposit in a random manner. As mentioned before, drying of deposited droplets is modeled using temporal reduction in droplet height as performed in the Monte-Carlo study of Singh et al. [72] and Du et al. [76]. For the sake of conciseness and to avoid repetition, we refer the interested reader to Section 4.3 for more detail on the challenges on this approach. Nevertheless, the main drawback of such an approach is the high computational cost.

5.1.6. Droplets in PBM Models

As described above, the computational cost associated with discrete droplet simulation is too high. On the other hand, the simplicity of the continuum approach does not allow using droplet size distribution. Therefore, to address these two issues, a group of researchers tried to simulate droplet–particle interaction using the PBM approach. For instance, Muddu et al. [117] used the PBM approach to track the droplet size and number, which change due to evaporation and deposition. They derived a mass balance equation for the liquid considering (i) the rate of particles being formed due to spray liquid addition into the bin and (ii) the rate of particles depleted due to liquid evaporation.
In another study, Hussain et al. [87] used the PBM approach to simulate droplet–particle interaction in an FBG. In their study, the droplet number density depends on the drying time and the accessible wet surface fraction. In a more accurate approach, Rajniak and Birmingham [118] developed a 1D-PBM based on the Direct Quadrature Method of Moments (DQMOM), i.e., considering the variation of the moments of the droplet size distribution with time. In this approach, the total drying rate is obtained by summing up the drying rates from individual droplets of different sizes deposited on the particle surface. According to Amini et al. [119], though this approach provides a reduced range of the estimated model parameters for a wide range of process conditions, it is still unclear if it can provide a better prediction for the temporal evolution of temperature and moisture in the FBG.
The main disadvantage of this approach is the model parameters which need to be extracted from experimental data for the kernels. This limits the application of the model to the operating range of the underlying experiments.

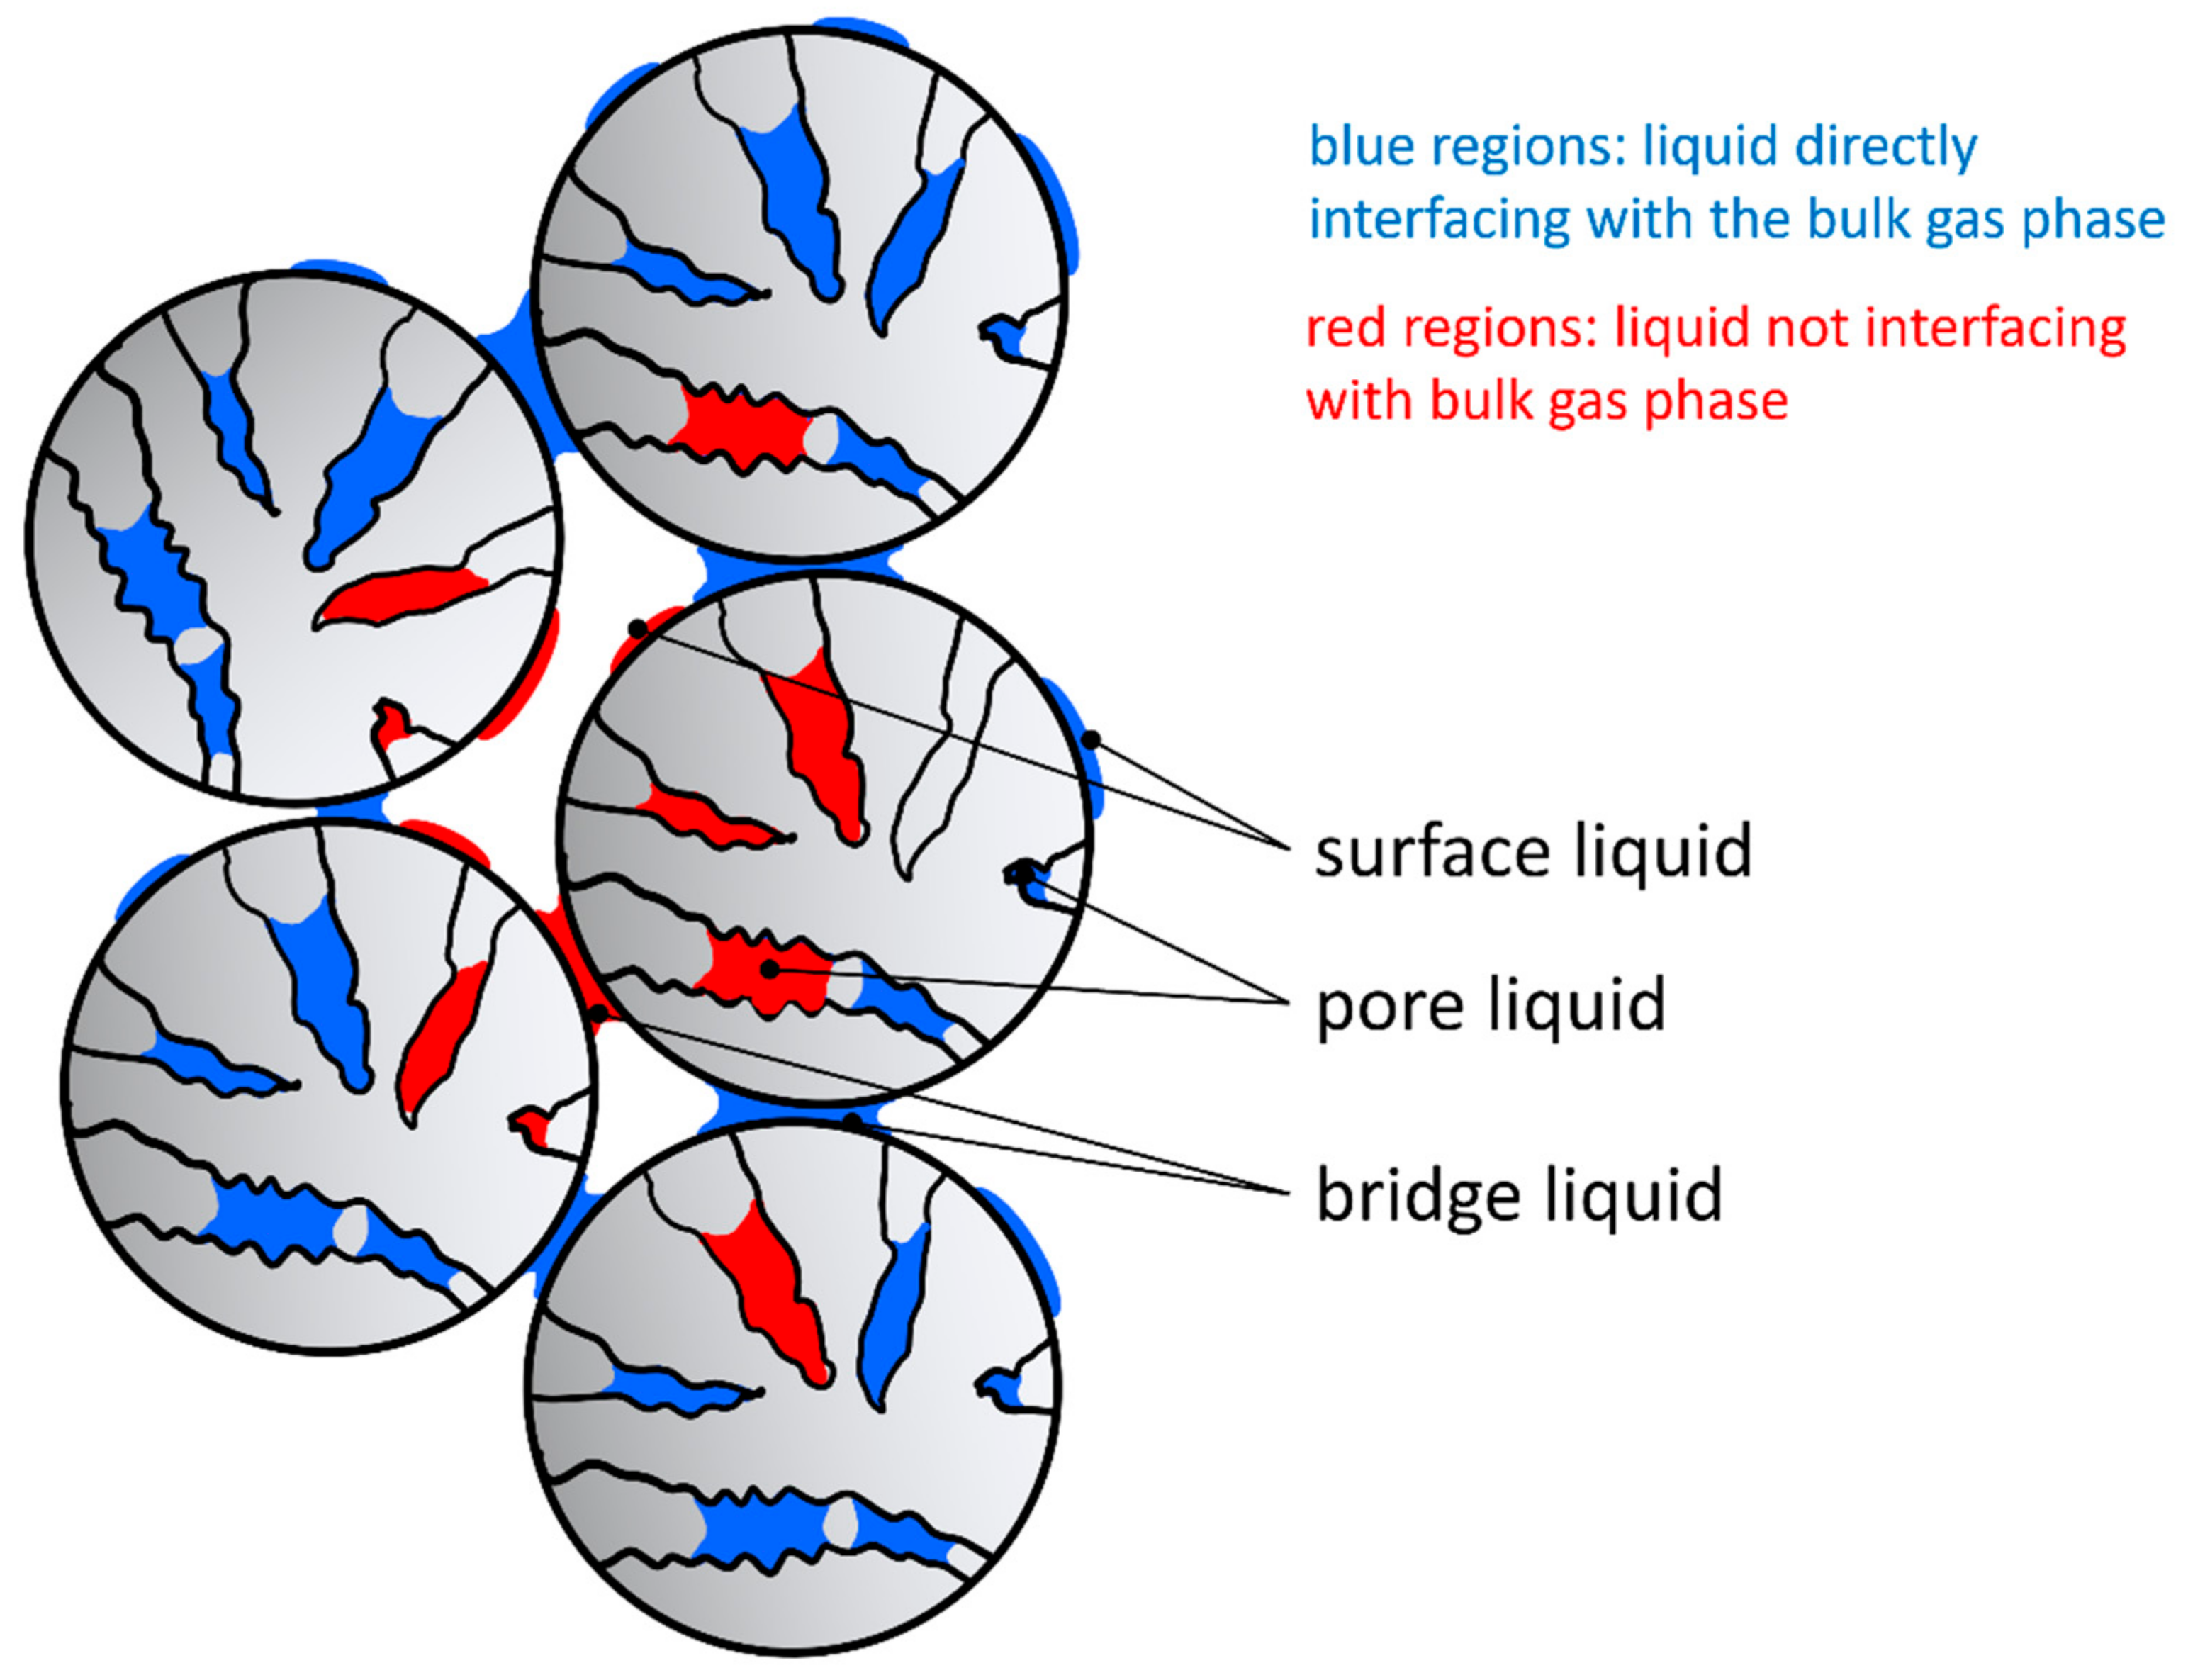
5.2. Surface Area Available for Drying

Predicting the surface area available for granule drying is another critical challenge in the simulation of fluid bed granulators. Some parts of the liquid will be locked due to the formation of liquid bridges and, consequently, are not available for surface drying. Depending on the binding liquid properties, the inter-particle liquid can immigrate to the outer surface of the granule when the liquid on this fraction of the surface is evaporated. In addition, due to particle growth, the outer surface area of the granule is also changing over time due to agglomeration.
Several approaches have been adopted in the literature for the estimation/calculation of drying surface area upon granulation, as detailed below.

5.2.1. Continuous Film-Based Models

A pragmatic approach assumes the formation of a continuous film on the outer surface area of the granules. To calculate the wet area, spherical granules are assumed. For instance, Muddu et al. [117] used the total external surface area of all the particles in the bed for heat exchange between gas and particles. Tu et al. [31] considered the external surface area of the particle for drying rate calculation. The same approach was used by Aziz et al. [57], Li et al. [64], and Peglow et al. [84].
However, calculating the outer surface area of the granule is faced with its own challenges. The main issue is related to the morphology of the granule. Upon particle agglomeration, the granule does not have a spherical shape anymore. To tackle this issue, these researchers computed the granular surface area based on the granules’ volumetric-equivalent diameter.
Sutkar et al. [120] assumed that when a droplet collides with a particle, the droplet forms a continuous film on the particle’s surface. They justified this by exposing particles to a high number of droplets in the spray zone. However, in case of particle agglomeration and drying during the circulation in the fluidized bed, the already deposited droplet can be dried or form liquid bridges between the particles. In the latter case, droplets are not available anymore at the surface of the particles to form a continuous film.

5.2.2. Correction Factor-Based Models

A couple of researchers [119,121] calculated the wetted surface area by considering a correction factor for the outer surface area. For instance, Chaudhury et al. [121] considered an experimental correction factor for the wetted surface area of particles to calculate the rate of particle drying. This correction factor needs to be adjusted by fitting to the experimental data. The same strategy was used by Amini et al. [119]. In detail, they developed a semi-theoretical droplet-based evaporation rate model. Their model requires two adjustable parameters (one for correction factor and one for transition from first-stage to second-stage of drying) for calculating the evaporation rate. These model parameters were adjusted by fitting the granule temperature and moisture in the studied FBG. For the drying surface area, they considered the total surface area of droplets instead of the total surface area of the granulating solid particles. Therefore, the moisture content of the solid bed was assumed to consist of mono-dispersed liquid droplets adhering to particles. Moreover, they considered a correction factor for the wetted surface area to avoid the complexity of droplet deposition and spreading on the particle.

5.2.3. Surface Coverage-Based Models

In another approach, drying was also limited to the outer surface area of the granule/particle. However, only a fraction of the surface area covered by droplets was considered as the surface area for drying. In detail, the surface coverage of liquid was calculated as a function of particle/granule size, droplet size, and the spray flow rate.
An early surface coverage-based model (intended for melt granulation) was developed by Goldschmidt [101]: for single particles, this mode considered that a liquid film forms with a fixed thickness. The surface coverage ratio (baptized “spread factor” by Goldschmidt) can then be calculated based on the total amount of liquid present on the particle surface (see Equation (7.5) in his thesis). During an agglomeration event, it was considered that surface coverage decreases: the projected area of the small particle (participating in the agglomeration event) was subtracted from the sum of the initial liquid areas (see his Equation (7.8)). Consequently, also the liquid layer thickness was proportionally decreased. We note in passing that Goldschmidt [101] modeled the more complex phenomenon of “encapsulation” of liquid binder in a porous agglomerate based on a pore volume estimate. All of his model assumptions were not directly supported by experimental results and focused on providing the basis for future modeling work.
More than a decade later, Kariuki et al. [53] proposed several equations for the surface coverage of particles with droplets. They introduced a new quantity called the “coating number” for this purpose. This coating number is defined as the ratio of the theoretical area coated by the droplets, without any overlap, and the particle’s total surface area. They proposed several equations for the droplet footprint size on the particle. In the simplest form of the equation, they used the projected area of a spherical droplet. In a more complex form, they assumed that the footprint area is equivalent to the area of a droplet on a perfectly flat surface considering the equilibrium contact angle between the drop and the particle surface. According to Kariuki et al. [53], this approach is reasonably accurate when the curvature of the granule/particle is negligible compared to the droplet, i.e., droplet size is much smaller than that of the particle. This approach does not account for the relative size of particles and droplets. Therefore, in an alternative and more accurate form, they derived an implicit equation for the droplet footprint area as a function of the surface interaction between the droplet and particle, droplet size, and the relative size of the droplet and particle.
Various researchers have successfully used the models proposed by Kariuki et al. [53]. For instance, considering the projected surface area as the droplet footprint, Askarishahi et al. [39,51] employed Kariuki’s approach [53] to compute the drying surface area in their CFD-DEM and TFM simulation of top-spray fluidized beds. Their results demonstrated that assuming a continuous film on the particle surface can significantly overpredict the rate of drying from the particles. The same approach was used by Kieckhefen et al. [60,122] in their CFD-DEM study of fluidized bed spray granulation.
Hussain et al. [87,88,96] considered the “accessible droplet area” for drying in their PBM simulations, which can also be seen as a variant of a surface coverage-based model. Specifically, they determined the accessible wet surface fraction as the ratio of droplet surface area to that of the particles, i.e., n d A d / n p A p . Thielmann et al. [123] used the same approach in their Monte Carlo simulation. Rajniak et al. [124] used this simple methodology for their CFD simulation.
In all these approaches, a distribution on the particle’s outer surface was assumed for the droplet. In addition, this methodology mainly concerns particle wetting and can be used for the external drying stage. This may limit the application of the model for the real granulation process.

5.2.4. Droplet Height-Based Models

In an alternative, the drying rate can be described based on the reduction in the droplet height on the particle surface versus time. The droplet height-based approach is typically employed in stochastic methods in which the deposition of individual droplets on the particle can be tracked. Readers interested in this method are referred to Section 4.3. However, due to the high computational cost, the application of such an approach is limited to a very small system with a low number of particles.

5.2.5. Balance Equation-Based Model

In a detailed balance equation-based approach, the mass and heat balance equations for the liquid film adhering to the particle surface are derived and solved. To do so, one may need to calculate the initial film thickness after a droplet–particle collision. In this regard, Li et al. [37] used different correlations to estimate the initial film thickness as a function of the Weber number and Reynolds number. In their model, Li et al. [37] assumed that drying does not shrink the film surface area but only reduces the thickness of the film. They also assumed that at a threshold value of 10 8   m at which the film surface area disappears.

5.2.6. Common Deficiencies of Previous Models

The common deficiency of all previous approaches described above is lumping the moisture content of a granule into a single entity. However, one must differentiate between at least three types of liquid on particles or granules: (i) surface liquid, (ii) pore bridging inside primary particles, and (iii) bridge liquid present between particles. Each of these three types can be either (a) directly interfacing with the bulk gas phase or (b) not interfacing with the gas phase in the sense that the porous structure of the granule limits contact with the bulk phase.
Consequently, and as shown in Figure 10, for mass transfer and drying calculations, the following groups of moisture/liquid should be considered:
i.
Freely accessible liquid, which includes accessible surface and bridge liquid: here, no significant mass transfer limitation is present, and the entire “wet” (i.e., liquid) surface area can be considered (for bridge liquid, this is difficult to estimate, but in principle doable).
ii.
Liquid with limited accessibility, which includes surface and bridge liquid that is not interfacing with the bulk gas phase, as well as accessible pore liquid. For this group, the evaporation rate will be limited but finite.
iii.
Liquid with no or very minor accessibility includes inaccessible pore liquid. For this group, evaporation rates can be considered too small to have any relevance for industrial processes.
Interestingly, and to the best of our knowledge, only Goldschmidt [102] made an effort to model the “encapsulation” of liquid binder in a porous agglomerate. However, his model assumptions were never supported by experiments or detailed simulations.

5.3. Mass Transfer Coefficient and Reference Concentration Difference Estimation

5.3.1. External Particle Surface-to-Bulk Transport

Next to the available surface area for evaporation, the drying rate is critically impacted by the product of the mass transfer coefficient (typically abbreviated with β ) and a vapor concentration difference Δ c experienced by each and every granule. To consider inter-particle transport diffusion occurring in porous particles and/or granules, a significant additional complication arises (see next chapter for details): intra-particle transport might limit the overall evaporation process, and an intra-particle vapor concentration gradient builds up. For the rest of this section, we assume that this scenario is not the case (this is always true for non-porous particles).
When considering the mass transfer coefficient, several key assumptions are typically adopted in the literature which deserve a more detailed view:
  • Equimolar diffusion in the gas next to the external surface of the particle is assumed. Thus, it is assumed that there is no net flux of gas that exits the particle, and hence there exists no net radial gas velocity directly at the liquid-gas interface (note that this is unrelated to the fact that flow around the particle is considered in many publications). The resulting model equation is linear in the concentration difference, which leads to an underestimation of the evaporation rate in case of high vapor mole fractions, i.e., high temperatures. A fix to this shortcoming would be to use the Spalding mass transfer number, or recently published corrections [125];
  • An isolated wet particle is often considered, as well documented in many publications, e.g., that of Li et al. [37]. This assumption dates back to the early work of Heinrich and Mörl [1], which was clearly motivated at that time by the lack of closures for dense suspensions. It should be noted that the work of Heinrich and Mörl [1] already considered the fraction of the wetted surface of a particle when estimating the area available for mass transfer. In the future, improved correlations for mass transfer coefficients should be used—e.g., as already carried out by Askarishahi et al. [113] by exploiting the correlation of Deen et al. for heat transfer [126] and an analogy between heat and mass transfer.
When it comes to the concentration difference Δ c , another set of assumptions is frequently adopted:
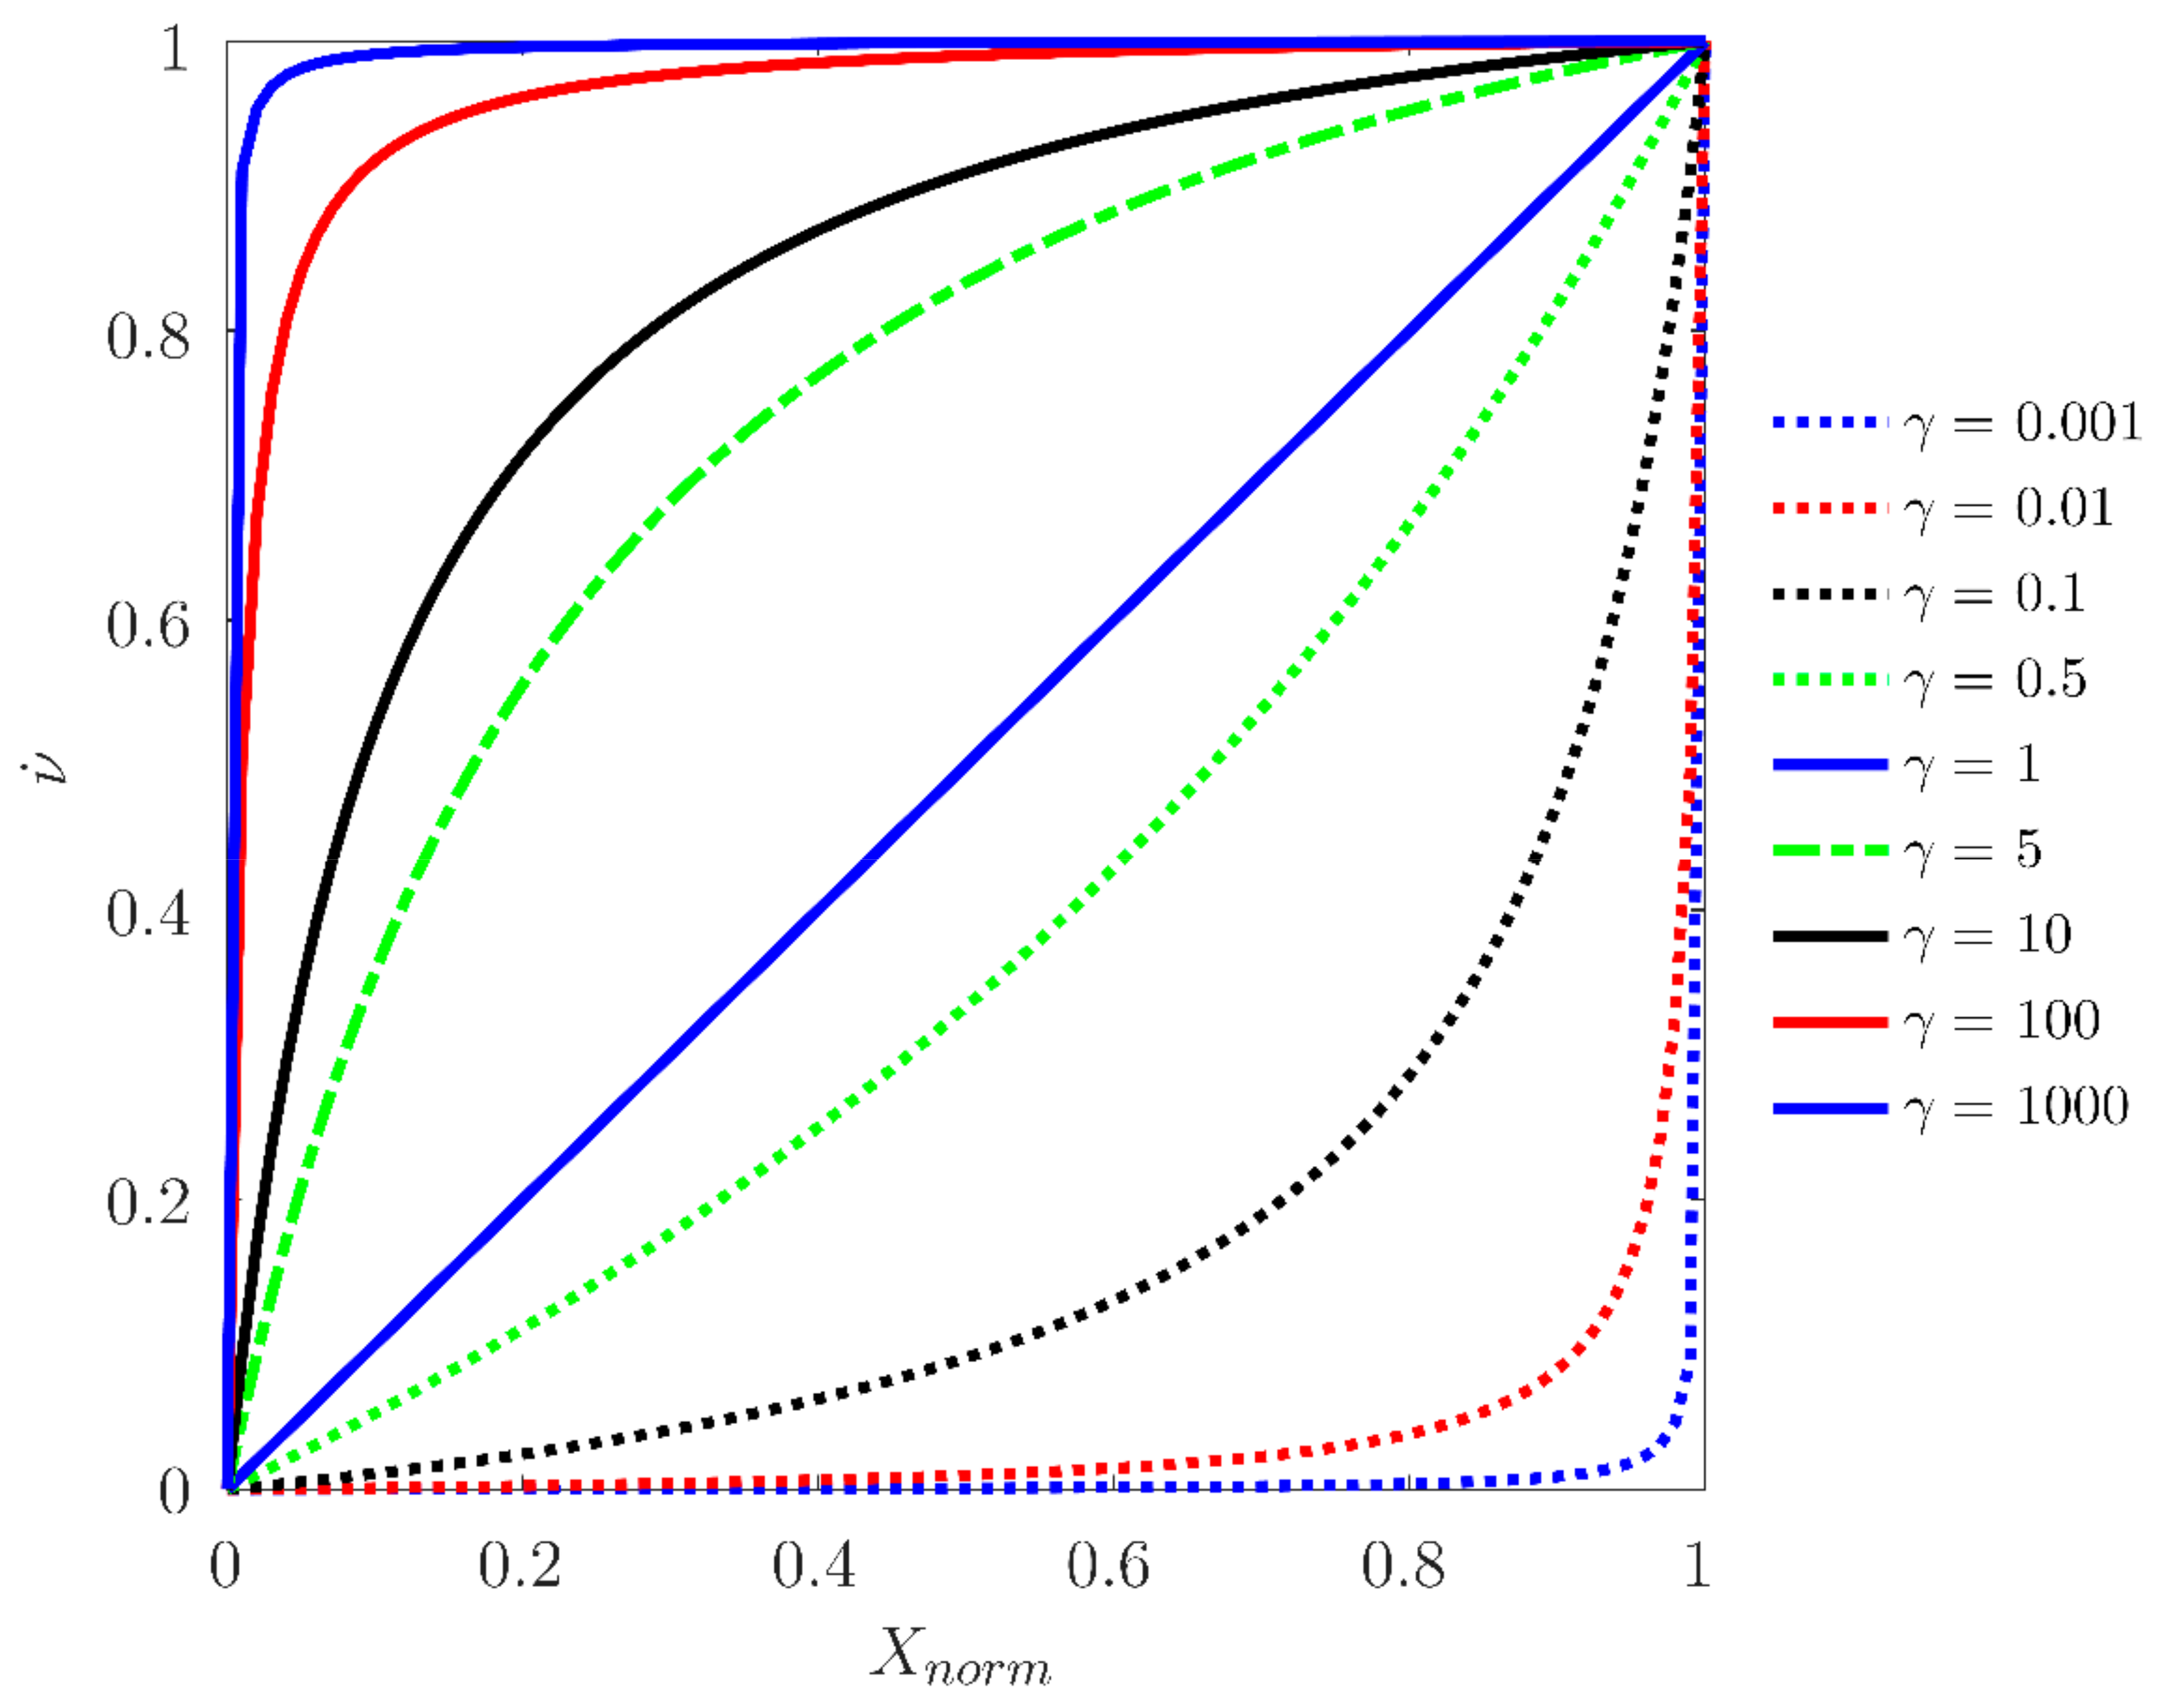
  • The entire previous works on drying used the local average concentration (i.e., an ensemble-averaged quantity as performed in RANS-type of simulations, or spatially averaged quantities as in the case of LES-type simulations). Thus, a resolution-dependency is expected since gas–particle systems spontaneously cluster [127,128], and this will affect the evaporation rate: as shown in our illustration (see Figure 11), even in case there is a difference between the region-average vapor concentration and the vapor equilibrium concentration at the external particle surface, the net evaporation rate might be zero! The size of these clusters is in the order of the particle diameter, with details depending on the particle Froude number [129]. Thus, it would be computationally very expensive to resolve the vapor concentration field in the gas phase since cluster size and the length scale of vapor concentration fluctuations will be of similar magnitude. Fortunately, an approach to overcome this challenge has been presented by Agrawal et al. [130]; however, in a different context: this early study revealed that a correction accounting for unresolved concentration fluctuations can be constructed and that this correction is similar to what is long known for the drag force. Most important, Agrawal et al. [128] showed that these unresolved structures lead to an extremely strong suppression of mass transfer—one or two orders of magnitude (!) lower mass transfer rates over a wide range of particle volume fractions were report. Physically, this means that the clustering phenomenon dominates the evaporation rate, i.e., mass transfer (drying) is so fast that the gas phase is locally saturated with vapor as long as a wet particle exists. In simple words, one can think of a “vapor concentration slip” that exists, i.e., a mismatch between the local average vapor concentration and the vapor concentration seen by individual particles. This message was reinforced by several recent studies, e.g., Guo and Capecelatro [131] or Rauchenzauner et al. [132,133].
  • It must be clear that in models that are not able to track each individual particle, imperfect mixing (within a region of interest) will cause a similar effect: if wet particles with high vapor pressure (caused by high temperature) are in regions that are saturated with vapor, and dry particles in low vapor content regions, the net evaporation rate might be zero (see Figure 12). In contrast, if one only considers particle–average vapor pressures and liquid content, the predicted evaporation rate would be non-zero! While this scenario is certainly rare (since particle-phase mixing is typically fast), it should be mentioned that such a correction could not be found in the open literature.
  • Another detail is the concentration that should be considered at the particle surface: most studies consider the vapor concentration in equilibrium with the liquid at the external particle surface. Aziz et al. [57] simulated the evaporation process based on the modification for the concentration difference as proposed by Putranto and Chen [59], i.e., the so-called “reaction engineering approach” (using an Arrhenius-type of function). This more advanced approach allows us to consider hygroscopic materials.

5.3.2. Intra-Particle Transport

Intra-Particle transport complicates the situation of calculating mass transfer rates enormously. Transport of gas (due to diffusion and pore gas flow; consideration of multicomponent diffusion might complicate the model additionally [134]), liquid phase (due to diffusion and convective flow caused by capillary pressure), as well as dissolved species in the liquid phase (diffusion, and in the case of charged species also electrostatically induced migration [135]). A detailed review that documents relevant forms of transport equations is that of Katekawa and Silva [136].

5.3.3. Analogy to Heat Transfer

The analogy between heat and mass transfer (i.e., expressions for the Nusselt and Sherwood number) has been exploited frequently in the drying literature. It should be noted that this analogy could also be extended to account for unresolved concentration fluctuations via the adoption of recent studies on heat transfer [132,133]. Thus, the concept of a “temperature slip” could be extended to a “concentration slip” concept, perhaps using even similar (dimensional) correction functions.

5.4. Drying Kinetics

In this chapter, we will briefly describe the methodologies used to obtain the drying curve required to compute the granule drying rate for granulation purposes. In these approaches, drying kinetic has been realized through either numerical or experimental approaches. In the experimental approaches, the drying rate of a granule can be measured either in a small-scale, single-granule (e.g., microbalance, levitation, drying channel), or it can be extracted from the data of the drying process (e.g., fluidized bed drying) as detailed in Section 5.4.1.
In the numerical approaches, the drying kinetic is obtained by simulating the drying phenomenon in a single granule. In the most detailed approach of pore-network modeling, the drying kinetic is obtained by simulating the evaporation of liquid inside the pore of the granule, as detailed in Section 5.4.3. In another approach, the Monte Carlo method is used to simulate sessile droplet drying on the particle, as detailed in Section 5.4.2.

5.4.1. Phenomenological Single-Particle Drying Models

In this approach, the drying kinetic for a single granule is measured using (i) a thermogravimetric method such as a magnetic micro-balance, (ii) a drying tunnel, or (iii) an acoustic levitator. To do so, the weight loss of the granule due to drying is captured over time, and the drying rate is calculated as a function of moisture content. These data are then used to formulate a mathematical model of the drying rate.
Burgschweiger et al. [85,93] extracted the drying kinetics of a single particle using microbalance and drying tunnel techniques. To quantify the drying rate, they introduced a normalized drying rate defined as the ratio of the drying rate in the falling-rate period to the drying rate at a constant-rate period given by
ν ˙ X n o r m = m ˙ d r y i n g X n o r m m ˙ d r y i n g X n o r m x c r
In which X n o r m is defined as
X n o r m = x x e q x c r x e q
In which x c r is the critical moisture content at which the transfer between the constant-rate and falling-rate period occurs. The quantity x e q is the equilibrium moisture content obtained from the sorption isotherm measurement at specific temperatures and humidity. The function of ν ˙ X n o r m is typically fitted to the experimental data, fulfilling two conditions of ν ˙ X n o r m = 1 = 1 , and ν ˙ X n o r m = 0 = 0 . The general form can take different forms, the most famous of which are
ν ˙ X n o r m = A X n o r m + B X n o r m 2 + C X n o r m 3 ;   A + B + C = 1
ν ˙ X n o r m = γ X n o r m 1 + γ 1 X n o r m
The second form is more advantageous as it has only one fitting parameter (i.e., γ ), which makes the parameter estimation more straightforward and more reliable due to less degree of freedom. As shown in Figure 13, the value of unity for γ leads to the linear form of ν ˙ X n o r m = X n o r m . The study of Askarishahi et al. [9,10,137] showed that the γ parameter could be easily correlated to the drying capacity (and hence the degree of wetness) of a fluid bed granulator.
.
Peglow et al. [84] used single-particle drying kinetic in their PBM approach. They assumed a linear decreasing normalized drying curve (i.e., ν ˙ = η ). Hennenberg et al. [138] used the same approach with a different form of function for normalized drying rate. Ghijs et al. [139] used an equilibrium factor of X X e q X for the falling-rate drying period.
Chen et al. [90,140] followed the approach of normalized drying rate from Burgschweiger et al. [85,93]. Their experimental results showed that the drying kinetics depends on the type of material and the size of the granule.
A disadvantage of this approach is that the measured drying kinetic is limited to the specific granule property under the condition of the experiment. However, due to the granule growth during the granulation process, the morphology of the granule may vary. Therefore, the measured drying kinetics may not be valid for the whole process. In addition, according to Sherwood [141,142], the critical moisture content depends on the drying rate at the constant rate period. Therefore, the measured drying kinetic cannot be used universally.
A group of researchers tried to estimate the drying curve from the experimental data obtained from the drying process in the fluidized bed instead of measuring/predefining single-particle drying kinetic. For instance, in addition to measuring the single-granule drying kinetic, Burgschweiger et al. [85,93] also obtained the drying kinetic from the drying rate measured in a fluidized bed drying run. The same approach was used by Askarishahi et al. [9,10,137] to estimate the critical moisture content and drying curve parameter for a set of experiments with different operating conditions. This approach has the advantage of a lower complexity when measuring the single-granule drying kinetic. However, an experiment is required for each operating condition to obtain the drying curve parameters.
Wang et al. [30] considered a correction factor of X n / X n + K for the falling-rate period (i.e., in which X smaller than critical moisture content) as a function of moisture content.
To simulate falling-rate drying, Amini et al. [119] also considered a correction factor in the rate of drying in the second stage. Instead of considering critical moisture, they used a transition time between two stages of drying. They adjusted the transition time and the correction factor by fitting the data to the experiments. Then, they correlated these two quantities to a linear function of operating conditions, which may not be physically meaningful. This means that their model is only valid under the operating condition of their experiment.
Chen et al. [143,144] assumed that the fluid bed dryer has the same drying kinetic as a single particle. They fitted the drying curves obtained from the batch drying experiments to the empirical model of Midilli et al. [145] in the form of
C A = a e k t n + b t
In which C A and t are moisture content and time, respectively, and a , b ,   k , and n are the model parameters to be fitted. However, the drying kinetic may depend on the drying rate in the constant-rate period. This means that the model parameters need to be fitted for each set of operating conditions. It should be noted that the focus of their study is on pure drying without granulation.
It is expected that granulation and the morphology of the formed granule can change the drying kinetics of a single particle/granule. This was discussed in the study of Askarishahi et al. [9], which was based on experimental and modeling work of FBGs. In their study, Askarishahi et al. [9] quantified the fluid bed granulator through a degree of wetness, defined as the ratio of enthalpy required for the spray evaporation and the enthalpy of the fluidizing hot gas as discussed in Section 2.1. The degree of wetness can be correlated to the reverse of the fluid bed drying capacity. This means that experiments with a higher spray rate, lower fluidization gas temperature, and flow rate feature a higher degree of wetness. Their experimental observation showed that the dryer batches with a lower degree of wetness result in the formation of elongated granules as fewer wet sites are available on the particle surface. In addition, according to Mortier et al. [43,47], the contribution of different physical phenomena, such as capillary effects, are lumped into phenomenological coefficients in this approach. This means that the detailed effects of the pore microstructure are not considered.

5.4.2. Sessile Droplet-Based Drying Models

This approach assumes that a droplet deposited on the particle surface forms a sessile droplet. This approach is typically used in Monte-Carlo approaches, which allows tracking the deposition of single droplets on the particles with a specific height and contact angle. The height of the droplet will change during drying time based on the calculated rate of drying. Janocha and Tsotsas [146] performed a detailed analysis of sessile droplet evaporation, also accounting for the effect of a second (nearby) droplet. For more information, see Section 4.3.
The disadvantage of sessile droplet-based drying models is the neglect of the particle-internal drying process, simply because drying is limited to the evaporation of droplets residing on the external surface of a granule. In this manner, drying the liquid bridging the particles is not modeled. However, studies similar to Janocha and Tsotsas [146] illustrate that more complex droplet configurations can be accounted for in future work.

5.4.3. Pore Network Models

An early study using pore-network modeling has been performed by Le Bray and Prat [147]. The work by Prat [148] can be considered as an early review of the field. The more recent review by Metzger [149] provides an excellent basis for understanding pore network models as they are presently used in the field.
In pore network models, the pore structure is represented by networks of pores with random individual sizes but the same geometric shape. The pore network modeling predicts capillary imbibition and drying in porous media. Various researchers (mainly from the group of Prof. Tsotsas) used the pore-network modeling approach to simulate drying in porous media. For instance, Rahimi et al. [150] used pore-network modeling to simulate the liquid droplet deposition on a network of pores and liquid drying, including surface evaporation and vapor diffusion inside the pores. They considered various phenomena in their simulation, including (i) diffusion in the gas phase, (ii) phase change at the liquid–gas interface, (iii) liquid viscous flow, and (iv) capillary forces at the menisci in the pores. However, according to Rahimi et al. [150], for the sake of simplicity, they made a set of simplifying assumptions for the contributing forces (i.e., gravity, buoyancy forces, inertia effects), which makes their model applicable to a limited range of material and process condition. Their simulation results can be used to approximate drying kinetic for a similar pore structure.
Wu and Zhao [151] used the pore-network approach to correlate the probability density function of liquid flow in the pore to the saturation level inside the pore and the location of the moving meniscus in the main liquid cluster. They described the transport of vapor in the void space of the pore Fick’s las [151].
Wang et al. [152] investigated the liquid distribution on the pore scale of wet particle aggregates. They used X-ray microtomography (XMT) to determine the inner structure of a porous aggregate. Then, they approximated the pore network using Voronoi approximation as interconnected cylindrical pores with radii computed from a distance between neighboring particles. Such an approach can accurately consider the structures of the pore and their connectivity. The comparison of their simulation with experimental data revealed that the pore-network model could accurately capture drying inside the pore if the geometry of the pore is described accurately in the model.
The recent pore network modeling of Kharaghani et al. [153] revealed that the capillary bridges formed between the particles have a crucial impact on drying; these capillary rings tend to remain connected over long distances from the outer surface of a packed bed, even for long times. Thus, these rings transfer moisture from the interior to the surface as “hydraulic pathways” and accelerate the drying rate. This can result in uniform liquid distribution down to the low saturation level. Therefore, the liquid on the surface of the primary particle cannot be evaporated at the same rate as the one on the outer surface of the granule.
It is true that pore-network modeling approaches can be used for developing a continuum model for particle-internal drying prediction. However, according to Mortier et al. [43,47], the bottleneck of pore network modeling is the strong assumption about the geometry of the pores by substituting the irregular network with a regular one to simplify the model. In addition, the width of the throats follows a particular distribution function in real-world particles, which is challenging to model.

5.5. Competition between Granule Drying and Suspended Droplet Evaporation

Another important challenge in the study of drying in FBGs is the competition between particle drying and droplet evaporation in generating the vapor. In most of the studies conducted in this field, the evaporation of gas-suspended droplets has been neglected. There are a few exceptions: one is the study of Li et al. [37] who assumed that droplets would be evaporated in case they do not deposit on a particle. To calculate the evaporation rate, they assumed that droplets follow the gas flow due to their small inertia; hence, the Nusselt-Number and Sherwood-Number are assumed to be 2.
In a CFD-DEM and a TFM study, Askarishahi et al. [39,51] assumed a constant droplet velocity in the spray zone and calculated the droplet evaporation rate based on the fluid-droplet relative velocity, the surface area of droplets, and the wet-bulb-based driving force. Kieckhefen et al. [60] used the same approach as Askarishahi et al. [39,51]. In compartmental modeling of FBGs, Askarishahi et al. [9,10,137] calculated the droplet evaporation rate based on the droplets’ residence time in the spray zone. The latter was defined based on the penetration length of droplets into the particle bed.
In most studies on drying in FBGs, the role of suspended droplet evaporation is neglected. However, the vapor generated by suspended droplet evaporation can reduce the driving force for particle drying. Consequently, predictions of the particle liquid content can be unreliable. This will be more severe in case of over-spraying, i.e., situations characterized by high degrees of wetness.

5.6. Effect of Drying on the Agglomerate Size Distribution and Strength

Drying can influence the size distribution of agglomerate in the FBG in various ways, as follows:
i.
Drying can change the liquid binder strength due to the dependency of viscosity and binder concentration on temperature. As discussed in Section 2.1, this can be quantified through the Stokes number;
ii.
Drying affects the number and distribution of wet spots on the granule and, consequently, the probability of successful agglomeration; this can influence the granule morphology, as discussed in Section 2.1;
iii.
Drying can influence the consolidation rate through the evaporation of volatile components of the biner solution.
A very limited number of studies exists in the literature considering the effect of drying on the agglomerate size distribution. Recently, Singh and Tsotsas [8] simulated agglomeration and breakage in the presence of drying using a stochastic approach. They selected one random droplet, which was not completely dried, and assumed that all bridges in the agglomerate were uniform and featured the same properties as the selected droplet. This means that the same drying rate is considered in the model for all the droplets, either (i) bridging the primary particle or (ii) residing on the outer surface of the granule. However, their access to the fluid bulk is different. In other words, the drying mechanism can differ for these two types of liquid, as discussed in Section 2.2. Therefore, the available surface area for drying must change with the progress of agglomeration. Neglecting such a difference in drying mechanisms is one of the main drawbacks of studies conducted in this field.
Singh and Tsotsas [8] also calculated the strength of the granule considering the liquid bridge force and morphological descriptors. In their study, breakage can happen when the Stokes deformation number exceeds the critical Stokes deformation number. They evaluated the effect of fluid temperature and droplet drying on the granule strength. In their study, higher binder concentration and higher fluidization gas temperature resulted in higher strength of the formed granule.
Many researchers have assumed the critical Stokes deformation number equal to the critical Stokes coalescence number [19,50,154]. However, in the case of FB agglomeration, the critical Stokes deformation number is expected to be far from the critical Stokes coalescence number because of the rapid solidification rates of the binder, which leads to stronger bonding [20]. For the sake of simplicity, the critical Stokes deformation number is assumed to be equal to twice the critical Stokes coalescence number [155] as
S t d e f * = 2 S t c o a l * = 2 1 + 1 e ln h h a
This equation shows that the deformation Stokes number depends on particle restitution coefficient, e , surface asperities of primary particles, h a , and the height of the droplet on the particle surface, h . Drying can change the h and the viscosity of the binder solution (and stokes number) and, consequently, the cohesive force among the primary particles. Hence, it is important to consider the height of the liquid at the site of the collision. This makes the analysis of the drying effect on the rate of agglomeration and granule strength more complicated and computationally demanding.

6. Identified Gaps and Way Forward

In this section, we will summarize the gaps which we identified in our present review study. Specifically, the following ideas should be followed in future to close them:
  • Performing experiments that isolate evaporation and granulation phenomena as much as possible but use granules that are typical for a real-world granulation process. Such experiments would then have a very high value for the validation of individual simulation models. These experiments could use 3D-printed reference granules that are then wetted in a defined way, similar to what has been performed by Ge et al. [156] for the mechanical strength of granules.
  • Modeling of the final strength of particle–particle bonds after evaporation of liquid bridges as a follow-up to the early work of Kafui and Thornton [49].
  • Modeling of the effect of drying on the binder solution properties and its contribution to the strength of granule, as a follow-up to the recent work of Singh and Tsotsas [8]. The effect of drying will be even more complicated if the binder forms a crust in the droplet deposited on the particle surface, as reported by Dernedde et al. [74].
  • A differentiated description of the amount of liquid on the surface and inside a granule: this is necessary to correctly model the amount of liquid that is freely accessible (or not) for drying. Indeed, such a modeling work will rely to a large degree on experimental data, and hence dedicated experiments closely linked to computer models should be followed.
  • The tendency to form liquid bridges is massively affected by the roughness of the particles or granules [157]. Accounting for roughness effects when estimating the surface area available for evaporation would be a leap forward, same as a model to predict the effect of solid depositions on the roughness evolution. In addition, such a model refinement could improve the fidelity of cohesion models.
  • Performing a rigorous simulation study that uses “best in class” models (i.e., Lagrangian droplet tracking, drying of droplets and particles considering surface covering, sophisticated drying kinetics model, corrections to the mass transfer rate due to clustering) to support or reject key assumptions made in the field. Based on such a reference study, regime maps could potentially be developed.
Based on the identified gaps, one can conclude that the simplifications typically made in the simulation of drying cannot predict the behavior of agglomerate formation and breakage accurately. This highlights the importance of conducting validation studies as a reference to examine the accuracy of to-be-developed models. However, isolating the individual effects in the drying of granulators is very difficult since the phenomena taking part in this process are highly coupled and strongly interconnected. Below, we summarize a number of studies that can be used for the validation purpose of drying in granulation processes:
  • Heinrich et al. [158,159] conducted a set of numerical and experimental studies on drying of particles in a top-spray fluidized bed with different spray rates. However, they did not consider the agglomeration effect.
  • Diez et al. [11] conducted a detailed experimental study on the effect of drying on the granule properties, including the morphological structure, particle moisture content, porosity, density, compression strength, and wetting behavior in a horizontal fluidized bed.
  • Askarishahi et al. [9,10] conducted a numerical and experimental study on the agglomeration and drying of a placebo formulation in a fluid bed granulator. They provided a set of experimental data for a wide range of operating conditions (spray rate, binder concentration, and fluidization gas temperature). Their data can be used for validation of FBG performance in macro-scales. Muddu et al. [117] and Tamrakar and Ramachandran [46] conducted a similar study.
  • Närvänen et al. [160] conducted an experimental study on the particle size distribution in an FBG for spraying and drying phases.
  • Rajniak et al. [124,161] conducted an experimental study on the effect of binder properties on the growth kinetics of agglomerates and their morphology in a top-spray fluidized bed
  • Schmidt et al. [162] presented a set of experimental data on the effect of drying conditions on the particle size distribution for layering granulation.
  • Bouffard et al. [163] reported a set of experimental data on the impact of binder solution atomization on the granule growth kinetics.
  • Dadkhah et al. [164] presented a set of experimental data on the dependency of granule morphology on the process variables.
All these studies might be used to synthesize more advanced experiments to isolate individual effects. This would greatly accelerate the path forward for rigorous mechanistic modeling that is truly predictive.

Author Contributions

Conceptualization, M.A., M.-S.S. and S.R.; methodology, M.A., M.-S.S. and S.R.; software, M.A., M.-S.S. and S.R.; validation, M.A. and M.-S.S.; formal analysis, M.A., M.-S.S. and S.R.; investigation, M.A., M.-S.S. and S.R.; resources, M.A., M.-S.S. and S.R.; writing—original draft preparation, M.A., M.-S.S. and S.R.; writing—review and editing, M.A., M.-S.S. and S.R.; visualization, M.A., M.-S.S. and S.R.; supervision, M.A.; project administration, M.A.; funding acquisition, M.A. All authors have read and agreed to the published version of the manuscript.

Funding

The Research Center Pharmaceutical Engineering is funded by the Austrian COMET program under the auspices of the Austrian Federal Ministry of Transport, Innovation, and Technology (bmvit), the Austrian Federal Ministry of Economy, Family and Youth (bmwf) and by the State of Styria (Styrian Funding Agency SFG). COMET is managed by the Austrian Research Promotion Agency FFG.

Data Availability Statement

The data is unavailable due to privacy restrictions.

Acknowledgments

M.A. acknowledges the funding from the Austrian Science Fund (FWF) through project T-1257.

Conflicts of Interest

The authors declare no conflict of interest.

Abbreviations

CFDComputational Fluid Dynamics
CNMCConstant-Number Monte Carlo
CVMCConstant-Volume Monte Carlo
DEMDiscrete Element Method
DoWDegree of Wetness
FBCFluid Bed Coater
FBDFluid Bed Dryer
FBGFluid Bed Granulator
MCMonte Carlo
MFMMulti-Fluid Model
LoDLoss on Drying
PBEPopulation Balance Equation
PBMPopulation Balance Method
TFMTwo-Fluid Model
2DTwo-dimensional
3DThree-dimensional

References

  1. Mörl, L.; Heinrich, S.; Peglow, M. Fluidized Bed Spray Granulation. In Handbook of Powder Technology; Elsevier Science BV: Amsterdam, The Netherlands, 2011; Volume 11, pp. 21–188. [Google Scholar]
  2. Seem, T.C.; Rowson, N.A.; Ingram, A.; Huang, Z.; Yu, S.; de Matas, M.; Gabbott, I.; Reynolds, G.K. Twin screw granulation—A literature review. Powder Technol. 2015, 276, 89–102. [Google Scholar] [CrossRef]
  3. Ennis, B.J.; Tardos, G.; Pfeffer, R. A microlevel-based characterization of granulation phenomena. Powder Technol. 1991, 65, 257–272. [Google Scholar] [CrossRef]
  4. Werner, S.R.; Jones, J.R.; Paterson, A.H.; Archer, R.H.; Pearce, D.L. Air-suspension particle coating in the food industry: Part I—State of the art. Powder Technol. 2007, 171, 25–33. [Google Scholar] [CrossRef]
  5. Werner, S.R.; Jones, J.R.; Paterson, A.H.; Archer, R.H.; Pearce, D.L. Air-suspension coating in the food industry: Part II—Micro-level process approach. Powder Technol. 2007, 171, 34–45. [Google Scholar] [CrossRef]
  6. Iveson, S.M.; Litster, J.D.; Hapgood, K.; Ennis, B.J. Nucleation, Growth and Breakage Phenomena in Agitated Wet Granulation Processes: A Review. Powder Technol. 2001, 117, 3–39. [Google Scholar] [CrossRef]
  7. Tsotsas, E. Influence of Drying Kinetics on Particle Formation: A Personal Perspective. Dry. Technol. 2012, 30, 1167–1175. [Google Scholar] [CrossRef]
  8. Singh, A.K.; Tsotsas, E. Influence of polydispersity and breakage on stochastic simulations of spray fluidized bed agglomeration. Chem. Eng. Sci. 2021, 247, 117022. [Google Scholar] [CrossRef]
  9. Askarishahi, M.; Salehi, M.-S.; Maus, M.; Schröder, D.; Slade, D.; Jajcevic, D. Mechanistic modelling of fluid bed granulation, Part II: Eased process development via degree of wetness. Int. J. Pharm. 2019, 572, 118836. [Google Scholar] [CrossRef]
  10. Askarishahi, M.; Maus, M.; Schröder, D.; Slade, D.; Martinetz, M.; Jajcevic, D. Mechanistic modelling of fluid bed granulation, Part I: Agglomeration in pilot scale process. Int. J. Pharm. 2020, 573, 118837. [Google Scholar] [CrossRef]
  11. Diez, E.; Meyer, K.; Bück, A.; Tsotsas, E.; Heinrich, S. Influence of process conditions on the product properties in a continuous fluidized bed spray granulation process. Chem. Eng. Res. Des. 2018, 139, 104–115. [Google Scholar] [CrossRef]
  12. McCabe, W.L.; Smith, J.C.; Harriott, P. Unit Operations of Chemical Engineering; McGraw-Hill: New York, NY, USA, 1993; Volume 1130. [Google Scholar]
  13. Ceaglske, N.H.; Hougen, O.A.; Loughborough, K.W. Drying Granular Solids. Ind. Eng. Chem. 1937, 29, 805–813. [Google Scholar] [CrossRef]
  14. Parikh, D.M. Handbook of Pharmaceutical Granulation Technology, 2nd ed.; CRC Press: New York, NY, USA, 2005. [Google Scholar]
  15. Weber, S.; Briens, C.; Berruti, F.; Chan, E.; Gray, M. Stability of agglomerates made from fluid coke at ambient temperature. Powder Technol. 2011, 209, 53–64. [Google Scholar] [CrossRef]
  16. Weber, S.; Briens, C.; Berruti, F.; Chan, E.; Gray, M. Agglomerate stability in fluidized beds of glass beads and silica sand. Powder Technol. 2006, 165, 115–127. [Google Scholar] [CrossRef]
  17. Weber, S.; Briens, C.; Berruti, F.; Chan, E.; Gray, M. Effect of agglomerate properties on agglomerate stability in fluidized beds. Chem. Eng. Sci. 2008, 63, 4245–4256. [Google Scholar] [CrossRef]
  18. Metzger, T.; Kwapinska, M.; Peglow, M.; Saage, G.; Tsotsas, E. Modern Modelling Methods in Drying. Transp. Porous Media 2006, 66, 103–120. [Google Scholar] [CrossRef]
  19. Terrazas-Velarde, K.; Peglow, M.; Tsotsas, E. Investigation of the kinetics of fluidized bed spray agglomeration based on stochastic methods. AIChE J. 2010, 57, 3012–3026. [Google Scholar] [CrossRef]
  20. Terrazas-Velarde, K.; Peglow, M.; Tsotsas, E. Stochastic simulation of agglomerate formation in fluidized bed spray drying: A micro-scale approach. Chem. Eng. Sci. 2009, 64, 2631–2643. [Google Scholar] [CrossRef]
  21. Terrazas-Velarde, K.; Peglow, M.; Tsotsas, E. Kinetics of fluidized bed spray agglomeration for compact and porous particles. Chem. Eng. Sci. 2011, 66, 1866–1878. [Google Scholar] [CrossRef]
  22. Suresh, P.; Sreedhar, I.; Vaidhiswaran, R.; Venugopal, A. A comprehensive review on process and engineering aspects of pharmaceutical wet granulation. Chem. Eng. J. 2017, 328, 785–815. [Google Scholar] [CrossRef]
  23. Alobaid, F.; Almohammed, N.; Farid, M.M.; May, J.; Rößger, P.; Richter, A.; Epple, B. Progress in CFD Simulations of Fluidized Beds for Chemical and Energy Process Engineering. Prog. Energy Combust. Sci. 2022, 91, 100930. [Google Scholar] [CrossRef]
  24. Lun, C.K.K.; Savage, S.B. The effects of an impact velocity dependent coefficient of restitution on stresses developed by sheared granular materials. Acta Mech. 1986, 63, 15–44. [Google Scholar] [CrossRef]
  25. Gidaspow, D.; Huilin, L. Equation of state and radial distribution functions of FCC particles in a CFB. AIChE J. 1998, 44, 279–293. [Google Scholar] [CrossRef]
  26. Benyahia, S.; Syamlal, M.; O’Brien, T.J. Extension of Hill–Koch–Ladd drag correlation over all ranges of Reynolds number and solids volume fraction. Powder Technol. 2006, 162, 166–174. [Google Scholar] [CrossRef]
  27. Koch, D.L. Kinetic theory for a monodisperse gas–solid suspension. Phys. Fluids A Fluid Dyn. 1990, 2, 1711–1723. [Google Scholar] [CrossRef]
  28. Beetstra, R.; van der Hoef, M.A.; Kuipers, J.A.M. Drag force of intermediate Reynolds number flow past mono- and bidisperse arrays of spheres. AIChE J. 2007, 53, 489–501. [Google Scholar] [CrossRef]
  29. Gu, Y.; Ozel, A.; Kolehmainen, J.; Sundaresan, S. Computationally generated constitutive models for particle phase rheology in gas-fluidized suspensions. J. Fluid Mech. 2018, 860, 318–349. [Google Scholar] [CrossRef]
  30. Wang, H.G.; Yang, W.Q.; Senior, P.; Raghavan, R.S.; Duncan, S.R. Investigation of Batch Fluidized-Bed Drying by Mathematical Modeling, CFD Simulation and ECT Measurement. AIChE J. 2008, 54, 427–444. [Google Scholar] [CrossRef]
  31. Tu, Q.; Ma, Z.; Wang, H. Investigation of wet particle drying process in a fluidized bed dryer by CFD simulation and experimental measurement. Chem. Eng. J. 2023, 452, 139200. [Google Scholar] [CrossRef]
  32. Liu, H.; Li, M. Two-compartmental population balance modeling of a pulsed spray fluidized bed granulation based on computational fluid dynamics (CFD) analysis. Int. J. Pharm. 2014, 475, 256–269. [Google Scholar] [CrossRef]
  33. Börner, M.; Tsotsas, E. Spray Zone Demarcation in Top-Spray Fluidised Bed Granulation by Droplet Detection Methods. In Proceedings of the 6th International Granulation Workshop, Sheffield, UK, 24–25 June 2013; pp. 1–12. [Google Scholar]
  34. Börner, M.; Hagemeier, T.; Ganzer, G.; Peglow, M.; Tsotsas, E. Experimental spray zone characterization in top-spray fluidized bed granulation. Chem. Eng. Sci. 2014, 116, 317–330. [Google Scholar] [CrossRef]
  35. Hounslow, M.J.; Ryall, R.L.; Marshall, V.R. A discretized population balance for nucleation, growth, and aggregation. AIChE J. 1988, 34, 1821–1832. [Google Scholar] [CrossRef]
  36. Hounslow, M.; Pearson, J.M.K.; Instone, T. Tracer studies of high-shear granulation: II. Population balance modeling. AIChE J. 2001, 47, 1984–1999. [Google Scholar] [CrossRef]
  37. Li, Z.; Kessel, J.; Grünewald, G.; Kind, M. CFD Simulation on Drying and Dust Integration in Fluidized Bed Spray Granulation. Dry. Technol. 2012, 30, 1088–1098. [Google Scholar] [CrossRef]
  38. Löffler, F. Staubabscheiden; Thieme Verlag: Stuttgart, Germany, 1989. [Google Scholar]
  39. Askarishahi, M.; Salehi, M.-S.; Radl, S. Two-Fluid-Model-Based Full Physics Simulations of Mixing in Noncohesive Wet Fluidized Beds. Ind. Eng. Chem. Res. 2019, 58, 12323–12346. [Google Scholar] [CrossRef]
  40. Askarishahi, M. Towards Full-Physics Simulation of Wet Fluidized Beds. Ph.D. Thesis, TU Graz, Graz, Austria, 2018. [Google Scholar]
  41. Radl, S.; Salehi, M.; Askarishahi, M. Benchmarking a Novel 0-D Model Against Data from Two-Fluid Model Simulations of a Wet Fluidized Bed. In Proceedings of the AIChE Annual Meeting 2018, Pittsburgh, PA, USA, 28 October–2 November 2018. [Google Scholar]
  42. Mortier, S.T.F.; De Beer, T.; Gernaey, K.V.; Remon, J.P.; Vervaet, C.; Nopens, I. Mechanistic modelling of fluidized bed drying processes of wet porous granules: A review. Eur. J. Pharm. Biopharm. 2011, 79, 205–225. [Google Scholar] [CrossRef]
  43. Li, Z.; Kessel, J.; Grünewald, G.; Kind, M. Coupled CFD-PBE Simulation of Nucleation in Fluidized Bed Spray Granulation. Dry. Technol. 2013, 31, 1888–1896. [Google Scholar] [CrossRef]
  44. Askarishahi, M.; Salehi, M.-S.; Radl, S. Capability of the TFM Approach to Predict Fluidization of Cohesive Powders. Ind. Eng. Chem. Res. 2022, 61, 3186–3205. [Google Scholar] [CrossRef]
  45. Bin Yeom, S.; Ha, E.-S.; Kim, M.-S.; Jeong, S.H.; Hwang, S.-J.; Choi, D.H. Application of the Discrete Element Method for Manufacturing Process Simulation in the Pharmaceutical Industry. Pharmaceutics 2019, 11, 414. [Google Scholar] [CrossRef]
  46. Tamrakar, A.; Ramachandran, R. CFD–DEM–PBM coupled model development and validation of a 3D top-spray fluidized bed wet granulation process. Comput. Chem. Eng. 2019, 125, 249–270. [Google Scholar] [CrossRef]
  47. Farivar, F.; Zhang, H.; Tian, Z.F.; Gupte, A. CFD-DEM -DDM Model for Spray Coating Process in a Wurster Coater. J. Pharm. Sci. 2020, 109, 3678–3689. [Google Scholar] [CrossRef]
  48. Fries, L.; Antonyuk, S.; Heinrich, S.; Palzer, S. DEM–CFD modeling of a fluidized bed spray granulator. Chem. Eng. Sci. 2011, 66, 2340–2355. [Google Scholar] [CrossRef]
  49. Kafui, D.; Thornton, C. Fully-3D DEM simulation of fluidised bed spray granulation using an exploratory surface energy-based spray zone concept. Powder Technol. 2008, 184, 177–188. [Google Scholar] [CrossRef]
  50. Tardos, G.I.; Gupta, R. Forces generated in solidifying liquid bridges between two small particles. Powder Technol. 1996, 87, 175–180. [Google Scholar] [CrossRef]
  51. Askarishahi, M.; Radl, S.; Salehi, M.-S. Full-physics simulations of spray-particle interaction in a bubbling fluidized bed. AIChE J. 2017, 63, 2569–2587. [Google Scholar] [CrossRef]
  52. Kolakaluri, R.; Subramaniam, S.; Fox, R.O.; Brown, R.C.; Meyer, T.; Passalacqua, A. Direct Numerical Simulations and Analytical Modeling of Granular Filtration. Ph.D. Thesis, Iowa State University, Ames, IA, USA, 2013. [Google Scholar]
  53. Kariuki, W.I.; Freireich, B.; Smith, R.M.; Rhodes, M.; Hapgood, K.P. Distribution nucleation: Quantifying liquid distribution on the particle surface using the dimensionless particle coating number. Chem. Eng. Sci. 2013, 92, 134–145. [Google Scholar] [CrossRef]
  54. Salehi, M.-S.; Askarishahi, M.; Radl, S. Analytical solution for thermal transport in packed beds with volumetric heat source. Chem. Eng. J. 2017, 316, 131–136. [Google Scholar] [CrossRef]
  55. Askarishahi, M.; Salehi, M.; Radl, S. Voidage Correction Algorithms for Improved Heat and Mass Transfer Predictions in Unresolved Particle Simulations. In Proceedings of the 2017 AIChE annual Meeting, Minneapolis, MN, USA, 29 October–3 November 2017. [Google Scholar]
  56. Askarishahi, M.; Salehi, M.-S.; Radl, S. Voidage correction algorithm for unresolved Euler–Lagrange simulations. Comput. Part. Mech. 2018, 5, 607–625. [Google Scholar] [CrossRef]
  57. Aziz, H.; Ahsan, S.N.; De Simone, G.; Gao, Y.; Chaudhuri, B. Computational Modeling of Drying of Pharmaceutical Wet Granules in a Fluidized Bed Dryer Using Coupled CFD-DEM Approach. AAPS PharmSciTech 2022, 23, 59. [Google Scholar] [CrossRef]
  58. Briens, L.; Bojarra, M. Monitoring Fluidized Bed Drying of Pharmaceutical Granules. AAPS PharmSciTech 2010, 11, 1612–1618. [Google Scholar] [CrossRef]
  59. Putranto, A.; Chen, X.D. The Relative Activation Energy of Food Materials: Important Parameters to Describe Drying Kinetics. Int. J. Food Prop. 2016, 19, 1726–1737. [Google Scholar] [CrossRef]
  60. Kieckhefen, P.; Pietsch-Braune, S.; Heinrich, S. Product-Property Guided Scale-Up of a Fluidized Bed Spray Granulation Process Using the CFD-DEM Method. Processes 2022, 10, 1291. [Google Scholar] [CrossRef]
  61. Fries, L.; Dosta, M.; Antonyuk, S.; Heinrich, S.; Palzer, S. Moisture Distribution in Fluidized Beds with Liquid Injection. Chem. Eng. Technol. 2011, 34, 1076–1084. [Google Scholar] [CrossRef]
  62. Jiang, Z.; Bück, A.; Tsotsas, E. CFD–DEM study of residence time, droplet deposition, and collision velocity for a binary particle mixture in a Wurster fluidized bed coater. Dry. Technol. 2018, 36, 638–650. [Google Scholar] [CrossRef]
  63. Che, H.; Wang, H.; Xu, L.; Ge, R. Investigation of gas-solid heat and mass transfer in a Wurster coater using a scaled CFD-DEM model. Powder Technol. 2022, 406, 117598. [Google Scholar] [CrossRef]
  64. Li, H.; Liu, D.; Ma, J.; Chen, X. Simulation of a Wurster fluidized bed by CFD–DEM with a cohesive contact model. Chem. Eng. Res. Des. 2021, 177, 157–166. [Google Scholar] [CrossRef]
  65. Mikami, T.; Kamiya, H.; Horio, M. Numerical Simulation of Cohesive Powder Behavior in a Fluidized Bed. Chem. Eng. Sci. 1998, 53, 1927–1940. [Google Scholar] [CrossRef]
  66. Li, H.; Liu, D.; Ma, J.; Chen, X. Influence of cycle time distribution on coating uniformity of particles in a spray fluidized bed by using CFD-DEM simulations. Particuology 2023, 76, 151–164. [Google Scholar] [CrossRef]
  67. Madlmeir, S.; Radl, S. A coarse-grained parcel method for heat and mass transfer simulations of spray coating processes. Adv. Powder Technol. 2022, 33, 103590. [Google Scholar] [CrossRef]
  68. Madlmeir, S.; Forgber, T.; Trogrlic, M.; Jajcevic, D.; Kape, A.; Contreras, L.; Carmody, A.; Liu, P.; Davies, C.; Sarkar, A.; et al. Quantifying the coating yield by modeling heat and mass transfer in a Wurster fluidized bed coater. Chem. Eng. Sci. 2022, 252, 117505. [Google Scholar] [CrossRef]
  69. Singh, A.K.; Tsotsas, E. Stochastic model to simulate spray fluidized bed agglomeration: A morphological approach. Powder Technol. 2019, 355, 449–460. [Google Scholar] [CrossRef]
  70. Rieck, C.; Hoffmann, T.; Bück, A.; Peglow, M.; Tsotsas, E. Influence of drying conditions on layer porosity in fluidized bed spray granulation. Powder Technol. 2014, 272, 120–131. [Google Scholar] [CrossRef]
  71. Rieck, C.; Bück, A.; Tsotsas, E. Estimation of the dominant size enlargement mechanism in spray fluidized bed processes. AIChE J. 2020, 66, e16920. [Google Scholar] [CrossRef]
  72. Singh, A.K.; Tsotsas, E. A Fast and Improved Tunable Aggregation Model for Stochastic Simulation of Spray Fluidized Bed Agglomeration. Energies 2021, 14, 7221. [Google Scholar] [CrossRef]
  73. Singh, A.K.; Tsotsas, E. A tunable aggregation model incorporated in Monte Carlo simulations of spray fluidized bed agglomeration. Powder Technol. 2020, 364, 417–428. [Google Scholar] [CrossRef]
  74. Dernedde, M.; Peglow, M.; Tsotsas, E. Stochastic Modeling of Fluidized Bed Agglomeration: Determination of Particle Moisture Content. Dry. Technol. 2013, 31, 1764–1771. [Google Scholar] [CrossRef]
  75. Das, A.; Kumar, J. Population balance modeling of volume and time dependent spray fluidized bed aggregation kernel using Monte Carlo simulation results. Appl. Math. Model. 2020, 92, 748–769. [Google Scholar] [CrossRef]
  76. Du, J.; Strenzke, G.; Bück, A.; Tsotsas, E. Monte Carlo modeling of spray agglomeration in a cylindrical fluidized bed: From batch-wise to continuous processes. Powder Technol. 2021, 396, 113–126. [Google Scholar] [CrossRef]
  77. Jiang, Z.; Rieck, C.; Bück, A.; Tsotsas, E. Modeling of inter- and intra-particle coating uniformity in a Wurster fluidized bed by a coupled CFD-DEM-Monte Carlo approach. Chem. Eng. Sci. 2019, 211, 115289. [Google Scholar] [CrossRef]
  78. Marshall, C.L. Multi-Component Population Balance Modeling of Wet Granulation Via Constant-Number Monte Carlo. Ph.D. Thesis, The Pennsylvania State University, State College, PA, USA, 2012. [Google Scholar]
  79. Dernedde, M.; Peglow, M.; Tsotsas, E. Stochastic Modeling of Fluidized Bed Granulation: Influence of Droplet Pre-Drying. Chem. Eng. Technol. 2011, 34, 1177–1184. [Google Scholar] [CrossRef]
  80. Hussain, M.; Kumar, J.; Peglow, M.; Tsotsas, E. Modeling spray fluidized bed aggregation kinetics on the basis of Monte-Carlo simulation results. Chem. Eng. Sci. 2013, 101, 35–45. [Google Scholar] [CrossRef]
  81. Heinrich, S.; Blumschein, J.; Henneberg, M.; Ihlow, M.; Peglow, M.; Mörl, L. Study of dynamic multi-dimensional temperature and concentration distributions in liquid-sprayed fluidized beds. Chem. Eng. Sci. 2003, 58, 5135–5160. [Google Scholar] [CrossRef]
  82. Kunii, D.; Levenspiel, O. Bubbling Bed Model. Model for Flow of Gas through a Fluidized Bed. Ind. Eng. Chem. Fundam. 1968, 7, 446–452. [Google Scholar] [CrossRef]
  83. Schuch, G. Theoretische und Experimentelle Untersuchungen zur Auslegung von Naßentstaubern; University Karlsruh: Karlsrule, Germany, 1978. [Google Scholar]
  84. Peglow, M.; Kumar, J.; Heinrich, S.; Warnecke, G.; Tsotsas, E.; Mörl, L.; Wolf, B. A generic population balance model for simultaneous agglomeration and drying in fluidized beds. Chem. Eng. Sci. 2007, 62, 513–532. [Google Scholar] [CrossRef]
  85. Burgschweiger, J.; Tsotsas, E. Experimental Investigation and Modelling of Continuous Uidized Bed Drying under Steady-State and Dynamic Conditions. Chem. Eng. Sci. 2002, 57, 5021–5038. [Google Scholar] [CrossRef]
  86. Hussain, M.; Kumar, J.; Peglow, M.; Tsotsas, E. On two-compartment population balance modeling of spray fluidized bed agglomeration. Comput. Chem. Eng. 2013, 61, 185–202. [Google Scholar] [CrossRef]
  87. Hussain, M.; Kumar, J.; Tsotsas, E. Micro-Macro Transition of Population Balances in Fluidized Bed Granulation. Procedia Eng. 2015, 102, 1399–1407. [Google Scholar] [CrossRef]
  88. Hussain, M.; Peglow, M.; Tsotsas, E.; Kumar, J. Modeling of aggregation kernel using Monte Carlo simulations of spray fluidized bed agglomeration. AIChE J. 2014, 60, 855–868. [Google Scholar] [CrossRef]
  89. Hussain, M.; Kumar, J.; Tsotsas, E. A new framework for population balance modeling of spray fluidized bed agglomeration. Particuology 2014, 19, 141–154. [Google Scholar] [CrossRef]
  90. Chen, K.; Bachmann, P.; Bück, A.; Jacob, M.; Tsotsas, E. Experimental study and modeling of particle drying in a continuously-operated horizontal fluidized bed. Particuology 2017, 34, 134–146. [Google Scholar] [CrossRef]
  91. Chen, K.; Bachmann, P.; Bück, A.; Jacob, M.; Tsotsas, E. CFD simulation of particle residence time distribution in industrial scale horizontal fluidized bed. Powder Technol. 2018, 345, 129–139. [Google Scholar] [CrossRef]
  92. Arthur, T.B.; Chauhan, J.; Rahmanian, N. Process Simulation of Fluidized Bed Granulation: Effect of Process Parameters on Granule Size Distribution. Chem. Eng. Trans. 2022, 95, 241–246. [Google Scholar] [CrossRef]
  93. Burgschweiger, J.; Groenewold, H.; Hirschmann, C.; Tsotsas, E. From hygroscopic single particle to batch fluidized bed drying kinetics. Can. J. Chem. Eng. 1999, 77, 333–341. [Google Scholar] [CrossRef]
  94. Börner, M.; Peglow, M.; Tsotsas, E. Particle Residence Times in Fluidized Bed Granulation Equipments. Chem. Eng. Technol. 2011, 34, 1116–1122. [Google Scholar] [CrossRef]
  95. Peglow, M.; Kumar, J.; Hampel, R.; Tsotsas, E.; Heinrich, S. Towards a Complete Population Balance Model for Fluidized-Bed Spray Agglomeration. Dry. Technol. 2007, 25, 1321–1329. [Google Scholar] [CrossRef]
  96. Hussain, M.; Kumar, J.; Tsotsas, E. Modeling aggregation kinetics of fluidized bed spray agglomeration for porous particles. Powder Technol. 2015, 270, 584–591. [Google Scholar] [CrossRef]
  97. Ramachandran, R.P.; Akbarzadeh, M.; Paliwal, J.; Cenkowski, S. Computational Fluid Dynamics in Drying Process Modelling—A Technical Review. Food Bioprocess Technol. 2018, 11, 271–292. [Google Scholar] [CrossRef]
  98. Askarishahi, M.; Salehi, M.-S.; Dehkordi, A.M. Numerical investigation on the solid flow pattern in bubbling gas–solid fluidized beds: Effects of particle size and time averaging. Powder Technol. 2014, 264, 466–476. [Google Scholar] [CrossRef]
  99. Askarishahi, M.; Salehi, M.-S.; Godini, H.R.; Wozny, G. CFD study on solids flow pattern and solids mixing characteristics in bubbling fluidized bed: Effect of fluidization velocity and bed aspect ratio. Powder Technol. 2015, 274, 379–392. [Google Scholar] [CrossRef]
  100. Salehi, M.-S.; Askarishahi, M.; Radl, S. Quantification of Solid Mixing in Bubbling Fluidized Beds via Two-Fluid Model Simulations. Ind. Eng. Chem. Res. 2020, 59, 10606–10621. [Google Scholar] [CrossRef]
  101. Goldschmidt, M. Hydrodynamic Modelling of Fluidised Bed Spray Granulation. 2001. Available online: http://doc.utwente.nl/36352/1/t000002e.pdf (accessed on 26 August 2014).
  102. Goldschmidt, M.; Weijers, G.; Boerefijn, R.; Kuipers, J. Discrete element modelling of fluidised bed spray granulation. Powder Technol. 2003, 138, 39–45. [Google Scholar] [CrossRef] [Green Version]
  103. Barrasso, D.; Ramachandran, R. Multi-scale modeling of granulation processes: Bi-directional coupling of PBM with DEM via collision frequencies. Chem. Eng. Res. Des. 2015, 93, 304–317. [Google Scholar] [CrossRef]
  104. Grohn, P.; Lawall, M.; Oesau, T.; Heinrich, S.; Antonyuk, S. CFD-DEM Simulation of a Coating Process in a Fluidized Bed Rotor Granulator. Processes 2020, 8, 1090. [Google Scholar] [CrossRef]
  105. Ronsse, F.; Pieters, J.; Dewettinck, K. Combined population balance and thermodynamic modelling of the batch top-spray fluidised bed coating process. Part I—Model development and validation. J. Food Eng. 2007, 78, 296–307. [Google Scholar] [CrossRef]
  106. Ronsse, F.; Pieters, J.; Dewettinck, K. Combined population balance and thermodynamic modelling of the batch top-spray fluidised bed coating process. Part II—Model and process analysis. J. Food Eng. 2007, 78, 308–322. [Google Scholar] [CrossRef]
  107. Ronsse, F. Modelling Heat and Mass Transfer in Fluidised Bed Coating Processes. Ph.D. Thesis, University of Ghent, Ghent, Belgium, 2013. [Google Scholar]
  108. Neugebauer, C.; Palis, S.; Bück, A.; Tsotsas, E.; Heinrich, S.; Kienle, A. A dynamic two-zone model of continuous fluidized bed layering granulation with internal product classification. Particuology 2017, 31, 8–14. [Google Scholar] [CrossRef]
  109. Börner, M.; Peglow, M.; Tsotsas, E. Derivation of parameters for a two compartment population balance model of Wurster fluidised bed granulation. Powder Technol. 2012, 238, 122–131. [Google Scholar] [CrossRef]
  110. Hede, P.D.; Bach, P.; Jensen, A.D. Batch top-spray fluid bed coating: Scale-up insight using dynamic heat- and mass-transfer modelling. Chem. Eng. Sci. 2009, 64, 1293–1317. [Google Scholar] [CrossRef]
  111. Mörl, L.; Heinrich, S.; Peglow, M. Chapter 2 Fluidized bed spray granulation. Handb. Powder Technol. 2007, 11, 21–188. [Google Scholar] [CrossRef]
  112. Vreman, A.; van Lare, C.; Hounslow, M. A basic population balance model for fluid bed spray granulation. Chem. Eng. Sci. 2009, 64, 4389–4398. [Google Scholar] [CrossRef]
  113. Bachmann, P.; Chen, K.; Bück, A.; Tsotsas, E. Prediction of particle size and layer-thickness distributions in a continuous horizontal fluidized-bed coating process. Particuology 2020, 50, 1–12. [Google Scholar] [CrossRef]
  114. Kaur, G.; Singh, M.; Kumar, J.; De Beer, T.; Nopens, I. Mathematical Modelling and Simulation of a Spray Fluidized Bed Granulator. Processes 2018, 6, 195. [Google Scholar] [CrossRef]
  115. Maharjan, R.; Jeong, S.H. Application of different models to evaluate the key factors of fluidized bed layering granulation and their influence on granule characteristics. Powder Technol. 2022, 408, 117737. [Google Scholar] [CrossRef]
  116. Johnson, K.L.; Kendall, K.; Roberts, A. Surface Energy and the Contact of Elastic Solids. Proc. R. Soc. Lond. 1971, 324, 301–313. [Google Scholar]
  117. Muddu, S.V.; Tamrakar, A.; Pandey, P.; Ramachandran, R. Model Development and Validation of Fluid Bed Wet Granulation with Dry Binder Addition Using a Population Balance Model Methodology. Processes 2018, 6, 154. [Google Scholar] [CrossRef]
  118. Rajniak, P.; Birmingham, S. A Population Balance Model for Calculation of Total Evaporation Rate during Fluid Bed Granulation or Coating. In Proceedings of the AIChEAnnual Meeting, San Francisco, CA, USA, 13–18 November 2016. [Google Scholar]
  119. Amini, H.; He, X.; Tseng, Y.-C.; Kucuk, G.; Schwabe, R.; Schultz, L.; Maus, M.; Schröder, D.; Rajniak, P.; Bilgili, E. A semi-theoretical model for simulating the temporal evolution of moisture-temperature during industrial fluidized bed granulation. Eur. J. Pharm. Biopharm. 2020, 151, 137–152. [Google Scholar] [CrossRef]
  120. Sutkar, V.S.; Deen, N.G.; Patil, A.V.; Salikov, V.; Antonyuk, S.; Heinrich, S.; Kuipers, J. CFD–DEM model for coupled heat and mass transfer in a spout fluidized bed with liquid injection. Chem. Eng. J. 2016, 288, 185–197. [Google Scholar] [CrossRef]
  121. Chaudhury, A.; Niziolek, A.; Ramachandran, R. Multi-dimensional mechanistic modeling of fluid bed granulation processes: An integrated approach. Adv. Powder Technol. 2013, 24, 113–131. [Google Scholar] [CrossRef]
  122. Kieckhefen, P.; Lichtenegger, T.; Pietsch, S.; Pirker, S.; Heinrich, S. Simulation of spray coating in a spouted bed using recurrence CFD. Particuology 2019, 42, 92–103. [Google Scholar] [CrossRef]
  123. Thielmann, F.; Naderi, M.; Ansari, M.A.; Stepanek, F. The effect of primary particle surface energy on agglomeration rate in fluidised bed wet granulation. Powder Technol. 2008, 181, 160–168. [Google Scholar] [CrossRef]
  124. Rajniak, P.; Stepanek, F.; Dhanasekharan, K.; Fan, R.; Mancinelli, C.; Chern, R. A combined experimental and computational study of wet granulation in a Wurster fluid bed granulator. Powder Technol. 2009, 189, 190–201. [Google Scholar] [CrossRef]
  125. Nugraha, M.G.; Andersson, R.; Andersson, B. On the Sherwood number correction due to Stefan flow. Chem. Eng. Sci. 2021, 249, 117292. [Google Scholar] [CrossRef]
  126. Deen, N.; Kuipers, J. Direct Numerical Simulation (DNS) of mass, momentum and heat transfer in dense fluid-particle systems. Curr. Opin. Chem. Eng. 2014, 5, 84–89. [Google Scholar] [CrossRef]
  127. Glasser, B.J.; Sundaresan, S.; Kevrekidis, I.G. From Bubbles to Clusters in Fluidized Beds. Phys. Rev. Lett. 1998, 81, 1849–1852. [Google Scholar] [CrossRef]
  128. Agrawal, K.; Loezos, P.N.; Syamlal, M.; Sundaresan, S. The role of meso-scale structures in rapid gas–solid flows. J. Fluid Mech. 2001, 445, 151–185. [Google Scholar] [CrossRef]
  129. Sundaresan, S.; Radl, S.; Milioli, C.C.; Milioli, F.E.; Kuipers, J.A.M. Coarse-Grained Models for Momentum, Energy and Species Transport in Gas-Particle Flows. In Proceedings of the 14th International Conference on Fluidization– From Fundamentals to Product, Noordwijkerhout, The Netherlands, 26–31 May 2013. [Google Scholar]
  130. Agrawal, K.; Holloway, W.; Milioli, C.C.; Milioli, F.E.; Sundaresan, S. Filtered models for scalar transport in gas–particle flows. Chem. Eng. Sci. 2013, 95, 291–300. [Google Scholar] [CrossRef]
  131. Guo, L.; Capecelatro, J. The role of clusters on heat transfer in sedimenting gas-solid flows. Int. J. Heat Mass Transf. 2018, 132, 1217–1230. [Google Scholar] [CrossRef]
  132. Rauchenzauner, S.; Schneiderbauer, S. Validation study of a Spatially-Averaged Two-Fluid Model for heat transport in gas-particle flows. Int. J. Heat Mass Transf. 2022, 198, 123382. [Google Scholar] [CrossRef]
  133. Rauchenzauner, S.; Schneiderbauer, S. A dynamic Spatially Averaged Two-Fluid Model for heat transport in moderately dense gas–particle flows. Phys. Fluids 2020, 32, 063307. [Google Scholar] [CrossRef]
  134. Silva, M.A.; Kerkhof, P.J.A.M.; Coumans, W.J. Estimation of Effective Diffusivity in Drying of Heterogeneous Porous Media. Ind. Eng. Chem. Res. 2000, 39, 1443–1452. [Google Scholar] [CrossRef]
  135. Lekhal, A.; Glasser, B.J.; Khinast, J.G. Impact of Drying on the Catalyst Profile in Supported Impregnation Catalysts. Chem. Eng. Sci. 2001, 56, 4473–4487. [Google Scholar] [CrossRef]
  136. Katekawa, M.E.; Silva, M.A. A Review of Drying Models Including Shrinkage Effects. Dry. Technol. 2006, 24, 5–20. [Google Scholar] [CrossRef]
  137. Askarishahi, M.; Maus, M.; Slade, D.; Khinast, J.; Jajcevic, D. Mechanistic Modelling of Fluid Bed Granulation Process. In Proceedings of the 9th Granulation Workshop, Laussane, Switzerland, 26–28 June 2019. [Google Scholar]
  138. Henneberg, M.; Heinrich, S.; Ihlow, M.; Mörl, L. Fluidized Bed Air Drying: Experimental Study and Model Development. Can. J. Chem. Eng. 2003, 81, 176–184. [Google Scholar] [CrossRef]
  139. Ghijs, M.; Schäfer, E.; Kumar, A.; Cappuyns, P.; Van Assche, I.; De Leersnyder, F.; Vanhoorne, V.; De Beer, T.; Nopens, I. Modeling of Semicontinuous Fluid Bed Drying of Pharmaceutical Granules With Respect to Granule Size. J. Pharm. Sci. 2019, 108, 2094–2101. [Google Scholar] [CrossRef] [PubMed]
  140. Chen, K. Modeling and Validation of Particle Drying and Coating in a Continuously Operated Horizontal Fluidized Bed. Ph.D. Thesis, Otto-von-Guericke-Universität Magdeburg, Magdeburg, Germany, 2020. [Google Scholar]
  141. Sherwood, T.K. The Drying of Solids-I Classification of Drying Mechanisms. Ind. Eng. Chem. 1929, 21, 12–16. [Google Scholar] [CrossRef]
  142. Sherwood, T.K. The Drying of Solids—II. Ind. Eng. Chem. 1929, 21, 16. [Google Scholar] [CrossRef]
  143. Chen, H.; Glasser, B.J. Fluidized Bed Drying of Pharmaceutical Materials: Batch and Continuous Manufacturing, Rutgers. Ph.D. Thesis, The State University of New Jersey, Rutgers, New Brunswick, NJ, USA, 2019. [Google Scholar]
  144. Chen, H.; Diep, E.; Langrish, T.A.G.; Glasser, B.J. Continuous fluidized bed drying: Residence time distribution characterization and effluent moisture content prediction. AIChE J. 2020, 66, e16902. [Google Scholar] [CrossRef]
  145. Midilli, A.; Kucuk, H.; Yapar, Z. A New Model for Single-Layer Drying. Dry. Technol. 2002, 20, 1503–1513. [Google Scholar] [CrossRef]
  146. Janocha, M.; Tsotsas, E. In silico investigation of the evaporation flux distribution along sessile droplet surfaces during convective drying. Chem. Eng. Sci. 2021, 238, 116590. [Google Scholar] [CrossRef]
  147. Le Bray, Y.; Prat, M. Three-dimensional pore network simulation of drying in capillary porous media. Int. J. Heat Mass Transf. 1999, 42, 4207–4224. [Google Scholar] [CrossRef]
  148. Prat, M. Recent Advances in Pore-Scale Models for Drying of Porous Media. Chem. Eng. J. 2002, 86, 153–164. [Google Scholar] [CrossRef]
  149. Metzger, T. A personal view on pore network models in drying technology. Dry. Technol. 2018, 37, 497–512. [Google Scholar] [CrossRef]
  150. Rahimi, A.; Metzger, T.; Kharaghani, A.; Tsotsas, E. Interaction of droplets with porous structures: Pore network simulation of wetting and drying. Dry. Technol. 2016, 34, 1129–1140. [Google Scholar] [CrossRef]
  151. Wu, R.; Zhao, C.Y. Distribution of liquid flow in a pore network during evaporation. Phys. Rev. E 2021, 104, 025107. [Google Scholar] [CrossRef]
  152. Wang, Y.; Kharaghani, A.; Metzger, T.; Tsotsas, E. Pore Network Drying Model for Particle Aggregates: Assessment by X-Ray Microtomography. Dry. Technol. 2012, 30, 1800–1809. [Google Scholar] [CrossRef]
  153. Kharaghani, A.; Mahmood, H.T.; Wang, Y.; Tsotsas, E. Three-dimensional visualization and modeling of capillary liquid rings observed during drying of dense particle packings. Int. J. Heat Mass Transf. 2021, 177, 121505. [Google Scholar] [CrossRef]
  154. Tardos, G.I.; Khan, M.I.; Mort, P.R. Critical parameters and limiting conditions in binder granulation of fine powders. Powder Technol. 1997, 94, 245–258. [Google Scholar] [CrossRef]
  155. Barnocky, G.; Davis, R.H. Elastohydrodynamic collision and rebound of spheres: Experimental verification. Phys. Fluids 1988, 31, 1324. [Google Scholar] [CrossRef]
  156. Wang, L.G.; Omar, C.; Litster, J.; Slade, D.; Li, J.; Salman, A.; Bellinghausen, S.; Barrasso, D.; Mitchell, N. Model driven design for integrated twin screw granulator and fluid bed dryer via flowsheet modelling. Int. J. Pharm. 2022, 628, 122186. [Google Scholar] [CrossRef] [PubMed]
  157. Halsey, T.C.; Levine, A.J. How Sandcastles Fall. Phys. Rev. Lett. 1998, 80, 3141–3144. [Google Scholar] [CrossRef]
  158. Heinrich, S.; Mö, L. Fluidized Bed Spray Granulation—A New Model for the Description of Particle Wetting and of Temperature and Concentration Distribution. Chem. Eng. Process Process Intensif. 1999, 38, 635–663. [Google Scholar] [CrossRef]
  159. Heinrich, S.; Mori, L.; Wöstheinrich, K.; Schmidt, P. Non-Stationary Drying Kinetics in a Batch Pharmaceutical Fluidized Bed Coating Process. Dry. Technol. 2000, 18, 2065–2090. [Google Scholar] [CrossRef]
  160. Närvänen, T.; Antikainen, O.; Yliruusi, J. Predicting Particle Size During Fluid Bed Granulation Using Process Measurement Data. AAPS PharmSciTech 2009, 10, 1268–1275. [Google Scholar] [CrossRef] [PubMed]
  161. Rajniak, P.; Mancinelli, C.; Chern, R.; Stepanek, F.; Farber, L.; Hill, B. Experimental study of wet granulation in fluidized bed: Impact of the binder properties on the granule morphology. Int. J. Pharm. 2007, 334, 92–102. [Google Scholar] [CrossRef] [PubMed]
  162. Schmidt, M.; Bück, A.; Tsotsas, E. Experimental investigation of the influence of drying conditions on process stability of continuous spray fluidized bed layering granulation with external product separation. Powder Technol. 2017, 320, 474–482. [Google Scholar] [CrossRef]
  163. Bouffard, J.; Kaster, M.; Dumont, H. Influence of Process Variable and Physicochemical Properties on the Granulation Mechanism of Mannitol in a Fluid Bed Top Spray Granulator. Drug Dev. Ind. Pharm. 2005, 31, 923–933. [Google Scholar] [CrossRef]
  164. Dadkhah, M.; Tsotsas, E. Influence of process variables on internal particle structure in spray fluidized bed agglomeration. Powder Technol. 2014, 258, 165–173. [Google Scholar] [CrossRef]
Figure 1. Granule morphology for different net rates of liquid addition; high saturation level means that the net rate of liquid addition to the granule is fast compared to dryingafter the work of Askarishahi et al. [10] (figure has been reused with the permission from the publisher).
Processes 11 00569 g001
Figure 2. Dependence of final granule size on the final LoD [9,10] (figure has been reused with permission from the publisher).
Processes 11 00569 g002
Figure 3. Temporal evolution of temperature and granule LoD for a typical granulation process.
Processes 11 00569 g003
Figure 4. The typical rate of drying versus liquid content of granule. AB: initial heat-up; BC: constant-rate drying: surface moisture removed while keeping continuous film; CD: first-falling rate period: moisture is transferred to the surface from the pore while the wet surface area is reduced; DE: second falling-rate period: finally the particle reaches the equilibrium moisture content, so the drying rate becomes zero.
Processes 11 00569 g004
Figure 5. Different types of liquid in a granule.
Processes 11 00569 g005
Figure 6. Scales when modeling and simulating granulation processes with a focus on drying.
Processes 11 00569 g006
Figure 7. Information exchange between TFM/MFM and PBM approaches for different levels of coupling (MFM stands for Multi-Fluid Method).
Processes 11 00569 g007
Figure 8. Indication of the spray and drying zones in a typical fluid bed.
Processes 11 00569 g008
Figure 9. Identification of different zones in a typical 2D wet fluidized bed (the result of TFM simulations following Askarishahi et al. [40]).
Processes 11 00569 g009
Figure 10. Different types of liquid regarding their interface with the gas phase.
Processes 11 00569 g010
Figure 11. Illustration of the effect of clustering on drying rates (the yellow-colored region indicates vapor).
Processes 11 00569 g011
Figure 12. Importance of cell size in accurate estimation of the driving force based on the distribution of vapor inside the cell.
Processes 11 00569 g012
Figure 13. Variation of the normalized drying rate versus normalized moisture content for different values of γ .
Processes 11 00569 g013
Table 1. List of key parameters and variables influencing fluid bed granulation performance (upon an increase in each of the parameters) [8,14,15,16,17].
Parameter/VariableInfluence on Fluid Bed Performance
Fluidization gas
temperature
  • increase in the rate of drying
  • possible decrease in the rate of agglomeration
  • improvement of granule consolidation
  • reduction in agglomerate porosity and consequently agglomerate diameter [8]
humidity
  • reduction in the rate of drying
velocity
  • improvement of particle mixing and circulation
  • possible improvement of nucleation
  • reduces growth limit
  • possible increase in the rate of particle attrition and breakage
  • increase in collision frequency
  • increase in the rate of drying for the constant-rate period (initial drying kinetics) [14]
  • increase in particle collision velocity
Binder liquid
spray rate
  • increase in the rate of particle wetting and liquid content
  • increase in the rate of nucleation and, to some extent, granulation and consolidation
  • increase in the granule size and density with a broader size distribution
  • reduction in the fluid bed temperature
  • possible increase in successful collisions of wet particle
  • possible increase in the rate of agglomeration
  • over-wetting may result in agglomerate breakage
number of nozzles
  • affects the uniformity of binder addition
droplet size and its distribution
  • increase in growth rate
atomization air pressure
  • influence on the size distribution of droplets
  • decrease in the average size of droplets
viscosity
  • reduction in the wetting uniformity
  • deterioration of spray distribution
  • increase in the success rate of collisions
  • improvement of the agglomerate stability to a certain extent (however, increases in viscosity do not guarantee agglomerate stability [15,16,17])
surface tension
  • increase in the agglomerate stability
  • improvement of wetting uniformity
  • tighter granule size distribution and improved product quality
binder concentration
  • formation of loosely arranged and porous agglomerates
  • increase in the rate of agglomeration if the viscosity increases with a binder concentration
heat of evaporation
  • decrease in the rate of drying
  • increase in particle liquid content
  • possible increase in the rate of agglomeration
  • deterioration of granule consolidation
Particles
size and size distribution
  • determines fluidization velocity
  • minimal effect on growth rate
  • wide size distribution leads to increased granule consolidation and density
density
  • determines fluidization velocity
wettability
  • improvement of particle wetting
  • increase in the rate of agglomeration
porosity
  • reduction in the rate of drying
  • increase in liquid penetration into the pores
Dryer
heat loss
  • can affect the temperature evolution and consequently lower the drying rate
Table 3. Phenomena to be considered in CFD-DEM-based simulations.
Phenomena ConsideredNumber of PapersReferences
Accounting for surface coverage4Askarishahi et al. [51], Kieckhefen et al. [60], Fries et al. [61], Madlmeir [68]
Finite cohesion force after drying is complete1Kafui and Thornton [49]
Intra-particle layer thickness variability1Jiang et al. [62]
Stefan Diffusion effects in evaporation (Spalding mass transfer numbers)1Madlmeir and Radl [67]
Systematic coarse-graining1Kieckhefen et al. [60], Madlmeir and Radl [67]
Falling rate drying0-
Table 4. Phenomena involved in the fluid bed granulation which need to be addressed in stochastic modeling approaches.
Phenomenon ConsideredNumber of PapersReferences
Granulation and drying13Dernedde et al. [74], Terrazas et al. [19,20,21], Marshall [78], Rieck et al. [70,71], Hussain et al. (Hussain et al., 2013b), Singh and Tsotsas [8,69,72], Das and Kumar [75], Du et al. [76]
Pre-deposition droplet evaporation1Dernedde et al. [74]
Imbibition of droplets into particles1Terrazas et al. [21]
Breakage10Terrazas et al. [19,20,21], Marshall [78], Rieck et al. [70,71], Hussain et al. (Hussain et al., 2013b), Singh and Tsotsas [8,69,72], Das and Kumar [75], Du et al. [76]
Accounting for surface coverage13Dernedde et al. [74], Terrazas et al. [19,20,21], Marshall [78], Rieck et al. [70,71], Hussain et al. [80], Singh and Tsotsas [8,69,72], Das and Kumar [75], Du et al. [76]
Liquid binder viscosity change8Dernedde et al. [74], Terrazas et al. [19,21], Marshall [78], Rieck et al. [71], Singh and Tsotsas [8,69,72]
Falling rate drying (of intra-particle moisture or intra-granule moisture)0-
Droplet deposition on particle13Dernedde et al. [74], Terrazas et al. [19,20,21], Marshall [78], Rieck et al. [70,71], Hussain et al. (Hussain et al., 2013b), Singh and Tsotsas [8,69,72], Das and Kumar [75], Du et al. [76]
Table 5. Phenomena involved in the fluid bed granulation which need to be addressed in compartmental modeling approaches.
Phenomenon ConsideredNumber of PapersReferences
Granulation and drying4Hussain et al. [80], Peglow et al. [84], Askarishahi et al. [9,10],
Das and Kumar [75]
Breakage1Liu and Li [32]
The success factor of collision4Hussain et al. [87], Das and Kumar [75], Askarishahi et al. [9,10]
Accounting for surface coverage1Hussain et al. [87]
Intra-particle layer thickness variability0-
Falling rate drying3Arthur et al. [92], Peglow et al. [95], Askarishahi et al. [9,10]
Droplet deposition on particle2Heinrich et al. [81], Hussain et al. [96]
Disclaimer/Publisher’s Note: The statements, opinions and data contained in all publications are solely those of the individual author(s) and contributor(s) and not of MDPI and/or the editor(s). MDPI and/or the editor(s) disclaim responsibility for any injury to people or property resulting from any ideas, methods, instructions or products referred to in the content.

