Article

Leakage Model of Tubing and Casing Premium Connection Based on Sinusoidal Contact Simulation between Rough Surfaces

1
State Key Laboratory of Oil and Gas Reservoir Geology and Exploitation, Southwest Petroleum University, Chengdu 610500, China
2
School of Petroleum and Natural Gas Engineering, Chongqing University of Science and Technology, Chongqing 401331, China
*
Author to whom correspondence should be addressed.
Processes 2023, 11(2), 570; https://doi.org/10.3390/pr11020570
Submission received: 10 January 2023 / Revised: 4 February 2023 / Accepted: 7 February 2023 / Published: 13 February 2023
(This article belongs to the Special Issue New Research on Oil and Gas Equipment and Technology)

Abstract

:
This paper proposed a semi-theoretical model to quantitatively predict leakage rate of tubing and casing premium connections. The geometric parameters of the sealing surface profile approximated by a sinusoidal micro-convex surface were first obtained based on the random normal distribution sampling method. With the actual area prediction formula for elastic–plastic contact of an axisymmetric sinusoidal micro-convex body based on the equivalent simulation principle, the circumferential leakage width and radial average leakage height of the micro-leakage channel between sealing surfaces were then acquired with the surface roughness and geometric mean contact pressure. At last, the actual micro-leakage rate of the premium connection was derived by considering the non-uniform contact pressure distribution between sealing surfaces. An example was investigated to validate the model and reveal the sealing and leakage characteristics, and anti-leakage measures were proposed. The results show that average contact pressure, circumferential leakage width, and radial average leakage height between sealing surfaces were non-uniformly distributed. The leakage rate of a premium connection decreases exponentially with an increase in radial interference between sealing surfaces. In order to reduce leakage rate, it is beneficial to increase radial interference and lower sealing surface roughness.

1. Introduction

Premium tubing and casing connections, which use special metal-to-metal sealing structures to achieve excellent gas sealing performances, have become one of the key technologies for maintaining wellbore integrity in deep high-temperature and high-pressure (HTHP) gas wells, thermal recovery wells, and gas wells in deep water environments [1,2,3]. The sealing structures for premium connections mainly include cone-to-cone, ball-to-cone, ball-to-cylinder, and ball-to-ball seals. The cone-to-cone seal is a static coordinated contact seal and the other three are static spherical non-coordinated contact seals. However, due to the influence of roughness on sealing surface, no matter what kind of sealing structure is used, premium connections cannot achieve zero leakage at present. Therefore, determining how to reliably evaluate gas sealing performances of premium connections is very important to ensure integrity of strings in gas wells.
In the API 5C3 and ISO10400 standards, the internal pressure leakage resistance formula of tubing and casing strings connected with API thread is derived based on the critical condition that the elastic contact pressure at the E1 plane of a round thread and the E7 plane of a buttress thread, respectively, generated by radial interference of the thread and internal pressure excitation, are equal to the internal pressure in the strings [4,5]. However, this formula is not suitable for sealing performance evaluation of non-coordinated contact seal structures. Gao et al. [6] analyzed gas leakage resistance for rough contact between metal and metal sealing surfaces and proposed a method for improving sealing performance by increasing sealing contact pressure and sealing length as much as possible. Based on experimental testing, Murtagian et al. [7] established a gas sealing criterion of metal-to-metal seals that used the integral of sealing contact pressure multiplied by sealing length to represent gas sealing capacity. Xie et al. [8] also proposed a similar evaluation standard for premium connections in thermal recovery wells.
Based on these evaluation criteria, contact pressure distribution on sealing surfaces has mainly been obtained by the finite element method (FEM) to evaluate sealability of premium connections. Wang [9] and Chen [10] both adopted the FEM to evaluate sealability of cone-to-cone-type and arc-to-cone-type premium connections under complex loads, including make-up torque, tension, bending, and internal pressure loads. Dou et al. [11,12] carried out sealing ability simulation for premium connections based on ISO 13679 CAL IV tests with FEM; the investigations also consider the effects of cyclic load on sealability of premium connections. Kim et al. analyzed the effects of stabbing flank angle and upper stabbing flank corner radius on von Mises stress of premium connections and presented the design criteria [13]. Zhang et al. adopted the viscoelastic finite element model to predict relaxation of contact pressure on premium connections’ sealing surface versus time under different temperatures [14]. Yu et al. analyzed the effect of energy dissipation on premium connection sealing surface with the microslip shear layer model [15]. Moreover, some theoretical and testing methods have also been proposed. Xu et al. [16,17] studied theoretically elastic contact pressure on sealing surface of ball-to-cone-type and cone-to-cone-type premium connections and their sealing performances. Yang et al. [18] also proposed a theoretical model to calculate elastic–plastic contact pressure distribution on sealing interfaces for sphere-type premium connections based on make-up torque and adopted gas sealing criterion obtained from Murtagian’s experimental results for deducing gas sealing capacity. Hamilton et al. [19] used ultrasonic technology to accurately detect the contact stress on the sealing surface to evaluate the sealability of premium connections in downhole strings.
In fact, the gas sealing test is the most direct and effective method to evaluate the sealing performance of a premium connection, but it is often used for validation because of economic and time cost limitations. According to ISO13679, detection sensitivity of leakage rate under internal pressure action for premium connections is 0.9 cm3/15 min based on the bubble method and 1 × 10⁻⁴ cm3/min based on helium mass spectrometer measurements [20]. Thus, in order to quantitatively evaluate the sealing performance of a premium connection, the leakage rate prediction model is urgently needed based on microscopic contact mechanics between sealing surfaces [21,22]. Xu et al. [23] first applied the microscopic contact mechanism to leakage rate prediction of a premium connection. Their purely theoretical method with assumption of a conical micro-convex body has difficulty accurately modeling the elastic–plastic contact state between sealing surfaces. Thus, the prediction accuracy needs to be further improved. In recent years, scholars have proposed that a sinusoidal micro-convex contact model can better simulate the contact problem on rough surfaces dominated by plastic deformation under heavy loads [24,25]. Further, most existing multiscale rough surface contact models consider multiscale properties of surface roughness by using Fourier series or Weierstrass–Mandelbrot profile functions to convert rough surfaces into a sum of sine or cosine functions [26,27]. Therefore, it should be more reasonable to simulate the elastic–plastic microscopic contact problem for a premium connection with sinusoidal convex body assumptions.
In this study, the surface profile curve of the preset surface roughness was obtained based on random normal distribution sampling, and the simulated geometric parameters of the surface profile approximated by the sinusoidal micro-convex surface were first statistically obtained. With the actual area prediction formula for elastic–plastic contact of axisymmetric sinusoidal micro-convex bodies based on the equivalent simulation principle [28], the circumferential leakage width and radial average leakage height of the micro-leakage channel between sealing surfaces were then acquired with the surface roughness and geometric mean contact pressure. By dividing the sealing structure into a series of sealing contact units along the axial direction and using the boundary conditions of the fluid leakage pressure and the continuity conditions of the leakage rate of each unit, an actual micro-leakage rate prediction model of a premium connection considering a non-uniform distribution of contact pressure on a sealing surface was finally derived. With the proposed model, an example of a cone-to-cone-type premium connection was investigated to validate the model and reveal the sealing and leakage characteristics of a connection, and anti-leakage measures were proposed. The proposed model provides a fast and quantitative sealability evaluation method for premium connections, which is of great importance for sealing parameters optimization and sealing performance improvement.

2. Model Development

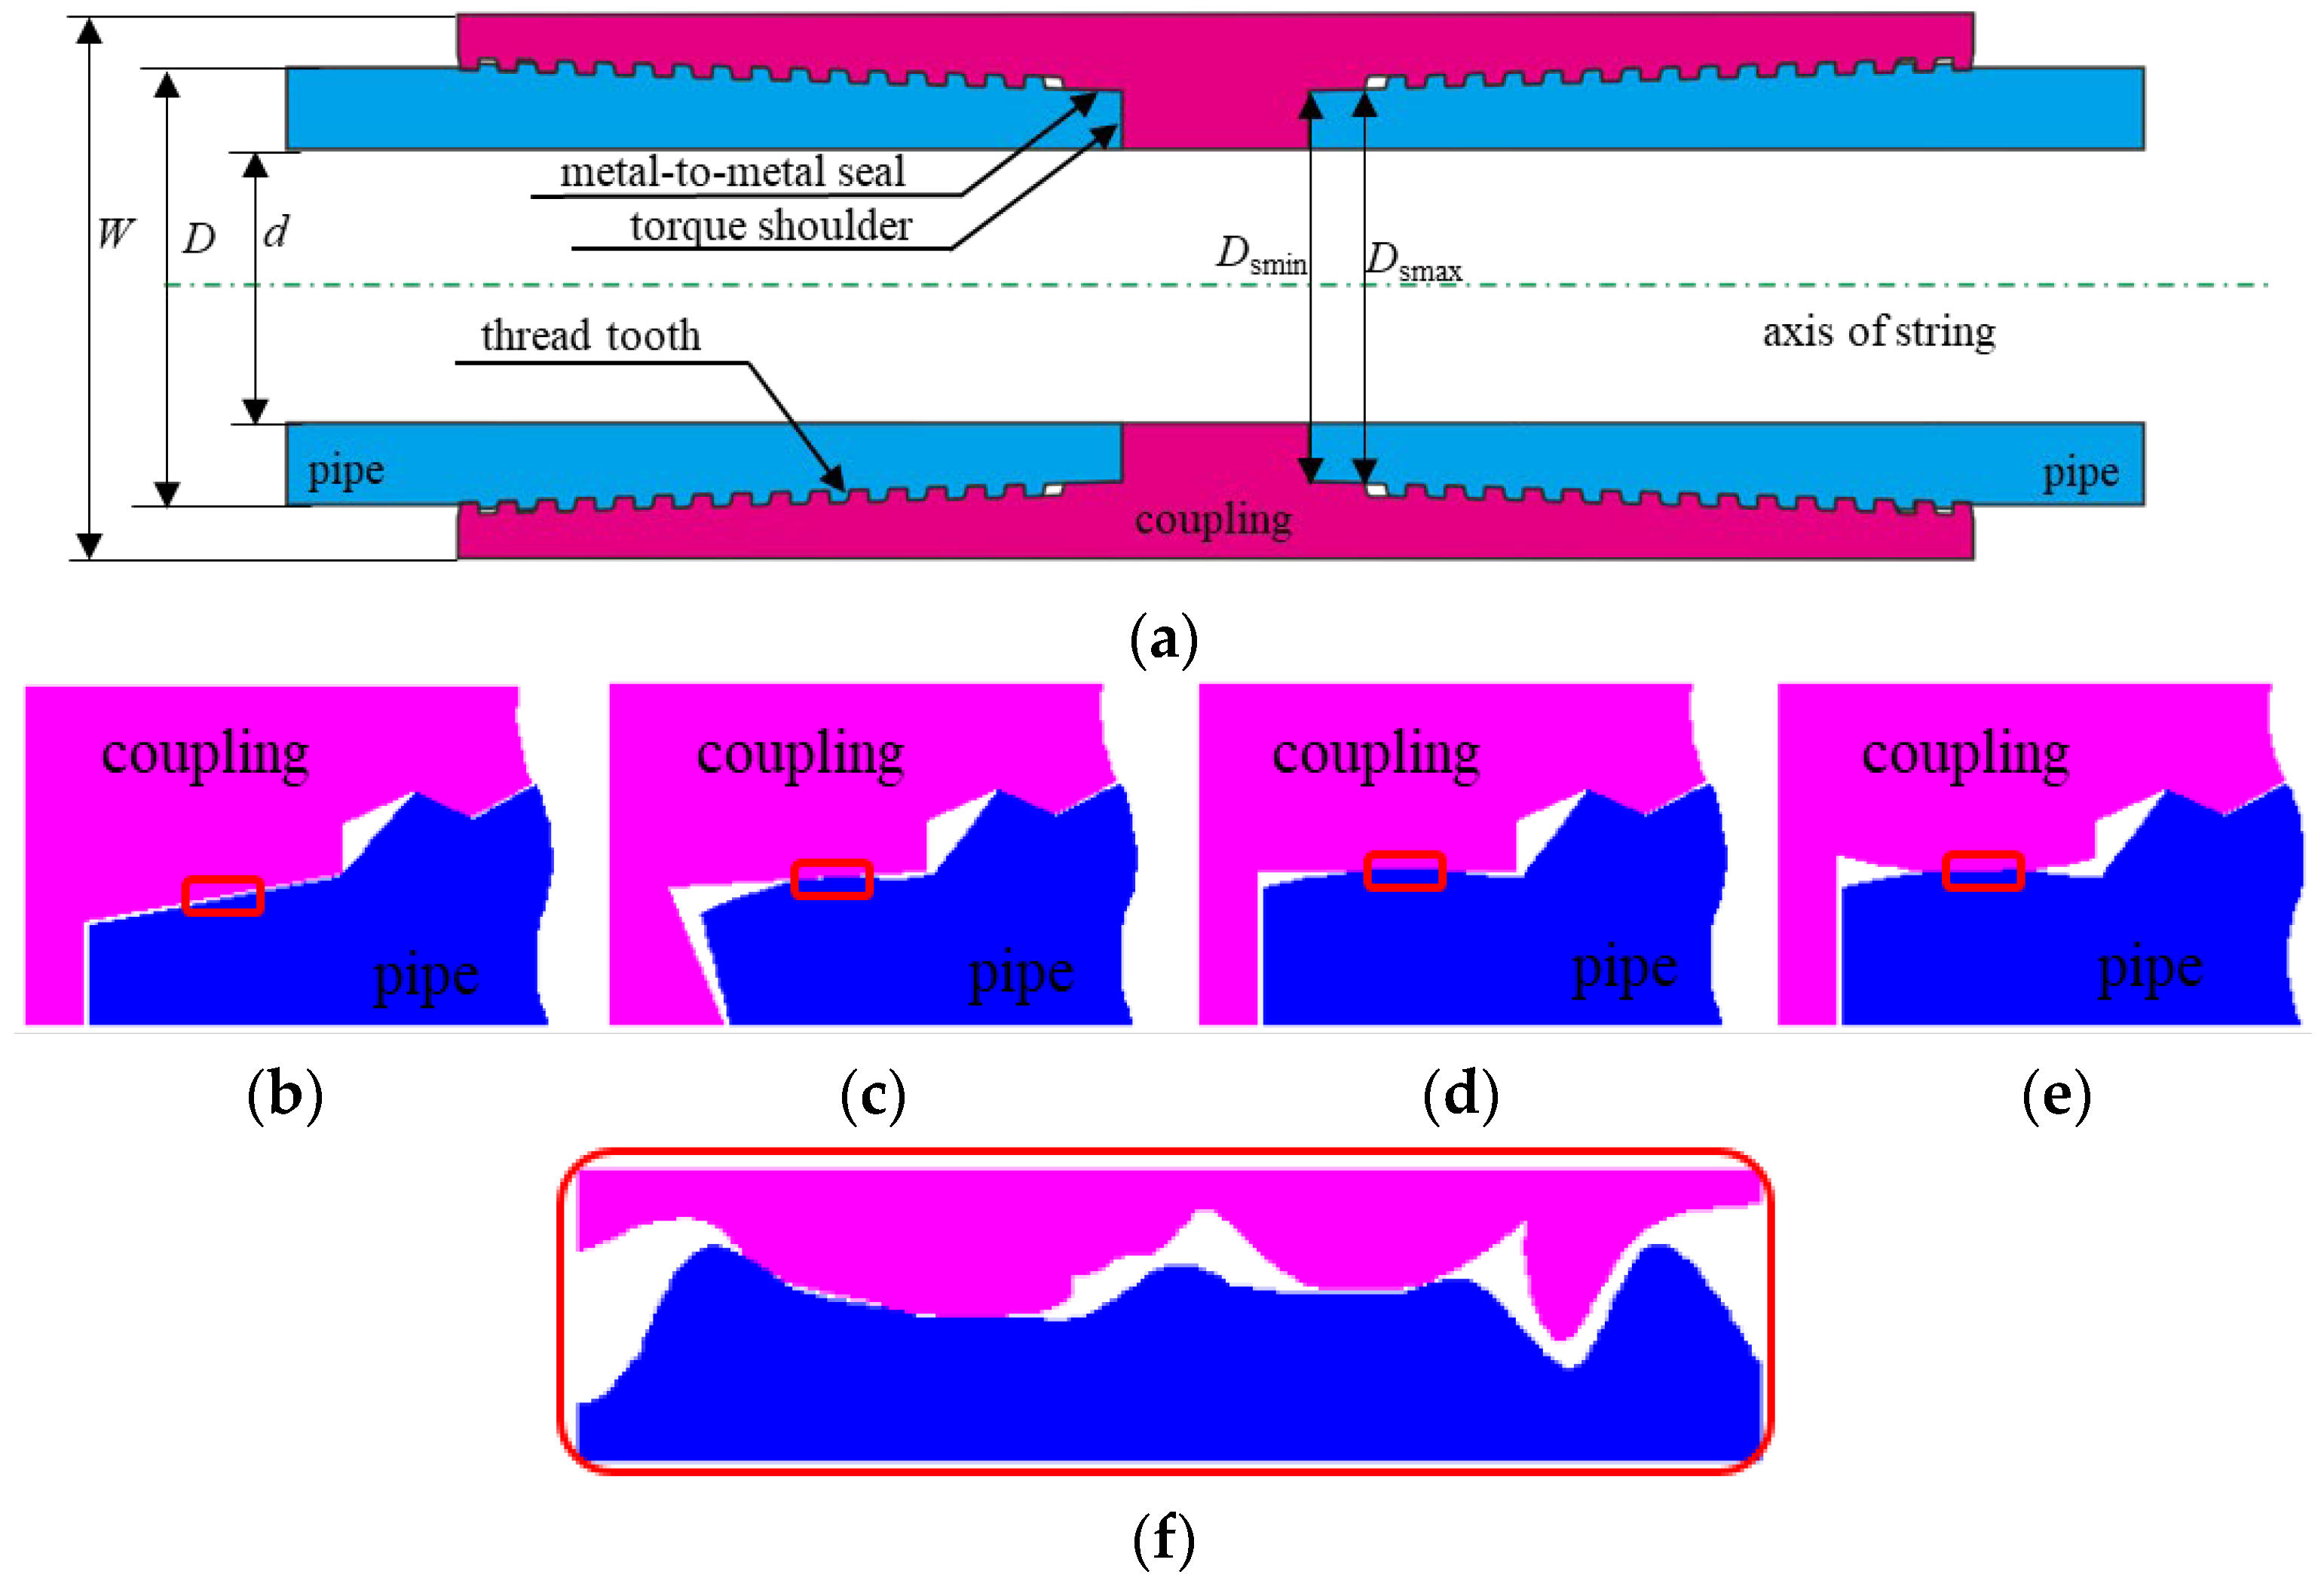
2.1. Seal Structure and Micro-Leakage Channel for Premium Connections

Unlike API standard tubing and casing connections, premium connections achieve excellent gas sealing performance by using a special radial metal-to-metal seal structure and torque shoulder to control make-up torque and assist sealing. The common seal structures of premium connections include cone-to-cone, ball-to-cone, ball-to-cylinder, and ball-to-ball seals. Under the influence of mechanical processing, regardless of which type of sealing structure is adopted, the sealing surface of a premium connection is always unsmooth, and there are always microscopic leakage channels between the sealing surfaces after make-up torque application, as shown in Figure 1. Therefore, accurately modeling the elastic–plastic contact mechanical behavior of the micro-convex body between sealing surfaces and obtaining the micro-leakage channel area between sealing surfaces are the bases for establishing a micro-leakage model for premium connections.

2.2. Micro-Leakage Model for Tubing and Casing Premium Connection

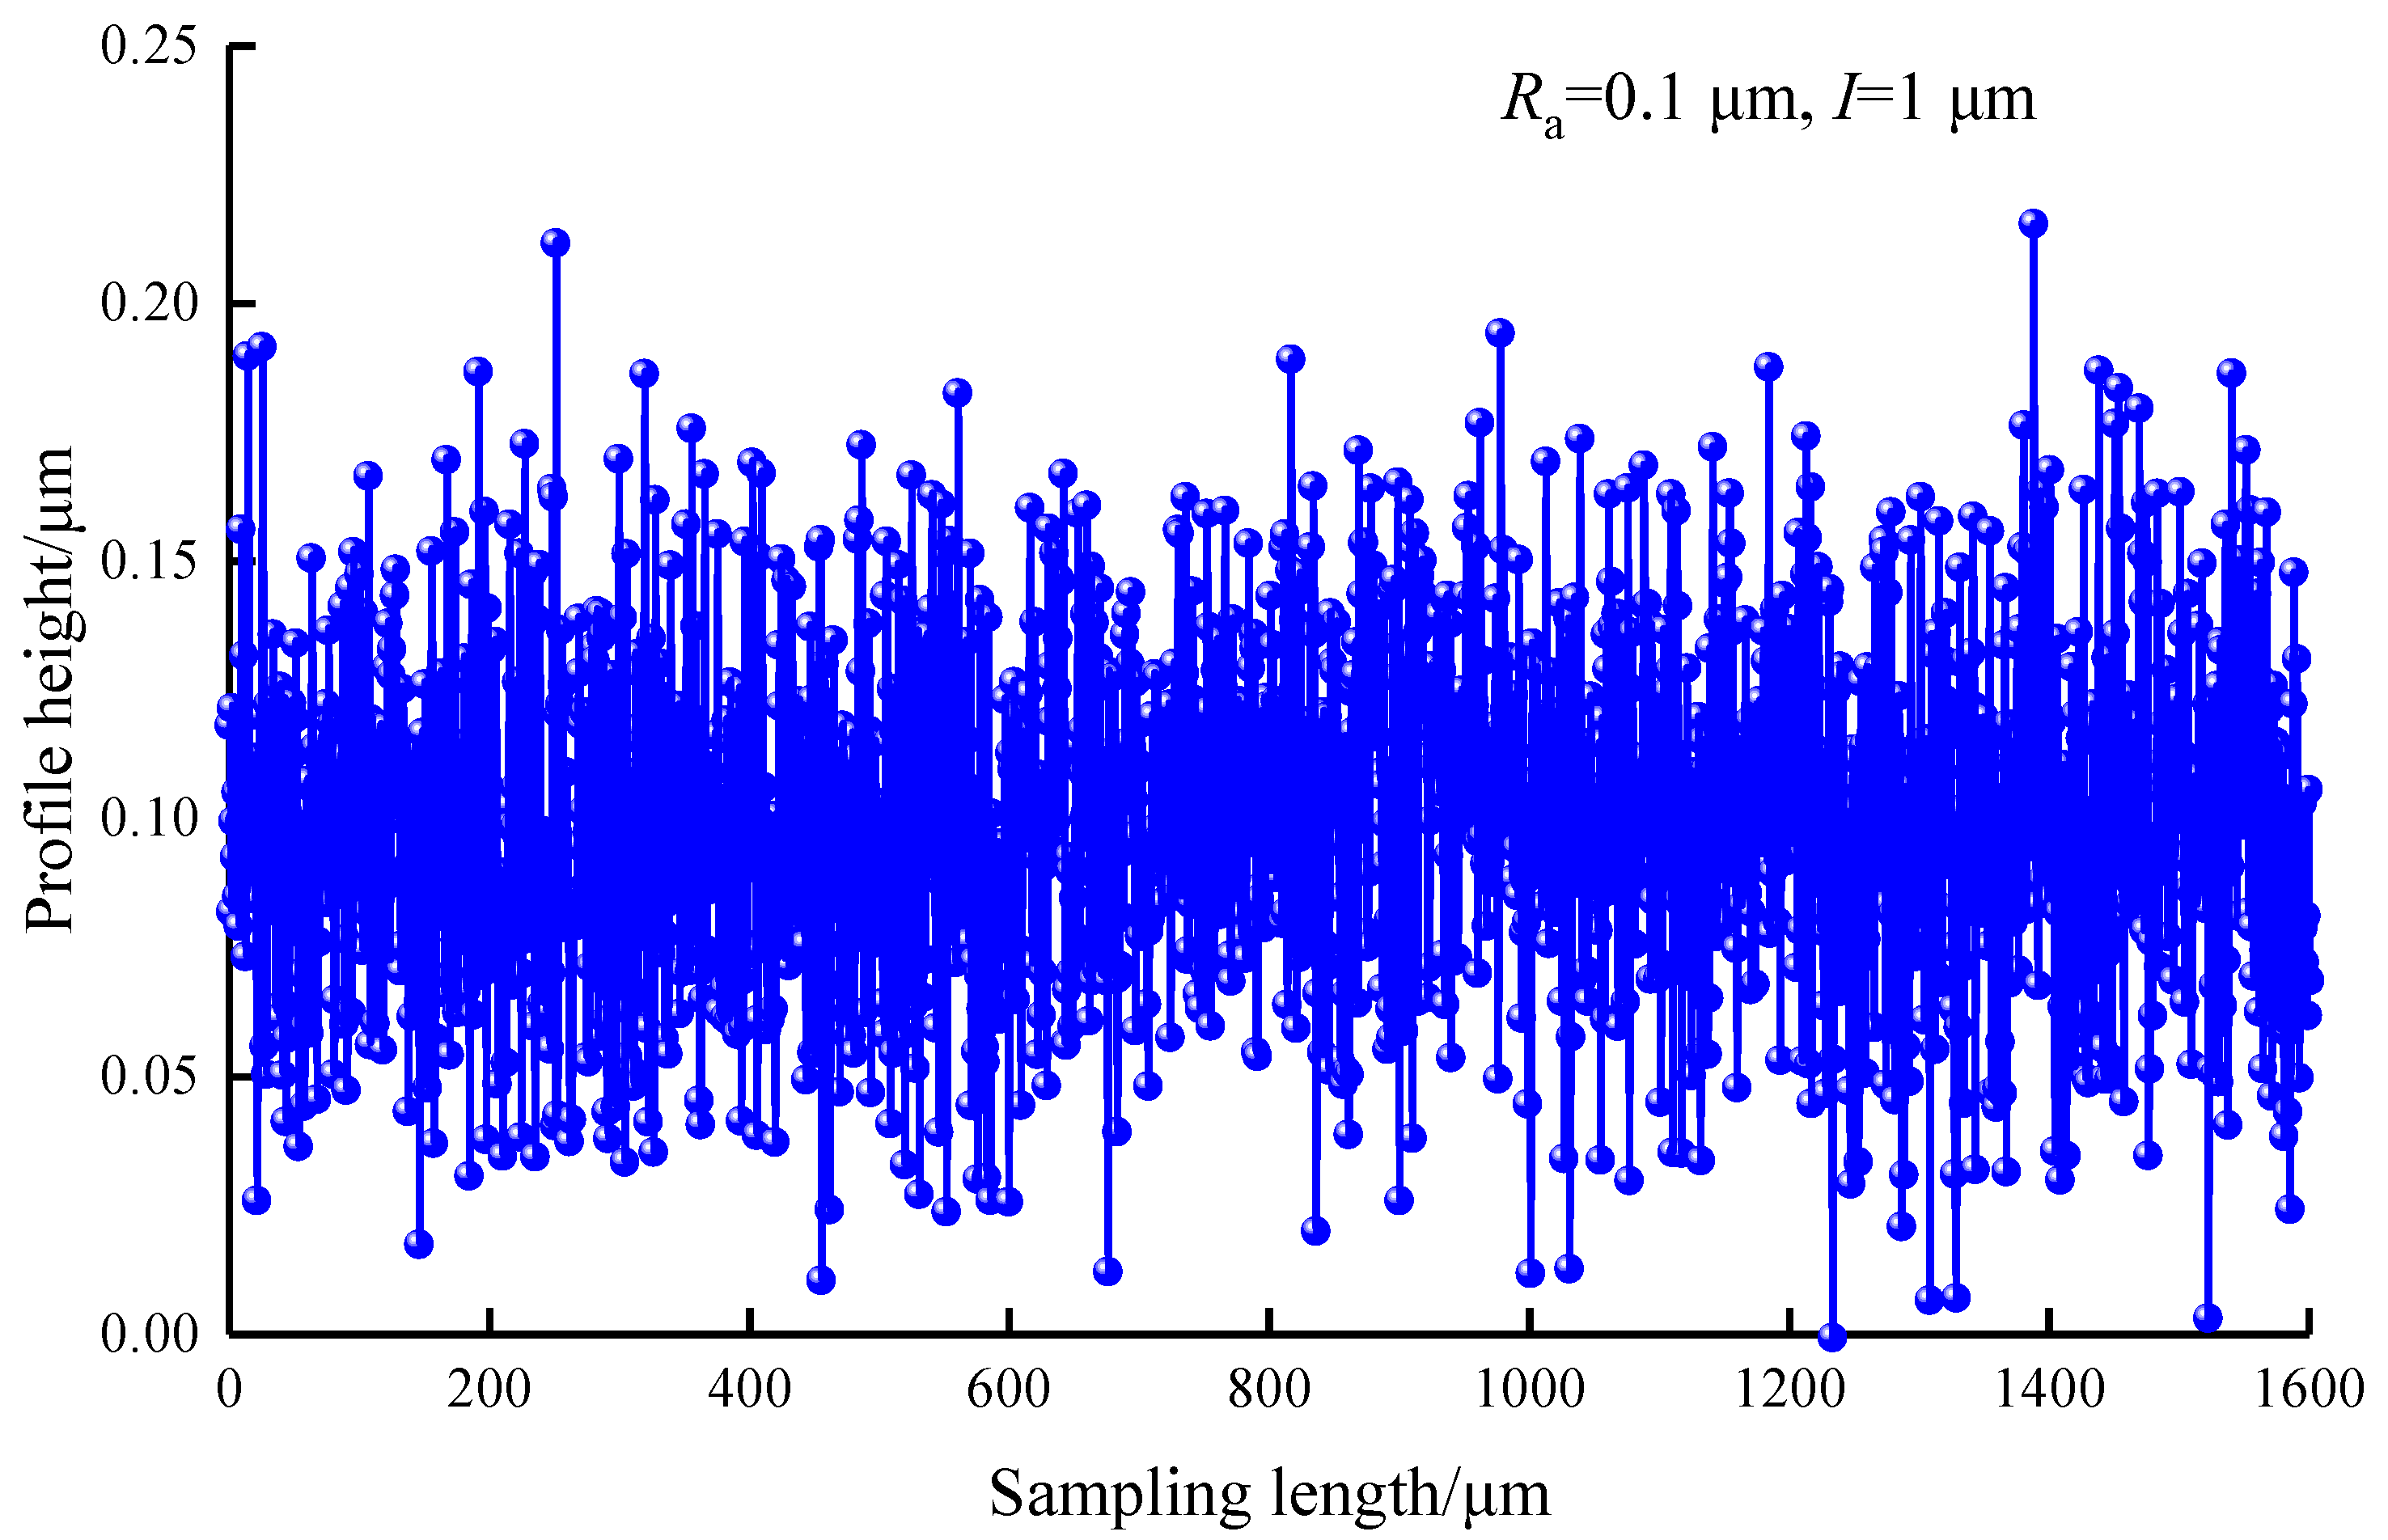
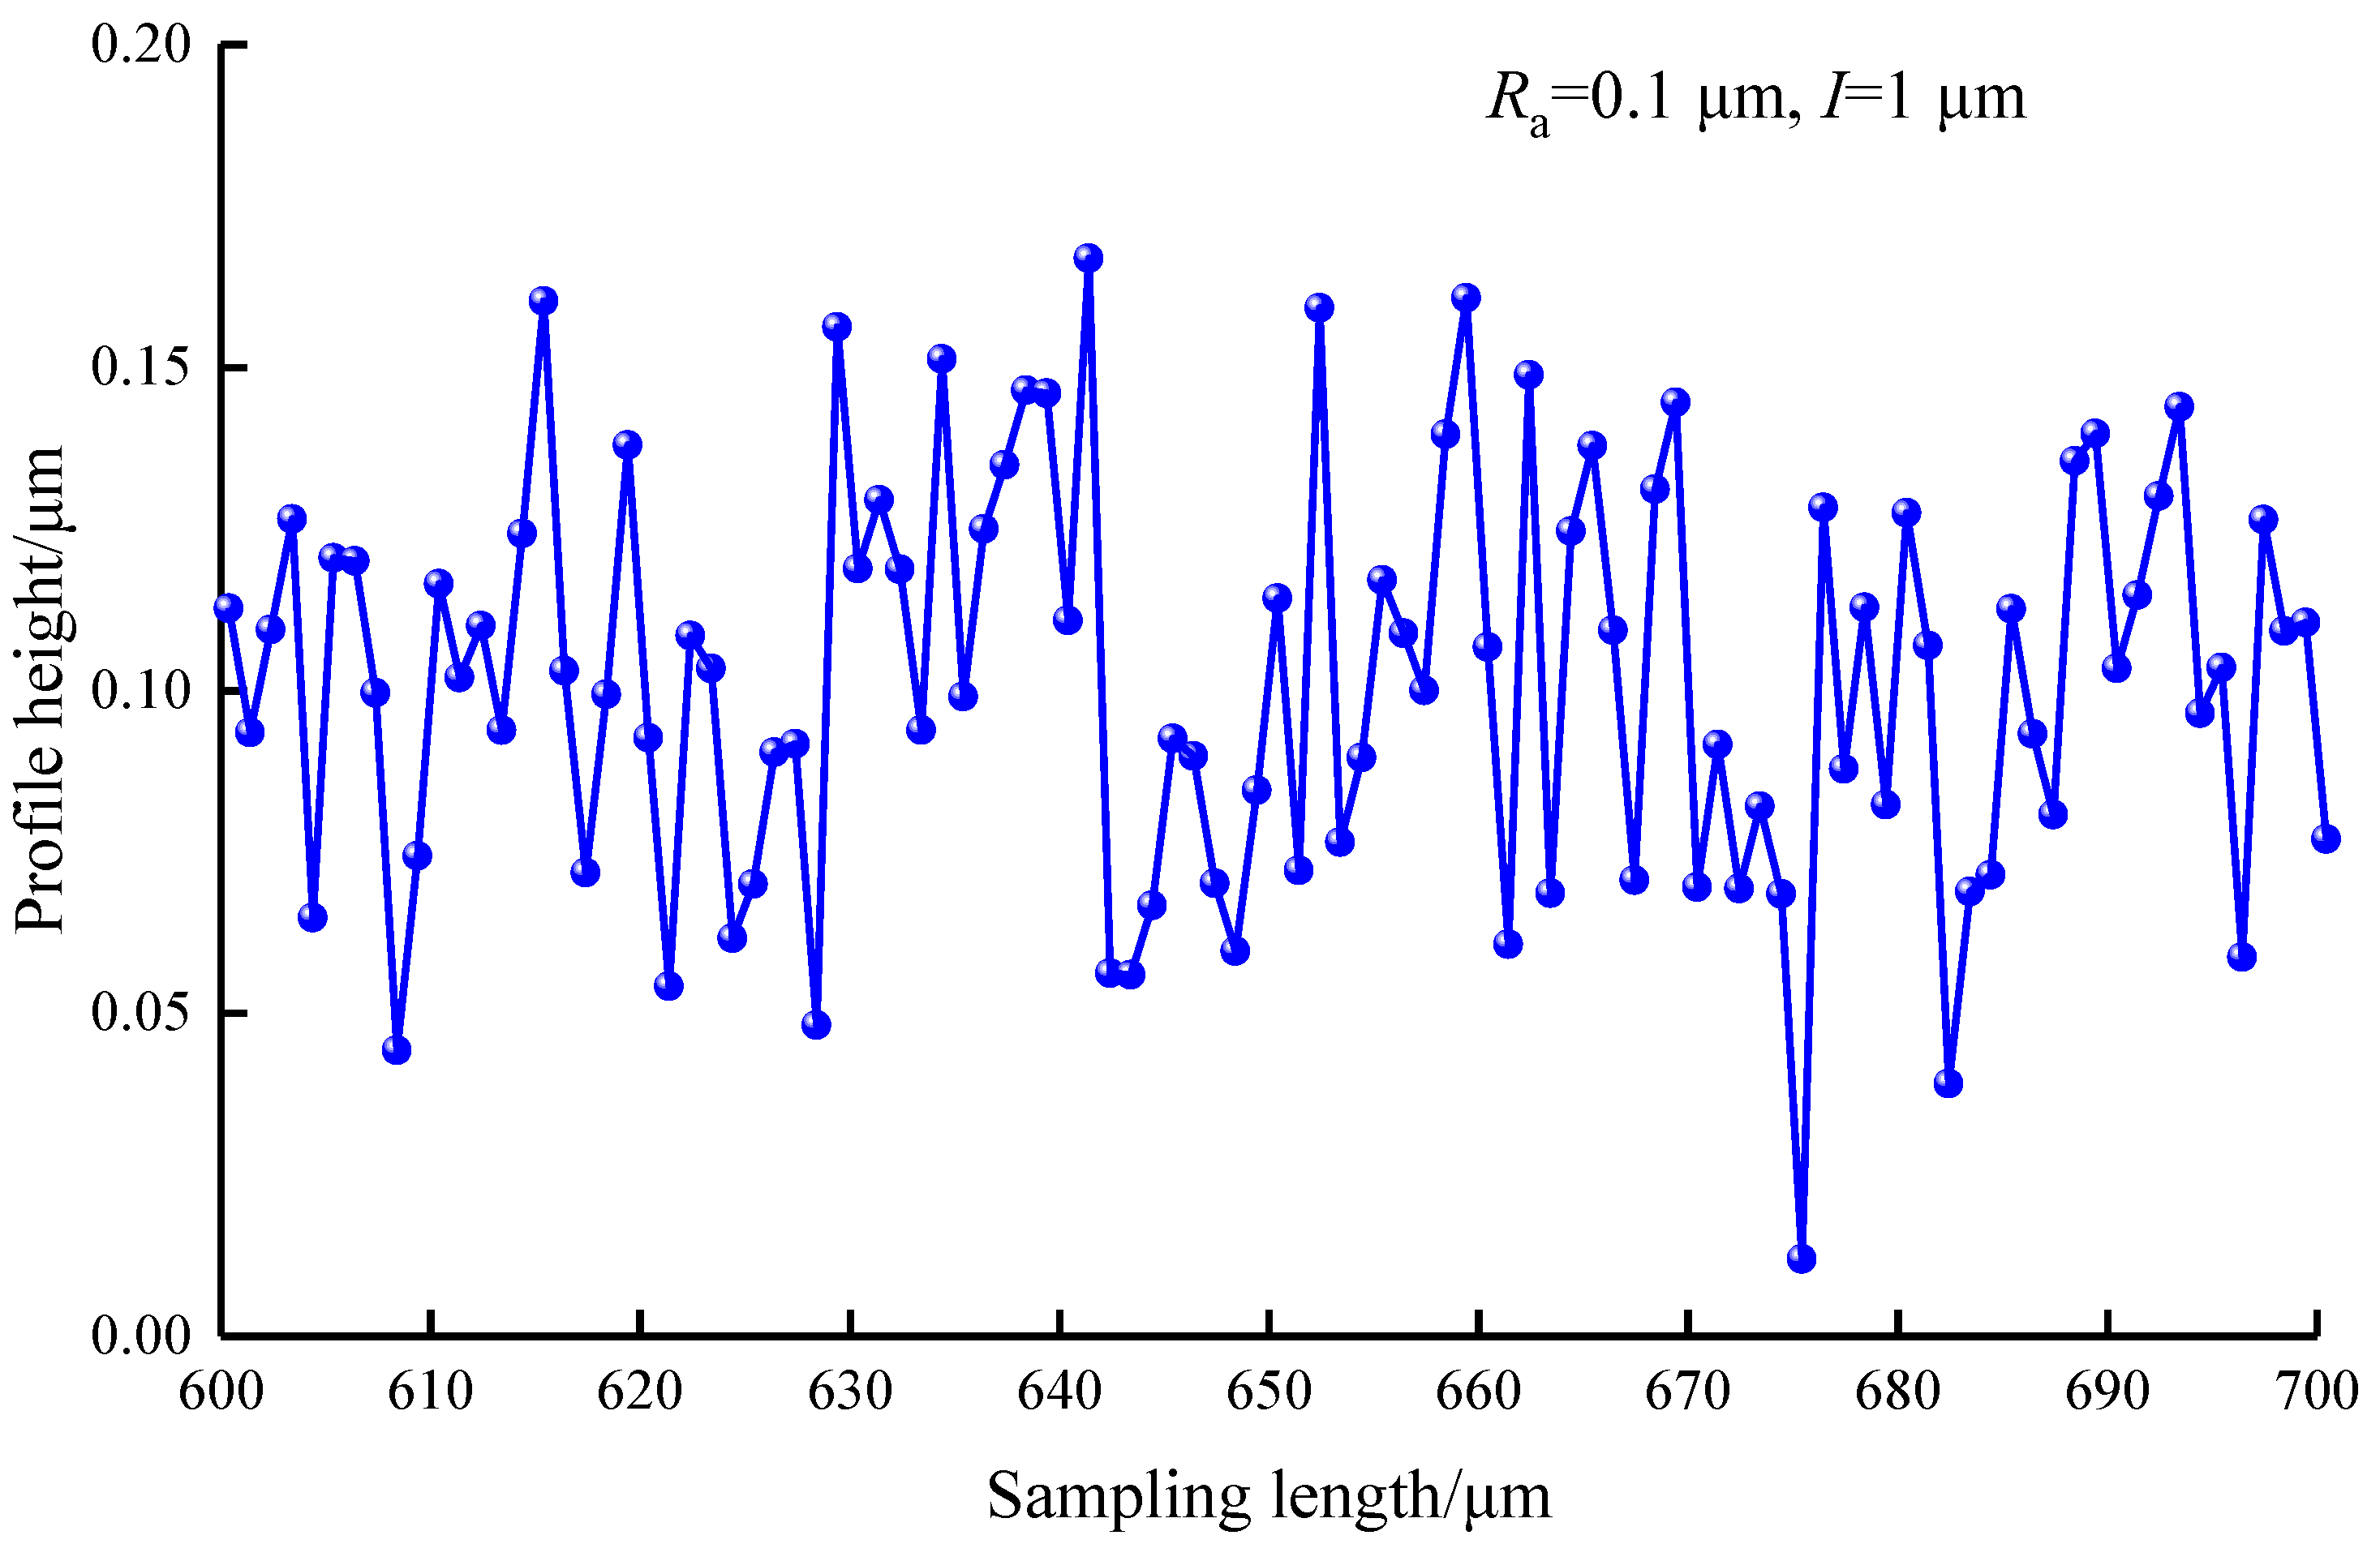
2.2.1. Profile Curve Model of Sealing Surface

Under the assumption that the actual profile height distribution curve of a rough surface follows a Gaussian distribution, Monte Carlo random normal distribution sampling was used to obtain the height sample sequences of the profile curve with equal spacing on rough surfaces Z1, Z2..., Zi, …, ZN [23]:
Z i = μ + σ ( 2 ln c 1 ) 0.5 sin 2 π c 2
The Monte Carlo random sampling method was used to simulate the sealing surface’s profile. The values of μ and σ of the random sampling for different machining accuracies of the sealing surface and corresponding roughness Ra were determined based on the principle of ±3σ by corresponding the maximum peak-to-valley distance Ry to the approximate limit range of a Gaussian distribution, as shown in Table 1.
In order to ensure that the simulated sample values of the sealing surface’s profile height conformed to the preset surface roughness as closely as possible, the mean error εμ and maximum peak-to-valley distance error εy for the sealing surface’s profile height samples were selected as the test standards, and the relative errors of μ and σ were controlled to be less than 1% by repeated sampling. εμ and εy are defined as follows:
ε μ = 1 R a | 1 / N i = 1 N Z i R a | ,
ε y = 1 R y | ( Z i , max Z i , min ) R y | ,
Based on the industry standards [29], the sampling length was selected to be 0.8 mm, the evaluation length was selected to be 1.6 mm, the sampling spacing I was selected to be 0.2, 0.4, 0.6, 0.8, and 1.0 μm, and the corresponding sample number N were 8000, 4000, 2667, 2000, and 1600, respectively. The relative errors εμ and εy were both less than 1% when the sample number was 1600–8000 for sampling profile height Zi. Figure 2 shows the profile curve of the rough surface based on Monte Carlo random normal distribution sampling when Ra = 0.1 μm and sample number was 1600 (sampling spacing I = 1.0 μm).

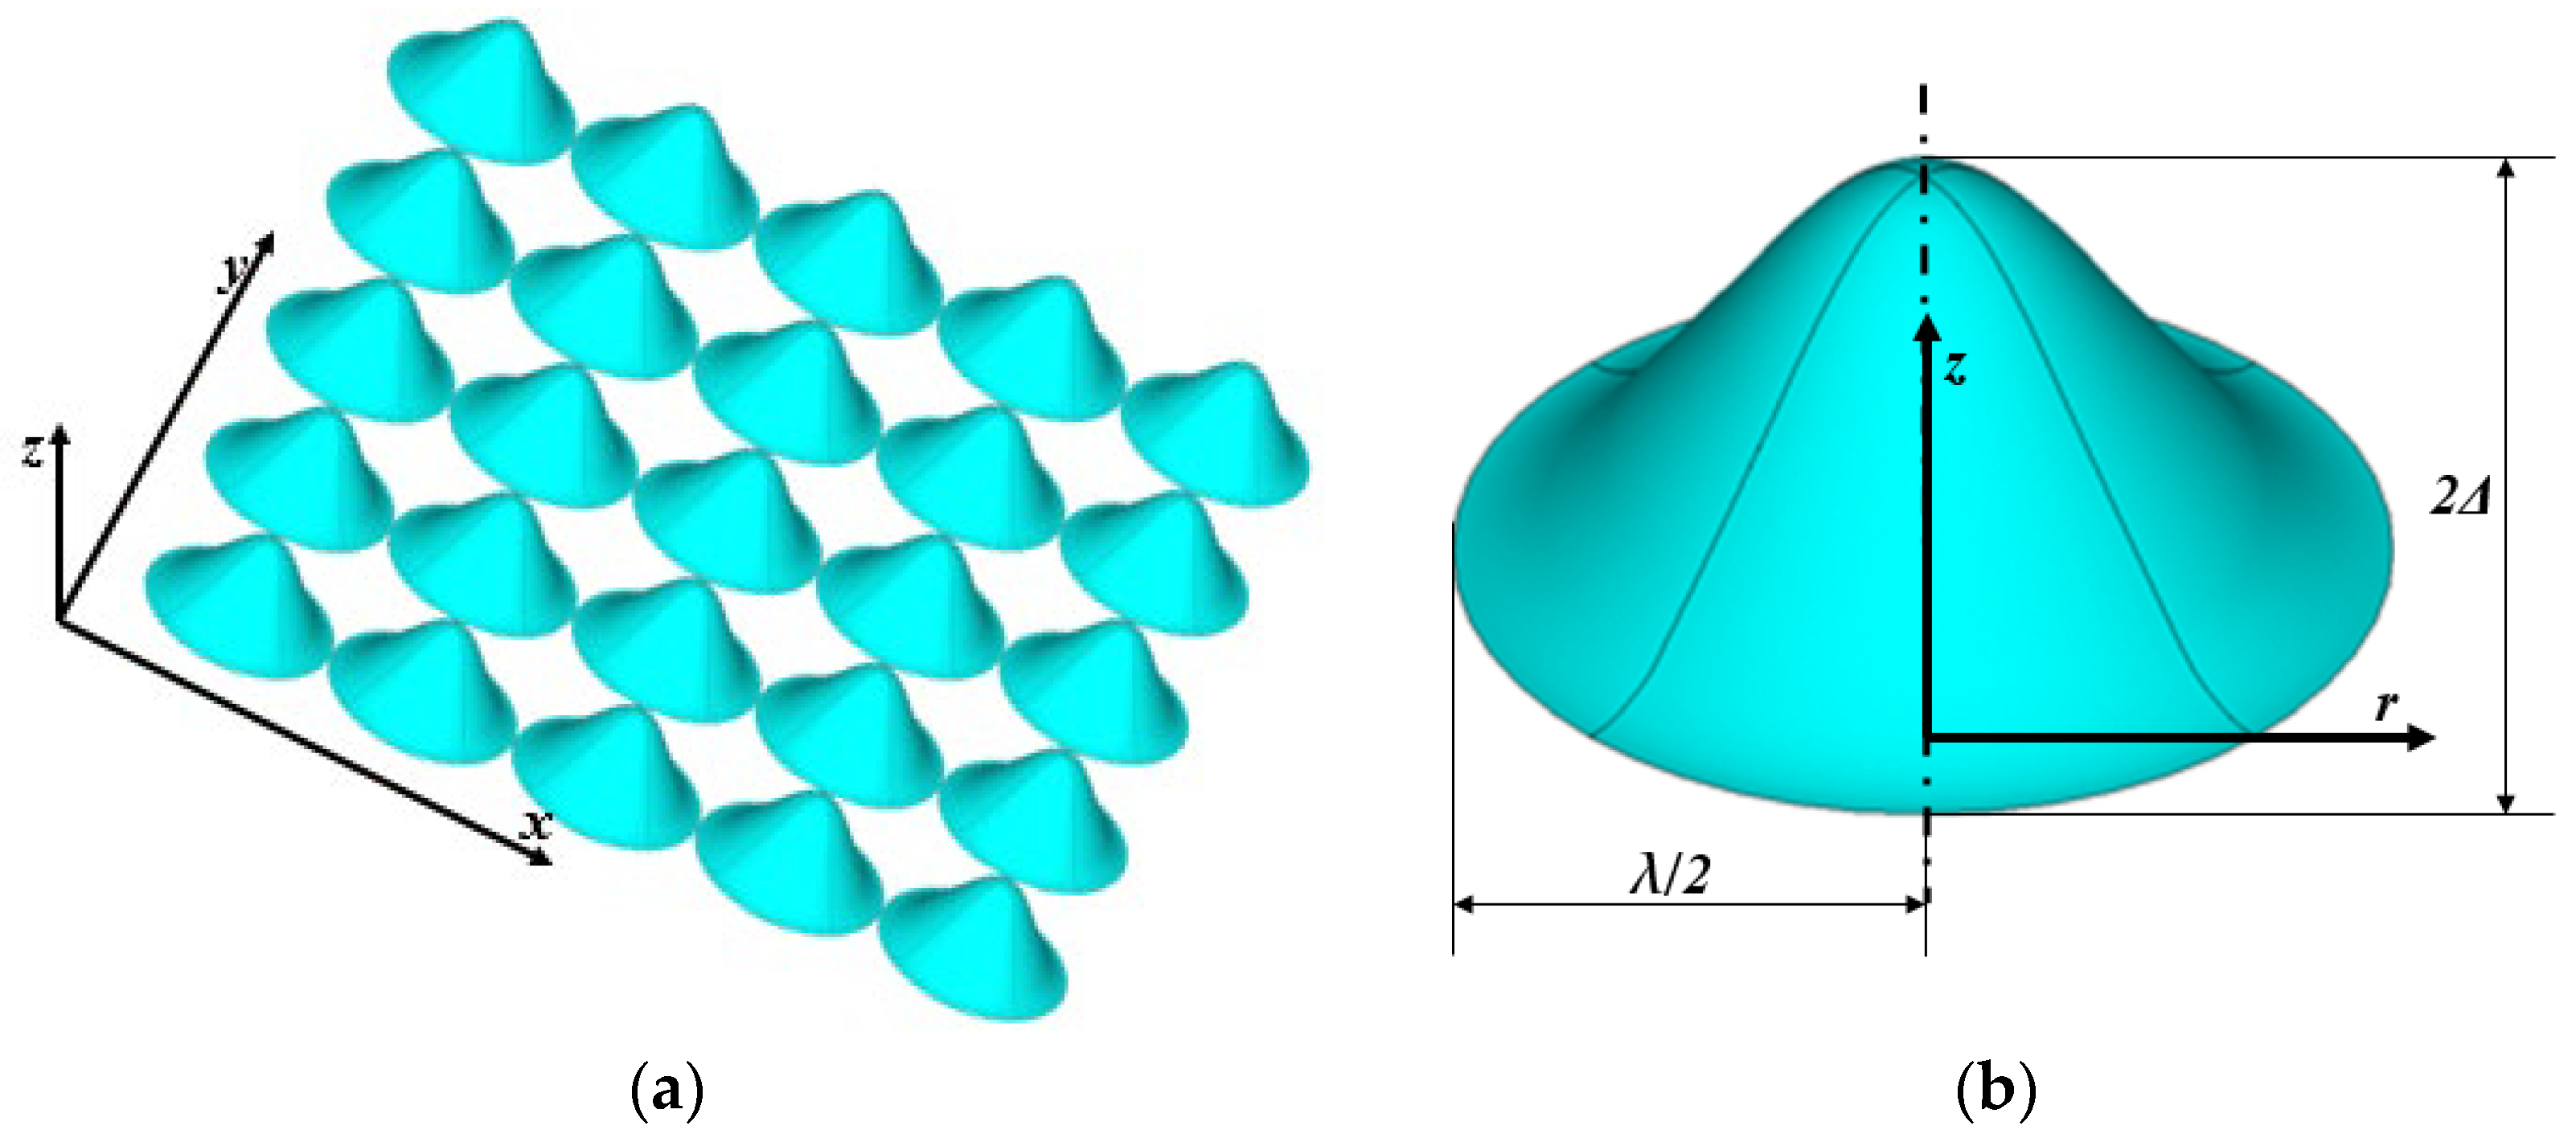
2.2.2. Parameter Calculation of Simulated Sine Wave Surface

Whether a two-dimensional, axisymmetric, or three-dimensional sine wave surface is used to generate the profile curve of a real rough surface, the key is to determine the wavelength and amplitude of the wave surface. After local magnification of the simulated profile curve of the rough surface in Figure 2, it was found that the profile curve of the rough surface contained many peaks and valleys, and the horizontal distance between adjacent peaks or valleys and the vertical distance between adjacent peaks or valleys all changed randomly, shown in Figure 3.
In order to obtain fitting parameters of the sinusoidal profile curves, the coordinates of the wave peaks and valleys were first calculated based on the coordinate sequence (xi, Zi) of the profile height. When i = 2, 3, …, N − 1, if ZiZi−1 > 0 and ZiZi+1 > 0, then the corresponding coordinate sequence (xi, Zi) of the profile height is the peak point. If ZiZi-1 < 0 and ZiZi+1 < 0, then the corresponding coordinate sequence (xi, Zi) of the profile height is the valley point. Thus, the coordinate sequences of peak points (xPj, ZPj) and valley points (xTk, ZTk) were both obtained, where j = 1, 2, …, NP, k = 1, 2, …, NT.
Then, the horizontal and vertical distances between adjacent peaks or valleys were calculated based on the coordinate sequences of the peaks and valleys:
λ P j = x P ( j + 1 ) x P j                       ( j = 1 , 2 , , N P 1 ) ,
λ T k = x T ( k + 1 ) x T k                       ( k = 1 , 2 , , N T 1 ) ,
h j = Z P j Z T j                           ( j = 1 , 2 , , N P ) ,
Finally, because λPj, λTk, and hj were all randomly distributed, their average values were used to calculate the wavelength and amplitude of the profile curve of the fitted sinusoidal curve, respectively, as follows:
λ = 1 2 ( λ P ¯ + λ T ¯ ) = 1 2 ( 1 N P 1 j = 1 N P 1 λ P j + 1 N T 1 k = 1 N T 1 λ T k ) ,
2 Δ = h ¯ = 1 N P j = 1 N P h j ,
Table 2 shows the values of NP, NT, λ P ¯ , λ T ¯ , h ¯ , λ, Δ, NP/N, NT/N, λ/I, and Δ/Ra calculated from the simulated profile curves with different surface roughness values and sample numbers. By analyzing the data in Table 2, it is easy to observe the following: (1) with an increase in sampling spacing, average horizontal distance between adjacent peaks (or valleys) gradually increased; (2) with an increase in the surface roughness, average vertical distance between adjacent peaks and valleys increased; (3) number of wave peaks was approximately equal to number of wave valleys and was about 1/3 of the sample number; (4) fitted sinusoidal wavelength of rough surface profile was about three times the sampling spacing; (5) fitted sinusoidal amplitude of roughness profile was about 0.28 times the surface roughness.

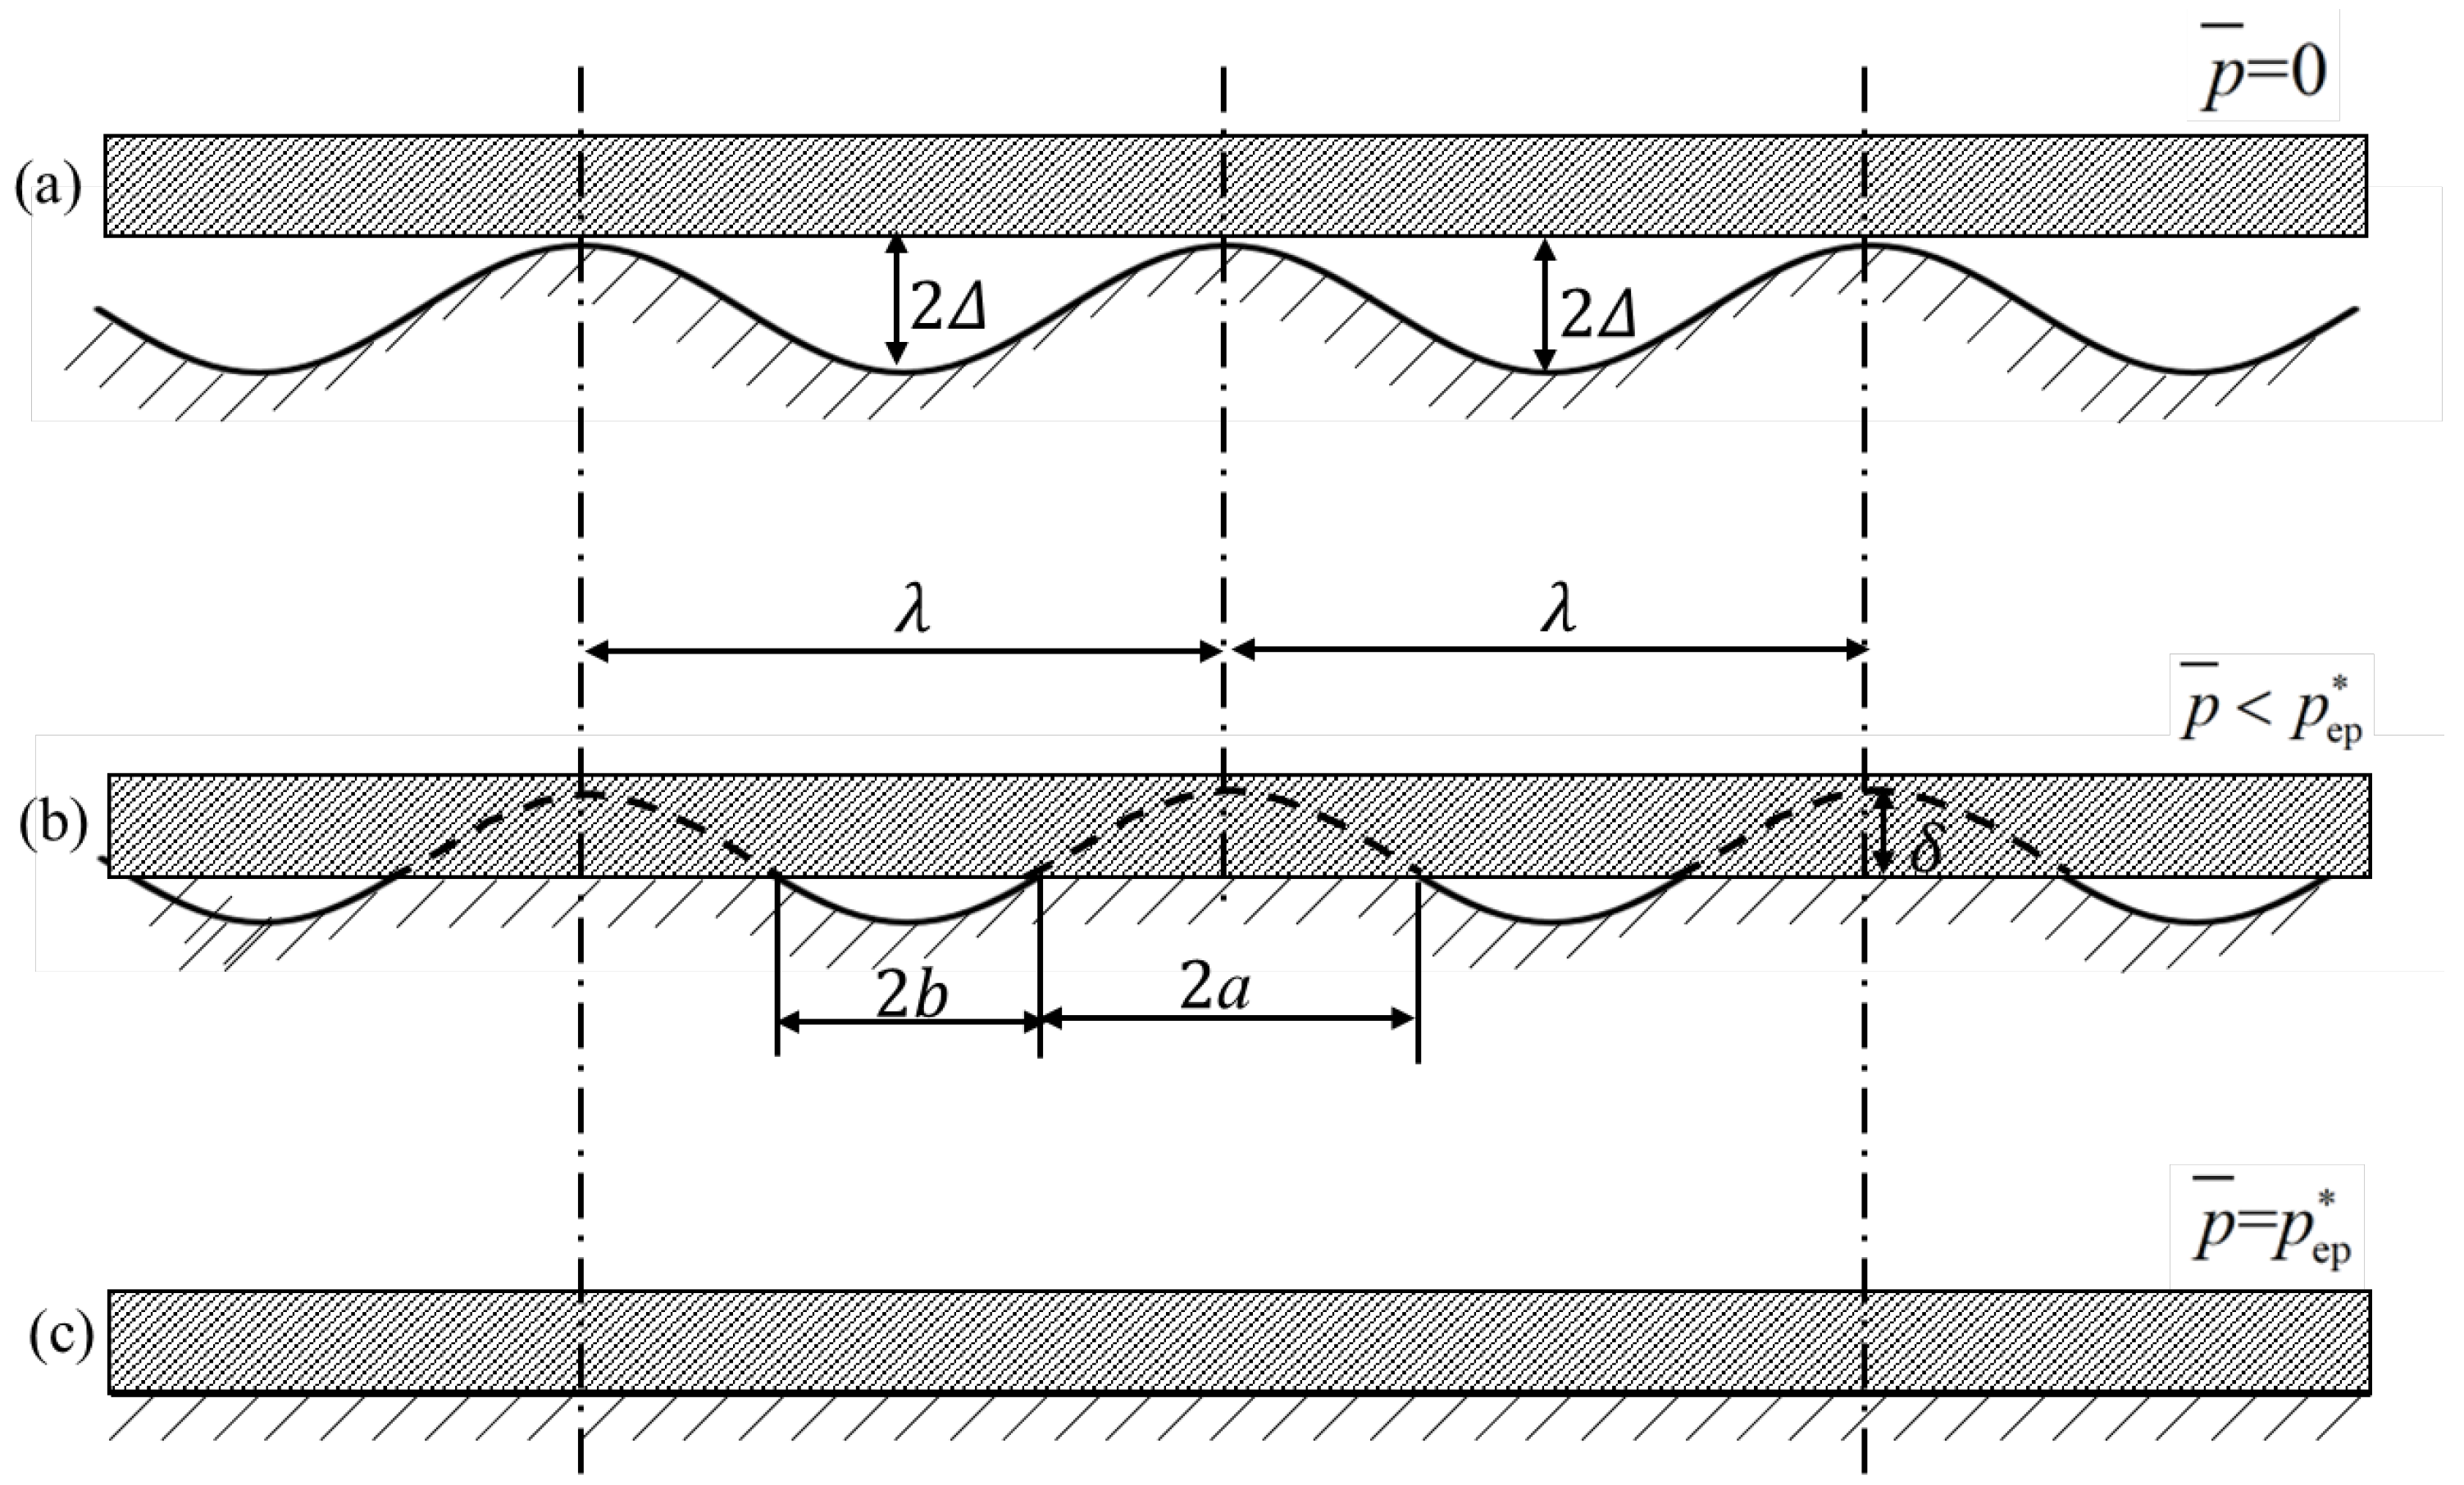
2.2.3. Contact Model of Axisymmetric Sinusoidal Micro-Convex Surface

Assuming that the actual rough surface is formed by a continuous axisymmetric sinusoidal micro-convex function with wavelength λ and amplitude Δ, as shown in Figure 4, then the height of a single sinusoidal micro-convex surface can be described as
Z ( r ) = Δ [ 1 + cos ( 2 π r λ ) ] ,             0 r λ 2 ,
Combined with the principle of equivalent simulation in contact mechanics [30], the microscopic contact between the two rough surfaces is equivalent to the contact between the axisymmetric sinusoidal micro-convex surface with the equivalent elastic modulus E* and a rigid plane; E* can be calculated as follows
E * = E 1 E 2 E 1 ( 1 ν 2 2 ) + E 2 ( 1 ν 1 2 ) ,
Figure 5 shows the simulated microscopic contact process between the axisymmetric sinusoidal micro-convex body and the rigid plane in the xoz cross section, where (a) denotes initial contact, (b) denotes partial contact, and (c) denotes complete contact. With an increase in geometric average pressure p ¯ , the contact between the sinusoidal micro-convex body and the rigid plane changed from point contact to surface contact and finally developed into complete contact without clearance. The flattening distance of the sinusoidal micro-convex body gradually increased, while the clearance between the contact surfaces gradually decreased until the sinusoidal surface completely fit the rigid plane.
According to the study of Saha et al. [28], the interactions between adjacent sinusoidal micro-convex bodies and the influence of the sinusoidal micro-convex base were effectively considered by setting a constraint boundary at the outer radius of the sinusoidal micro-convex base. The bilinear hardening deformation characteristics of micro-convex bodies were also considered by setting the tangent modulus to 0.01 E*. Through several finite element parameterization studies, they proposed an empirical formula for predicting the elastic–plastic contact state of the axially symmetric sinusoidal micro-convex body based on two dimensionless parameters: E*/Sy and Δ/λ. The applicable range was 25 MPa < Sy < 40,000 MPa, 50 GPa < E* < 400 GPa, and 0.00005 < Δ/λ < 0.0125. According to the above research results, the fitted sinusoidal wavelength of the rough surface profile was about three times the sampling spacing, and the fitted sinusoidal amplitude of the roughness profile was about 0.28 times the surface roughness. Thus, Δ/λ should satisfy
0.00005 < Δ λ = 0.28 R a 3 I < 0.0125 .
That is, the sampling spacing should satisfy the following condition:
7.47 R a < I < 1886 . 6 R a .
According to the research conclusions in the literature [28] and in combination with Equation (11), a prediction formula for the actual elastic–plastic contact area was obtained between a rigid plane and a single axisymmetric sinusoidal micro-convex body that was based on preset surface roughness and sampling spacing:
A ep = A ep * π ( λ 2 ) 2 = 4.5 I 2 ( p ¯ p ep * ) { 0.64 + [ 1.14 1 1.25 ( 0.28 R a 3 I E * S y ) 0.32 ] } ( p ¯ / p ep * ) { sin 1 [ ( p ¯ p ep * ) 0.16 ] } [ 1 + 1 200 ( 0.28 R a 3 I E * S y ) ] ,
In Equation (13), p ep * , the critical contact pressure for a single sinusoidal convex body in complete elastoplastic contact with a rigid plane can be calculated by the following formula:
p ep = 0.0469 0.653 ( 0.28 R a 3 I E * S y ) 0.0027 + 0.22 ( 0.28 R a 3 I E * S y ) 1.6 ( 0.28 R a 3 I E * S y ) 0.141 π E * R a I .

2.2.4. Micro-Leakage Model for Premium Connections

After obtaining the actual contact area Aep of a single sinusoidal micro-convex body, the contact half-width and non-contact half-width of a single micro-convex body in the cross section and the flattening distance of the micro-convex body can be calculated from Figure 5 using the following equations:
a = A ep π ,                             b = λ 2 a = λ 2 A ep π ,
δ = 2 Δ δ * = 2 Δ Z ( a ) = Δ [ 1 cos ( 2 π λ A ep π ) ] ,
Considering that the contact pressure on the sealing surface is evenly distributed along the circumferential direction of the tubing and casing strings, the total circumferential leakage width on the sealing surface is obtained as follows:
B = π D s × 2 b λ = π D s × 2 λ ( λ 2 A ep π ) = π D s ( 1 2 λ A ep π ) ,
Considering that the cross section of the leakage channel is still a sinusoidal curve, the height function of the leakage channel can be expressed as
Z L ( r ) = Z ( r ) δ ,             0 r b .
Substituting Equations (9) and (16) into Equation (18),
Z L ( r ) = Δ [ cos ( 2 π r λ ) + cos ( 2 π λ A ep π ) ] ,             0 r b .
Furthermore, the radial average leakage height on the sealing surface for the premium connection can be calculated as follows:
H = 1 b 0 b Z L ( r ) d r = Δ b [ λ 2 π sin ( 2 π r λ ) + r cos ( 2 π λ A ep π ) ] 0 b         = Δ [ λ 2 π ( λ 2 A ep π ) 1 sin ( 2 π λ ( λ 2 A ep π ) ) + cos ( 2 π λ A ep π ) ] ,
After B and H are both known, the volume leakage rate of the premium connection can be calculated according to the parallel plate model [31]:
Q v = B H 3 ( p in p out ) 12 L s η = π D s ( p in p out ) 12 L s η ( 1 2 λ A ep π ) × { Δ [ λ 2 π ( λ 2 A ep π ) 1 sin ( 2 π λ ( λ 2 A ep π ) ) + cos ( 2 π λ A ep π ) ] } 3           = D s L s ( p in p out ) η g ( A ep , Δ , λ )
In Equation (21),
g ( A ep , Δ , λ ) = π 12 ( 1 2 λ A ep π ) { Δ [ λ 2 π ( λ 2 A ep π ) 1 × sin ( 2 π λ ( λ 2 A ep π ) ) + cos ( 2 π λ A ep π ) ] } 3 ,
By analyzing Equation (13) and (21) simultaneously, it can be found that, when material parameters E* and Sy of the sealing surface, the roughness of the sealing surface, and the sampling length (which determine λ an Δ) are all given, g is only related to the nominal average contact pressure on the sealing surface, i.e.,
g = g ( p ¯ ) .
In this case, Equation (21) can be simplified to
Q v = D s L s ( p in p out ) η g ( p ¯ ) .
Generally, if the connection is ideally centered, the contact pressure distribution on the sealing surface is axially symmetric, but the contact pressure on sealing surface is usually non-uniform along the axial direction of the pipe string, especially for a spherical premium connection. At this point, the cross-sectional area of the leakage channel along the axial direction of the string is non-uniform, so the sealing structure can be divided into several contact elements along the axial direction. When the number of contact elements is large enough, the sealing contact pressure in a single contact element can be regarded as a constant. Therefore, for each contact element, the leakage rate can be calculated by Equation (21). As an example, for the cone-to-cone sealing structure, the sealing structure is divided into several sealing contact elements equally along the axial direction of the string, which are numbered 1, 2, 3, …, k, …, n, as shown in Figure 6.
Then, the sealing length of each sealing element is
L s k = D smax D smin 2 n s i n γ s ,
The average sealing diameter of the kth sealing element is
D s k = D smin + ( k 1 2 ) D smax D smin n ,
It is assumed that the average contact pressure for the kth sealing contact element is p k ¯ , which consists of two parts: a contact pressure generated by the interference fit between sealing surface and a contact pressure induced by internal pressure in the string [23]:
p k ¯ = [ ( p k ¯ ) δ r + ( p k ¯ ) p in ] cos γ s         = [ δ r E ( D sk 2 d 2 ) ( W 2 D sk 2 ) D sk 3 ( W 2 d 2 ) + p in d 2 ( W 2 D sk 2 ) D sk 2 ( W 2 d 2 ) ] cos γ s ,
Then, the actual contact area Aepk of a single micro-convex body in every contact element can still be calculated by Equation (13), and, thus, g k ( p k ¯ ) can be obtained by Equation (21). Assuming that the pressure at the inlet and outlet of the kth sealing contact element are pk−1 and pk, respectively, the leakage rate Qvk can also be obtained by Equation (23) as follows:
Q vk = D s k L s k ( p k 1 p k ) η g k ( p k ¯ ) .
Thus, the pressure at the outlet of the kth sealing contact element is
p k = p k 1 L s k η D s k g k ( p k ¯ ) Q vk .
According to Equation (28), the outlet pressure of the first sealing contact element can be calculated by the internal gas pressure in the string:
p 1 = p in L s 1 η D s 1 g 1 ( p 1 ¯ ) Q v 1 .
Based on the boundary conditions of gas leakage pressure along sealing surface, it can be known that the outlet pressure of the kth sealing contact element is the inlet pressure of the (k + 1)th sealing contact element, so the outlet pressures of the 2nd, 3rd, …, nth sealing contact elements can be obtained, e.g.,
p 2 = p 1 L s 2 η D s 2 g 2 ( p 2 ¯ ) Q v 2 ,
p 3 = p 2 L s 3 η D s 3 g 3 ( p 3 ¯ ) Q v 3 ,
and so on. By adding the left and right sides of Equations (29)–(31), we can obtain the outlet pressure of the 3rd sealing contact element:
p 3 = p in L s 1 η D s 1 g 1 ( p 1 ¯ ) Q v 1 L s 2 η D s 2 g 2 ( p 2 ¯ ) Q v 2 L s 3 η D s 3 g 3 ( p 3 ¯ ) Q v 3 .
By analogy, the outlet pressure of the nth sealing contact element can be obtained:
p out = p in L s 1 η D s 1 g 1 ( p 1 ¯ ) Q v 1 L s 2 η D s 2 g 2 ( p 2 ¯ ) Q v 2 L s 3 η D s 3 g 3 ( p 3 ¯ ) Q v 3                 L sk η D sk g k ( p k ¯ ) Q vk L sn η D sn g n ( p n ¯ ) Q vn .
According to the continuity condition of gas flow in the leakage passage, the following must be satisfied:
Q v 1 = Q v 2 = Q v 3 = = Q vk = Q vn = Q v .
Finally, the gas leakage rate Qv for a premium connection can be obtained from Equations (33) and (34) as follows:
Q v = n ( p in p out ) L s 1 η D s 1 g 1 ( p 1 ¯ ) + L s 2 η D s 2 g 2 ( p 2 ¯ ) + L s 3 η D s 3 g 3 ( p 3 ¯ ) + + L sk η D sk g k ( p k ¯ ) + L sn η D sn g n ( p n ¯ )           = n ( p in p out ) k = 1 n L sk η D sk g k ( p k ¯ ) .

3. Results and Discussion

3.1. Basic Parameters

A 177.8 mm × 10.36 mm P110 casing with a cone-to-cone-type premium connection was chosen for the example analysis [23]. Its basic parameters for calculating the leakage rate of the premium connection are listed in Table 3.

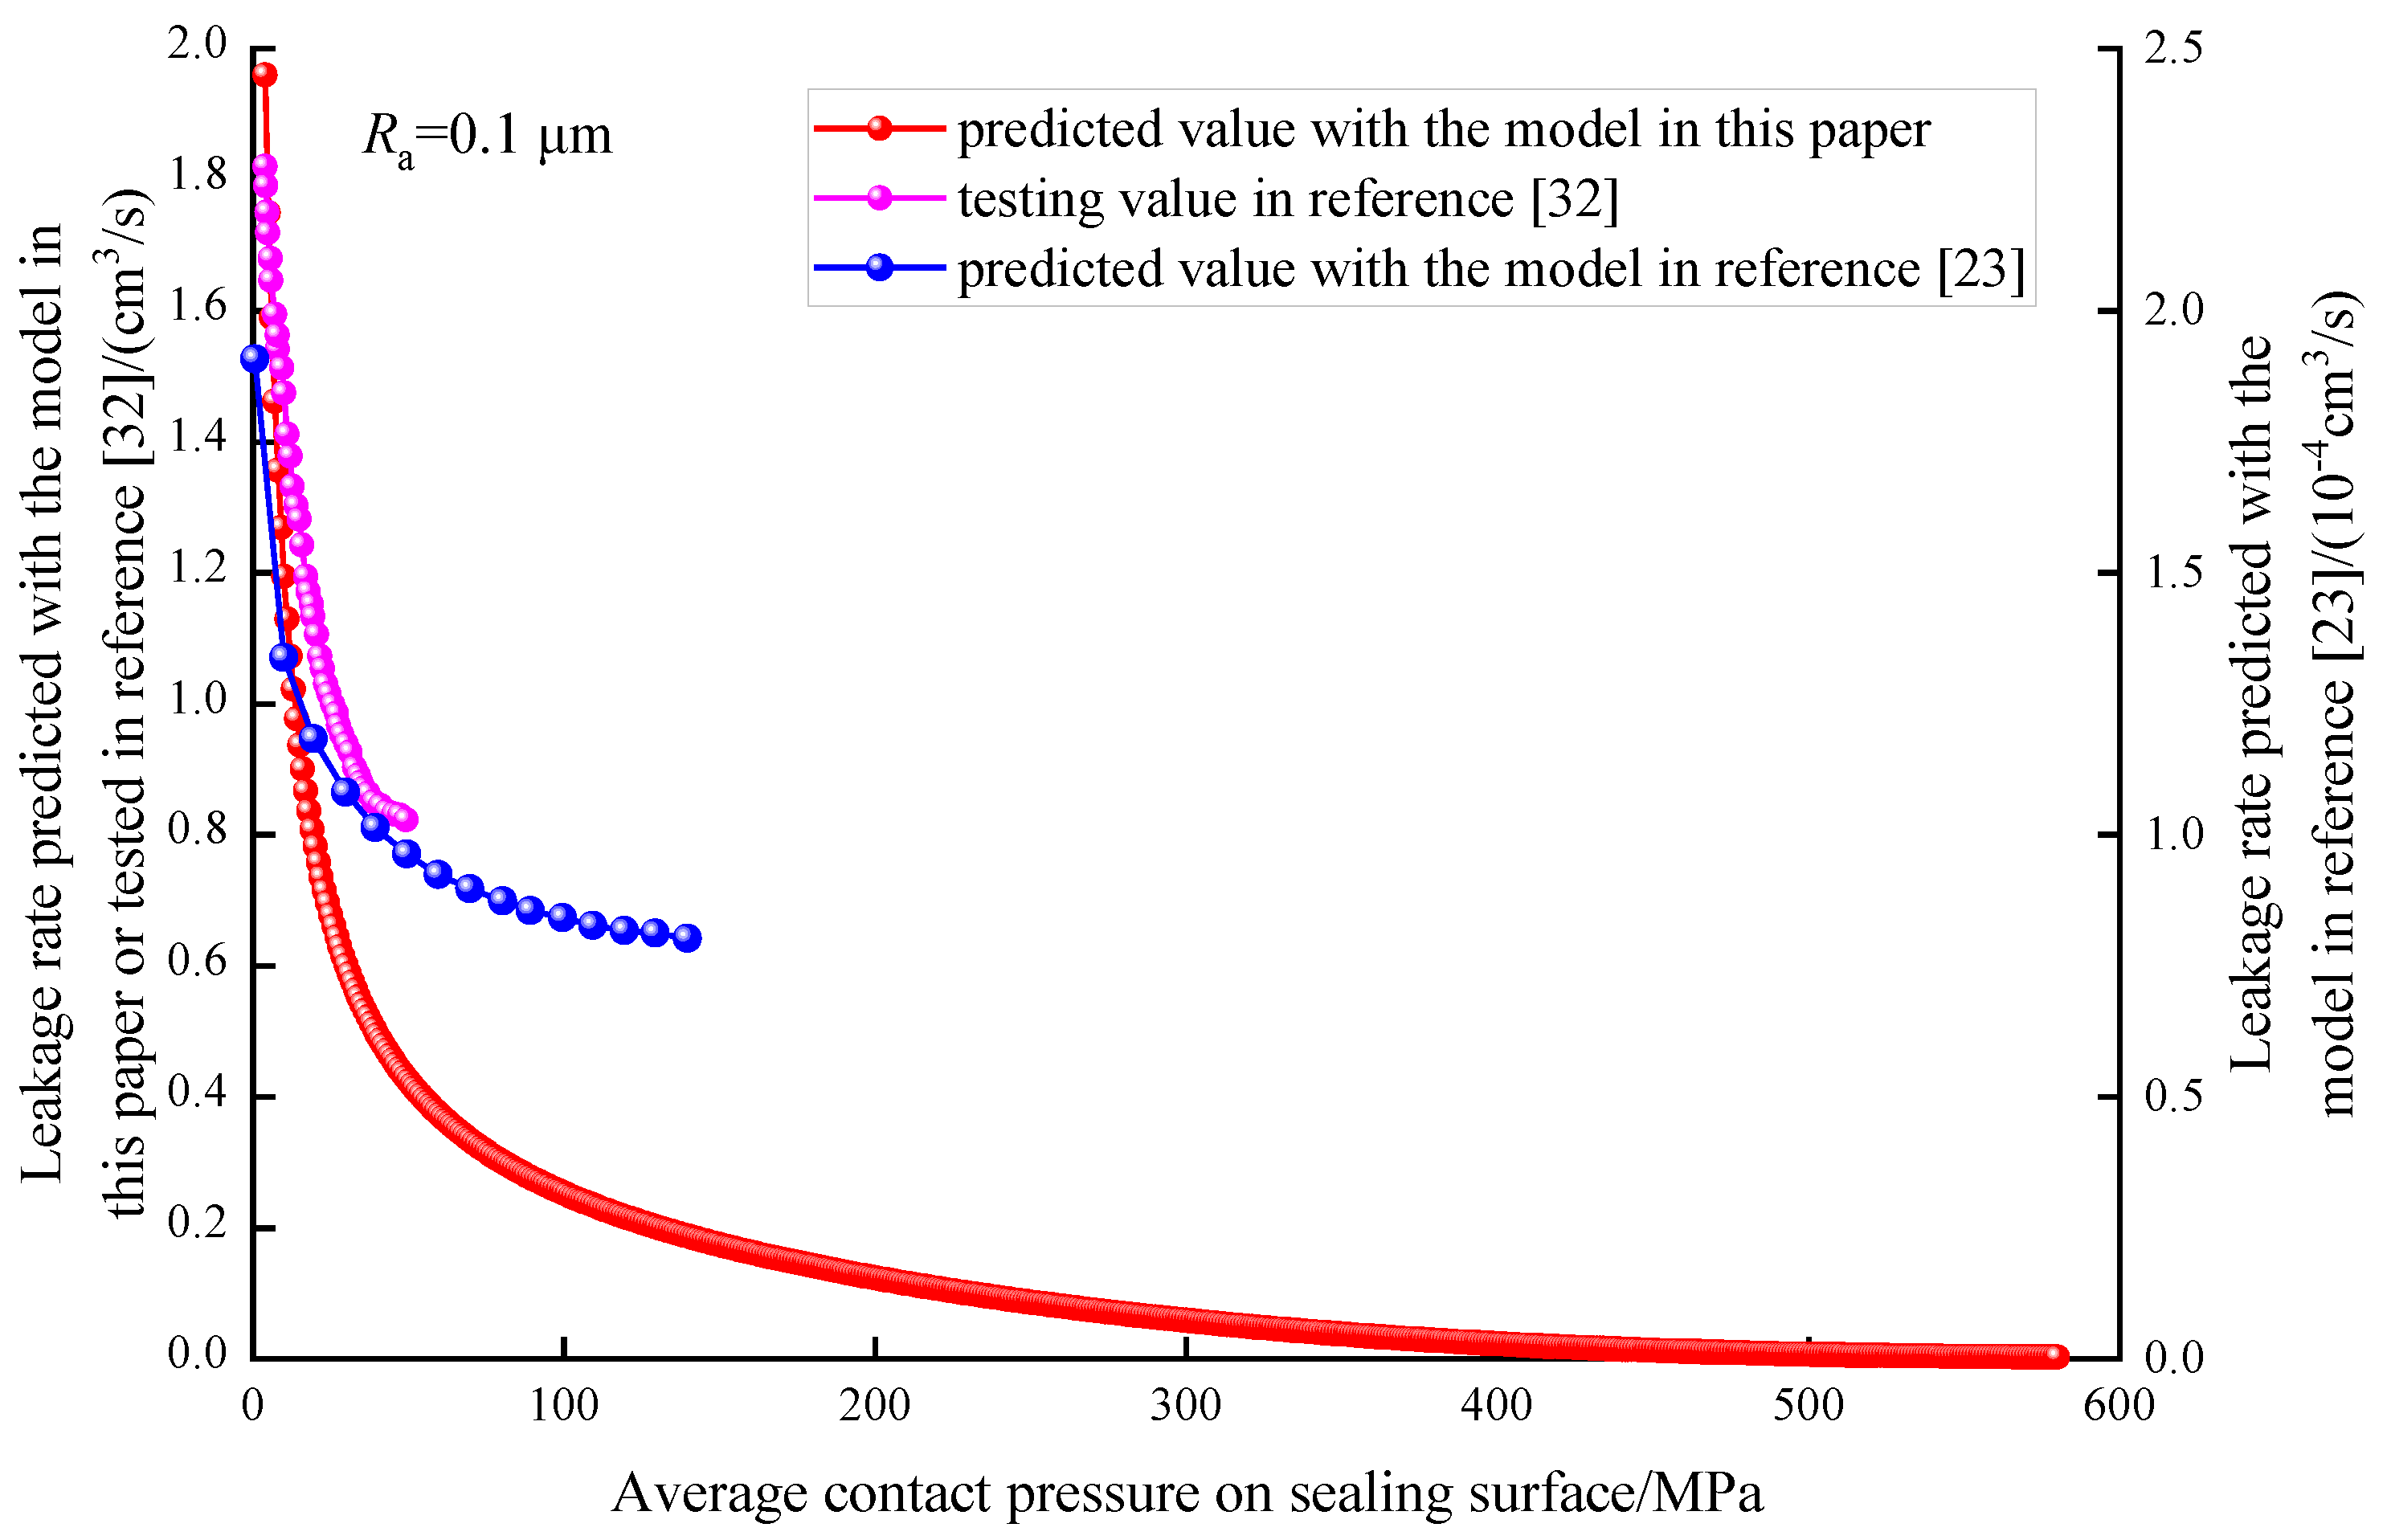
3.2. Model Validation

The roughness Ra of the sealing surface was set to be 0.1 μm, and the sampling spacing I was 0.8 μm. First, model validation analysis was carried out. Figure 7 compares the theoretical leakage rate predicted by the model in this paper with the predicted value by a model in the literature [23] and previously reported experimental values in Ref. [32]. The proposed model could predict the leakage rate with a consistent variation trend to those of the other model predictions and test results, although there were some numerical differences because of the testing condition not exactly disagreeing with the calculation condition. Meanwhile, under the same average contact pressure on sealing surface, the predicted leakage rate with the model in this paper is closer to the testing value in Ref. [32], which indicates that it is more reasonable to simulate the elastic–plastic microscopic contact problem between sealing surfaces for a premium connection with sinusoidal convex body assumptions compared with a conical micro-convex body in the literature [23]. In addition, it is also obvious that, when the average contact pressure on the sealing surface increases to about 580 MPa, that is close to two times the yield strength of contact material 250 MPa; the actual leakage rate approaches nearly zero finally, which is conformed to the actual situation. Consequently, the model presented in this paper was in better agreement with the experimental results, indicating its correctness and reliability.

3.3. Results Analysis

Considering different amounts of radial interference between sealing surfaces, the average contact pressure, total circumferential leakage width, radial average leakage height on the sealing surface for each axial sealing contact unit, and gas leakage volume rate of the premium connection were obtained by the model proposed in this paper, and the results are shown in Figure 8a–d.
Figure 8a shows that average contact pressure had an uneven axial distribution for each sealing contact element, and average contact pressure increased with an increase in radial interference between sealing surfaces. Figure 8b,c shows that, under the influence of unevenly distributed contact pressure, the total circumferential leakage width and radial average leakage height for each sealing contact element were also uneven, and both decreased with an increase in radial interference between the sealing surfaces. Figure 8d shows that the gas leakage volume rate of the premium connection decreased exponentially with an increase in radial interference between sealing surfaces.
Comprehensive analysis of Figure 8a–d shows that, when the sealing surface roughness was constant, increasing the radial interference between the sealing surfaces could help to reduce the leakage channel cross-sectional area, significantly reducing the leakage rate and improving the gas sealing performance of the premium connection. Figure 9 compares the influence of average contact pressure on the sealing surface on the leakage rates for two roughness values.
Figure 9 shows that the influence of roughness on the leakage rate was not monotonic due to the elastic–plastic deformation of the sinusoidal micro-convex body on the sealing surface. When the average contact pressure on the sealing surface p ¯ was less than 30 MPa, the leakage rate with Ra of 0.1 μm is obviously lower than that with Ra of 0.4 μm. When p ¯ was between 30 and 220 MPa, the thin and tall micro-convex body with a larger roughness was more likely to produce plastic deformation and fill the leakage channel, so its leakage rate was relatively low. However, when p ¯ was higher than 220 MPa, the dumpy micro-convex with a smaller roughness was more likely to produce plastic deformation, while the thin and tall micro-convex body with a larger roughness was more and more difficult to flatten, so its leakage rate was relatively high. However, in general, the smaller the roughness, the faster the sealing surface entered a completely plastic contact state, completely locking the leakage channel between the sealing surfaces. Assuming that the critical allowable leakage rate of the premium connection was 0.9 cm3/15 min (0.001 cm3/s) based on ISO13679, the critical average contact pressure on the sealing surface should be greater than 366 and 580 MPa for roughness values of 0.1 and 0.4 µm, respectively. During sealing parameters design for premium connections, it is very convenient to use this critical p ¯ for sealing parameters optimization. Meanwhile, in order to improve the gas sealing performance of a premium connection, the machining accuracy of the sealing surface should be improved properly to reduce sealing surface roughness.

4. Conclusions

(1)
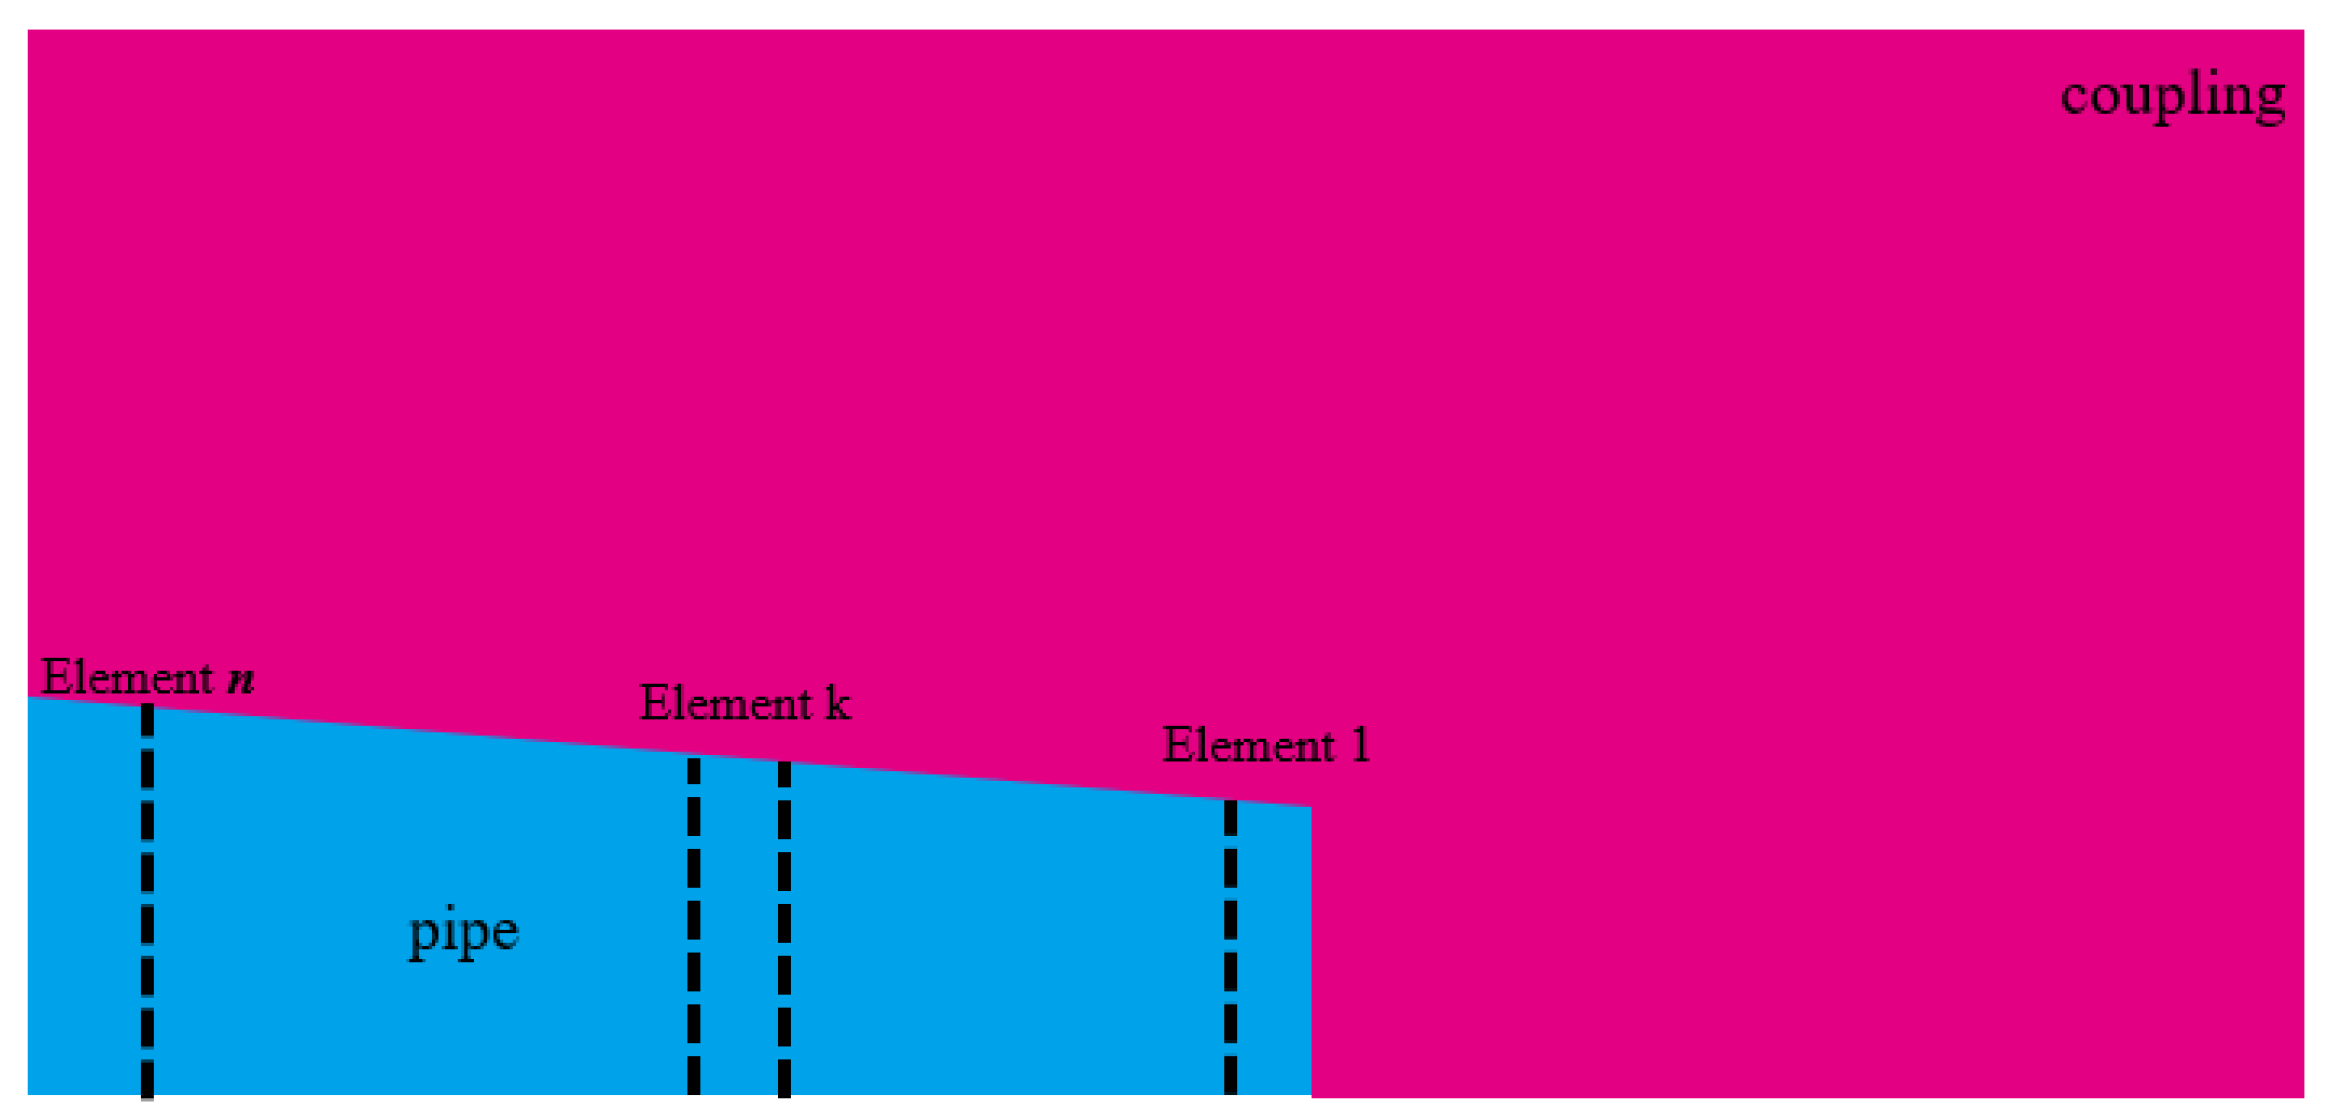
A semi-theoretical model to quantitatively predict leakage rate of tubing and casing premium connections has been proposed based on sinusoidal contact simulation on rough surfaces. The geometric parameters of the sealing surface profile approximated by a sinusoidal micro-convex surface were obtained based on the random normal distribution sampling method. With the actual area prediction formula for the elastic–plastic contact of an axisymmetric sinusoidal micro-convex body, the circumferential leakage width and radial average leakage height of the micro-leakage channel between sealing surfaces were acquired. The actual micro-leakage rate of the premium connection was derived by dividing the sealing structure into a series of sealing contact units along the axial direction of connection and using the boundary conditions of the fluid leakage pressure and the continuity conditions of the leakage rate of each unit.
(2)
A cone-to-cone-type premium connection was taken as an example investigation to validate the model and reveal the sealing and leakage characteristics of a connection.
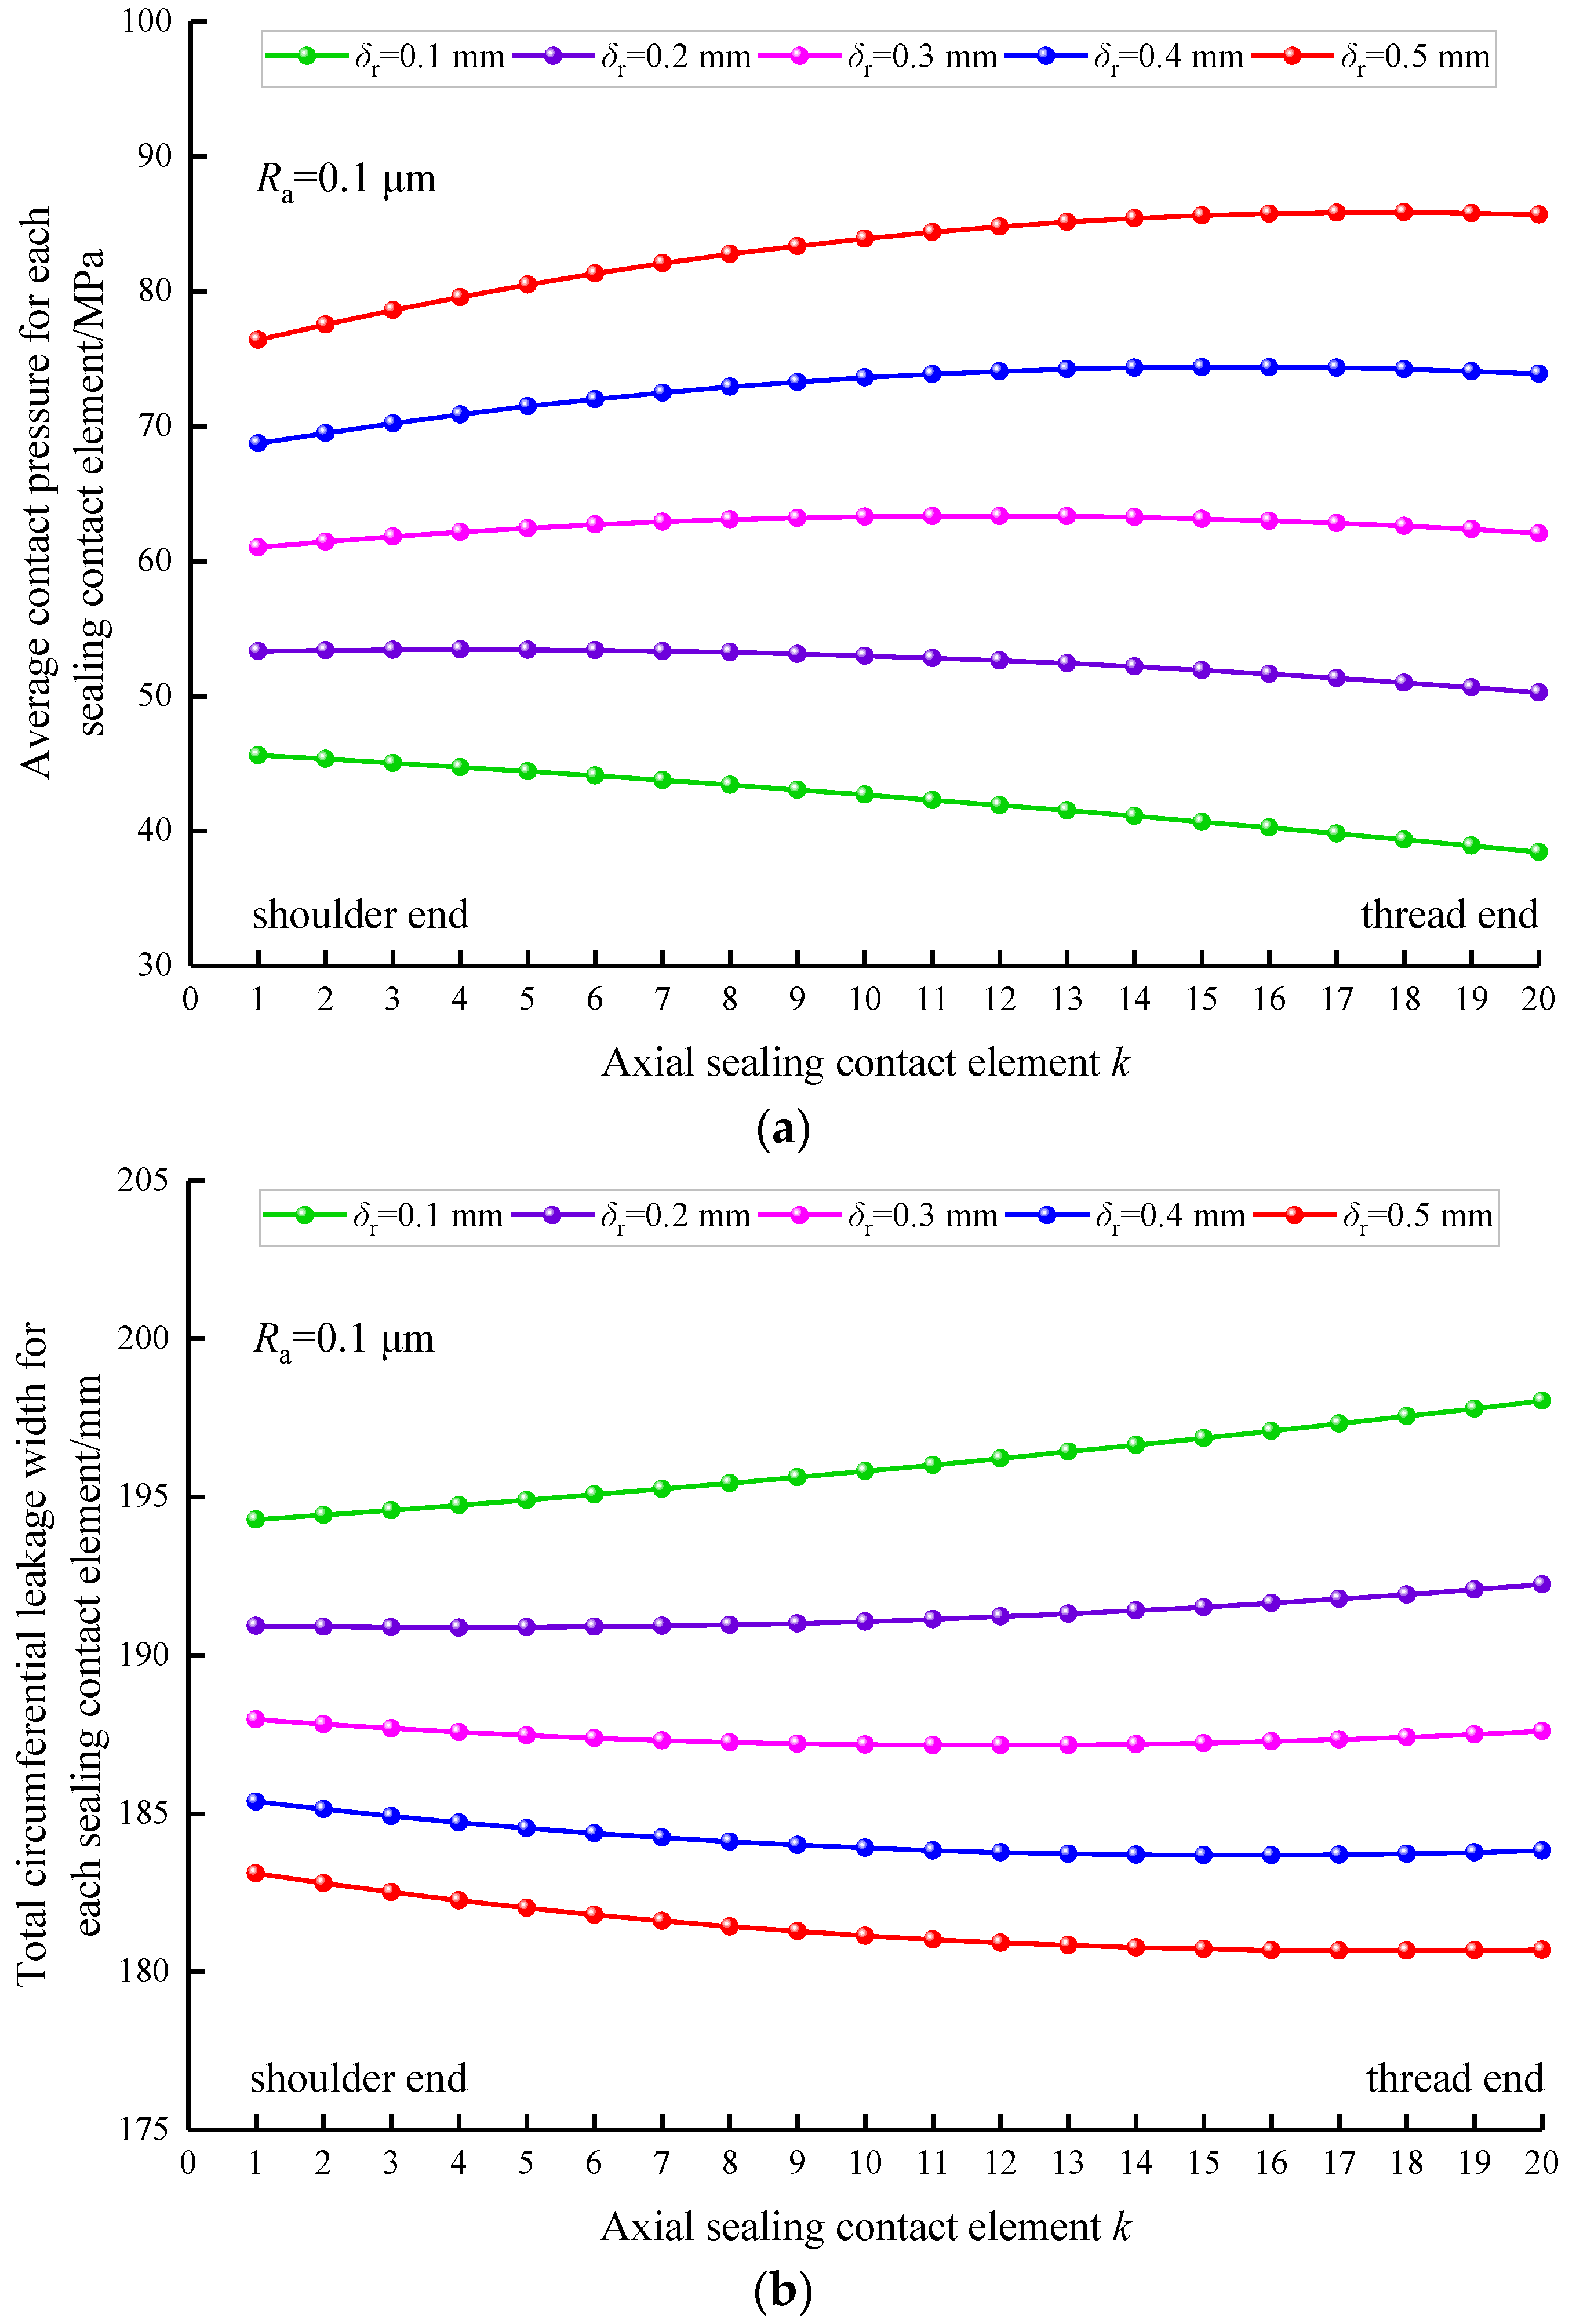
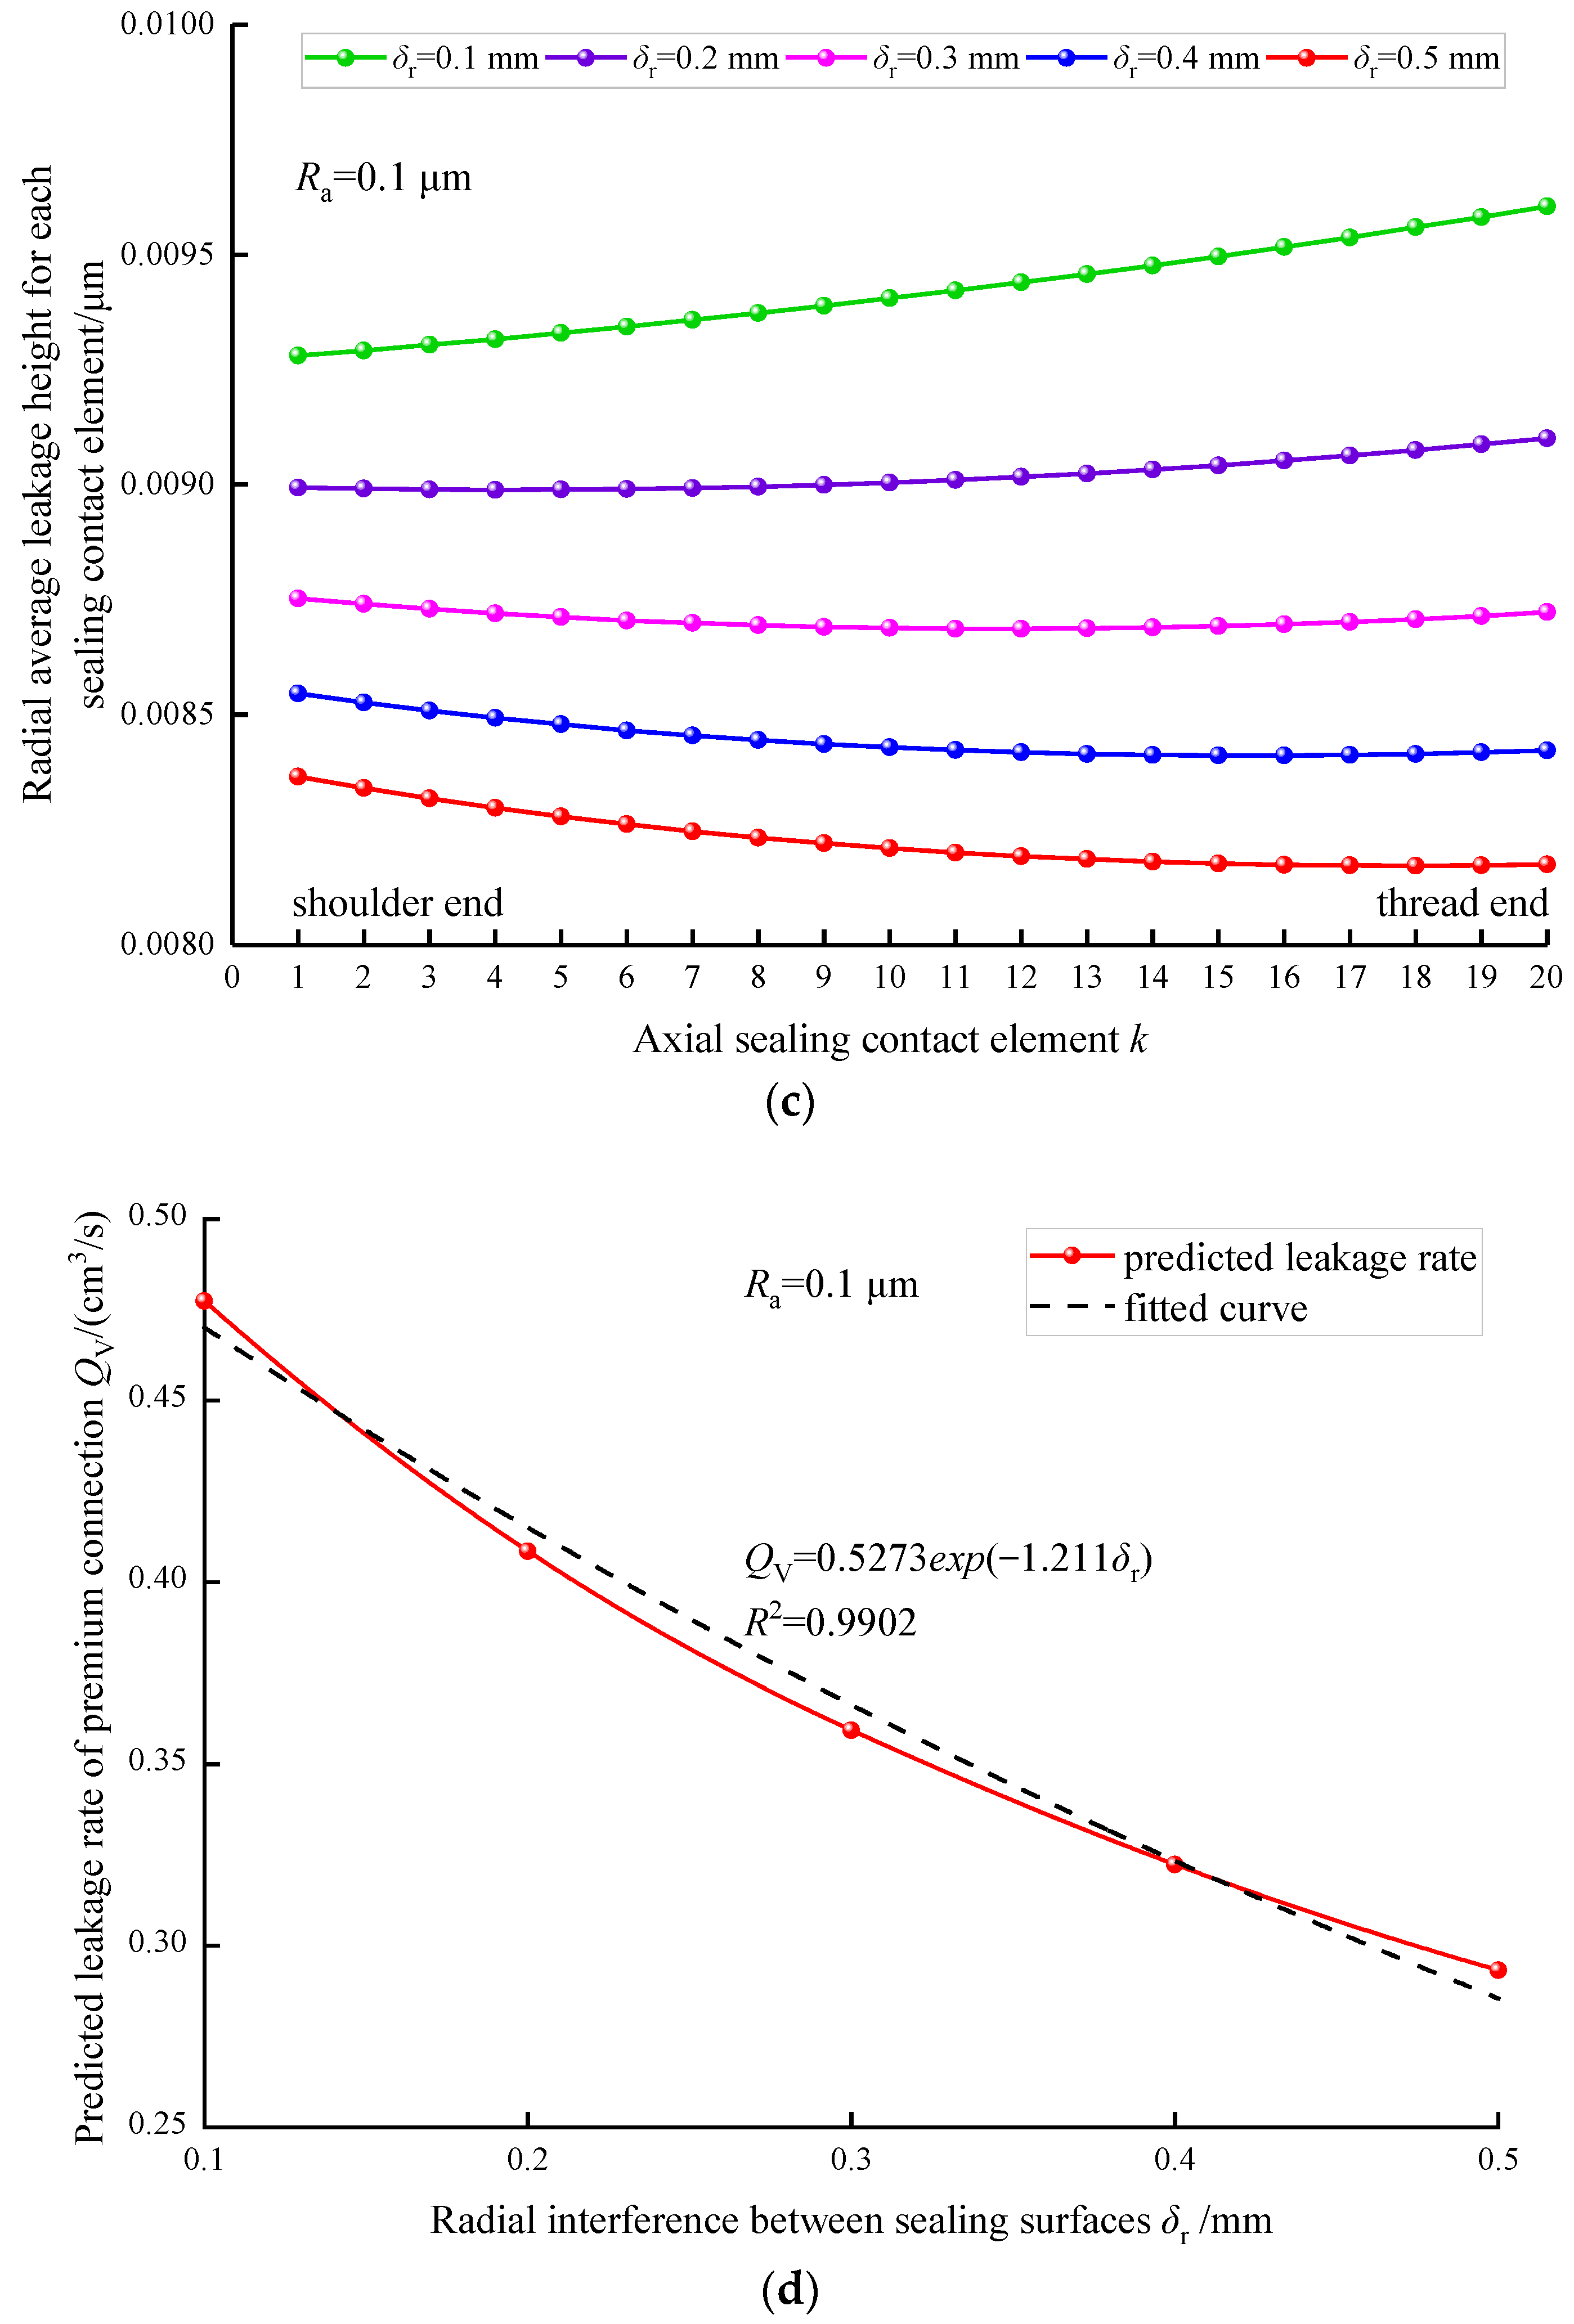
  • Affected by the uneven distribution of the contact pressure on the sealing surface, the circumferential leakage width and radial average leakage height between sealing surfaces are both non-uniformly distributed.
  • The leakage rate of a premium connection decreases exponentially with an increase in radial interference between sealing surfaces.
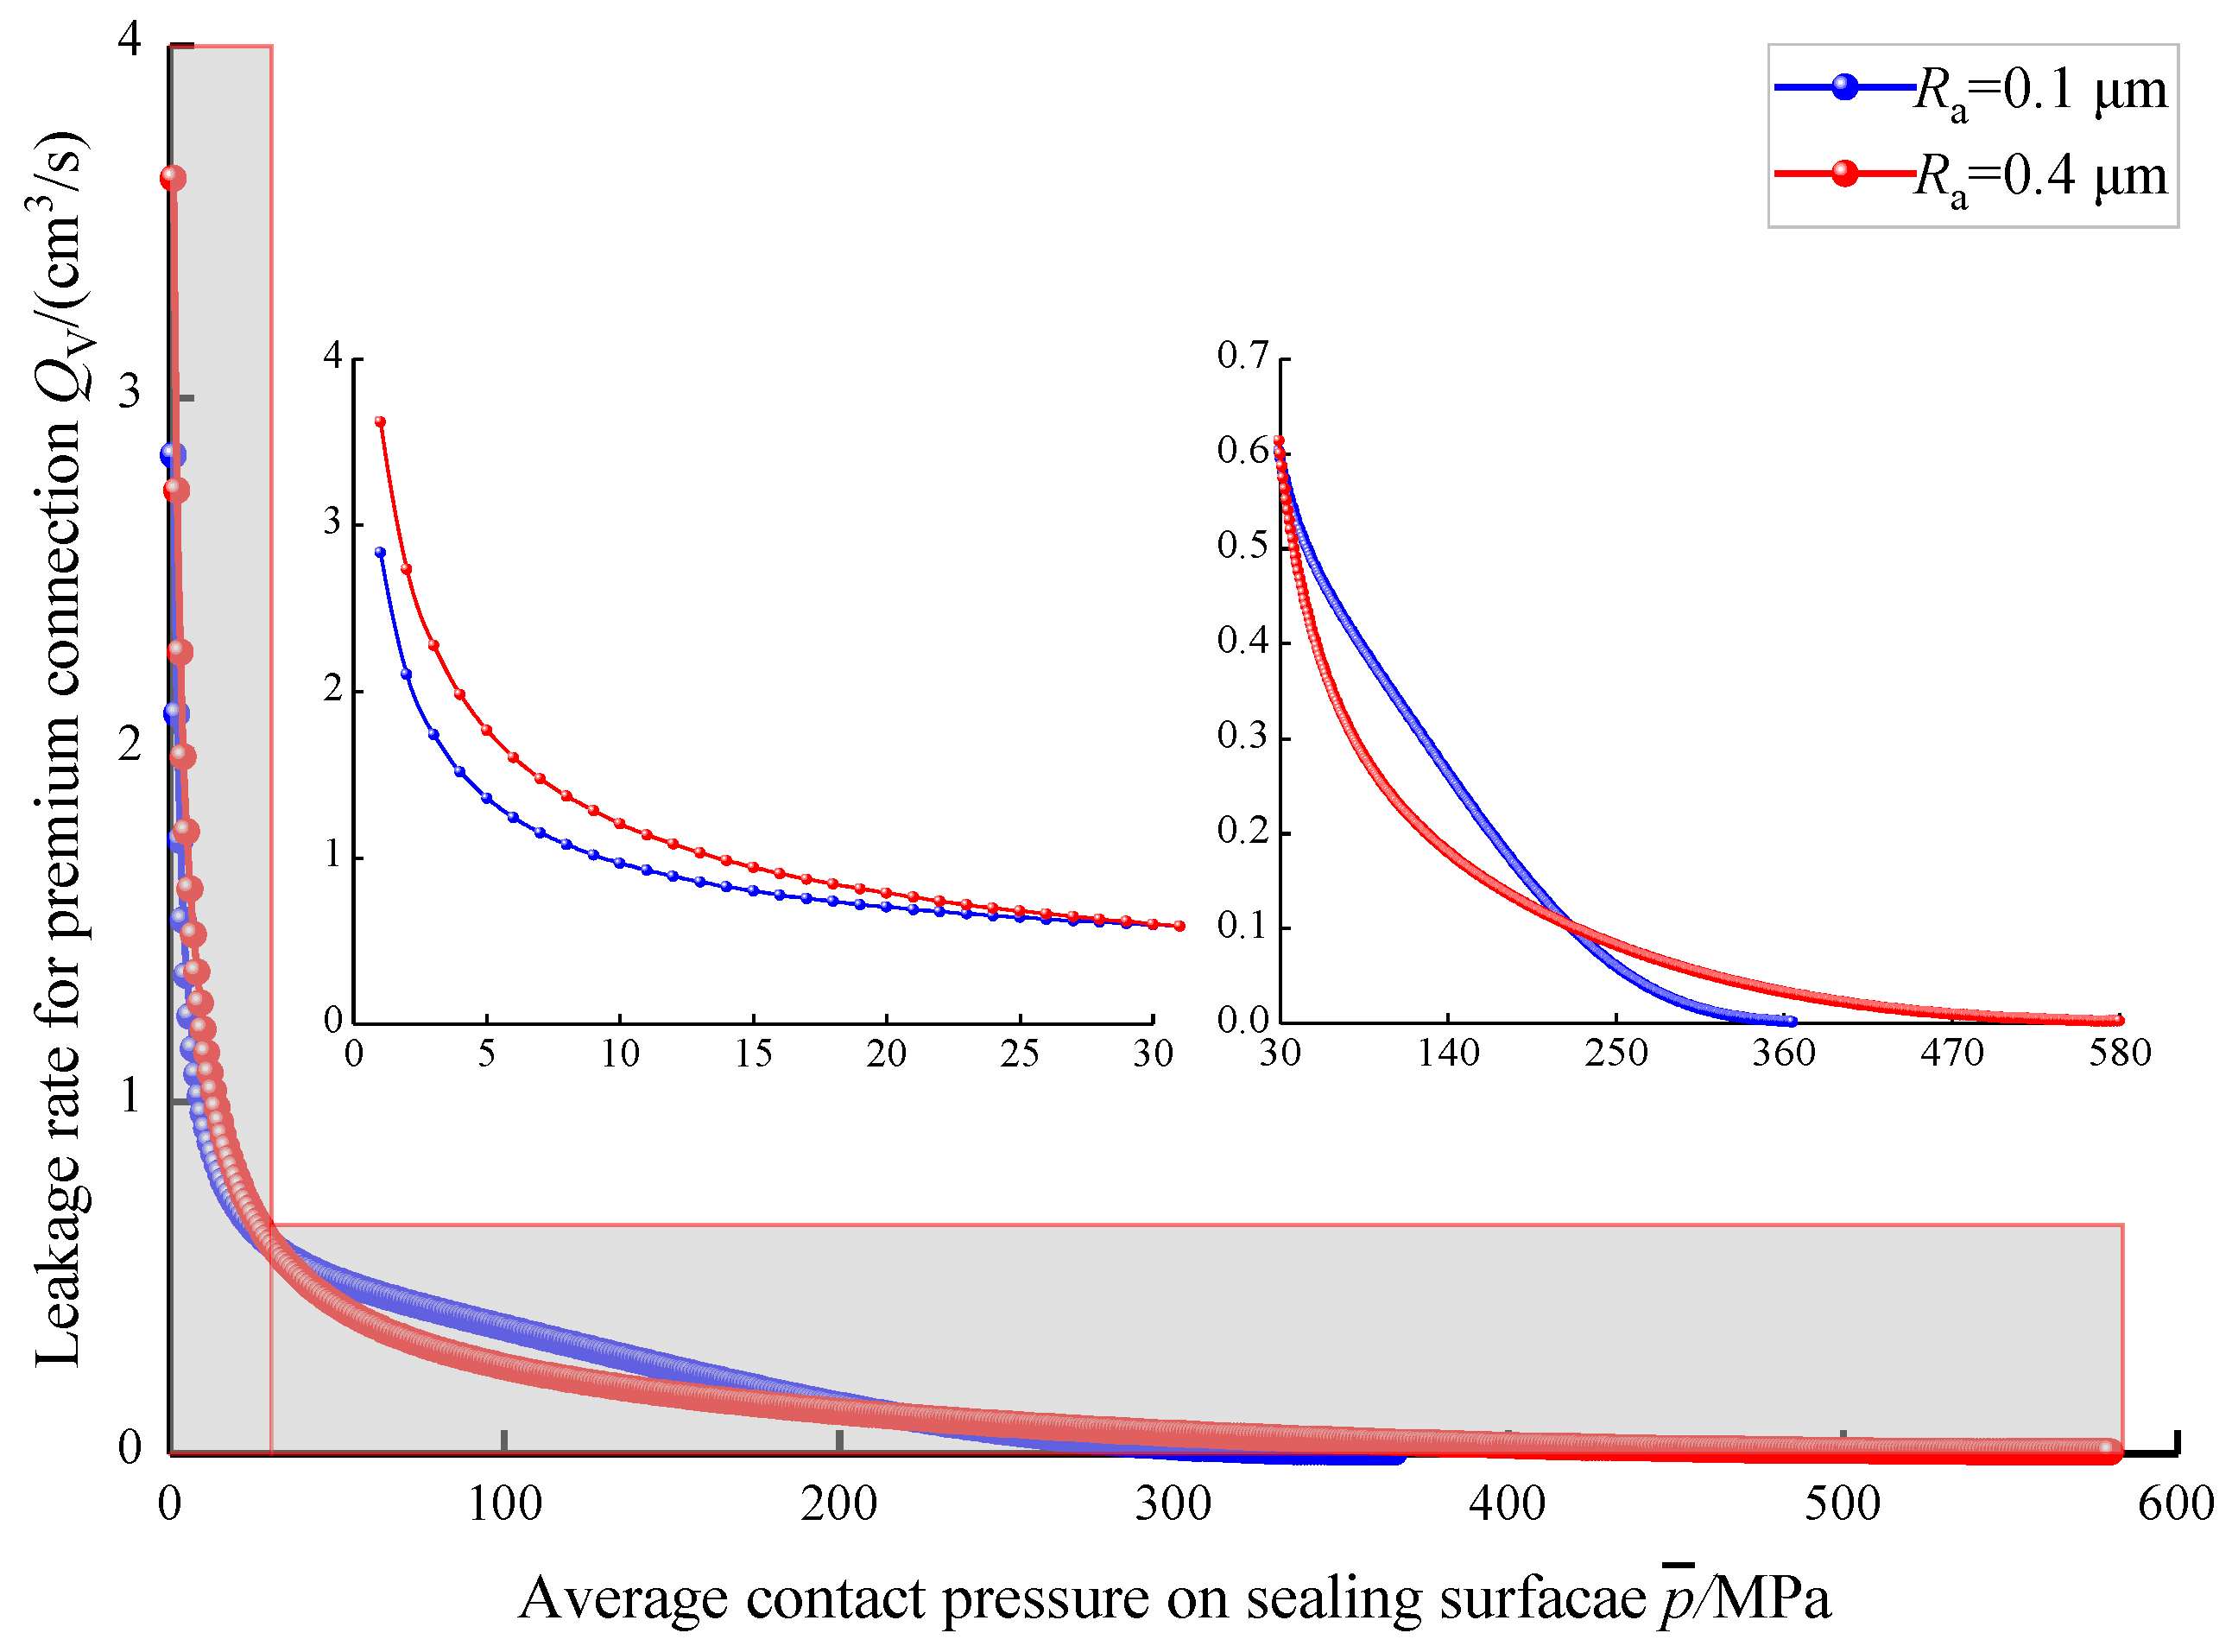
  • The lower the roughness of a sealing surface, the smaller the mean contact pressure to completely lock the leakage channel. In the example when the roughness values were 0.1 and 0.4 µm, the mean contact pressures of the sealing surface corresponding to the critical allowable leakage rate of 0.9 cm3/15 min should be greater than 366 and 580 MPa, respectively.
(3)
To improve the gas sealability of a premium connection, the radial interference between the sealing surfaces should be increased to reduce the leakage channel cross-sectional area, and the machining accuracy of the sealing surface should be improved to reduce the roughness of the sealing surface.
(4)
The proposed model in this paper provides a fast and quantitative sealability evaluation method for premium connections. However, some affecting factors, including additional sealing from torque shoulder, more sealing structure types, thread grease’s effects, and contact pressure relaxation in high-pressure and high-temperature environments, have not been comprehensively considered, and the model was also validated mainly by the previous literature. Consequently, some corresponding full-scale experimental testing and model refinement should be carried out to further improve model reliability in later work.

Author Contributions

Conceptualization, H.X.; Methodology, H.X. and Z.Z.; Validation, H.X.; Formal analysis, H.X.; Investigation, H.X., S.X. and B.Y.; Writing—original draft, H.X.; Writing—review and editing, H.X. and S.X.; Supervision, Z.Z. and T.S. All authors have read and agreed to the published version of the manuscript.

Funding

This research was funded by the National Natural Science Foundation of China [grant no. 51804060], the Open Fund [grant no. PLN2022-23] of the State Key Laboratory of Oil and Gas Reservoir Geology and Exploitation (Southwest Petroleum University), and the Natural Science Foundation of Chongqing, China [grant no. CSTB2022NSCQ-MSX0989]. We also thank LetPub (www.letpub.com, accessed on 9 January 2023) for its linguistic assistance during preparation of this manuscript.

Data Availability Statement

The data used to support the findings of this study are available from the corresponding author upon request.

Conflicts of Interest

The authors declare no conflict of interest.

Nomenclature

Ziheight sample of roughness profile, μm
Nnumber of Zi, integer
μmean value of Zi, μm
σstandard deviation of Zi, μm
c1, c2random numbers distributed uniformly between zero and one
Rasurface roughness, μm
Rymaximum peak-to-valley distance of roughness profile, μm
εμmean error of Zi, dimensionless
εymaximum peak-to-valley distance error, dimensionless
Zi,max, Zi,minmaximum and minimum values of profile height samples, respectively, μm
Isampling spacing, μm
xicoordinate value along sampling length, μm
NPtotal number of peak points of the profile curve, integer
NTtotal number of valley points of the profile curve, integer
λPjhorizontal distance between adjacent wave peaks, μm
λTkhorizontal distance between adjacent valleys, μm
hjvertical distance between adjacent peaks and valleys, μm
λ P ¯ average horizontal distance between adjacent wave peaks, μm
λ T ¯ average horizontal distance between adjacent valleys, μm
h ¯ average vertical distance between adjacent peaks and valleys, μm
λfitted sinusoidal wavelength of the roughness profile, μm
Δfitted sinusoidal amplitude of the roughness profile, μm
rcorresponding radial coordinate at the height of the axisymmetric sinusoidal micro-convex surface, μm
Eelastic modulus of string, MPa
E*equivalent elastic modulus of the contact pair, MPa
Syyield strength of the softer material for sealing contact pair, MPa
E1, E2elastic moduli of the materials of the two contact surfaces, respectively, MPa
ν1, ν2Poisson’s ratios of two contact surface materials, respectively, dimensionless
Aepactual contact area of a single sinusoidal micro-convex body, μm2
A e p * dimensionless actual contact area of a single sinusoidal micro-convex body, dimensionless
p ¯ geometric average pressure on sealing surface, MPa
p e p * critical contact pressure for a single sinusoidal convex body in complete elastoplastic contact with a rigid plane, MPa
a, bcontact and non-contact half-widths of a single micro-convex body in the cross section, respectively, μm
δflattening distance of a single micro-convex body in the cross section, μm
δ*dimensionless flattening distance, dimensionless
Btotal circumferential leakage width on sealing surface, mm
Dsaverage diameter of sealing surface, mm
Hradial average leakage height on sealing surface, mm
Qvgas leakage volume rate of a premium connection, cm3/s
pin, poutinternal and external gas pressures for tubing and casing string with a premium connection, respectively, MPa
ηdynamic viscosity of the sealed gas in the strings, MPa·s
Lstotal axial length of the sealing surface for a premium connection, mm
Dsmax, Dsminmaximum and minimum diameters of the sealing surface, respectively, mm
γscone angle of the sealing surface for cone-to-cone premium connection, °
Lsksealing length of the kth sealing element, mm
nnumber of sealing elements, integer
Dskaverage sealing diameter of the kth sealing element, mm
( p k ¯ ) δ r sealing contact pressure generated by radial interference between sealing surfaces, MPa
( p k ¯ ) p in additional contact pressure on the sealing surface generated by the gas pressure in the string, MPa
δrradial interference between sealing surfaces, mm
Wouter diameter of the coupling, mm
dinternal diameter of the string, mm
i,j,krespectively, integer

References

  1. Feng, Y.R.; Fu, A.Q.; Wang, J.D.; Wang, P.; Li, D.F.; Yin, C.X.; Liu, H.T. Failure control and integrity technologies of tubing/casing string under complicated working conditions: Research progress and prospect. Nat. Gas Ind. 2020, 40, 106–114. [Google Scholar]
  2. Bradley, A.B.; Nagasaku, S.; Verger, E. Premium connection design, testing, and installation for HPHT sour wells. In Proceedings of the SPE High Pressure/High Temperature Sour Well Design Applied Technology Workshop, The Woodlands, TX, USA, 17–19 May 2005; pp. 1–8. [Google Scholar]
  3. Bassarath, W.; Lafuente, M.; Branly, R. Development and qualification of a next generation gas tight connection incorporating metal-to-metal Technology. In Proceedings of the International Petroleum Technology Conference, Doha, Qatar, 6–9 December 2015; pp. 1–20. [Google Scholar]
  4. American Petroleum Institute. Calculating Performance Properties of Pipe Used as Casing or Tubing, API TR 5C3; API Publishing Services: Washington, DC, USA, 2018; pp. 48–50. [Google Scholar]
  5. ISO/TR 10400; Petroleum and Natural Gas Industries—Formulae and Calculations for the Properties of Casing, Tubing, Drillpipe, and Line Pipe Used as Casing or Tubing. Technical Committee ISO/TC 67, Materials, Equipment and Offshore Structures for Petroleum, Petrochemical and Natural Gas Industries, Subcommittee SC 5, Casing, Tubing and Drill Pipe. The International Organization for Standardization: Geneva, Switzerland, 2018; pp. 45–47.
  6. Gao, L.X.; Jin, Y.; Zhang, J.Q. Seal design of premium threaded casing connections. Chin. J. Mech. Eng. 2005, 41, 216–220. [Google Scholar] [CrossRef]
  7. Murtagian, G.R.; Fanelli, V.; Villasante, J.A.; Johnson, D.H.; Ernst, H.A. Sealability of stationary metal-to-metal seals. J. Trib. 2004, 126, 591–596. [Google Scholar] [CrossRef]
  8. Xie, J.; Matthews, C.; Hamilton, A. A study of sealability evaluation criteria for casing connections in thermal wells. In Proceedings of the SPE Canada Heavy Oil Technical Conference, Calgary, AB, Canada, 7–9 June 2016; pp. 1–12. [Google Scholar]
  9. Wang, J.D.; Feng, Y.R.; Lin, K.; Qin, C.Y.; Song, Y.P. Comparison analysis of premium connections seal structure. J. China Univ. Pet. Ed. Nat. Sci. 2010, 34, 126–130. [Google Scholar]
  10. Chen, W.; Di, Q.F.; Zhang, H.; Chen, F.; Wang, W.C. The sealing mechanism of tubing and casing premium threaded connections under complex loads. J. Pet. Sci. Eng. 2018, 171, 724–730. [Google Scholar] [CrossRef]
  11. Dou, Y.H.; Yu, Y.; Cao, Y.P.; Yang, X.T. Comparative analysis of the sealability of premium connection under the effect of dynamic load. China Petrol. Mach. 2014, 42, 63–72. [Google Scholar]
  12. Dou, Y.; Li, Y.; Cao, Y.; Yu, Y.; Zhang, J.; Zhang, L. FE simulation of sealing ability for premium connection based on ISO 13679 CAL IV tests. Int. J. Struct. Integr. 2020, 12, 138–148. [Google Scholar] [CrossRef]
  13. Kim, B.; Huang, J.; Yoon, J.Y. Design optimization of OCTG premium connection system based on the effect of stabbing flank angle. J. Mech. Sci. Technol. 2021, 35, 545–561. [Google Scholar] [CrossRef]
  14. Zhang, Y.; Lian, Z.; Zhou, M.; Lin, T. Viscoelastic behavior of a casing material and its utilization in premium connections in high-temperature gas wells. Adv. Mech. Eng. 2018, 10, 1–8. [Google Scholar] [CrossRef]
  15. Yu, Y.; Qu, Z.; Dou, Y.; Cao, Y. Analysis of Energy Dissipation on the Sealing Surface of Premium Connection Based on a Microslip Shear Layer Model. Energies 2022, 15, 8400. [Google Scholar] [CrossRef]
  16. Xu, H.L.; Li, T.L.; Yang, B.; Shi, T.H.; Zhang, Z. Theoretical analysis of sphere to cone sealing performance for tubing and casing premium connection. J. Southwest Pet. Univ. Sci. Technol. Ed. 2016, 38, 179–184. [Google Scholar]
  17. Xu, H.L.; Yang, B. A Quantitative Model to Calculate Gas Sealing Capacity and Design Sealing Parameters for Premium Connection. Math. Probl. Eng. 2020, 2020, 9074381. [Google Scholar] [CrossRef]
  18. Yang, B.; Xu, H.; Xiang, S.; Zhang, Z.; Su, K.; Yang, Y. Effects of Make-Up Torque on the Sealability of Sphere-Type Premium Connection for Tubing and Casing Strings. Processes 2023, 11, 256. [Google Scholar] [CrossRef]
  19. Hamilton, K.A.; Wagg, B.; Roth, T. Using ultrasonic techniques to accurately examine seal surface contact stress in premium connections. In Proceedings of the SPE Annual Technical Conference and Exhibition, Anaheim, CA, USA, 11–14 November 2007; pp. 1–14. [Google Scholar]
  20. ISO 13679; Petroleum and Natural Gas Industries—Procedures for Testing Casing and Tubing Connections, Technical Committee ISO/TC 67, Materials, Equipment and Offshore Structures for Petroleum, Petrochemical and Natural Gas Industries, Subcommittee SC 5, Casing, Tubing and Drill Pipe. The International Organization for Standardization: Geneva, Switzerland, 2002; pp. 18–22.
  21. Bei, G.; Ma, C.; Sun, J.; Ni, X.; Ma, Y. A Porous Media Leakage Model of Contact Mechanical Seals Considering Surface Wettability. Coatings 2021, 11, 1338. [Google Scholar] [CrossRef]
  22. Zheng, W.; Sun, J.; Ma, C.; Yu, Q. The Theoretical Basis of Face Contact Pressure Design of the Zero-Leakage Mechanical Seal. Coatings 2022, 12, 536. [Google Scholar] [CrossRef]
  23. Xu, Z.Q.; Yan, X.Z.; Yang, X.J.; Yin, X.K.; Wang, M.D.; Zheng, X.Y. Aplication of micro-leakage mechanism for evaluating the sealing performance of non-API casing connections. Acta Pet. Sin. 2014, 35, 963–971. [Google Scholar]
  24. Gao, Y.F.; Bower, A.F.; Kim, K.S.; Lev, L.; Cheng, Y.T. The behavior of an elastic–perfectly plastic sinusoidal surface under contact loading. Wear 2006, 261, 145–154. [Google Scholar] [CrossRef]
  25. Krithivasan, V.; Jackson, R.L. An analysis of three-dimensional elasto-plastic sinusoidal contact. Tribol. Lett. 2007, 27, 31–43. [Google Scholar] [CrossRef]
  26. Ciavarella, M.; Murolo, G.; Demelio, G.; Barber, J.R. Elastic contact stiffness and contact resistance for the Weierstrass profile. J. Mech. Phys. Solids 2004, 52, 1247–1265. [Google Scholar] [CrossRef]
  27. Jackson, R.L.; Streator, J.L. A multi-scale model for contact between rough surfaces. Wear 2006, 261, 1337–1347. [Google Scholar] [CrossRef]
  28. Ghaednia, H.; Wang, X.; Saha, S.; Xu, Y.; Sharma, A.; Jackson, R.L. A review of elastic–plastic contact mechanics. Appl. Mech. Rev. 2017, 69, 060804. [Google Scholar] [CrossRef] [Green Version]
  29. ISO 4288; Geometrical Product Specifications (GPS)—Surface Texture: Profile Method—Rules and Procedures for the Assessment of Surface Texture, Technical Committee ISO/TC 57, Metrology and Properties of Surfaces, Subcommittee SC1. The International Organization for Standardization: Geneva, Switzerland, 1994; pp. 1–8.
  30. Johnson, K.L. Contact Mechanics; Cambridge University Press: Cambridge, UK, 1987; pp. 103–119. [Google Scholar]
  31. Sheng, J.C. Engineering Fluid Mechanics; China Machine Press: Beijing, China, 1988; p. 193. [Google Scholar]
  32. Buchter, H.H. Industrial Sealing Technology; Chemical Industry Press: Beijing, China, 1988; pp. 41–53. [Google Scholar]
Figure 1. Seal structures and micro-leakage channels for tubing and casing premium connections. (a) Schematic diagram of premium connection; (b) cone-to-cone; (c) ball-to-cone; (d) ball-to-cylinder; (e) ball-to-ball; (f) schematic diagram of micro-leakage channel of sealing surface.
Processes 11 00570 g001
Figure 2. Simulated profile curve of rough surface based on Monte Carlo random normal distribution sampling.
Processes 11 00570 g002
Figure 3. Local magnification of simulated profile curve of rough surface.
Processes 11 00570 g003
Figure 4. Schematic diagram of axisymmetric sinusoidal micro-convex surface for rough surface model. (a) Three-dimensional morphology; (b) single micro-convex body.
Processes 11 00570 g004
Figure 5. Simulated microscopic contact process between axisymmetric sinusoidal micro-convex body and rigid plane in the xoz cross section. (a) Initial contact; (b) partial contact; (c) complete contact.
Processes 11 00570 g005
Figure 6. Axial sealing contact element of cone-to-cone sealing structure for premium connections.
Processes 11 00570 g006
Figure 7. Comparison of leakage rates.
Processes 11 00570 g007
Figure 8. Predicted sealing parameters of each axial sealing contact unit and leakage rate for cone-to-cone-type premium connection for different amounts of radial interference between sealing surfaces. (a) Average contact pressure for each sealing contact element. (b) Total circumferential leakage width for each sealing contact element. (c) Radial average leakage height for each sealing contact element. (d) Predicted leakage rate of premium connection.
Processes 11 00570 g008aProcesses 11 00570 g008b
Figure 9. Influence of average contact pressure on sealing surface on leakage rate for two roughness values.
Processes 11 00570 g009
Table 1. Monte Carlo random normal distribution sampling parameters for sealing surface’s profile height.
Grade of Machining AccuracyRa/μmRy/μmμ/μmσ/μm
71.63.21.60.533333
80.81.60.80.266667
90.40.80.40.133333
100.20.40.20.066667
110.10.20.10.033333
Table 2. Calculated parameters of simulated profile curves with different surface roughness values and sample numbers.
Ra/μmI/μmNNPNT λ P ¯ λ T ¯ h ¯ NP/NNT/Nλ/μmΔ/μmλ/IΔ/Ra
0.10.28000267926790.5972 0.5974 0.0568 0.335 0.335 0.597 0.028 2.986 0.284
0.44000135613571.1802 1.1796 0.0561 0.339 0.339 1.180 0.028 2.951 0.281
0.626678858861.8072 1.8059 0.0571 0.332 0.332 1.807 0.029 3.012 0.286
0.820006626632.4169 2.4157 0.0573 0.331 0.332 2.416 0.029 3.021 0.287
116005415422.9556 2.9538 0.0558 0.338 0.339 2.955 0.028 2.956 0.279
0.20.28000266926680.5996 0.5996 0.1112 0.334 0.334 0.600 0.056 2.998 0.278
0.44000132413241.2085 1.2088 0.1133 0.331 0.331 1.209 0.057 3.021 0.283
0.626679069051.7673 1.7666 0.1119 0.340 0.339 1.767 0.056 2.946 0.280
0.820006666662.4036 2.4024 0.1147 0.333 0.333 2.403 0.057 3.005 0.287
116005395392.9703 2.9665 0.1104 0.337 0.337 2.968 0.055 2.970 0.276
0.40.28000268426830.5962 0.5963 0.2269 0.336 0.335 0.596 0.113 2.981 0.284
0.44000133413341.2000 1.1994 0.2230 0.334 0.334 1.200 0.112 3.000 0.279
0.626678978971.7844 1.7837 0.2226 0.336 0.336 1.784 0.111 2.974 0.278
0.820006656662.4060 2.4036 0.2200 0.333 0.333 2.405 0.110 3.008 0.275
116005545532.8915 2.8949 0.2194 0.346 0.346 2.893 0.110 2.892 0.274
0.80.28000268626850.5958 0.5959 0.4493 0.336 0.336 0.596 0.225 2.979 0.281
0.44000132313231.2094 1.2097 0.4588 0.331 0.331 1.210 0.229 3.024 0.287
0.626678808801.8189 1.8175 0.4622 0.330 0.330 1.818 0.231 3.032 0.289
0.820006816822.3482 2.3471 0.4522 0.341 0.341 2.348 0.226 2.935 0.283
116005365352.9888 2.9925 0.4579 0.335 0.334 2.991 0.229 2.989 0.286
1.60.28000263126320.6082 0.6081 0.9007 0.329 0.329 0.608 0.450 3.041 0.281
0.44000134013391.1946 1.1949 0.8670 0.335 0.335 1.195 0.434 2.987 0.271
0.626678718711.8370 1.8377 0.9134 0.327 0.327 1.837 0.457 3.062 0.285
0.820006876872.3300 2.3312 0.8884 0.344 0.344 2.331 0.444 2.913 0.278
116005275283.0361 3.0342 0.9186 0.329 0.330 3.035 0.459 3.036 0.287
Table 3. Basic parameters for calculating leakage rate of premium connection.
SymbolValueUnitSymbolValueUnit
W194.31mmpin50MPa
d157.08mmpout0MPa
Dsmax171.132mmη1.660 × 10⁻⁶MPa·s
Dsmin163.08mmE2100GPa
Ls15.556mmν20.32dimensionless
γs15°Sy250MPa
Disclaimer/Publisher’s Note: The statements, opinions and data contained in all publications are solely those of the individual author(s) and contributor(s) and not of MDPI and/or the editor(s). MDPI and/or the editor(s) disclaim responsibility for any injury to people or property resulting from any ideas, methods, instructions or products referred to in the content.

