Article

A Model for the Flow Distribution in Dual Cell Density Monoliths

Departamento de Ingenieria Quimica y Ambiental, Universidad Tecnica Federico Santa Maria, Valparaíso 2390123, Chile
*
Author to whom correspondence should be addressed.
Processes 2023, 11(3), 827; https://doi.org/10.3390/pr11030827
Submission received: 4 February 2023 / Revised: 5 March 2023 / Accepted: 8 March 2023 / Published: 10 March 2023
(This article belongs to the Special Issue Modelling and Optimization of Chemical Reactors)

Abstract

:
Monoliths are promising as catalytic structured supports due to their many operational advantages. Compared to pellets, monoliths offer low backpressure and good heat distribution, even at high flow rates. There is interest in the industry for improving temperature control in highly exothermic systems, such as the catalytic hydrogenation of C O 2 for e-fuels synthesis. In this context, novel substrate shapes, such as non-homogeneous cell density monoliths, show good potential; however, to date, they have only been sparsely described. This work focuses on a dual cell density substrate and uses a computational model of a straight-channel monolith with two concentric regions to analyze its flow distribution. The central (core) and peripheral (ring) regions of the substrate differ in cell density in order to obtain a non-homogeneous cross-section. The model is validated against classical data in the literature and theoretical equations. Then, the flow fraction passing through each region of the substrate is registered. Several flow rates, core sizes and combinations of apparent permeabilities are tested. According to the results, the flow distribution depends only on the monolith geometrical features and not on the flow rate. A model for this phenomenon is proposed. The model accurately predicted the flow fraction passing through each region of the monolith for all the cases analyzed.

1. Introduction

Improving the efficiency of chemical reactors is crucial for industry and society as it leads to numerous benefits, such as lowering greenhouse gas emissions, decreasing operating costs, and increasing productivity [1]. By optimizing reactor performance, the amount of waste generated during chemical processes can also be reduced, potentially leading to more sustainable manufacturing practices with reduced energy consumption [2,3]. Catalyst supports, commonly made of aluminum oxide, silicon dioxide, and titanium dioxide, play a critical role in catalytic process design as they provide a stable and effective surface for the catalytic reactions to occur. The choice of the support material for the catalyst and shape is crucial as it can affect the activity, selectivity, and stability of the catalyst [4,5,6].
Support surface properties, such as porosity, surface area, and chemical composition, are critical factors that can greatly impact the performance of the catalyst and the reaction outcome. The correct combination of the aforementioned variables is non-trivial. For example, a highly porous support with a large surface area can increase the accessibility of reactants to the catalyst, leading to higher reaction rates. On the other hand, if the reaction rate is too high, it may overheat the catalyst decreasing its efficiency and lifespan [7]. The interaction between the support and the catalyst can also influence the performance of the process. A poorly optimized support might lead to an uneven flow distribution, generating hot spots inside of the reactor, resulting in decreased catalytic activity, leading to longer reaction times and lower yields [8,9,10,11,12,13].
Structured catalyst supports, as monoliths, show a significant potential for improving the efficiency of catalytic processes. Compared to pellets, monoliths offer important advantages, for example, a low pressure drop at high flow rates, a large specific surface area, and good mechanical integrity, to name a few [14,15,16]. Monolith support consists of a continuous solid structure with many channels running in parallel, typically made from the extrusion of a variety of materials, including ceramics, metals, and polymers. By incorporating specific design features, like the channel geometry, void fraction and washcoat thickness, monoliths offer significant design flexibility to obtain a desired internal flow pattern and heat distribution. The high mechanical strength of monoliths also makes them ideal for use in high-pressure and high-temperature reactions, where traditional catalyst supports may not be suitable.
External mass transfer and internal diffusion are two other important phenomena that impact the performance of chemical reactors that are influenced by the catalyst support design. In monoliths, which typically operate in a laminar regime due to the reduced size of the channels, external mass transfer is dominated by molecular diffusion in the radial direction inside the channels. Both external mass transfer and internal diffusion play important roles in determining the overall performance of chemical reactors. To prevent loss of efficiency in micro-channel reactors, catalyst loading and other variables should be carefully set, taking into account how the flow distributes among the different channels [17].
Traditionally, monoliths have a square channel cross-section [18,19,20], but it is also possible to find them with a triangular, hexagonal and sinusoidal corrugated shapes. to name a few [21,22,23]. In any case, in flow-through monoliths, it is observed that the channel cross-section shape tends to become rounder once washcoated, which is the process where catalyst species are fixed to the inner walls of the channels of the substrate [24,25]. A study of the heterogeneity of washcoat distribution of, for example, zeolite in a cordierite monolith, can be found in [26]. The washcoat layer is commonly a few tens of microns thick. Hence, monoliths are usually assumed to operate either in a chemically-controlled regime or limited by external mass transfer. However, mass transfer resistance in non-uniform washcoat is currently an active topic of research [27].
For decades, straight-channel monoliths have been widely used as catalytic support in several relevant industrial applications, such as C O abatement, steam reforming, and methanol synthesis [28,29,30,31,32]. Furthermore, in environmental applications, such as removal of NOx, volatile organic compounds abatement and air purification in exhaust gas, where low backpressure is mandatory, monoliths are excellent candidates for large scale applications, such as large-volume sandwich-type honeycomb monolith plasma reactors [30,33].
An important feature of straight-channel monoliths is their cell density, that is, the number of channels per square inch of cross-sectional area (CPSI). Typical cell densities for square channels range from 400 to 900 CPSI, with channel hydraulic diameters close to the millimeter [34]. The cell density, together with the wall thickness and channel shape, define the viscous resistance of the substrate (the inverse of the apparent permeability), which, in turn, impacts the backpressure and the flow and temperature distribution inside of the reactor [35,36].
Despite the many additional geometric variables available when designing a monolith, state of the art shows that they still are mostly simply cylinders with basic channel shape geometries. This comes mainly from limitations from the manufacturing technique, extrusion. In the last decade, additive manufacturing enabled researchers to investigate novel monolith shapes made by 3D printing. Some examples are reported in Negri et al. [37]. In that work, Lithography-based Ceramic Manufacturing [38] is used to 3D print straight-channel monoliths and other cellular structures made of M g O . Actually, it is also possible to find, in the literature, substrates where the monolith itself is made of catalytic materials [39,40,41]. Monoliths have known advantages that make them ideal in some contexts; however, it should be remembered that, under different circumstances, other types of support, such as foams, might perform better. An interesting discussion about the potential of structured and unstructured substrates is presented in [17].
Another point that must be taken into account is temperature control. This directly affects the rate and outcome of chemical reactions. In fact, in externally-cooled tubular reactors with exothermic reactions, it is common to find that the tube diameter is limited by the capacity to refrigerate its core [29]. A relevant system, exothermic and limited by the equilibrium, is C O 2 hydrogenation to methane. In the process, an increase in local temperature negatively impacts the thermodynamic equilibrium of the reaction, since it is promoted at low temperatures. In the case of C O 2 hydrogenation to methanol, temperature increases the reaction rate, but it also reduces the equilibrium constant, limiting conversion efficiency [42,43]. Poor heat management might lead to thermal gradients and hotspots formation in the catalytic bed, damaging the catalyst stability and causing a drop in reactor performance [44,45,46]. Temperature control is also necessary to prevent thermal runaway, which can lead to equipment damage and safety hazards. In general terms, monoliths have better thermal conductivity than pellets [47]. This refers to oxide-based pellets, which are very common. It is also possible to find substrates made of silicon carbide (SiC), which show excellent thermal conductivity, comparable to some metals, and may significantly prevent hotspots due to a significantly improved temperature distribution. An example of an SiC substrate can be found in [48].
In some exothermic systems, improvements in temperature control are still required. In that sense, metallic monoliths have been investigated [49,50]. Another alternative that has been proposed is the use of monoliths with variable radial cell density, meaning two concentric regions composed of different cell densities each, leading to a disparity of flow resistance and, thus, flow distribution. That concept may deliver several efficiency improvements [51]. According to recent literature, this could become especially relevant for externally-cooled monoliths because, if more flow passes through the outer region of the substrate, then refrigeration is improved due to the higher convective coefficient in that region, promoting heat transfer from the internal hot region to the peripheral one [52]. Certainly, it may also be possible to find systems where it could be more convenient to have the opposite configuration, where more flow through the core section would be beneficial. In reactive systems, space velocity is also affected, potentially leading to changes in selectivity and other relevant variables [53]. Currently, additional research on the topic is still needed to reach a more general conclusion. A comprehensive study of reacting systems on non-homogeneous substrates is considered in a further stage of this project.
It should be emphasized that the concept of non-homogeneous monoliths does not necessarily imply a difference in the cell density in this paper. Here, a non-homogeneous monolith is considered to be a monolith where the apparent permeability of the core section differs from that of the ring, resulting in a disparity in the flow distribution, regardless of whether the difference comes from a change in the channel size, wall thickness or other. Despite the potential advantages, currently, non-homogeneous monoliths have not been sufficiently investigated, and many questions about them still remain unaddressed. One example is how the flow distributes when passing through a monolith having two different cell densities in its cross-section. In that context, the main objective of this paper is to investigate and develop a model for predicting the flow distribution across a monolith having two concentric regions, where each one has a different apparent permeability. In this work, flow through a monolith with several combinations of cell densities, defined by channel sizes and wall thickness, was analyzed. The results are presented in terms of flow distribution for several Reynolds numbers, core sizes and relative permeabilities. Based on them, a new model for predicting the fraction of the flow passing for each section of the substrate is proposed.

2. Computational Model

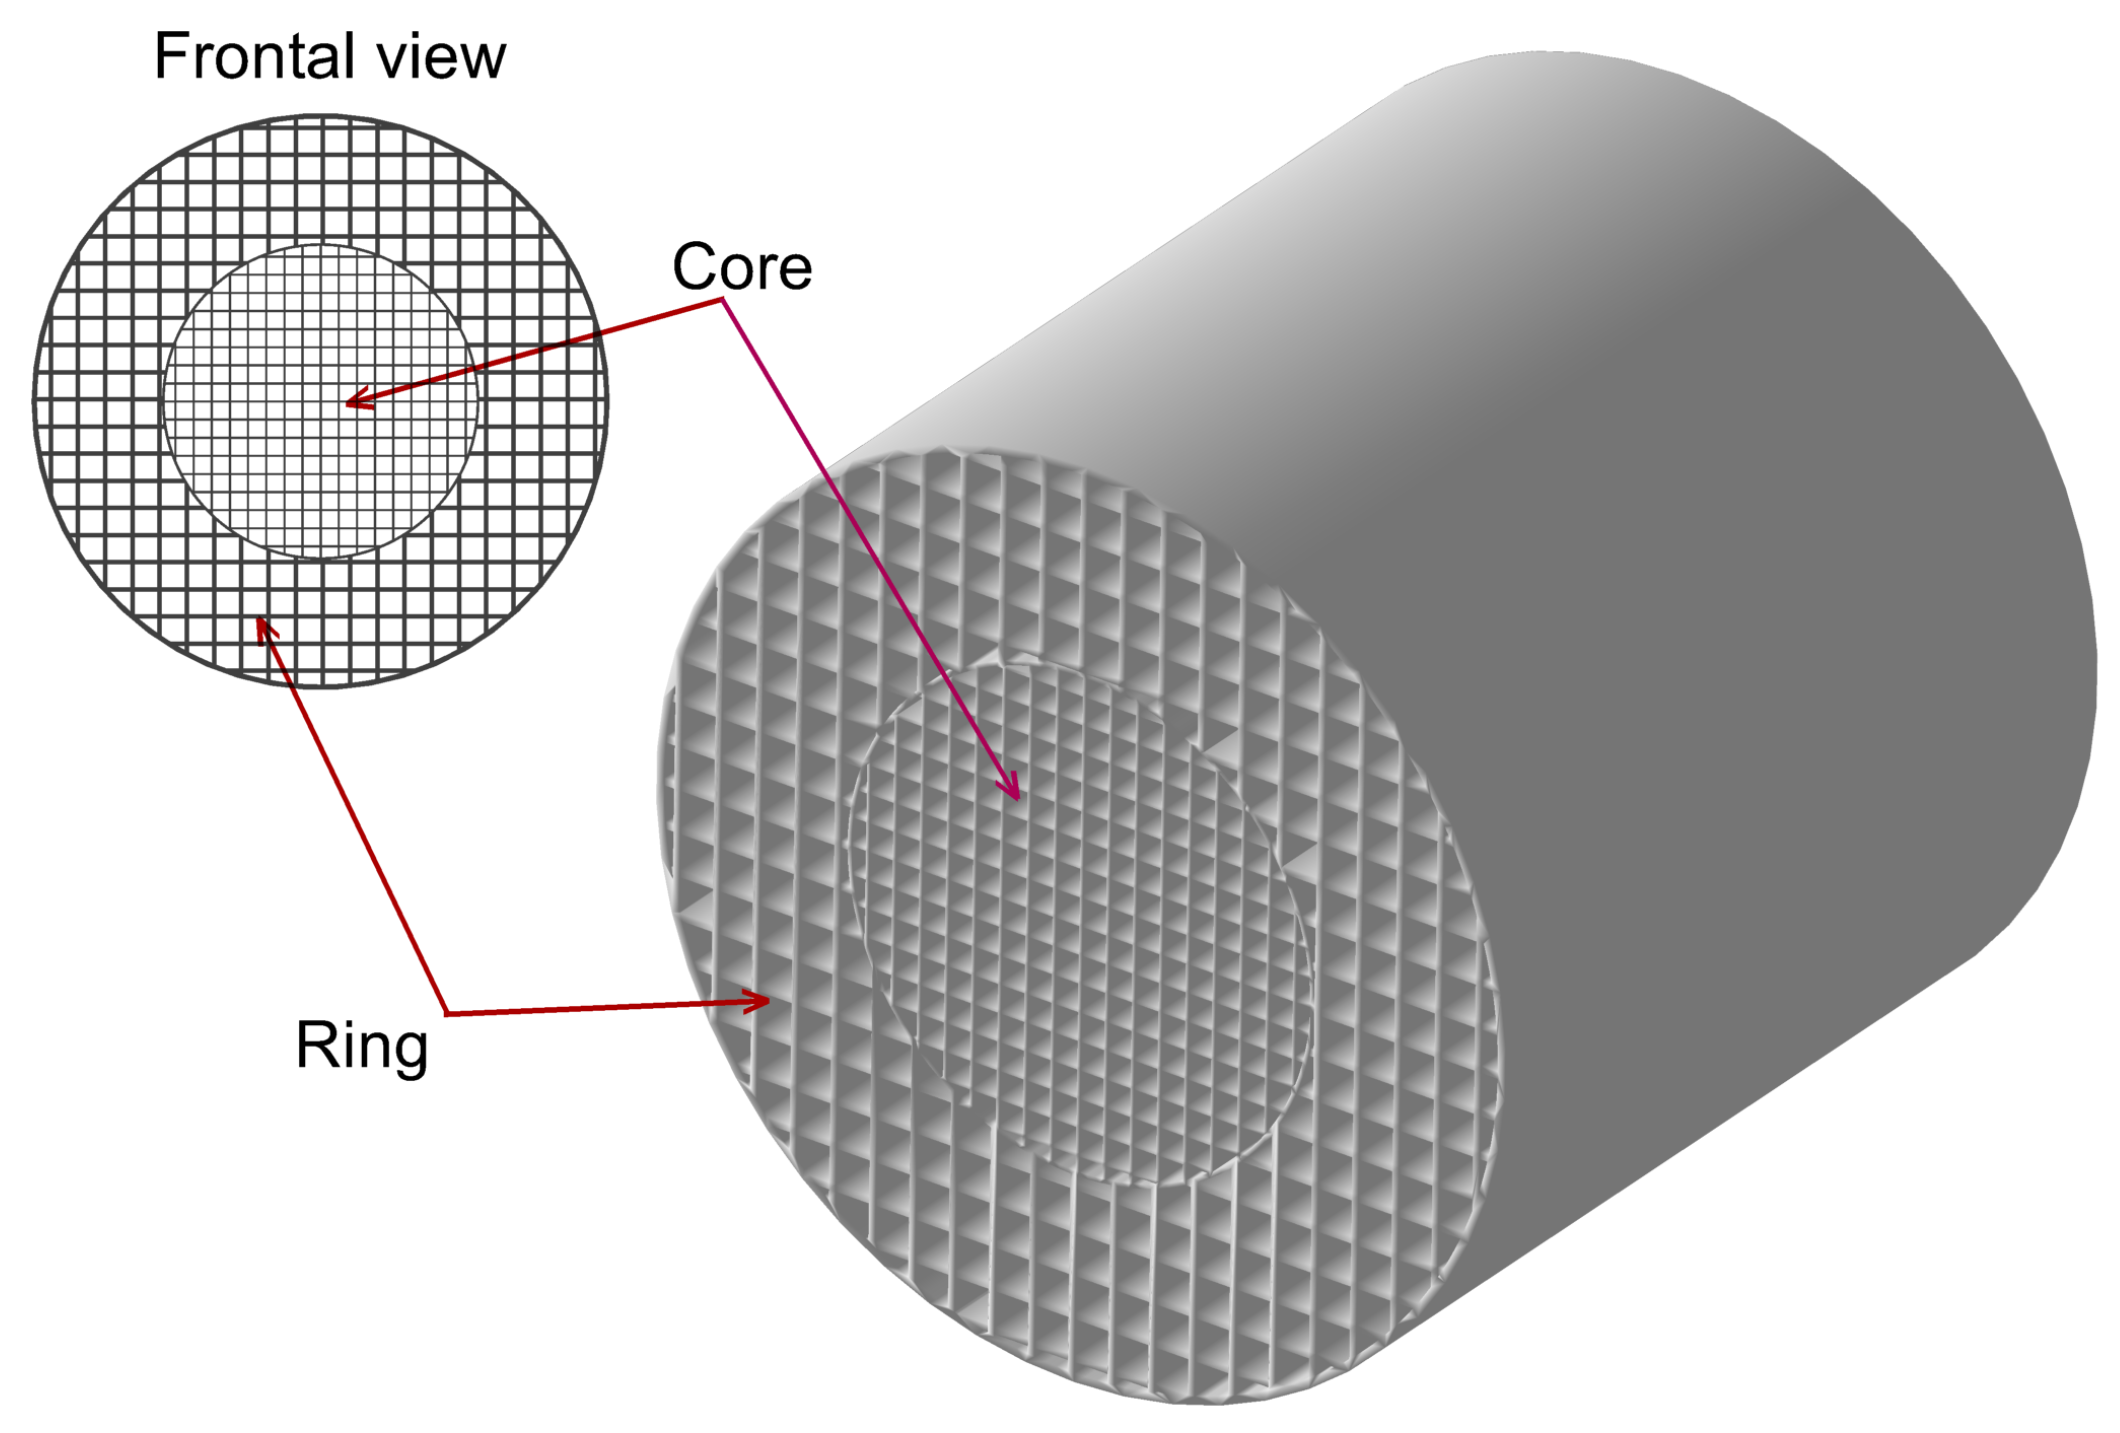
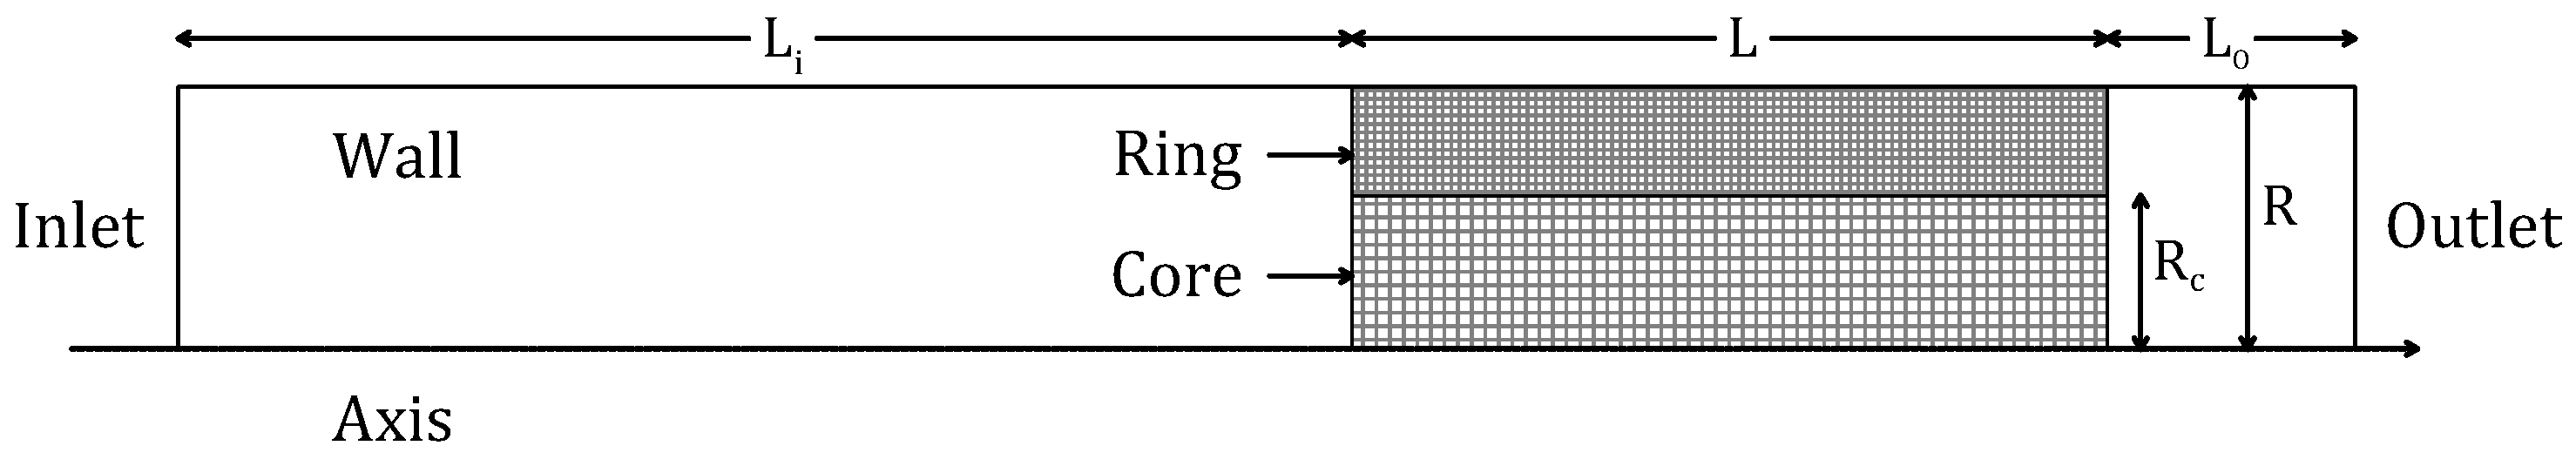
2.1. Description of the Domain

The domain consisted of a tube filled with a dual cell density monolith substrate. Figure 1 shows a schematic of the monolith with two concentric regions differing in cell density.
The monolith was 150 mm long (L) and had 40 mm as total radius (R). It had two concentric regions with two different geometric features. The central one, referred to as the core, was a cylinder with R c as radius, while the rest of the substrate was given to the peripheral one, called the ring. Two tube sections before and after the substrate were also included in the domain, both L i and L o were 345 mm and 40 mm long, respectively. L i was sufficient to ensure a fully developed velocity profile inside of the tube prior to entering the substrate. The monolith was considered to be unwashcoated with square cross-section channels. The core and the ring differed in apparent permeability, that is, in channel size and wall thickness, depending on the analyzed case. The substrate was modeled by using the continuum approach; hence, it was possible to take advantage of the axial symmetry of the domain. A schematic of the axisymmetrical section that generates the domain is shown in Figure 2.

2.2. Flow Model

The flow regime was assumed to be turbulent at the inlet of the tube, and modeled by a two-equations Reynolds-Average Navier–Stokes model. The continuity and momentum conservation equations were [54,55]:
ρ u i x i = 0
ρ u i u j x j = p x i + x j μ u i x j + u j x i 2 3 u i x i δ i j τ i j x j + S u i
The closure was provided by the Boussinesq approximation and the SST k- ω eddy viscosity model, which is widely accepted for flow through monolith reactors [56,57]. The Reynolds stress tensor was:
τ i j = u i u j ¯ = μ t u i x j + u j x i 2 3 u i x i δ i j
The eddy-viscosity was:
μ t = ρ k ω 1 Max 1 α , S F 2 a 1 ω
The transport equations for k and ω from the SST model were:
ρ k u i x j = μ + μ t σ k k x j + μ t S 2 ρ β k ω + S k s i n k + S k g e n
ρ ω u i x j = μ + μ t σ ω ω x j + α ω α ρ μ t S 2 ρ β ω 2 + 2 1 F 1 ρ 1 ω σ ω 2 k x j ω x j + S ω s i n k + S ω g e n
Details about the parameters of the SST model can be found elsewhere [57,58].
In discrete-phase models, each channel requires the order of the millions of control volumes to be described accurately [59,60]. Due to their high cell density, a single monolith, such as is considered in this study, can have thousands of channels, so, a discrete-phase model of a whole monolith is still very expensive in terms of computational power [61]. There are examples in the literature using more suitable techniques, such as in Bertrand et al. [62], where the Lattice Boltzmann method is used to model the flow over a 3D domain compromising 7539 parallel channels with square cross-sectional shape. The method shows potential, provided that it is highly parallelizable; however, it still requires several days of processing in a high-performance computing cluster to run a single case. To overcome computational power limitations in systematic research, monoliths can be modeled as a continuum. That is, a homogeneous porous medium where the flow suffers the same head losses, heat transfer and mass transfer as when passing through a physical monolith with discrete channels. A continuum is essentially a porous medium with source terms added to account for the phenomena inside of the substrate. For pressure drop, the Hagen–Poiseuille equation can be equated to Darcy’s law to obtain an apparent permeability for the porous medium that leads to exactly the same mechanical energy dissipation as when the flow passes through a straight channel monolith. With this approach, there is no need to use a mesh fine enough to be able to describe the development of the boundary layer inside every channel. Instead of that, a lumped model, based on apparent permeability, is used, saving orders of magnitude of core-hours in computational time. More details about the continuum approach are given in Cornejo et al. [63].
The term S u i in Equation (2) accounted for the extra losses when the flow passed through the monolith and was modeled by the Darcy law [55,64], as in Equation (7).
S u i = μ α i u i
The radial component of the apparent permeability of each zone was set to be three orders of magnitude lower than the axial one in the same region. This allowed flow through the substrate only in the axial direction, as expected in a physical monolith with closed channels where there is no mass transfer between contiguous channels. The apparent permeability for each case was computed by using Equation (8). In the equation, the subscript n corresponds to c for the core and r for the ring region of the substrate.
α a x i a l n = ϕ n D n 2 C n / 2 ; α r a d i a l n = α a x i a l n 1000
In Equations (5) and (6), the terms S k s i n k and S ω s i n k represent the decay of the turbulence when the flow enters the monolith channels. In this paper, due to the operating conditions considered, it was assumed that both k and ω decayed to zero immediately once passing the frontal face of the substrate. According to the literature, this is a good approximation because turbulence kinetic energy decays proportionally to the effective viscosity in the substrate. As a consequence, upstream turbulence dissipates rapidly inside of the channels and the turbulence viscosity ratio is zero after a distance equivalent to a few channel diameters inside of the monolith [65,66]. On the other end, S k g e n and S ω g e n represent the turbulence generation when the flow leaves the substrate. In the rear face of the substrate, turbulence can arise because of two phenomena. The first one is the flow leaving the channels as many jets are close to each other. The second is the flow passing through the last part of the solid walls. This phenomenon is comparable to the flow around an object. In that case, the characteristic length used to compute Reynolds is the maximum thickness of the solid at the corners of the channels. Typical monoliths have thin walls, and, hence, the flow rate necessary to produce a detachment of the boundary layer at the end of the substrate is rarely reached. Taking that into account, both S k g e n and S ω g e n were neglected in this paper, since preliminary calculations discarded such a turbulence generation [67,68,69].
Extra losses due to the flow entering the substrate are possible because of the flow colliding with the frontal face of the monolith. This can be modeled as a porous jump where the magnitude of the losses depends on the void fraction and channel shape. Similarly, a porous jump can be used to account for the expansion of the flow in the rear face of the substrate when the flow area increases. According to the literature, both phenomena produce only minor losses that can be neglected for the conditions considered in this paper [63,70]. Finally, additional dissipation can occur because the friction factor in the hydraulic entrance length is higher than that in the fully developed region considered in the Hagen–Poiseuille model, but classical equations dictate that, at the Reynolds numbers analyzed, the average friction factor of the whole channel is fairly similar to the asymptotic one, making this effect negligible [63,71,72].
As boundary conditions, the top of the domain was defined as a no-slip wall and the bottom, which corresponded to the center line of the tube, as a symmetry axis. The inlet had a prescribed velocity, which changed according to every run, and the outlet had a prescribed pressure of 1 bar. The operating fluid was atmospheric air with a density of 1.225 kg / m 3 and 1.7894 × 10⁻⁵ Pa·s as viscosity.
The problem was implemented in ANSYS Fluent 2022R2 [73], a Computational Fluid Dynamics software, which uses the Finite Volumes Method; hence, the domain was discretized into 216,140 fully orthogonal quadrilateral control volumes. A second-order up-wind scheme was used for momentum, and the pressure–velocity coupling was solved by using a pseudo-transient fully coupled approach [54]. As convergence criteria, having residuals below 10 6 and a stable backpressure value were considered.

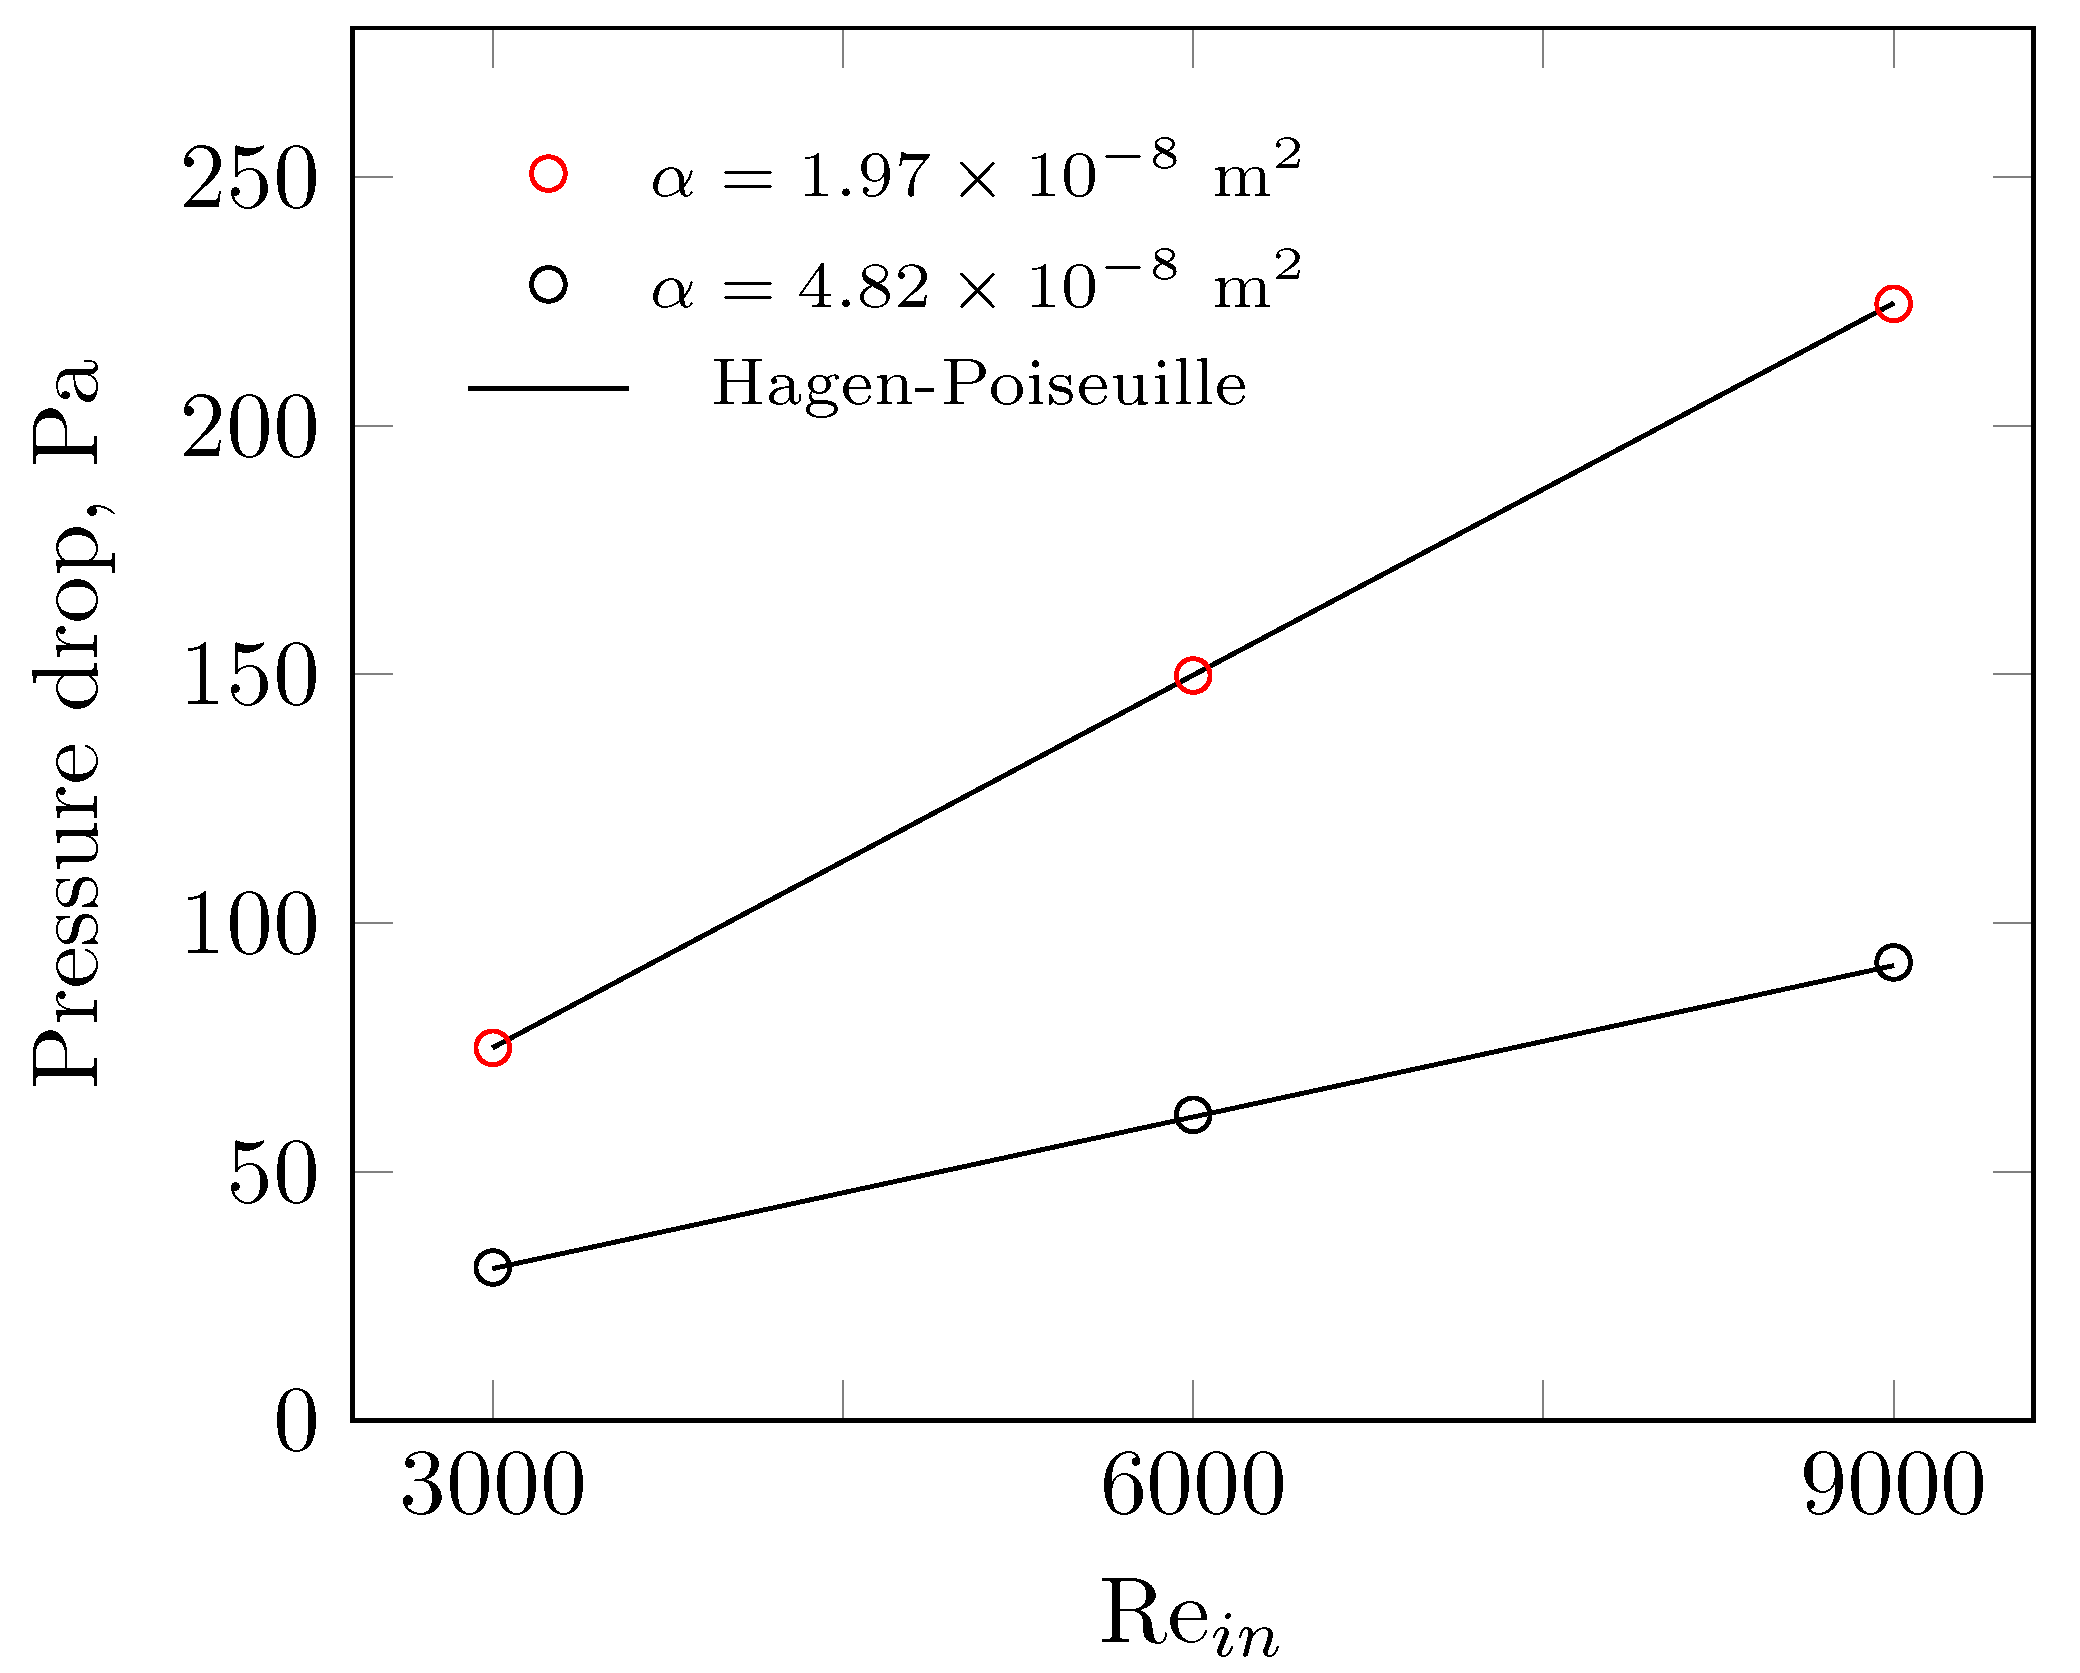
2.3. Grid Independence and Model Validation

The grid independence of the solution was corroborated by comparing the total pressure drop through the substrate obtained from two grids with a significantly different number of control volumes. In addition to the original grid with 216,140 control volumes, a refined one with 864,560 control volumes was considered. The latter came from homogeneously refining the original grid, by breaking each control volume into four of a quarter of the size each; hence, the two grids were fully orthogonal. As inlet condition, a Re i n of 6000 was used, and the monolith was considered a 400 CPSI one, with 1.22 mm as channel diameter. In such a condition, channel Re of about 100 are obtained, which are typical values for monolith applications [61,74,75]. From the grid study, the total pressure drop obtained from both meshes differed by less than 0.15%, so, the study continued with the original grid.
There are no models available for predicting flow distribution in monoliths combining different cell densities, hence, the validity of the computational model was investigated by comparing the pressure drop through a channeled substrate with a homogeneous cell density against that predicted by the theoretical equation of Hagen–Poiseuille for straight channels, as in [55,76]. This is still useful because both regions of the substrate, core and ring, were modeled using the same set of equations and only differed in the value given to the apparent permeability. The Hagen–Poiseuille expression, shown in Equation (9), assumes fully developed flow along the whole channel, neglecting minor losses, which is reasonable given the dimensions of the substrate used, and which is explained in Section 2.2 [63,77]. In the equation, Re c h was the channel Reynolds number, and u c h was the channel velocity.
Δ p = L D H 56.8 Re c h 1 2 ρ u c h 2
The results from the computational model accounted for the pressure drop from the frontal to the rear face of the monolith. Consistency with the momentum balance was kept by using the mass-weighted values of the total pressure across both aforementioned faces. It should be emphasized that it is necessary to use the total pressure instead of the static one when computing losses between two faces that may have different velocity profiles. In mathematical terms, pressure at a given axial position was computed as in Equation (10).
p | x = A p u d A A u d A
In order to validate the computational model covering a wide range of conditions, two significantly different apparent permeabilities, together with Re i n ranging from 3000 to 9000 were considered for testing. According to the results shown in Figure 3, the computational model agreed with the theoretical one for all the analyzed cases; therefore, there is no reason to mistrust the implemented model.

3. Results and Discussion

This section summarizes the main results obtained from the series of computational runs. According to the literature, higher apparent permeability and lower flow rate may help to diminish flow maldistribution significantly [52,78], so, Re i n , relative permeability, and core size were selected as three relevant variables for the resulting flow distribution. Re i n ranged from 3000 to 6000 because that led to channel Reynolds from 50 to 250, which are typical values observed in practical applications. Core permeability was fixed to be 4.82 × 10⁻⁸ m 2 because that value is fairly similar to that for a commercial 400 CPSI thin wall monolith. The ring permeability was manipulated in order to obtain relative permeabilities (core over ring) from one to four, which is a broad range and sufficient to observe a tendency in the results. Finally, the core size, defined as the percentage of the monolith volume given to the core, ranged from 0 to 10% in 10% increments. It should be noted that cases with relative permeability equal to one and core sizes of 0% and 100% are equivalent to using homogeneous cell density monoliths, and were included in the analyzed cases for comparison purposes. The latter led to a total of 72 computational runs. A list with their details is shown in Table 1.

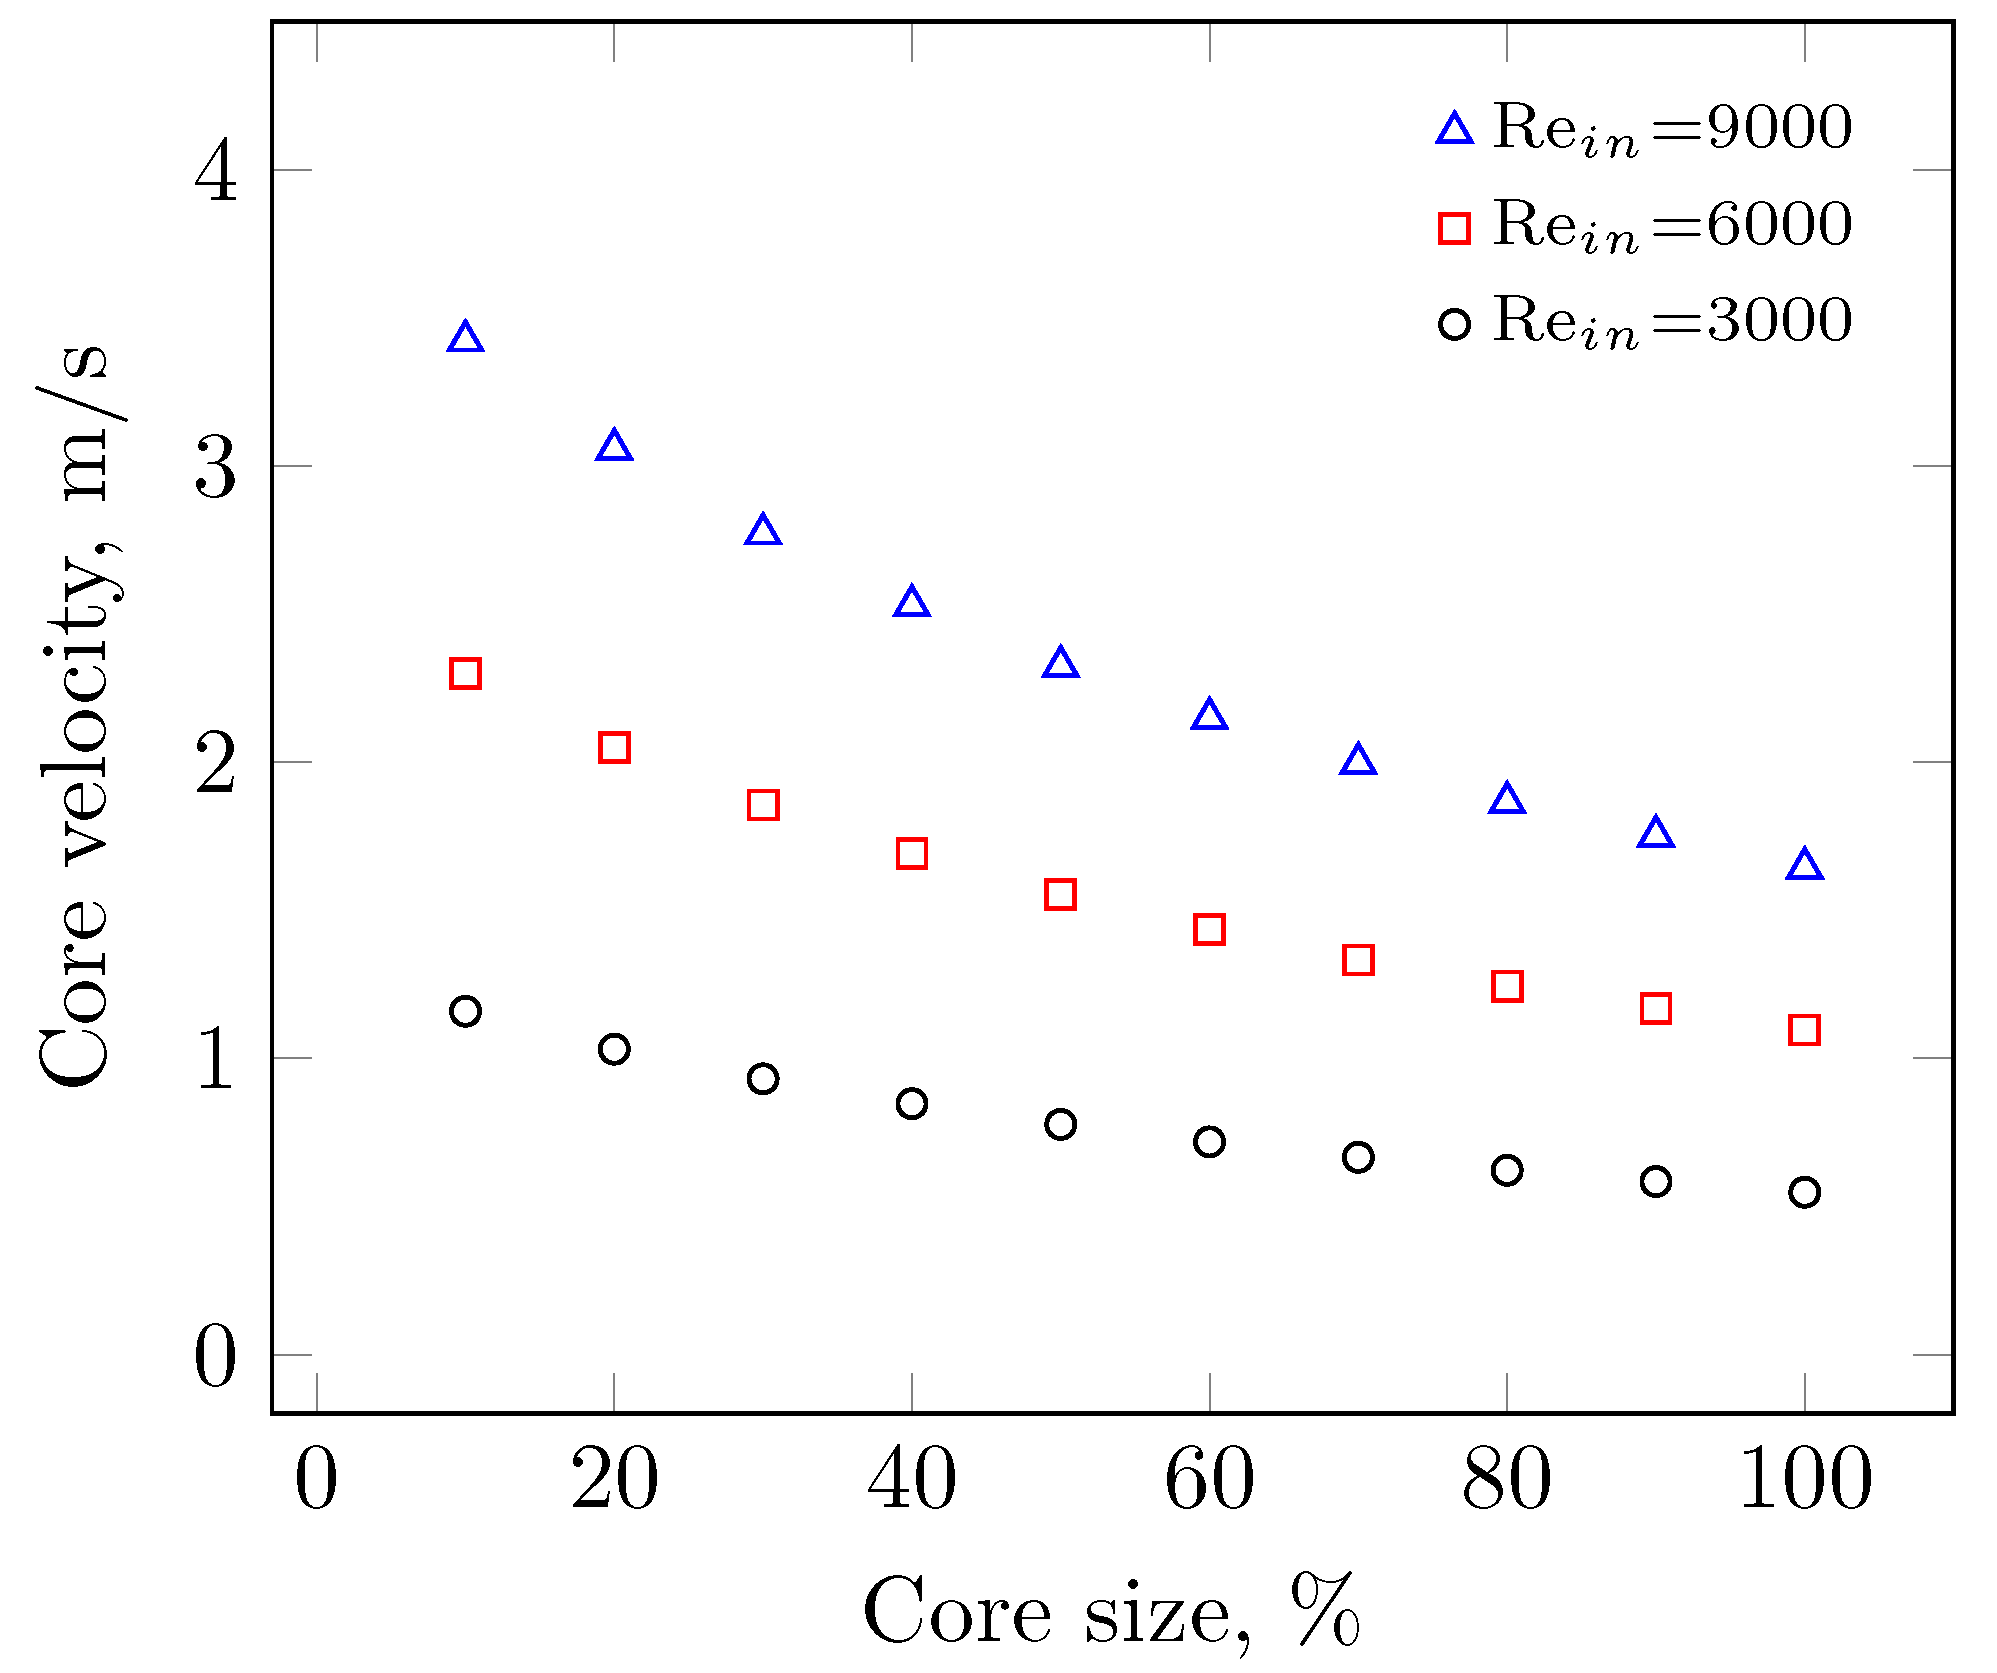
3.1. Effect of the Core Size

The first variable studied was the core size. For this analysis, both core and ring apparent permeabilities were kept constant, being α c o r e = 4.82 × 10⁻⁸ m 2 and α c o r e / α r i n g = 2.45. The core size percentage ran from 0% to 100% in 10% increments. As the output variable, the velocity profile right after the outlet of the substrate was measured. The average velocity through the core and ring was computed as the area-weighted one across the rear face of the respective region. The results are summarized in Figure 4. According to the figure, by increasing the core size, the core velocity progressively reduced, which is consistent with the increment of the core size, which is more permeable; however, the relation between the two variables seemed non-linear, being more sensitive at a lower core size and higher Re i n .

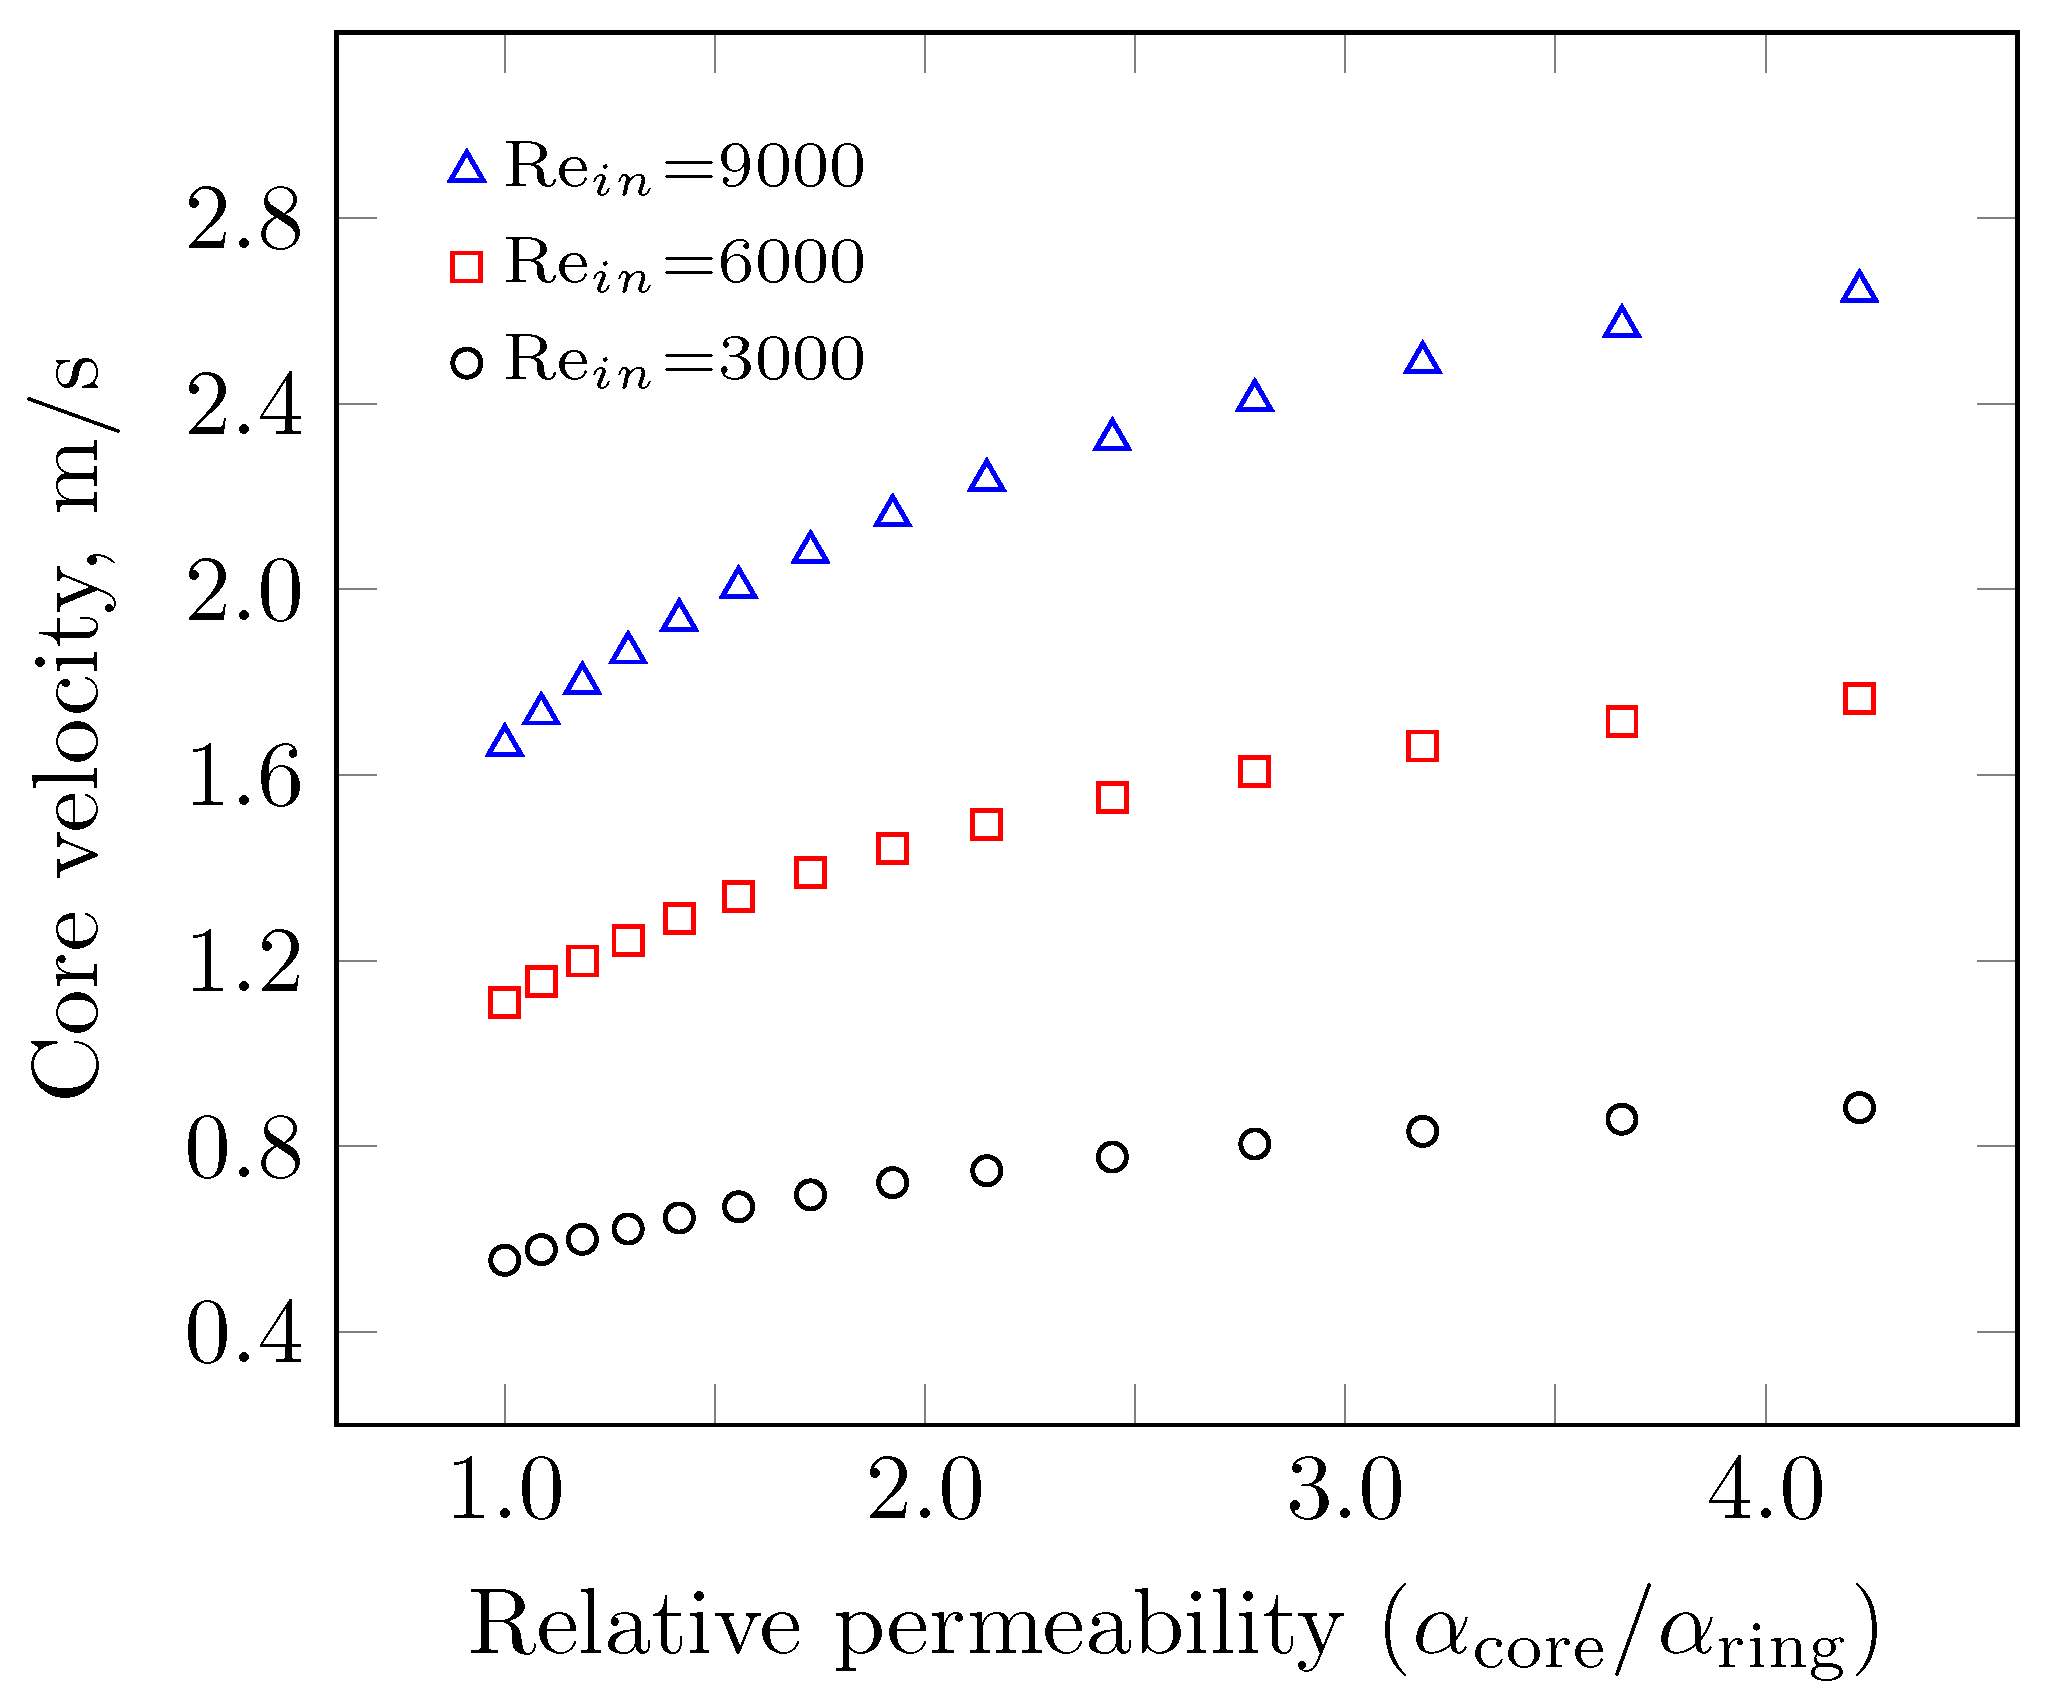
3.2. Effect of the Relative Permeability

For the effect of the relative permeability, the core size was kept fixed at 50% of the substrate size. The core permeability was 4.82 × 10⁻⁸ m 2 , while the ring permeability varied in order to obtain values of α c o r e / α r i n g from 1.00 to 4.22, since such a range covers potential differences of core and ring permeabilities found in industrial applications. Figure 5 shows the results of core velocity for several relative permeabilities and Re i n . It can be seen from the results that at a higher relative permeability, more flow passed through the core, the curve being more sensitive at lower relative permeability. The same as for the core size, this effect was more pronounced at higher Re i n .

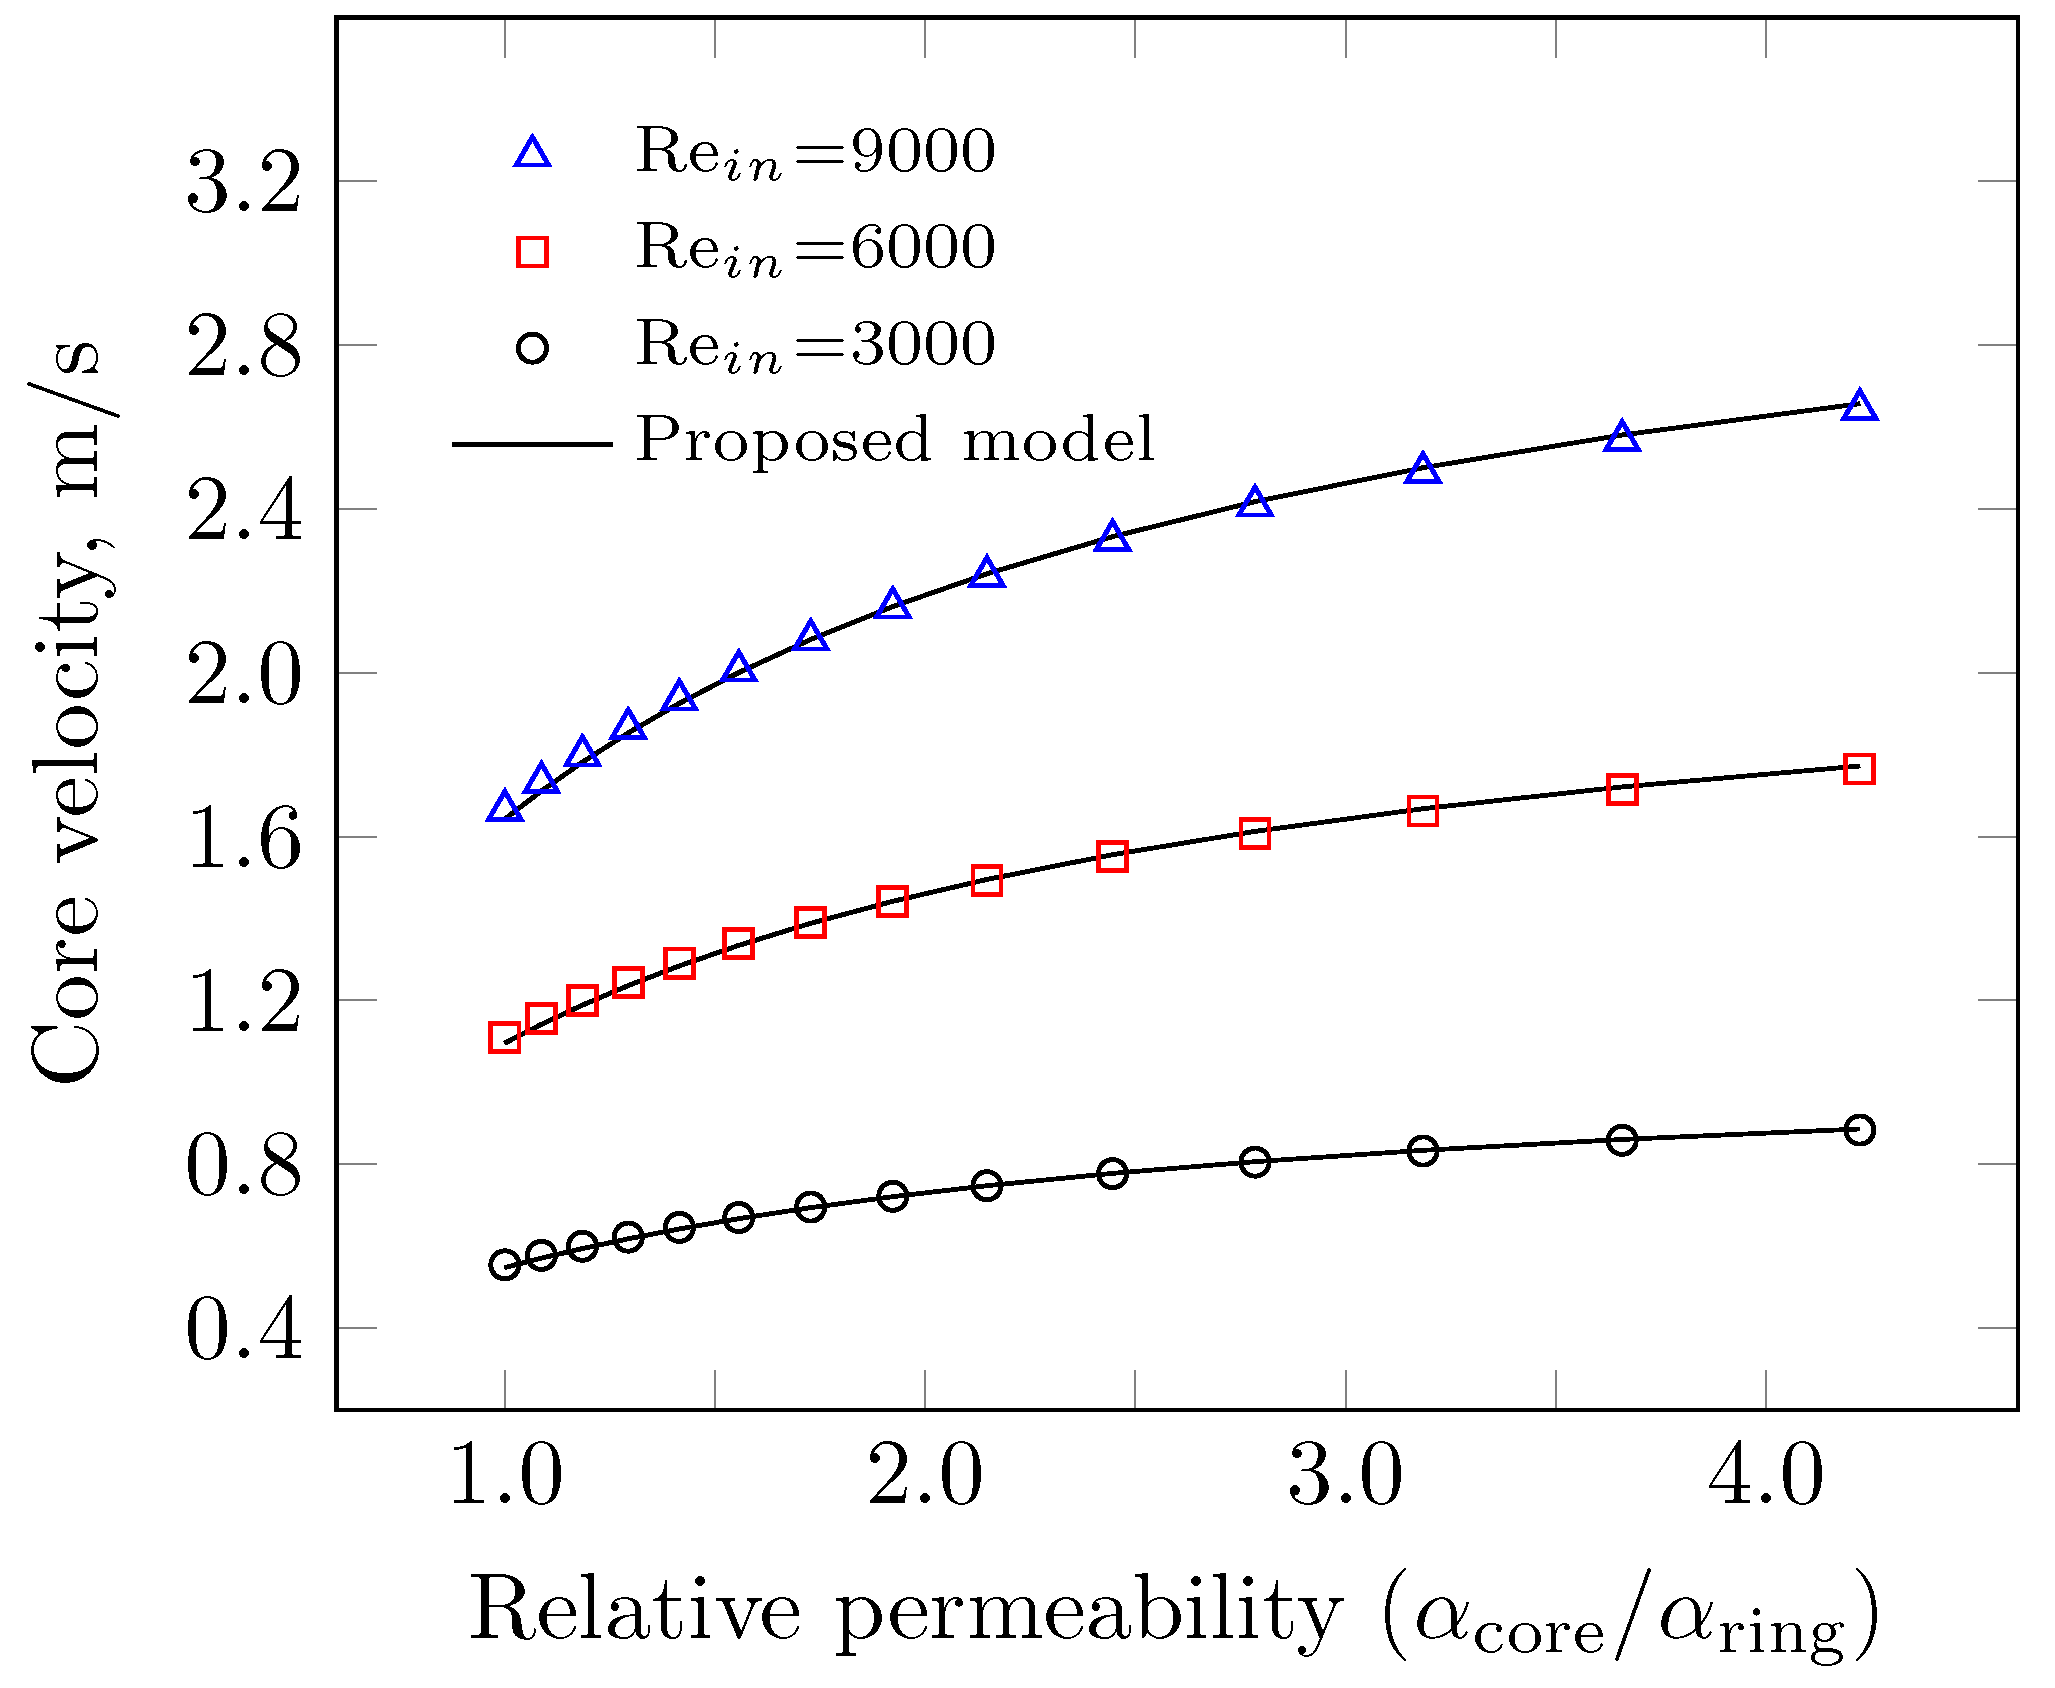
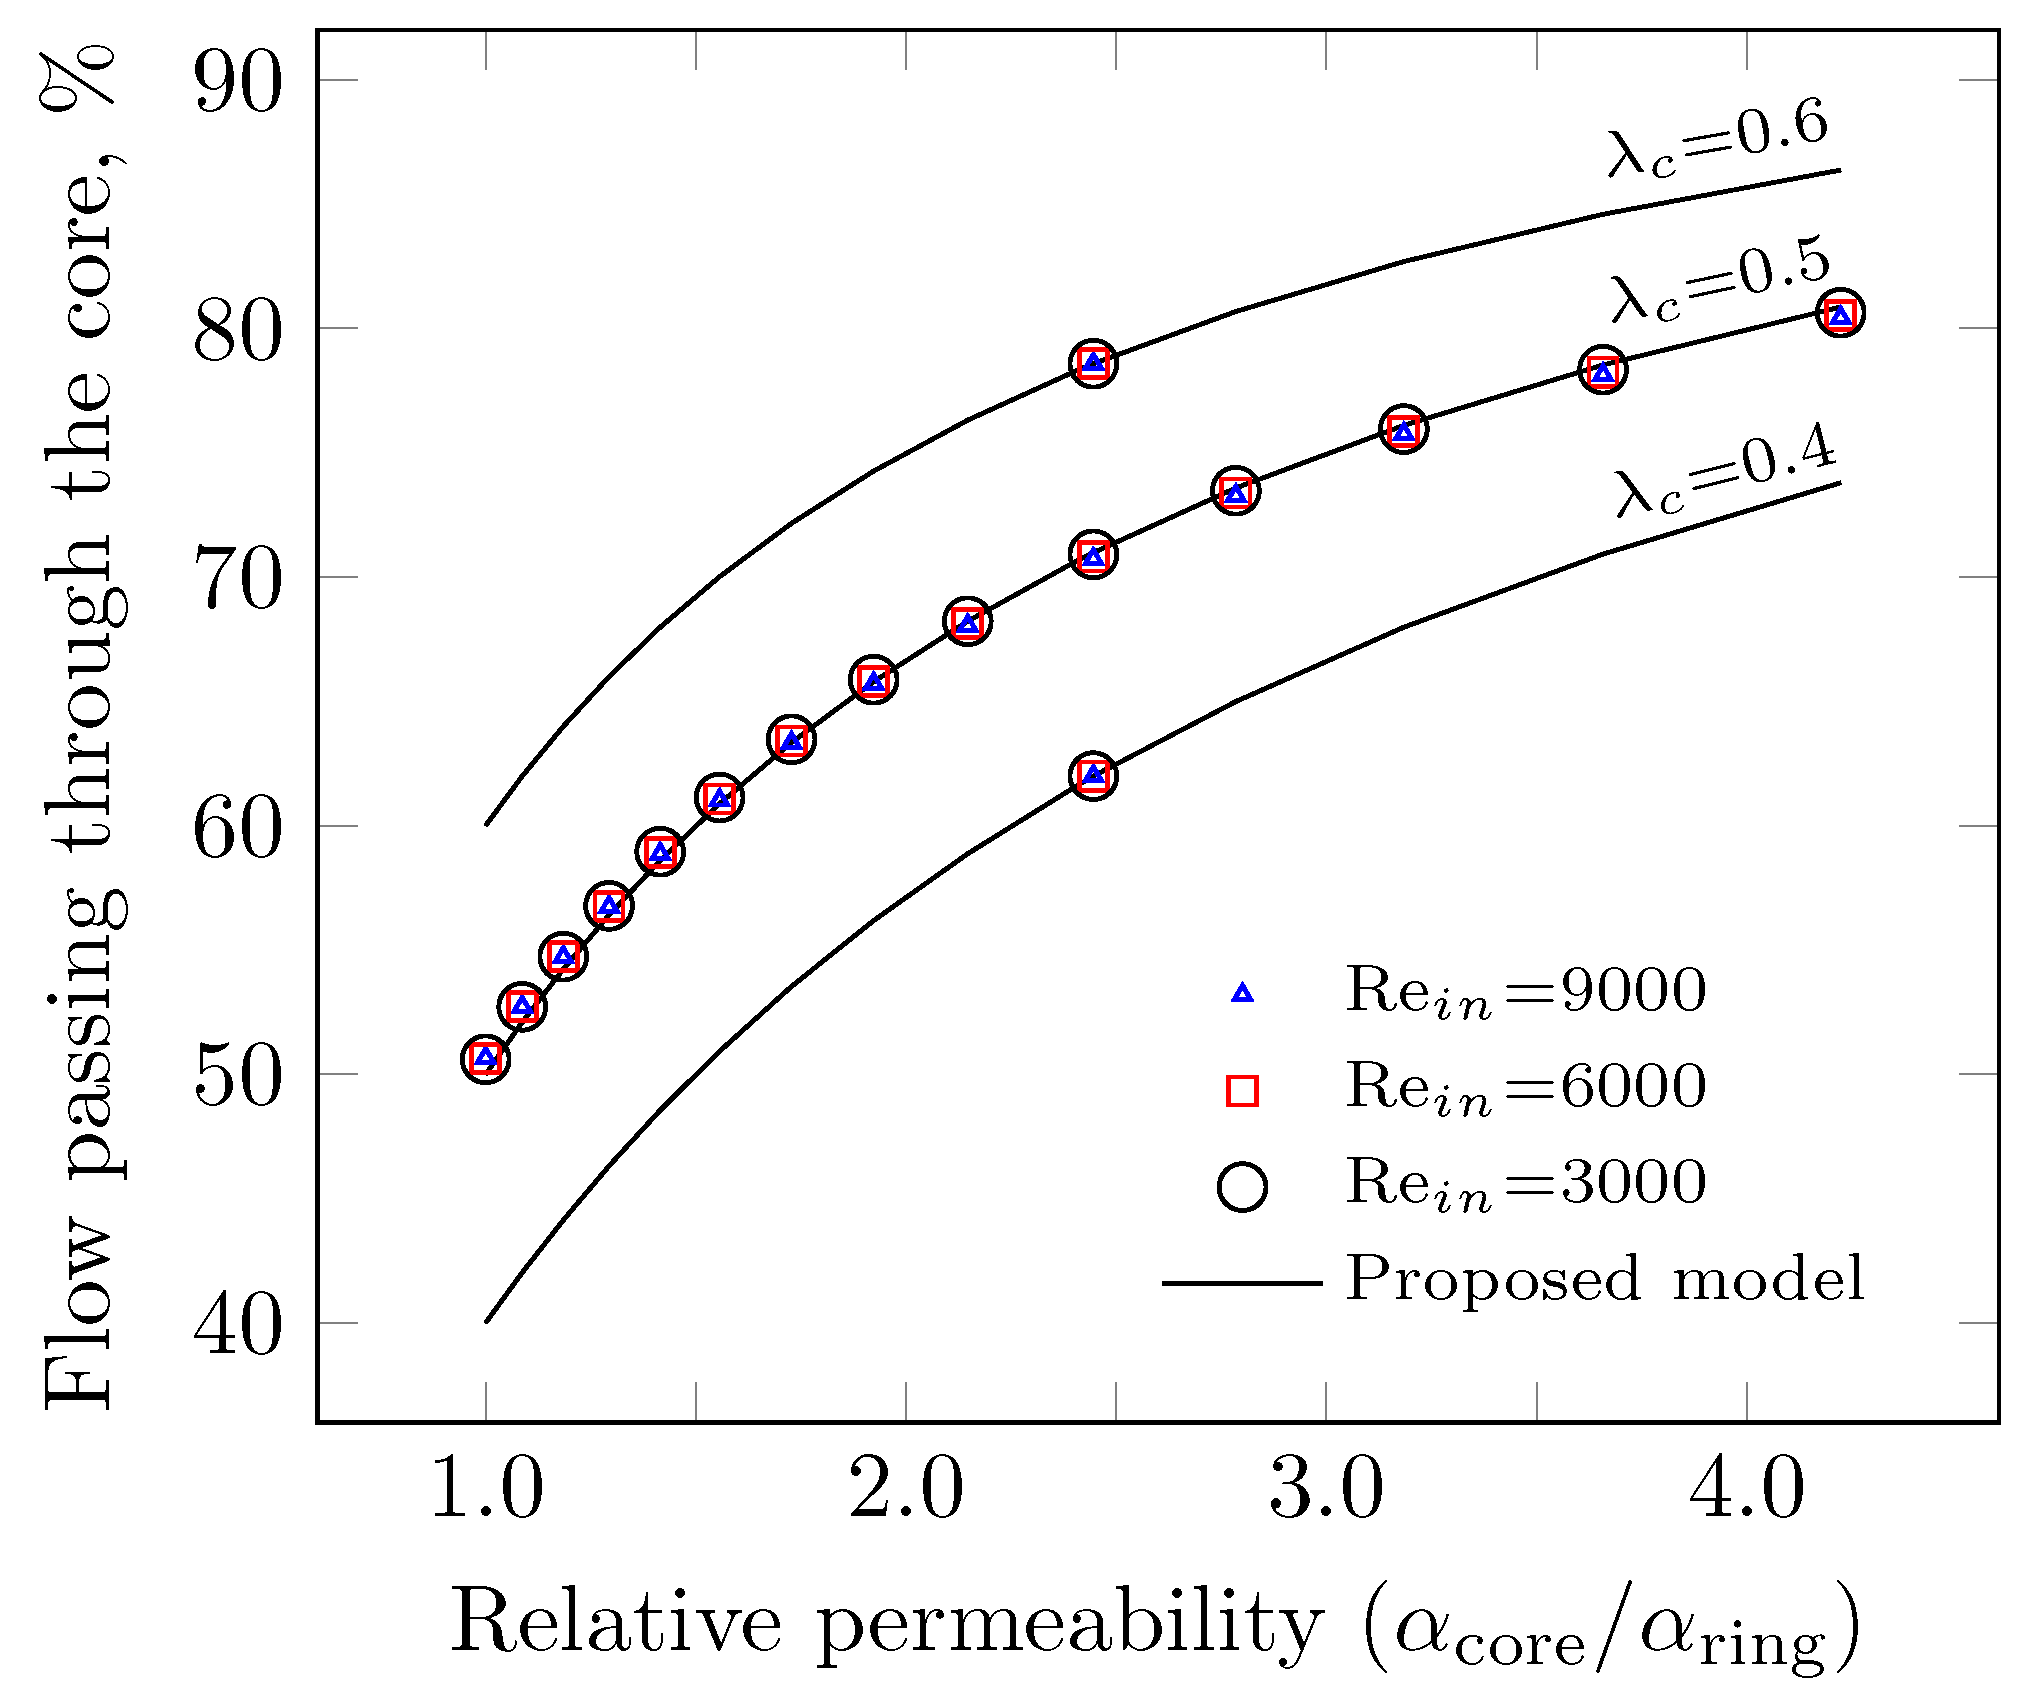
3.3. Model Development

Having performed the sensibility analysis of the main variables of this study, a model for predicting the flow distribution was developed. The path followed by a fluid through any medium is affected by viscous resistance [78]. In the case of a medium with two regions, each with different permeability, in equilibrium, the flow distributes in such a way that the backpressure through the two regions of the substrate equals. This comes from the fact that if one section offers less backpressure, then more flow would tend to pass through it, increasing backpressure; hence, the only possible stable solution is to reach the same backpressure in both regions at the expense of uneven flow distribution. That is:
Δ p c = Δ p r
By using the Darcy law:
u c μ L α c = u r μ L α r
Solving for the ring velocity:
u r = u c α r α c
There is also a relationship between the flow passing through each region of the substrate based on the mass balance:
A T u i n = A c u c + A r u r
Replacing u r from Equation (13) into Equation (14) and dividing both sides of the expression by A T :
u i n = A c A T u c + A r A T u c α r α r u r
However, ( A c / A T ) is λ c , or the fractional core size, and ( A r / A T ) is ( 1 λ c ). u c can be taken as common factors in Equation (15), so that the following explicit expression for u c is obtained:
u c = u i n λ c + ( α r / α c ) ( 1 λ c )
It should be mentioned that u c and u r are the surface velocity instead of the physical ones. That is, the velocity inside of the channels in the core and ring regions in a physical system are given by u c / ϕ c and u r / ϕ r , respectively.
Equation (16) was tested for several relative permeabilities and Re i n , showing an excellent agreement with the substrate scale data in all analyzed cases. Results are shown in Figure 6.
Even though Equation (16) tightly agrees with the substrate scale data, it would be of more interest to have an expression to predict the fraction of the flow passing through the core and, by consequence, through the ring. In a constant density system, the fraction of the flow passing through the core ( f c ) can be written as:
f c = u c u i n A c A T
Substituting ( u c / u i n ) from Equation (16) into Equation (17) and replacing ( A c / A T ) by λ c :
f c = λ c λ c + ( α r / α c ) ( 1 λ c )
Values predicted from the model in Equation (18) were compared to those from the substrate scale for several core sizes, Re i n and relative permeabilities. The results are shown in Figure 7. It can be noticed that the data for different Re i n group together when non-dimensionalized, and that the only variables influencing the flow distribution were the geometric features of the substrate. This agreed with the deductions from the proposed model. It is also seen that the model accurately predicted all the values for flow distribution at all the different conditions tested.

4. Conclusions

The flow distribution in a non-homogeneous cell density monolith, having two concentric regions, each with different cell density, was successfully investigated by using a computational model.
It can be concluded from the results that, regardless of the flow rate, the fraction of the flow passing through each part of the substrate, core and ring, depends on the relative permeability and core size. The former is defined as the ratio between the core and ring permeability, and the latter as the ratio of the core volume over the monolith one. Both depend only on the geometrical features of the substrate, namely channel cross-section shape, void fraction and channel diameter. This implies that the monolith’s physical configuration is sufficient to predict the flow distribution between the regions.
Regarding the flow rate, it is found that the flow distribution does not depend on the tube Reynolds in the tested range; however, the channel Reynolds in each part of the substrate is undoubtedly highly dependent on how the flow distributes. The same tube Reynolds can lead to significantly different channel Reynolds inside of the substrate, depending on the combination of relative permeability and core size selected. This enables design where less flow passes through the core section and more through the ring, decreasing heat released from the reaction in the centre of the tube, and potentially preventing typical overheating issues in that region in exothermic systems.
In the conditions analyzed, the relationship between the flow distribution and the relative permeability is non-linear, and more pronounced when the relative permeability is closer to unity. That is, the same increment of 1.0 in the relative permeability impacts progressively less on the flow distribution as the absolute value of the relative permeability increases.
A model for the flow distribution between the core and the ring regions is proposed. The model depends only on the relative permeability and core size. The model accurately predicted the fraction of the flow passing through the core region for several core sizes, relative permeabilities, ranging from 1.0 and 4.0, and several flow rates. The model can be used for improving catalyst monolith support design by combining two cell densities in a single monolith in order to obtain a convenient flow distribution.
Even though CFD models for predicting flow through monolith substrates, such as that used in this paper, are widely accepted and have been extensively validated, further experimental validation of the proposed model is recommended.

Author Contributions

All the authors contributed equally to the paper. All authors have read and agreed to the published version of the manuscript.

Funding

This research was funded by ANID grant number FONDECYT N11200608.

Data Availability Statement

Data is contained within the article.

Acknowledgments

The author Ivan Cornejo is grateful for the financial support provided by ANID through the FONDECYT project N 11200608.

Conflicts of Interest

The authors declare no conflict of interest.

Nomenclature

The following nomenclature is used in this manuscript:
ACross-sectional area, m
A c Cross-sectional area of the core, m
A r Cross-sectional area of the ring, m
CChannel cross-section shape factor
D H Channel hydraulic diameter, m
f c Fraction of flow through the core
LMonolith length, m
pPressure, Pa
Δ p c Pressure drop through the core, Pa
Δ p r Pressure drop through the ring, Pa
RMonolith or tube radius, m
R c Core radius, m
Re c h Channel Reynolds number, = ρ u c h D H / μ
Re i n Inlet Reynolds number, ρ u i n ( 2 R ) / μ
uVelocity Magnitude, m/s
u i Velocity vector, m/s
u i n Inlet velocity, m/s
u c h Channel velocity, m/s
u c Core velocity, m/s
u r Ring velocity, m/s
α i Apparent permeability vector, m 2
α c , α c o r e Core apparent permeability, m 2
α r , α r i n g Ring apparent permeability, m 2
λ c Core fractional size
ϕ Substrate void fraction
ρ Density, kg / m 3
μ Molecular viscosity, Pa·s

References

  1. Dincer, I. Comprehensive Energy Systems; Elsevier: Amsterdam, The Netherlands, 2018. [Google Scholar]
  2. Nauman, E.B. Chemical Reactor Design, Optimization, and Scaleup; John Wiley & Sons: Hoboken, NJ, USA, 2008. [Google Scholar]
  3. Silveston, P.; Hudgins, R.R.; Renken, A. Periodic operation of catalytic reactors—Introduction and overview. Catal. Today 1995, 25, 91–112. [Google Scholar] [CrossRef] [Green Version]
  4. Zhang, J.; Wang, M.; Gao, Z.; Qin, X.; Xu, Y.; Wang, Z.; Zhou, W.; Ma, D. Importance of species heterogeneity in supported metal catalysts. J. Am. Chem. Soc. 2022, 144, 5108–5115. [Google Scholar] [CrossRef]
  5. Ould-Chikh, S.; Pavan, S.; Fecant, A.; Trela, E.; Verdon, C.; Gallard, A.; Crozet, N.; Loubet, J.; Hemati, M.; Rouleau, L. Hierarchical porous catalyst support: Shaping, mechanical strength and catalytic performances. In Studies in Surface Science and Catalysis; Elsevier: Amsterdam, The Netherlands, 2010; Volume 175, pp. 193–200. [Google Scholar]
  6. De, S.; Dokania, A.; Ramirez, A.; Gascon, J. Advances in the design of heterogeneous catalysts and thermocatalytic processes for CO2 utilization. ACS Catal. 2020, 10, 14147–14185. [Google Scholar] [CrossRef]
  7. Omojola, T.; van Veen, A.C. Mechanistic insights into the conversion of dimethyl ether over ZSM-5 catalysts: A combined temperature-programmed surface reaction and microkinetic modelling study. Chem. Eng. Sci. 2021, 239, 116620. [Google Scholar] [CrossRef]
  8. Chen, J.; Li, T. Effect of catalytic washcoat shape and properties on mass transfer characteristics of microstructured steam-methanol reformers for hydrogen production. Int. J. Hydrogen Energy 2022, 47, 16375–16397. [Google Scholar] [CrossRef]
  9. Liu, W.; Wen, J.; Gong, J.; Liu, G.; Zhong, C.; Pan, J. Parametric study of methane catalytic combustion in a micro-channel reactor: Effects of porous washcoat properties. Fuel 2021, 290, 120099. [Google Scholar] [CrossRef]
  10. Jeyakumar, N.; Arumugam, C.; Narayanasamy, B.; Rajkumar, R. Effect of wash coat layers on the conversion efficiency of a catalytic converter in the SI engine. Int. J. Ambient. Energy 2022, 43, 1598–1606. [Google Scholar] [CrossRef]
  11. Bolton, G.; Hooper, C.; Mann, R.; Stitt, E. Flow distribution and velocity measurement in a radial flow fixed bed reactor using electrical resistance tomography. Chem. Eng. Sci. 2004, 59, 1989–1997. [Google Scholar] [CrossRef]
  12. Mei, D.; Liang, L.; Qian, M.; Lou, X. Modeling and analysis of flow distribution in an A-type microchannel reactor. Int. J. Hydrogen Energy 2013, 38, 15488–15499. [Google Scholar] [CrossRef]
  13. Cornejo, I.; Nikrityuk, P.; Hayes, R.E. Heat and mass transfer inside of a monolith honeycomb: From channel to full size reactor scale. Catal. Today 2020, 383, 110–122. [Google Scholar] [CrossRef]
  14. Avila, P.; Montes, M.; Miró, E.E. Monolithic reactors for environmental applications: A review on preparation technologies. Chem. Eng. J. 2005, 109, 11–36. [Google Scholar] [CrossRef]
  15. Gokalp, B. Using the three-way catalyst monolith reactor for reducing exhaust emissions. J. Renew. Sustain. Energy 2012, 4, 043114. [Google Scholar] [CrossRef]
  16. Montebelli, A.; Visconti, C.G.; Groppi, G.; Tronconi, E.; Kohler, S. Optimization of compact multitubular fixed-bed reactors for the methanol synthesis loaded with highly conductive structured catalysts. Chem. Eng. J. 2014, 255, 257–265. [Google Scholar] [CrossRef]
  17. Kreutzer, M.T.; Kapteijn, F.; Moulijn, J.A. Shouldn’t catalysts shape up?: Structured reactors in general and gas–liquid monolith reactors in particular. Catal. Today 2006, 111, 111–118. [Google Scholar] [CrossRef]
  18. Benjamin, S.; Clarkson, R.; Haimad, N.a.; Girgis, N. An experimental and predictive study of the flow field in axisymmetric automotive exhaust catalyst systems. J. Fuels Lubr. 1996, 105, 1008–1019. [Google Scholar]
  19. Boger, T.; Heibel, A.K. Heat transfer in conductive monolith structures. Chem. Eng. Sci. 2005, 60, 1823–1835. [Google Scholar] [CrossRef]
  20. Inbamrung, P.; Sornchamni, T.; Prapainainar, C.; Tungkamani, S.; Narataruksa, P.; Jovanovic, G.N. Modeling of a square channel monolith reactor for methane steam reforming. Energy 2018, 152, 383–400. [Google Scholar] [CrossRef]
  21. Dai, C.; Lei, Z.; Zhang, J.; Li, Y.; Chen, B. Monolith catalysts for the alkylation of benzene with propylene. Chem. Eng. Sci. 2013, 100, 342–351. [Google Scholar] [CrossRef]
  22. Lei, Z.; Wen, C.; Zhang, J.; Chen, B. Selective catalytic reduction for NO removal: Comparison of transfer and reaction performances among monolith catalysts. Ind. Eng. Chem. Res. 2011, 50, 5942–5951. [Google Scholar] [CrossRef]
  23. Kang, H.K.; Woo, S.G.; Kim, J.H.; Lee, S.R.; Lee, D.G.; Yu, J.S. Three-dimensional monolithic corrugated graphene/Ni foam for highly stable and efficient Li metal electrode. J. Power Sources 2019, 413, 467–475. [Google Scholar] [CrossRef]
  24. Leung, D.; Hayes, R.; Kolaczkowski, S. Diffusion limitation effects in the washcoat of a catalytic monolith reactor. Can. J. Chem. Eng. 1996, 74, 94–103. [Google Scholar] [CrossRef]
  25. Bhattacharya, M.; Harold, M.P.; Balakotaiah, V. Mass-transfer coefficients in washcoated monoliths. AIChE J. 2004, 50, 2939–2955. [Google Scholar] [CrossRef]
  26. Zamaro, J.M.; Ulla, M.A.; Miró, E.E. Zeolite washcoating onto cordierite honeycomb reactors for environmental applications. Chem. Eng. J. 2005, 106, 25–33. [Google Scholar] [CrossRef]
  27. Walander, M.; Sjöblom, J.; Creaser, D.; Agri, B.; Löfgren, N.; Tamm, S.; Edvardsson, J. Modelling of mass transfer resistances in non-uniformly washcoated monolith reactors. Emiss. Control. Sci. Technol. 2021, 7, 153–162. [Google Scholar] [CrossRef]
  28. Wu, P.; Li, X.; Ji, S.; Lang, B.; Habimana, F.; Li, C. Steam reforming of methane to hydrogen over Ni-based metal monolith catalysts. Catal. Today 2009, 146, 82–86. [Google Scholar] [CrossRef]
  29. Arab, S.; Commenge, J.M.; Portha, J.F.; Falk, L. Methanol synthesis from CO2 and H2 in multi-tubular fixed-bed reactor and multi-tubular reactor filled with monoliths. Chem. Eng. Res. Des. 2014, 92, 2598–2608. [Google Scholar] [CrossRef]
  30. Hosseini, S.; Moghaddas, H.; Soltani, S.M.; Kheawhom, S. Technological applications of honeycomb monoliths in environmental processes: A review. Process Saf. Environ. Prot. 2020, 133, 286–300. [Google Scholar] [CrossRef]
  31. Salamon, E.; Cornejo, I.; Mmbaga, J.P.; Kołodziej, A.; Lojewska, J.; Hayes, R.E. Investigations of a three channel autogenous reactor for lean methane combustion. Chem. Eng. Process.-Process Intensif. 2020, 153, 107956. [Google Scholar] [CrossRef]
  32. Hayes, R.E.; Cornejo, I. Multi-scale modelling of monolith reactors: A 30-year perspective from 1990 to 2020. Can. J. Chem. Eng. 2021, 99, 2589–2606. [Google Scholar] [CrossRef]
  33. Nguyen, D.B.; Shirjana, S.; Hossain, M.M.; Heo, I.; Mok, Y.S. Effective generation of atmospheric pressure plasma in a sandwich-type honeycomb monolith reactor by humidity control. Chem. Eng. J. 2020, 401, 125970. [Google Scholar] [CrossRef]
  34. Hayes, R.E.; Fadic, A.; Mmbaga, J.; Najafi, A. CFD modelling of the automotive catalytic converter. Catal. Today 2012, 188, 94–105. [Google Scholar] [CrossRef]
  35. Cornejo, I.; Nikrityuk, P.; Hayes, R.E. The influence of channel geometry on the pressure drop in automotive catalytic converters: Model development and validation. Chem. Eng. Sci. 2020, 212, 115317. [Google Scholar] [CrossRef]
  36. Tsinoglou, D.N.; Koltsakis, G.C.; Missirlis, D.K.; Yakinthos, K.J. Transient modelling of flow distribution in automotive catalytic converters. Appl. Math. Model. 2004, 28, 775–794. [Google Scholar] [CrossRef]
  37. Negri, M.; Wilhelm, M.; Hendrich, C.; Wingborg, N.; Gediminas, L.; Adelöw, L.; Maleix, C.; Chabernaud, P.; Brahmi, R.; Beauchet, R.; et al. New technologies for ammonium dinitramide based monopropellant thrusters—The project RHEFORM. Acta Astronaut. 2018, 143, 105–117. [Google Scholar] [CrossRef]
  38. Schwentenwein, M.; Homa, J. Additive manufacturing of dense alumina ceramics. Int. J. Appl. Ceram. Technol. 2015, 12, 1–7. [Google Scholar] [CrossRef]
  39. Li, X.; Li, W.; Rezaei, F.; Rownaghi, A. Catalytic cracking of n-hexane for producing light olefins on 3D-printed monoliths of MFI and FAU zeolites. Chem. Eng. J. 2018, 333, 545–553. [Google Scholar] [CrossRef]
  40. Couck, S.; Cousin-Saint-Remi, J.; Van der Perre, S.; Baron, G.V.; Minas, C.; Ruch, P.; Denayer, J.F. 3D-printed SAPO-34 monoliths for gas separation. Microporous Mesoporous Mater. 2018, 255, 185–191. [Google Scholar] [CrossRef]
  41. López, P.; Quintanilla, A.; Salazar-Aguilar, A.D.; Vega-Díaz, S.M.; Díaz-Herrezuelo, I.; Belmonte, M.; Casas, J.A. Monolithic Stirrer Reactors for the Sustainable Production of Dihydroxybenzenes over 3D Printed Fe/γ-Al2O3 Monoliths: Kinetic Modeling and CFD Simulation. Catalysts 2022, 12, 112. [Google Scholar] [CrossRef]
  42. Lommerts, B.; Graaf, G.; Beenackers, A. Mathematical modeling of internal mass transport limitations in methanol synthesis. CHemical Eng. Sci. 2000, 55, 5589–5598. [Google Scholar] [CrossRef]
  43. Ghosh, S.; Sebastian, J.; Olsson, L.; Creaser, D. Experimental and kinetic modeling studies of methanol synthesis from CO2 hydrogenation using In2O3 catalyst. Chem. Eng. J. 2021, 416, 129120. [Google Scholar] [CrossRef]
  44. Meloni, E.; Martino, M.; Iervolino, G.; Ruocco, C.; Renda, S.; Festa, G.; Palma, V. The Route from Green H2 Production through Bioethanol Reforming to CO2 Catalytic Conversion: A Review. Energies 2022, 15, 2383. [Google Scholar] [CrossRef]
  45. Di Stasi, C.; Renda, S.; Greco, G.; González, B.; Palma, V.; Manyà, J.J. Wheat-Straw-Derived Activated Biochar as a Renewable Support of Ni-CeO2 Catalysts for CO2 Methanation. Sustainability 2021, 13, 8939. [Google Scholar] [CrossRef]
  46. Huynh, H.L.; Tucho, W.M.; Shen, Q.; Yu, Z. Bed packing configuration and hot-spot utilization for low-temperature CO2 methanation on monolithic reactor. Chem. Eng. J. 2022, 428, 131106. [Google Scholar] [CrossRef]
  47. Busse, C.; Freund, H.; Schwieger, W. Intensification of heat transfer in catalytic reactors by additively manufactured periodic open cellular structures (POCS). Chem. Eng. Process.-Process Intensif. 2018, 124, 199–214. [Google Scholar] [CrossRef]
  48. Portela, R.; Marinkovic, J.M.; Logemann, M.; Schörner, M.; Zahrtman, N.; Eray, E.; Haumann, M.; García-Suárez, E.J.; Wessling, M.; Ávila, P.; et al. Monolithic SiC supports with tailored hierarchical porosity for molecularly selective membranes and supported liquid-phase catalysis. Catal. Today 2022, 383, 44–54. [Google Scholar] [CrossRef]
  49. Tronconi, E.; Groppi, G. ‘High conductivity’monolith catalysts for gas/solid exothermic reactions. Chem. Eng. Technol. 2002, 25, 743–750. [Google Scholar]
  50. Sanz, O.; Velasco, I.; Reyero, I.; Legorburu, I.; Arzamendi, G.; Gandía, L.M.; Montes, M. Effect of the thermal conductivity of metallic monoliths on methanol steam reforming. Catal. Today 2016, 273, 131–139. [Google Scholar] [CrossRef]
  51. Kim, J.Y.; Son, S. Improving Flow Efficiency of a Catalytic Converter Using the Concept of Radially Variable Cell Density-Part I; SAE Technical Paper; Report Number 1999-01-0769; SAE International: Warrendale, PA, USA, 1999. [Google Scholar]
  52. Cornejo, I.; Garreton, G.; Hayes, R.E. On the use of dual cell density monoliths. Catalysts 2021, 11, 1075. [Google Scholar] [CrossRef]
  53. Renda, S.; Di Stasi, C.; Manyà, J.J.; Palma, V. Biochar as support in catalytic CO2 methanation: Enhancing effect of CeO2 addition. J. CO2 Util. 2021, 53, 101740. [Google Scholar] [CrossRef]
  54. ANSYS Fluent Theory Guide v2022R2; ANSYS Inc.: Canonsburg, PA, USA, 2022.
  55. White, F.M. Fluid Mechanics; McGraw-Hill: New York, NY, USA, 2009. [Google Scholar]
  56. Wilcox, D.C. Reassessment of the scale-determining equation for advanced turbulence models. AIAA J. 1988, 26, 1299–1310. [Google Scholar] [CrossRef]
  57. Menter, F. Improved Two-Equation K-ω Turbulence Models for Aerodynamic Flows; NASA Technical Memorandum; ID 19930013620; NASA: Washington, DC, USA, 1992.
  58. Menter, F. Two-equation eddy-viscosity turbulence models for engineering applications. AIAA J. 1994, 32, 1598–1605. [Google Scholar] [CrossRef] [Green Version]
  59. Mesquida, I.M.V.; Cornejo, I.; Nikrityuk, P.; Greiner, R.; Votsmeier, M.; Hayes, R.E. Towards a fully predictive multi-scale pressure drop model for a wall-flow filter. Chem. Eng. Res. Des. 2020, 164, 261–280. [Google Scholar] [CrossRef]
  60. Cornejo, I.; Nikrityuk, P.; Hayes, R.E. Turbulence decay inside the channels of an automotive catalytic converter monolith. Emiss. Control. Sci. Technol. 2017, 3, 302–309. [Google Scholar] [CrossRef]
  61. Hettel, M.; Daymo, E.; Schmidt, T.; Deutschmann, O. CFD-Modeling of fluid domains with embedded monoliths with emphasis on automotive converters. Chem. Eng. Process.-Process Intensif. 2020, 147, 107728. [Google Scholar] [CrossRef]
  62. Bertrand, F.; Devals, C.; Vidal, D.; de Préval, C.S.; Hayes, R.E. Towards the simulation of the catalytic monolith converter using discrete channel-scale models. Catal. Today 2012, 188, 80–86. [Google Scholar] [CrossRef]
  63. Cornejo, I.; Nikrityuk, P.; Hayes, R.E. Pressure correction for automotive catalytic converters: A multi-zone permeability approach. Chem. Eng. Res. Des. 2019, 147, 232–243. [Google Scholar] [CrossRef]
  64. Whitaker, S. Flow in porous media I: A theoretical derivation of Darcy’s law. Transp. Porous Media 1986, 1, 3–25. [Google Scholar] [CrossRef]
  65. Cornejo, I.; Hayes, R.E.; Nikrityuk, P. A new approach for the modeling of turbulent flows in automotive catalytic converters. Chem. Eng. Res. Des. 2018, 140, 308–319. [Google Scholar] [CrossRef]
  66. Cornejo, I.; Nikrityuk, P.; Lange, C.; Hayes, R.E. Influence of upstream turbulence on the pressure drop inside a monolith. Chem. Eng. Process.-Process Intensif. 2020, 147, 107735. [Google Scholar] [CrossRef]
  67. Cornejo, I.; Nikrityuk, P.; Hayes, R.E. Turbulence generation after a monolith in automotive catalytic converters. Chem. Eng. Sci. 2018, 187, 107–116. [Google Scholar] [CrossRef]
  68. Cornejo, I.; Nikrityuk, P.; Hayes, R.E. Effect of substrate geometry and flow condition on the turbulence generation after a monolith. Can. J. Chem. Eng. 2020, 98, 947–956. [Google Scholar] [CrossRef]
  69. Al-Nassri, S.; Unny, T. Developing laminar flow in the inlet length of a smooth pipe. Appl. Sci. Res. 1981, 36, 313–332. [Google Scholar] [CrossRef]
  70. Cornejo, I. A Model for Correcting the Pressure Drop between Two Monoliths. Catalysts 2021, 11, 1314. [Google Scholar] [CrossRef]
  71. Shah, R. A correlation for laminar hydrodynamic entry length solutions for circular and noncircular ducts. J. Fluids Eng. 1978, 100, 177–179. [Google Scholar] [CrossRef]
  72. Benjamin, S.; Zhao, H.; Arias-Garcia, A. Predicting the flow field inside a close-coupled catalyst—The effect of entrance losses. PRoceedings Inst. Mech. Eng. Part C J. Mech. Eng. Sci. 2003, 217, 283–288. [Google Scholar] [CrossRef]
  73. ANSYS Fluent User’s Guide Release 2022R2; ANSYS Inc.: Canonsburg, PA, USA, 2022.
  74. Azzoni, M.E.; Franchi, F.S.; Usberti, N.; Nasello, N.D.; Castoldi, L.; Nova, I.; Tronconi, E. Dual-layer AdSCR monolith catalysts: A new solution for NOx emissions control in cold start applications. Appl. Catal. B Environ. 2022, 315, 121544. [Google Scholar] [CrossRef]
  75. Joshi, S.Y.; Harold, M.P.; Balakotaiah, V. Overall mass transfer coefficients and controlling regimes in catalytic monoliths. Chem. Eng. Sci. 2010, 65, 1729–1747. [Google Scholar] [CrossRef]
  76. Clarkson, R.J. A Theoretical and Experimental Study of Automotive Catalytic Converters. Ph.D. Thesis, Coventry University, Coventry, UK, 1997. [Google Scholar]
  77. Quadri, S. The Effect of Oblique Entry into An Automotive Catalyst on the Flow Distribution within the Monolith. Ph.D. Thesis, Coventry University Coventry, Coventry, UK, 2008. [Google Scholar]
  78. Agrawal, G.; Kaisare, N.S.; Pushpavanam, S.; Ramanathan, K. Modeling the effect of flow mal-distribution on the performance of a catalytic converter. Chem. Eng. Sci. 2012, 71, 310–320. [Google Scholar] [CrossRef]
Figure 1. Monolith having different cell densities in the core and ring regions of its cross-sectional area.
Processes 11 00827 g001
Figure 2. Schematic of the computational domain. The 2D generatrix plane rotates around the bottom axis to compose the volumetric domain.
Processes 11 00827 g002
Figure 3. Comparison between the pressure drop from the computational model and that from the Hagen–Poiseuille equation.
Processes 11 00827 g003
Figure 4. Average core velocity for several Re i n and core sizes.
Processes 11 00827 g004
Figure 5. Average core velocity for several Re i n and relative permeabilities.
Processes 11 00827 g005
Figure 6. Comparison of the proposed model and substrate scale data for several Re i n and relative permeabilities.
Processes 11 00827 g006
Figure 7. Prediction of the dimensionless model compared with the substrate scale data for several Re i n and relative permeabilities.
Processes 11 00827 g007
Table 1. List of numerical runs. For all of them α c o r e was 4.82 × 10⁻⁸ m 2 .
N Re i n α core / α ring % Core SizeN Re in α core / α ring % Core Size
130001.00503790002.1550
230001.09503890002.4550
330001.18503990002.7850
430001.29504090003.1850
530001.42504190003.6650
630001.56504290004.2250
730001.73504330002.450
830001.92504430002.4510
930002.15504530002.4520
1030002.45504630002.4530
1130002.78504730002.4540
1230003.18504830002.4560
1330003.66504930002.4570
1430004.22505030002.4580
1560001.00505130002.4590
1660001.09505230002.45100
1760001.18505360002.450
1860001.29505460002.4510
1960001.42505560002.4520
2060001.56505660002.4530
2160001.73505760002.4540
2260001.92505860002.4560
2360002.15505960002.4570
2460002.45506060002.4580
2560002.78506160002.4590
2660003.18506260002.45100
2760003.66506390002.450
2860004.22506490002.4510
2990001.00506590002.4520
3090001.09506690002.4530
3190001.18506790002.4540
3290001.29506890002.4560
3390001.42506990002.4570
3490001.56507090002.4580
3590001.73507190002.4590
3690001.92507290002.45100
Disclaimer/Publisher’s Note: The statements, opinions and data contained in all publications are solely those of the individual author(s) and contributor(s) and not of MDPI and/or the editor(s). MDPI and/or the editor(s) disclaim responsibility for any injury to people or property resulting from any ideas, methods, instructions or products referred to in the content.

