Article

Analysis of Unsteady Heat Transfer in the Pre-Cooling Process of 300 m3 Liquid Hydrogen Tank

State Key Laboratory of Technology in Space Cryogenic Propellants, Beijing 100028, China
*
Author to whom correspondence should be addressed.
Processes 2023, 11(3), 787; https://doi.org/10.3390/pr11030787
Submission received: 4 February 2023 / Revised: 25 February 2023 / Accepted: 3 March 2023 / Published: 7 March 2023
(This article belongs to the Special Issue Liquid Hydrogen Production and Application)

Abstract

:
A mathematical model for the pre-cooling process was established to solve the problems of the long pre-cooling time and uncertain parameters of cryogenic propellant tanks. The pre-cooling parameters of a 300 m3 liquid hydrogen tank at several cooling rates were calculated and analyzed. The results show that the liquid hydrogen flow required to pre-cool the gas in the tank, tank wall, accessories, and interlayer thermal insulation materials increases first and then decreases and that the liquid hydrogen flow needed to offset the heat leakage gradually increases with the temperature reduction. When the average cooling rate rose from 0.1 K/min to 1 K/min, the pre-cooling time was shortened from 2730 min to 273 min, and the consumption of liquid hydrogen decreased from 2115 kg to 2091 kg. Among the various heat loads, the inner tank wall and accessories consumed the most significant proportion of liquid hydrogen, accounting for 87.84% to 88.61%. The cooling capacity was derived from the liquid hydrogen’s evaporation and the cryogenic hydrogen gas’s heating process, of which the liquid hydrogen accounted for 23.00%. Considering the principle of safe operation, it is recommended that stepped pre-cooling in two or three stages based on the maximum cooling rate is conducted.

1. Introduction

Compared with conventional UDMH/nitrogen tetroxide propellants, liquid hydrogen/oxygen propellants have the advantages of high specific impulse; they are non-toxic and pollution-free and have significant thrust, etc.; so, they are mainly adopted in new launch rockets [1,2]. Cryogenic propellants have a low boiling point. The boiling point of liquid hydrogen is 20.4 K and that of liquid oxygen is 90.2 K. The liquid hydrogen and oxygen must be stored in specialized containers with excellent thermal insulation performance. These containers need to have excellent thermal insulation performance. Early liquid hydrogen tanks mainly used multilayer or perlite vacuum insulation [3,4,5]. In recent years, with the progress of material technology, aerogel and glass bubble insulation materials have been applied in cryogenic containers [6,7,8].
The current cryogenic propellant tanks are mostly made of austenitic stainless steel, which has a large linear expansion coefficient. The tanks are easily damaged when they are directly filled with cryogenic propellants at room temperature as this operation can dramatically change the tank temperature and result in substantial thermal stress. Consequently, pre-cooling is required before storage tanks are filled with cryogenic propellants. According to the literature statistics, about 75% of cryogenic propellant storage accidents occurred in the pre-cooling and filling processes. Therefore, safety is the first consideration when pre-cooling cryogenic propellant tanks [9]. The greater the cooling rate is, the more it will shorten the launch preparation cycle; however, because of the restrictions due to safety factors in the practical operation process, it is necessary to keep cooling rates within a certain range. At present, at home and abroad, in terms of cryogenic tank pre-cooling rates, only the National Fire Protection Association (NFPA) has adopted a standard regarding liquefied natural gas (LNG) [10], and no technical standards on cryogenic propellant storage are available.
The existing research mainly focuses on the pre-cooling of high-pressure gaseous hydrogen tanks in the refueling station [11,12,13]. Only one paper in 2022 was concerned with the pre-cooling of liquid hydrogen tanks. Fardin used EcoSimPro software to simulate and analyze the pre-cooling process of a 113 L liquid hydrogen spherical tank. The results show that the boiling loss can be significantly reduced by pre-cooling the cryogenic tank with liquid nitrogen [14]. Currently, the pre-cooling process parameters of liquid hydrogen tanks are primarily obtained through engineering tests. A theoretical calculation model is needed for systematic research, which means that the establishment of corresponding standards for the pre-cooling of liquid hydrogen tanks lacks a theoretical basis. Based on the mass and energy balance principle under certain assumptions, an innovative pre-cooling model was established for 300 m3 liquid hydrogen tanks to calculate the dynamic change trends in inner temperature and cold source mass consumption at different cooling rates. The pre-cooling process parameters under different working conditions were compared and analyzed. The results provide theoretical support for the selection of the practical pre-cooling process parameters of cryogenic propellant tanks.

2. Establishment of a Pre-Cooling Model

2.1. Analysis of Heat Transfer in the Pre-Cooling Process

The cryogenic storage tanks commonly used at space launch sites include liquid hydrogen tanks, liquid oxygen tanks, and liquid nitrogen tanks. After installing the cryogenic tanks, it is necessary to carry out hydrostatic tests. It is inevitable that there will be a large amount of free water and vapor residuals inside the tanks after tests. To reduce the moisture content inside the cryogenic propellant tank, nitrogen or propellant gas is used to purge the internal space of the tank until it is detected that the dew point of the container meets the requirements.
The original gas inside the tank and the inner tank wall, interlayer thermal insulation materials, and external tank wall are all at room temperature at the beginning of pre-cooling. When the liquid propellant enters the inner tank through the inlet pipe at the bottom and contacts the bottom wall, boiling heat transfer occurs. The formed vapor, the original normal temperature gas, and the tank wall will generate further convection heat transfer. The propellant changes from liquid to gas in the process, and the form of heat transfer changes from latent heat to sensible heat. In the process, the bottom wall temperature goes down, and the inner tank wall temperature decreases slowly from bottom to top.
Meanwhile, the interlayer’s temperature decreases gradually from the inside out through heat conduction. When the temperature of the inner tank wall and interlayer close to the wall drops to the boiling temperature of the propellant, the liquid propellant begins to be stored in the inner tank. The accumulated liquid mass rises gradually. At a certain moment, the heat transfer between the liquid propellant and the wall is converted to heat conduction. When the vapor temperature is high, boiling heat transfer is conducted between the liquid propellant and vapor at the liquid level, and the vapor temperature goes down gradually. During the whole pre-cooling process, in addition to the heat transfer between the inner propellant and the tank, the external air constantly transmits heat to the external tank wall through natural convection. The outer wall, interlayer, and internal wall exchange heat through radiation and heat conduction. Then, the inner wall transmits heat to the propellant inside the tank through convection heat transfer.

2.2. Model Hypothesis

The cryogenic propellant tank pre-cooling process is a complicated, unsteady heat transfer process and includes three heat transfer forms: heat conduction, convection, and radiation. It is not easy to make a precise heat transfer analysis of the process, and it is necessary to form hypotheses about the process below to simplify the calculation:
  • The pre-cooling liquid and gas inside the tank are uniform in temperature distribution and have no thermal stratification.
  • The temperature of the inner wall surface and the fluid medium in the tank are the same and are changed synchronously. In addition, it is assumed that the external wall temperature is the same as the environmental temperature.
  • Inner pressure fluctuation exists in the practical pre-cooling process, and it is assumed that the pressure is a constant value to simplify the calculation.
  • The heat flow vertical to the thermal insulation materials is significantly greater than that parallel to the tank wall; so, only the radial heat transfer is calculated without considering the tangential heat transfer.
  • The level of liquid hydrogen stored in a 300 m3 tank is very low in the pre-cooling process. Considering the model’s simplification, it is feasible to ignore the liquid volume.

2.3. Pre-Cooling Process Mathematical Model

Figure 1 shows the structure of the liquid hydrogen tank and the heat during pre-cooling. The cooling capacity consumed for propellant tank pre-cooling mainly included: (1) the cooling capacity Q1 required to cool the gas at room temperature in the tank to the boiling temperature of the propellant; (2) the Q2 required to cool the inner tank wall and other metal accessories; (3) the Q3 required to cool the interlayer materials; and (4) the Q4 required to offset the heat leaked. The cooling capacity in the pre-cooling process was mainly the latent heat released from the phase transition of the pre-cooling media and the sensible heat Q5 from the rising gas temperature. Based on the principle of energy balance:
Q 1 + Q 2 + Q 3 + Q 4 + Q 5 = 0

2.3.1. Cooling Capacity Required to Lower the Gas Temperature in the Tank

The Equation (2) is as follows:
Q 1 = C p 1 · m 1 · d T / d t
Cp1 is the specific heat of the pre-cooling medium gas at constant pressure; m1 is the gas mass in the tank; and dT is the temperature variation per unit of time. The gas mass in the tank can be obtained based on the real gas state equation, namely:
P · V = Z · m 1 · R g · T
In the equation above, P is the absolute pressure of the inner tank gas; V is the tank volume; Rg is the pre-cooling medium gas constant; Z is the gas compressibility factor; and T is the gas temperature and a function of the pre-cooling time:
T = f t
The tank’s temperature at the initial time is the ambient temperature T0, and after pre-cooling, the temperature drops to the propellant saturation temperature Tsat. In the references [15,16,17,18] on the LNG tank pre-cooling process, it was assumed that the temperature was distributed linearly and that the cooling rates at the beginning and end of pre-cooling were constant values; however, this was not in line with the actual engineering practice, as the cooling rates at the beginning and end of pre-cooling were 0. The equation above met the following:
T 0 = f 0
T s a t = f t l a s t
0 = f 0
0 = f t l a s t

2.3.2. Cooling Capacity Required to Cool the Inner Tank Wall and Other Metal Accessories

The Equation (9) is as follows:
Q 2 = C p 2 · m 2 · d T / d t
Cp2 is the specific heat of the inner tank wall and other metal accessories at constant pressure, and m2 is the corresponding metal mass.

2.3.3. Cooling Capacity Required for Interlayer Insulation Materials

The Equation (10) is as follows:
Q 3 = α · ( C p 3 · m 3 + C p 4 · m 4 ) · d T / d t
Cp3 is the specific heat of the aluminum foil; m3 is the mass of the aluminum foil; Cp4 is the specific heat of the glass fiber cloth; m4 is the mass of the glass fiber cloth; and α is the pre-cooling calculation coefficient of the interlayer insulation materials. The calculation coefficient was defined as the ratio between the heat absorbed to pre-cool a specific thermal insulation layer to a steady working condition and that absorbed to pre-cool all the thermal insulation layers to the propellant saturation temperature [19]. Under the assumption of a stable working condition where the temperature of the external tank wall was at the same temperature as the environmental temperature T0, and the innermost layer temperature of the inner wall was the same as the propellant saturation temperature Tsat, if the average temperature of the thermal insulation layer under a steady working condition T m ¯ was obtained, the calculation coefficient α could be obtained with the following equation:
α = T 0 T m ¯ T 0 T s a t

2.3.4. Cooling Capacity Required to Offset Heat Leaked from the Tank

In the pre-cooling process, the environment constantly imported heat into the tank, and the value is the heat absorbed by the evaporation capacity of the propellant liquid in the tank under steady working conditions:
Q 4 = θ · ρ l · V · γ 4
θ is the tank evaporation rate, the quantity of which was derived from reference [20]. ρ l is the liquid propellant density, V is the tank volume, and γ 4 is the latent heat of the propellant evaporation.

2.3.5. Cooling Capacity Released from Pre-Cooling Media

The Equations (13)–(16) are as follows:
Q 5 = q m · γ 5 + C p 5 · q m · T T s a t
M = t 1 t N q m
w i = t 1 t N Q i t 1 t N Q 5
w γ = t 1 t N q m · γ 5 t 1 t N Q 5
where q m is the mass of the pre-cooling medium required per unit of time; C p 5 is the specific heat of the pre-cooling medium gas at constant pressure; and γ 5 is the latent heat of the pre-cooling medium evaporation. The total medium mass consumed for pre-cooling M is the sum of the pre-cooling medium mass of each unit of time; w i the percentage of cooling capacity consumed by each heat load in the whole process of pre-cooling; and w γ is the percentage of cooling capacity from the latent heat of evaporation.
In addition to the equations above, besides the necessity to separately calculate the calculation coefficient of the time-dependent temperature variation and interlayer material pre-cooling, others are available by referring to the relevant manuals and product data. Then, Q1Q5 was calculated and put into Equation (1) to obtain the time-dependent change trends of the pre-cooling media consumed.

2.4. Parameter Calculation Flow in the Pre-Cooling Process

The practical pre-cooling process is unsteady and is regarded as a steady process per unit of time in the programming calculation in order to simplify the analysis. The temperature variation dTn within every unit of time was calculated with Equations (4)–(8), and the hydrogen temperature Tn could be obtained. Within the first unit of time, Q1Q4 could be calculated with Equations (2) and (9)–(12); then, the pre-cooling medium mass consumed was obtained with Equations (1) and (13). From the second unit of time to the end of the calculation, the calculation process of each unit of time was the same as that of the first unit of time. The pre-cooling medium mass within every unit of time was obtained. The total pre-cooling mass was obtained by adding the consumed mass of each unit of time with Equation (14). Finally, the various heat weights were calculated with Equations (15) and (16). Accordingly, the pre-cooling process’s iterative calculation was performed until the inner temperature reached the boiling temperature of the propellant. In the paper, the pre-cooling process was programmed with MATLAB software. Figure 2 shows the flow diagram of the pre-cooling parameter calculation.

3. Relevant Parameters of 300 m3 Liquid Hydrogen Tank

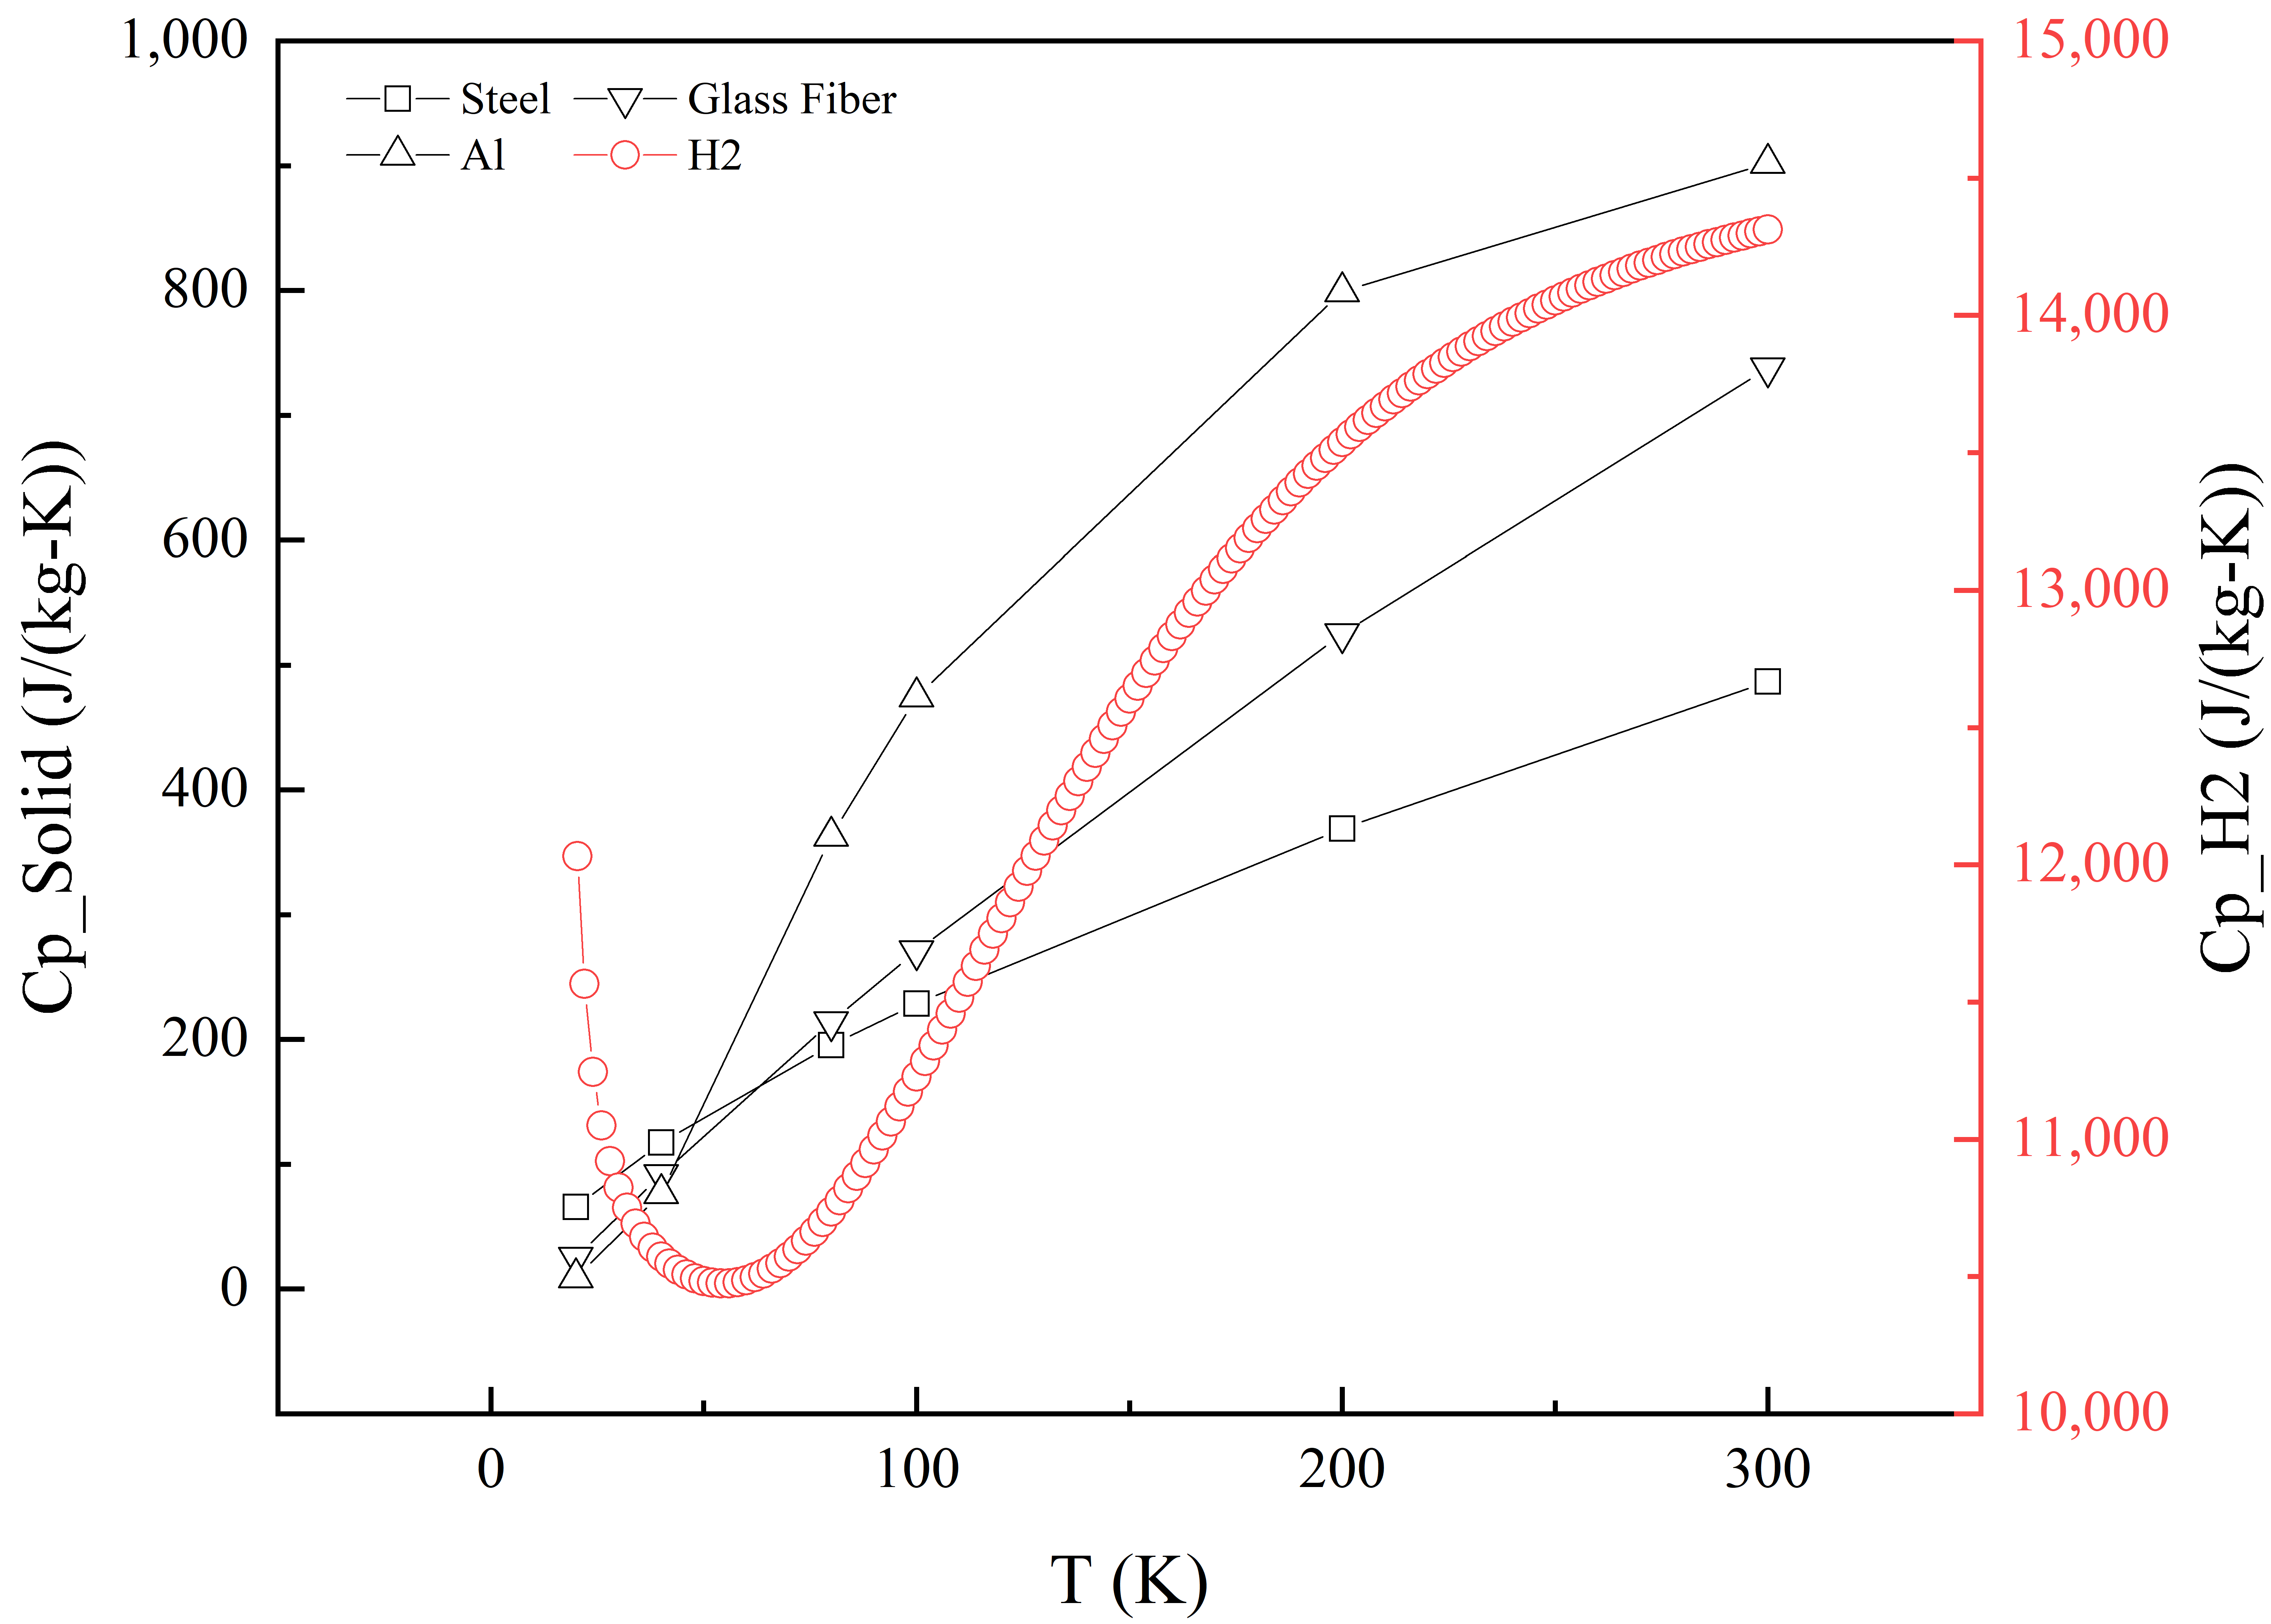
3.1. Liquid Hydrogen Tank and Basic Parameters of Relevant Materials

The parameter calculation of the pre-cooling process was conducted for the laboratory 300 m3 liquid hydrogen tank, which was regarded as the research object in the paper. The inner tank of the liquid hydrogen tank was made of 06Cr18Ni11Ti; its external tank was made of 16MnDR and was made of aluminum foil and alkali-free glass fiber cloth. The adiabatic layer was wrapped for 200 layers. The pre-cooling fluid of the 300 m3 tank was liquid hydrogen, and the basic parameters are shown in Table 1. Figure 3 shows the fitted specific heat of the liquid and the solid materials in a liquid hydrogen tank.

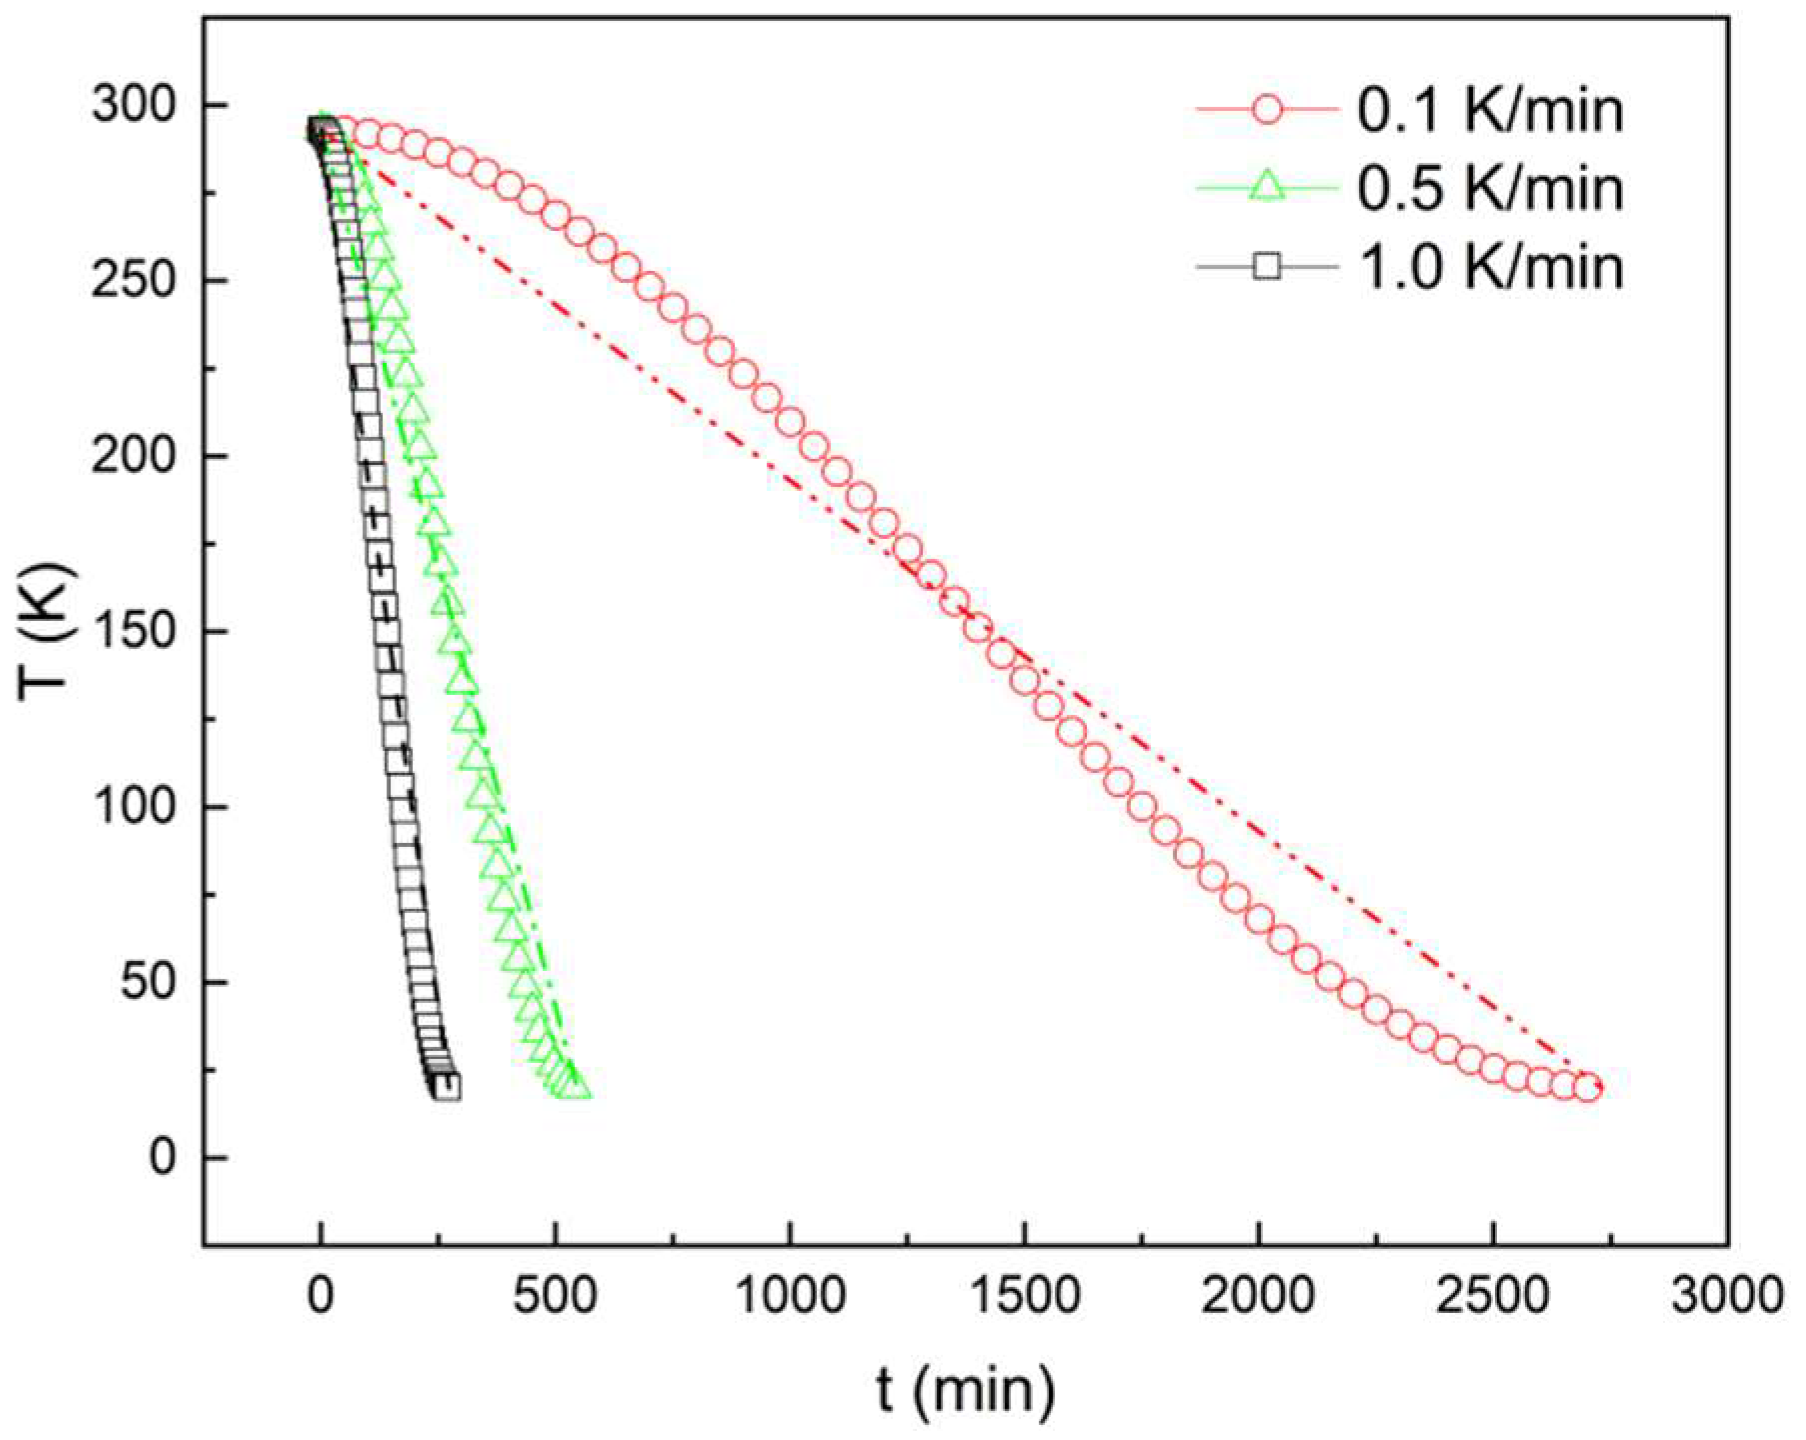
3.2. Cooling Rate and Temperature Distribution in Liquid Hydrogen Tank Pre-Cooling Process

The cooling rates of large-scale LNG tanks are generally controlled within the range of 3–5 K/h, and the average cooling rates of rocket cryogenic propellant tanks are mainly in the field of 20–40 K/h. The average tank cooling rates were set to be ten values at the range of 0.1–1 K/min (namely 6–60 K/h) in the paper, and the difference between the two adjacent rates was 0.1 K/min. Considering that the cooling rates were both 0 at the beginning and end of pre-cooling, the temperature distribution was set as a cubic polynomial function with time T and the unit of time of 1 min, namely:
T = f t = a t 3 + b t 3 + c t + d
Based on a certain average cooling rate, Equations (5)–(8) were put into the equation above to obtain the corresponding parameter values and temperature distribution. The curves in Figure 4 show the temperature distribution at the average cooling rates of 0.1 K/min, 0.5 K/min, and 1 K/min, respectively.

3.3. Pre-Cooling Coefficient Calculation of Multi-Layered Thermal Insulation Materials

A heat transfer analysis model was established to obtain the temperature distribution of the interlayer materials at the end of the pre-cooling process, considering the heat conduction and radiation from the inner wall to the external wall. The diameter of the inner tank was 4200 mm, the wall thickness was 14 mm, and the internal wall temperature was 20.4 K. The diameter of the external tank was 4800 mm, the wall thickness was 14 mm, and the exterior wall temperature was 293.15 K. The thickness of the multi-layered thermal insulation materials was 60 mm. The apparent thermal conductivity was 2 × 10⁻⁵ W/(m•K), and the emissivity of the double-faced aluminized film was 0.05. The radiation model was selected as “surface to surface.” The temperature distribution was obtained after calculation with the FLUENT software and is shown in Figure 5.
The average temperature of the adiabatic layer, T m ¯ 153.63 K, could be obtained through the temperature distribution at the end of pre-cooling, and the calculation coefficient α 0.5115 was available by putting it into Equation (11).

4. Result and Discussion

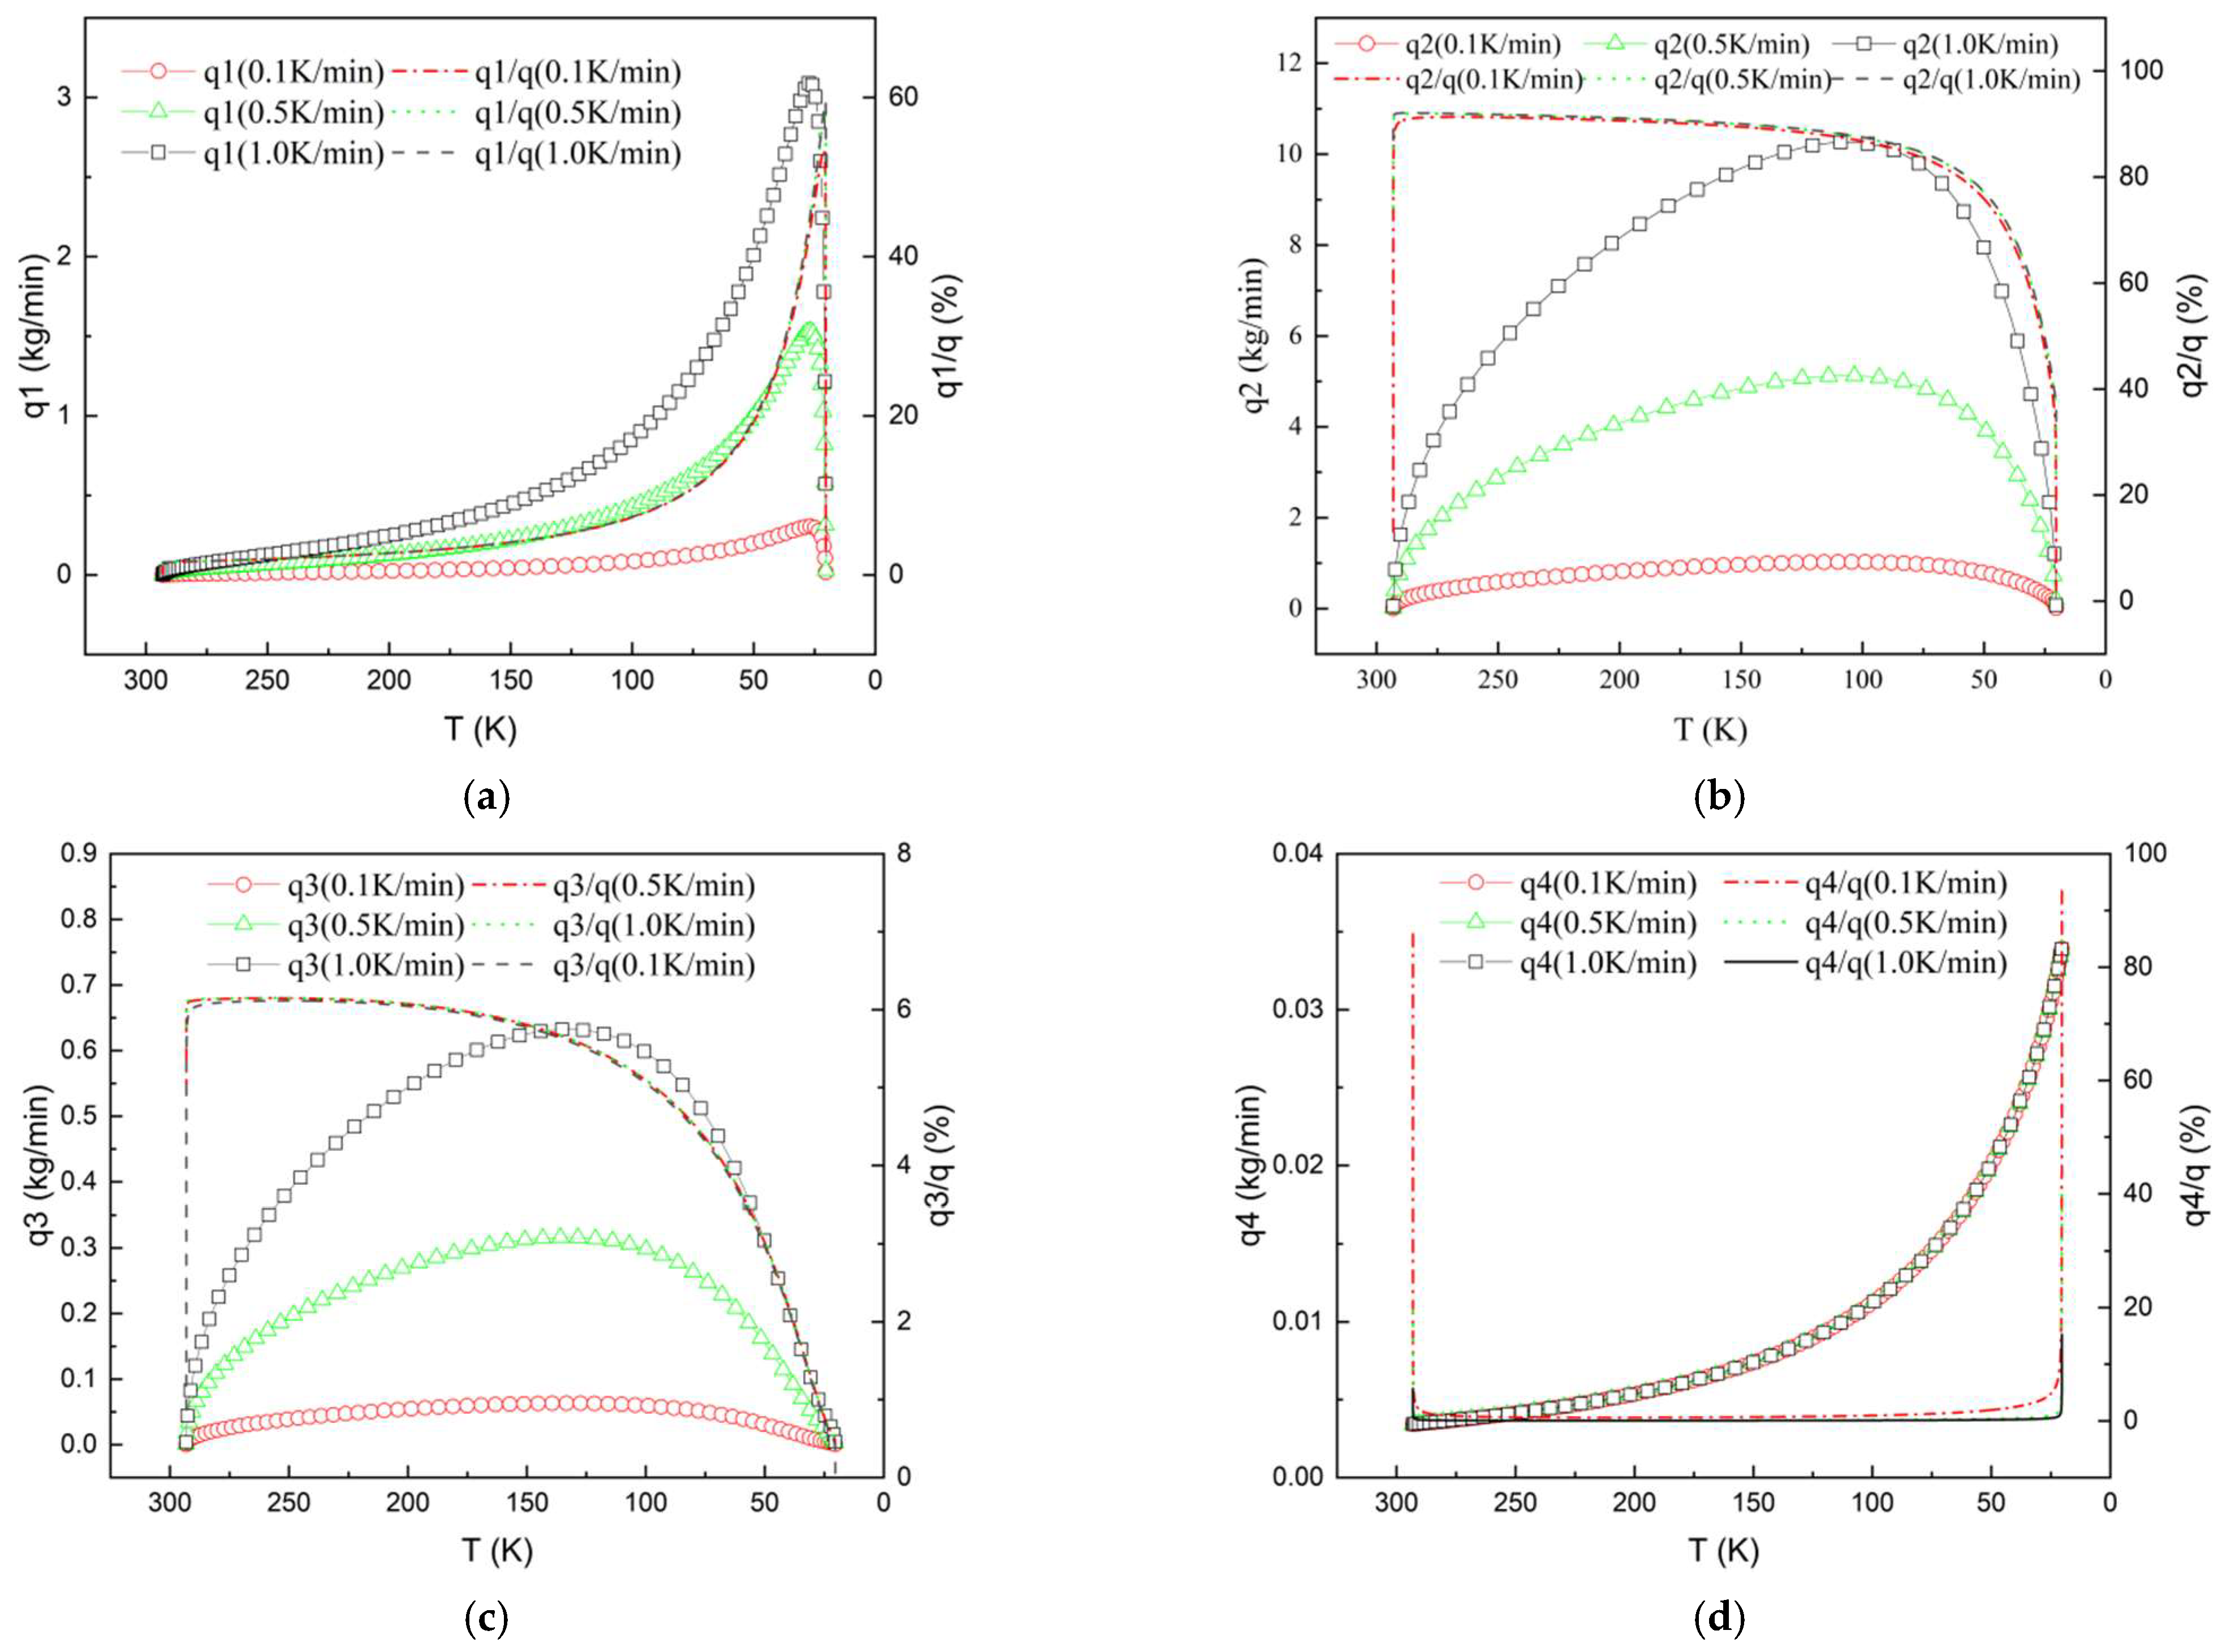
4.1. Hydrogen Mass Flow for Pre-Cooling at Different Cooling Rates

Figure 6 shows the temperature-dependent distribution of the liquid hydrogen mass flow consumed by various heat loads at the average cooling rates of 0.1 K/min, 0.5 K/min, and 1 K/min. q1 is the liquid hydrogen mass required to cool the gas in the tank per unit of time. q2 is that which is required to cool the tank wall and the accessories per unit of time. q3 is that which is needed to cool the thermal insulation materials per unit of time, and q4 is necessary to offset the heat leakage of the tank per unit of time. Generally, q1–q3 went up and then down with the fall in temperature in the pre-cooling process, as they had a positive correlation with the specific heat of the materials and the temperature change rate per unit of time, which played a dominant role. Figure 4 shows that the temperature change rates went up and down in keeping with the corresponding temperature change trends. In the pre-cooling process, q4 kept rising and was negatively correlated with the temperature; it was not relevant to the temperature change rates. When q1 was the maximum, the corresponding temperature was 27 K, that of q2 was 106 K, and that of q3 was 134 K. In different pre-cooling stages, the proportion of liquid hydrogen consumed by the four heat loads was different.q4 had the most significant proportion, ranging from 85% to 95% at the beginning and end of pre-cooling. The reason is that pre-cooling needs to offset the external heat initially, and all the materials were pre-cooled at the end. In the middle pre-cooling process, q1 and q2 accounted for a more significant proportion, with the maximum values of 60% and 90%, respectively, because the steel’s mass and the hydrogen’s specific heat are relatively large. The maximum proportion of q3 was 6%, which did not play a leading role in the pre-cooling process.
Figure 7 shows the total liquid hydrogen flow q in the pre-cooling process. It can be seen that the liquid hydrogen flow rose with the fall in temperature, as q1–q4 went up in the range of 293–90 K. In the 90–20 K field, the liquid hydrogen flow decreased with the fall in temperature as the increasing range of q1 and q4 could not offset the reduced value of q2 and q3.

4.2. Pre-Cooling Process Parameters at Different Cooling Rates

Table 2 and Figure 8 show the pre-cooling time, the total mass of liquid hydrogen consumed, the proportions of the various heat loads, and the liquid hydrogen’s total flow at different cooling rates. The larger the average cooling rate, the shorter the pre-cooling time and the smaller the liquid hydrogen mass. Among the various heat loads, the proportion of liquid hydrogen consumption for offsetting heat leakage decreased with the cooling rate and that of the other three heat loads increased with the cooling rate. The cooling capacity of the inner tank wall and the accessories consumed the most significant proportion of liquid hydrogen, with a range of 87.84–88.61%; the internal gas consumed liquid hydrogen with a range of 5.64–5.74%, the interlayer vacuumed thermal insulation materials had a consumption ratio ranging from 5.50% to 5.55%. The tank heat leakage ratio was only from 0.10% to 1.01%. The cooling capacity in the pre-cooling process was mainly the latent heat evaporation of the liquid hydrogen and the heating process of the hydrogen gas, in which the former accounted for 23% and the latter 77%.
It is required to enhance efficiency and lower costs in the practical pre-cooling process; so, the optimal cooling rate was 1 K/min in the paper; the pre-cooling time was 273 min; and the amount of liquid hydrogen used was 2091 kg. However, the maximum cooling rate of a specific tank was restricted by many factors, such as mechanical structure, adiabatic pattern, etc. As a result, two or three stages are recommended to conduct stepped pre-cooling based on the maximum cooling rate in the practical process. In terms of the tank in the paper, it was assumed that the allowable maximum cooling rate was 1 K/min in a safe operation, to shorten the pre-cooling time and also to take the safety principle into account in the initial pre-cooling stage. The temperature which matches the peak of the total liquid hydrogen flow in Figure 7 could be regarded as a critical point. It was determined that the temperature range was 293.15–90 K at the first stage; the cooling rate could be set as the maximum value, namely 1.0 K/min, and the liquid hydrogen flow range was 0.00–11.72 kg/min. The temperature range was 90–20.4 K at the second stage; the cooling rate was half of the maximum value, namely 0.5 K/min, and the liquid hydrogen flow range was 0.00–5.86 kg/min.

5. Conclusions

The paper established a pre-cooling process mathematical model to analyze and calculate the pre-cooling parameters of 300 m3 liquid hydrogen tanks with average cooling rates ranging from 0.1 K/min to 1 K/min in various operating conditions. The conclusions are as follows:
In the pre-cooling process, the liquid hydrogen flow required to pre-cool the gas in the tank, tank wall, accessories, and interlayer thermal insulation materials increased first and then decreased. The liquid hydrogen required to offset the heat leakage gradually increased with the fall in temperature.
The increase in average cooling rates could reduce the pre-cooling time and the total mass of liquid hydrogen consumed. For example, when the average cooling rate of the tank rose from 0.1 K/min to 1 K/min, the pre-cooling time was shortened from 2730 min to 273 min, and the consumption of liquid hydrogen decreased from 2115 kg to 2091 kg.
The cooling capacity of the inner tank wall and accessories consumed the most significant proportion of liquid hydrogen, with a range of 87.84–88.61%; the internal gas consumed the liquid hydrogen with a range of 5.64–5.74%; the interlayer vacuumed thermal insulation materials had a consumption ratio ranging from 5.50% to 5.55%. The tank heat leakage ratio only ranged from 0.10% to 1.01%. The cooling capacity in the pre-cooling process was mainly the latent heat evaporation of the liquid hydrogen and the heating process of the hydrogen gas; the former accounted for 23% and the latter 77%.
It is recommended that a stepped pre-cooling in two or three stages based on the maximum cooling rate in the practical pre-cooling process is conducted. In terms of the 300 m3 liquid hydrogen tank in the paper, the temperature range was 293.15–90 K at the first stage, and the cooling rate could be set as the maximum value, namely 1.0 K/min. The liquid hydrogen flow range was 0.00–11.72 kg/min. The temperature range was 90–20.4 K at the second stage, and the cooling rate was half of the maximum value, namely 0.5 K/min, and the liquid hydrogen flow range was 0.00–5.86 kg/min.

Author Contributions

Conceptualization, methodology and writing, Q.C.; software, X.Z.; validation, X.Y.; formal analysis and investigation, L.Y.; resources and data curation, T.W.; visualization and supervision, G.L. All authors have read and agreed to the published version of the manuscript.

Funding

This research was funded by State Key Laboratory of Technologies in Space Cryogenic Propellants grant number [SKLTSCP1506, SKLTSCP2013].

Institutional Review Board Statement

Not applicable.

Informed Consent Statement

Not applicable.

Data Availability Statement

  • Data available in a publicly accessible repository
  • The data presented in this study are openly available in [repository name e.g., FigShare] at [doi], reference number [reference number].
  • Data available in a publicly accessible repository that does not issue DOIs
  • Publicly available datasets were analyzed in this study. This data can be found here: [link/accession number].
  • Data available on request due to restrictions eg privacy or ethical
  • The data presented in this study are available on request from the corresponding author. The data are not publicly available due to [insert reason here].
  • 3rd Party Data
  • Restrictions apply to the availability of these data. Data was obtained from [third party] and are available [from the authors/at URL] with the permission of [third party].
  • Data sharing not applicable
  • No new data were created or analyzed in this study. Data sharing is not applicable to this article.

Acknowledgments

The authors gratefully acknowledge the support from the State Key Laboratory of Technologies in Space Cryogenic Propellants (SKLTSCP1506, SKLTSCP2013).

Conflicts of Interest

The authors declare no conflict of interest.

References

  1. Liu, Z.; Li, Y. Thermal physical performance in liquid hydrogen tank under constant wall temperature. Renew. Energy 2019, 130, 601–612. [Google Scholar] [CrossRef]
  2. Jiachao, L.; Guozhu, L. Analysis of Thermal Management Technology and its Application Progress for Launch Vehicle Cryogenic Propellants. Astronaut. Syst. Eng. Technol. 2017, 1, 59–70. [Google Scholar]
  3. Fesmire, J.E. Layered composite thermal insulation system for nonvacuum cryogenic applications. Cryogenics 2016, 74, 154–165. [Google Scholar] [CrossRef]
  4. Babac, G.; Sisman, A.; Cimen, T. Two-dimensional thermal analysis of liquid hydrogen tank insulation. Int. J. Hydrogen Energy 2009, 34, 6357–6363. [Google Scholar] [CrossRef]
  5. Hastings, L.; Hedayat, A.; Brown, T. Analytical Modeling and Test Correlation of Variable Density Multilayer Insulation for Cryogenic Storage; 20040121015; NASA: Washington, DC, USA, 2004.
  6. Fesmire, J.E. Aerogel-Based Insulation Materials for Cryogenic Applications. IOP conference series. Mater. Sci. Eng. 2019, 502, 12188. [Google Scholar]
  7. Fesmire, J. Research and Development History of Glass Bubbles Bulk-Fill Thermal Insulation Systems for Large-Scale Cryogenic Liquid Hydrogen Storage Tanks; 20180006604; NASA: Washington, DC, USA, 2017.
  8. Fesmire, J.E.; Ancipink, J.B.; Swanger, A.M.; White, S.; Yarbrough, D. Thermal conductivity of aerogel blanket insulation under cryogenic-vacuum conditions in different gas environments. IOP Conf. Ser. Mater. Sci. Eng. 2017, 278, 12198. [Google Scholar] [CrossRef]
  9. Chang, J.I.; Chung, L.C. A study of storage tank accidents. J. Loss Prev. Process Ind. 2006, 19, 51–59. [Google Scholar] [CrossRef]
  10. NFPA59A-2019; Standard for the Production, Storage, and Handling of Liquefied Natural Gas (LNG). National Fire Protection Association: Quincy, MA, USA, 2019.
  11. Handa, K.; Oshima, S.; Rembutsu, T. Pre-cooling temperature relaxation technology in hydrogen refueling for fuel-cell vehicles. Int. J. Hydrogen Energy 2021, 46, 33511–33522. [Google Scholar] [CrossRef]
  12. Li, M.; Bai, Y.; Zhang, C.; Song, Y.; Jiang, S.; Grouset, D.; Zhang, M. Review on the research of hydrogen storage system fast refueling in fuel cell vehicle. Int. J. Hydrogen Energy 2019, 44, 10677–10693. [Google Scholar] [CrossRef] [Green Version]
  13. Melideo, D.; Baraldi, D.; Galassi, M.C.; Cebolla, R.O.; Iborra, B.A.; Moretto, P. CFD model performance benchmark of fast filling simulations of hydrogen tanks with pre-cooling. Int. J. Hydrogen Energy 2014, 39, 4389–4395. [Google Scholar] [CrossRef]
  14. Ghaffari-Tabrizi, F.; Haemisch, J.; Lindner, D. Reducing Hydrogen Boil-Off Losses during Fueling by Pre-Cooling Cryogenic Tank. Hydrogen 2022, 3, 255–269. [Google Scholar] [CrossRef]
  15. Tianlong, L.; Shuping, C.; Shuting, Y. Pre-cooling Calculations of Spherical LNG Tank. Cryog. Supercond. 2014, 42, 21–24. [Google Scholar]
  16. Zijing, W.; Song, X.; Ying, H. Thermodynamic Analysis of Pre-cooling LNG Storage Tanks. Urban Gas 2016, 6, 11–14. [Google Scholar]
  17. Xuewen, C.; Yanhua, X.; Wenshan, P. Pre-cooling Model and Pre-cooling Parameters Calculation of the large-scale LNG Tank. Cryog. Supercond. 2015, 43, 16–22. [Google Scholar]
  18. Jiqiang, W.; Jianqiang, Y. Pre-cooling of Large-scale LNG Tanks and Calculation of Pre-cooling Media Usage. Cryog. Technol. 2015, 6, 36–39. [Google Scholar]
  19. Tianlong, L. Analysis of Unsteady Heat Transfer of Large-Scale LNG Storage Tanks in Pre-Cooling Process; Lanzhou University of Technology: Lanzhou, China, 2014. [Google Scholar]
  20. Chongkun, C. Development of 300 m3 Liquid Hydrogen Storage Tank for Transportation Vehicle; Harbin Institute of Technology: Harbin, China, 2014. [Google Scholar]
  21. Lemmon, E.W.; Huber, M.L.; Mclinden, M.O. Reference Fluid Thermodynamic and Transport Properties [CP/OL]; NIST: Gaithersburg, MD, USA, 2002.
  22. Guobang, C. Cryogenics Materials; Zhejiang University Press: Hangzhou, China, 1998. [Google Scholar]
Figure 1. Structure of liquid hydrogen tank and heat during pre-cooling.
Processes 11 00787 g001
Figure 2. Flow diagram of pre-cooling parameter calculation of liquid hydrogen tank.
Processes 11 00787 g002
Figure 3. Specific heat of liquid and solid materials in a liquid hydrogen tank.
Processes 11 00787 g003
Figure 4. Temperature distribution at the average cooling rates of 0.1 K/min, 0.5 K/min, and 1 K/min.
Processes 11 00787 g004
Figure 5. Temperature distribution of inner wall and interlayer thermal insulation materials at the end of pre-cooling.
Processes 11 00787 g005
Figure 6. Hydrogen mass and flow of heat loads at different cooling rates: (a) inner gas q1; (b) inner wall and accessories q2; (c) thermal insulation material q3; (d) heat leakage offset q4.
Processes 11 00787 g006
Figure 7. Total liquid hydrogen flows at different cooling rates.
Processes 11 00787 g007
Figure 8. Percentages of liquid hydrogen consumed by various heat loads at different cooling rates and total liquid hydrogen mass.
Processes 11 00787 g008
Table 1. Liquid hydrogen tank and relevant material properties.
ItemValueNote
T0 (K)293.15
θ 0.23%Reference [20]
P (kPa)101.35
Tsat (K)20.4Reference [21]
ρ l (kg/m3)70.8Reference [21]
γ (J/kg)448567Reference [21]
Cp1 (J/kg·K) 146205.7 / T + 14184.1 T 0.1369 16710.7 Reference [21]
Z1/(1 + 466.59/T 2.79)Reference [21]
m2 (kg)44000Reference [20]
Cp2 (J/kg·K)−45.81 + 0.45T + 22.96T0.5Reference [22]
m3 (kg)874Reference [20]
Cp3 (J/kg·K)35290.46/T1.5 + 247.22T0.5 − 6.77T − 1355.72Reference [22]
m4 (kg)2700Reference [20]
Cp4 (J/kg·K)3.9526T − 0.0772 T1.5 − 46.9561Reference [22]
Table 2. Pre-cooling process parameters at different cooling rates.
Average Cooling Rate (K/min)Pre-Cooling Time
(min)
Liquid Hydrogen Mass
(kg)
Proportion
(%)
Liquid Hydrogen Mass Flow
(kg/min)
dT/dttMw1w2w3w4wγqm_startqm_endMax (qm)Min (qm)
0.127302114.95 5.64 87.84 5.50 1.01 23.06 0.00 0.04 1.18 0.00
0.213652099.68 5.68 88.28 5.53 0.51 23.01 0.01 0.04 2.35 0.01
0.39102094.93 5.69 88.43 5.54 0.34 23.01 0.01 0.05 3.52 0.01
0.46822092.80 5.70 88.50 5.54 0.25 23.01 0.01 0.06 4.69 0.01
0.55462091.73 5.71 88.54 5.55 0.20 23.01 0.02 0.08 5.86 0.02
0.64552091.19 5.72 88.57 5.55 0.17 23.02 0.02 0.10 7.03 0.02
0.73902090.94 5.72 88.58 5.55 0.15 23.03 0.03 0.13 8.20 0.03
0.83412090.89 5.73 88.59 5.55 0.13 23.04 0.04 0.15 9.38 0.04
0.93042090.95 5.74 88.60 5.55 0.11 23.05 0.05 0.19 10.53 0.05
12732091.11 5.74 88.61 5.55 0.10 23.06 0.06 0.22 11.72 0.06
Disclaimer/Publisher’s Note: The statements, opinions and data contained in all publications are solely those of the individual author(s) and contributor(s) and not of MDPI and/or the editor(s). MDPI and/or the editor(s) disclaim responsibility for any injury to people or property resulting from any ideas, methods, instructions or products referred to in the content.

