Article

Pachyrhizus erosus Inhibits Adipogenesis via the Leptin-PPARγ-FAS Pathway in a High-Fat Diet-Induced Mouse Model

1
School of Veterinary Medicine, Kangwon National University, Chuncheon 24341, Republic of Korea
2
College of Oriental Medicine, Dongshin University, Naju 58245, Republic of Korea
3
Good F&B, Naju 58245, Republic of Korea
*
Author to whom correspondence should be addressed.
These authors contributed equally to this work.
Processes 2023, 11(3), 735; https://doi.org/10.3390/pr11030735
Submission received: 12 January 2023 / Revised: 25 February 2023 / Accepted: 27 February 2023 / Published: 1 March 2023
(This article belongs to the Section Pharmaceutical Processes)

Abstract

:
In 2016, obese patients represented 13% of the worldwide adult population, and by 2030, they are projected to make up 34%. Obesity is an incommunicable disease, but it can induce many health problems. The groups consisted of a control, a 65% high-fat group, and a 250 mg/kg P. erosus group. Several biomarkers, such as body weight gain, the presence of TC/LDL/HDL in the serum, the weight of fat tissue, and liver weight/morphology, were investigated to define the anti-obesity mechanisms of P. erosus, and the adipogenesis pathway was studied. P. erosus suppressed body weight gain, decreased TC and LDL, prevented fat tissue weight gain, and prevented liver weight gain by blocking lipid droplet accumulation. P. erosus effectively decreased the up-regulated levels of leptin, significantly controlled both C/EBPα and PPARγ levels, and prevented increased FAS expression levels. We concluded that P. erosus effectively controlled obesity by regulating leptin-C/EBPα-PPARγ and FAS and might be a promising AOM.

Graphical Abstract

1. Introduction

The World Health Organization defines obesity as abnormal or excessive fat accumulation, which can be measured using the body mass index (BMI); a BMI ranging from 25 to 29 is classed as overweight, but a BMI of 30 and over can be considered obese [1]. Obesity occurs due to an energy imbalance with high intake and low usage [2]. Currently, obesity is considered a catastrophic illness that can be induced by diverse and complex causes, such as personal (genetic, physiological, psychological, drug administration, etc.) and circumstantial (society, economics, politics, etc.) ones [3]. Additionally, there are many drugs that can lead to increased body weight, such as psychiatric/neurologic drugs (antipsychotic agents: phenothiazines and risperidone; mood stabilizers: lithium; antidepressants: tricyclics and monoamine oxidase inhibitors; antiepileptic drugs: gabapentin and valproate), steroid hormones (corticosteroids; progestational steroids), antidiabetic agents (insulin and sulfonylureas), antihypertensives (β- and α-1 adrenergic receptor blockers), antihistamines (cyproheptadine), and HIV protease inhibitors [4].
In 2016, 39% (1.9 billion) of the worldwide 18-years-and-over population were overweight, with 13% (650 million) of them classified as obese, and 39 million children under 5 years old were classified as overweight or obese [1]. In 2022, the World Obesity Federation projected that by 2030, 20% of the female and 14% of the male population would be classified as obese, and these percentages correspond to 1 billion people or more globally [5].
Obesity is a disease that can stimulate more severe health problems (illnesses), such as type 2 diabetes mellitus [6], cardiovascular disease [7], non-alcoholic hepatic problems, such as fatty liver and steatohepatitis [8], etc. However, the more severe repercussions for obese patients are related to the induction of psychosocial problems, such as work disability, social discrimination, and depression/low self-esteem [9].
Obesity is deeply related to changes in adipose tissue. There are two types of adipose tissue: white adipose tissue and brown adipose tissue. Adipose tissue is predominantly composed of adipocytes and obese white adipose tissue (WAT), which is caused by incremental lipid storage in the adipocytes, increasing their size, decreasing oxygen, and finally leading to cell death [10]. Slender WAT mainly consists of immunocytes, such as M2-like adipose tissue macrophages (M2-ATM), regulatory T cells (Treg), helper T cells (Th), and eosinophils. M2-ATM have various functions, such as the clearance of dead adipocytes, the inhibition of adipocyte progenitor’s proliferation, and the release of cytokines (IL-10, IL-4, and IL-13) [11,12]. However, in obese WAT, the population of M1 macrophages and the level of pro-inflammatory cytokines, such as TNF-α and IL-6, simultaneously increase [13].
The mechanisms relating to decreasing body fat can be classified into four groups: anti-adipogenesis, anti-absorption of fat into the body, stimulation of fat breakdown, and thermogenesis [14]. There are many factors related to adipogenesis, such as adipocytokines (leptin), transcription factors (PPARγ, peroxisome proliferator-activated receptor γ; C/EBPα, CCAAT/enhancer binding protein α; ADD1/SREBP1c, adipocyte determination and differentiation factor 1/sterol regulatory element binding protein 1c), and enzymes (FAS, fatty acid synthase) [15]. Leptin is a hormone that can initiate adipogenesis [16]. Although PPARγ and C/EBPα are transcription factors for FAS generation, C/EBPα cannot act as a transcription factor for FAS synthesis by itself, dissimilar to PPARγ. PPARγ is considered to be proximal to FAS expression [17]. FAS is linked to de novo fatty acid synthesis [18].
For several decades, there has been much trial and error in the development of anti-obesity medications (AOMs), and in the initial stage, many studies were conducted to control feelings of appetite. From these studies, several AOMs have developed, such as sibutramine, fenfluramine, dexfenfluramine, rainbow pills, rimonabant, and methamphetamine. However, they have adverse side effects, such as cardiovascular problems, increasing suicidal impulses, or promoting drug dependence and abuse; therefore, many AOMs have been refused entry into the drug market after failing to receive regulatory approval [19].
Pachyrhizus erosus (P. erosus) is called jicama, Mexican yam bean, or Mexican turnip. It originates from Mexico and Central America, and presently, it is cultivated for culinary uses in Southeast Asia [20]. There are several reports suggesting that it has biological effects, such as promoting gastroprotective activity [21], decreasing blood glucose and body weight gain [22], and increasing insulin sensitivity [23].
In this study, we verified the potency of P. erosus when used as an AOM and elucidated the anti-obesity mechanisms of P. erosus.

2. Materials and Methods

2.1. Pachyrhizus erosus Preparation

P. erosus roots, harvested from 2020 to 2021 in Jeonnam Province, were purchased from traditional markets. The roots were cleaned with tap water before drying. The air-dried and powdered P. erosus roots were fermented with Pectinex ultra (a fermentative enzyme) in tap water for 4 h at 45 °C/pH 4.0~4.5. The fermentative one was filtered and then concentrated at 45 °C/1000 mmHg. The resultant solution was evaporated, dried, and stored at −50 °C. One gram of P. erosus extract was obtained from 1.095 g of P. erosus powder (yield = 91%).

2.2. Animal Experiments and Bodyweight Measurement

Thirty-six male C57BL/6 mice were purchased from Samtako (Osan, Republic of Korea) and divided into three groups according to each treatment: (1) vehicle control (normal diet), (2) high-fat diet (HFD)-induced obese model, and (3) 250 mg/kg/day P. erosus with HFD. After 7 days of acclimation, all of the mice were treated for 56 days depending on each group’s treatment and P. erosus treatments (28 μL/g of body weight), which were conducted from 14:00 to 16:00 using a feeding needle. Across 56 days, two times per week, body weight and food consumption were measured. In order to guarantee the reproducibility of the results, the animal study was conducted twice. The results are explained in the Result and Discussion sections.

2.3. Ethics Statement

All of the experiments were approved by the Institutional Animal Care and Use Committee at Dongshin University (Animal Study Approval No. DSU2021-03-01).

2.4. Blood Chemistry Analysis and Organ Weight Measurement

Three hours before sacrifice (day 57), feed and water were limited, and all of the mice were anesthetized using 50 mg/kg of Zoletil (Virbac, Carros, France), and the whole blood (at least 0.8 mL) was collected from the heart using a syringe coated with EDTA. After collecting the blood, the collected samples were gently shaken for the sake of anti-coagulation and centrifuged at 3000 rpm for 5 min (M15R, Hanil Scientific Inc., Gyeonggi-do, Republic of Korea). The serum was separated, and the total cholesterol and high-density lipids (HDLs) in the separated serum were measured using a Dri-Chem NX-500i (FUJIFILM Corporation, Tokyo, Japan). Fat tissue, such as the visceral fat tissue and subcutaneous fat tissue, and the liver were weighed. The results are described in the Results section.

2.5. Histopathological Analysis

A morphological analysis of the liver was performed to evaluate the inhibitiory effect of P. erosus against fat tissue accumulation. The morphological change of liver was evaluated by hematoxylin and eosin (H and E) staining, followed by a pathological reading. The livers were fixed using a 10% (v/v) formaldehyde solution, dehydrated using graded ethanol (99.9%, 90%, 80%, and 70%), and embedded with paraffin. The embedded livers were longitudinally sliced (5 μm), and H and E staining was conducted. All images were gotten by Axioscope A1 (Carl Zeiss, Gottingen, Germany), and they are shown in the Results section.

2.6. Enzyme-Linked Immunosorbent Assay (ELISA)

The level of leptin in the liver was measured using the mouse/rat Quantikine ELISA kit (MOB00, R & D SYSTEMS®, Minneapolis, MN, USA), and whole process was done according to the manufacturer’s guidelines. The liver tissues were lysed with a buffer consisting of a protease inhibitor cocktail and RIPA buffer (Thermo Fisher Scientific Inc., Waltham, MA, USA) and centrifuged at 8200 rpm for 15 min using M15R (Hanil Scientific Inc.). The supernatants were gotten and the results were measured with a microplate reader, the Multiskan SkyHigh Microplate Spectrophotometer (Thermo Fisher Scientific Inc.). All of the results are explained in the Results and Discussion sections.

2.7. Real-Time Polymerase Chain Reaction (RT-PCR) Analysis

To evaluate the changes in the cDNA levels of PPARγ, C/EBPα, SREBPc, and FAS, which are related to adipogenesis, RT-PCR analysis was conducted. Whole RNAs from the liver were extracted using the RNeasy Mini Kit (Qiagen, Hilden, Germany) according to the manufacturer’s instructions, and for the reaction, 100 ng of RNA was used. The primers’ sequences used are as follows: PPARγ forward 5′-TGTGGGGATAAAGCATCAGGC-3′, PPARγ reverse 5′-CCGGCAGTTAAGATCACACCTAT-3′; C/EBPα forward 5′-TGGACAAGAACAGCAACGAGTA-3′, C/EBPα reverse 5′-GCAGTTGCC ATGGCCTTGA-3′; SREBPc forward 5′-GGAGCCATGGATTGCACATT-3′, SREBPc reverse 5′-GGCCCGGGAAGTCACTGT-3′; FAS forward 5′-AGCTGCCAGAGTCGGAGAAC-3′, FAS reverse 5′-TGTAGCCCACGAGTGTCTCG-3′; β-actin forward 5′-GGCTGTATTCCCCTCCATCG-3′, β-actin reverse 5′-CCAGTTGGTAACAATGCCATGT-3′. In order to quantify the levels of cDNA, qTOWER2.2 (Analytic Jena GmbH, Jena, Germany) was used, and the RT-PCR cycles consisted of denaturation at 95 °C for 5 s and annealing/extension at 65 °C for 30 s for 40 cycles. The outcomes of RT-PCR are described and discussed in the Results and Discussion sections.

2.8. Immunofluorescent Analysis

In order to define the anti-adipogenetic pathway of P. erosus, such as C/EBPα-PPARγ-FAS, immunofluorescent analysis was conducted. All paraffinized blocks such as CON, HFD, and P. erosus with HFD were 5 μm-sectioned and were stained using the immunofluorescent method with four primary antibodies—C/EBPα (SC-61, Santa Cruz, Dallas, TX, USA), PPARγ (SC-1984, Santa Cruz), FAS (SC-21730, Santa Cruz), and DAPI for the nucleus (Hoechst 62249, ThermoFisher Scientific, Waltham, MA, USA)—and three secondary antibodies: Alexa Fluor 555-conjugated IgG for C/EBPα (A32731, Invitrogen, Waltham, MA, USA), Alexa Fluor 488-conjugated IgG for PPARγ (A32816, Invitrogen), and Alexa Fluor 555-conjugated IgG for FAS (A32731, Invitrogen). They reacted for 1 h to bind the primary antibody to the specific proteins and for 2 h to bind the secondary antibody to the primary antibody. The results were obtained using a K1-Fluo confocal microscope (Nanoscope System, Daejeon, Republic of Korea), and their implications are discussed in the Results and Discussion sections.

2.9. Inulin Analysis

In order to determine the composition of inulin as an active compound in P. erosus, the phenolic–sulfuric acid method for measuring total sugar [24] and the dinitrosalicyclic acid (DNS) method for analyzing reducing sugar [25] were conducted. The inulin content can be calculated by the value that is taken by reducing sugar from the total sugar. Briefly, for the phenolic sulfuric acid method, 95% sulfuric acid solution is added to the P. erosus extract and phenol solution and then measured at 470 nm using an EZ Read 400 (Biochrom). For the DNS method, the DNS reagent is mixed with the P. erosus extract, reacted at 100 °C for 15 min, and then analyzed at 530 nm. This outcome is discussed in the Discussion section.

2.10. Statistical Analysis

The results are expressed as means ± standard deviation (SD). Group differences were evaluated using a one-way analysis of variance followed by Dunnett’s multiple comparison test. p < 0.01 and p < 0.05 were considered statistically significant.

3. Results

3.1. P. erosus Effectively Controlled HFD-Induced Body Weight Gaining

The differences in body weight between the three groups were observed from Day 15 (Figure 1), and from Day 22, the body weight in the HFD treatment group was higher than in the P. erosus treatment group. Compared to the body weight in the control group, the body weight in the HFD treatment group increased by 142%, but that in the P. erosus treatment group increased by 120%. That means that P. erosus has a protective effect on body weight gain due to an HFD.

3.2. P. erosus Decreased Obesity-Related Biomarkers in the Serum

Dyslipidemia is a representative physiological change seen in obesity, referring to the imbalance of total cholesterol (TC), high-density lipoproteins (HDLs), and low-density lipoproteins (LDLs). Obesity raises the levels of TC and LDLs while not raising the level of HDLs does not increase [26]. Compared to the level of TC in the HFD treatment group (202.4 ± 18.95 mg/dL), that in the P. erosus treatment group (175.8 ± 11.92 mg/dL) was low, although it was higher than that in the control group (112.4 ± 15.7 mg/dL) (Figure 2). The results of the LDL levels were similar to those of the TC levels, and in the P. erosus treatment group (38.0 ± 6.90 mg/dL), the LDL levels were lower than those in the HFD treatment group (54.0 ± 9.55 mg/dL), although higher than those in the control group (22.6 ± 5.43 mg/dL).

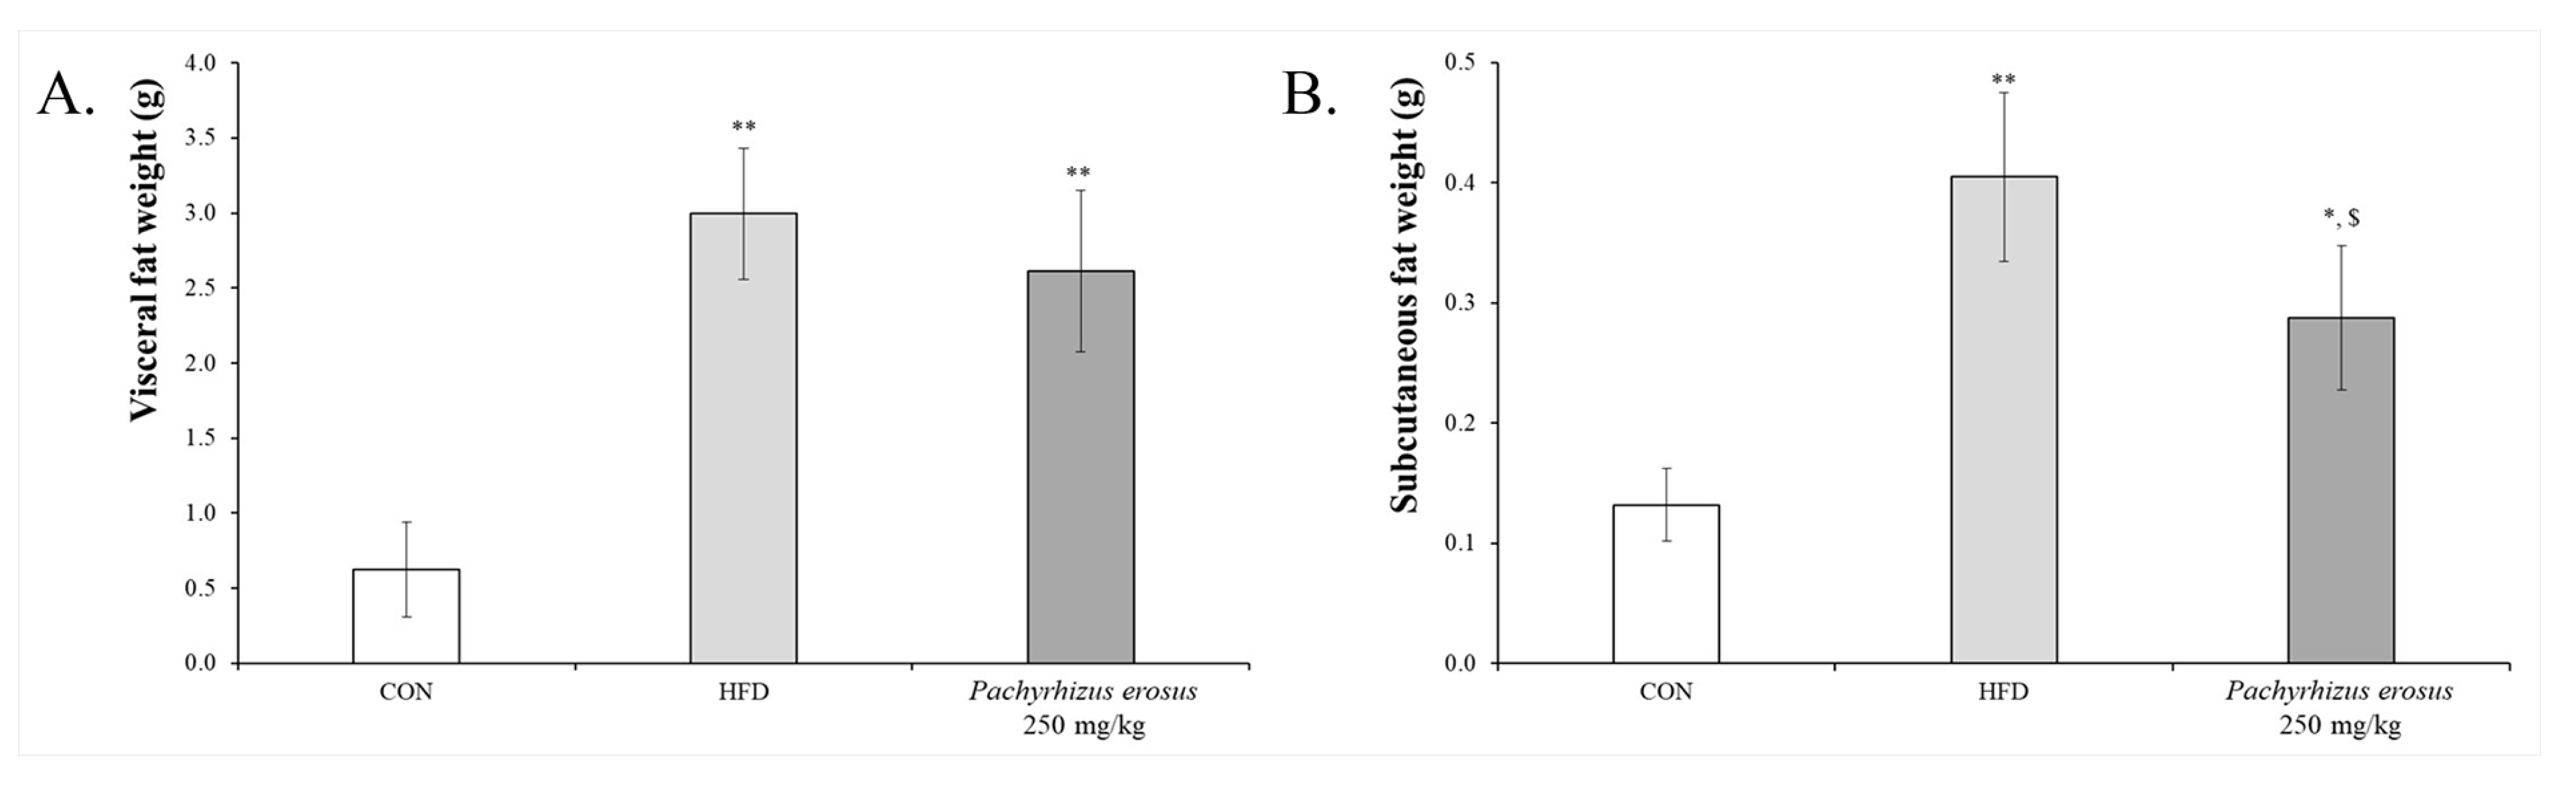
3.3. P. erosus Suppressed Fat Tissues Weight Gain

Fat tissues can be classified into two categories: visceral fat tissue and subcutaneous fat tissue [27]. The weights of the fat tissues in the P. erosus treatment group (visceral fat weight, 2.61 ± 0.536 g; subcutaneous fat weight, 0.29 ± 0.060 g) were higher than those in the control group (visceral fat weight, 0.62 ± 0.316 g; subcutaneous fat weight, 0.13 ± 0.030 g) (Figure 3). P. erosus treatment could slightly prevent HFD-induced weight gain.

3.4. P. erosus Significantly Controlled the Fat Accumulation in the Liver

The liver weights in the P. erosus treatment group (1.33 ± 0.360 g) were similar to those in the control group (1.66 ± 0.107) (Figure 4A), but those in the HFD group increased to 2.39 ± 0.478 g. In order to define the fat accumulation in the liver, H and E staining was conducted (Figure 4B) and compared to that in the control group. The HFD induced lipid droplet accumulation in the whole liver (Figure 4(Ba)). However, the P. erosus treatment prevented fat accumulation in the liver (Figure 4(Bc)). In the livers of the HFD group, both the number and size of the lipid droplets increased significantly, but the P. erosus treatment effectively decreased the size and number of the fat.

3.5. P. erosus Inhibited Adipogenesis via Leptin-PPARγ/C/EBPα-FAS

There are several pathways relating to anti-obesity, such as decreasing lipid accumulation in the bio-organism, blocking adipocyte synthesis, inducing adipolysis, and thermogenesis [14]. Leptin, in particular, as an adipocytokine, is related to adipogenesis and stimulates FAS, released via PPARγ and C/EBPα [15]. In order to define the anti-adipogenetic effects of P. erosus, the level of leptin in the liver significantly increased in the HFD group (5971.98 ± 567.341 pg/mL) compared to that in the control group (210.31 ± 96.594 pg/mL), but P. erosus treatment led to decreases (3758.22 ± 1645.777 pg/mL) (Figure 5A). The HFD increased the levels of transcription factors of FAS, such as C/EBPα (1.5 ± 0.17 fold) and PPARγ (2.1 ± 0.30 fold) in the liver, but P. erosus treatment significantly decreased (C/EBPα, 1.1 ± 0.16 fold) and PPARγ (1.0 ± 0.34 fold) (Figure 5B,C). In order to analyze the quantitative changes in the liver, an immunofluorescent assay was conducted (Figure 5D). The expression levels of C/EBPα (green spots) and PPARγ (red spots) in the HFD group significantly increased compared to the control group, but P. erosus treatment effectively controlled their expressions. In the case of FAS expression (green color), the change in the HFD group to that in the P. erosus treatment group was dramatic.

4. Discussion

Recently, obesity has been considered a severe disease [3] that induces many severe diseases, such as type 2 diabetes [6], cardiovascular disease [7], non-alcoholic fatty liver disease [8], and psychosocial problems [9]. Especially, by 2030, 20% of the female and 14% of the male global populations are projected to become obese [5]. Adipocytes could release adipocytokines, such as adiponectin, leptin, resistin, and visfatin, which are related to inflammatory disorders and immune imbalances [10,28]. Depending on the obesity status of adipocytes, such as lean or obese, the composition of the cell type is different [10]. Under the lean status, white adipose tissue mainly consists of immune modulatory cells, including M2-like adipose tissue macrophages, several types of T cells, natural killer cells, eosinophils, and, especially, M2-like adipose tissue macrophages (M2 ATM), which have several biological functions, such as clearance, promoting dead adipocytes, suppressing adipocyte progenitor proliferation, and releasing anti-inflammatory cytokines, such as IL-10, IL-4, IL-13, and IL-1Rα [11]. Obesity could switch the adipocyte macrophage’s type from M2 ATM under a lean status to an M1-like adipose tissue macrophage (M1 ATM) under an obese status [12]. Adipocyte dysfunction could increase the release of proinflammatory cytokines, such as TNF-α, IL-6, IL-8, IFN-γ, and MCP-1 [29,30].
There are several pathways for reducing obesity, such as the inhibition of fat absorption into the body, the prevention of adipogenesis, the stimulation of lipolysis, and thermogenesis [14]. P. erosus, which originated in Mexico and Central America, has been used for culinary reasons for a long time, and it is currently cultivated in many countries [20]. Recently, its biological effects have been reported, such as gastroprotection [21], the down-regulation of blood glucose and body weight gain [22], and the stimulation of insulin sensitivity [23]. In this study, P. erosus controlled obesity-induced changes, such as weight gain, TC and LDL increases, and weight gain in various tissues, such as visceral fat, subcutaneous tissues, and liver tissue, by preventing lipid droplet accumulation in the liver. Especially, P. erosus effectively inhibited adipogenesis-related markers, such as leptin levels, the expressions of C/EBPα and PPARγ, and finally, the up-regulation of FAS synthesis. Although there are several anti-obesity-related reports concerning inulin as an active compound in P. erosus, almost all of them are related to prebiotic inulin [31,32]. In this study, we evaluated the anti-obesity effect of P. erosus extract and checked the inulin content in P. erosus extract (Table 1).
The inulin content per 1 mg/mL of P. erosus extract was 0.38 ± 0.029 mg/mL, and in further studies, the relationship between this result and inulin needs to be defined.
During the initial stage of AOM development, many scientists focused on controlling neurological factors/receptors to regulate appetite, such as GABAergic neurotransmitters, satiety receptors, adrenergic receptors, and dopaminergic receptors in the hypothalamus, limbic system, or central nervous system [19,33], but their adverse side effects have resulted in their withdrawal from the drug market. Many AOM candidates have been studied in clinical phases, such as GLP1/glucagon dual agonists (Cotadutide, BI 456906, Efinopegdutide, OXM), GIP/GLP1 dual agonists (Tirzepatide, GIP/GLP peptide I and II, NN9709), GIP/GLP1/glucagon tri-agonists (HM15211, GGG tri-agonist, NN9423), leptin sensitizers (Withaferin A, Celastrol, Leptin/amylin), etc [19]. In particular, trials to develop AOM candidates that have low adverse effects and could be treated as an easy route have increased recently, and AOM development studies related to natural products have also increased [34].

5. Conclusions

P. erosus, also known as jicama, Mexican yam bean, or Mexican turnip, originates from Mexico and Central America and is presently cultivated for culinary uses in Southeast Asia [20]. The results show that P. erosus controlled adipocyte proliferation via leptin-PPARγ-C/EBPα-FAS. Based on the results of this study, we conclude that it might be used as a potential AOM.

Author Contributions

Conceptualization D.-H.P.; methodology, S.-M.L., S.-H.B., M.-H.K. and K.S.L.; software, S.-H.B.; investigation, S.-M.L. and S.-H.B.; data curation, S.-H.B.; writing—original draft preparation, S.-M.L. and S.-H.B.; writing—review and editing, D.-H.P.; supervision, D.-H.P. All authors have read and agreed to the published version of the manuscript.

Funding

This research was supported by the Regional Specialized Industry Development Plus Program (R and D, S3093068) funded by the Ministry of SMEs and Startups (MSS, Republic of Korea), and the National Research Foundation of Korea (NRF) grant funded by the Korean government (MSIT, No. 2022R1A5A8033794).

Conflicts of Interest

The authors declare no conflict of interest.

References

  1. World Health Organization. Obesity. 2 May 2022. Available online: https://www.who.int/health-topics/obesity#tab=tab_1 (accessed on 1 August 2022).
  2. Wright, S.M.; Aronne, L.J. Causes of obesity. Abdom. Imaging 2012, 37, 730–732. [Google Scholar] [CrossRef] [PubMed]
  3. Aronne, L.J.; Nelinson, D.S.; Lillo, J.L. Obesity as a disease state: A new paradigm for diagnosis and treatment. Clin. Cornerstone 2009, 9, 9–29. [Google Scholar] [CrossRef] [PubMed]
  4. Kushner, R.F.; Roth, J.L. Assessment of the obese patient. Endocrinol. Metab. Clin. N. Am. 2003, 32, 915–933. [Google Scholar] [CrossRef] [PubMed]
  5. World Obesity Federation. World Obesity Atlas 2022. Available online: https://s3-eu-west-1.amazonaws.com/wof-files/World_Obesity_Atlas_2022.pdf (accessed on 1 August 2022).
  6. Pillon, N.J.; Loos, R.J.F.; Marshall, S.M.; Zierath, J.R. Metabolic consequences of obesity and type 2 diabetes: Balancing genes and environment for personalized care. Cell 2021, 184, 1530–1544. [Google Scholar] [CrossRef]
  7. Powell-Willey, T.M.; Poirier, C.P.; Burke, L.E.; Despres, J.P.; Gordon-Larsen, P.; Lavie, C.J.; Lear, S.A.; Ndumele, C.E.; Neeland, I.J.; Sanders, P.; et al. American Heart Association Council on Lifestyle and Cardiometabolic Health; Council on Cardiovascular and Stroke Nursing; Council on Clinical Cardiology; Council on Epidemiology and Prevention; and Stroke Council. Obesity and cardiovascular disease: A scientific statement from the American Heart Association. Circulation 2021, 143, e984–e1010. [Google Scholar] [CrossRef]
  8. Wang, X.; Rao, H.; Liu, F.; Wei, L.; Li, H.; Wu, C. Recent advances in adiopose tissue dysfunction and its role in the pathogenesis of non-alcoholic fatty liver disease. Cells 2021, 10, 3300. [Google Scholar] [CrossRef]
  9. Kushner, R.F.; Weinsier, R.L. Evaluation of the obese patient. Med. Clin. N. Am. 2000, 84, 387–399. [Google Scholar] [CrossRef]
  10. Taylor, E.B. The complex role of adipokines in obesity, inflammation, and autoimmunity. Clin. Sci. 2021, 135, 731–752. [Google Scholar] [CrossRef]
  11. Nawaz, A.; Aminuddin, A.; Kado, T.; Takikawa, A.; Yamamoto, S.; Tsuneyama, K.; Igarashi, Y.; Ikutani, M.; Nishida, Y.; Nagai, Y.; et al. CD206+ M2-like macrophages regulate systemic glucose metabolism by inhibiting proliferation of adipocyte progenitors. Nat. Commun. 2017, 8, 286. [Google Scholar] [CrossRef] [Green Version]
  12. Lumeng, C.N.; Bodzin, J.L.; Saltiel, A.R. Obesity induces a phenotypic switch in adipose tissue macrophage polarization. J. Clin. Investig. 2007, 117, 175–184. [Google Scholar] [CrossRef] [Green Version]
  13. Kratz, M.; Coasts, B.R.; Hisert, K.B.; Hagman, D.; Mutskov, V.; Peris, E.; Schoenfelt, K.Q.; Kuzma, J.N.; Larson, I.; Billing, P.S.; et al. Metabolic dysfunction drives a mechanistically distinct proinflammatory phenotype in adipose tissue macrophage. Cell Metab. 2014, 20, 614–625. [Google Scholar] [CrossRef] [PubMed] [Green Version]
  14. Department of Nutritional Function Research. Possible to help body fat decrease. In Efficacy Evaluation Guide for Functional Food; Korea National Institute of Food and Drug Safety Evaluation: Osong, Republic of Korea, 2019; pp. 8–10. [Google Scholar]
  15. Gwon, S.Y.; Ahn, J.Y.; Kim, T.W.; Ha, T.Y. Zanthoxylum peperitum DC ethanol extract suppresses fat accumulation in adipocytes and high fat diet-induced obese mice by regulating adipogenesis. J. Nutr. Sci. Vitaminol. 2012, 58, 393–401. [Google Scholar] [CrossRef] [PubMed] [Green Version]
  16. Palhinha, L.; Liechocki, S.; Hottz, E.D.; Pereira, J.A.d.S.; de Almeida, C.J.; Moraes-Vieira, P.M.M.; Bozza, P.T.; Maya-Monteiro, C.M. Leptin induces proadipogenic and proinflammatory signaling in adipocytes. Front. Endocrinol. 2019, 10, 841. [Google Scholar] [CrossRef] [PubMed] [Green Version]
  17. Rosen, E.D.; Hsu, C.H.; Wang, X.; Sakai, S.; Freeman, M.W.; Gonzalez, F.J.; Spiegelman, B.M. C/EBPα induces adipogenesis through PPARγ: A unified pathway. Genes Dev. 2002, 16, 22–26. [Google Scholar] [CrossRef] [Green Version]
  18. Jensen-Urstad, A.P.L.; Semenkovich, C.F. Fatty acid synthase and liver triglyceride metabolism: Housekeeper or messenger? Biochim. Biophys. Acta 2012, 1821, 747–753. [Google Scholar] [CrossRef] [Green Version]
  19. Muller, T.D.; Bluher, M.; Tschop, M.H.; DiMarchi, R.D. Anti-obesity drug discovery: Advances and challenges. Nat. Rev. Drug Discov. 2022, 21, 201–223. [Google Scholar] [CrossRef]
  20. Sanderson, H.; Prance, G.; Nesbitt, M. (Eds.) The Culture History of Plants; Routledge: New York, NY, USA, 2005; ISBN 0-415-92746-3. [Google Scholar]
  21. Pertiwi, R.; Samudra, A.G.; Wati, N.K.; Hanuun, A.; Yudha, S.S.; Notriawan, D.; Wibowo, R.H. Gastroprotective activities of Peperomia pellucida L. and Pachyrhizus erosus L. extracts combination on ethanol-induced rats. Inflammopharmacolgy 2022, 30, 2139–2144. [Google Scholar] [CrossRef]
  22. Santoso, P.; Amelia, A.; Rahayu, R. Jicama (Pachyrhizus erosus) fiber prevents excessive blood glucose and body weight increase without affective food intake in mice fed with high-sugar diet. J. Adv. Vet. Anim. Res. 2019, 6, 222–230. [Google Scholar] [CrossRef]
  23. Park, C.J.; Lee, H.A.; Han, J.S. Jicama (Pachyrhizus erosus) extract increases insulin sensitivity and regulates hepatic glucose in C57BL/Ksj-db/db mice. J. Clin. Biochem. Nutr. 2016, 58, 56–63. [Google Scholar] [CrossRef] [Green Version]
  24. DuBois, M.; Gilles, K.A.; Hamilton, J.K.; Rebers, P.A.; Smith, F. Colorimetric method for determination of sugarts and related substances. Anal. Chem. 1956, 28, 350–356. [Google Scholar] [CrossRef]
  25. Miller, G.L. Use of dinitrosalicyclic acid reagent for determination of reducing sugar. Anal. Chem. 1959, 31, 426–428. [Google Scholar] [CrossRef]
  26. Almari, M.; Mohammad, A.; Abubaker, J.; Ziyab, A.H. Obesity and prediabetes are jointly associated with lipid abnormalities among adolescents: A cross-sectional study. Diabetes Metab. Syndr. Obes. 2021, 14, 345–353. [Google Scholar] [CrossRef]
  27. Lee, J.S.; Kim, K.J.; Kim, Y.H.; Kim, D.B.; Shin, G.H.; Cho, J.H.; Kim, B.K.; Lee, B.Y.; Lee, O.H. Codonopsis lanceolate extract prevents diet-induced obesity in C57BL/6 mice. Nutrients 2014, 6, 4663–4677. [Google Scholar] [CrossRef] [PubMed] [Green Version]
  28. Tilg, H.; Moschen, A.R. Adipocytokines: Mediators linking adipose tissue, inflammation and immunity. Nat. Rev. Immunol. 2006, 6, 772–783. [Google Scholar] [CrossRef] [PubMed]
  29. Nara, N.; Nakayama, Y.; Okamoto, S.; Tamura, H.; Kiyono, M.; Muraoka, M.; Tanaka, K.; Taya, C.; Shitara, H.; Ishii, R.; et al. Disruption of CXC motif chemokine ligand-14 in mice ameliorates obesity-induced insulin resistance. J. Biol. Chem. 2007, 282, 30794–30803. [Google Scholar] [CrossRef] [Green Version]
  30. Duffaut, C.; Zakaroff-Girard, A.; Bourlier, V.; Decaunes, P.; Maumus, M.; Chiotasso, P.; Sengenes, C.; Lafontan, M.; Galitzky, J.; Bouloumie, A. Interplay between human adipocytes and T lymphocytes in obesity. CCL20 as an adipochemokine and T lymphocytes as lipogenic modulators. Arterioscler. Thromb. Vasc. Biol. 2009, 29, 1608–1614. [Google Scholar] [CrossRef] [Green Version]
  31. Beisner, J.; Rosa, L.F.; Kaden-Volynets, V.; Stolzer, I.; Gunther, C.; Bischoff, S.C. Prebiotic inulin and sodium butyrate attenuate obesity-induced intestinal barrier dysfunction by induction of antimicrobial peptides. Front. Immunol. 2021, 12, 678360. [Google Scholar] [CrossRef]
  32. Van der Beek, C.M.; Canfora, E.; Kip, A.M.; Gorissen, S.H.M.; Damink, S.W.M.O.; Van Eijk, H.M.; Holst, J.J.; Blaak, E.E.; Dejong, C.H.C.; Lenaerts, K. The prebiotic inulin improves substrate metabolism and promotes short-chain fatty acid production in overweight to obese man. Metabolism 2018, 87, 25–35. [Google Scholar] [CrossRef]
  33. Antel, J.; Hebenbrand, J. Weight-reducing side effects of the antiepileptic agents topiramate and zonisamide. Handb. Exp. Pharmacol. 2012, 209, 433–466. [Google Scholar] [CrossRef]
  34. Rufino, A.T.; Costa, V.M.; Carvalho, F.; Fernandes, E. Flavonoids as antiobesity agents: A review. Med. Res. Rev. 2021, 41, 556–585. [Google Scholar] [CrossRef]
Figure 1. P. erosus decreased HFD-induced body weight gain. The differences in body weight between the three groups were observed from Day 15, and by Day 50, the body weight in the HFD treatment group was higher than that in the P. erosus treatment group. Compared to the body weight in the control group, the body weight in the HFD treatment group increased by 142%, but that in the P. erosus treatment group increased by 120%. That means that P. erosus has a protective effect against body weight gain due to HFD. Table in Figure 1. Body weight gain depends on the feeding period. The results are described as mean ± standard deviation. N = 12. * p < 0.05 vs. control; ** p < 0.001 vs. control; $ p < 0.05 vs. HFD-induced obesity.
Processes 11 00735 g001
Figure 2. P. erosus controlled the HFD-induced changes as obesity biomarkers in the serum. (A) P. erosus total cholesterol was increased by HFD feeding, but P. erosus suppressed the upregulation of total cholesterol due to HFD. (B) P. erosus down-regulated the LDL levels in the serum, and HFD increased the level of that. (C) P. erosus treatment slightly decreased the level of HDL, but there was no statistical comparison. Table in Figure 2. The change of obesity-related parameters in the serum. The results are described as a mean ± standard deviation. N = 12. * p < 0.05 vs. control; ** p < 0.001 vs. control; $ p < 0.05 vs. HFD-induced obesity.
Processes 11 00735 g002
Figure 3. P. erosus inhibited HFD-induced increases in fat tissue weight. (A) P. erosus slightly decreased the visceral fat weight, although there was no statistical comparison. (B) P. erosus prevented subcutaneous fat weight gain due to HFD. Table in Figure 3. The weights of visceral fat tissue and subcutaneous fat tissue. The results are described as a mean ± standard deviation. N = 12. * p < 0.05 vs. control; ** p < 0.001 vs. control; $  p < 0.05 vs. HFD-induced obesity.
Processes 11 00735 g003
Figure 4. P. erosus significantly inhibited liver weight increment. (A) The liver weight in the P. erosus treatment group was the highest between the three groups, such as the control, HFD group, and P. erosus treatment group, although the gap in liver weight between the control and the P. erosus treatment group was very slight. Table in Figure 4A. The liver weight. The results are described as a mean ± standard deviation. N = 12. * p < 0.05 vs. control; $ p < 0.05 vs. HFD-induced obesity. (B) HFD feeding induced lipid droplet accumulation in the liver, but P. erosus treatment could prevent their accumulation. (a) control; (b) high-fat diet group; (c) 250 mg/kg P. erosus treatment group. Scale bar, 100 μm. Magnification, ×200.
Processes 11 00735 g004
Figure 5. P. erosus inhibited adipogenesis via leptin-C/EBPα-PPARγ and FAS. (A) P. erosus down-regulated the level of leptin in the liver, which was significantly increased by HFD. (B) P. erosus decreased the relative expression of C/EBPα from 1.5 ± 0.17 fold to 1.1 ± 0.16 fold. (C) P. erosus effectively decreased the expression level of PPARγ from 2.1 ± 0.30 fold to 1.0 ± 0.34 fold. The results are described as a mean ± standard deviation. N = 12. * p < 0.05 vs. control; ** p < 0.001 vs. control; $ p < 0.05 vs. HFD-induced obesity. (D) P. erosus effectively controlled the adipogenesis-related factors such as C/EBPα, PPARγ, and FAS in the liver. Scale bar, 50 μm. Magnification, ×1000.
Processes 11 00735 g005
Table 1. The content of inulin.
1 mg/mL of Pachyrhizus erosus Extract
Total Sugar (mg/mL)Reducing Sugar (mg/mL)Inulin (mg/mL)
0.78 ± 0.0290.39 ± 0.0080.38 ± 0.029
Disclaimer/Publisher’s Note: The statements, opinions and data contained in all publications are solely those of the individual author(s) and contributor(s) and not of MDPI and/or the editor(s). MDPI and/or the editor(s) disclaim responsibility for any injury to people or property resulting from any ideas, methods, instructions or products referred to in the content.

