Article

Study on Relationships between Coal Microstructure and Coke Quality during Coking Process

1
China Coal Research Institute, Beijing 100013, China
2
CCTEG China Coal Research Institute, Beijing 100013, China
3
National Energy Technology & Equipment Laboratory of Coal Utilization and Emission Control, Beijing 100013, China
4
State Key Laboratory of Heavy Oil Processing, China University of Petroleum-Beijing, Beijing 102249, China
*
Author to whom correspondence should be addressed.
Processes 2023, 11(3), 724; https://doi.org/10.3390/pr11030724
Submission received: 10 December 2022 / Revised: 15 February 2023 / Accepted: 25 February 2023 / Published: 28 February 2023
(This article belongs to the Section Chemical Processes and Systems)

Abstract

:
Optimizing coal blending is important for high-quality development of coking industries, among which deep understanding of relationships between coal characteristics and coke quality is critical. This work selected four typical coals from Shanxi Province in China to investigate influences of their structures and properties on coke quality. Although these samples belong to coking coals, the mechanical strength and thermal strength of the corresponding cokes are quite different. Macerals in coals, especially vitrinite, have significant effect on thermal strength of cokes. The thermal strength of coke B is better than coke A, because coal A mainly contains desmocollinite and coal B has more telocollinite. The CSR of coke B, C and D is higher than 60%, indicating they possess good thermal property. In the coking process, relatively low initial softening temperature (<400 °C), wide plastic temperature range (>100 °C), smooth fluidity region and appropriate maximum fluidity is helpful to improve coke quality based on Gieseler fluidity analysis. Coal C and Coal D have lower condensation degree, shorter aliphatic chain, and more hydrogen bond, which reveals that the condensation degree and hydrogen bond play important roles on the formation of plastic mass and coke thermal strength. Coke A shows unsatisfied properties because coal A has higher condensation degree and less hydrogen bond. In addition, TG-MS and CH4 evolution characteristics also imply the volatile matter released from coal A during pyrolysis mainly comes from the covalent bond with higher bond energy, which indicates that the chemical bond of coal A is more stable than other coals.

1. Introduction

The coking industry is an important basic energy and raw material industry, which connects coal, coke and steel industries and plays an important role in the industrial chain, economic construction, social development and so on [1,2]. With the development of large-scale blast furnaces, the requirements for coke quality have gradually improved, and high-quality coking coal resources have become more and more scarce. This means that if the optimal scheme can be selected in coal blending, not only can the coke quality be guaranteed, but the cost can also be effectively reduced [3,4,5]. Based on the fact that there are many blended coals in the domestic coking coal market, optimizing coal blending technology to make the best use of coal resources and obtain high-quality cokes is essential to reasonably utilize coal resources and improve coke quality. Therefore, it is of great significance to deeply understand characteristics of raw coal and their influences on coke quality.
The chemical and physical structure of coal is changed in the process of thermal decomposition, free radical generation and reaction, hydrogen transfer, condensation and crosslinking, polymerization and other complex chemical reactions of coal. Saxena et al. [6] summarized the typical coking reaction process of coking coal. Firstly, hydrogen bonds and carboxyl groups break down and release gases such as carbon dioxide and water in the temperature range of 200–400 °C. Secondly, depolymerization reactions occur when the temperature rises to 350–550 °C (plastic stage), and weak bridging bonds containing functional groups such as methylene break from the macromolecular structures of coal and generate gaseous hydrocarbons such as CH4. Accompanied by the dealkylation reaction of aliphatic side chains, this decomposition contributes to the generation of unstable aromatic free radicals. Then, the free radicals were stabilized by hydrogen transfer and formed the plastic layer [7,8,9,10]. The plastic layer formed at this stage has fluidity characteristic. Some aromatic fragments that are small enough to evaporate are released as a form of tar from the plastic layer, and the generated high temperature coal tar is mainly composed of polycyclic aromatic hydrocarbons and aromatic clusters containing more than twenty rings. Finally, when the temperature continues to rise over the thermoplastic stage, the carbon structures of the plastic layer change and become solid to form semi-coke [11,12,13]. After 750 °C, the hydrogen atoms around the condensed aromatic ring fall off and release more hydrogen. The generated free bonds further make the solid products polycondensate, thus enlarging the carbon network and forming coke. It can be seen from the reaction mechanism of coking coal that the structures and properties of coke largely depend on the chemical structures of raw coal.
A large number of studies have found that there is a close relationship between the chemical structure and thermoplasticity, and it is necessary to integrate different properties to predict and improve coke quality [14,15]. Lee et al. [16] obtained high-resolution images of plastic mass using synchrotron radiation Micro-CT, and studied the effect of coals with different vitrinite contents. It is found that coals with higher vitrinite contents can produce plastic mass with better fluidity, making the hydrogen transfer more efficient. Shin et al. [17] found that FTIR parameters have a good correlation with the properties of coal. The average vitrinite reflectance determines the aromaticity (Aar/Aal) of coal types, and aliphatic hydrogen has a great influence on the fluidity of coal. At the same time, when the volatile content of coal is higher, it shows higher fluidity and lower aromaticity (Aar/Aal). Lee et al. [18] studied the chemical structure changes of the plastic layer in coal during the coking process. The aliphatic structure in coal may influence the thermoplastic property during the formation of the plastic layer through FTIR. Guo et al. [19] pointed out that the thermal strength of coke obtained from coking coal with the same type are greatly different. High vitrinite content in coal is conducive to improving coking performance, but low inertinite content will reduce the strength of coke. If the macromolecular structure in coal consists of large aromatic clusters and short alkyl chains such as methyl or methene, it will be difficult to depolymerize to form transferable hydrogen-rich free radical donors or acceptors. Li et al. [20] found that the coal cohesiveness is closely related to infrared bands of 3000 cm−1–2800 cm−1 and 3700 cm−1–3000 cm−1, affecting the coking performance. Some studies also reported that oxygen in coal is not conducive to thermoplastic, and the oxidation reaction will reduce the fluidity of coal [21,22]. Owing to the complexity of coal structure and composition, the coking process needs to comprehensively consider coal quality characteristics such as coal metamorphic degree, volatile matter and ash content of coal, cohesive properties such as the caking index and plastic layer index, microscopic properties such as the functional group and microstructure of coal, and other factors. Most of the researches mainly focus on the basic coal quality characteristics and caking characteristics of coal, while few systematic researches have been conducted on the microstructure and composition of coal, the maximum fluidity of plastic mass, basic structural units and characteristic functional groups. Therefore, it is important to systematically study various apparent properties of coking coal and reveal the intrinsic relationship between coal microstructure and coke quality for optimizing coal blending structure and improving coke quality.
In this work, four typical coking coals from Shanxi Province were selected and used to produce coke through a scale-up coking experiment in a kilogram-type coke oven. In order to study the relationship between coal microstructures and the coke quality, the basic coal properties, cohesiveness (caking index and plastic layer), petrographic properties, fluidity and chemical structures of coal samples were firstly analyzed through various characterizations. And the influences of these indexes on the coke quality were systemically investigated. In addition, in-situ FTIR and TG-MS were also used to further study the changes of chemical structures and micro-composition during the coking process.

2. Materials and Methods

2.1. Materials

Four kinds of coal samples from Shanxi Province were used in this study. These coal samples were divided, crushed and screened, and named coal A, coal B, coal C and coal D. The proximate analyses, ultimate analyses, caking index (G value), the maximum thickness of the plastic layer index (Y value) and final shrinkage (X value) of the four samples were determined according to Chinese standards for coal analyses (GB/T 212-2008, GB/T 30733-2014, GB/T 5447-2014 and GB/T 479-2016) and are shown in Table 1.

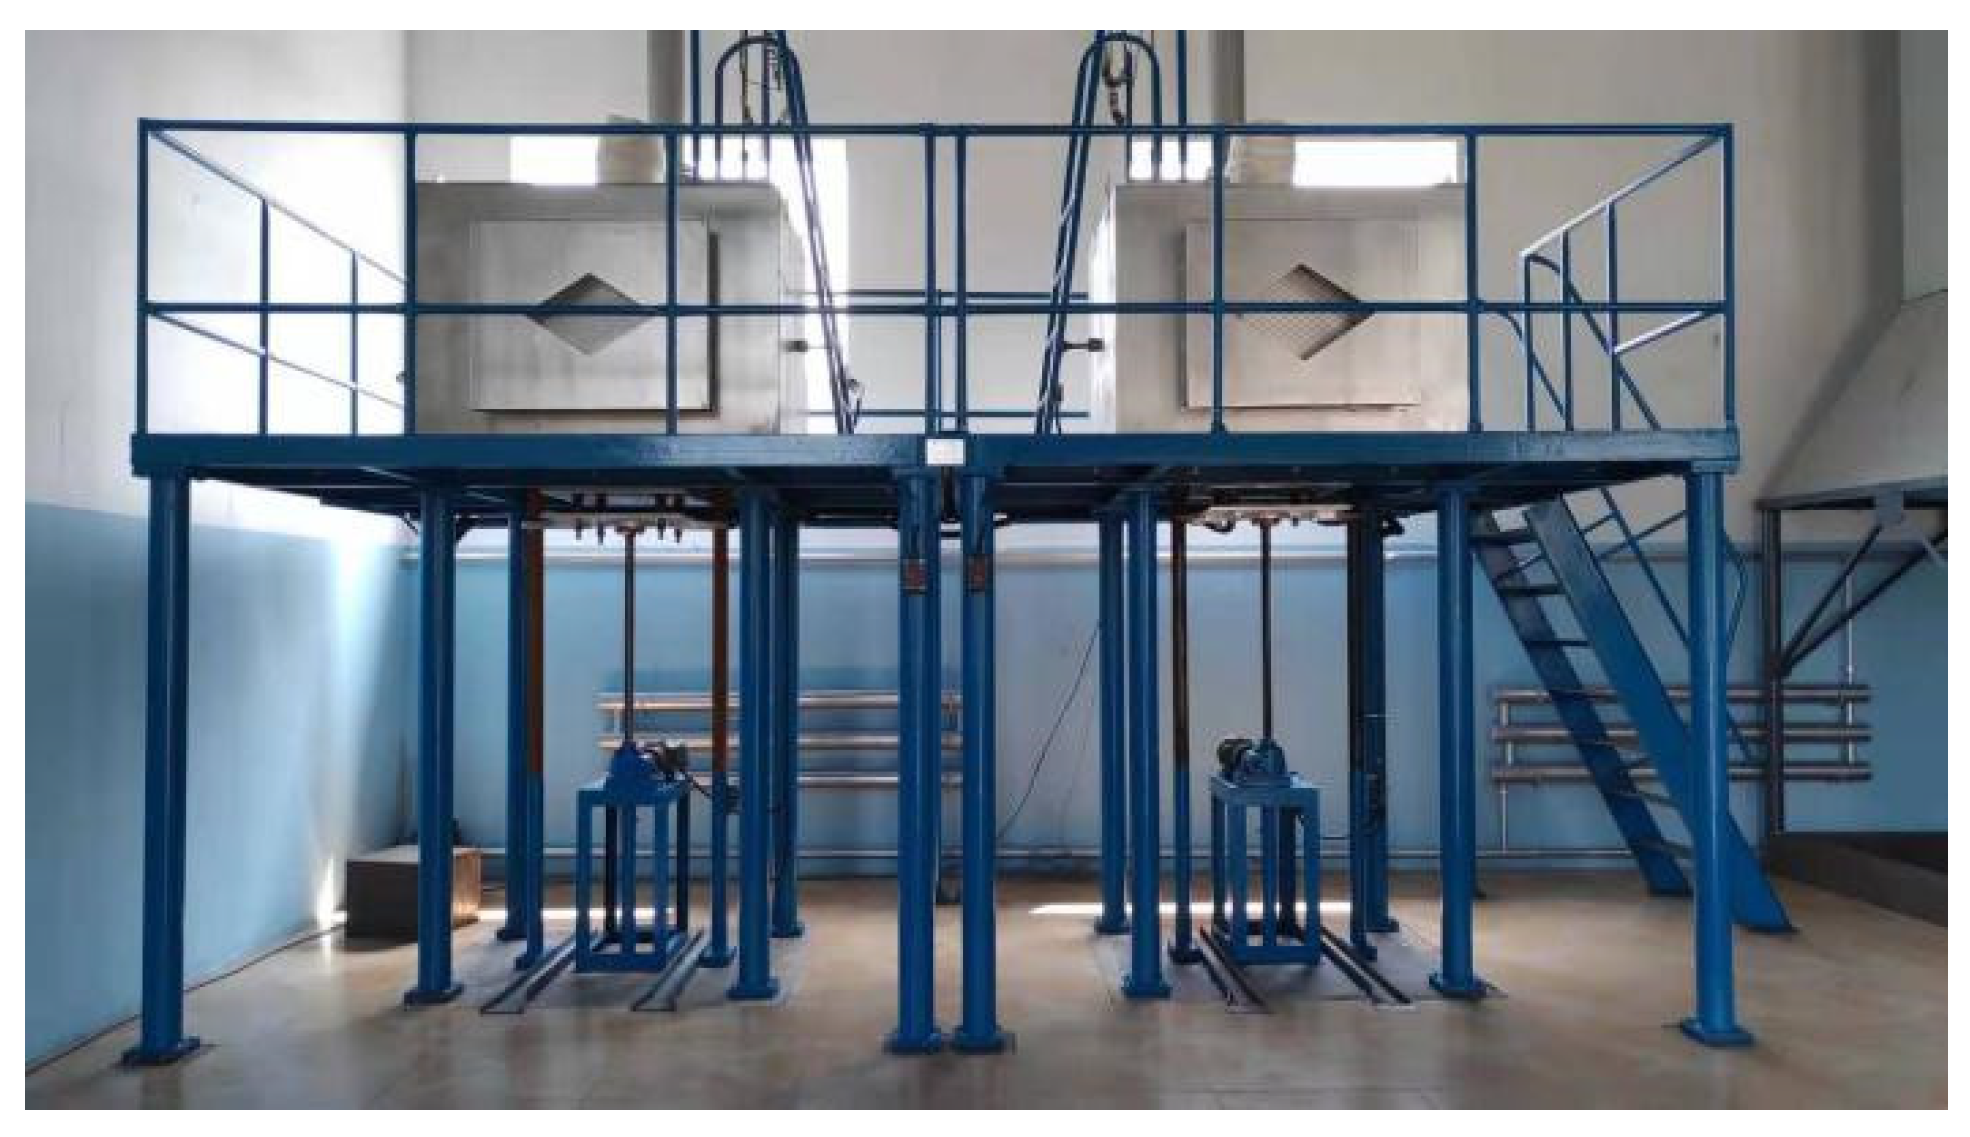
2.2. Coking Test by the 40 kg Experimental Coke Oven

The coking test was carried out in an MHJ-40 kg (Ⅲ)-type experimental coke oven, as shown in Figure 1, which was set up in our lab. The coal loading and coke discharging of the coke oven adopt the bottom door opening method. The carbonization chamber is approximately 420 mm × 550 mm × 460 mm (L × W × H). The inner wall is integral carbonized silica brick, and the coal material is heated on both sides by silicon carbon rod heating. The maximum temperature is up to 1300 °C. Relevant test steps and results are in accordance with coal coking test method MT/T 1181-2019 from the coal industry standard of China. The specific experimental steps are as follows: First, crush the raw coal materials, and the coal samples with particle size less than 3 mm should reach 85–90%; Second, put the coal samples into the charging box and level the coal surface to make the dry basis bulk density reach 800 ± 10 kg/m3; Third, after the furnace temperature rises to 800 °C and keeps for 3 h, lift the charging box into the furnace and start to heat up. When the central temperature of coke cake reaches 950 °C and lasts for 30 min, the furnace will be discharged when the total constant temperature time of furnace wall reaches 6 h. Finally, coke samples are obtained by low moisture coke quenching.
The coke reactivity of the obtained coke samples was tested by the following procedure. Weigh a certain amount of coke sample and place it in the reactor. After reacting with carbon dioxide for 2 h at 1100 °C, the coke reactivity is expressed as the percentage of coke mass loss. Then the drum test was carried out; the strength of the coke after reaction is expressed as the percentage of the coke with a particle size greater than 10 mm in the coke after reaction [23,24].

2.3. Analytical Methods

2.3.1. FTIR

The chemical structure of the coal samples was tested by FTIR using a German Bruker-Tensor 27 infrared spectrometer. 1 mg dry coal sample was mixed with 100 mg of KBr, ground and pressed into tablets. Then, the formed tablets were put into an infrared spectrometer for testing. The characteristic peaks of carbon structure and oxygen-containing functional groups of coal in the FTIR spectrum can be divided into four regions: 900 cm−1–700 cm−1 is the bending vibration region of aromatic rings; 1800 cm−1–1000 cm−1 is the region of oxygen-containing functional groups and aromatic structures; 3000 cm−1–2800 cm−1 is the region of aliphatic carbon chain structures; 3700 cm−1–3000 cm−1 is the region of hydrogen bonds and hydroxyl groups in coal. Assuming that the carbon atoms were all aliphatic or aromatic, the following structural parameters are calculated according to the method of reported literature [25,26,27].
Apparent aromaticity:
f a = 100 V daf × 0 . 9677 C
Aar/Aal is used to indicate the aromaticity of coal:
A ar A al = A 900 700   cm 1 A 3000 2815   cm 1  
The C-H stretching vibration of aromatic hydrocarbons can be characterized by 3100 cm−1–3000 cm−1, and the C-H stretching vibration of aliphatic hydrocarbons can be characterized by 3000 cm−1–2815 cm−1.
I1 represents the ratio of aromatic hydrocarbon structure content to aliphatic hydrocarbon structure content in coal, indicating the condensation degree of aromatic rings and the removal degree of aliphatic structures, and obtained by the following equation:
I 1 = A 3100 3000   cm 1 A 3000 2815   cm 1
I2 is used to characterize the degree of branching of aliphatic chain, and obtained by the following equation:
I 2 = A 2920   cm 1   A 2950   cm 1
In addition, the chemical structure changes during thermal transformation were studied by the in-situ FTIR (Thermo Scientific Nicolet iS50, Waltham, NJ, USA) combining with the infrared spectra of the coke samples obtained from a 40 kg coke oven. The test conditions were as follows: from room temperature to 520 °C, the heating time was 100 min, and the data were collected at intervals of 0.5 min.

2.3.2. Petrographic Analysis

The petrographic analysis of coal samples was performed using a BRICC-M automatic coal and rock image analysis system. The test method was mainly based on Chinese standards (GB/T 15588-2013 and GB/T 40485-2021).

2.3.3. TG-MS

TG-MS consisting of Hitachi thermogravimetric mass spectrometry (7300TG/DTG) and Tilon T200 online mass spectrometry was used to study the conversion rate and gas volatiles evolution with the increase of pyrolysis temperature during the coal coking process. About 10 mg samples were weighed and heated from room temperature to 900 °C at a rate of 3 °C/min, then held for 30 min. The carrier gas was argon, and the gas flow rate was 200 mL/min. The gas volatiles including methane, hydrogen, alkanes and olefins were collected by mass spectrometry.

2.3.4. XRF

The X-ray fluorescence spectroscopy (XRF) (AXIOSX, Almelo, The Netherlands) was used to analyze major elements and their oxides in coal samples. First, coal samples were heated to 850 °C in a muffle furnace. Then the obtained coal ash was characterized by XRF. According to the composition and content of minerals in coal ash obtained by XRF, the coke reactivity mineral catalytic index (MCI) can be calculated, which represents the catalytic effect of the mineral composition in coal on the coke reactivity. The calculation formula of the MCI is as follows [28]:
M C I = A d × ( F e 2 O 3 + 1.85 × K 2 O + 2.2 × N a 2 O + 1.6 × C a O + 0.83 × M g O   + 0.9 × M n O ) ÷ ( ( S i O 2 + 0.41 × A l 2 O 3 + 2.5 × T i O 2 ) × ( 100   V d ) ) × 100 %  

2.3.5. Gieseler Fluidity

The maximum fluidity (MF), initial softening temperature (IST), resolidification temperature (RST), maximum fluidity temperature (MFT) and fluidity temperature range (FTR) of coal samples were tested by a JS1-1 Gieseler fluidity analyzer. The test method was carried out according to Chinese standard (GB/T 25213-2010).

3. Results and Discussion

3.1. Influences of Basic Properties of Coal on Coke Quality

In this work, the scale-up coking experiment was conducted in a 40 kg coke oven to produce coke samples (A, B, C and D) using the four coal samples from Shanxi province in China. The mechanical strength including breakage resistance strength (M40) and abrasion resistance strength (M10), and thermal properties including coke reactivity index (CRI) and coke strength after reaction (CSR), are important properties for reflecting the coke quality. Thus, they were analyzed in this work and shown in Table 2. It can be seen from Table 2 that the breakage resistance strength (M40) decreases successively in the order of coke A > coke B > coke C > coke D. The abrasion resistance strength (M10) of coke B and coke D is better than that of coke A and coke C. Moreover, the CSR of coke samples increase in the order of coke A < coke C < coke B < coke D. The CSR of coke B, C and D is higher than 60%, indicating they possess good thermal property. The proximate analysis of coke samples was also tested and listed in Table 2. It shows that from coke A to coke D, the ash content increases in turn, and the volatile content increases first and then decreases. On the whole, the ash and volatile content of the four kinds of coke are within the normal range. The maturity of coke can be judged according to the volatile content. The volatile content of four kinds of coke is lower than 1.4%, indicating that the quality of coke obtained under this test condition meets the requirements. In addition, although the volatile content of coal D is the highest, the volatile content of coke D is not the highest, which indicates that the amount of volatile matter released in the process of coal coking may be related to the activity of oxygen containing functional groups in coal, that is, volatile matter is easier to release when the active oxygen is relatively high.
It can be seen from Table 1 that these coal samples are “coking coal (JM)” determined by the volatile content (Vdaf) and the caking index value (G) according to Chinese standard (GB/T 5751-2009). The proximate analysis shows ash contents of four coal samples are relatively close, ranging from 9.12% to 10.80%. However, the volatile contents are widely varied. The volatile content of coal A is the lowest with the value of 18.61% and the volatile content of coal D is the highest with the value of 29.91%, which influence the formation and quality of plastic mass in coal and further affect the coke quality. The ultimate analysis shows the oxygen content of coal samples increases as the order of coal A < coal B < coal C < coal D. In addition, oxygen in coal may promote the oxidation of coal and reduce the fluidity of plastic mass in coal, which means the corresponding coke will have low thermal strength. However, the coke D with high oxygen content has the highest CSR. Because the main factors affecting the thermal strength of coke are the metamorphic degree of coal, cohesiveness, ash content and minerals in coal, coking process conditions and coke microstructure. It is not reliable to judge the coke thermal strength only by relying on such apparent coal quality indicators as volatile matter, oxygen content, caking index, maximum thickness of plastic layer and average maximum reflectance of vitrinite. In addition to conventional coal quality indicators, comprehensive judgment should be made by combining alkali metal content of coal, genetic factors (including coal petrographic composition, coal forming experience, etc.). Moreover, the G value and Y value of the four coal samples both increases as the order of coal A < coal B < coal C < coal D. Based on previous studies, the larger the G value and the Y value are, the better the cohesiveness of coal is, and more inert substances can be adhesive, which is beneficial for the formation of coke with high quality. However, as shown in Table 2, except of coke D, the CSR of coke B is also relatively high, but the G and Y of coal B is relatively low from Table 1. The coke quality is affected by various comprehensive factors, such as coal blend characteristics, pore structure and coke carbon textural composition [29,30]. Thus, the basic properties, such as oxygen content, the G value and Y value are not enough to fully and deeply characterize the real quality of the coke, and a comprehensive analysis such as microstructure of coal is needed.

3.2. Influences of Organic and Inorganic Components in Coal on Coke Quality

Coal is composed of organic microcomponents (e.g., vitrinite, inertinite and liptinite) and a few amounts of inorganic microcomponents (minerals such as alkali metal oxide and alkaline earth metal oxide). The structure and property of organic components in coal are different, which mainly influence the coking process and coke quality. Thus, the maceral composition of the four coal samples were characterized to study the effect on coke quality. As shown in Table 3, the standard deviations (S) of coal samples are less than 0.1, implying they are all single coal instead of blended coal. It can be determined that the four coal samples are main coking coal according to the vitrinite reflectance (Rran). Coal D has the lowest vitrinite reflectance, indicating that the coalification degree of coal D is lower than that of other coals. In addition, the vitrinite is the main active component in coal, and its cohesiveness in the coking process determines the coke quality. In Table 3, the vitrinite content of the four coal samples ranges from 52.90% to 59.80%, and the inertinite content ranges from 34.60% to 45.50%. Although the vitrinite content of the four coals is relatively close, the CSR of the four kinds of cokes is quite different, especially coke A and coke B, which may result from the quality of the vitrinite in coal. Thus, the coal A and coal B were taken as examples for petrographic analysis, and the micrographs are presented in Figure 2. Combined with quantitative analysis data of microscopic composition, it shows that the vitrinite in coal A is dominated by desmocollinite (21.2% of desmocollinite, 12.2% of telocollinite). The content of transition component in desmocollinite is higher, filling with clay, micrinite and other substances. Whereas, the vitrinite in coal B has a higher content of telocollinite (17.8% of desmocollinite, 29.4% of telocollinite). Therefore, the different composition in vitrinite will affect the quality of vitrinite, leading to the different quality of coke A and coke B. Besides, inertinite in coals also has influence on the strength of coke, and the aromatic carbons of the inertinite are the basic structures or skeletal support of the coke [31]. Therefore, it is possible to produce high-quality coke only when the coal contains a certain amount of high-quality vitrinite and an appropriate proportion of inertinite.
Furthermore, the influence of inorganic components in coal samples on coke property were studied by analyzing the coal ash. Coal ash is an important indicator for evaluating the coke reactivity with CO2, because the existed alkali metals and alkaline earth metals oxides always act as catalysts during the coking process [32]. Ash components of the four coal samples were characterized by XRF and the results are shown in Table 4. The content of SiO2 and Al2O3 is much higher and the total content exceeds 80 wt%, of which coal A and coal D reach 85.3% and 88.6%. According to formula 5, the mineral catalytic index (MCI) of four coal samples are obtained, which is 2.03%, 3.06%, 3.36% and 1.71%, respectively. The MCI of coal D is the smallest, indicating that minerals in coal D have the weakest catalysis on coke reactivity, following by coal A, coal B and coal C. According to the coke reactivity index displayed in Table 2, it is found that the rule of CRI (coke D < coke B < coke C) is positively correlated with the MCI of the corresponding coal samples (coal D < coal B < coal C), which indicates that minerals in coals have promotive effect on coke reactivity to a certain extent. Unusually, the MCI of coal A is not larger, but its CRI is the largest one, implying that there are other factors influence the coke quality. Thus, it is necessary to study the intrinsic factors such as chemical structures of coal on coke properties.

3.3. Influences of Chemical Structures of Coal on the Thermal Strength of Coke

The chemical properties of plastic mass in coal play a crucial role in coking and have a great influence on coke quality, because the cohesiveness of plastic mass is related to the aliphatic structure of coal and hydrogen bonds containing hydroxyl group (-OH) or amino group (-NH) [20,33,34]. Thus, we analyzed the chemical structures of four coal samples by FTIR and displayed in Figure 3. According to the literature [35,36], the FTIR bands assignments and functional group distributions of coal samples are shown in Table 5. FTIR spectra of the four coal samples are similar, and the peaks of functional groups are mainly in the range of 730 cm−1 to 3700 cm−1. The absorption peaks at 3200 cm−1–3600 cm−1 is assigned to the hydrogen bond formed by hydroxyl and a small amount of amino groups. The peak at 2922 cm−1 is assigned to the aliphatic-CH2 antisymmetric stretching vibration, and the intensity is much higher than the aliphatic-CH2 symmetric stretching vibration, implying there are more aliphatic-CH2 carbon chain structures in these four coal samples. In addition, these coal samples have oxygen-containing functional groups such as phenolic hydroxyl group, carboxyl group and carbonyl group.
The characteristic absorption peaks in the spectra obtained by FTIR often overlap each other, so the information such as the peak height and peak area cannot be accurately analyzed. Thus, we used Peakfit sub-peak fitting software to deal with the FTIR spectra by curve fitting method in order to obtain more chemical structure information of coal samples. The fitting curves of the main functional groups belonging to the four coal samples are shown in Figure 4. The range of 3700 cm−1−3000 cm−1 represents the hydrogen bond region, and A 3700 3000   cm 1 is the peak area of the hydrogen bond region. The hydrogen bond composed of hydroxyl-OH has great influences on the cohesion and coke ability of coal. The range of 900 cm−1−700 cm−1 represents the aromatic ring substitution region. The higher the peak area of A 900 700   cm 1 , the higher proportion of substituted aromatic rings is in coal structure. Taking coal A as an example, the curve in the range of 3700 cm−1–3000 cm−1 was fitted and divided according to the Gaussian algorithm, and nine Gaussian peaks were obtained. Parameters such as peak area, peak height, and half-peak width of each sub-peak were also obtained, then   A 3700 3000   cm 1 and A 3100 3000   cm 1 were calculated. For the 900−700 cm−1 region of aromatic ring bending vibration, five Gaussian peaks and the corresponding parameters were obtained, then A 900 700   cm 1 was calculated. For 3000 cm−1−2815 cm−1 region of aliphatic stretching vibration, four Gaussian peaks and the corresponding parameters were obtained, and A 3000 2815   cm 1 can be obtained. According to the results of Peakfit and the formula in Section 2.3, the chemical structure parameters of the coal samples were listed in Table 6.
It can be seen from Table 6 that I1 value of coal A is the maximum and is up to 0.452, while I1 values of the other three coal samples just range from 0.026 to 0.044. It indicates that the content of aromatic structure in coal A is high, and the content of aliphatic hydrocarbon structure is a little low, which means coal A has high condensation degree. In addition, coal D has the lowest condensation degree, followed by coal B and coal C. Table 1 and Table 2 shows that the G value of coal A and CSR of coke A is the lowest, while the G value of coal D and CSR of coke D is the highest, so the condensation degree of coal samples has a very strong correlation with the caking index and thermal strength of coke. The above conclusions were also found in the study of Li et al. [20], which pointed out that when the condensed degree of the structural unit is low and the amount of bridge bonds is large, the plastic mass can be generated regardless of coal molecule size. The cohesiveness of coal is closely related to its FTIR absorption peak, especially the two absorption bands of 3000 cm−1−2815 cm−1 and 3700 cm−1−3000 cm−1. By comparing the area corresponding to 3700 cm−1−3000 cm−1 of four coal samples, it is found in Table 6 that A3000−3700 of coal A is the smallest, indicating that hydroxyl groups in coal A are less than other coal samples. This also means that the hydrogen bond of coal A has less contribution to the amount of plastic mass formed. From the area corresponding to 3000 cm−1−2815 cm−1, it can be seen that the aliphatic hydrocarbon structure content of coal A is the smallest, which leads to the highest aromaticity of coal A. Additionally, the apparent aromaticity (ƒa) of coal D is the lowest, which also shows that aromatic rings in coal A is more stable. From the parameter of I2, coal D has the shortest aliphatic chain and the highest degree of branching, while coal A has a shorter aliphatic chain than coal B and coal C. In general, it is difficult to obtain a high G value when the aliphatic chain is long. For A3000−3700, representing the hydrogen bond region, the peak area of coal A is the smallest, while the peak area of coal C is the largest, and the peak area of coal B and coal D is very close. Hydrogen bonding structures in coal will be broken and form substances dominated by the plastic mass liquid phase during the formation of plastic mass, which also affect the coke quality. From the analysis of the aromaticity data, coal D has the smallest aromaticity, and coal A has the largest aromaticity, indicating that coal D has less carbon atoms belonging to the aromatic ring structure than that of coal A. Thus, coke A produced by coal A shows unsatisfied thermal strength than others, mainly because coal A has higher aromaticity and condensation degree, longer aliphatic chain or lower branching degree and lower content of hydrogen bond. Moreover, the condensation degree of aromatic rings and bridge bonds such as hydrogen bonds play important roles in coke quality.

3.4. Chemical Structures of Coal during Coking Process

From the above research, it is recognized that the chemical structures and maceral compositions of coal have great influence on the coal cohesiveness and the coke quality, and the above processes mainly occur in the plastic mass formation stage and the semi-coke formation stage. In order to further reveal the thermochemical reaction characteristics in the pyrolysis process, the changes of chemical structures of coal during the coking process from room temperature to 520 °C was studied through in-situ FTIR, and the results are shown in Figure 5. There are a lot of aromatic structures in the four coking coals, and the content of aliphatic structures in each coal is different. With the increase of temperature, the absorption peaks at 500 cm−1−1000 cm−1, especially the absorption peaks around 750 cm−1, 825 cm−1 and 880 cm−1, are slightly enhanced. It shows that with the increase of the pyrolysis temperature, the functional groups on the aromatic ring are cleaved or condensed, resulting in the removal of the side chains with the C-H structures on the aromatic ring to a certain extent. The intensity of peaks at 1500 cm−1 and 1600 cm−1 remains nearly unchanged during the heating process, indicating that the aromatic skeleton structures of coal are not changed. The bands of 3000 cm−1−2815 cm−1 belong to the alkyl chains (CH, CH2 and CH3), and the intensity decreases obviously, showing that the aliphatic components of coal decompose violently during pyrolysis. Figure 6 shows the FTIR spectra of the coke produced by four coal samples. It can be seen from Figure 6 that there are almost no substituents on aromatic rings of cokes, and the aliphatic hydrocarbons and cyclic hydrocarbons are extremely unobvious, which indicates that the removal of substituents occurs in the carbonization process of coal at high temperature, and the aliphatic hydrocarbons decrease or even disappear.

3.5. Gieseler Fluidity and TG−MS Analysis

Gieseler fluidity was used to characterize the fluidity characteristics of coking coals. The initial softening temperature (IST), maximum fluidity temperature (MFT), resolidification temperature (RST), fluidity temperature range (FTR) and maximum fluidity (MF) were shown in Table 7 and Figure 7. From coal A to coal D, the initial softening temperature of coal samples become lower and the maximum fluidity become higher. The maximum initial softening temperature of coal A is 453 °C, which means that coal A begins to flow only at higher temperature, and the plastic temperature range is narrow. Thus, the active substances in coal A do not have sufficient time and space to interact with the inert substances and fuse, resulting in the lower thermal strength of coke A. It is noted from Table 1 that G value of coal A and coal B is close, but the fluidity curve and range of coal B differs greatly from that of coal A in Figure 7, implying that caking index G can only reflect the viscosity of plastic mass. The narrower plastic range and smaller maximum fluidity result in poor fusion of plastic mass and inertinite, which lead to low thermal strength of coke. Similarly, the G values of coal C and coal D are very close (as shown in Table 1), and their plastic temperature ranges are also close. Although the maximum fluidity of coal D is ten times higher than that of coal C, the CSR of the corresponding coke is both higher than 60% shown in Table 2, and the thermal strength of coke is good. Therefore, it is necessary to comprehensively analyze the caking index, plastic temperature range and maximum fluidity of coal to determine its influence on coke quality. According to the Gieseler fluidity parameters of the four coking coals, the initial softening temperature of coal D is the lowest, the plastic range is the widest, and the thermal strength of coke made from coal D is the best. Therefore, according to the above results, when the initial softening temperature is lower than 400 °C and the plastic range is higher than 100 °C, high-quality coke can be obtained.
TG-MS was used to analyze TG, DTG and CH4 evolution during the heating process of coal samples. The results are shown in Figure 8. It can be seen that the maximum weight loss rate of coal A is lower than that of coal B, coal C and coal D, and the temperature corresponding to the maximum weight loss of coal A is the highest, which shows that the activation energy required for the fracture of aliphatic hydrocarbon side chain and oxygen-containing functional group of coal A is high. That is to say, the volatile matter released from coal A during pyrolysis mainly comes from the covalent bond with higher bond energy, which indicates that the chemical bond of coal A is more stable than other coals. CH4 generated during coal pyrolysis is from the polycondensation of methyl, aliphatic side chains or aromatic ring compounds in coals. The initial temperature of hydrogen evolution is about 300 °C, and the generation of hydrogen is related to the C=O, H/C and O/C. From the fitting curve of CH4 in the gas mass spectrum, it is found that coal A pyrolysis and generates CH4 at about 500 °C, and releases the most CH4 at 567 °C. It is inferred that CH4 may be formed by secondary pyrolysis of hydrogen ions and aliphatic hydrocarbons, or formed due to methyl groups are broken from aromatic systems at higher temperature.
Comparing the TG curves and fluidity curves of coal samples, it can be found that the area corresponding to the maximum fluidity basically coincides with the peak area of DTG, and the temperature corresponding to the maximum fluidity is slightly higher than the temperature corresponding to the maximum weight loss rate. The above results show when the coal is heated to a certain temperature, the coal particles begin to soften. The fluidity of plastic mass is increased with the increase of temperature, and more volatiles emit during the pyrolytic reaction. The maximum fluidity occurs when the content of volatiles reaches the maximum value. Then, as the temperature continues to increase, the volatiles gradually decrease, and the fluidity begins to decrease. Therefore, in the area where the weight loss during coal pyrolysis reaches the highest, the cohesiveness and fluidity of plastic mass changes greatly, as well as the gas evolution.

4. Conclusions

Four typical coking coals from Shanxi Province were used to investigate the influences of coal microstructures on the coke quality. The thermal strength and mechanical strength of cokes are positively related with the caking index and plastic layer value of coals, but actually the mechanical strength and thermal strength of the corresponding cokes are quite different. Thus, the microscopic structure and composition, chemical structure and fluidity were systemically studied. It was found the content of macerals especially vitrinite and inertinite is relatively close, but the activity of macerals is significantly different through petrographic analysis, which leads to the different coke quality. Therefore, the vitrinite, inertinite and metal oxides of coals need to maintain a certain balance to ensure the better coke quality during the coal blending process. In addition, from analyzing of chemical structures through FTIR and in-site FTIR during the coking process, hydrogen bonding structures in coal will be broken and form substances dominated by the plastic mass liquid phase, and it is beneficial for improving coke quality when coals have lower condensation degree of the aromatic ring, longer aliphatic chain length or lower branching degree and more content of the hydrogen bond. The results of Gieseler fluidity suggest that relatively lower initial softening temperature (<400 °C), wider plastic temperature range (>100 °C), smoother fluidity region and appropriate maximum fluidity of coals is helpful to the coking process. Furthermore, combining the TG-MS and CH4 evolution characteristics, it also implies that the volatile matter released from coal A during pyrolysis mainly comes from the covalent bond with higher bond energy, which indicates that the chemical bond of coal A is more stable than other coals. This study can provide a fundamental basis for optimization of coking coal blending under complex mixed coal conditions to improve coke quality and boost efficient and clean utilization of coal resources.

Author Contributions

Conceptualization, Y.W. and Q.Z. (Qi Zhou).; methodology, S.Q.; validation, Y.W., Q.Z. (Qi Zhao) and Y.Z.; formal analysis, Y.W.; investigation, Y.Z.; data curation, Y.W. and Q.Z. (Qi Zhou); writing—original draft preparation, Y.W.; writing—review and editing, Q.Z. (Qi Zhou) and S.Q. All authors have read and agreed to the published version of the manuscript.

Funding

This research was funded by the China Coal Research Institute (2020CX–II–07).

Data Availability Statement

Not applicable

Acknowledgments

The authors gratefully acknowledge the financial support of fund of China Coal Research Institute (2020CX−Ⅱ−07).

Conflicts of Interest

The authors declare no conflict of interest.

References

  1. Zhao, J.; Liu, H.; Zhang, H.; Song, X.; Zuo, H.; Wang, G.; Xu, Z.; Wu, M.; Zhang, Z.; Chi, R. Metallurgical performance and structural characteristics of cokes of hypercoal prepared from the mixture of low-rank coal and biomass residue. Fuel 2023, 332, 126069. [Google Scholar]
  2. Wang, H.; Jin, B.; Wang, X.; Tang, G. Formation and Evolution Mechanism for Carbonaceous Deposits on the Surface of a Coking Chamber. Processes 2019, 7, 508. [Google Scholar]
  3. Yan, S.; Lv, C.; Yao, L.; Hu, Z.; Wang, F. Hybrid dynamic coal blending method to address multiple environmental objectives under a carbon emissions allocation mechanism. Energy 2022, 254, 124297. [Google Scholar]
  4. Cao, X.; Yan, J.; Wang, Z.; Lei, Z.; Ren, S.; Kang, S.; Li, Z.; Shui, H. Comparative study on coal blending and coke-making property of two kinds of thermal dissolution soluble fractions from lignite and coking coal. J. Anal. Appl. Pyrolysis 2022, 166, 105585. [Google Scholar]
  5. Li, H.; Song, X.; Li, G.; Kong, L.; Li, H.; Bai, J.; Li, W. Effect of coal blending on ash fusibility and slurryability of xinjiang low-rank coal. Processes 2022, 10, 1693. [Google Scholar]
  6. Saxena, S.C. Devolatilization and combustion characteristics of coal particles. Prog. Energy Combust. Sci. 1990, 16, 55–94. [Google Scholar]
  7. Lee, S.; Mahoney, M.; Yu, J. Advances in the understanding of the formation and chemistry of the plastic layer during coke-making: A comprehensive review. Fuel 2020, 263, 116655. [Google Scholar]
  8. Nomura, S.; Thomas, K.M. Fundamental aspects of coal structural changes in the thermoplastic phase. Fuel 1998, 77, 829–836. [Google Scholar]
  9. Odeh Andrew, O. Qualitative and quantitative ATR-FTIR analysis and its application to coal char of different ranks. J. Fuel Chem. Technol. 2015, 43, 129–137. [Google Scholar]
  10. Cui, B.; Shen, Y.; Guo, J.; Jin, X.; Wang, M.; Xie, W.; Chang, L. A study of coking mechanism based on the transformation of coal structure. Fuel 2022, 328, 125360. [Google Scholar]
  11. Benfell, K.E.; Liu, G.S.; Roberts, D.G.; Harris, D.J.; Lucas, J.A.; Bailey, J.G.; Wall, T.F. Modeling char combustion: The influence of parent coal petrography and pyrolysis pressure on the structure and intrinsic reactivity of its char. Proc. Combust. Inst. 2000, 28, 2233–2241. [Google Scholar]
  12. Wall, T.F.; Liu, G.S.; Wu, H.W.; Roberts, D.G.; Benfell, K.E.; Gupta, S.; Lucas, J.A.; Harris, D.J. The effects of pressure on coal reactions during pulverised coal combustion and gasification. Prog. Energy Combust. Sci. 2002, 28, 405–433. [Google Scholar]
  13. Chen, Y.; Lee, S.; Tahmasebi, A.; Bai, J.; Mahoney, M.; Yu, J. A review of the state-of-the-art research on carbon structure evolution during the coking process: From plastic layer chemistry to 3D carbon structure establishment. Fuel 2020, 271, 117657. [Google Scholar]
  14. North, L.; Blackmore, K.; Nesbitt, K.; Mahoney, M.R. Methods of coke quality prediction: A review. Fuel 2018, 219, 426–445. [Google Scholar]
  15. Gupta, S.; Shen, F.; Lee, W.-J.; O’Brien, G. Improving coke strength prediction using automated coal petrography. Fuel 2012, 94, 368–373. [Google Scholar]
  16. Lee, S.; Yu, J.; Mahoney, M.; Tremain, P.; Moghtaderi, B.; Tahmasebi, A. A study on the structural transition in the plastic layer during coking of Australian coking coals using Synchrotron micro-CT and ATR-FTIR. Fuel 2018, 233, 877–884. [Google Scholar]
  17. Shin, S.-M.; Park, J.-K.; Jung, S.-M. Changes of Aromatic CH and Aliphatic CH in In-situ FT-IR Spectra of Bituminous Coals in the Thermoplastic Range. ISIJ Int. 2015, 55, 1591–1598. [Google Scholar]
  18. Lee, S.; Yu, J.; Mahoney, M.; Tremain, P.; Moghtaderi, B.; Tahmasebi, A.; Stanger, R.; Wall, T.; Lucas, J. Study of chemical structure transition in the plastic layers sampled from a pilot-scale coke oven using a thermogravimetric analyzer coupled with Fourier transform infrared spectrometer. Fuel 2019, 242, 277–286. [Google Scholar]
  19. Guo, J.; Shen, Y.; Wang, M.; Xie, W.; Kong, J.; Chang, L.; Bao, W.; Xie, K. Impact of chemical structure of coal on coke quality produced by coals in the similar category. J. Anal. Appl. Pyrolysis 2022, 162, 105432. [Google Scholar]
  20. Li, X.; Qin, Z.; Bu, L.; Yang, Z.; Shen, C. Structural analysis of functional group and mechanism investigation of caking property of coking coal. J. Fuel Chem. Techno. 2016, 44, 385–393. [Google Scholar]
  21. Cimadevilla, J.L.G.; Alvarez, R.; Pis, J.J. Effect of coal weathering on technological properties of cokes produced at different scales. Fuel Process. Technol. 2005, 86, 809–830. [Google Scholar]
  22. Wachowska, H.; Pawlak, W. Effect of cleavage of ether linkages on physicochemical properties of coals. Fuel 1977, 56, 422–426. [Google Scholar]
  23. Diez, M.A.; Alvarez, R.; Barriocanal, C. Coal for metallurgical coke production: Predictions of coke quality and future requirements for cokemaking. Int. J. Coal Geol. 2002, 50, 389–412. [Google Scholar]
  24. Kumar, D.; Saxena, V.K.; Tiwari, H.P.; Nandi, B.K.; Verma, A.; Tiwary, V.K. Variability in metallurgical coke reactivity index (CRI) and coke strength after reaction (CSR): An experimental study. ACS Omega 2022, 7, 1703–1711. [Google Scholar]
  25. Mielczarski, J.A.; Denca, A.; Strojek, J.W. Application of attenuated total reflection infrared-spectroscopy to the characterization of coal. Appl. Spectrosc. 1986, 40, 998–1004. [Google Scholar]
  26. Orrego-Ruiz, J.A.; Cabanzo, R.; Mejia-Ospino, E. Study of Colombian coals using photoacoustic Fourier transform infrared spectroscopy. Int. J. Coal Geol. 2011, 85, 307–310. [Google Scholar]
  27. Kastner, J.; Pichler, T.; Kuzmany, H.; Curran, S.; Blau, W.; Weldon, D.N.; Delamesiere, M.; Draper, S.; Zandbergen, H. Resonance Raman and infrared-spectroscopy of carbon nanotubues. Chem. Phys. Lett. 1994, 221, 53–58. [Google Scholar]
  28. Zhang, H.; Bai, J.; Li, W.; Cheng, F. Comprehensive evaluation of inherent mineral composition and carbon structure parameters on CO2 reactivity of metallurgical coke. Fuel 2019, 235, 647–657. [Google Scholar]
  29. Dash, P.S.; Guha, M.; Chakraborty, D.; Banerjee, P.K. Prediction of coke csr from coal blend characteristics using various techniques: A comparative evaluation. Int. J. Coal Prep. Util. 2012, 32, 169–192. [Google Scholar]
  30. Patrick, J.W. 1990. Available online: https://publications.europa.eu/resource/cellar/15c1e068-4039-4182-87c4-20c079f0798d.0001.02/DOC_1 (accessed on 25 December 2022).
  31. Singh, R.; Tiwari, H.P. Microscopic evaluation of inertinite in the coke micro-structure: A case study from Jharia Coalfield, India. Int. J. Coal Prep. Util. 2020, 40, 1–11. [Google Scholar]
  32. Li, C. Some recent advances in the understanding of the pyrolysis and gasification behaviour of Victorian brown coal. Fuel 2007, 86, 1664–1683. [Google Scholar]
  33. Zhang, K.; Yao, S.; Hu, W.; Fang, H. Analysis on infrared spectra characteristic of coal and discussion of coalification mechanism. Coal Geol. Explor. 2009, 37, 8–13. [Google Scholar]
  34. Chen, C.; Gao, J.S.; Yan, Y.J. Observation of the type of hydrogen bonds in coal by FTIR. Energy Fuels 1998, 12, 446–449. [Google Scholar]
  35. Xin, H.; Wang, D.; Qi, X.; Qi, G.; Dou, G. Structural characteristics of coal functional groups using quantum chemistry for quantification of infrared spectra. Fuel Process. Technol. 2014, 118, 287–295. [Google Scholar]
  36. Cooke, N.E.; Fuller, O.M.; Gaikwad, R.P. FTIR spectroscopic analysis of coals and coal extracts. Fuel 1986, 65, 1254–1260. [Google Scholar]
Figure 1. The picture of a 40 kg coke oven used for coking test.
Processes 11 00724 g001
Figure 2. Vitrinite micrographs of coal A and B.
Processes 11 00724 g002
Figure 3. FTIR analysis of coals.
Processes 11 00724 g003
Figure 4. The curve-fitted FTIR spectrum (3700 cm−1−3000 cm−1: hydrogen bonding area, 900 cm−1−700 cm−1: aromatic bending, 3000 cm−1−2815 cm−1: aliphatic and aromatic stretching).
Processes 11 00724 g004aProcesses 11 00724 g004b
Figure 5. In−situ FTIR spectra of coal samples during coking process.
Processes 11 00724 g005
Figure 6. FTIR spectra of coke obtained from coal samples.
Processes 11 00724 g006
Figure 7. Gieseler fluidity curve of coal samples.
Processes 11 00724 g007
Figure 8. TG, fluidity and evolution of CH4 curves of coal samples.
Processes 11 00724 g008
Table 1. Basic properties of coal samples.
SampleProximate Analysis (wt%) Ultimate Analysis (d, wt%) GX/mmY/mm
MadAdVdafCHStNO *
Coal A0.269.1218.61 81.42 4.11 2.651.12 1.58 7427.010.0
Coal B0.5010.1320.47 81.57 4.20 0.431.35 2.32 7930.016.0
Coal C0.6010.7226.82 78.35 4.36 1.371.32 3.88 9018.521.0
Coal D0.1910.8029.91 78.13 4.56 0.761.38 4.37 9417.026.0
Note: ad is air dried basis, d is dry basis, daf is dry and ash-free basis, * by difference.
Table 2. Mechanical strength, thermal property and proximate analysis of coke samples.
SampleM40 (%)M10 (%)CRI (%)CSR (%)Mad (%)Ad (%)Vdaf (%)
Coke A83.66.032.350.00.4810.920.84
Coke B83.24.423.268.20.2611.671.23
Coke C81.26.426.361.40.2013.411.34
Coke D78.44.818.071.00.1014.101.00
Table 3. Vitrinite reflectance and macerals composition of coal samples.
SampleRran (%)SVitriniteInertiniteLiptiniteMineral
Coal A1.480.0759.5034.602.003.90
Coal B1.460.0658.5034.606.100.80
Coal C1.130.0852.9045.500.800.80
Coal D1.020.0759.8035.204.300.70
Table 4. Ash composition of coal samples.
SampleAsh Composition (wt%)
SiO2Al2O3Fe2O3CaOTiO2MnOSO3Na2OMgOK2O
Coal A46.66738.6784.8683.9752.5700.0001.5370.3360.3330.271
Coal B46.22435.3822.9067.2822.1920.0173.6280.31500.3850.389
Coal C43.35637.8505.2155.4872.1730.0362.5110.224 0.2550.323
Coal D47.96640.6844.3961.0623.4070.0000.3010.4670.1780.666
Table 5. Bands assignment of FTIR absorption peaks of coal samples.
Band Position/cm−1Functional Group
3611−3516−OH, OH−π hydrogen bond
3419−3359−OH, −NH
3080−3030aromatic C−H stretching
2975−2850R−CH3, R−CH2, R−CH, asymmetric stretching
2950−2890R−CH3, R−CH2, stretching vibration
1745−1730R−C=O
1721−1695ar−OH, ar−COOH
1615−1590aromatic C=C stretching
1500−1450aromatic C−C stretching
1450−1440aliphatic C−H bending (CH3, CH2)
1300−1000aliphatic C−O stretching
900−700aromatic C−H bending
880−730substituted benzene ring with isolated or two hydrogen
Table 6. Structural parameters of coal samples derived from the FTIR spectra.
SampleƒaA900−700A3000−2815I1I2A3000−3700Aar/Aal
Coal A0.8790.4610.6590.45215.741.6030.699
Coal B0.8480.7901.0150.04120.771.8240.778
Coal C0.8071.1151.9410.04426.783.0710.574
Coal D0.7740.7730.6870.0266.711.7981.125
Table 7. Analysis data of Gieseler fluidity and TG−MS of coal samples.
Sample Parameters from Fluidity Parameters from TG-MS
IST
(°C)
MFT
(°C)
RST
(°C)
FTR
(°C)
MF
(ddpm)
Tmax (°C)Maximum Weight Loss Rate
(g/min)
Coal A 4534845055219 47433.82
Coal B 43547550368229 46534.80
Coal C 403456496931866 45249.35
Coal D 39445449910524628 44559.08
Disclaimer/Publisher’s Note: The statements, opinions and data contained in all publications are solely those of the individual author(s) and contributor(s) and not of MDPI and/or the editor(s). MDPI and/or the editor(s) disclaim responsibility for any injury to people or property resulting from any ideas, methods, instructions or products referred to in the content.

