Article

Application of PLC-Based Spectrophotometric System Nitrogen Protection Device to Automated Direct Measurement of Target Substances in Zinc Hydrometallurgy

1
School of Materials Science and Engineering, Anhui University of Science and Technology, Huainan 232001, China
2
State Key Laboratory of Pollution Control and Resources Reuse, College of Environmental Science and Engineering, Tongji University, Shanghai 200092, China
3
Shanghai Institute of Pollution Control and Ecological Security, Shanghai 200092, China
4
Tianjin Xinke Environmental Protection Technology Co., Ltd., Tianjin 300457, China
*
Authors to whom correspondence should be addressed.
Processes 2023, 11(3), 672; https://doi.org/10.3390/pr11030672
Submission received: 24 January 2023 / Revised: 17 February 2023 / Accepted: 20 February 2023 / Published: 22 February 2023
(This article belongs to the Special Issue Smart Manufacturing & Automation Control Systems for Industry 4.0/5.0)

Abstract

:
Due to the fast material reaction in zinc hydrometallurgy, the traditional national standard photometric method cannot capture the characteristic information of target substances in real time. Herein, a nitrogen protection device is built based on ultraviolet spectrophotometry, supplemented by a programmable logic controller (PLC), to form an automatic control system for the direct detection of target substances (SO42−, Pb2+ and S2−) in zinc hydrometallurgy. The baseline straightness comparison results show that the nitrogen atmosphere can effectively improve the stability of the instrument. Furthermore, the detection sensitivity of SO42−, Pb2+ and S2− under the nitrogen atmosphere is higher than that of the air atmosphere, manifesting in sensitivity increases of 16.23%, 18.05% and 17.91%, respectively. Additionally, devices based on PLC systems show advantages over manual control both in states feedback and information backtrack. Moreover, the regulation time and nitrogen consumption during the regulation process are reduced by 80% and 75%, respectively, which effectively reduces the test cost and improves the equipment utilization rate (from four cycles per day to six cycles per day). The device can meet the requirements of different target substances and different process conditions by changing the electronic control parts and air source, so it has great application potential in the automatic direct measurement of target substances in zinc hydrometallurgy.

1. Introduction

Zinc is an important, indispensable economic pillar in the process of national production and construction [1]. It is also one of the most important metal elements in the world [2], and its consumption ranks fourth in global metal consumption [3,4,5]. According to incomplete statistics, more than 85% of the world’s annual zinc production is produced by hydrometallurgy [6,7,8]. However, zinc hydrometallurgy will result in much pollution, such as industrial wastewater, anode sludge and acid mist, which is caused by extensive management of substance concentration [9]. Based on the process management in the process industry, real-time monitoring of target substances provides a good idea for industrial cleaner production because this idea reduces the source pollution and also reduces the burden of end-of-pipe treatment [10]. Therefore, the real-time monitoring of the target substances is very important for the cleaner production of zinc hydrometallurgy.
Due to the general characteristics of the fast reaction speed of the liquid phase system in zinc hydrometallurgy, the current analysis of target substances in zinc hydrometallurgy mainly adopts the national standard spectrophotometric method. This method requires pretreatment of test samples in the early stage of detection, such as dilution, digestion [11,12], complexation and color development [13,14,15], which cannot obtain accurate photometric information of the target substance in real time within the reaction time of the material and leads to a serious lag in the detection results relative to the real-time state of the liquid phase system in zinc hydrometallurgy, making it difficult to realize real-time feedback and regulation of industrial process [16]. However, the key to realizing the rapid determination of liquid phase flow systems in the process industry is to accurately obtain the luminosity information of target substances at a specific wavelength. The preliminary study shows that UV spectrophotometry based on light absorption is an alternative technology for the direct measurement of liquid in zinc hydrometallurgy without pollution because of its simplicity, rapidity and environmental friendliness [17]. However, the characteristic absorption wavelength of many substances in zinc hydrometallurgy is located in the ultraviolet region. The detection of target substances in the ultraviolet region (SO42− [18], S2− [19], etc.) also faces interference caused by ultraviolet attenuation, which has been confirmed to be caused by ultraviolet absorption by oxygen [20,21]. Specifically, oxygen has strong absorption characteristics in the ultraviolet band and readily absorbs the wavelength <240 nm UV light. When oxygen absorbs ultraviolet light, the chemical bonds between oxygen molecules are broken and recombined to produce ozone molecules (Equations (1)–(3)). However, ozone molecules can also be destroyed by absorbing ultraviolet light in the 200~350 nm band (Equations (4)–(6)) [22]. Therefore, the reversible conversion between oxygen and ozone will not only consume UV energy (Equation (7)) [21] but also cause poor accuracy of the detection results of substances in the ultraviolet region [23]. One of the effective means to reduce the absorption of ultraviolet by oxygen is to adopt inert gases (such as nitrogen, argon, etc.) to isolate oxygen from ultraviolet.
O 2 + h v O ( 3 P ) + O ( 1 D )
O ( 3 P ) + O ( 3 P ) + M O 2 + M
O ( 3 P ) + O 2 + M O 3 + M
O 3 + h v   200 ~ 300   n m O 2 + O ( 1 D )
O 3 + h v   300 ~ 350   n m O 2 + O ( 1 D )
O 3 + h v   300 ~ 350   n m O 2 + O ( 3 P )
3 O 2 U V   l i g h t 2 O 3
where O 2 is the oxygen. O 3   is the ozone. h   is the Planck constant, h = 6.626   ·   10 34   J · s . v   is the frequency, H z ,   s 1 . O   ( 3 P )   is the ground -state oxygen atom. O   ( 1 D )   is the electrically excited oxygen atom. M   is the neutral third body, generally composed of nitrogen molecules or oxygen molecules, that are used for energy transfer but do not participate in chemical reactions.
Although UV spectrophotometry has great application potential in the field of direct measurement, at present, nitrogen replacement of oxygen is still done manually, resulting in a low degree of automation. A programmable logic controller (PLC) is a ruggedized computer used for industrial automation with strong programmability, high reliability, strong anti-interference ability, perfect functions and strong practicability, specifically designed for practical application in a complex industrial environment. Therefore, PLC is widely applied in electric power [24], energy [25], coal [26], chemical industry [27], machinery manufacturing [28], transportation [29], environmental protection [30], medicine [31] and other practical industrial environments. It is found that for the ultraviolet spectrophotometer, which is a medium and small scientific research instrument and equipment, there is no clear report on the relevant research of using PLC technology to carry out the automatic control of the atmosphere displacement of the instrument for the direct measurement of target substances.
Therefore, based on the ultraviolet spectrophotometer equipped with a nitrogen protection device, this work designs a control system for the direct-detection of the target substances in the zinc hydrometallurgy process industry. The system adopts PLC technology to avoid the interference of manual control with the nitrogen protection device. The stability of the instrument under two atmospheres is compared by baseline flatness. The applicability of manual control and PLC control in the direct measurement of zinc hydrometallurgy is evaluated by means of the test method, parameter setting, test condition, test result, state change and historical traceability. The economic benefits of manual control and PLC control are evaluated comprehensively regarding regulation time and nitrogen amount during the regulation period, test cycle and equipment utilization rate. In the end, the application potential of the whole apparatus in the direct measurement of different substances in multiple scenarios of the zinc hydrometallurgy industry is explored. In short, this study has realized the functions of the overall setting of control parameters, diverse detection methods, timely response to state changes, and historical information backtracking. It has the advantages of good stability, high control accuracy, low test cost, and wide application scenarios, and it can provide reliable case references for the application of PLC in the automatic control of small and medium-sized scientific research instruments and equipment.

2. Relevant Research

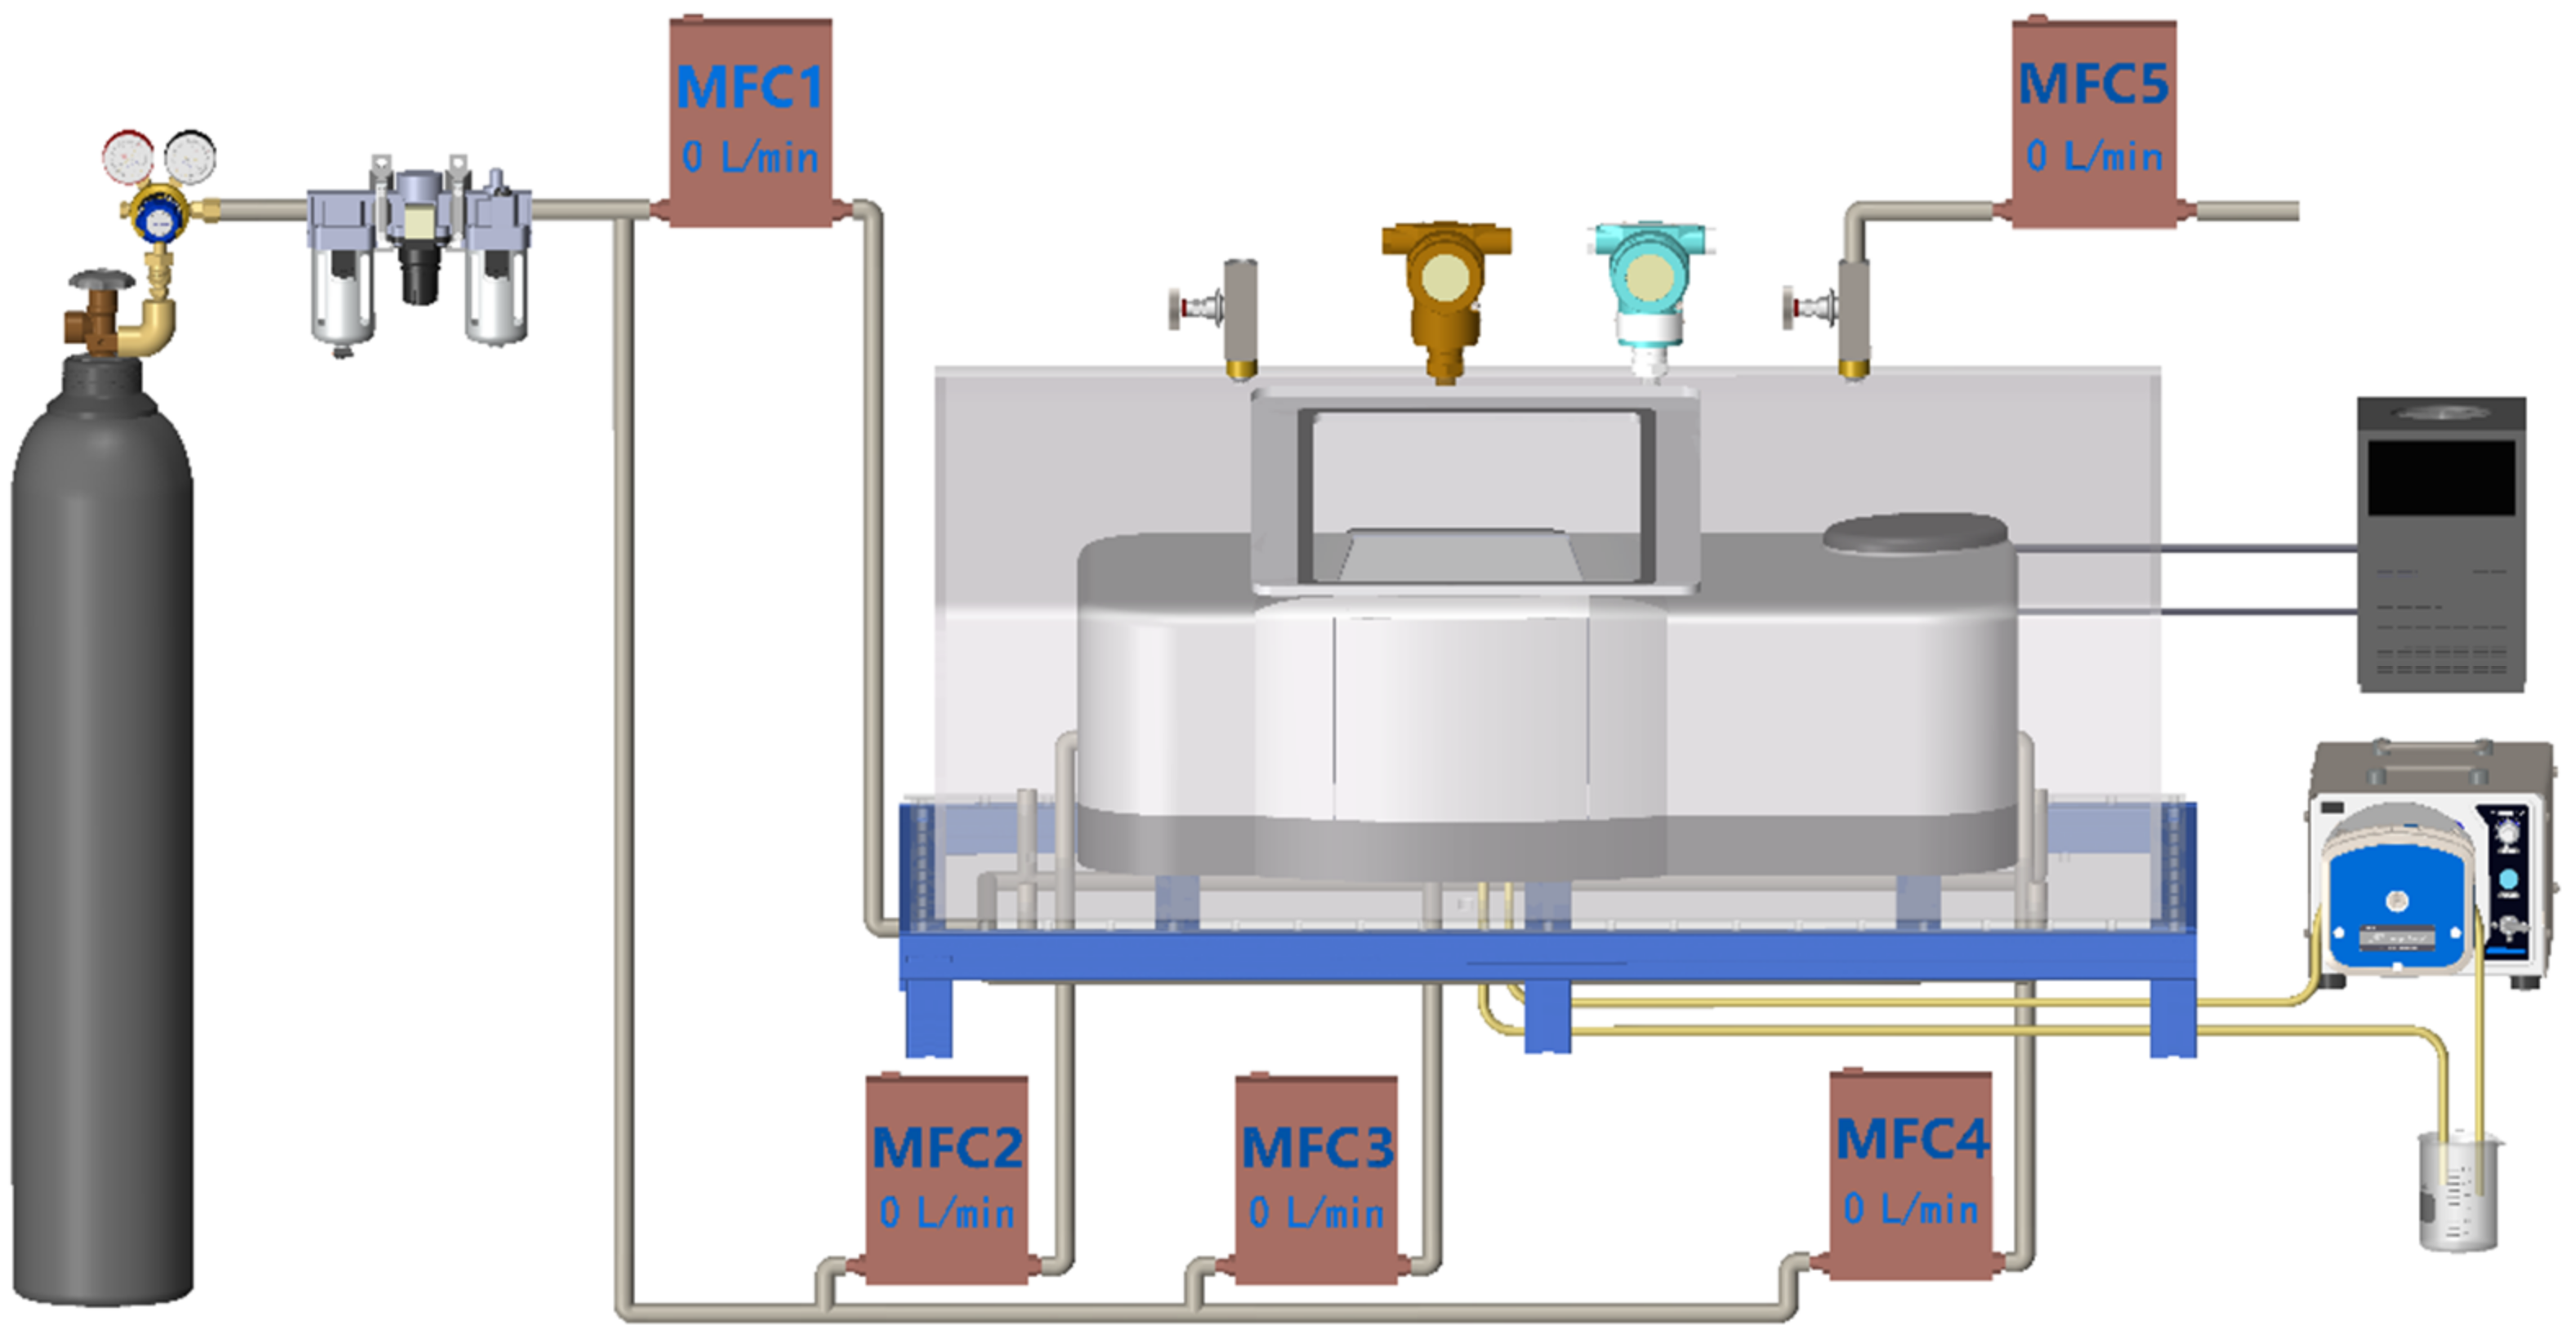
2.1. The Setting of Nitrogen Protection Device

The nitrogen protection device is built based on an ultraviolet spectrophotometer, as shown in Figure 1 [32]. In order to prevent the interference of dust and temperature and humidity changes in the environment to the operation of the instrument, and to stabilize the nitrogen atmosphere, a closed organic glass cover body (1200 mm × 850 mm × 437 mm) is installed outside the instrument to ensure the recycling of nitrogen in the instrument. The whole device is equipped with five mass flow control meters (M.F.C.) with different ranges: four hood air intakes (ø = 5 mm) are arranged at four corners of the hood bottom plate, and one mass flow controller controls the nitrogen flow into the hood (range 0~30 L/min). There is an optical system area, sample room and data -receiving area in the ultraviolet spectrophotometer. However, the distances ultraviolet rays travel in each region and the volume of each region are different. Therefore, the bottom plate of the hood body is also equipped with three -chamber air intakes, and the nitrogen flow into the optical system area, sample room and data receiving area is accurately controlled by three M.F.C. (ranges are: 0~10 L/min, 0~5 L/min and 0~5 L/min, respectively). The outlet flow is monitored by an M.F.C. (range 0~30 L/min) (All the M.F.C. models are S48-32/HMT, HORIBA Precision Instruments (Beijing) Co., Ltd., Beijing, China). Monitoring instruments such as the oxygen concentration detector and differential pressure meter and gas outlet of the device are located above the hood body.
In order to realize the automatic sample injection function under the sealed condition of the device, the sample injection tray and the flow cell of different specifications and sizes are designed, and the two ends of the flow cell are connected with inlet/outlet pipelines. During the testing process, the peristaltic pump (BT100-2J, Baoding Longer Precision Pump Co., Ltd., Baoding, China) drives the inlet pipeline forward to make the samples to be tested enter and fill the flow cell. In order to avoid bubbles in the flow cell caused by too fast injection speed, 30 r/min is selected as the injection speed in this experiment. After the detection, the peristaltic pump drives the liquid outlet pipe backward to discharge the liquid to be measured from the flow cell.
The whole device is also equipped with a chiller and a heat sink. The heat sink is installed on the back of the cover body. When the internal temperature of the cover body is too high, the cooling function can be achieved through the heat sink and the chiller.

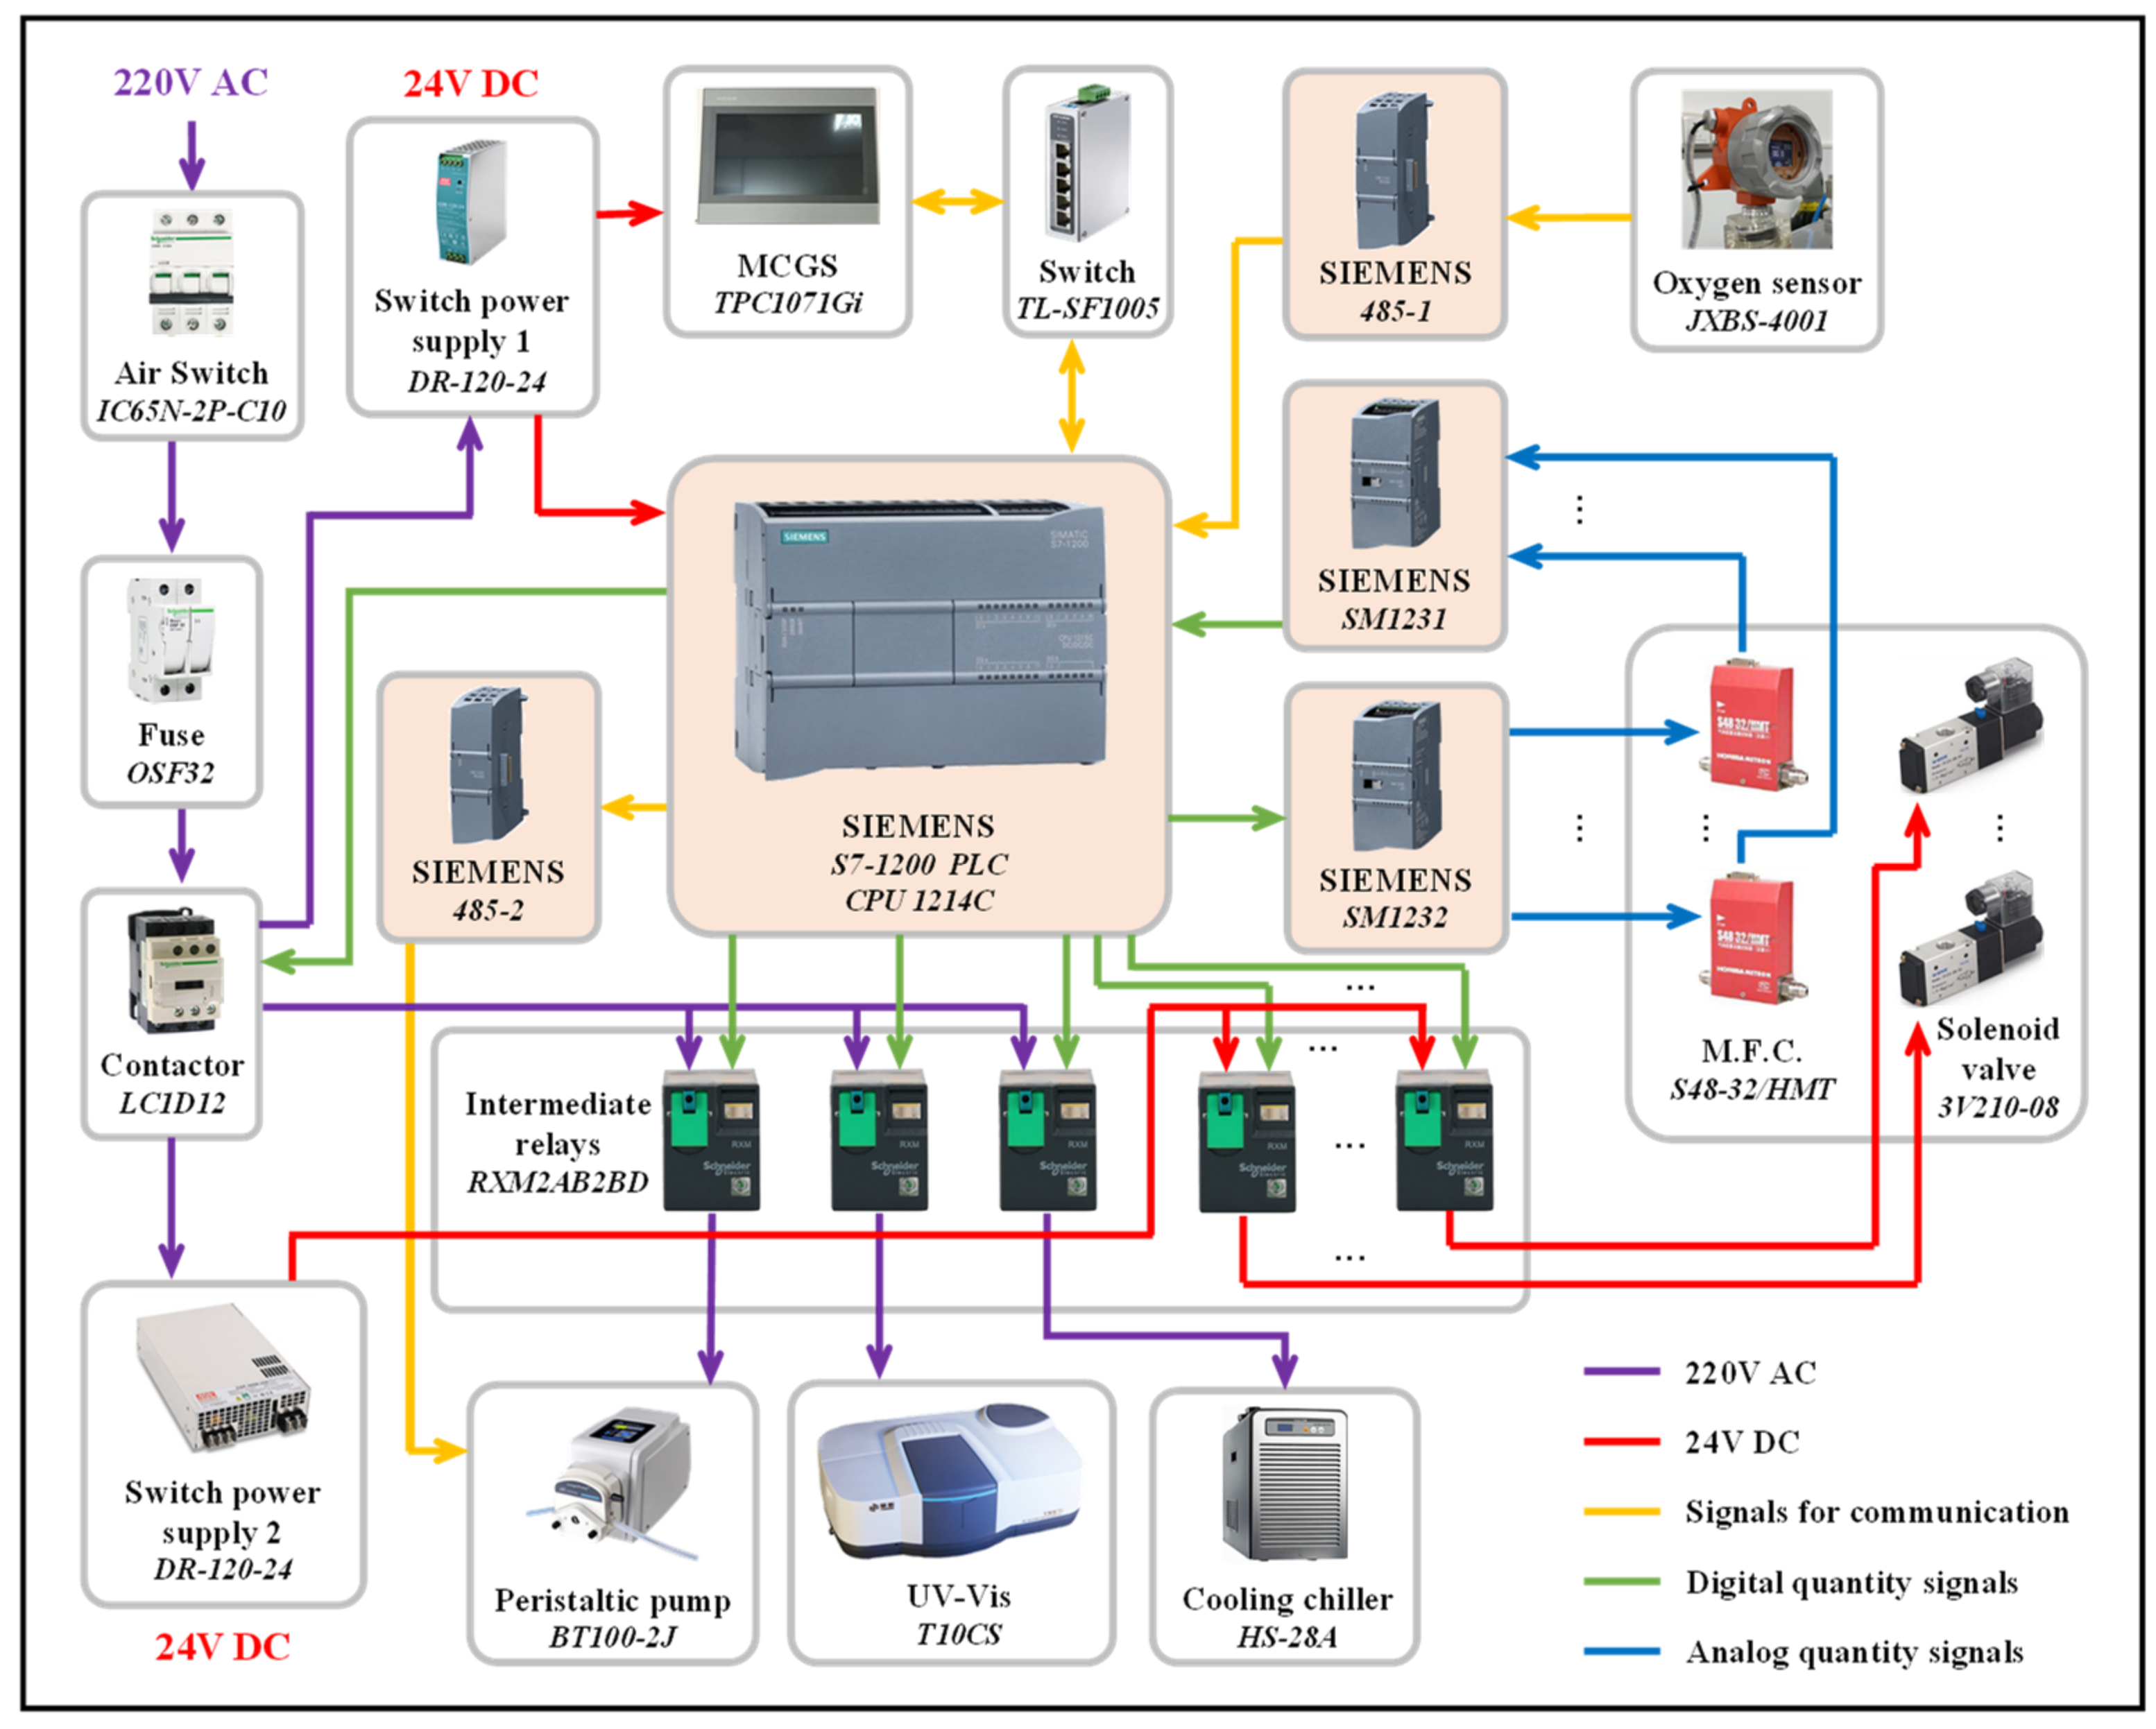
2.2. PLC Logic Control

There are still technical limitations to nitrogen flow rate control and nitrogen amount control in the unit. Specifically, the existing nitrogen flow control is completed manually, resulting in low operating efficiency and frequent misoperation of the equipment. Therefore, the equipment is supplemented by a PLC system to achieve automatic control.
Figure 2 shows the block diagram of the control system with S7-1200 PLC as the core, which controls all the controls based on PLC signal transmission to realize the automatic control of the nitrogen protection device of the spectrophotometric system.
As can be seen from Figure 2, the whole system adopts 220 V AC (purple line) and 24 V DC (red line) power supply modes. The peristaltic pump, ultraviolet spectrophotometer and chiller use 220 V AC, while PLC, upper computer, intermediate relay and gas solenoid valve use 24V DC. Each intermediate relay controls a gas solenoid valve because the whole system contains multiple intermediate relays and gas solenoid valves, shown by ellipses. At the same time, the air switch and fuse can realize power failure protection when the internal current of the system is too large.
This system takes the S7-1200PLC as the core and is equipped with an extended 485 module for reading, receiving and transmitting communication signals (shown by the yellow line in Figure 2). Among them, 485-1 is used to monitor and synchronously read the instrument data of oxygen concentration, temperature and humidity in the current oxygen concentration detector. 485-2 transmits the control signal from PLC to the peristaltic pump to realize the control of start, positive and negative rotation, stop and rotation speed. In addition, the system is equipped with an extended analog input module SM1231 and an analog output module SM1232, which are used to feedback on the current flow of the M.F.C. and control the opening and closing of its valve (shown by green and blue lines in Figure 2).

2.3. Instrumentation

According to the contents of the design scheme and the specific requirements of the actual setting, the relevant components are selected and assembled. The names, models, quantities and manufacturers of the required components are shown in Table 1. Each of the control is arranged and combined according to its installation size and space area size, and the final overall structure of the electric control cabinet is shown in Figure S1.
The whole PLC control program adopts a modular structure design, and the main program contains subroutine modules which include instrument communication, analog input, flow setting, optical path selection, peristaltic pump control, automatic sampling time control, alarm prompt, output control, etc. Figure S2 shows some program segments in the flow setting sub-module, which can complete the setting of the optimal flow value in the optical system area, sample room and data receiving area by the upper computer and transmit the setting value to the corresponding mass flow controller through the extension module of PLC. After the oxygen concentration, temperature, humidity and other parameters inside the hood meet the preset conditions, the PLC will execute relevant operations.
The MCGSPro TPC1071 Gi produced by Shenzhen Kunlun Tongtai Automation Software Technology Co., Ltd. (Shenzhen, China) is configured as the upper computer (The definition is: the computer issuing the operation command. Cortex A8 600 MHz processor, 128 MB memory). Five HMI (human–machine interface) interfaces are designed, including operation monitoring, optical path selection, parameter setting, manual control and alarm prompt. The whole system can be controlled remotely during the test, and the interface is easy to operate and readable. Supplementary Figures S3–S7 show the specific HMI interface.
Taking into account the requirements of logic design, hardware assembly and system construction, the three-layer framework is designed for placing the ultraviolet spectrophotometer, the organic glass hood, the upper computer, the peristaltic pump, the water chiller, the PLC electric control cabinet, the power supply, the test control terminal and other controls. The system renderings and physical drawings of the nitrogen protection device of the spectrophotometric system are shown in Figure S8 and Figure 3. The size of the entire system is 1500 mm × 1200 mm × 1350 mm. Meanwhile, the operation flow chart of the upper computer program of the whole device is shown in Figure S9.

3. Results and Discussion

3.1. Nitrogen Effect Verification

This section may be divided into subheadings. It should provide a concise and precise description of the experimental results, their interpretation, as well as the experimental conclusions that can be drawn.
Baseline flatness is a measure of the fluctuation noise of the environment itself when no samples are placed inside the instrument of an ultraviolet spectrophotometer [33]. The closed nitrogen atmosphere in this device is realized by controlling the numerical size of the M.F.C. in different ventilation stages by PLC. Therefore, the difference in the baseline flatness index under the two different atmospheres of air and nitrogen can be compared to verify the stability of the instrument before and after PLC control. Figure 4 shows the baseline flatness spectral curve under two atmospheres of air and nitrogen. The instrument parameters are set as follows: wavelength range of 180~360 nm, wavelength scanning interval of 1 nm, slow scanning speed, and continuous scanning six times without delay. As can be seen from Figure 4, the average baseline flatness value of the six scanning results under nitrogen atmosphere is 0.009 Abs, which attenuates by 92.11% compared with the average baseline flatness under air atmosphere (0.114 Abs). The significant difference in baseline straightness shown in Figure 4 is obviously attributed to the nitrogen atmosphere inhibiting the absorption of oxygen to UV and significantly reducing the luminosity noise of the spectral curve, which proves that the nitrogen atmosphere can effectively improve the stability of the detection system.
The commonly used optical path of 10 mm is selected to obtain the spectral absorption curves of acid groups (SO42−), metal lead ions (Pb2+) and nonmetal sulfur ions (S2−) in the ultraviolet region, respectively, under two atmospheres of air and nitrogen, as shown in Figure 5a,b,d,e,g,h. In the spectral curve, the absorbance at the spectral peak changes most significantly with the concentration. Therefore, the concentration-absorption peak intensity curve (C-A curve) is established according to the spectral curves of different concentrations of SO42−, Pb2+ and S2−, as shown in Figure 5c,f,i. Among them, SO42− the solution is diluted with concentrated sulfuric acid (98%, AR) produced by Sinopharm Chemical Reagent Co., LTD. The Pb2+ solution and S2− solution are both obtained by dissolving the PbSO4 sample (AR) and Na2S·9H2O sample (AR) produced by Shanghai Maclin Biochemical Technology Co., LTD. (Shanghai, China) in ultra-pure water.
It can be seen from Figure 5a,b,d,e,g,h that within a certain concentration range of SO42−, Pb2+ and S2−, the absorption intensity of SO42−, Pb2+ and S2− solutions under air and nitrogen atmosphere shows an increasing trend along with the increasing concentration of SO42−, Pb2+ and S2−, respectively, which is in line with Beer-Lambert law (Equations (8)–(10)) [33].
I t = I 0 · 10 A = 10 ε λ · b · C
A = l g I 0 I t = l g 1 T = l g T = ε λ · b · C
k = d A d C = ε λ b Δ C Δ C = ε λ · b
where I t is the Intensity of transmitted light. I 0 is the Intensity of incident light. A is the response value of the instrument. T is the transmittance. ε λ represents the molar absorption coefficient at a specific wavelength and is a characteristic constant. b is the thickness of the cuvette, that is, the optical path length. C is the concentration of the substance to be measured. k is the method sensitivity, i.e., the slope of the fitting curve.
By comparison with Figure 5c, it can be found that when the concentration of SO42− is the same, the absorption intensity value detected in the nitrogen atmosphere is always significantly higher than that in the air atmosphere, with the increase of the C-A curve slope of SO42− under air and nitrogen atmospheres from 1.577 to 1.833, an increase of 16.23%. Similarly, the C-A curve slope obtained by Pb2+ and S2− in the nitrogen atmosphere increases by 18.05% and 17.91%, respectively, compared with that in the air atmosphere (Figure 5f,i), which is attributed to the fact that the additional light attenuation caused by the absorption of ultraviolet light by oxygen is significantly inhibited by the nitrogen atmosphere. Therefore, under a given optical path and sample concentration, the detection process under nitrogen atmosphere shows higher sensitivity due to lower baseline noise and higher absorbance detection value compared with air atmosphere. The difference in fitted linear slope is attributed to the difference in absorbance of samples of a certain concentration under different atmospheres.
The above phenomenon should be attributed to the fact that the nitrogen atmosphere inhibits the absorption of ultraviolet by oxygen, and the reduced attenuation degree of ultraviolet leads to the absorption of ultraviolet with more light intensity by SO42−, Pb2+ and S2− solutions, which indicates that nitrogen atmosphere can provide a higher signal-to-noise ratio for substance detection and obtain more accurate detection results, and it is necessary to regulate nitrogen atmosphere environment [34,35] accurately.

3.2. Comparison of PLC Control and Manual Control

PLC plays an important role in strengthening the function of the nitrogen protection device. In order to demonstrate the superiority of PLC automatic control, the differences between PLC and manual control in detection mode, parameter setting, stability, accuracy and other aspects are compared. The detailed results are shown in Table 2.
Under manual control, the sample import, sample testing, sample recovery/waste discharge, cleaning and other steps need to be manually judged and completed, while under PLC control, it’s possible to choose either completing in steps or completing all operations continuously, which greatly shortens the sample testing cycle and also reduces the misoperation. The operation monitoring interface of the upper computer in Figure S3 distinguishes the operation buttons controlled by manual control and PLC control. At the same time, Figure 6 also shows in detail the logic flow behind the automatic sample testing under PLC control. In the early stage of the test, the detection times are set according to the sample test cycle, and all samples can be completed periodically (8 min for a single sample test and 24 min for three repeated tests) through the control of the timing/delay module inside the PLC program (sample recovery and cleaning operation after each detection are set inside the program), which demonstrates the advantages of the PLC automation control in reducing manual intervention and significantly reducing system errors introduced by human operation.
Compared to the multiple manual controls of the peristaltic pump speed, direction and M.F.C. to regulate the opening and closing of its valves, the PLC control of the parameters just needs to be set for one time in the early stages of the test and can be automatically called during the use. The parameter setting interface in Figures S4 and S5 can flexibly set parameters according to the actual needs, thus replacing the multiple repeated operations under manual control, which is the prerequisite for automation. At the same time, the parameters of each detection under PLC control remain constant, and the benchmark of multiple test parameters is consistent, which not only improves the stability of test conditions during the test but also greatly improves the accuracy compared with manual control.
Under manual control, the adjustment of the nitrogen flow rate is realized by rotating the adjusting knob of the M.F.C. and observing whether the real-time flow value on the M.F.C. flow display reaches the predetermined value. When the real-time flow value is consistent with the predetermined value, the valve of the M.F.C. reaches the specified opening and closing degree. However, the control of PLC simplifies the steps of regulating the flow display. The flow value set by the upper computer is output to the mass flow control meter through the analog output module SM1232 to directly regulates the opening and closing of the valve through the analog output module SM1232, as shown in Figure S5. At the same time, the precision of PLC control has been improved to a certain extent compared with manual control. Take the full range of 30 L/min as an example, the flow indicator MT52 (display digit: 3 1 2 , HORIBA Precision Instruments (Beijing) Co., Ltd., Beijing, China) is used for manual control to display the output, and its accuracy is 0.1 L/min. However, the accuracy of reading the mass flow control meter through SM1231 (conversion accuracy: 13 bits) can reach 0.00366 L/min. Under manual control, it is necessary to observe and monitor the current state of instruments, M.F.C. and peristaltic pump controls, while PLC is to send instructions to the controlled device and receive feedback signals, and can timely collect the current state information of the controlled device and the environmental changes. Therefore, when the detection environment or the state of the controlled components meets the specified conditions, PLC can start the next operation in time, which is more timely and significantly more accurate compared to human observation.
According to the previous research results, in order to make nitrogen quickly replace the internal air in the system in a short time, the replacement is divided into two stages: The air inside the hood is quickly replaced with a large flow rate of 30 L/min, and the air inside the optical system area, sample room and data receiving area of the ultraviolet spectrophotometer is quickly replaced with an optimal flow rate of 6, 2 and 3 L/min, respectively. At the same time, nitrogen in the detection stage is injected into the optical system area, sample room and data-receiving area at a micro-flow rate of 0.6 L/min. The operating status of each control inside the device can be clearly and accurately understood through the human-computer interaction interface. Compared with artificial monitoring under manual control, the automatic state switching of PLC has been improved to a certain extent. Figure S6 shows the operating status of the M.F.C. under different states.
In addition, the upper computer under PLC control has the function of recording, storing and backtracking the current status, alarm and other information, and can provide an inspection basis for the identification of causes of abnormal test results, such as the abnormal test results caused by high temperature without alarm, high humidity and insufficient nitrogen gas source, as shown in Figure S7, which is a major innovation and improvement compared with manual control.
To sum up, PLC control has good advantages over manual control in detection mode, parameter setting, stability, accuracy, timeliness and history traceability, which can effectively improve the stability of detection conditions and improve the accuracy of detection results.

3.3. Economic Benefits

In order to better demonstrate the application effect of PLC technology in the nitrogen protection device of the spectrophotometric system, three indicators such as the required time of regulation, the amount of nitrogen in the regulation process and the single test cycle are selected to compare the differences between manual control and PLC control. The comparison results are shown in Table 3.
According to the above analysis, there are three adjustment times in total for the 1~4 M.F.C. under manual control. In addition, either manual regulation or PLC integrated control will take 1 s to reach a stable output after each regulation of the M.F.C. Therefore, the regulation time calculated in Table 3 is the sum of the three regulation times plus the time from signal reception to the stability of the M.F.C.
In which the sum of the stability time and nitrogen amount of the M.F.C. is calculated as follows:
Stability time of M.F.C. (3 s) = time required to reach stable output (1 s) · regulation times (3 times)
Total nitrogen consumption = nitrogen flow rate at each stage ·
(regulation time at each stage + stability time of M.F.C.)
Take manual control as an example:
6 + 1 · 30 60 + 9 + 1 · 6 + 2 + 3 60 + 12 + 1 · 0.6 + 0.6 + 0.6 60 = 5.72   L / min
Similarly, PLC integrated control is calculated in the same way.
As can be seen from Table 3, compared with manual regulation, the regulation time of PLC automatic control is reduced from 30 s to 6 s, reducing the control time by 80%. On the one hand, the sum of nitrogen consumption during the regulation period is also reduced from 5.72 L/min to 1.43 L/min, saving 75% nitrogen consumption, with obvious effects of nitrogen saving. On the other hand, nitrogen consumption caused by inaccurate operation during manual control is reduced. The automatic control of PLC not only reduces the degree of fatigue in the repetitive manual operation, decreases the test error introduced due to human reasons during the regulation period, but also reduces the nitrogen consumption during the regulation period and saves the detection cost.
A single test cycle represents the time it takes for the operator to turn on the instrument until the entire sample test is completed. The test counts the single test cycle that measures the same batch of samples under manual control and PLC control. According to the daily working time of the instrument of 12 h, the single test cycle under manual control takes about 2.8~3.2 h, and four cycles of sample detection can be completed every day. Regardless of the interval time between operators, the single test cycle can be shortened to 1.8~2.0 h after PLC control, and the instrument allows the completion of 6 cycles of sample detection every day. As a result, the efficiency of the instrument is improved.
Combined with the above analysis, the comparison results of the four indexes, including time required for regulation under manual control and PLC control, nitrogen amount in the regulation process, single test cycle and instrument use efficiency, are recorded in Figure 7. As can be seen from Figure 7, compared with manual control, PLC control shows good advantages and better reflects the PLC control of fast response time, good stability, and high -reliability advantages, which can provide a good detection environment for the accurate determination of target substances, reduce testing costs, and improve economic benefits. It can be predicted that with the continuous development of automation degree in modern society, automatic control based on PLC will play a greater role in more fields in the future social development.
The advantages of the PLC-based nitrogen protection device of the spectrophotometric system compared with manual control in stability, accuracy and economic benefits are analyzed above. In addition, the device can also be expanded from the following points:
(1)
Because S7-1200 PLC itself has a certain expansion function, it can reasonably add other controls according to the requirements of the zinc hydrometallurgy industrial system, such as an automatic sampling device, long-distance transmission and distribution system, acid mist sensor and others, in order to meet the actual working conditions of the detection; namely, the device has high flexibility, strong scalability.
(2)
The light source applied in this device is not limited to the combination of a deuterium lamp and tungsten lamp inside the instrument and can be replaced in accordance with the band range of the target substance to realize the qualitative and quantitative analysis of different target substances in different band regions. Taking a zinc hydrometallurgy electrolysis system containing a certain amount of Mn2+, for example, the characteristic wavelength of Mn2+ is located at 401 nm in the visible region. In order to quantitatively study the influence degree of Mn2+ concentration on the reaction process, the quantitative relationship between the absorbance and concentration of Mn2+ can be directly established after the replacement of 401 nm single point light source, which simplifies the operation procedure and shortens the measurement time, timely feeding back the change rule of manganese element in the electrolyte, and provides a basis for accurately regulating the mass balance in the electrolyte.
(3)
The automatic control terminal of zinc hydrometallurgy is established based on PLC to feed back the real-time dynamic monitoring results of the target substances. According to the results, the dosing sequence and amount of the materials are reasonably controlled, thus truly controlling the ion network of the whole production process.
(4)
Currently, the nitrogen protection device of the spectrophotometric system established in this paper is being used in the laboratory. It can accurately determine target substances such as SO42−, S2−, Pb2+, F and Cl whose characteristic absorption wavelength is located in the ultraviolet region. Since the characteristic absorption wavelengths of many target substances in the electrolysis industry are located in the ultraviolet region, they are susceptible to oxygen interference in the air. Therefore, the establishment of a nitrogen protection device in the spectrophotometric system can provide research and development ideas for online monitors, promote the application of nitrogen protection devices in online monitors, provide reliable technical support for the application of online monitors in more process industries, and facilitate the sustainable development and cleaner production of process industries.
(5)
Due to various abnormal conditions that may occur during actual use, such as the peristaltic pump, water chiller and other actuators failing to respond to the instructions issued by PLC, the system expansion of the whole device can be carried out to increase the monitoring of the operating status of the actuator, and timely respond to the abnormal conditions, so as to ensure the normal operation of the whole device.
To sum up, the research in this paper is not the end point. The multi-disciplinary crossing is the trend of rapid development of modern society, which is also the key and difficult point of continuous breakthrough in the future scientific research field.

4. Conclusions

In order to quickly obtain the characteristic spectral information of the target substance in real time in the process of zinc hydrometallurgy, the paper establishes an ultraviolet spectrophotometer equipped with a nitrogen protection device and PLC system. The PLC system includes PLC, upper computer, electric control cabinet, peristaltic pump, oxygen concentration detector, M.F.C., solenoid valve and other controls. Compared with air, the baseline flatness under the nitrogen atmosphere is reduced from 0.114 Abs to 0.009 Abs (attenuation of 92.11%), indicating that the nitrogen atmosphere can effectively improve the stability of instrument operation. The sensitivity of SO42−, Pb2+and S2− detection results is better than that of air atmosphere, with the sensitivity increasing by 16.23%, 18.05% and 17.91%, respectively. However, the ultraviolet spectrophotometer based on manual control still faces the issues of operating accuracy and economic benefit in the application of real-time substance monitoring. Compared with manual control, the PLC system realizes continuous sample testing through logic programming control of electric control accessories, improves the flexibility of parameter setting, stability of detection conditions, the accuracy of test results and timeliness of status feedback, and especially provides the function of historical information backtracking, demonstrating significant advantages of automatic control. At the same time, the regulation time and nitrogen consumption in the regulation process are reduced by 80% and 75%, respectively, which improves the efficiency of the instrument (from 4 cycles/day to 6 cycles/day) and can effectively reduce the test cost and reflect the advantages of fast response time, good stability and high reliability of automatic control. In addition, some development potential and application scenarios of the device are prospected. Therefore, this study provides theoretical guidance and a case reference for the application of a UV spectrophotometer in the automatic direct measurement of substances in zinc hydrometallurgy and promotes the sustainable development and cleaner production of the process industry.

Supplementary Materials

The following supporting information can be downloaded at: https://www.mdpi.com/article/10.3390/pr11030672/s1, Figure S1: Internal physical picture of electric control cabinet; Figure S2: Current test environment detection procedure. Figure S3: Operation monitoring interface. Figure S4: Optical path selection interface. Figure S5: Parameter setting interface. Figure S6: Manual control interface under different conditions, including (a) nitrogen, replaces the air inside the hood at a high flow rate of 30 L/min; (b) Nitrogen displaces the air inside the light source system area, sample room and data receiving area of the instrument at the optimal flow rate of 6, 2 and 3 L/min; (c) At the detection stage, the nitrogen flow is 0.6 L/min. Figure S7: Alarm prompt interface. Figure S8: The system rendering of the device. Figure S9: Upper computer program operation flow chart.

Author Contributions

Conceptualization, X.Z.; methodology, X.Z. and N.D.; writing–original draft, X.Z.; data curation, X.Z.; visualization, X.Z.; supervision, N.D., L.J. and F.X.; funding acquisition, N.D.; project administration, N.D. and L.J.; writing–review and editing, N.D.; resources, L.J. and F.X.; investigation, X.Z., Z.Y., W.C., W.L. and Y.Q. All authors have read and agreed to the published version of the manuscript.

Funding

This work is supported by the Fundamental Research Funds for the Central Universities, Tongji University (No. 22120220166) and National Major Independent Project of Water Pollution Control and Treatment of the “13th Five-Year Plan”: Whole Process Control Technology Integration and Engineering Demonstration of Water Pollution in Key Industries (No. 2017ZX07402004).

Data Availability Statement

The data presented in this study are available on request from the corresponding authors. The data are not publicly available because of continuous research.

Acknowledgments

This article will be supported by Anhui University of Science and Technology and Tongji University.

Conflicts of Interest

The authors declare no conflict of interest.

References

  1. Xue, Y.; Hao, X.; Liu, X.; Zhang, N. Recovery of Zinc and Iron from Steel Mill Dust—An Overview of Available Technologies. Materials 2022, 15, 4127. [Google Scholar] [CrossRef]
  2. Terrones-Saeta, J.M.; Suárez-Macías, J.; Moreno-López, E.R.; Corpas-Iglesias, F.A. Leaching of Zinc for Subsequent Recovery by Hydrometallurgical Techniques from Electric Arc Furnace Dusts and Utilisation of the Leaching Process Residues for Ceramic Materials for Construction Purposes. Metals 2021, 11, 1603. [Google Scholar] [CrossRef]
  3. Ye, W.; Xu, F.; Jiang, L.; Duan, N.; Li, J.; Zhang, F.; Zhang, G.; Chen, L. A novel functional lead-based anode for efficient lead dissolution inhibition and slime generation reduction in zinc electrowinning. J. Clean. Prod. 2021, 284, 124767. [Google Scholar] [CrossRef]
  4. Luo, J.; Duan, N.; Xu, F.; Jiang, L.; Zhang, C.; Ye, W. System-level analysis of the generation and distribution for Pb, Cu, and Ag in the process network of zinc hydrometallurgy: Implications for sustainability. J. Clean. Prod. 2019, 234, 755–766. [Google Scholar] [CrossRef]
  5. Qin, S.; Jiang, K.; Wang, H.; Zhang, B.; Wang, Y.; Zhang, X. Research on Behavior of Iron in the Zinc Sulfide Pressure Leaching Process. Minerals 2020, 10, 224. [Google Scholar] [CrossRef] [Green Version]
  6. Rybarczyk, P.; Kawalec-Pietrenko, B. Simultaneous Removal of Al, Cu and Zn Ions from Aqueous Solutions Using Ion and Precipitate Flotation Methods. Processes 2021, 9, 1769. [Google Scholar] [CrossRef]
  7. Ye, W.; Xu, F.; Jiang, L.; Duan, N.; Li, J.; Ma, Z.; Zhang, F.; Chen, L. Lead release kinetics and film transformation of Pb-MnO2 pre-coated anode in long-term zinc electrowinning. J. Hazard. Mater. 2021, 408, 124931. [Google Scholar] [CrossRef]
  8. Priyadarshini, J.; Elangovan, M.; Mahdal, M.; Jayasudha, M. Machine-Learning-Assisted Prediction of Maximum Metal Recovery from Spent Zinc—Manganese Batteries. Processes 2022, 10, 1034. [Google Scholar] [CrossRef]
  9. Ma, Z.; Duan, L.; Jiang, J.; Deng, J.; Xu, F.; Jiang, L.; Li, J.; Wang, G.; Huang, X.; Ye, W.; et al. Characteristics and threats of particulate matter from zinc electrolysis manufacturing facilities. J. Clean. Prod. 2020, 259, 120874. [Google Scholar] [CrossRef]
  10. Duan, N.; Jiang, L.; Xu, F.; Zhang, G. A non-contact original-state online real-time monitoring method for complex liquids in industrial processes. Engineering 2018, 4, 392–397. [Google Scholar] [CrossRef]
  11. Lee, J.; Park, Y.-S.; Lee, H.-J.; Koo, Y.E. Microwave-assisted digestion method using diluted nitric acid and hydrogen peroxide for the determination of major and minor elements in milk samples by ICP-OES and ICP-MS. Food Chem. 2022, 373, 131483. [Google Scholar] [CrossRef]
  12. Ju, T.; Han, S.; Meng, Y.; Song, M.; Jiang, J. Occurrences and patterns of major elements in coal fly ash under multi-acid system during microwave digestion processes. J. Clean. Prod. 2022, 359, 131950. [Google Scholar] [CrossRef]
  13. Yang, R.; Tian, J.; Liu, Y.; Zhu, L.; Sun, J.; Meng, D.; Wang, Z.; Wang, C.; Zhou, Z.; Chen, L. Interaction mechanism of ferritin protein with chlorogenic acid and iron ion: The structure, iron redox, and polymerization evaluation. Food Chem. 2021, 349, 129144. [Google Scholar] [CrossRef]
  14. Singh, K.; Kumar, A. Kinetics of complex formation of Fe(III) with caffeic acid: Experimental and theoretical study. Spectrochim. Acta Part A. 2019, 211, 148–153. [Google Scholar] [CrossRef]
  15. Singh, K.; Kumar, A. Kinetics of complex formation of Fe(III) with syringic acid: Experimental and theoretical study. Food Chem. 2018, 265, 96–100. [Google Scholar] [CrossRef]
  16. Du, J.; Zhu, H.; Li, Y.; Zhang, T.; Yang, C. Simultaneous determination of trace Cu2+, Cd2+, Ni2+ and Co2+ in zinc electrolytes by oscillopolarographic second derivative waves. Trans. Nonferrous Met. Soc. China 2018, 28, 2592–2598. [Google Scholar] [CrossRef]
  17. Cheng, W.; Zhang, X.; Duan, N.; Jiang, L.; Xu, Y.; Chen, Y.; Liu, Y.; Fan, P. Direct-determination of high-concentration sulfate by serial differential spectrophotometry with multiple optical pathlengths. Sci. Total Environ. 2022, 811, 152121. [Google Scholar] [CrossRef]
  18. Ai, X.; Zhang, Z. Quantitative measurement model for sulfate in the temperature range of 298.15–343.15K based on vacuum ultraviolet absorption spectroscopy. Vacuum 2022, 200, 111035. [Google Scholar] [CrossRef]
  19. Szczuka, A.; Berglund-Brown, J.P.; Macdonald, J.A.; Mitch, W.A. Control of sulfides and coliphage MS2 using hydrogen peroxide and UV disinfection for non-potable reuse of pilot-scale anaerobic membrane bioreactor effluent. Water Res. X. 2021, 11, 100097. [Google Scholar] [CrossRef]
  20. Krish, A.; Streicher, J.W.; Hanson, R.K. Ultraviolet absorption cross-section measurements of shock-heated O2 from 2000~8400 K using a tunable laser. J. Quant. Spectrosc. Radiat. Transf. 2020, 247, 106959. [Google Scholar] [CrossRef]
  21. Wang, L.; Zhang, Y.; Zhou, X.; Zhang, Z. Sensitive dual sensing system for oxygen and pressure based on deep ultraviolet absorption spectroscopy. Sens. Actuators B. 2019, 281, 514–519. [Google Scholar] [CrossRef]
  22. Wang, M.; Zheng, X. Introduction to Atmospheric Chemistry; China Meteorological Press: Beijing, China, 2005. [Google Scholar]
  23. Ai, X. Ultraviolet Absorption Spectroscopy Properties of Inorganic Anions Such as Sulphate and Nitrate; Harbin Institute of Technology: Harbin, China, 2019. [Google Scholar]
  24. Pongswatd, S.; Smerpitak, K.; Asadi, F.; Thepmanee, T. Design of PLC-based system for linearity output voltage of AC–DC converter. Energy Rep. 2022, 8, 972–978. [Google Scholar] [CrossRef]
  25. Ting, C.; Lai, C.; Huang, C. Developing the dual system of wind chiller integrated with wind generator. Appl. Energy 2011, 88, 741–747. [Google Scholar] [CrossRef]
  26. Kazagic, A.; Smajevic, I. Experimental investigation of ash behavior and emissions during combustion of Bosnian coal and biomass. Energy 2007, 32, 2006–2016. [Google Scholar] [CrossRef]
  27. Aller, F.; Blázquez, L.F.; Miguel, L.J. Online monitoring of an industrial semi-batch vinyl acetate polymerization reaction by programmable logic controllers. IFAC Proc. Vol. 2014, 47, 1290–1295. [Google Scholar] [CrossRef]
  28. Anusha, R.; Chandrashekar Murthy, B.N. Automatic trimming machine for valve stem seal. Mater. Today Proc. 2021, 46, 4993–5000. [Google Scholar] [CrossRef]
  29. Aziz, N.; Tanoli, S.A.K.; Nawaz, F. A programmable logic controller based remote pipeline monitoring system. Process Saf. Environ. Prot. 2021, 149, 894–904. [Google Scholar] [CrossRef]
  30. Manesis, S.A.; Sapidis, D.J.; King, R.E. Intelligent control of wastewater treatment plants. Artif. Intell. Eng. 1998, 12, 275–281. [Google Scholar] [CrossRef]
  31. Güler, H.; Ata, F. Design and Implementation of Training Mechanical Ventilator Set for Clinicians and Students. Proc.—Soc. Behav. Sci. 2013, 83, 493–496. [Google Scholar] [CrossRef] [Green Version]
  32. Zhang, X.; Duan, N.; Jiang, L.; Cheng, W.; Yu, Z.; Li, W.; Zhu, G.; Xu, Y. Study on stability and sensitivity of deep ultraviolet spectrophotometry detection system. Spectrosc. Spectral Anal. 2022, 42, 3802–3810. [Google Scholar]
  33. University Wuhan. Analytical Chemistry Volume II, 5th ed.; Higher Education Press: Beijing, China, 2007. [Google Scholar]
  34. Chen, G.; Huang, X.; Liu, W.; Zheng, Z.; Wang, Z. Ultraviolet-Visible Spectrophotometry; Atomic Energy Press: Beijing, China, 1983; Volume I. [Google Scholar]
  35. Zhou, X.; Yu, J.; Wang, L.; Gao, Q.; Zhang, Z. Sensitive detection of oxygen using a diffused integrating cavity as a gas absorption cell. Sens. Actuators B 2017, 241, 1076–1081. [Google Scholar] [CrossRef]
Figure 1. Manual operation diagram of the nitrogen protection device of the spectrophotometric system.
Processes 11 00672 g001
Figure 2. Block diagram of PLC control system.
Processes 11 00672 g002
Figure 3. Spectrophotometric system nitrogen protection automation device physical picture.
Processes 11 00672 g003
Figure 4. Results of 6 baseline straightness tests under (a) air and nitrogen (b) atmospheres.
Processes 11 00672 g004
Figure 5. Spectral curves and C−A fitting curves of SO42−, Pb2+ and S2− in air and nitrogen atmosphere at b = 10 mm, where (a,b) are spectral curves of SO42− in air and nitrogen atmosphere, (c) C−A fitting curves of SO42−, (d,e) are spectral curves of Pb2+ in air and nitrogen atmosphere, (f) C−A fitting curves of Pb2+, (g,h) are spectral curves of S2− in air and nitrogen atmosphere, (i) C−A fitting curves of S2−.
Processes 11 00672 g005
Figure 6. PLC logic control flow.
Processes 11 00672 g006
Figure 7. Effect of PLC control vs. manual control.4 Exploitable Potential.
Processes 11 00672 g007
Table 1. A detailed list of the internal control components in the electronic control cabinet.
NameTypeQuantityUnitManufacturer
PLCS7-12001PieceSIEMENS AG of Germany, Berlin, Germany
485 Communication module 6ES7-241-1CH32-0XB02PieceSIEMENS AG of Germany, Berlin, Germany
Analog input module SM12311PieceSIEMENS AG of Germany, Berlin, Germany
Analog output moduleSM12321PieceSIEMENS AG of Germany, Berlin, Germany
SwitchboardTL-SF10051SetTP-LINK Technology Co., Ltd., Shenzhen, China
Air switchIC65N-2P-C101Set Schneider Electric, Rue, France
FuseOSF32-2P-10A1SetSchneider Electric, Rue, France
ContactorLC1D121Set Schneider Electric, Rue, France
Intermediate relayRXM2AB2BDSomeSetSchneider Electric, Rue, France
Wiring terminal-SomeSetPhoenix Contact Electric Group, Bloomberg, Germany
Gas solenoid valve3V210-085SetAirtac International Group, Taipei, Taiwan
Gas M.F.C.S48-32/HMT5SetHORIBA Precision Instruments (Beijing) Co., Ltd., Beijing, China
Switching power supplyDR-100-121SetMEAN WELL (Guangzhou) Electronics Co., Ltd., Guangzhou, China
Switching power supplyDR-120-241SetMEAN WELL (Guangzhou) Electronics Co., Ltd., Guangzhou, China
Table 2. Comparison of manual control and PLC control.
Comparison ItemsManual ControlPLC Control
Detection methodsSingle-step operationSingle-step operation/Continuous operation
Parameter setting flexibilityMultiple repetitive settings during detectionOne-time set-up
Stability of detection conditionsVulnerable to environmental changesStable
Accuracy of detection resultsLarge influence of human factorsPrecise
Timeliness of status changesRelying on human judgmentTimely feedback
Historical tracing possibilitiesNot traceableTraceable
Table 3. Manual regulation vs. Integrated PLC control.
Comparison ItemsManual RegulationIntegrated PLC Control
Large flow adjustment/s61
Optimal flow adjustment/s91
Micro flow adjustment/s121
Stability time of M.F.C./s33
Sum of regulation time/s306
Sum of nitrogen amount/L·min−15.721.43
Disclaimer/Publisher’s Note: The statements, opinions and data contained in all publications are solely those of the individual author(s) and contributor(s) and not of MDPI and/or the editor(s). MDPI and/or the editor(s) disclaim responsibility for any injury to people or property resulting from any ideas, methods, instructions or products referred to in the content.

