

Mobile Energy Storage System Scheduling Strategy for Improving the Resilience of Distribution Networks under Ice Disasters
Abstract
:1. Introduction
- (1)
- Currently, there is little research on power system recovery after ice disasters that takes into account the participation of MESS. On the other hand, the assessment of the consequences of natural disasters is often carried out after the occurrence of natural disasters, and the assessment and determination of scheduling strategies may take several hours, which will further expand the range of fault impact and increase economic losses. In this paper, a MESS scheduling strategy before an ice disaster is proposed. By combining meteorological information and fault scenarios using Monte Carlo methods, it can accurately depict the impact of ice disasters on the power system and avoid conservative decision-making.
- (2)
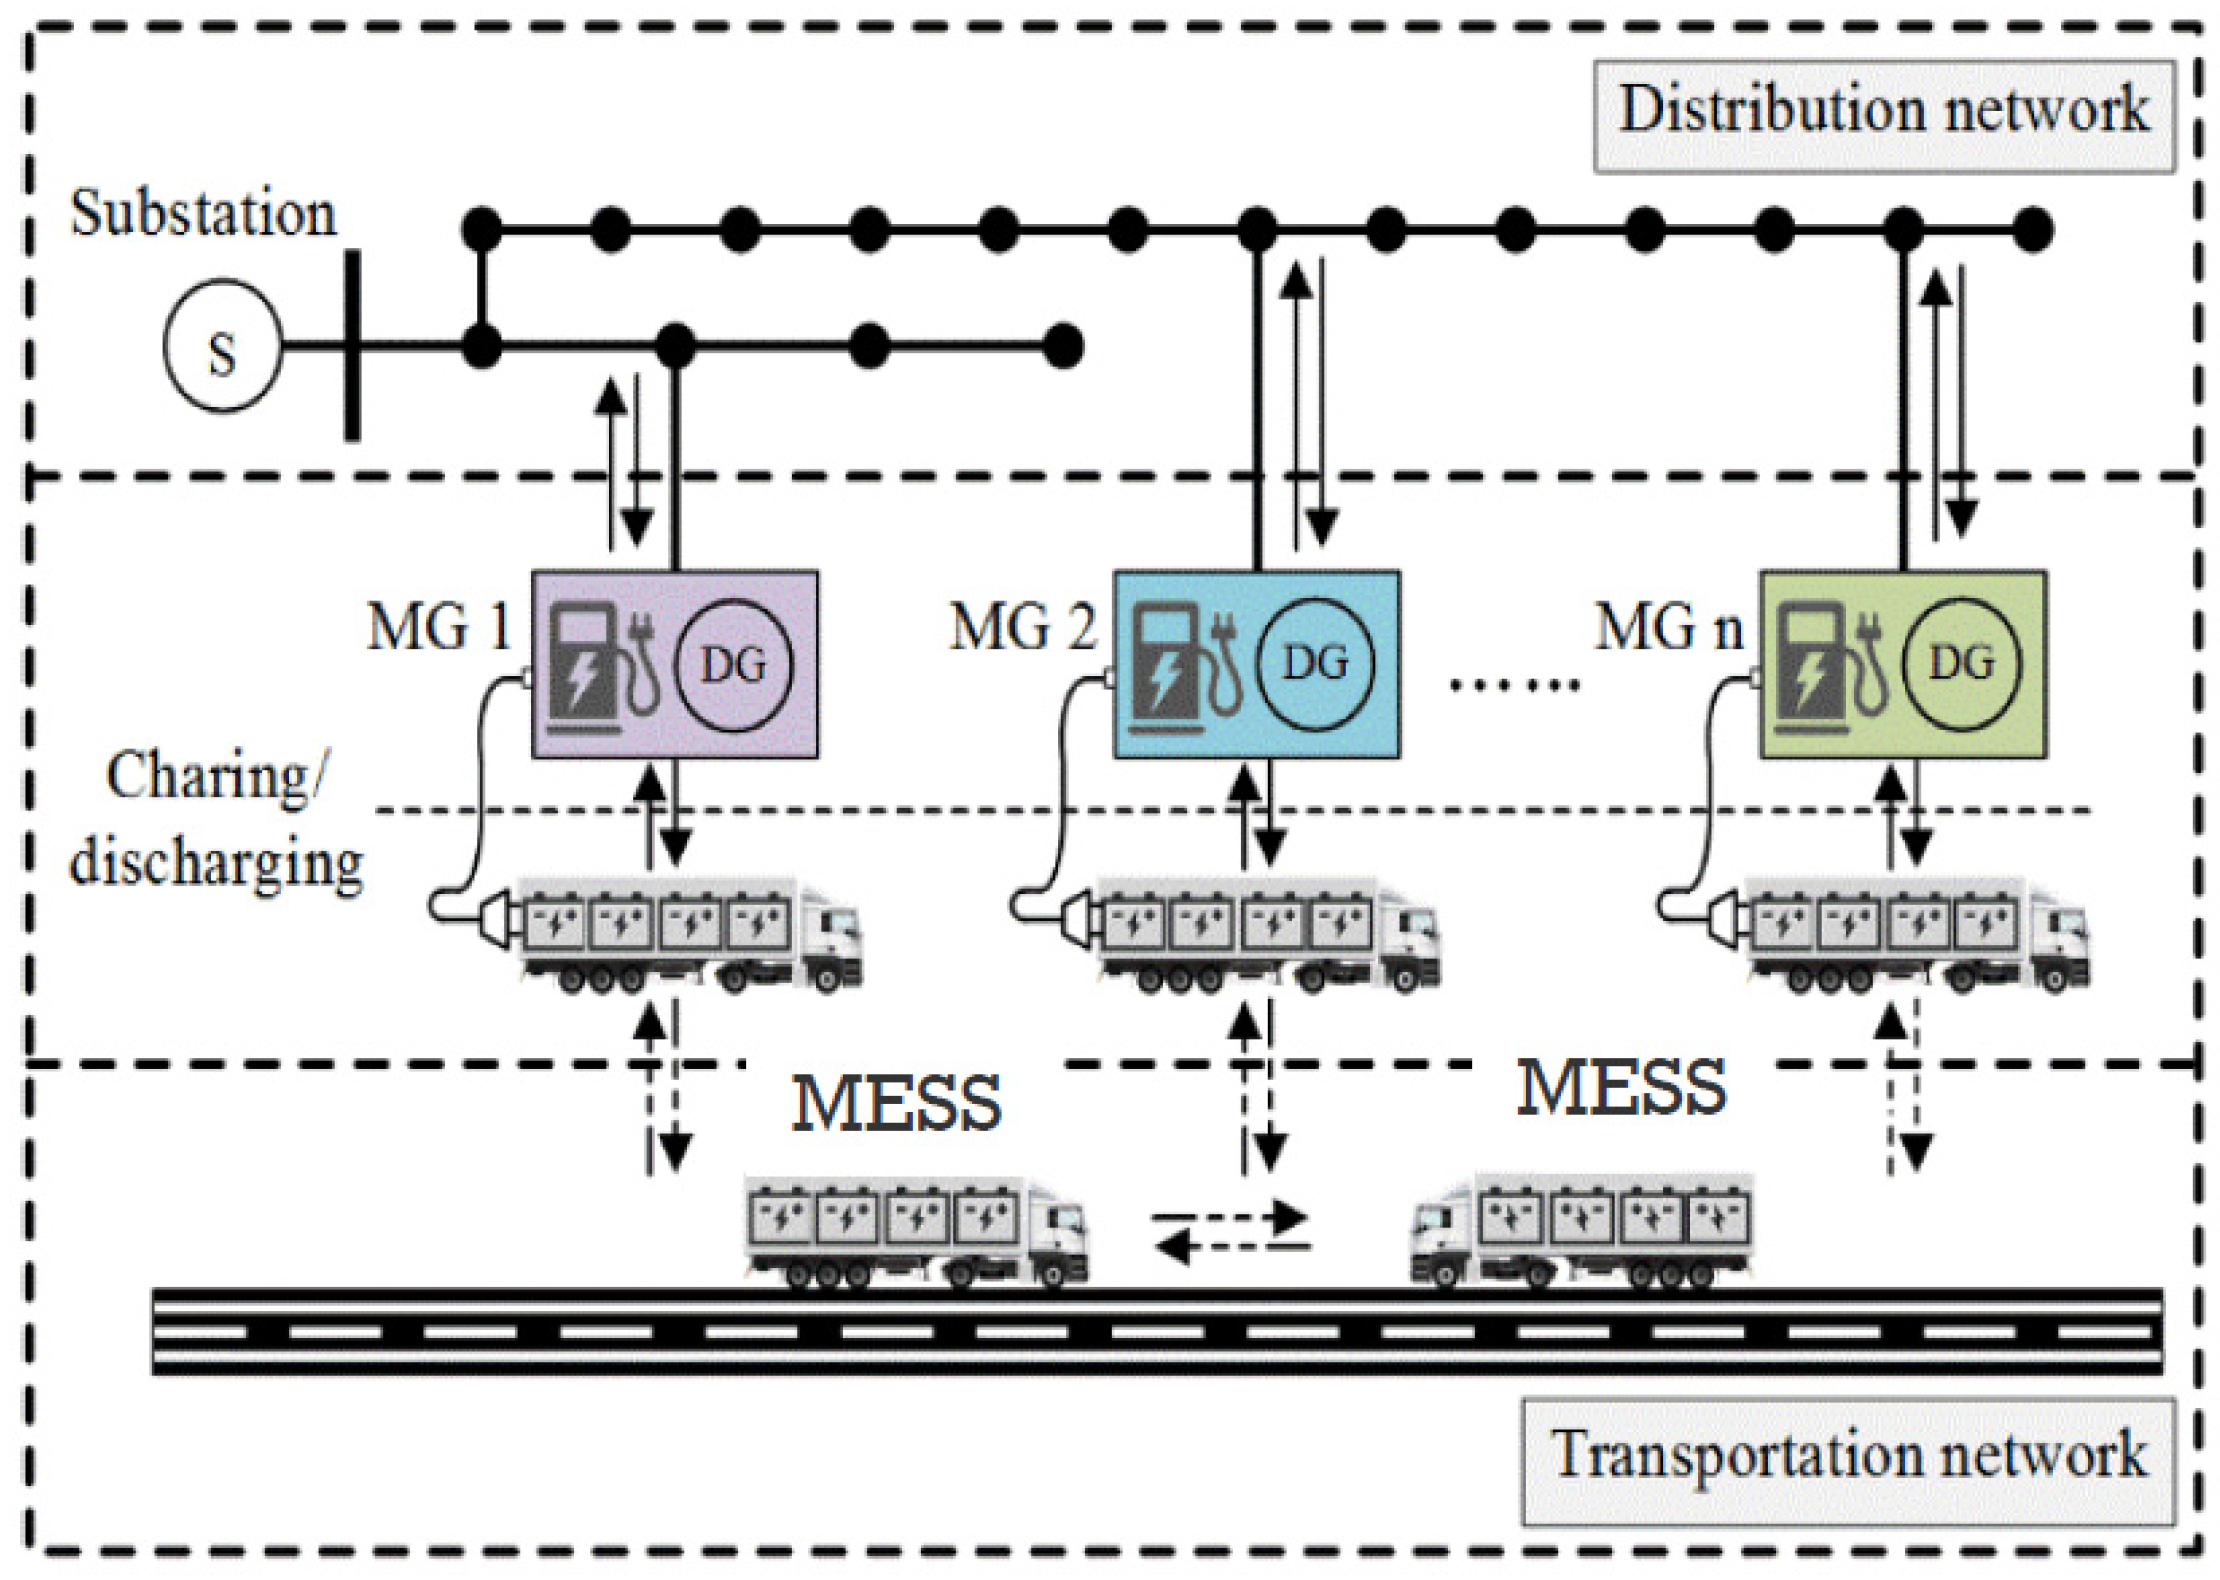
- At present, the transportation network and power energy network are closely coupled, and the damage and congestion of transportation networks caused by ice disasters may affect the timely delivery of MESS, which has often been ignored in previous studies. Therefore, the optimal path selection problem is also a complex but necessary consideration factor in MESS scheduling. The strategy proposed in this paper is a two-stage optimization problem. In the second stage, we fully consider the traffic situation, which can provide a fast-reaching strategy.
2. Modeling of Transmission Line Fault Rate under Ice Disaster
2.1. Ice Load
2.2. Wind Load
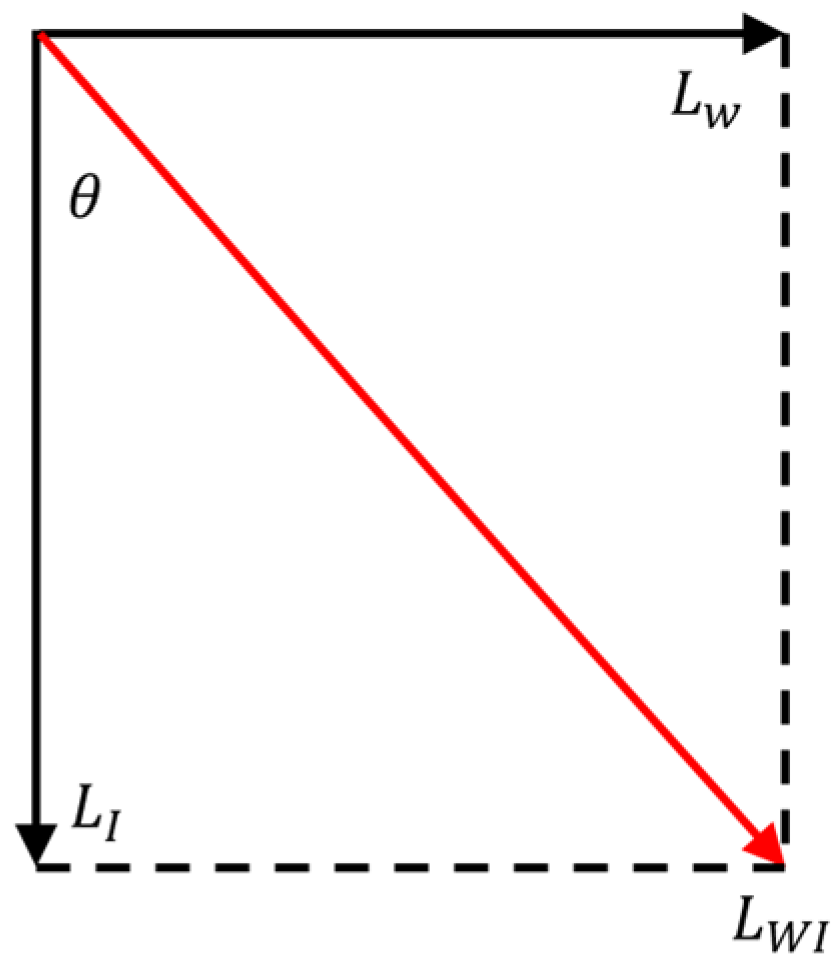
2.3. Ice-Wind Load
3. A Two-Stage MESS Scheduling Strategy Considering Transportation-Electricity Coupling Networks
3.1. Stage-1: Distribution Network Level
3.2. Stage-2: Transportation Network Level
4. Case Study
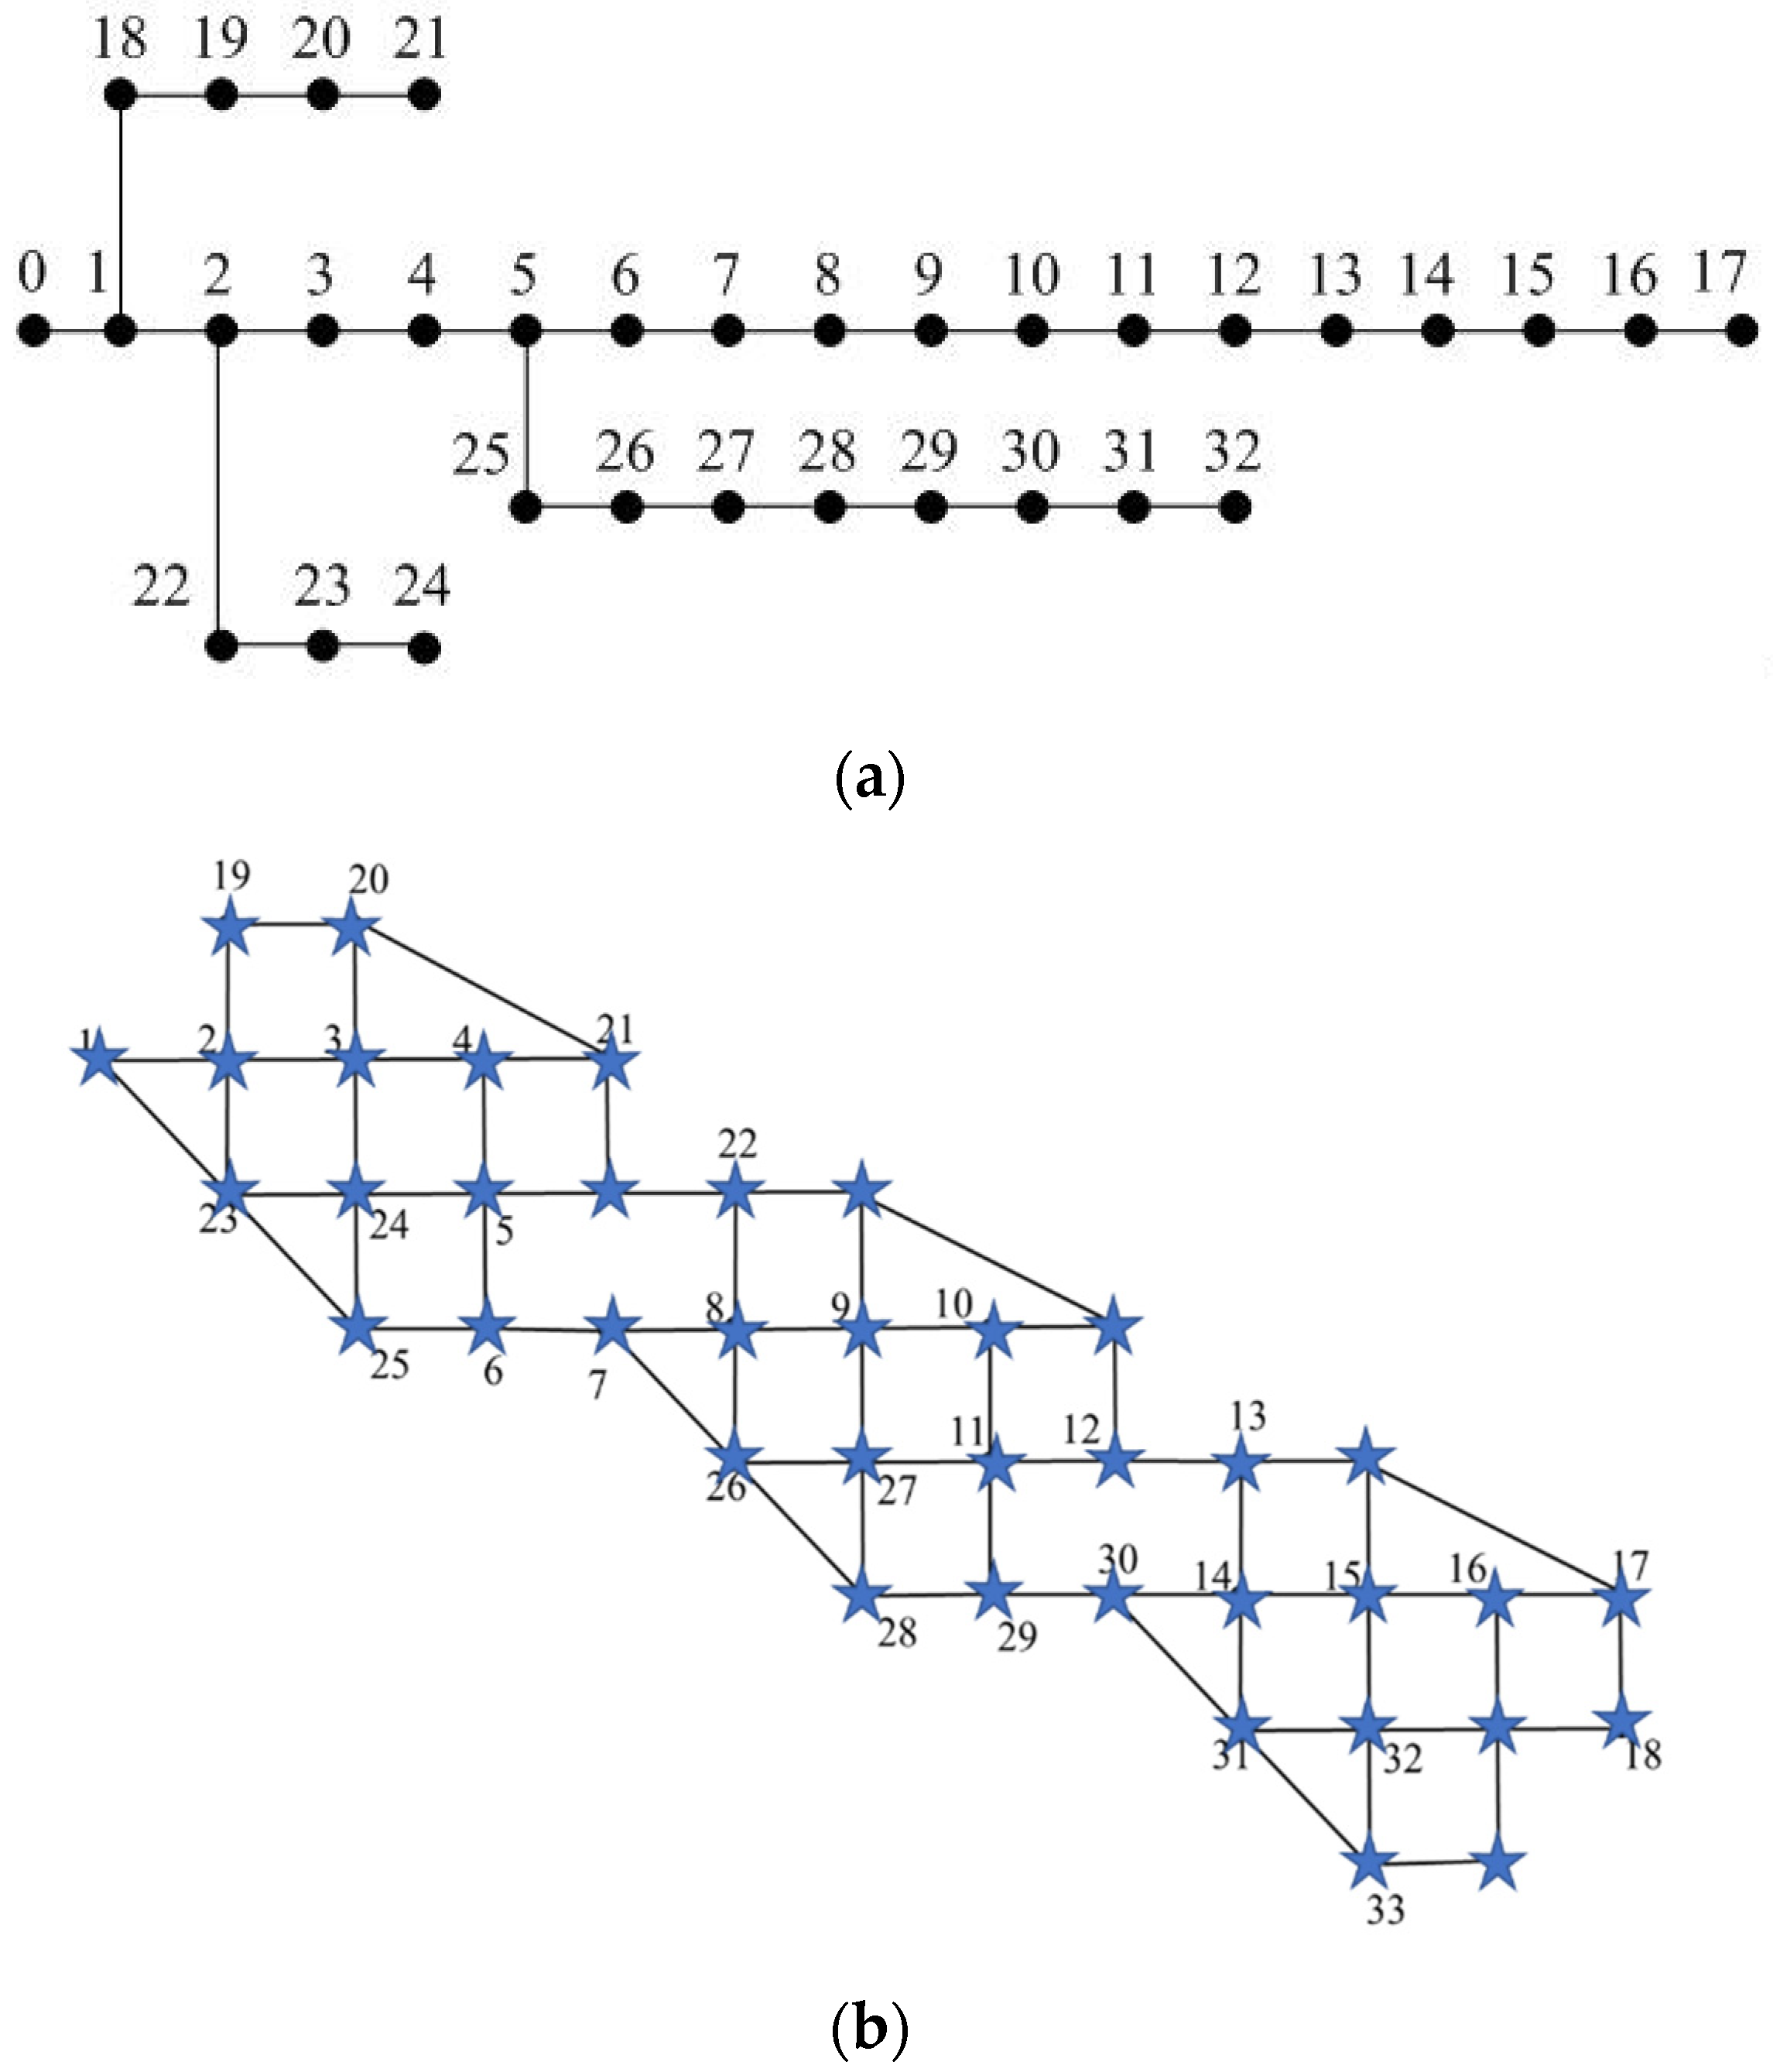
4.1. The Introduction of Test System
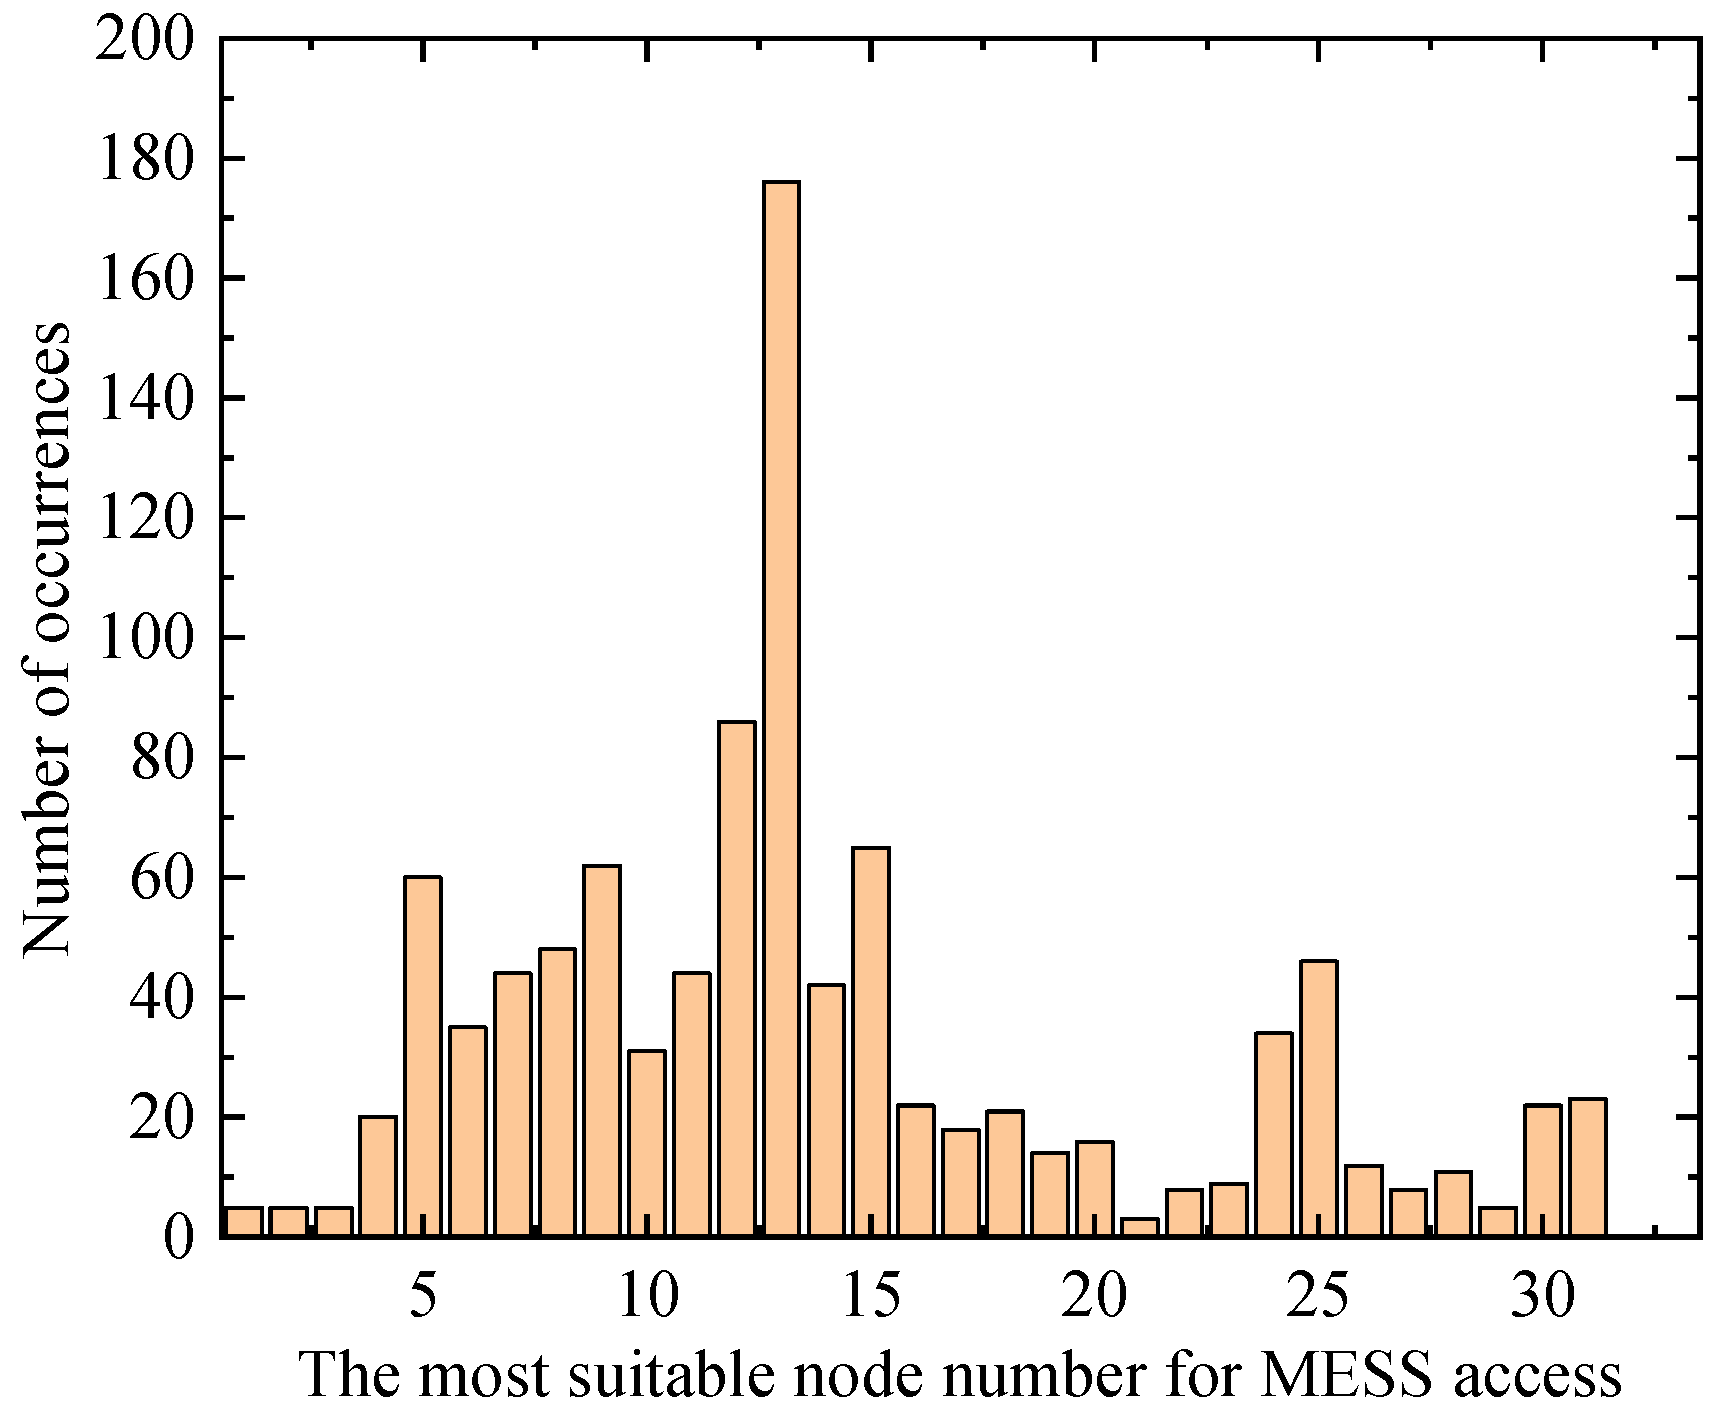
4.2. The Feasibility of the Proposed Method
5. Conclusions
Author Contributions
Funding
Data Availability Statement
Conflicts of Interest
References
- Zhang, L.; Wang, C.; Liang, J.; Wu, M.; Zhang, B.; Tang, W. A Coordinated Restoration Method of Hybrid AC/DC Distribution Network for Resilience Enhancement. IEEE Trans. Smart Grid 2023, 14, 112–125. [Google Scholar] [CrossRef]
- Xu, X.; Chenguang, H.; Chenya, S.; Jian, M. Research on System Resource Optimization of Distribution Network Producer-Consumer System Considering Resilience and Economy. IEEE Access 2023, 11, 63947–63957. [Google Scholar] [CrossRef]
- Ding, T.; Wang, Z.; Qu, M.; Wang, Z.; Shahidehpour, M. A Sequential Black-Start Restoration Model for Resilient Active Distribution Networks. IEEE Trans. Power Syst. 2022, 37, 3133–3136. [Google Scholar] [CrossRef]
- Nazemi, M.; Moeini-Aghtaie, M.; Fotuhi-Firuzabad, M.; Dehghanian, P. Energy Storage Planning for Enhanced Resilience of Power Distribution Networks Against Earthquakes. IEEE Trans. Sustain. Energy 2020, 11, 795–806. [Google Scholar] [CrossRef]
- Ding, J.C.; Su, Y.S.; Li, J.S.; Liu, H.T. Operation characters of power grid and countermeasure during icing disaster. South. Power Syst. Technol. 2008, 4, 23–26. [Google Scholar]
- Hou, Y.; Wang, X.; Duan, J.; Guo, J. Transmission lines de-icing optimal scheduling considering system risk. Proc. CSEE 2014, 34, 6101–6108. [Google Scholar]
- Lu, Z.; Li, D.; Lu, X. Multiple faults repair strategy under ice storm for distribution network with distributed generators. Trans. China Electrotech. Soc. 2018, 33, 423–432. [Google Scholar]
- Liang, C.; Chuang, F.; Xing-Yuan, L. Optimized decision-making of power grid DC de-icing plan based on tabu search algorithm. Power Syst. Technol. 2015, 39, 1637–1642. [Google Scholar]
- Yan, M.; He, Y.; Ai, X.; Guo, C. Coordinated strategy of de-Icing outage scheduling and unit commitment. Proc. CSEE 2018, 38, 1467–1474. [Google Scholar]
- Wang, S.; Huang, R.; Pan, Z.; Wang, J. Construction and evaluation of resilience restoration capability indices for distribution network under extreme ice and snow weather. High Volt. Eng. 2020, 46, 123–132. [Google Scholar]
- Guo, W.; An, J.; He, C.; Yang, S.; Hu, S.; Fan, W. Resilience assessment and improvement of power system under ice disaster. Proc. CSU-EPSA 2021, 33, 116–122. [Google Scholar]
- Zhang, G. Research on the Planning and Restoration of Resilient Distribution System to Hedge Against Nature Disasters. Ph.D. Thesis, Shandong University, Jinan, China, 2021. [Google Scholar]
- Li, Y.; Yang, Y.; Li, Z.; Tang, W.; Guo, J.; Feng, T. Proactive dispatch of power systems considering spatial-temporal distribution characteristics of ice disaster weather. Power Syst. Autom. 2021, 43, 62–65. [Google Scholar]
- Huang, W.; Hu, B.; Shahidehpour, M.; Sun, Y.; Sun, Q.; Yan, M.; Shao, C.; Xie, K. Preventive scheduling for reducing the impact of glaze icing on transmission lines. IEEE Trans. Power Syst. 2021, 37, 1297–1310. [Google Scholar] [CrossRef]
- Wang, W.; Xiong, X.; He, Y.; Hu, J.; Chen, H. Scheduling of Separable Mobile Energy Storage Systems with Mobile Generators and Fuel Tankers to Boost Distribution System Resilience. IEEE Trans. Smart Grid 2022, 13, 443–457. [Google Scholar] [CrossRef]
- Abdeltawab, H.H.; Mohamed, Y.A.-R.I. Mobile Energy Storage Scheduling and Operation in Active Distribution Systems. IEEE Trans. Ind. Electron. 2017, 64, 6828–6840. [Google Scholar] [CrossRef]
- Pulazza, G.; Zhang, N.; Kang, C.; Nucci, C.A. Transmission Planning with Battery-Based Energy Storage Transportation for Power Systems with High Penetration of Renewable Energy. IEEE Trans. Power Syst. 2021, 36, 4928–4940. [Google Scholar] [CrossRef]
- Li, X.; Wang, S. Energy management and operational control methods for grid battery energy storage systems. CSEE J. Power Energy Syst. 2021, 7, 1026–1040. [Google Scholar]
- Kim, J.; Dvorkin, Y. Enhancing Distribution System Resilience With Mobile Energy Storage and Microgrids. IEEE Trans. Smart Grid 2018, 10, 4996–5006. [Google Scholar] [CrossRef]
- Ren, J.; Chen, J.; Jiang, X.; Sun, X.; Zhang, S.; Li, W. Post-disaster recovery strategy of resilient distribution network considering mobile energy storage system and network reconfiguration. Electr. Power Constr. 2020, 41, 86–92. [Google Scholar]
- Yao, S.; Wang, P.; Liu, X.; Zhang, H.; Zhao, T. Rolling optimization of mobile energy storage fleets for resilient service restoration. IEEE Trans. Smart Grid 2020, 11, 1030–1043. [Google Scholar] [CrossRef]
- Yang, L.J.; Zhao, Y.; Qin, Y. Balanced fault recovery of active distribution network considering emergency power supply vehicle scheduling in traffic network. Autom. Electr. Power Syst. 2021, 45, 170–180. [Google Scholar]
- Yao, S.; Wang, P.; Zhao, T. Transportable energy storage for more resilient distribution systems with multiple microgrids. IEEE Trans. Smart Grid 2019, 10, 3331–3341. [Google Scholar] [CrossRef]
- Ding, T.; Wang, Z.; Jia, W.; Chen, B.; Chen, C.; Shahidehpour, M. Multiperiod distribution system restoration with routing repair crews, mobile electric vehicles, and soft-open-point networked microgrids. IEEE Trans. Smart Grid 2020, 11, 4795–4808. [Google Scholar] [CrossRef]
- Wang, Y.; Deng, H.; Wang, X.; Jiang, C.; Fang, L.; Ma, J. Optimal configuration and operation strategy of mobile energy storage in distribution network considering spatial-temporal evolution of typhoon. Autom. Electr. Power Syst. 2022, 46, 42–51. [Google Scholar]
- Zhang, Q.; Wang, Z.; Ma, S.; Arif, A. Stochastic prevent preparation for enhancing resilience of distribution systems. Renew. Sustain. Energy Rev. 2021, 152, 111636. [Google Scholar] [CrossRef]
- Lei, S.; Chen, C.; Zhou, H.; Hou, Y. Routing and scheduling of mobile power sources for distribution system resilience enhancement. IEEE Trans. Smart Grid 2019, 10, 5650–5662. [Google Scholar] [CrossRef]
- Lei, S.; Wang, J.; Chen, C. Mobile Emergency Generator Pre-Positioning and Real-Time Allocation for Resilient Response to Natural Disasters. IEEE Trans. Smart Grid 2016, 9, 2030–2041. [Google Scholar] [CrossRef]
- Gao, H.; Chen, Y.; Mei, S. Resilience-Oriented Pre-Hurricane Resource Allocation in Distribution Systems Considering Electric Buses. Proc. IEEE 2017, 105, 1214–1233. [Google Scholar] [CrossRef]
- Sedzro, Z.S.A.; Lamadrid, A.J.; Zuluaga, L.F. Allocation of Resources Using a Microgrid Formation Approach for Resilient Electric Grids. IEEE Trans. Power Syst. 2018, 33, 2633–2643. [Google Scholar] [CrossRef]
- Che, L.; Shahidehpour, M. Adaptive Formation of Microgrids with Mobile Emergency Resources for Critical Service Restoration in Extreme Conditions. IEEE Trans. Power Syst. 2019, 34, 742–753. [Google Scholar] [CrossRef]
- Lei, S.; Chen, C.; Li, Y. Resilient Disaster Recovery Logistics of Distribution Systems: Co-Optimize Service Restoration With Repair Crew and Mobile Power Source Dispatch. IEEE Trans. Smart Grid 2019, 10, 6187–6202. [Google Scholar] [CrossRef]
- Jones, K.F. A simple model for freezing rain ice loads. Atmos. Res. 1998, 46, 87–97. [Google Scholar] [CrossRef]
- Krishnasamy, S.G. Assessment of weather induced transmission line loads on a probabilistic basis. IEEE Trans. Power Appar. Syst. 1985, 104, 2510–2516. [Google Scholar]
- Feng, W. Operation Risk Assessment on Power Grid in Ice Storm and Network Protection. Master’s Thesis, Harbin Institute of Technology, Harbin, China, 2014. [Google Scholar]
- Chen, M.; Xia, M.; Chen, Q. A two-stage planning method of the energy router considering the optimal operation in distribution network. CSEE J. Power Energy Syst. 2022, 1–13. [Google Scholar] [CrossRef]
- Wang, W.; Danandeh, A.; Buckley, B.; Zeng, B. Two-Stage Robust Unit Commitment Problem with Complex Temperature and Demand Uncertainties. IEEE Trans. Power Syst. 2023, 1–12. [Google Scholar] [CrossRef]


| Line Number | Fault Probability | Line Number | Fault Probability | Line Number | Fault Probability |
|---|---|---|---|---|---|
| 1 | 0.0200 | 12 | 0.2968 | 23 | 0.0496 |
| 2 | 0.0224 | 13 | 0.0419 | 24 | 0.0464 |
| 3 | 0.0455 | 14 | 0.0416 | 25 | 0.1903 |
| 4 | 0.0252 | 15 | 0.2487 | 26 | 0.0172 |
| 5 | 0.1286 | 16 | 0.2529 | 27 | 0.1186 |
| 6 | 0.0216 | 17 | 0.0749 | 28 | 0.0287 |
| 7 | 0.0446 | 18 | 0.0898 | 29 | 0.0186 |
| 8 | 0.0543 | 19 | 0.3072 | 30 | 0.0830 |
| 9 | 0.1695 | 20 | 0.1651 | 31 | 0.1461 |
| 10 | 0.0429 | 21 | 0.3333 | 32 | 0.1463 |
| 11 | 0.1315 | 22 | 0.0204 |
| Different Scenarios | Scenario 1 | Scenario 2 |
|---|---|---|
| System load loss/MWh | 3.756 | 3.248 |
| Moving time in transportation networks | / | 1.163 |
| Different Strategies | Strategy 1 | Strategy 2 | Strategy 3 |
|---|---|---|---|
| Operating cost of the distribution network/$ | 34,927.6 | 32,468.2 | 31,488.7 |
| Cost of load shedding/$ | 7246.4 | 3765.0 | 3248.0 |
| Cost of road traffic | / | / | 581.5 |
| Operating cost of MESS | / | 1924.6 | 1685.8 |
| Total cost | 42,174.0 | 38,157.8 | 37,004.0 |
Disclaimer/Publisher’s Note: The statements, opinions and data contained in all publications are solely those of the individual author(s) and contributor(s) and not of MDPI and/or the editor(s). MDPI and/or the editor(s) disclaim responsibility for any injury to people or property resulting from any ideas, methods, instructions or products referred to in the content. |
© 2023 by the authors. Licensee MDPI, Basel, Switzerland. This article is an open access article distributed under the terms and conditions of the Creative Commons Attribution (CC BY) license (https://creativecommons.org/licenses/by/4.0/).
Share and Cite
Guo, X.; Miao, G.; Wang, X.; Yuan, L.; Ma, H.; Wang, B. Mobile Energy Storage System Scheduling Strategy for Improving the Resilience of Distribution Networks under Ice Disasters. Processes 2023, 11, 3339. https://doi.org/10.3390/pr11123339
Guo X, Miao G, Wang X, Yuan L, Ma H, Wang B. Mobile Energy Storage System Scheduling Strategy for Improving the Resilience of Distribution Networks under Ice Disasters. Processes. 2023; 11(12):3339. https://doi.org/10.3390/pr11123339
Chicago/Turabian StyleGuo, Xiaofang, Guixi Miao, Xin Wang, Liang Yuan, Hengrui Ma, and Bo Wang. 2023. "Mobile Energy Storage System Scheduling Strategy for Improving the Resilience of Distribution Networks under Ice Disasters" Processes 11, no. 12: 3339. https://doi.org/10.3390/pr11123339