Article

Study of Indium Phosphide Quantum Dots/Carbon Quantum Dots System for Enhanced Photocatalytic Hydrogen Production from Hydrogen Sulfide

1
State Key Laboratory of Oil and Gas Reservoir Geology and Exploitation, Southwest Petroleum University, Chengdu 610500, China
2
School of New Energy and Materials, Southwest Petroleum University, Chengdu 610500, China
3
Tianfu New Energy and Materials Industry Department, Meishan Vocational and Technical College, Meishan 620000, China
*
Authors to whom correspondence should be addressed.
Processes 2023, 11(11), 3160; https://doi.org/10.3390/pr11113160
Submission received: 26 September 2023 / Revised: 31 October 2023 / Accepted: 2 November 2023 / Published: 6 November 2023

Abstract

:
Quantum dots (QDs) are promising semiconductor nanocrystals in photocatalysis due to their unique properties and in contrast to bulk semiconductors. Different from the traditional modification methods of indium phosphide (InP) QDs such as metal doping, shell design, and surface ligand modification, we firstly constructed the indium phosphide quantum dot and carbon quantum dot (InP QDs/CQDs) system and used it for the study of photocatalytic hydrogen production from hydrogen sulfide (H2S) in this work. The photocatalytic performance tests show that the average rate of photocatalytic decomposition of hydrogen sulfide to produce hydrogen of the InP QDs/CQDs system increases by 2.1 times in contrast to InP QDs alone. The steady-state and time-resolved photoluminescence spectra demonstrated that the introduction of CQDs can effectively improve the separation efficiency of photo-generated carriers. In addition, the surface electronegativity of the InP QDs/CQDs system is weaker than that of InP QDs, which may reduce the repulsion between the photocatalyst and reaction substrate, promoting the surface oxidation reaction in the photocatalytic process. This work indicates that the construction of the QDs hybrid system can improve their photocatalytic performance, providing a way to optimize QDs in photocatalysis.

1. Introduction

Solar energy is the most abundant source of energy on earth, with a total of 1.5 × 10¹⁸ kWh of solar energy reaching the surface of the earth every year which is nearly 10,000 times the global energy consumption [1]. Therefore, solar energy shows great potential to meet future world clean energy demands. Photocatalysis can directly convert solar energy into chemical energy, which is of great importance for clean energy utilization. The selection of the appropriate photocatalyst is of paramount importance in the photocatalytic reaction. In recent years, semiconductor quantum dot (QDs) materials have attracted extensive attention in the field of photocatalytic hydrogen production due to their adjustable band gap, strong light absorption ability, multiple active sites, and rich surface properties [2,3]. For example, cadmium sulfide (CdS), cadmium selenide (CdSe), cadmium antimonide (CdTe), cadmium sulfide/cadmium oxide (CdS/CdOx), and cadmium sulfide/zinc sulfide (CdS/ZnS) QDs are used in photocatalytic hydrogen production reactions to obtain clean energy (H2) [4,5,6,7,8,9,10,11,12]. However, the high toxicity of Cd may limit their large-scale application. Therefore, there is an urgent need to design and develop efficient and non-toxic QDs.
Alternatively, the III-V QDs represented by indium phosphide (InP QDs) have great potential for photocatalysis. Compared with extensively studied CdSe QDs, InP QDs have a narrower bandgap and a larger Bohr exciton radius, which provides InP QDs with a wider adjustable absorption range in the visible light region [13]. Moreover, the covalent bond property of InP QDs is stronger than CdSe QDs, resulting in weaker interactions between electrons and holes in InP QDs, which is beneficial for the charge separation process [14]. Benefiting from these properties, InP QDs are widely used in the fields of solar cells, light emitting diodes (LEDs) [15,16], photocatalytic organic synthesis [17,18,19,20], photocatalytic hydrogen production [13,21,22], etc. For instance, we have designed an S2− surface ligand capped on InP QDs for photocatalytic hydrogen production, proving that the hydrogen production efficiency of InP QDs capped with S2− can be comparable to that of CdSe QDs for the first time [13]. Hong et al. demonstrated the potential of Cu-doped InP/ZnS QDs as visible light-driven photocatalysts for hydrogen evolution reactions, which exhibited excellent photocatalytic activity and stability [23]. Similarly, Tong et al. also investigated the application of Cu-doped InP/ZnSe QDs for solar-driven photoelectrochemical hydrogen production. In addition, InP/Cu:ZnSe QDs have excellent photo-generated carrier separation efficiency and ultimately have outstanding hydrogen production performance [24]. Moreover, research also suggests that InP/ZnS QDs serve as efficient visible light photocatalysts for organic synthesis. Pillai et al. proved that InP/ZnS QDs play a decisive role in carbon–carbon coupling reactions [17]. This indicated that InP QDs have promising applications in photocatalysis.
Carbon quantum dots (CQDs) are increasingly used in photocatalysis due to their simple synthetic method, low cost, low toxicity, and abundant surface properties [25,26]. The formation of composites of CQDs and other photocatalysts such as metals, semiconductors, QDs, and other materials is an ideal way to improve photocatalytic performance. CQDs can provide active sites due to adjustable element composition and surface functional group and improve the visible light response of photocatalysts, leading to enhanced light absorption and surface reaction of the photocatalytic system, ultimately promoting photocatalytic activity of photocatalytic system [25,27,28]. In addition, CQDs may also effectively improve the separation of photo-generated carriers in composite photocatalytic systems [29,30,31]. For instance, Tang et al. demonstrated that construction of CQDs/carbon nitride-like polymers system can promote the photocatalytic reaction due to the decrease in the recombination rate of photo-generated electrons and holes in the system [32]. Similarly, Guo et al. also reported that the construction of a CQDs/BiOBr system can promote photocatalytic reaction performance. They found that the introduction of CQDs can enhance visible light absorption and the separation efficiency of photo-generated electrons and holes, thereby improving photocatalytic activity [33].
Here, we introduce CQDs into the InP QDs system to construct an InP QDs/CQDs system for the first time and investigate its photocatalytic performance using photocatalytic hydrogen production from H2S as a model reaction. The introduction of CQDs can promote the transfer of photo-generated carriers of the InP QDs/CQDs system. Moreover, the introduction of CQDs can weaken the negative charge surface of the original InP QDs, reducing the repulsion between the InP QDs/CQDs system and the reaction substrate (HS-), eventually facilitating the occurrence of surface oxidation reactions. As a result, the hydrogen production efficiency of the InP QDs/CQDs system is 2.1 times that of InP QDs, indicating the effectiveness of modification of InP QDs by CQDs.

2. Materials and Methods

2.1. Chemicals

Indium (III) chloride tetrahydrate (99.9%), zinc chloride (98%), zinc iodide (99.999%), oleylamine (OLA, 80–90%), tris(diethylamino)phosphine (97%), hexane (HEX, AR), N-methylformamide (NMF, 99%), ethylenediamine (AR), tetrabutylammonium tetrafluoroborate (AR), potassium bromide (99%) and formamide (FA, 99%) were purchased from Aladdin (Shanghai, China). Ethanol absolute (99.7%), sodium sulfide (Na2S·9H2O, ≥98%), sodium sulfite (97%), hydrochloric acid (AR), sodium hydroxide (98%), acetone (99.5%), and chitosan (Chi, AR) were obtained from Chron Chemicals (Chengdu, China). All reagents were used as received without further purification. Deionized water (18.25 MΩ/cm) was used throughout the experiments.

2.2. Synthesis of InP QDs

InP QDs capped with oleylamine (InP-OLA) were prepared following a reported hot injection method [13]. In detail, 146 mg (0.5 mmol) InCl3·4H2O as indium precursor, 204 mg (1.5 mmol) ZnCl2, and 160 mg (0.5 mmol) ZnI2 as zinc precursors, and 5.0 mL (15 mmol) oleylamine were added to a three neck RB. The reaction mixture was then evacuated by Schlenk techniques and kept under vacuum at 120 °C for 1 h. Afterwards, the system was heated to 180 °C under the inert atmosphere. A total of 0.5 mL (1.8 mmol) of tris (diethylamino)phosphine (phosphorous: indium ratio = 3.6:1) was then quickly injected into the mixture solutions. The system was kept at 180 °C for 30 min to drive the growth of InP-OLA QDs to completion and then cooled to room temperature. After the above, the crude QDs solution was cooled down to room temperature, and approximately 10 mL of ethanol was added for the precipitation of QDs. After centrifugation, the supernatant was discarded. The precipitated QDs were further purified by dissolution in 10 mL of hexane and subsequent precipitation in 15 mL of ethanol. Finally, the QDs were again dissolved in 10 mL of HEX and centrifuged to remove the insoluble impurities. The prepared QDs could be properly maintained in solution at 2–5 °C.
The water-soluble sulfide ion (S2−) ligands were then attached to the InP surface by the ligand exchange process, in accordance with the previously reported literature [13]. Specifically, 1 mL of InP-OLA QDs in HEX with an approximate concentration of 3–5 mg/mL were mixed with 1 mL of the Na2S∙9H2O solution (0.05 M) in NMF. The solution mixture was continuously stirred at room temperature until the QDs were transferred from the HEX phase to the NMF phase. Then the HEX solution was removed and the NMF solution was further washed twice with HEX to remove residual non-polar organic impurities. Subsequently, the NMF solution was precipitated with acetone to obtain the precipitate of InP QDs capped with S2− (herein denoted as InP QDs). The precipitate was then purified using a small amount of FA and acetone. Finally, InP QDs were dispersed in water and stored in an environment of 2–5 °C.

2.3. Synthesis of CQDs

CQDs were synthesized using a modified method from the literature [34]. A total of 10 mL of deionized water and 11 mg of biomass chitosan were taken in a beaker, and 0.6 mL of HCl solutions (1 mol/L) was added with slow stirring. The insoluble chitosan was gradually dissolved due to protonation. Subsequently, 0.8 mL of ethylenediamine was added to the above mixed solutions and stirred for two minutes. The reaction mixture was heated by microwave method in a 100 W microwave oven. Finally, a certain amount of deionized water was added to the beaker to dissolve the reaction product after cooling down to room temperature.

2.4. Preparation of InP QDs/CQDs System

The InP QDs/CQDs system was obtained by the simple magnetic stirring method. More specifically, InP QDs solution and CQDs solution were mixed in a certain proportion, the mixture was first sonicated for 2 min, and then stirred in the dark for 12 h. A series of InP QDs/CQDs systems with different loading amounts of CQDs were synthesized by varying the feeding ratio of CQDs. Notably, we directly stirred 1 mg of InP QDs and different loading amounts of CQDs in the reactor for 12 h, then directly used them for photocatalytic hydrogen production from H2S.

2.5. Characterization

The crystal structure and crystallinity of the samples were studied by X-ray diffraction (XRD) with Cu Ka radiation using a Philips X’Pert diffractometer at 40 kV and 40 mA. UV–Vis absorption spectra were recorded with a Shimadzu UV-2600 spectrophotometer. Steady-state photoluminescence spectra (PL) were recorded with an Edinburgh FLS1000 fluorescence spectrophotometer. The valence band of CQDs was measured by electrochemical cyclic voltammetry (CV, CHI760E, Chenhua Instrument, Shanghai, China). The actual composition of InP QDs was determined by inductively coupled plasma optical emission spectrometry (ICP-OES, HORIBA Ultima Expert, HORIBA France SAS, Palaiseau, France). The surface functional groups of CQDs and InP QDs/CQDs were determined by Fourier transform infrared spectrum (FTIR, TENSOR II, Bruker, Ettlingen, Germany). The morphologies of the sample were studied using a transmission electron microscope (TEM, TECNAI G2S-TWIN, FEI, Worcester, MA, USA). X-ray photoelectron spectra (XPS) were obtained by Thermo Fisher Scientific (FEI, Worcester, MA, USA) ESCALAB 250Xi X-ray photoelectron spectrometer and all of the binding energies were referenced to the C 1s level at 284.8 eV. Zeta potential of the samples was measured by a Brookhaven Zeta PALS/90 Plus analyzer (Brookhaven, NY, USA). Time-resolved fluorescence spectroscopy of the sample was tested by an Edinburgh FLS1000 fluorescence spectrometer (Edinburgh, Livingston, UK).

2.6. Photocatalytic Hydrogen Production from H2S

The photocatalytic performance evaluation of all materials for hydrogen production was conducted at room temperature and pressure, with a 10 mL single port Pyrex tube as the reactor. The open end of the reaction tube was sealed with a silicone rubber plug, and the light source was a 3 W LED lamp (λ = 460 nm). The system was equipped with a circulating condensation device to avoid overheating of the light source. The specific experimental operation was as follows: first, add 1 mL of InP QDs/CQDs solution to the reaction tube (maintain the dosage of InP QDs at 1 mg in experiments with different photocatalysis), seal it, and then inject argon gas to exhaust air. Then, take 4 mL of reaction medium (reaction medium is 0.6 M Na2SO3 solution with 2% H2S gas) and inject it into the reaction tube. Finally, inject 1 mL of methane as the internal standard. After exposure to light for a period of time, 0.5 mL of gas was extracted from the reaction tube using an injection needle and injected into a gas chromatograph (TCD detector, Ar as the carrier gas, and 5 Å molecular sieve as the chromatographic column). Calculation of the hydrogen production amount is based on the peak areas of hydrogen and methane.

3. Results and Discussion

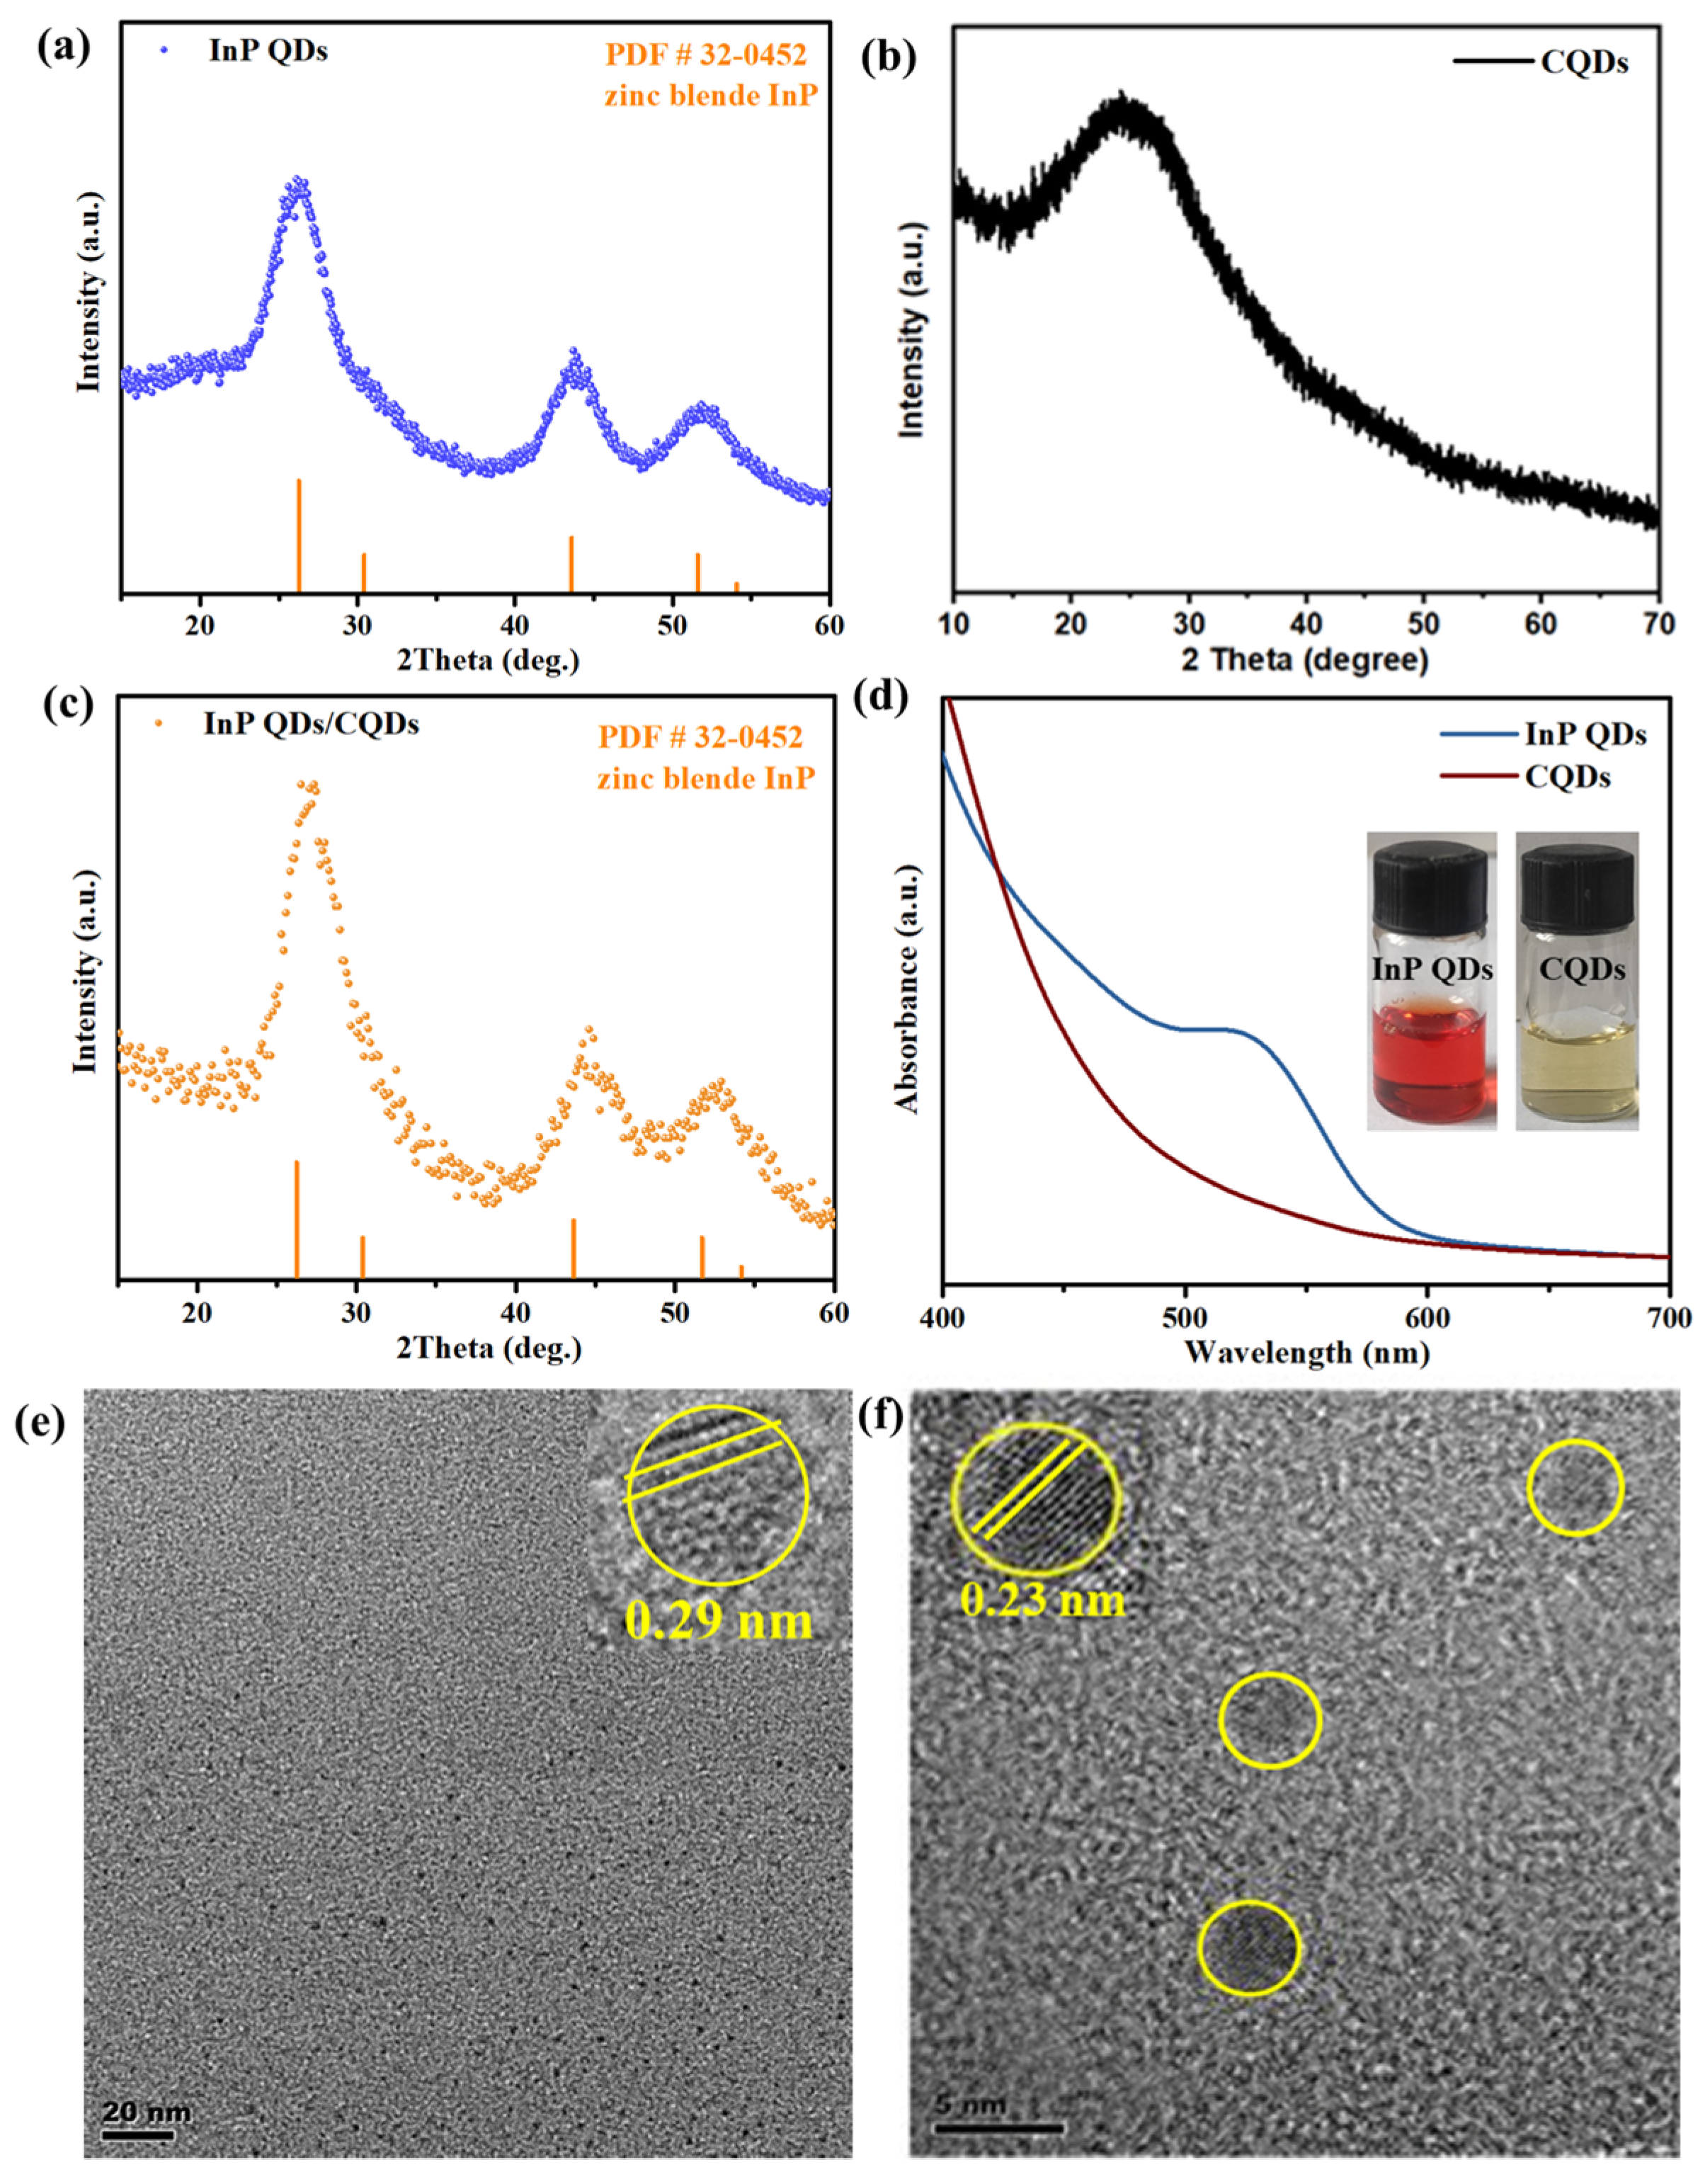
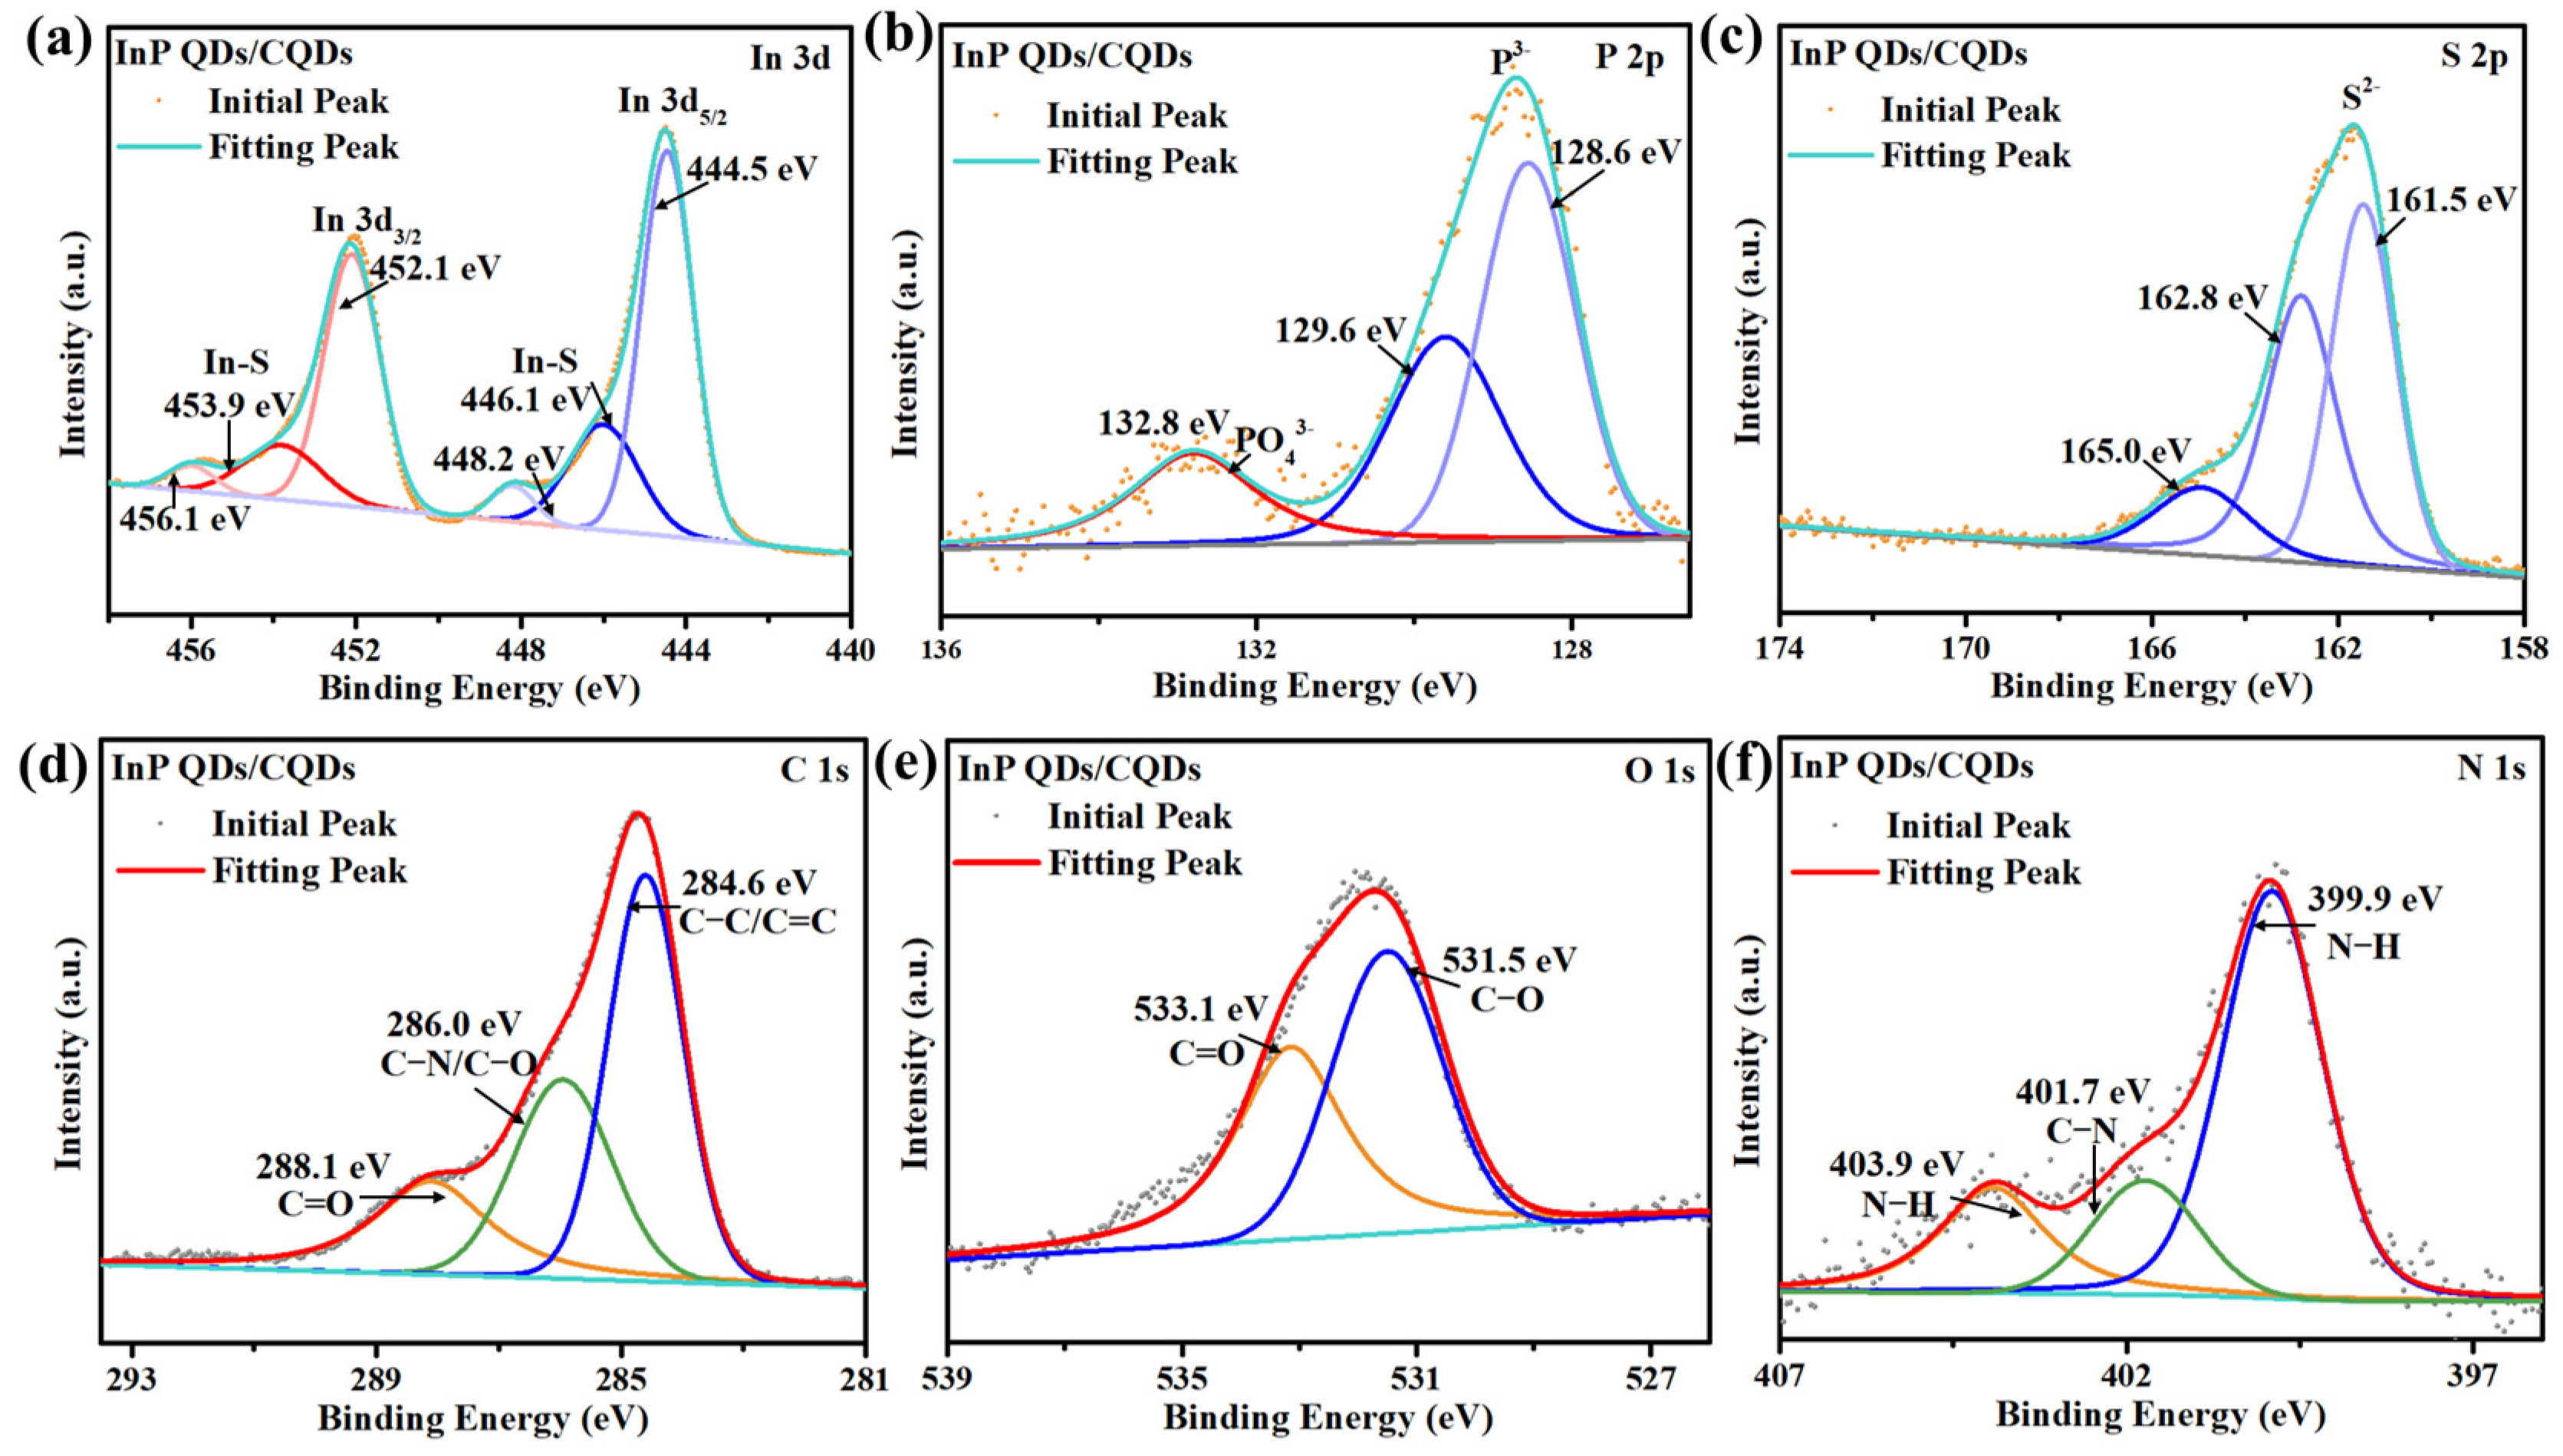
3.1. Synthesis and Characterization of InP QDs and CQDs

Water-soluble InP QDs capped with inorganic S2− surface ligands were synthesized by hot injection methods, in accordance with a previous report [13]. X-ray diffraction (XRD) measurements were employed to analyze the structure of the synthesized InP QDs, as shown in Figure 1a. It can be seen that InP QDs have three obvious diffraction peaks at 26.3°, 43.8°, and 51.8°, respectively, corresponding to the (111), (220), and (331) diffraction crystal planes of sphalerite-type InP (JCPDS 32-0452) [35,36,37]. UV–Vis absorption spectrum of InP QDs (Figure 1d) exhibits a characteristic absorption peak at 513 nm, which is consistent with the literature [13] and indicates the successful synthesis of InP QDs. Elemental analyses by ICP-OES determined the actual composition of InP QDs (Table S1). Specifically, the weight percentages of In, P, S, and Zn in InP QDs are 41.87 wt.%, 7.62 wt.%, 7.12 wt.%, and 3.93 wt.%, respectively. Furthermore, the morphology of InP QDs was characterized by transmission electron microscopy (TEM). Figure 1e shows that InP QDs are spherical particles with uniform distribution, and the particle size is 2–3 nm. Moreover, the lattice of the InP QDs could be observed with a lattice spacing of 0.29 nm, which corresponds well with the (200) crystal plane of sphalerite type InP. Finally, for band energy structure of InP QDs, in previous studies, we found that the valence and conduction band values of InP QDs were 1.43 V and −0.88 V, respectively [13].
CQDs were synthesized using the microwave method based on a modified protocol from the literature [34]. The XRD pattern (Figure 1b) shows that the CQDs have a relatively wide diffraction peak located at around 2θ = 24°, indicating the amorphous state of the carbon structure. Furthermore, the UV–Vis absorption spectrum of CQDs exhibits an absorption peak at 288 nm (Figure S1), corresponding to a π-π* transition of C=C bond electrons, which is similar to the previous reports [34,38,39]. This indicates that CQDs were successfully synthesized through the microwave method. Further, we tested the Fourier transform infrared (FTIR) spectrum of CQDs; the results are shown in the Figure S2a. The characteristic peaks of CQDs appear at 3554–3000, 1600–1400, and 1200–900 cm−1, corresponding to the characteristic stretching vibration band of the hydroxyl group and amino group, the asymmetric and symmetric stretching vibration of carboxylic acid groups, and C-H stretching vibration, respectively, which are consistent with the reported literature [34,40]. This further proves the successful synthesis of CQDs using chitosan as the raw material. The TEM of CQDs exhibits a spherical particle distribution and an average particle size of around 4.4 nm (Figure S3). Moreover, the lattice spacing of CQDs is 0.23 nm (Figure 1f), corresponding to the (100) graphite diffraction plane. Finally, we measured the oxidation potential of the CQDs using CV to be 0.12 V, then obtained a valence band value of 0.12 V (Figure S4a). Combined with UV–Vis absorption spectrum (Figure S4b), we derive that the conduction band value of the CQDs is 2.88 V.
Compared to the InP QDs and CQDs alone, no diffraction peaks related to CQDs were observed in the XRD pattern of the InP QD/CQD system (Figure 1c). Two possible reasons for the absence of CQDs diffraction peaks are: (1) The diffraction peaks of CQDs ranging from 20 to 30° overlap with the peak of InP QDs at 26.3°; (2) The relatively low content of CQDs in the InP QDs/CQDs system. Moreover, the diffraction peak of the InP QDs/CQDs system shifted by approximately 0.6°, which may be due to the introduction of CQDs (Figure 1c). However, it was found that the overall InP QDs/CQDs system still belongs to the sphalerite-type InP, indicating that the introduction of CQDs did not change the structure of InP QDs. Moreover, it can be seen that there are characteristic peaks (3554–3000, 1600–1400, and 1200–900 cm−1) related to CQDs in the InP QDs/CQDs system from the FTIR spectra of CQDs and InP QDs/CQDs system (Figure S2b), indicating that CQDs are indeed loaded on the InP QDs surface.
X-ray photoelectron spectroscopy (XPS) measurement is employed to further analyze the element composition information of the InP QDs surface. The existence of In, P, and S is confirmed in the survey spectrum of InP QDs. In addition, the signal of Zn could also be observed (Figure S5a), which derives from the precursor ZnCl2 and ZnI2 used during the synthesis for size control of InP QDs [13,41,42]. The fine spectrum of In 3d exhibits two peaks at 444.4 and 451.9 eV, which are assigned to In 3d5/2 and In 3d3/2 with In3+, respectively (Figure S6a). Moreover, the other two peaks at 446.1 and 453.8 eV belong to In-S; this confirms InP QDs are indeed capped with the S2− ligand [43]. The fine spectrum of P 2p of InP QDs clearly proves the existence of two chemical environments for P atoms (Figure S6b). The peak with low binding energies, present at 128.4 and 129.3 eV, is characteristic of InP with P3−. The peaks with higher binding energies (132.8 and 133.7 eV) correspond to P in an oxidation environment, which is consistent with previous reports [41]. In terms of the S element in InP QDs, it has two chemical states (Figure S6c). The three bands located at 164.1, 162.8 eV, and 161.4 eV in the S 2p fine spectrum are assigned to the hybrid chemical bond species of S2− (Figure S6c); this further confirms InP QDs are indeed capped with the S2− ligand. The other three peaks with higher binding energy corresponded to oxidized S, which is similar to previous reports in the literature of S2− ligand-capped QDs (Figure S6c) [13,21].
As for CQDs, the survey XPS spectrum reveals the co-existence of C, N, and O elements (Figure S5b). The fine spectrum of C 1s exhibits peaks at 284.8, 286.2, and 287.7 eV, which correspond to C-C/C=C, C-O/C-N, and C=O bonds, respectively (Figure S6d) [44,45]. Notably, CQDs have a high N content with a ratio of up to 30% to the C element content, indicating CQDs are abundant with amino groups originating from the precursor chitosan (Figure S5b). This is further demonstrated by the fine spectrum of N 1s shows that N elements exist in the form of -NH2 and C-N in CQDs (Figure S6f). In addition, a proportion of the C-O/C-N structure is significantly higher than that of C-C/C=C, resulting in a relatively high degree of sp2 hybridization in the carbon nucleus of CQDs, ultimately leading to a lower degree of graphitization or aromatization of CQDs, which is consistent with the amorphous carbon structure of the CQDs revealed by XRD.
In addition, compared with the XPS spectra of individual InP QDs and CQDs, the XPS spectra of the InP QDs/CQDs system show a shift of 0.2–0.5 eV in the peak positions of the fine spectra of C 1s and O 1s; moreover, a new peak appeared in the fine spectrum of N 1s at 403.9 eV, which can be attributed to the N-H bond (Figure 2d–f). These results indicate that a certain interaction between CQDs and InP QDs occurs. The fine spectrum of P 2p of InP QDs/CQDs system has hardly changed (Figure 2b). However, the fine spectrum of In 3d exhibits two new peaks at 448.2 and 456.1 eV; this has been observed in the fine spectra of In 3d of the InN system previously reported, so it may be due to the interaction between InP QDs and CQDs forming In-N or In-O bonds in this system (Figure 2a) [46]. The fine spectrum of S 2p indicates the absence of sulfur oxide species, which may be due to the reduction of sulfur oxide species by functional groups on the surface of CQDs (Figure 2c). This indicates that InP QDs are combined with CQDs, rather than a simple mixture.

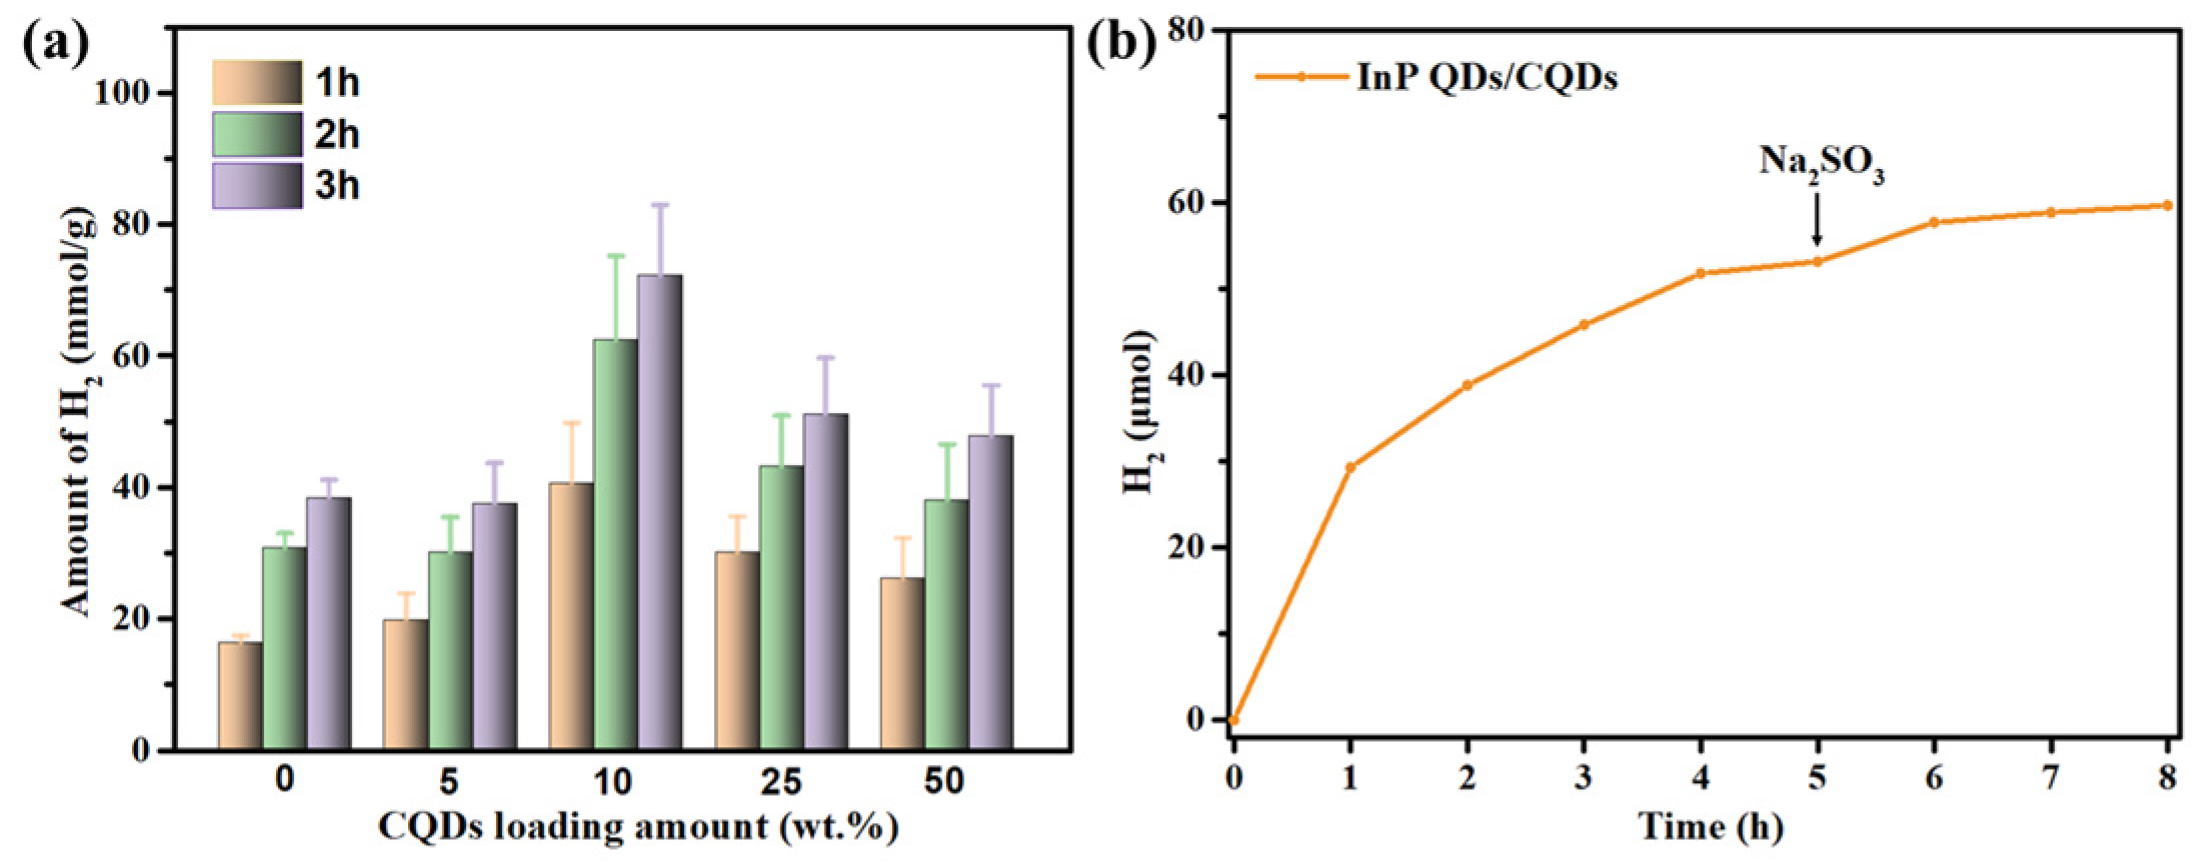
3.2. Photocatalytic Hydrogen Production

The photocatalytic hydrogen production system was built by the mixture of InP QDs and different amounts of CQDs in the presence of 0.112 mol H2S in 0.6 M Na2SO3 aqueous solution and a 460 nm LED light source. Specifically, we tested the photocatalytic activity of pure CQDs, pure InP QDs, and CQDs loading amounts of 5 wt.%, 10 wt.%, 25 wt.%, and 50 wt.%, respectively, for photocatalytic hydrogen production from H2S. The photocatalytic hydrogen production efficiency of InP QDs is 15.0 mmol g−1 h−1 and CQDs alone do not have activity towards hydrogen production. With an optimal quantity of CQDs (10 wt.%), InP QDs/CQDs system exhibits the highest photocatalytic activity with H2 formation rate of 32.0 mmol g−1 h−1, which was 2.1 times higher than of InP QDs (Figure 3). A further increase in CQDs in the system results in a decrease in the photocatalytic hydrogen production activity of the system, which may be caused by excessive CQDs covering the active sites on the InP QDs surface and crowded surfaces hindering the interaction between InP QDs and reactants. For the sources of H2, our previous report has shown that a portion of H2 comes from H2S. Notably, D in D2O will undergo proton exchange with H in H2S due to the amount of D2O in the aqueous solution being several tens of times that of H2S, resulting in some H2 coming from D2O [21].
Moreover, the photocatalytic hydrogen production rate of the InP QDs/CQDs system decreases with increasing time, which may be due to the weakening of the interaction between InP QDs and CQDs caused by photo-corrosion under visible light irradiation and consumption of Na2SO3. This indicates that the photocatalytic activity of the InP QDs/CQDs system is enhanced, but its stability may not be excellent enough. Accordingly, we evaluated the stability of the InP QDs/CQDs system (Figure 3b). It indicates that the overall stability of the InP QDs/CQDs system is poor, and the photocatalytic hydrogen production rate significantly decreases within 8 h. Notably, the hydrogen production rate slightly increases after adding the sacrificial agent of Na2SO3 solutions, indicating the stability of the photocatalytic reaction system is not only related to the stability of the photocatalyst itself, but may also be related to the consumption of sacrificial agents. It has been reported that InP is prone to oxidation to produce InPOx or In2O3; therefore, its stability is limited [47,48,49]. Subsequent research needs to strengthen the stability of InP QDs for photocatalytic hydrogen production.

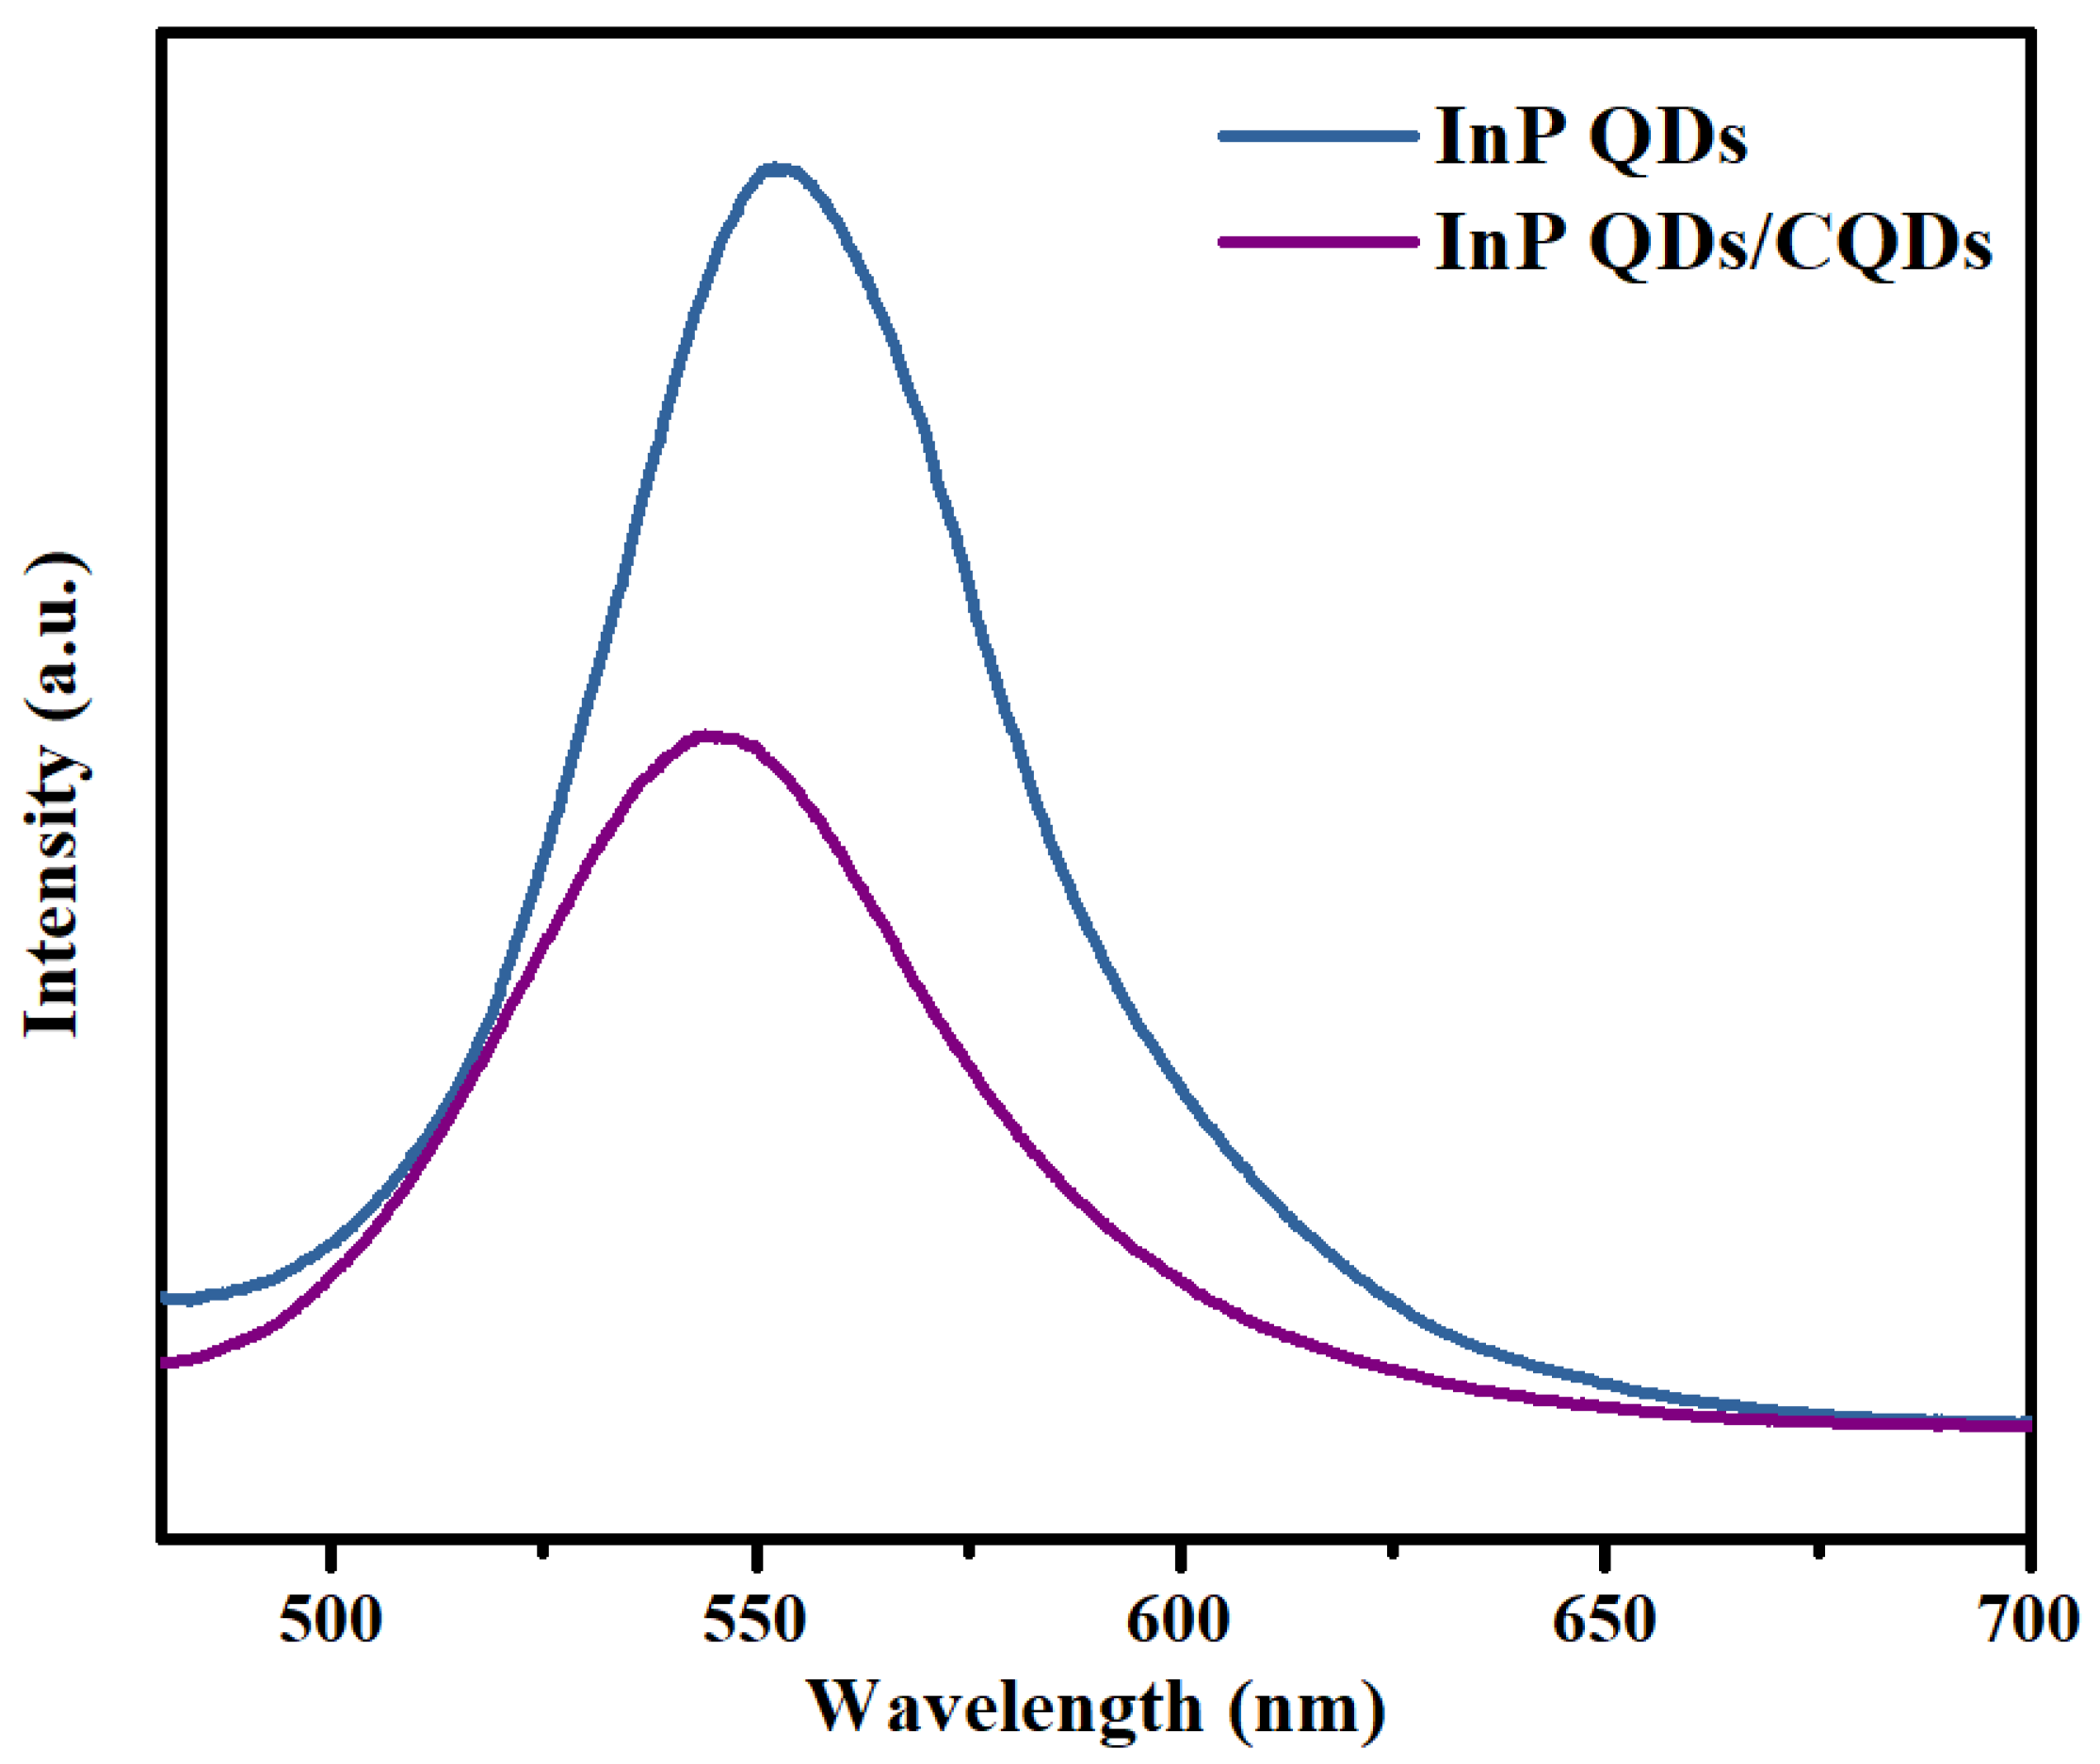
3.3. Photocatalytic Mechanism of the InP QDs/CQDs System

Photocatalysis typically involves three processes: (1) solar light absorption, (2) separation and migration of photo-generated carriers, and (3) reduction and oxidation reactions on photocatalyst surfaces [50]. Therefore, the overall photocatalytic efficiency is strongly dependent on the cumulative effects of the three consecutive steps of photocatalysis.
In order to clarify the photocatalytic hydrogen production mechanism of InP QDs/CQDs system, the first process of photocatalysis is analyzed by the UV–Vis absorption spectrum of the materials. The absorption spectrum of InP QDs exhibits the exciton absorption peak at 513 nm and excellent visible light absorption ability (Figure 1d). Compared to InP QDs, the light absorption performance of InP QDs/CQDs system is not enhanced (Figure S7). This indicates that the construction of the InP QDs/CQDs system may mainly affect the separation and migration of charge carriers and surface reactions during photocatalysis.
Notably, the PL spectrum test result (Figure 4) showed that CQDs can effectively quench the fluorescence of InP QDs, indicating the presence of additional electron transfer processes for the InP QDs/CQDs system in the current photocatalytic system. CQDs may induce carrier transfer, thereby reducing the probability of radiative recombination between photo-generated electrons and holes [25,29,30,31]. Therefore, in order to understand the specific process of photo-generated carrier migration, the photoluminescence decay curves of the samples were tested using time-resolved photoluminescence spectroscopy (TRPL) (Figure 5). The PL kinetics were effectively fitted using a multiexponential decay equation [22]:
f ( t n ) = A 1   e - t / τ 1 + A 2   e - t / τ 2 + + A n   e - t / τ n
where τn represents the decay times of each component; the amplitudes of these decay components are An; and n is the number of components in carrier recombination.
The fitted result includes two components, fast decay process τ1 and slow decay process τ2, respectively (Table 1). The lifetime τ1 and τ2 of InP QDs are 4.7 and 33.3 ns, respectively. The fast component τ1 belongs to the process of capturing electrons by surface defects, and the slow component τ2 corresponds to the process of radiation recombination of carriers in InP QDs [51]. The fast component ratio A1 and slow component ratio A2 are 0.67 and 0.33, respectively, indicating that the fast process of electrons dominates fluorescence decay. Compared to the TRPL of InP QDs, the fast component lifetime (3.9 ns) of the InP QDs/CQDs system decreases and the fast component ratio (0.88) increases, indicating the construction of the InP QDs/CQDs system promotes migration of photo-generated carriers, which is consistent with the reports in the literature [28,29,30,52]. Therefore, the inclusion of CQDs probably diminishes surface trap states in InP QDs. Additionally, CQDs offer an extra pathway for charge transfer, allowing for direct charge generation between InP QDs and CQDs.
In addition, the average lifetime (τav) of InP QDs and InP QDs/CQDs system can be further calculated using Equation (2) [53]:
τ av = ( A 1 τ 1 2 + A 2 τ 2 2 ) / ( A 1 τ 1 + A 2 τ 2 )
The τav reflects the whole charge recombination process within QDs. The average lifetime of InP QDs/CQDs system is 15.6 ns, which is almost half of the average lifetime of InP QDs alone. These TRPL data together strongly support that the charge recombination loss inside the InP QDs/CQDs system is much smaller than that of InP QDs, which is consistent with the experimental results observed in the steady-state PL spectrum (Figure 4). This is beneficial for improving the efficiency of charge separation and promoting the performance of photocatalytic hydrogen production. Hence, one reason for the promotion of photocatalytic hydrogen production performance by the construction of the InP QDs/CQDs system should be related to the improved separation efficiency and migration rate of photo-generated carriers.
Moreover, we tested the Zeta potentials of InP QDs, InP QDs/CQDs, and CQDs to understand the impact of InP QDs/CQDs system construction on surface reactions during photocatalytic reactions. The Zeta potential tests show that the Zeta potentials of InP QDs, InP QDs/CQDs, and CQDs are −16.1, −6.3, and 7.4 mV, respectively (Figure 6). InP QDs have a negatively charged surface due to the abundance of S2− present on the surface. The CQDs have a positive charge due to the presence of amino groups on their surface. H2S exists in the form of HS- in Na2SO3 aqueous solution [54]. Therefore, when CQDs bind to InP QDs by the electrostatic attraction interaction [55], it can reduce the repulsion between the InP QDs/CQDs system and the reaction substrate (HS) due to reduction in the surface negative charge in InP QDs/CQDs system, eventually promoting surface reactions and achieving higher hydrogen production efficiency.
Based on the above analysis, we speculate that the mechanism of photocatalytic H2 production from H2S in InP QDs/CQDs system is shown in Figure 7. It mainly involves the harvest of sunlight (Equation (4)), charge carrier transfers, and surface reactions (Equations (5)–(7)). Specifically, the reaction steps for photocatalytic decomposition of H2S to produce hydrogen in Na2SO3 solution are shown in Equations (3)–(7) [56]:
H2S + OH → HS + H2O (l)
Photocatalyst + hv → e + h+
2H+ + 2e → H2 (g)
HS + 2h+ → H+ + S
S + SO32− → S2O32−
Moreover, for the role of CQDs in the InP QDs/CQDs system, on the one hand, there are additional pathways in the InP QDs/CQDs system that allow the transfer of photo-generated carriers from the InP QDs to the CQDs under visible light irradiation, improving the separation efficiency of photo-generated carriers and providing more opportunities for electrons to participate in reduction reactions (hydrogen production). On the other hand, the introduction of CQDs can alleviate the repulsive effect between InP QDs and HS in the Na2SO3 solution, promoting the oxidation reaction of H2S. As a result, compared with InP QDs, the charge separation efficiency and surface reaction efficiency of the InP QDs/CQDs system were improved, ultimately achieving higher hydrogen production efficiency.

4. Conclusions

In summary, CQDs with different weight percentages were successfully connected to the surface of InP QDs to form an InP QDs/CQDs system for the first time. Experimental data showed that the promotion of the photo-generated carriers transfer owing to the formation of InP QDs/CQDs system greatly improved the photocatalytic hydrogen production performance of InP QDs/CQDs system. Moreover, the formation of the InP QDs/CQDs system may weaken the repulsive force between QDs and reaction substrates (HS), accelerating the oxidation reaction during the photocatalytic process. Therefore, InP QDs/CQDs system exhibits a high photocatalytic hydrogen production activity of 32.0 mmol g−1 h−1, which is 2.1 times higher than that of InP QDs alone. In conclusion, compared to previous work on modifying InP QDs with metals doping and shells design, this work firstly proposes the construction of the InP QDs/CQDs system, which can provide some guidance for the photocatalytic hydrogen production process of InP QDs and other QDs composite systems.

Supplementary Materials

The following supporting information can be downloaded at: https://www.mdpi.com/article/10.3390/pr11113160/s1, Figure S1: UV–Vis spectrum of CQDs; Figure S2: The FTIR spectrum (a) CQDs and (b) InP QDs/CQDs system; Figure S3: The TEM image of CQDs; Figure S4: (a) Band gap calculation of CQDs from CV measurements. Electrolyte: tetrabutylammonium tetrafluoroborate (0.1 M); scan rate: 10 mV s−1. (b) (α h ν)2 and energy curve graph of CQDs; Figure S5: The XPS survey spectra of (a) InP QDs and (b) CQDs; Figure S6: The XPS fine spectra of InP QDs and CQDs. (a) In 3d; (b) P 2p; (c) S 2p of InP QDs. (d) C 1s; (e) O1s; (f) N 1s of CQDs; Figure S7: UV–vis spectra of InP QDs/CQDs system; Table S1: The wt.% element composition of InP QDs by ICP-OES measurement.

Author Contributions

Conceptualization, S.Y. and Y.Z. (Ying Zhou); methodology, Y.C., Y.Z. (Yunqian Zhong) and J.Y.; validation, Y.C., Y.Z. (Yunqian Zhong) and Y.W.; formal analysis, Y.C., Y.Z. (Yunqian Zhong), S.Y. and Y.Z. (Ying Zhou); investigation, J.Y. and Y.W.; data curation, Y.C. and Y.Z. (Yunqian Zhong); writing—original draft preparation, Y.C.; writing—review and editing, S.Y. and Y.C.; suervision, S.Y. and Y.Z. (Ying Zhou); project administration, Y.Z. (Ying Zhou). All authors have read and agreed to the published version of the manuscript.

Funding

This research was funded by the National Natural Science Foundation of China (22002123, 22211530070, 22109132 and 22178291), the National High-end Foreign Experts Recruitment Program (G2022036015L) and the Special Project for the Central Government to Guide the Development of Local Science and Technology in Sichuan Province (22ZYZYTS0231).

Data Availability Statement

Data are available from the authors upon request.

Conflicts of Interest

The authors declare no conflict of interest.

References

  1. Mohanty, S.; Patra, P.K.; Sahoo, S.S.; Mohanty, A. Forecasting of solar energy with application for a growing economy like India: Survey and implication. Renew. Sustain. Energy Rev. 2017, 78, 539–553. [Google Scholar] [CrossRef]
  2. Chen, Y.J.; Yu, S.; Fan, X.B.; Wu, L.Z.; Zhou, Y. Mechanistic insights into the influence of surface ligands on quantum dots for photocatalysis. J. Mater. Chem. A 2023, 11, 8497–8514. [Google Scholar] [CrossRef]
  3. Wang, Q.; Ren, X.; Chen, R.; Jia, L.; He, C.; Philo, D.; Li, S.; Shi, L.; Luo, S.; Ye, J. Selective conversion of CO2 to CO under visible light by modulating Cd to In ratio: A case study of Cd-In-S colloidal catalysts. Appl. Surf. Sci. 2023, 610, 155546. [Google Scholar] [CrossRef]
  4. Ren, X.; Wei, S.; Wang, Q.; Shi, L.; Wang, X.S.; Wei, Y.; Yang, G.; Philo, D.; Ichihara, F.; Ye, J. Rational construction of dual cobalt active species encapsulated by ultrathin carbon matrix from MOF for boosting photocatalytic H2 generation. Appl. Catal. B 2021, 286, 119924. [Google Scholar] [CrossRef]
  5. Li, W.; Lee, J.R.; Jackel, F. Simultaneous Optimization of Colloidal Stability and Interfacial Charge Transfer Efficiency in Photocatalytic Pt/CdS Nanocrystals. ACS Appl. Mater. Interfaces 2016, 8, 29434–29441. [Google Scholar] [CrossRef]
  6. Li, Y.; Yu, S.; Xiang, J.; Zhang, F.; Jiang, A.; Duan, Y.; Tang, C.; Cao, Y.; Guo, H.; Zhou, Y. Revealing the Importance of Hole Transfer: Boosting Photocatalytic Hydrogen Evolution by Delicate Modulation of Photogenerated Holes. ACS Catal. 2023, 13, 8281–8292. [Google Scholar] [CrossRef]
  7. Zhao, N.; Peng, J.; Wang, J.; Zhai, M. Novel Carboxy-Functionalized PVP-CdS Nanopopcorns with Homojunctions for Enhanced Photocatalytic Hydrogen Evolution. Acta Phys. Chim. Sin. 2022, 38, 2004046. [Google Scholar] [CrossRef]
  8. Das, A.; Han, Z.; Haghighi, M.G.; Eisenberg, R. Photogeneration of hydrogen from water using CdSe nanocrystals demonstrating the importance of surface exchange. Proc. Natl. Acad. Sci. USA 2013, 110, 16716–16723. [Google Scholar] [CrossRef]
  9. Wang, P.; Zhang, J.; He, H.; Xu, X.; Jin, Y. The important role of surface ligand on CdSe/CdS core/shell nanocrystals in affecting the efficiency of H2 photogeneration from water. Nanoscale 2015, 7, 5767–5775. [Google Scholar] [CrossRef]
  10. Wang, F.; Wang, W.G.; Wang, X.J.; Wang, H.Y.; Tong, C.H.; Wu, L.Z. A Highly Efficient Photocatalytic System for Hydrogen Production by a Robust Hydrogenase Mimic in an Aqueous Solution. Angew. Chem. Int. Ed. 2011, 50, 3193–3197. [Google Scholar] [CrossRef]
  11. Wakerley, D.W.; Kuehnel, M.F.; Orchard, K.L.; Ly, K.H.; Rosser, T.E.; Reisner, E. Solar-driven reforming of lignocellulose to H2 with a CdS/CdOx photocatalyst. Nat. Energy 2017, 2, 17021. [Google Scholar] [CrossRef]
  12. Huang, L.; Wang, X.; Yang, J.; Liu, G.; Han, J.; Li, C. Dual Cocatalysts Loaded Type I CdS/ZnS Core/Shell Nanocrystals as Effective and Stable Photocatalysts for H2 Evolution. J. Phys. Chem. C 2013, 117, 11584–11591. [Google Scholar] [CrossRef]
  13. Yu, S.; Fan, X.B.; Wang, X.; Li, J.; Zhang, Q.; Xia, A.; Wei, S.; Wu, L.Z.; Zhou, Y.; Patzke, G.R. Efficient photocatalytic hydrogen evolution with ligand engineered all-inorganic InP and InP/ZnS colloidal quantum dots. Nat. Commun. 2018, 9, 4009. [Google Scholar] [CrossRef] [PubMed]
  14. Fan, G.; Wang, C.; Fang, J. Solution-based synthesis of III-V quantum dots and their applications in gas sensing and bio-imaging. Nano Today 2014, 9, 69–84. [Google Scholar] [CrossRef]
  15. Kim, S.; Kim, T.; Kang, M.; Kwak, S.K.; Yoo, T.W.; Park, L.S.; Yang, I.; Hwang, S.; Lee, J.E.; Kim, S.K.; et al. Highly Luminescent InP/GaP/ZnS Nanocrystals and Their Application to White Light-Emitting Diodes. J. Am. Chem. Soc. 2012, 134, 3804–3809. [Google Scholar] [CrossRef]
  16. Zhang, Z.; Liu, D.; Li, D.; Huang, K.; Zhang, Y.; Shi, Z.; Xie, R.; Han, M.Y.; Wang, Y.; Yang, W. Dual Emissive Cu:InP/ZnS/InP/ZnS Nanocrystals: Single-Source “Greener” Emitters with Flexibly Tunable Emission from Visible to Near-Infrared and Their Application in White Light-Emitting Diodes. Chem. Mater. 2015, 27, 1405–1411. [Google Scholar] [CrossRef]
  17. Chakraborty, I.N.; Roy, S.; Devatha, G.; Rao, A.; Pillai, P.P. InP/ZnS Quantum Dots as Efficient Visible-Light Photocatalysts for Redox and Carbon–Carbon Coupling Reactions. Chem. Mater. 2019, 31, 2258–2262. [Google Scholar] [CrossRef]
  18. Wu, H.L.; Qi, M.Y.; Tang, Z.R.; Xu, Y.J. Semiconductor quantum dots: A versatile platform for photoredox organic transformation. J. Mater. Chem. A 2023, 11, 3262–3280. [Google Scholar] [CrossRef]
  19. Nan, X.L.; Wang, Y.; Li, X.B.; Tung, C.H.; Wu, L.Z. Site-selective D2O-mediated deuteration of diaryl alcohols via quantum dots photocatalysis. Chem. Commun. 2021, 57, 6768–6771. [Google Scholar] [CrossRef]
  20. Qiao, J.; Song, Z.Q.; Huang, C.; Ci, R.N.; Liu, Z.; Chen, B.; Tung, C.H.; Wu, L.Z. Direct, Site-Selective and Redox-Neutral alpha-C-H Bond Functionalization of Tetrahydrofurans via Quantum Dots Photocatalysis. Angew. Chem. Int. Ed. 2021, 60, 27201–27205. [Google Scholar] [CrossRef]
  21. Yu, S.; Xie, Z.; Ran, M.; Wu, F.; Zhong, Y.; Dan, M.; Zhou, Y. Zinc ions modified InP quantum dots for enhanced photocatalytic hydrogen evolution from hydrogen sulfide. J. Colloid Interface Sci. 2020, 573, 71–77. [Google Scholar] [CrossRef]
  22. Liu, Y.; Zhou, Y.; Abdellah, M.; Lin, W.; Meng, J.; Zhao, Q.; Yu, S.; Xie, Z.; Pan, Q.; Zhang, F.; et al. Inorganic ligands-mediated hole attraction and surface structural reorganization in InP/ZnS QD photocatalysts studied via ultrafast visible and midinfrared spectroscopies. Sci. China Mater. 2022, 65, 2529–2539. [Google Scholar] [CrossRef]
  23. Bang, J.; Das, S.; Yu, E.J.; Kim, K.; Lim, H.; Kim, S.; Hong, J.W. Controlled Photoinduced Electron Transfer from InP/ZnS Quantum Dots through Cu Doping: A New Prototype for the Visible-Light Photocatalytic Hydrogen Evolution Reaction. Nano Lett. 2020, 20, 6263–6271. [Google Scholar] [CrossRef]
  24. Zhao, H.; Li, X.; Cai, M.; Liu, C.; You, Y.; Wang, R.; Channa, A.I.; Lin, F.; Huo, D.; Xu, G.; et al. Role of Copper Doping in Heavy Metal-Free InP/ZnSe Core/Shell Quantum Dots for Highly Efficient and Stable Photoelectrochemical Cell. Adv. Energy Mater. 2021, 11, 2101230. [Google Scholar] [CrossRef]
  25. Han, M.; Zhu, S.; Lu, S.; Song, Y.; Feng, T.; Tao, S.; Liu, J.; Yang, B. Recent progress on the photocatalysis of carbon dots: Classification, mechanism and applications. Nano Today 2018, 19, 201–218. [Google Scholar] [CrossRef]
  26. Wang, X.; Jiang, H.; Zhu, M.; Shi, X. Cascaded electron transition proved by femto-second transient absorption spectroscopy for enhanced photocatalysis hydrogen generation. Chin. Chem. Lett. 2023, 34, 107683. [Google Scholar] [CrossRef]
  27. Travlou, N.A.; Giannakoudakis, D.A.; Algarra, M.; Labella, A.M.; Rodríguez-Castellón, E.; Bandosz, T.J. S- and N-doped carbon quantum dots: Surface chemistry dependent antibacterial activity. Carbon 2018, 135, 104–111. [Google Scholar] [CrossRef]
  28. Wang, Y.; Liu, X.; Liu, J.; Han, B.; Hu, X.; Yang, F.; Xu, Z.; Li, Y.; Jia, S.; Li, Z.; et al. Carbon Quantum Dot Implanted Graphite Carbon Nitride Nanotubes: Excellent Charge Separation and Enhanced Photocatalytic Hydrogen Evolution. Angew. Chem. Int. Ed. 2018, 57, 5765–5771. [Google Scholar] [CrossRef]
  29. Wang, B.; Deng, Z.; Fu, X.; Li, Z. MoS2/CQDs obtained by photoreduction for assembly of a ternary MoS2/CQDs/ZnIn2S4 nanocomposite for efficient photocatalytic hydrogen evolution under visible light. J. Mater. Chem. A 2018, 6, 19735–19742. [Google Scholar] [CrossRef]
  30. Lu, K.Q.; Quan, Q.; Zhang, N.; Xu, Y.J. Multifarious roles of carbon quantum dots in heterogeneous photocatalysis. J. Energy Chem. 2016, 25, 927–935. [Google Scholar] [CrossRef]
  31. Yu, H.; Shi, R.; Zhao, Y.; Waterhouse, G.I.N.; Wu, L.Z.; Tung, C.H.; Zhang, T. Smart Utilization of Carbon Dots in Semiconductor Photocatalysis. Adv. Mater. 2016, 28, 9454–9477. [Google Scholar] [CrossRef]
  32. Wang, Y.; Godin, R.; Durrant, J.R.; Tang, J. Efficient Hole Trapping in Carbon Dot/Oxygen-Modified Carbon Nitride Heterojunction Photocatalysts for Enhanced Methanol Production from CO2 under Neutral Conditions. Angew. Chem. Int. Ed. 2021, 60, 20811–20816. [Google Scholar] [CrossRef] [PubMed]
  33. Xia, J.; Di, J.; Li, H.; Xu, H.; Li, H.; Guo, S. Ionic liquid-induced strategy for carbon quantum dots/BiOX (X = Br, Cl) hybrid nanosheets with superior visible light-driven photocatalysis. Appl. Catal. B 2016, 181, 260–269. [Google Scholar] [CrossRef]
  34. Choi, Y.; Ryu, G.H.; Min, S.H.; Lee, B.R.; Song, M.H.; Lee, Z.; Kim, B.S. Interface-Controlled Synthesis of Heterodimeric Silver–Carbon Nanoparticles Derived from Polysaccharides. ACS Nano 2014, 8, 11377–11385. [Google Scholar] [CrossRef] [PubMed]
  35. Panzer, R.; Guhrenz, C.; Haubold, D.; Hübner, R.; Gaponik, N.; Eychmüller, A.; Weigand, J.J. Versatile Tri(pyrazolyl)phosphanes as Phosphorus Precursors for the Synthesis of Highly Emitting InP/ZnS Quantum Dots. Angew. Chem. Int. Ed. 2017, 56, 14737–14742. [Google Scholar] [CrossRef] [PubMed]
  36. Li, Y.; Pu, C.; Peng, X. Surface activation of colloidal indium phosphide nanocrystals. Nano Res. 2017, 10, 941–958. [Google Scholar] [CrossRef]
  37. Yadav, R.; Kwon, Y.; Rivaux, C.; Saint-Pierre, C.; Ling, W.L.; Reiss, P. Narrow Near-Infrared Emission from InP QDs Synthesized with Indium(I) Halides and Aminophosphine. J. Am. Chem. Soc. 2023, 145, 5970–5981. [Google Scholar] [CrossRef]
  38. Sul, Y.; Ezati, P.; Rhim, J.W. Preparation of chitosan/gelatin-based functional films integrated with carbon dots from banana peel for active packaging application. Int. J. Biol. Macromol. 2023, 246, 125600. [Google Scholar] [CrossRef]
  39. Li, L.; Wu, G.; Yang, G.; Peng, J.; Zhao, J.; Zhu, J.J. Focusing on luminescent graphene quantum dots: Current status and future perspectives. Nanoscale 2013, 5, 4015–4039. [Google Scholar] [CrossRef] [PubMed]
  40. Liu, X.; Pang, J.; Xu, F.; Zhang, X. Simple Approach to Synthesize Amino-Functionalized Carbon Dots by Carbonization of Chitosan. Sci. Rep. 2016, 6, 31100. [Google Scholar] [CrossRef]
  41. Virieux, H.; Le Troedec, M.; Cros-Gagneux, A.; Ojo, W.-S.; Delpech, F.; Nayral, C.; Martinez, H.; Chaudret, B. InP/ZnS Nanocrystals: Coupling NMR and XPS for Fine Surface and Interface Description. J. Am. Chem. Soc. 2012, 134, 19701–19708. [Google Scholar] [CrossRef] [PubMed]
  42. Tessier, M.D.; Dupont, D.; De Nolf, K.; De Roo, J.; Hens, Z. Economic and Size-Tunable Synthesis of InP/ZnE (E = S, Se) Colloidal Quantum Dots. Chem. Mater. 2015, 27, 4893–4898. [Google Scholar] [CrossRef]
  43. Huang, K.; Demadrille, R.; Silly, M.G.; Sirotti, F.; Reiss, P.; Renault, O. Internal Structure of InP/ZnS Nanocrystals Unraveled by High-Resolution Soft X-ray Photoelectron Spectroscopy. ACS Nano 2010, 4, 4799–4805. [Google Scholar] [CrossRef]
  44. Shim, H.S.; Ko, M.; Nam, S.; Oh, J.H.; Jeong, S.; Yang, Y.; Park, S.M.; Do, Y.R.; Song, J.K. InP/ZnSeS/ZnS Quantum Dots with High Quantum Yield and Color Purity for Display Devices. ACS Appl. Nano Mater. 2023, 6, 1285–1294. [Google Scholar] [CrossRef]
  45. Zhan, J.; Peng, R.; Wei, S.; Chen, J.; Peng, X.; Xiao, B. Ethanol-Precipitation-Assisted Highly Efficient Synthesis of Nitrogen-Doped Carbon Quantum Dots from Chitosan. ACS Omega 2019, 4, 22574–22580. [Google Scholar] [CrossRef]
  46. Yang, W.D.; Wang, P.N.; Li, F.M.; Cheah, K.W. Synthesis of oxygen-free nanosized InN by pulse discharge. Nanotechnology 2002, 13, 65. [Google Scholar] [CrossRef]
  47. Reiss, P.; Carriere, M.; Lincheneau, C.; Vaure, L.; Tamang, S. Synthesis of Semiconductor Nanocrystals, Focusing on Nontoxic and Earth-Abundant Materials. Chem. Rev. 2016, 116, 10731–10819. [Google Scholar] [CrossRef]
  48. Won, Y.H.; Cho, O.; Kim, T.; Chung, D.Y.; Kim, T.; Chung, H.; Jang, H.; Lee, J.; Kim, D.; Jang, E. Highly efficient and stable InP/ZnSe/ZnS quantum dot light-emitting diodes. Nature 2019, 575, 634–638. [Google Scholar] [CrossRef]
  49. Cros-Gagneux, A.; Delpech, F.; Nayral, C.; Cornejo, A.; Coppel, Y.; Chaudret, B. Surface Chemistry of InP Quantum Dots: A Comprehensive Study. J. Am. Chem. Soc. 2010, 132, 18147–18157. [Google Scholar] [CrossRef]
  50. Ran, J.; Zhang, J.; Yu, J.; Jaroniec, M.; Qiao, S.Z. Earth-abundant cocatalysts for semiconductor-based photocatalytic water splitting. Chem. Soc. Rev. 2014, 43, 7787–7812. [Google Scholar] [CrossRef]
  51. Tamang, S.; Lincheneau, C.; Hermans, Y.; Jeong, S.; Reiss, P. Chemistry of InP Nanocrystal Syntheses. Chem. Mater. 2016, 28, 2491–2506. [Google Scholar] [CrossRef]
  52. Li, F.; Liu, Y.; Mao, B.; Li, L.; Huang, H.; Zhang, D.; Dong, W.; Kang, Z.; Shi, W. Carbon-dots-mediated highly efficient hole transfer in I-III-VI quantum dots for photocatalytic hydrogen production. Appl. Catal. B 2021, 292, 120154. [Google Scholar] [CrossRef]
  53. Luo, B.; Pu, Y.C.; Yang, Y.; Lindley, S.A.; Abdelmageed, G.; Ashry, H.; Li, Y.; Li, X.; Zhang, J.Z. Synthesis, Optical Properties, and Exciton Dynamics of Organolead Bromide Perovskite Nanocrystals. J. Phys. Chem. C 2015, 119, 26672–26682. [Google Scholar] [CrossRef]
  54. Dan, M.; Xiang, J.; Yang, J.; Wu, F.; Han, C.; Zhong, Y.; Zheng, K.; Yu, S.; Zhou, Y. Beyond hydrogen production: Solar−driven H2S−donating value−added chemical production over MnxCd1−xS/CdyMn1−yS catalyst. Appl. Catal. B 2021, 284, 119706. [Google Scholar] [CrossRef]
  55. Qu, X.; Gao, C.; Fu, L.; Chu, Y.; Wang, J.H.; Qiu, H.; Chen, J. Positively Charged Carbon Dots with Antibacterial and Antioxidant Dual Activities for Promoting Infected Wound Healing. ACS Appl. Mater. Interfaces 2023, 15, 18608–18619. [Google Scholar] [CrossRef] [PubMed]
  56. Yu, S.; Wu, F.; Zou, P.; Fan, X.-B.; Duan, C.; Dan, M.; Xie, Z.; Zhang, Q.; Zhang, F.; Zheng, H. Highly value-added utilization of H2S in Na2SO3 solution over Ca–CdS nanocrystal photocatalysts. Chem. Commun. 2020, 56, 14227–14230. [Google Scholar] [CrossRef] [PubMed]
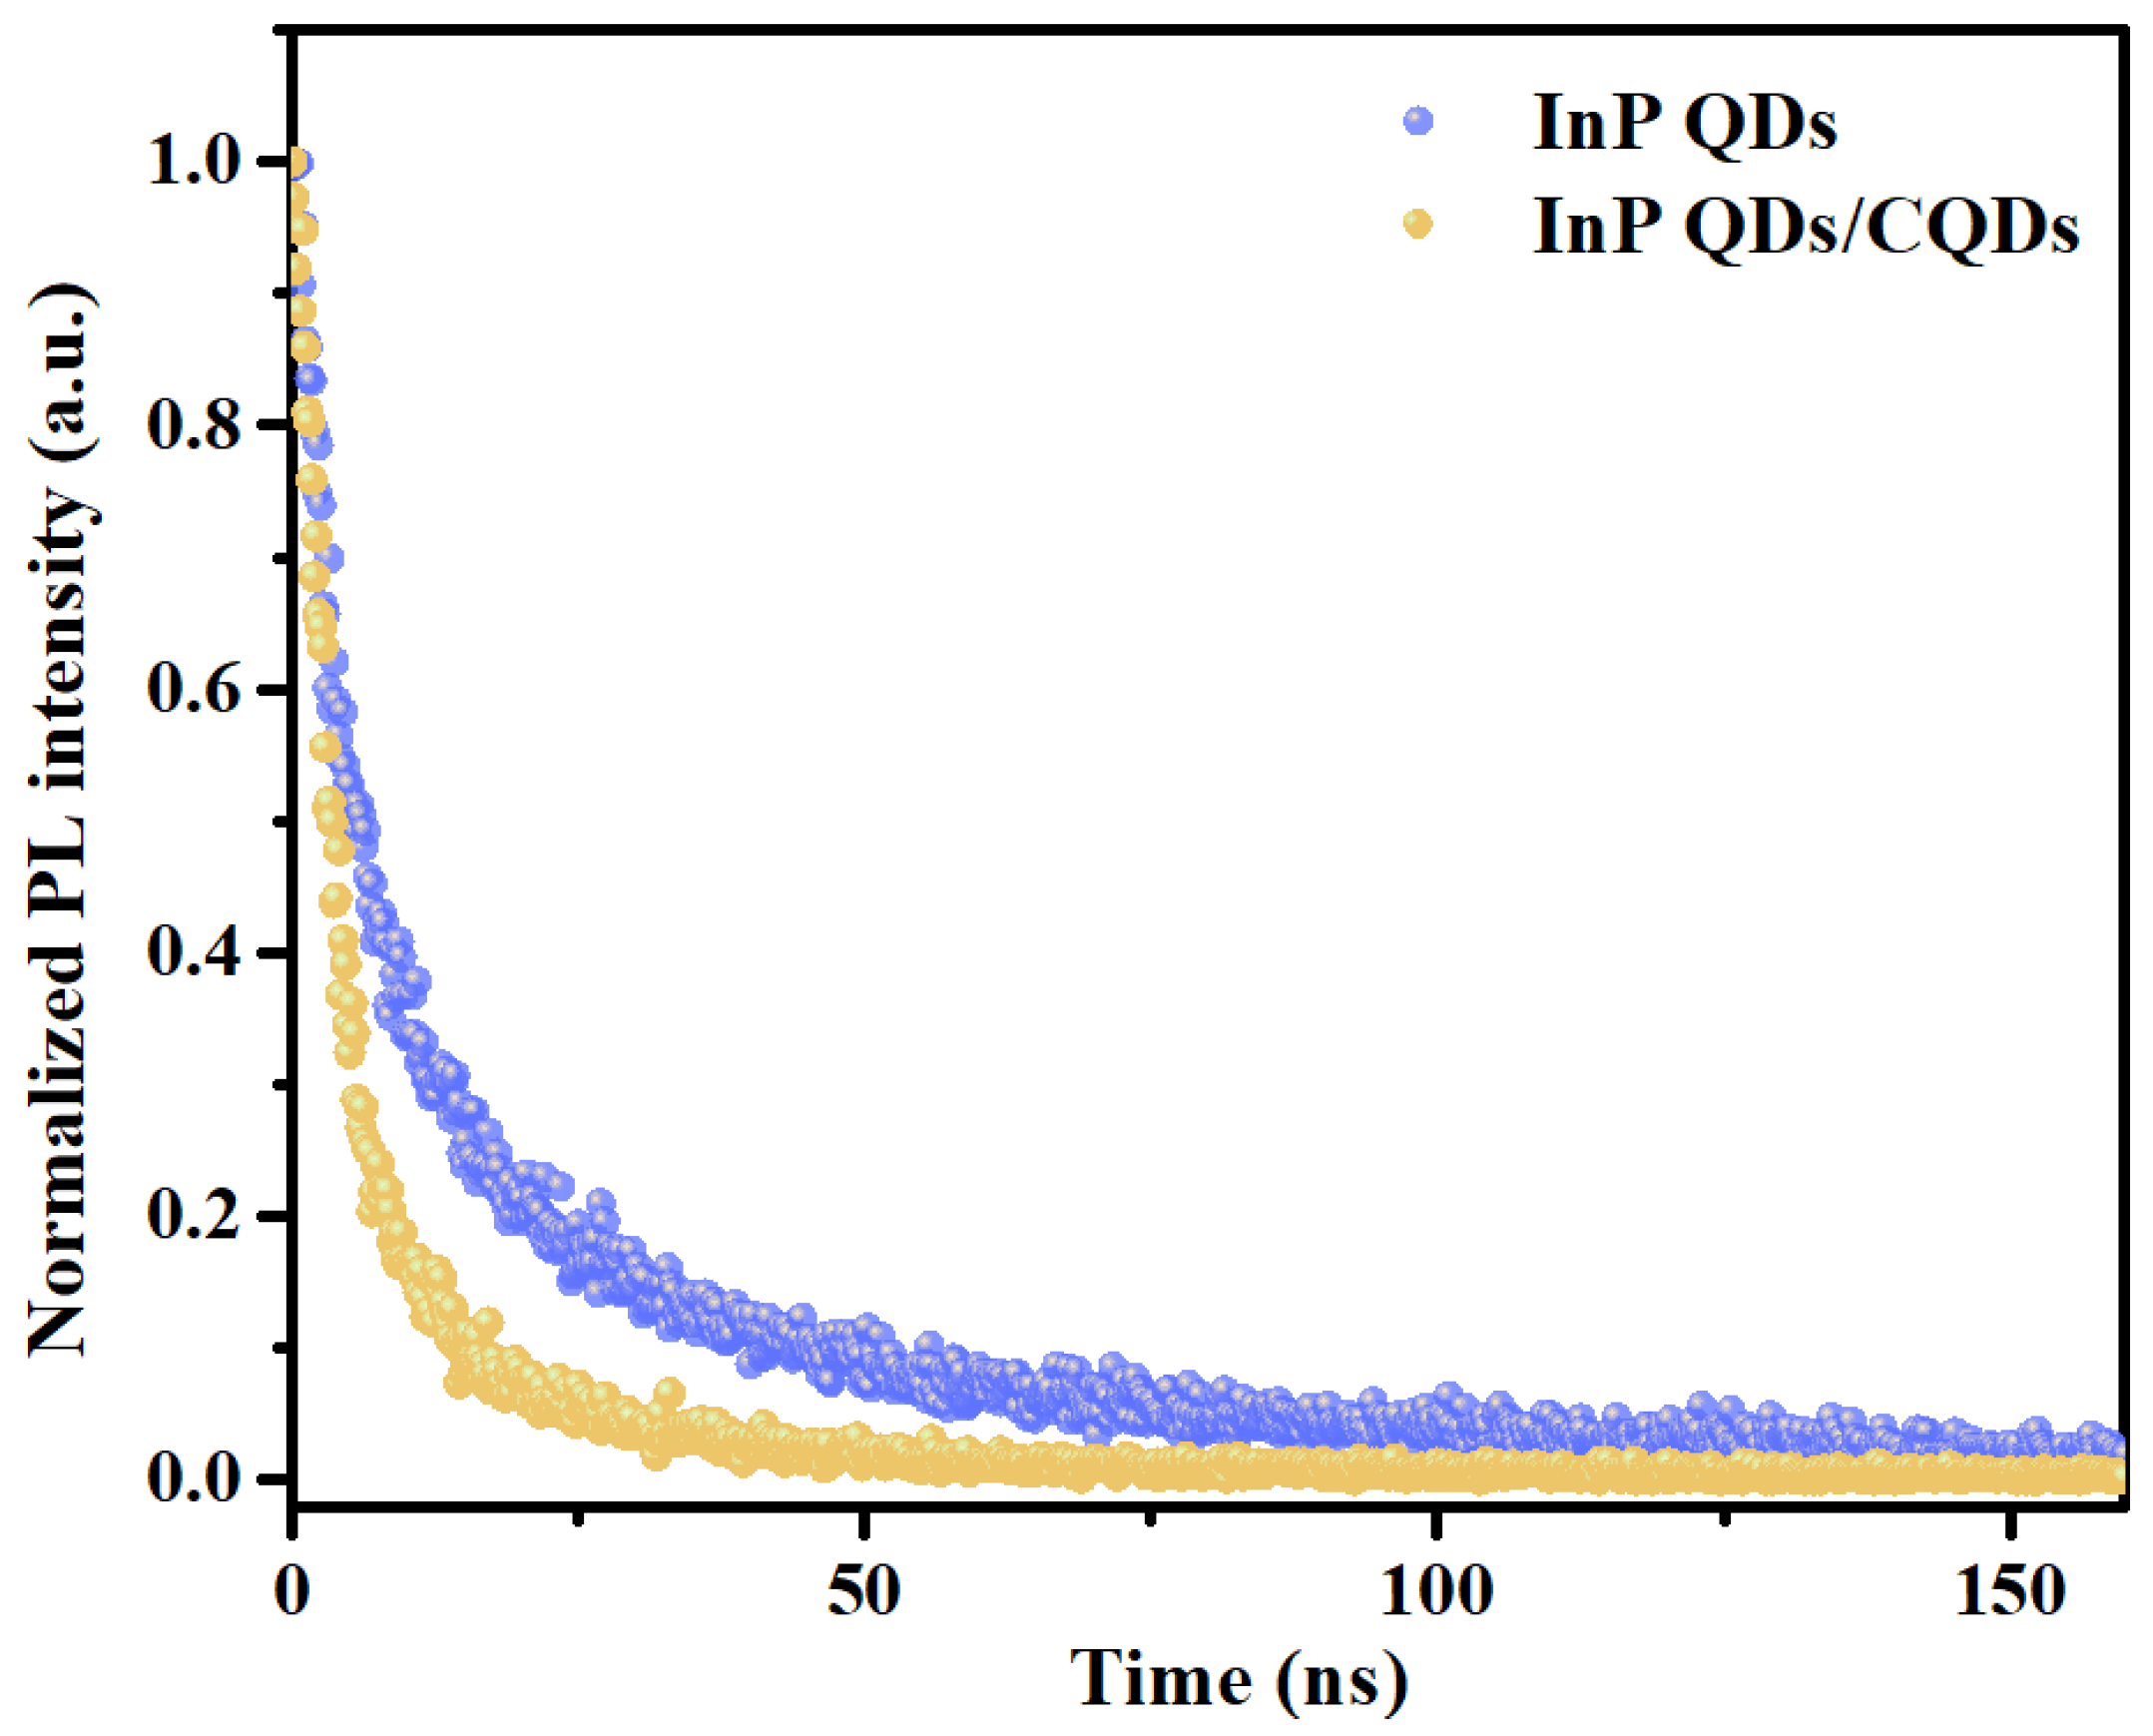
Figure 1. Characterization results of InP QDs and CQDs. XRD patterns of (a) InP QDs, (b) CQDs and (c) InP QDs/CQDs system. (d) UV–Vis spectrum of InP QDs and CQDs. TEM images of (e) InP QDs and (f) CQDs.
Processes 11 03160 g001
Figure 2. XPS fine spectra of InP QDs/CQDs system. (a) In 3d; (b) P 2p; (c) S 2p; (d) C 1s; (e) O 1s; (f) N 1s.
Processes 11 03160 g002
Figure 3. The results of photocatalytic hydrogen production from H2S. (a) Photocatalytic hydrogen production of InP QDs/CQDs system with different loading amount of CQDs. (b) Long-time photocatalytic hydrogen production of InP QDs/CQDs system. Photocatalytic reaction condition: 5 mL 0.6 M Na2SO3-H2S solution with InP QDs/CQDs system illuminated by LED light (λ = 460 nm); 1 mL 0.6 M Na2SO3 solution was additionally injected into the reaction system after 5 h of illumination in (b).
Processes 11 03160 g003
Figure 4. PL spectrum of the InP QDs and InP QDs/CQDs system.
Processes 11 03160 g004
Figure 5. TRPL of InP QDs and InP QDs/CQDs system.
Processes 11 03160 g005
Figure 6. Zeta potential of all samples.
Processes 11 03160 g006
Figure 7. The schematic mechanism for the photocatalytic hydrogen production of InP QDs/CQDs system.
Processes 11 03160 g007
Table 1. The photoluminescence decay lifetime fitting results of InP QDs and InP QDs/CQDs system.
Sampleτ1 (ns)τ2 (ns)A1A2τav (ns)
InP QDs4.733.30.670.3326.9
InP QDs/CQDs3.927.70.880.1215.6
Disclaimer/Publisher’s Note: The statements, opinions and data contained in all publications are solely those of the individual author(s) and contributor(s) and not of MDPI and/or the editor(s). MDPI and/or the editor(s) disclaim responsibility for any injury to people or property resulting from any ideas, methods, instructions or products referred to in the content.

