Article

CFD Numerical Simulation Study Based on Plunger Air Lift

1
School of Mechanical Engineering, Yangtze University, Jingzhou 434023, China
2
Key Laboratory of Production Engineering for Oil and Gas (CNPC), Yangtze University, Wuhan 430100, China
3
Wuxi Lishen New Energy Technology Co., Ltd., Wuxi 214125, China
*
Author to whom correspondence should be addressed.
Processes 2023, 11(11), 3103; https://doi.org/10.3390/pr11113103
Submission received: 28 September 2023 / Revised: 22 October 2023 / Accepted: 25 October 2023 / Published: 29 October 2023
(This article belongs to the Topic Multi-Phase Flow and Unconventional Oil/Gas Development)

Abstract

:
To study the movement law of a plunger air lift and liquid discharge efficiency, this paper observes the plunger movement and leakage through indoor experiments, based on which the CFD method is applied to establish a numerical model with the same experimental conditions, and compares the simulation results with the experiments, verifies the feasibility of the CFD simulation, and optimizes the structure of the plunger, and researches the change rule of the bottom-hole pressure and the wellhead pressure in a 200 m long wellbore. The results show that the error between CFD simulation and experimental data is 12.5%. When the depth of the plunger groove is 10 mm, the width of each groove is 10 mm, and the number of grooves is 12, the leakage is minimal; in addition, to ensure the smooth lifting of the plunger, it is necessary to control the wellhead pressure and keep the pressure difference with the bottom of the well. When the wellbore pressure is 10 MPa, the wellhead pressure should be no more than 7 MPa, and when the wellbore–wellhead pressure difference is kept at a certain level (7 MP), the plunger cannot continue to move up when the wellhead pressure is more than 18 MP, so it is necessary to control the wellbore pressure as it cannot be too big and increase the wellbore–wellhead pressure difference as much as possible. The above study of the plunger lifting law provides a reference basis for the determination of the above research plunger process parameters.

1. Introduction

With the continuous development and production of oil and gas fields, the formation pressure and production capacity of the oil and gas fields to which the gas wells belong are gradually decreasing, which makes the bottom-hole fluid accumulation of the gas wells more and more serious. Due to the increasing severity of wellbore fluid accumulation, the production efficiency of natural gas is reduced, which ultimately leads to the shutdown of gas wells. Since the plunger drainage technology can effectively reduce the liquid leakage and gas flow, the plunger drainage technology is widely used at home and abroad. Plunger drainage technology uses the plunger as a solid interface between the gas below the bottom of the well and the liquid above it, and to lift the liquid to the surface by pushing the plunger through the gas energy in the formation of the gas well, and then drain the liquid from the bottom of the well. So far, many researchers have studied the plunger gas-lift process technology. White et al. [1] conducted a comparison experiment between plunger gas-lift and conventional gas-lift to study the gas-lift production with and without a plunger, and found that the plunger can effectively reduce the slippage loss and improve the efficiency of the gas lift. FOSS and Gau et al. [2,3] summarized the characteristics of the plunger motion under the action of different conditions and further put forward a hydrostatic research method of plunger motion. J.F. lea et al. [4,5] analyzed the force on the plunger lifting process and, at the same time, believed that the upward velocity of the plunger varied with time, based on which the dynamic model of the plunger motion process was proposed for the first time. However, its research is also limited, not considering the existence of liquid leakage from the upper part of the plunger, and at the same time, the research on the motion of the plunger in another cycle is not perfect enough. D. Sask et al. [6,7] and others found that the overall lifting and draining efficiency of the rodlike plunger was the highest by studying the different types of plungers as the experimental variables and then found that the overall lifting and draining efficiency of the rod plunger was the highest. Cao Yinping et al. [8,9] designed a set of plunger air-lifting experimental devices according to the actual situation of the air-lifting site, analyzed several variables such as plunger movement speed, rising height, and well inclination angle change, and found their influence on the efficiency of plunger air-lifting work. Liu Chunlu et al. [10,11] designed a split-plunger structure and concluded that the inclined ladder-type slot had the best drainage flow. Neil Longfellow et al. [12] simulated the lifting process of horizontal good plunger air lift by CFD technology, comparing the movement speed and drainage flow of a conventional rod plunger and a conventional liner-type plunger. The results with the actual test show that the error of the CFD simulation results is within 8%, which proves the reliability of the CFD simulation. Li Yingchuan et al. [13,14], who used FLUENT software, carried out a numerical simulation of the plunger lifting process and mainly investigated the regional changes of the flow field in the gap between the plunger and the inner wall of the oil pipe. Wang Xi et al. [15] used CFD technology for the tiny gap generated between the plunger and the pipe wall. The corresponding simulation was carried out, and the velocity and pressure flow field changes in the gap between the plunger and the pipe wall were observed. Li Li et al. [16] simulated the plunger lifting process and observed the flow patterns and velocity and pressure flow field changes of the gas and liquid phases in its tubing. Zhou Qingqiang et al. [17] designed an adaptive plunger structure, focusing on the change rule of velocity during plunger movement. Feng Xiaoya. [18] established a lifting model of plunger air-lifting, analyzed the impact of liquid leakage on the lifting efficiency of the plunger air-lifting process, and optimized the design of the plunger air-lifting working system. Shi Haowen et al. [19] studied the liquid leakage model of a rod plunger gas lift and established a mathematical model of gas-lift liquid leakage. Zhang Jinglong et al. [20] used CFD technology to study the plunger liquid discharge mechanism and operation law and concluded that the overall operation time of the plunger can be estimated based on the average speed of the plunger. Miao Shiyu et al. [21] established a kinetic model of plunger lifting to improve the average production of sample wells.
In summary, nowadays, many scholars have conducted indoor experiments on the plunger air lift, and many scholars have investigated the law of motion of the plunger air lift and its leakage model. Many scholars have not used experiments to verify the accuracy of CFD simulations to directly use numerical simulations to optimize the plunger structure. Moreover, due to the limitation of the experimental site, it is impossible to simulate the real length of the wellbore in indoor experiments, which leads to a big gap between the experimental results and the field results. Therefore, this paper combines indoor experiments with CFD simulation to verify the accuracy of CFD simulation through indoor experiments and then solve the site and cost limitations of indoor experiments through CFD simulation. It is more convenient to study the movement law and draining flow efficiency of different plunger structures, intuitively obtain the actual velocity and pressure distribution under the wellbore and the actual drainage flow, and reduce the drainage flow according to the simulation results. In this paper, the dynamic experiment of a plunger air lift was carried out indoors first, and the relationship between the average speed of plunger movement and the drainage flow was obtained. Then, CFD numerical simulation is carried out according to the specific parameters of the experiment, and the numerical simulation results are compared with the experimental results to verify the feasibility of CFD simulation. Next, the numerical simulation technique using CFD dynamic grid is used to reduce the drainage flow in the plunger upstroke from the plunger slotted depth, slotted width, and number of slots. For the problem of inaccurate experimental results due to the short length of the indoor experimental rig, the CFD dynamic grid is used to analyze the flow field inside the 200 m long wellbore to obtain the comprehensive rules of the plunger movement under the actual wellbore, which is of certain guiding significance for the application of the plunger air-lift field process.

2. Research Content and Methodology

2.1. Indoor Simulation Experiment and Result Analysis

2.1.1. Experimental Equipment and Methods

The experiments were carried out on a plunger lift dynamic simulation rig (Figure 1), which uses a 13 m high U-tube to simulate the actual wellbore, a transparent tube on the left side of the U-tube to simulate the tubing and a plunger lift channel inside the left transparent tube, and a steel tube on the right side of the U-tube to simulate the casing, which can simulate the source of pressure in the casing annulus. The casing and tubing are fixed in a U-shape on top of the bench, and the transparent tubing made of Plexiglas allows real-time observation of the up-and-down movement of the plunger inside the tubing and the flow pattern of the internal fluid flow. Sensors at the top and bottom of the bench can accurately measure the pressure, speed, and the amount of fluid discharged during the experiment. The rig can be used for multiphase flow experiments and plunger leakage experiments under different operating conditions.
Indoor experiment simulation: record the change rule of plunger speed and drainage flow, use CFD simulation software to simulate the experimental conditions, compare the simulation data with the experimental data, and study the change in plunger average speed and drainage flow.

2.1.2. Analysis of Experimental Results

From the plunger experiment, it was found that the lifting motion of the plunger is mainly related to the air inlet (which determines the pressure of lifting the plunger) and the liquid inlet (which determines the height and weight of the liquid column on the upper part of the plunger). When the air inlet is small, the pressure at the bottom of the tubing is low, and the plunger cannot be lifted to the wellhead, with the result that the upper part of the liquid cannot be discharged but will gradually leak back to the bottom of the well, and the effect of the plunger air-lifting at this time is poor. When the air inlet is large, the pressure at the bottom of the tubing is large, which causes the plunger to be lifted higher until it reaches the wellhead and discharges the liquid, which increases the efficiency of the lifting. At the same time, the size of the liquid inlet will also affect the plunger lifting efficiency. When the feed volume is larger, the upper liquid column of the plunger is higher, and the plunger can lift more liquid to discharge, but the lifting pressure needs to be higher at this time; when the feed volume is smaller, the plunger can discharge the liquid faster, but the amount of liquid discharged is smaller, and the lifting efficiency is lower.
The average speed vm is the average speed of the plunger in the speed measurement section. The theoretical drained flow is the mass of the static liquid column above the plunger before lifting, and the drainage flow is the difference between the theoretical and actual drained flow. It can be seen that when the flow pressure is 199.77~632.93 kPa, the average velocity of the plunger ranges from 7.74 to 22.5 m/s, and the leakage flow rate increases approximately linearly with the increase in the velocity (as shown in Figure 2).

2.2. Plunger Lift Numerical Simulation

2.2.1. Gas–Liquid Multiphase Flow Models

(1)
Mixture model
The gas–liquid lifting process belongs to multiphase flow motion, due to the existence of gas–liquid mixing caused by the leakage in the gas–liquid lifting process; therefore, the mixture model of gas–liquid wide distribution is considered.
  • continuity equation
t ( ρ m ) + · ( ρ m v m ) = 0
where v m is the mass-averaged velocity,
v m = k = 1 n α k ρ k v k ρ m
ρ m is a mixed density,
ρ m = k = 1 n α k ρ k
α k is the volume fraction of the kth phase.
  • momentum equation
The momentum equation of the mixture model can be obtained by summing the momentum equations of all the phase-respective ones, denoted as
t ( ρ m v m ) + · ( ρ m v m v m ) = p + · [ μ m ( v m + v T m ) ] + ρ m g + F + · ( k = 1 n α k ρ k v d r , k v d r , k )
where n is the number of phases; F is the volume force; μ m is the mixing viscosity.
μ m = k = 1 n α k μ k
v d r , k is the drift velocity of the second phase   k .
v d r , k = v k v m
  • energy equation
t ( k = 1 n α k ρ k E k ) + · ( k = 1 n α k v k ( ρ k E k + p ) ) = · [ k e f f T ) + S E
where k e f f is the effective thermal conductivity. The first term to the right of the equal sign represents the amount of heat conducted; S E All volumetric heat sources are included; E k is the value of the equation
E k = h k p ρ k + ρ k 2 2
where h k is the enthalpy.
  • Relative and drift speeds
Define the relative velocity as the velocity of the second phase p with respect to the main phase q ,
v q p = v p v q
Slip velocity and relative velocity are related as follows:
v d r , p = v q p k = 1 n α k ρ k ρ m v q k
The mixture model generally uses an algebraic slip for emulation,
v q p = τ q p a
Here, a is the acceleration of the second phase particle and is the relaxation time of the particle,
τ q p = ( ρ m ρ p ) d p 2 18 μ q f d r a g
where is the diameter of the second phase particles (or droplets, bubbles), the Drag function f d r a g is calculated as,
f d r a g = 1 + 0.15 Re 0.687   Re 1000 0.0183 Re R e > 1000
The acceleration is
a = g ( v m · ) v m v m t
(2)
Standard k–e model
When the flow is turbulent, the Standard k–e model is used. The Standard k–e model is a semi-empirical formulation based mainly on the turbulent kinetic energy k and diffusivity   ε . The k equation is exact and the e equation is derived from the empirical formulation [22].
(3)
Dynamic modeling of the upward phase of the plunger
Considering the friction between the plunger and the inner wall of the oil pipe and its weight, the liquid section at any moment t is taken as the control body, and it is also assumed that the liquid on the upper part of the plunger and the gas in the lower part move with the same speed as the plunger, and then by the law of momentum conservation, the dynamic model of the upward stage of the plunger can be obtained:
d d t c ν ρ v d V + c s ρ v ( v r ¯ · n ) d A = ( P x P s ) A z F l F z m z g
In the formula:
m z : Mass of the plunger and the upper liquid column, kg;
P x : Gas pressure on the lower face of the plunger, Pa;
P s : Gas pressure on the upper surface of the liquid column above the plunger, Pa;
A z : The cross-sectional area of the oil pipe, m2;
F l : Friction force on the liquid column above the plunger, N;
F z : Friction between the side of the plunger and the inner wall of the oil pipe, N.

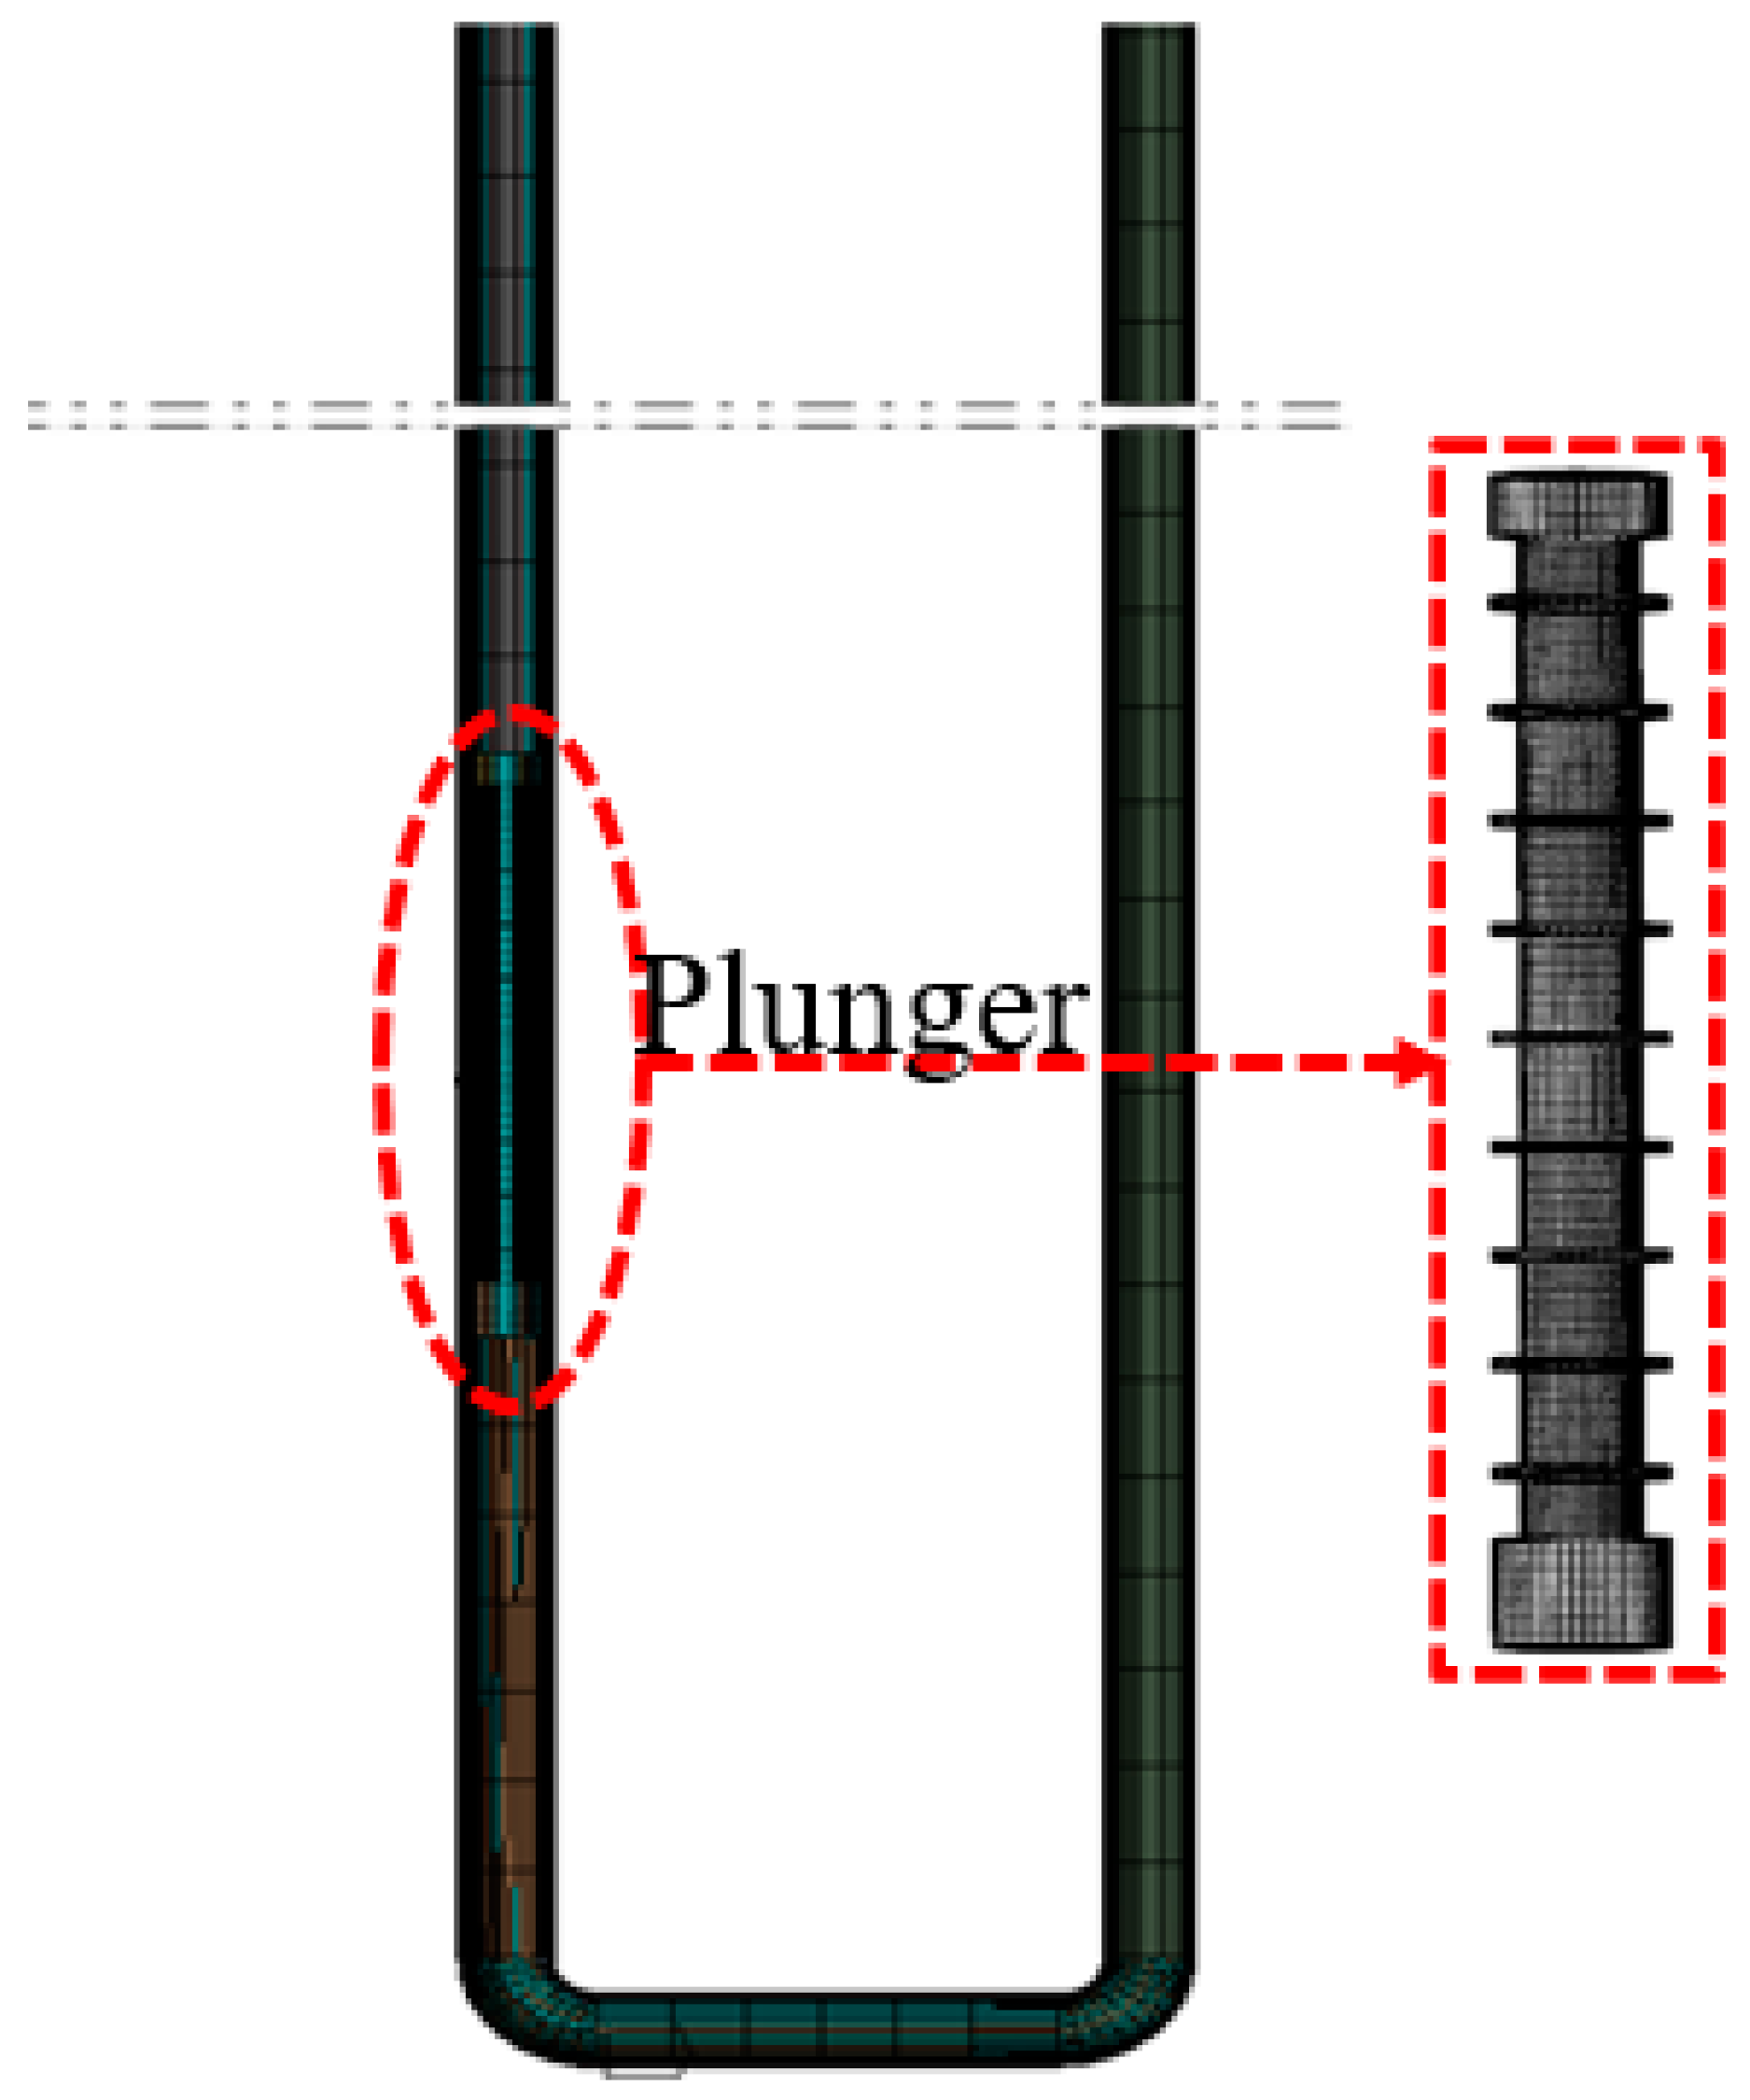
2.2.2. CFD model Building and Boundary Condition Determination

(1)
CFD modelling
According to the dimensions of the air-lift test rig, Solidworks software was used to build a “U-shaped” (the left side is the oil pipe, in which the plunger moves upward; the right side is the casing, which provides energy for the plunger and stores the data of the plunger’s velocity and force, etc.) three-dimensional model of the flow path (shown in Figure 3). A 62 mm inner diameter size of oil pipe was used to connect the simulated casing of 60 mm inner diameter to the U-shaped pipe, connected to a simulated casing with an inner diameter of 60 mm, an overall height of 10 m, and a rodlike plunger with an outer diameter of 58 mm, a length of 485 mm, and a mass of 4 kg.
The experiments are considered to test the process of lifting the plunger by relying on the energy storage in the closed wellbore space, removing the inlet air, and fluid shorting. Due to the complexity of the flow around the plunger, a hexahedral mesh needs to be used for the delineation to improve the mesh quality, and five layers of mesh encryption are arranged to capture the gap flow field at the gap between the plunger and the tubing, as shown in Figure 4. The number of cells after meshing is 811,460, the number of faces is 2,638,245, and the number of nodes is 909,378. The average orthogonal quality is 0.89, possessing good mesh quality.
In the numerical simulation of transients, mesh sensitivity verification is required to ensure that the number of meshes is not correlated with the final calculation results. In this simulation, the main concern is the average velocity of the plunger and the drainage flow. Taking the flow pressure at the bottom of the well as 429.951 KPa, we need to draw six different numbers of grids and compare the average plunger velocity and drainage flow under the five models to determine whether the grids are irrelevant or not.
From Figure 5, it can be seen that when the number of meshes is greater than 811,460, the average velocity of the plunger and the drainage flow change region is smooth and the error is less than 1%, and the number of meshes (811,460) meets the requirements of mesh sensitivity, so the number of meshes (811,460) is selected as the calculation grid.
(2)
Boundary condition determination
Considering the gas–liquid mixing caused by the leakage during the plunger lifting process, the transient simulation is carried out using the “Mixture+Standard k-e“ multiphase turbulence model. This is a multiphase turbulence model for transient simulation, using the finite control body method to discretize the set of multiphase turbulence control equations, adopting the pressure term in PRESTO! format to adapt to the characteristics of the large differences in the flow field of each phase, and the other terms in the central difference format, and adopting the semi-implicit algorithm SIMPLE suitable for the non-constant computation for the iterative solution, and choosing the First-Order Upwind for the terms of the turbulence kinetic energy and the turbulence energy dissipation rate. The first-order upwind format is chosen for both turbulent kinetic energy and turbulent energy dissipation rate terms. The time step is set to 10−4, and 200,000 steps are computed. The computation is considered to have converged when the maximum residual is less than 10−5.
Set the main phase as the ideal gas and the second item as water. Set the bottom of the well as inlet, the pressure inlet; the mouth of the well as outlet, the pressure outlet (as shown in Figure 6); open the startup grid during the calculation, import the UDF code for calculating the movement of the plunger, and set up the movement of each surface. Part of the UDF code is shown below:
DEFINE_CG_MOTION(zhusai,dt,vel,omega,time,dtime)//plunger motion macro
{
................................................
fb=force_bottom[0];
ft = force_top[0];
fc = force_cylinder[0];
total_force = fb + fc + ft; //fluid force on the plunger
dv = dtime*(total_force-mass*9.8)/mass; //mass -- plunger mass, kg
velocity+=dv;
................................................
}

2.2.3. CFD Simulation Reliability Verification

(1)
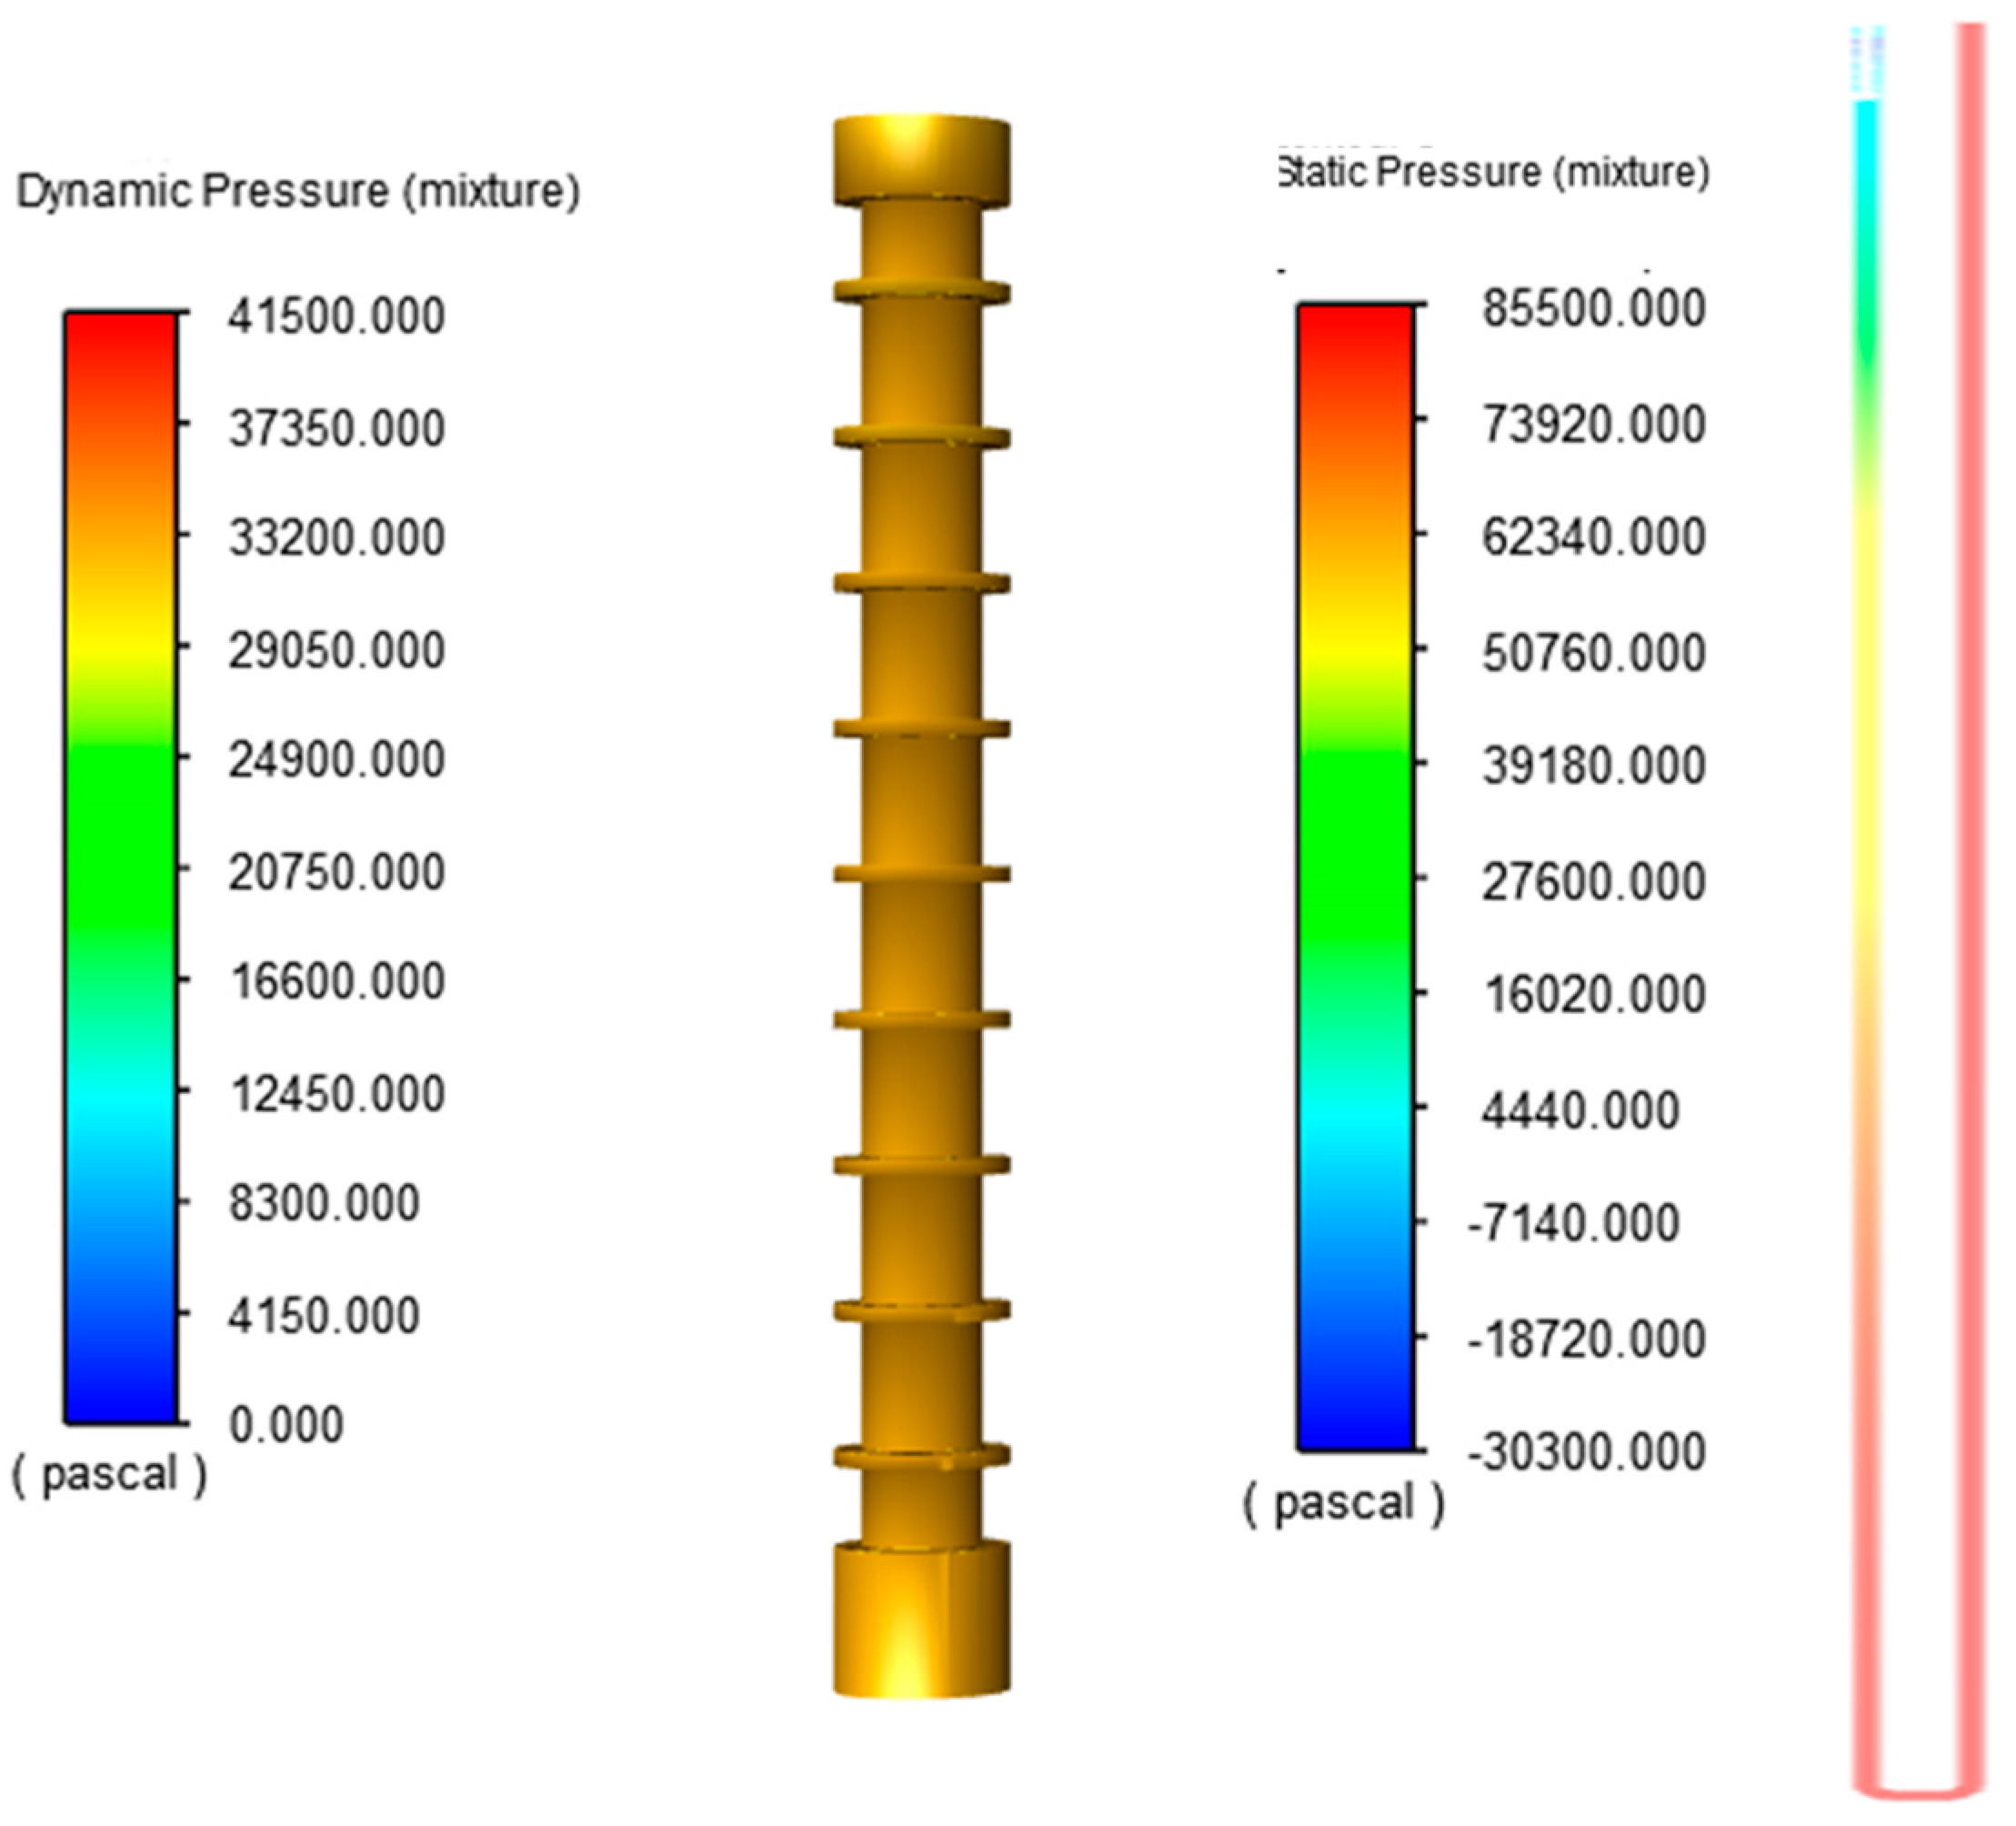
Analysis of the flow field inside the plunger movement
According to the cloud diagram of the distribution of the plunger pressure and velocity flow field shown in Figure 7 and Figure 8, there is a pressure difference between the upper and lower ends of the plunger, which pushes the plunger to lift up, and the law that the plunger velocity increases rapidly and then decreases slowly is also found. This is because in the initial stage of the plunger upstream, the gas well releases the blowout, and the bottom pressure pushes the plunger and its upper liquid to lift along the tubing; at this time, the resistance of the plunger is zero, so the plunger velocity quickly reaches the maximum value. As the plunger moves up, its resistance increases, causing its speed to decrease slowly.
The change in bottom-hole pressure and plunger discharge is shown in Figure 9 and Figure 10. With the outflow of gas and liquid, the bottom-hole pressure decreases significantly, and the bottom pressure decreases from the initial 0.43 MPa to 0.09 MPa. Since the height of the upper liquid column of the plunger is fixed, the plunger needs to move for some time, so that the liquid column reaches the wellhead, and at this time, the plunger starts to discharge, the amount of the discharged liquid rises sharply, and the plunger decreases after it reaches the wellhead. The mass of the upper column of the plunger is 7.996 kg, the amount of liquid discharged when the plunger reaches the wellhead is 7.644 kg, and the weight of liquid lost is 0.352 kg.
The simulation results of in-well pressure, plunger draining flow, and drainage flow under different bottom-hole flow pressures are shown in Figure 11 and Figure 12. With the increase in bottom-hole flow pressure, the average speed of plunger lifting increases, the time for the plunger to reach the wellhead is shortened, and the pressure in the well decreases in a “wave shape”. When the wellbore flow pressure is 202.21 KPa, the pressure is too small, and the time for the plunger to reach the wellhead is too long, which is twice as long as that of other pressures. Therefore, the liquid in the upper part of the plunger is leaking, and there is no change in the discharge flow rate.
(2)
Comparison of simulation results with experimental data
Since the experiment can only produce the average velocity, the average velocity of the plunger is used as the evaluation index; the plunger value when the flow pressure at the bottom of the well is 429.951 KPa is taken, and the comparison between the plunger experimental results and the simulation results is shown in Table 1.
As can be seen from Table 1, for the plunger lifting average speed, the error between the experimental data and the simulated data is 11.2%, which is more reliable. The error of drainage flow is 12.5%, so it is feasible to use CFD numerical simulation of the plunger air-lifting process.

3. Rodlike Plunger Slot Width Determination

In the previous section, the amount of leakage during the upward movement of the plunger is high, so the results of the rodlike plunger are considered to be optimized, to reduce the amount of leakage during the upward movement of the plunger. In the following section, the rodlike plunger is structurally optimized in terms of the depth of the groove on the outer wall of the plunger, the width of the groove and the number of the grooves, and the average speed and the amount of drainage flow of the rodlike plunger are compared with each other, to establish the optimal structure of the rodlike plunger.

3.1. Influence of Different Groove Depths in the Outer Wall of the Plunger on the Amount of Leakage

To ensure that the length of the plunger is 485 mm, the width of the outer wall groove and the number of parameters remain unchanged, in this case, change the depth of the outer wall groove of the plunger, the establishment of six different depths of the groove plunger three-dimensional model (as shown in Figure 13), the specific depth of the groove as shown in Table 2.
From the pressure cloud shown in Figure 14, the pressure at the lower part of the plunger is the maximum value, and in the upward flow, it is found that it decreases gradually over the gap between the plunger and the tubing, and decreases to the minimum when it is at the top of the upper part of the plunger. When the groove depth is 4 mm, the pressure of the lower part of the plunger is too small; when it is 6 mm, the pressure difference between the upper and lower ends is too small, both of which interfere weakly with the liquid flow, and improve the effect of leakage being poor. When the depth of the slot is 8 mm to 12 mm, the pressure difference between the upper and lower part of the plunger shows a trend of “increasing and then decreasing”. When the depth of the slot is 10 mm, the lower pressure of the plunger is the largest, and the upper and lower differential pressures are the largest, which is a strong interference with the liquid flow, and the turbulence effect is better, and the ability to prevent leakage is the best.
The velocity flow field plots obtained after numerical simulation of the plunger structure at different slot depths are shown in Figure 15. It can be seen from the figure that the velocity variation is small when comparing different plunger structures. However, the magnitude of plunger leakage is again related to the velocity of plunger movement. So, for the evaluation criteria of the plunger outer wall grooving depth on the effect of plunger leakage, the amount of leakage and speed of movement in the upward movement of the plunger are taken.
From Figure 16 and the pressure cloud analysis above, it is clear that under the condition of ensuring that the other parameters of the plunger remain unchanged, when the depth of the groove on the outer wall of the plunger is 10 mm, the least amount of leakage and the lowest speed of movement are found during the upward movement of the plunger, so at this time, the structure is improved and the best effect is achieved in reducing the leakage.

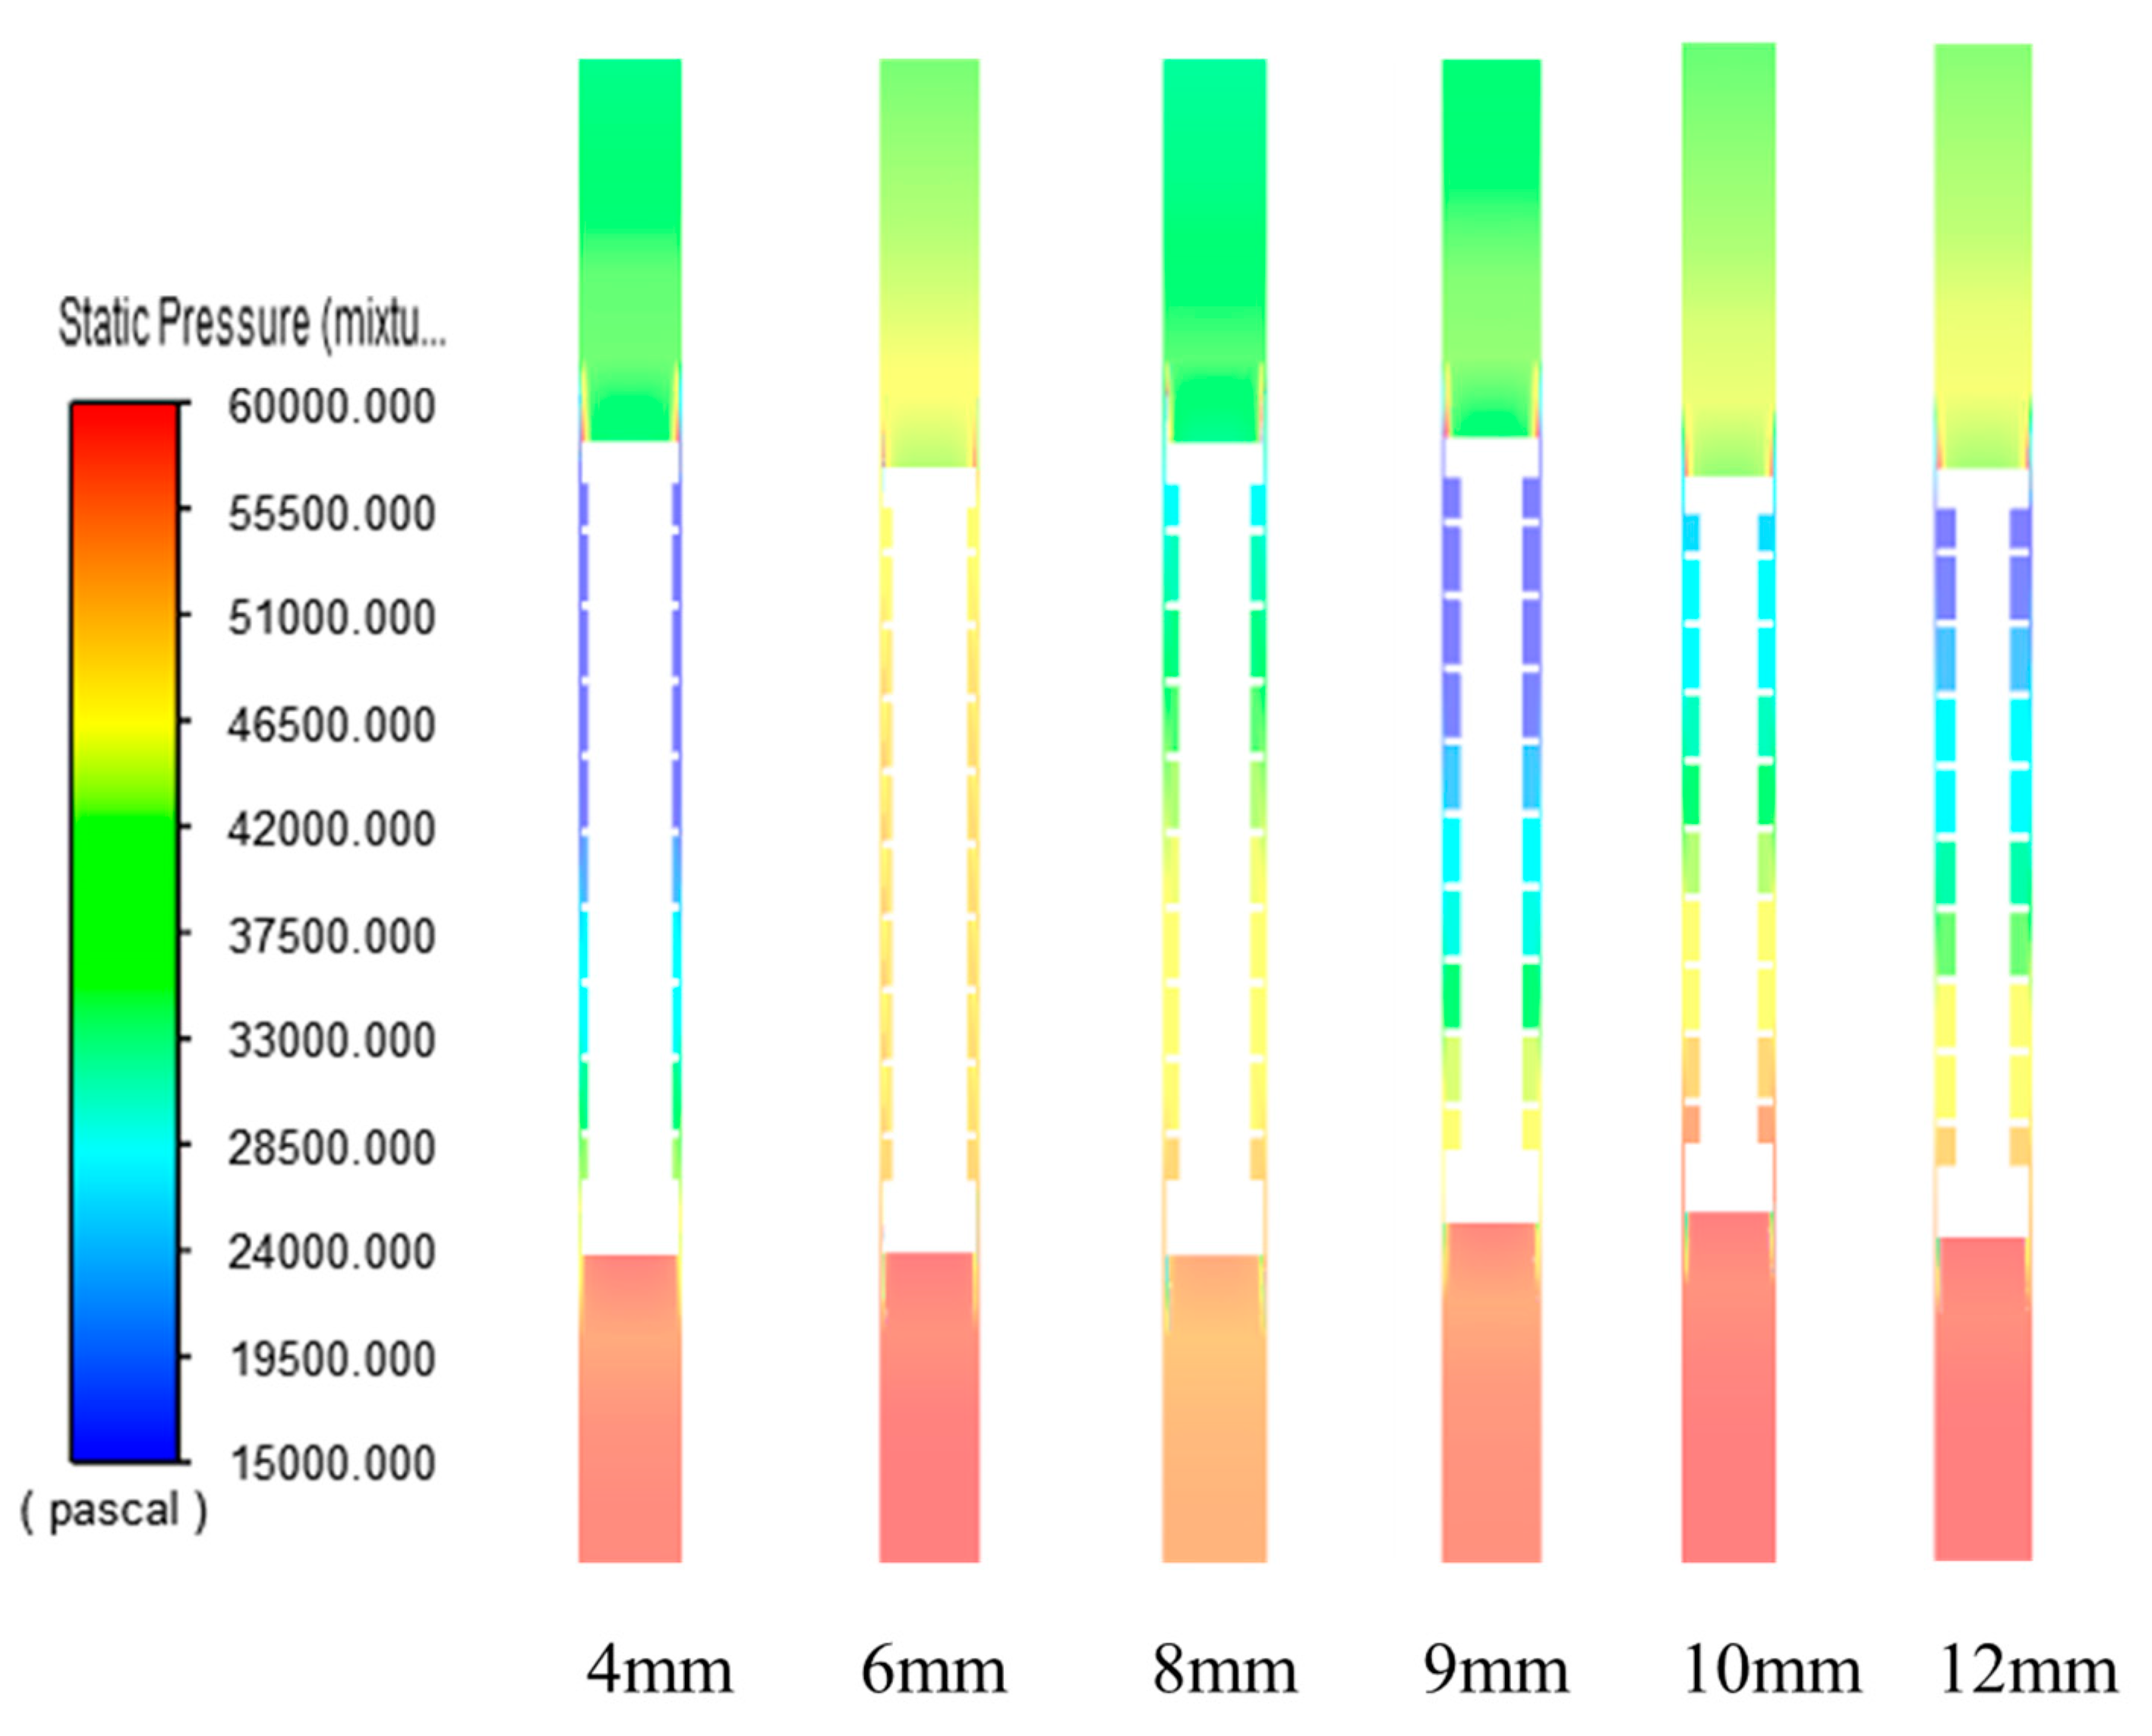
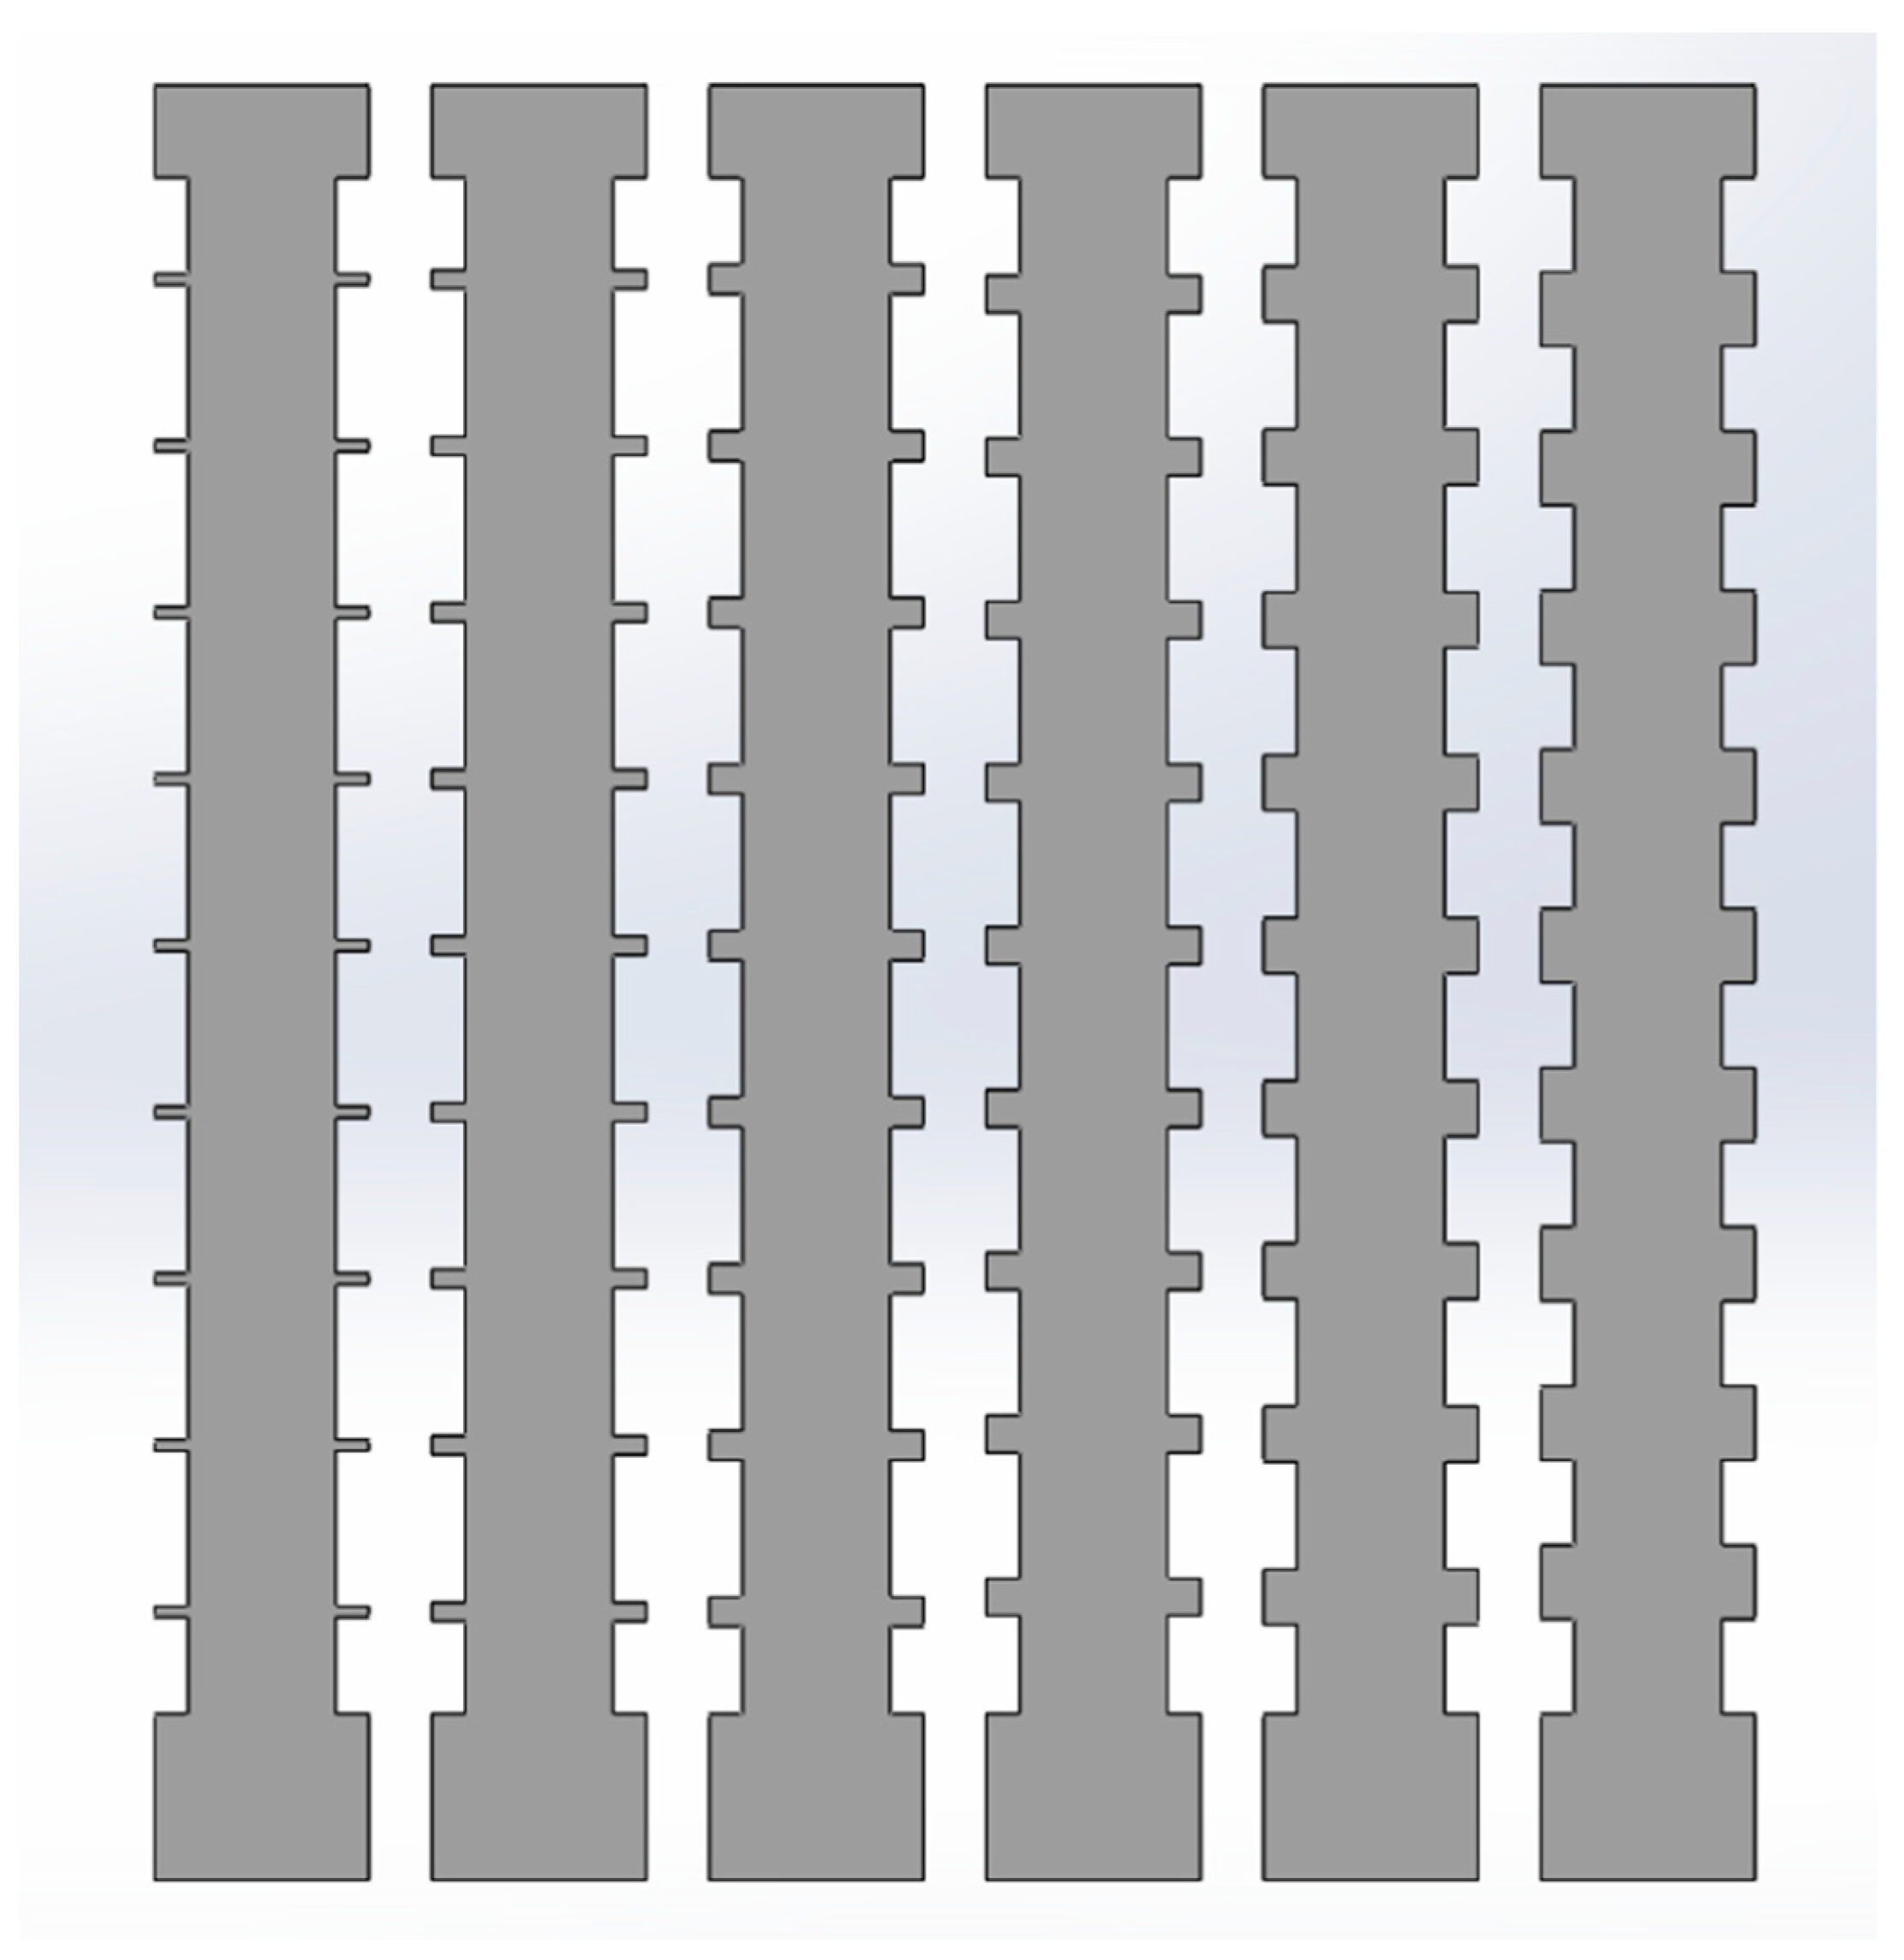
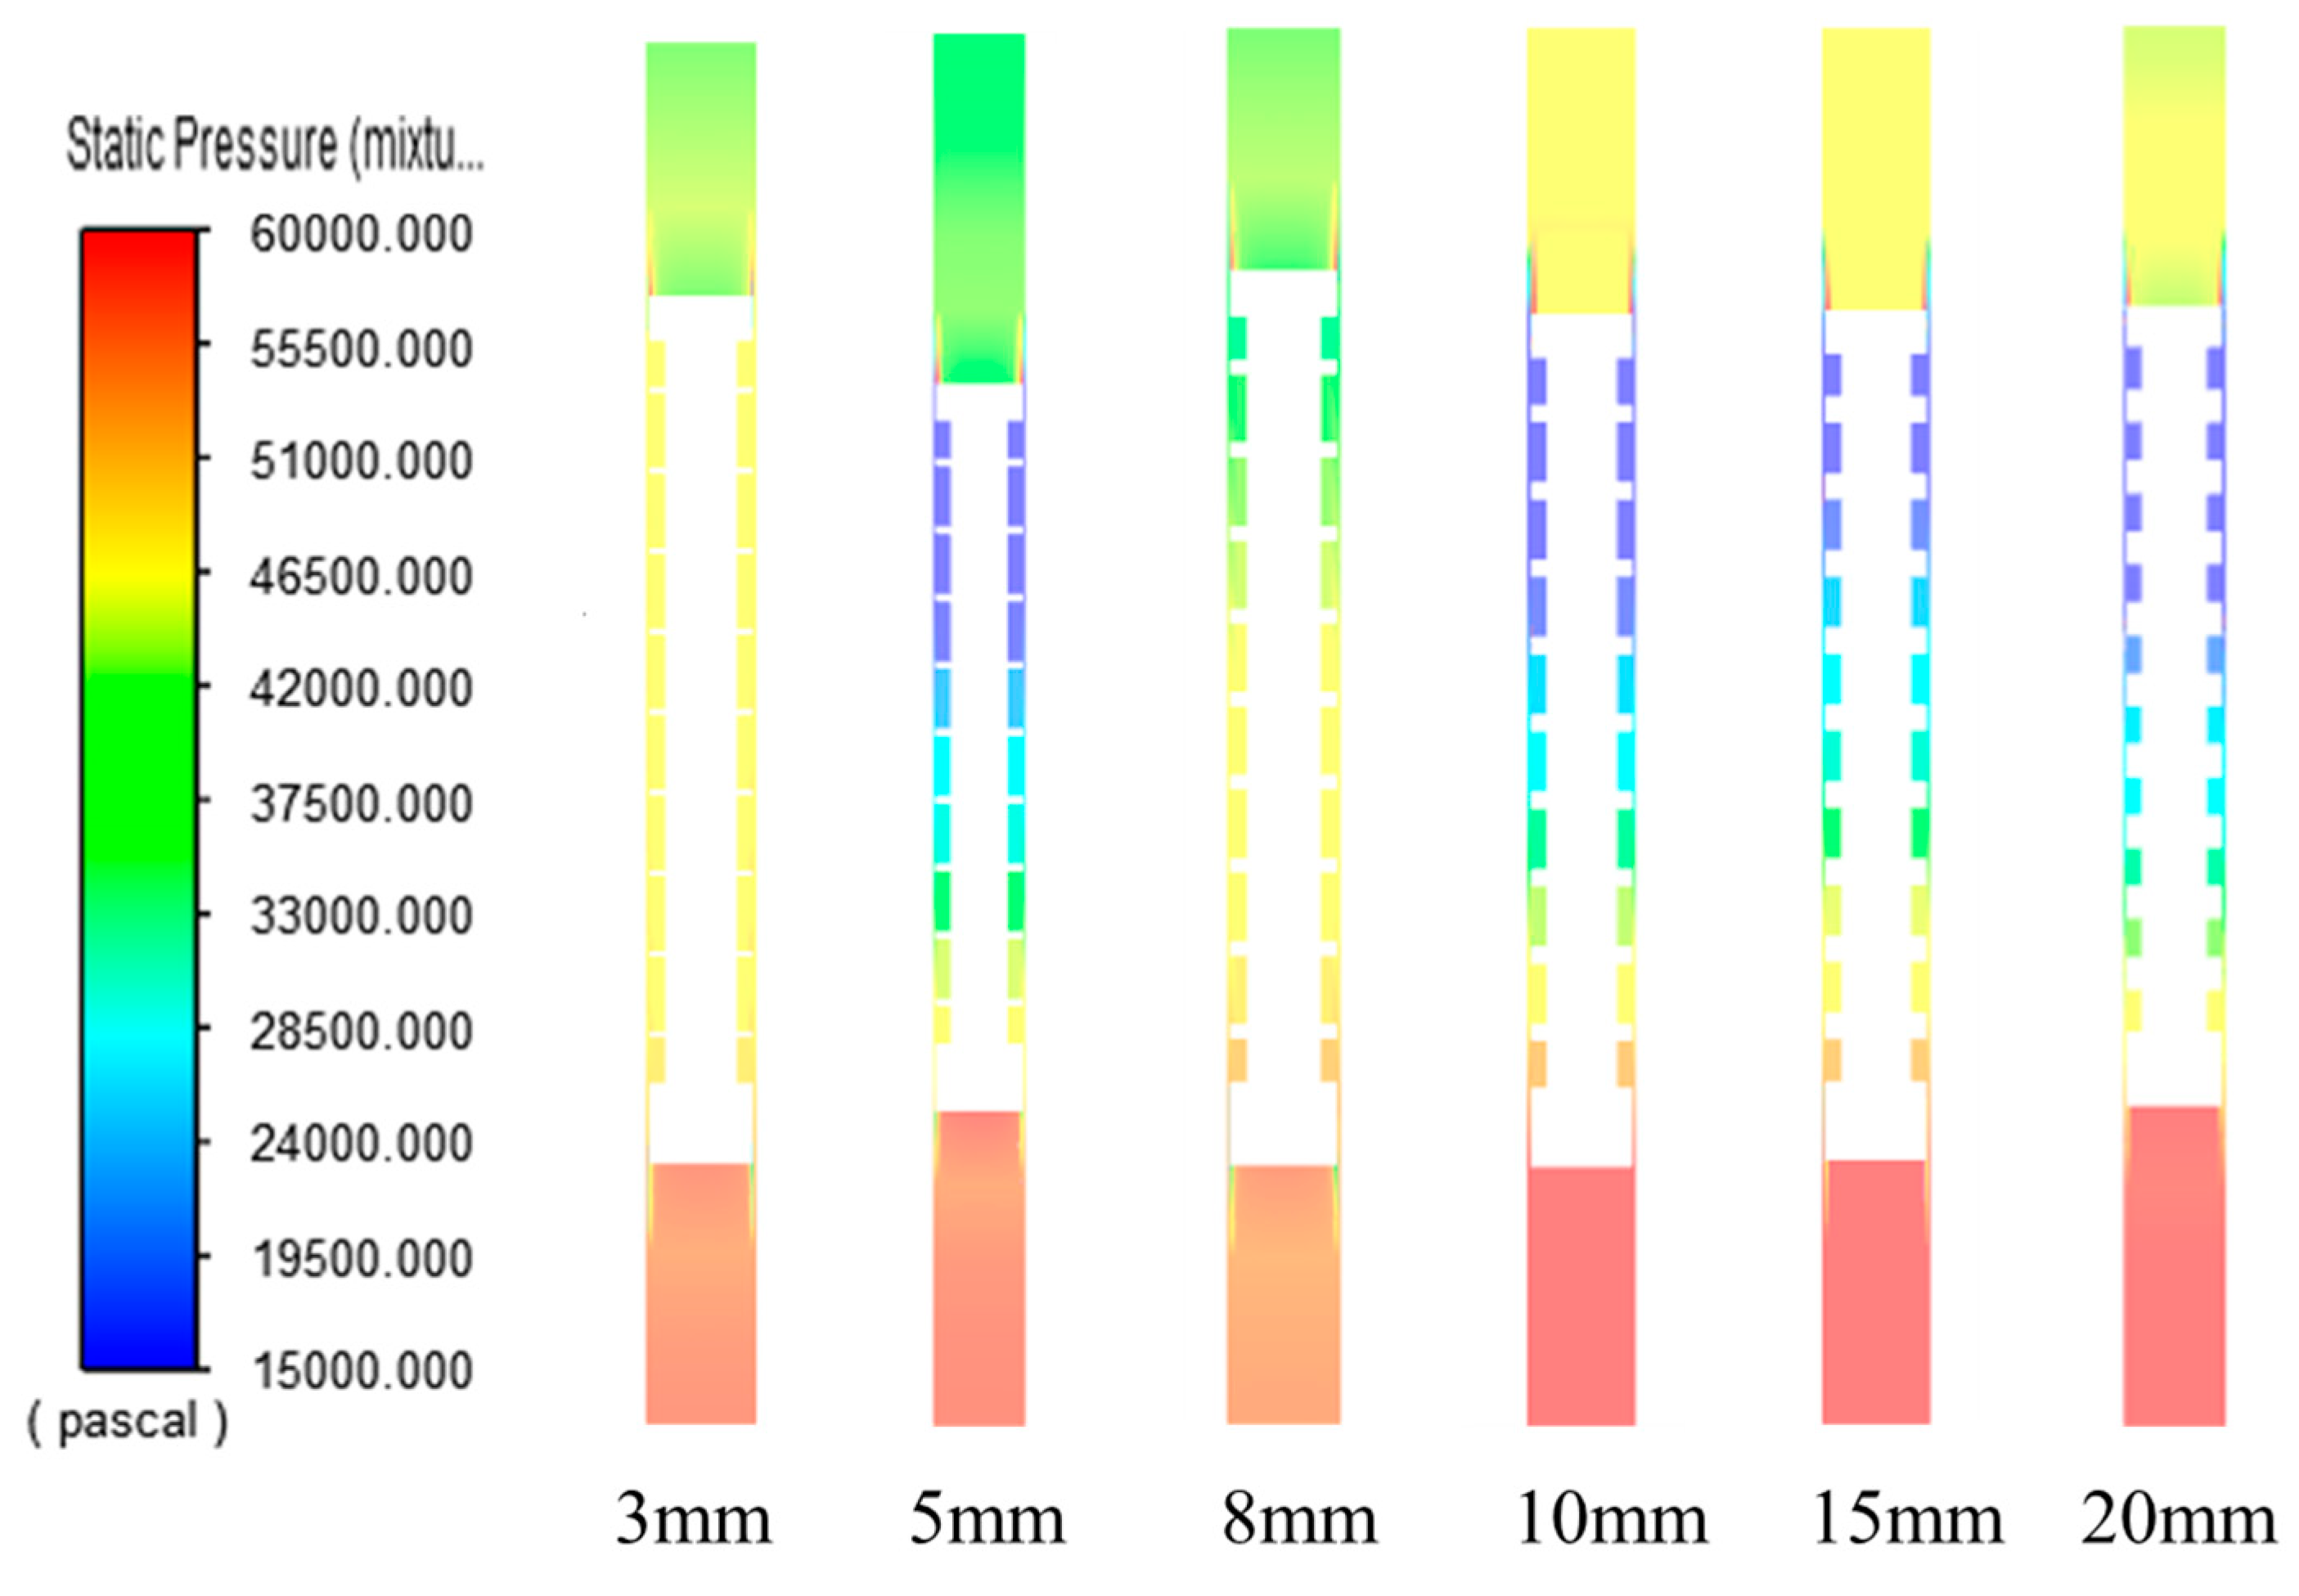
3.2. The Effect of Different Groove Widths on the Amount of Leakage on the Outer Wall of the Plunger

Selecting the previous analysis, a plunger structure with a depth of 10 mm was obtained, and six 3D models of plungers with different slotting widths (shown in Figure 17) were established by keeping the number of plungers, length, and other parameters unchanged. Their specific slotting widths are shown in Table 3.
From the pressure cloud shown in Figure 18, it can be seen that the pressure at the lower part of the plunger is the maximum value, and during the upward flow, it gradually decreases over the gap between the plunger and the tubing, and then decreases to the minimum when it is at the top of the upper part of the plunger. When the width of the plunger slots is 3 mm, the pressure change of the top and bottom of the plunger is very small, because the width of the plunger slots is small, the width between the two slots is bigger, the liquid is easy to flow out from the gap, so the ability to carry the liquid is poor, so the plunger drainage flow is big; when the width of the slots of the plunger is in the range from 5 mm to 15 mm, the pressure difference between the top of the plunger and the bottom of the plunger shows a trend of change, which is firstly decreasing and then increasing. Therefore, when the slot width is 10 mm to 15 mm, the lower pressure of the plunger is the largest, and the upper and lower differential pressures are the largest; at this time, the interference with the liquid flow is stronger, the turbulence effect is better, and the leakage prevention ability is the best. When the slot width is 15 mm to 20 mm, the upper and lower pressures of the plunger start to decrease, which is because the slot width is too large, the plunger notch carries too little fluid, and the leakage loss of liquid increases.
As can be seen from Figure 19, it can be seen that the plunger speed varies less in different slot widths. For the judgement of the impact of the slotted depth of the outer wall of the plunger on the plunger leakage, the amount of leakage in the upward movement of the plunger and the maximum movement speed can be taken as the judgement evaluation criteria. From Figure 20 and the analysis of pressure change, it can be seen that under the condition of ensuring that the other parameters of the plunger remain unchanged, when the depth of the groove on the outer wall of the plunger is between 10 mm and 15 mm, the leakage amount is found to be the least and the speed is the lowest in the process of the plunger upward movement, so that at this time, the improvement of the structure of the outer wall of the plunger is optimal for the reduction of the leakage effect.

3.3. Effect of Different Number of Grooves in the Outer Wall of the Plunger on the Amount of Leakage

The plunger structure with a depth of 10 mm and an outer slot width of 10 mm obtained from the previous analysis was selected, and keeping the other parameters of the plunger unchanged, five 3D models of plungers with different slotting widths were established (e.g., Figure 21), and the specific number of their slots is shown in Table 4.
According to the pressure distribution graph shown in Figure 22, when the number of plunger slots is 5 to 7, the pressure change between the upper and lower ends is small, the interference with the liquid flow is poor, and the overall liquid-carrying capacity is weak. When the number of plunger slots is 9 to 16, the pressure difference between the upper and lower ends is larger; at this time, the interference with the liquid flow is stronger, the turbulence effect is better, and the anti-leakage and loss prevention ability is also stronger.
Similarly, it can be seen that at the different number of slots, the change in plunger velocity is less, as shown in Figure 23. From Figure 24 and the analysis of the pressure change, it can be seen that under the condition of ensuring that the other parameters of the plunger remain unchanged, when the number of slots on the outer wall of the plunger is 12, the least amount of leakage and the lowest speed are found during the upward movement of the plunger, so that, at this time, the improvement of the structure of the outer wall of the plunger can be optimal for the reduction of the leakage effect.
Analyzing the above, it can be seen that improving the parameters of the plunger structure: the depth of the slot is 10 mm, the width of the slot is 10 mm, and the number of slots is 12, the least amount of drainage flow occurs during the lifting process of the plunger, and the weight of the drainage flow decreases from 0.532 kg to 0.167 kg.

4. Rodlike Plungers in Long Wellbores

4.1. Analysis of Results When the Bottom-Hole Pressure Is Constant and the Differential Pressure Is Changed

When the wellbore flow pressure is 10 MPa and the wellhead pressure is changed, the simulation results are shown in Figure 25A,B. As the wellbore pressure difference decreases, the plunger upstream speed decreases, and the time to reach the wellhead grows. When the wellhead pressure reaches 7 MPa and the initial pressure difference is equal to 3 MPa, after the plunger rises to 100 m, the plunger cannot continue to go up because the bottom-hole pressure decreases to 8.5 MPa, which is only 1.5 MPa different from the wellhead. Therefore, maintaining a sufficient bottom-hole–wellhead pressure difference is an important condition for the feasibility of the plunger gas-lift process, and it is necessary to try the best possible wellhead pressure under the premise of meeting the surface gathering pressure. When the bottom-hole flow pressure is 10 MPa, the wellhead pressure cannot exceed 5 MPa.
Since the plunger does not move from the bottom of the well to the top of the well when the bottom pressure is 10 MPa, the wellhead pressure is 7 MPa, the change in the pressure and discharge flow rate in the well in the positive case is not considered. When the plunger is at a certain wellbore pressure, the wellbore pressure curves and the discharge flow rate curves at different wellhead pressures are shown in Figure 25C,D. When the wellbore pressure is 10 MPa and the initial pressure difference is equal to 8 MPa, the pressure in the good changes the fastest during the plunger movement, and at the same time, the liquid discharge volume is the largest, and the liquid discharge effect is the best. Therefore, under the same conditions, increasing the bottom-hole–wellhead pressure difference as much as possible can improve the plunger liquid discharge effect.

4.2. Analysis of Results When the Differential Pressure Is Constant and the Wellhead Pressure Is Changed

When the pressure difference between the bottom-hole pressure and the wellhead pressure is 7 MPa, the simulation results obtained by changing different wellhead pressures are shown in Figure 26. Different wellhead pressures and different bottom-hole pressures affect the movement of the plunger inside the wellbore. When the wellhead pressure is within the range of 0 MPa to 13 MPa, the plunger can be lifted upwards smoothly inside the wellbore. However, when the wellhead pressure is 18 MPa, the plunger can only be lifted up to 156 m in the wellbore, and after reaching the highest point, the pressure inside the wellbore will gradually decrease, resulting in the gradual fall of the plunger. After reaching the maximum point, the pressure inside the wellbore will gradually decrease, resulting in the plunger dropping down gradually. However, in this case, the pressure inside the wellbore decreases rapidly, and the upward movement of the plunger decreases rapidly, resulting in a longer time for the plunger to reach the wellhead.

5. Conclusions

  • An indoor simulation of the plunger air lift was conducted indoors, concluding that the leakage flow rate in the wellbore increases approximately linearly with increasing plunger velocity.
  • The CFD numerical simulation was carried out, and the CFD simulation results were compared with the indoor experiments to verify the feasibility of the CFD simulation, and the annular groove structure outside the plunger was improved for the situation that the plunger has a large drainge flow in the wellbore lifting. CFD numerical simulation was used to simulate the plunger wellbore lift with different different groove depths, different groove widths and different numbers of grooves. The overall drainge flow of the plunger movement and the speed of the plunger movement were used as the evaluation criteria, and the obtained simulation results show that the drainge flow in the plunger wellbore is the smallest when the plunger groove depth is 10 mm, the width of each groove is 10 mm, and the number of grooves is 12.
  • The movement of the plunger in the wellbore was studied for different bottom-hole pressure differences and wellhead pressure differences. When the pressure at the bottom of the well is 10 MPa, the wellhead pressure cannot be greater than 7 MPa, and if it is greater than 7 MPa, the upward movement of the plunger in the wellbore cannot reach the wellhead. If you want to ensure the feasibility of the plunger air-lift process, it is necessary to ensure sufficient differential pressure at the bottom of the well and differential pressure at the wellhead. Moreover, increasing the pressure difference between the bottom hole and the wellhead can improve the liquid discharge effect of the plunger in the upward movement of the wellbore. When the wellbore and wellhead pressure difference is kept at 7 MPa, the plunger cannot continue to move upward in the wellbore when the wellhead pressure exceeds 18 MPa. Therefore, in the actual application of the plunger lifting process, it is necessary to ensure that the wellhead pressure is not too large, and to increase the pressure difference between the bottom hole and the wellhead as much as possible.

Author Contributions

Conceptualization, M.Z. and R.L.; methodology, M.Z.; software, Q.X. and H.M.; validation, G.W.; investigation, M.Q.; data curation, Y.T.; writing—original draft preparation, Q.X.; writing—review and editing, Q.X.; project administration, S.Z. and H.Z. All authors have read and agreed to the published version of the manuscript.

Funding

National Natural Science Foundation of China under Grant No. 621730, “Performance Analysis and Optimisation of Grid-based Intelligent Systems under Multiple Communication Constraints”.

Data Availability Statement

The raw/processed data required to reproduce these findings cannot be shared at this time as the data also form part of an ongoing study.

Acknowledgments

We would like to thank Zhang Manlai for being the corresponding author of this article.

Conflicts of Interest

The authors declare no conflict of interest.

References

  1. White, G.W. Combine Gas Lift Plungers to Increase Production Rate. World Oil 1982, 195, 69–76. [Google Scholar]
  2. Foss, D.L.; Gaul, R.B. Plunger-lift Performance Criteria with Operating Experience-Venture Avenue Field. In Drill and Prod Practice; OnePetro: Richardson, TX, USA, 1965; pp. 124–140. [Google Scholar]
  3. Liu, H.; Li, M.; Liu, Q.; Zhang, L. Research and Application of Plunger Gas Lift Technology in the Fuling Shale Gas Field. Pet. Drill. Tech. 2020, 48, 102–107. [Google Scholar]
  4. Lea, J.F. Dynamic Analysis of Plunger Lift Operations. J. Pet. Technol. 1982, 34, 2617–2629. [Google Scholar] [CrossRef]
  5. Tong, Z.; Pei, X.; Shen, Z.; Hao, Z.; Niu, H. A plunger lift and monitoring system for gas wells based on deployment-retrievement integration. Nat. Gas Ind. B 2015, 2, 449–454. [Google Scholar] [CrossRef]
  6. Sask, D.; Kola, D.; Tuftin, T. Plunger Lift Optimization in Horizontal Gas Wells: Case Studies and Challenges. In Proceedings of the Canadian Unconventional Resourcesand International Petroleum Conference, Calgary, AL, Canada, 19–21 October 2010. [Google Scholar]
  7. Tian, K.; Gao, E.; Wang, H.; Dou, Y. Numerical Analysis of Flow Field in Eccentric Annular Clearance of Gas-lift Plunger. Sci. Technol. Eng. 2021, 21, 15446–15453. [Google Scholar]
  8. Cao, Y. Simulation and Optimization of Drainage Gas Recovery by Plunger Lift in Highly Deviated Wells. Master’s Thesis, Southwest Petroleum University, Chengdu, China, 2018. [Google Scholar]
  9. Ge, K.; Zou, J.; Song, W. Research progress on optimization design of plunger gas lift drainage parameters. Digit. Des. 2017, 6, 21–24+36. [Google Scholar] [CrossRef]
  10. Liu, C. Study on the Structure and Performance of a New Split Gas-lift Plunger. Master’s Thesis, Northeast Petroleum University, Daqing, China, 2021. [Google Scholar]
  11. Duan, J. Two-Piece Plunger Lift Technology Research and Application. Master’s Thesis, Southwest Petroleum University, Chengdu, China, 2013. [Google Scholar]
  12. Longfellow, N.; Green, D. Computational Fluid Dynamics for Horizontal Well Plunger Lift System Design. SPE 169585-MS. In Proceedings of the SPE Western North American and Rocky Mountain Joint Meeting, Denver, CO, USA, 15–18 April 2014. [Google Scholar]
  13. Liu, Y.; Huang, Q.; Du, J.; Ma, H.; Xu, Z. Optimization of Solid Plunger’s Structure. J. Southwest Pet. Univ. 2019, 41, 181–186. [Google Scholar]
  14. Duan, J.; Li, Y.; Zhong, H. Numerical simulation of new type plunger gas-it fuid flow field based on fluent. J. Oil Gas Technol. 2014, 36, 117–120. [Google Scholar]
  15. Wang, X. The Optimization Design of Plunger Gas Lift Sealing Structure and Its Flow Characteristics Analysis of Clearance Flowing. Thesis, Xi’an Shiyou University, Xi’an, China, 2019. [Google Scholar]
  16. Li, L. CFD Simulation and Process Parameter Optimization of Gas Well Plunger Lifting. China Pet. Mach. 2020, 48, 104–112. [Google Scholar]
  17. Zhou, Q. Design and Simulation Analysis of Self-Adaptive Plunger for Natural Gas Production; Harbin Institute of Technology: Harbin, China, 2020. [Google Scholar]
  18. Xiaoya, F. Process Design and Lifting Capacity Analysis of Plunger Gas Lift. Master’s Thesis, Yangtze University, Jingzhou, China, 2020. [Google Scholar]
  19. Shi, H. Study on Liquid Leakage Model of Rod Plunger Gas Lift. J. Southwest Pet. Univ. 2022, 37, 101–106+136. [Google Scholar]
  20. Zhang, J. Analysis of gas lift plunger drainage mechanism and operation law based on CFD. Mach. Des. Manuf. Eng. 2023, 52, 95–99. [Google Scholar]
  21. Miao, S.; Liu, X.; Feng, X.; Shi, H.; Luo, W.; Liu, P. A Dynamic Plunger Lift Model for Shale Gas Wells. Fluid Dyn. Mater. Process. 2023, 19, 1735–1751. [Google Scholar] [CrossRef]
  22. Ren, Z.A.; Hao, D.; Xie, H.J. Several turbulence models and their applications in FLUENT. Chem. Equip. Technol. 2009, 30, 38–40+44. [Google Scholar] [CrossRef]
Figure 1. Schematic diagram of plunger air-lift indoor experiment system.
Processes 11 03103 g001
Figure 2. Change in average leakage flow rate with average plunger velocity.
Processes 11 03103 g002
Figure 3. “U” flow channel model of piston gas lift.
Processes 11 03103 g003
Figure 4. “U” grid model of piston gas lift.
Processes 11 03103 g004
Figure 5. Plunger mean velocity versus drainage flow as a function of the number of grids.
Processes 11 03103 g005
Figure 6. Plunger gas-lift U-shaped initial gas–water distribution setup.
Processes 11 03103 g006
Figure 7. Flow field diagram of piston gas-lift velocity.
Processes 11 03103 g007
Figure 8. Flow field of piston gas-lift pressure.
Processes 11 03103 g008
Figure 9. Bottom-hole pressure curve.
Processes 11 03103 g009
Figure 10. Drain flow rate diagram of the plunger.
Processes 11 03103 g010
Figure 11. Changes in well pressure under different flow pressures during plunger movement.
Processes 11 03103 g011
Figure 12. Change in discharge flow rate in piston movement under different flow pressures.
Processes 11 03103 g012
Figure 13. Physical model of plunger structure under different groove depths.
Processes 11 03103 g013
Figure 14. Cloud diagram of plunger pressure distribution under different groove depths.
Processes 11 03103 g014
Figure 15. Cloud diagram of plunger velocity distribution under different groove depths.
Processes 11 03103 g015
Figure 16. Relationship between plunger leakage and velocity under different groove depths.
Processes 11 03103 g016
Figure 17. Physical model of plunger structure with different slot widths.
Processes 11 03103 g017
Figure 18. Cloud diagram of plunger pressure distribution under different slot widths.
Processes 11 03103 g018
Figure 19. Cloud diagram of plunger velocity distribution under different slot widths.
Processes 11 03103 g019
Figure 20. Relationship between piston leakage and maximum velocity under different slot widths.
Processes 11 03103 g020
Figure 21. Physical model of plunger structure with the different number of slots.
Processes 11 03103 g021
Figure 22. Cloud diagram of plunger pressure distribution under different slot widths.
Processes 11 03103 g022
Figure 23. Cloud diagram of plunger velocity distribution under different slot widths.
Processes 11 03103 g023
Figure 24. Relationship between piston loss and maximum velocity in different slots.
Processes 11 03103 g024
Figure 25. Simulation results when keeping the bottomhole pressure constant and changing the differential pressure(A) Plunger motion velocity curves at different wellhead pressures when the bottom-hole pressure is constant. (B) Plunger displacement curves under different wellhead pressures at a certain bottom-hole pressure. (C) Pressure curves in the hole under different wellhead pressures when the bottom-hole pressure is constant. (D) Drain flow curves under different wellhead pressures when the bottom-hole pressure is constant.
Processes 11 03103 g025
Figure 26. Simulation results for different wellhead pressures by keeping the pressure difference between the wellhead and the bottomhole at 7 MPa (A) Plunger movement speed curves at different wellhead pressures when the pressure difference is certain. (B) Plunger displacement curves at different wellhead pressures when the pressure difference is certain. (C) Plunger pressure curves under different wellhead pressures when the pressure difference is constant. (D) Drain flow curves under different wellhead pressures when the pressure difference is constant.
Processes 11 03103 g026
Table 1. Data comparison.
Average Speed (m/s)Drainge Flow (kg)
Experimental data10.370.308
Analogue data9.260.352
Inaccuracies10.7 cent12.5 cent
Table 2. Plunger 3D model number and groove depth table.
Serial number123456
Slotting depth (mm)46891012
Table 3. Plunger 3D model number and groove width table.
Serial number123456
Slotted width (mm)358101520
Table 4. Plunger 3D model number and groove number table.
Serial number12345
Number of slots (pcs)5791216
Disclaimer/Publisher’s Note: The statements, opinions and data contained in all publications are solely those of the individual author(s) and contributor(s) and not of MDPI and/or the editor(s). MDPI and/or the editor(s) disclaim responsibility for any injury to people or property resulting from any ideas, methods, instructions or products referred to in the content.

