Article

Fracture Parameters Optimization and Field Application in Low-Permeability Sandstone Reservoirs under Fracturing Flooding Conditions

1
State Key Laboratory of Oil and Gas Reservoir Geology and Exploitation, Southwest Petroleum University, Chengdu 610500, China
2
CNOOC Research Institute Co., Ltd., Beijing 100029, China
3
Sinopec Shengli Oil Field Luming Oil-Gas Exploration & Development Co., Ltd., Dongying 257000, China
*
Authors to whom correspondence should be addressed.
Processes 2023, 11(1), 285; https://doi.org/10.3390/pr11010285
Submission received: 28 December 2022 / Revised: 11 January 2023 / Accepted: 11 January 2023 / Published: 16 January 2023
(This article belongs to the Special Issue Advances in Enhancing Unconventional Oil/Gas Recovery)

Abstract

:
To solve engineering problems in the production process after fracturing and flooding of low-permeability sandstone reservoirs, such as rapid water-cut rise and low water flooding efficiency, a method for optimizing the fracture parameters of low-permeability sandstone reservoirs under fracturing flooding conditions was proposed. A rock property test experiment was first carried out, the fracturing coefficient was defined, and an evaluation method for the brittleness index of low-permeability sandstone was established to optimize the perforation location of the fracturing reservoir. A productivity numerical model for the two-phase flow of oil–water in matrix–fracture media was established to optimize the fracture morphology under fracturing flooding conditions. The results showed that the quartz content, Young’s modulus, and peak stress mainly affected the fracturing coefficient of rock and are the key indicators for evaluating the brittleness of low-permeability sandstone reservoirs. For production wells in the direction of minimum horizontal principal stress, the swept area of water flooding should be expanded, fracture length should be optimized to 90 m, and fracture conductivity should be 20 D·cm. For fracturing production wells in the direction of maximum horizontal principal stress, the advancing speed of the water injection front should be slowed down to reduce the risk of water channeling in injection-production wells. The optimized fracture length was 80 m, and the fracture conductivity was 25 D·cm. The application of these findings can markedly improve oil production and provide a reference for optimizing the fracture parameters of low-permeability sandstone reservoirs under fracturing flooding conditions.

1. Introduction

With the development of oil and gas exploration and technology, oil and gas development has shifted from conventional reservoirs to unconventional reservoirs that have low permeability and are difficult to produce in China. Hydraulic fracturing is a key technology for the effective production and economic development of unconventional reservoirs [1,2,3]. Conventional water and chemical flooding can improve reservoir recovery to a certain extent; however, there are still related problems in the development of low-permeability reservoirs [4]. The conventional fracturing process is complex, expensive, has a small scope for fracture control, and the effect of reservoir stimulation is poor. Conventional water flooding has poor hydrodynamic connections, extensive water channeling and flooding, and non-Darcy flow characteristics of fluids, which lead to problems such as “no injection and no production” in low-permeability reservoirs. In conventional chemical flooding, the oil displacement agent adsorbs and remains in the pores of the formation rock, and the concentration decreases, which leads to a reduction in the oil displacement efficiency [5]. Therefore, “fracture-injection-production” integrated reservoir simulation technology (fracturing flooding) was proposed for the oilfield sites, which perfectly combines hydraulic fracturing technology, conventional water flooding development, and chemical flooding to form a set of continuous development technologies [6].
Since 2000, fracturing flooding technology has been applied and developed in the Daqing and Changqing oilfields, and there are some low-permeability blocks in the Shengli oilfield. The development of this technology mainly involves four stages: matrix imbibition technology for low-permeability reservoirs (2000–2009), fracture–matrix dynamic imbibition technology for fractured low-permeability reservoirs (2010–2014), energy storage fracture network fracturing technology (2015–2016), and energy storage fracturing-imbibition oil recovery technology (2017–present) [7,8,9,10]. Based on the operation mode and stimulation mechanism, the fracturing flooding process is divided into two methods: reverse fracturing flooding and forward fracturing flooding [11]. Reverse fracturing flooding involves opening the formation using a low-viscosity fluid instead of a fracturing fluid from the production well and quickly injecting liquid containing an oil-displacing agent through the fracture to increase the reservoir pressure. During the well shut-in process, the flow direction of the wetting phase that is sucked in by the reservoir matrix is opposite to the flow direction of the discharged non-wetting phase, and the reservoir recovery is improved through the enhanced oil–water imbibition displacement between the fracture and matrix. Forward fracturing flooding involves injecting a large amount of liquid containing an oil-displacing agent from an injection well at a pressure that exceeds the formation fracture pressure. Reservoir recovery is improved by increasing the reservoir pressure and oil displacement effect of the oil displacement agent. This study focuses on forward fracturing flooding technology, which has been applied to the Shengli oilfield on a large scale since 2020. More than 40 well group tests have been completed in Bonan, Niuzhuang, and other blocks, and the cumulative water injection is 110 × 104 m3, with a cumulative increase of 33,000 tons of oil, achieving certain economic benefits [12]. However, this technique also faces two difficulties regarding the optimization of fracture parameters: poor matching of perforation horizons between injection and production wells and unreasonable fracture morphology (fracture length and fracture conductivity), resulting in engineering problems such as rapid water cut rise, low oil displacement efficiency, and short effective production time in some production wells. Therefore, optimizing the perforation location of the well and the fracture parameters of the production well are important methods for improving fracturing flooding technology.
The rock brittleness index is a key parameter for optimizing perforation location [13,14,15,16]. Hucka and Das [17] calculated rock brittleness using compressive and tensile strengths through uniaxial compressive strength and Brazilian testing. Later, many scholars used rock mechanical parameters and rock brittle mineral content to characterize rock brittleness and believed that horizon rocks with large brittleness indexes were more prone to fracture and formed a complex fracture network; therefore, the perforation location was optimized according to the brittleness index [18,19,20]. Presently, there are three types of methods for evaluating rock brittleness: mineral composition, mechanical parameters, and stress–strain parameters [21]. These three parameters are all related to brittleness; however, the fitting degree is not high. Therefore, it is necessary to develop a new method to characterize rock brittleness and improve the accuracy of brittleness prediction.
Optimizing and controlling the hydraulic fracture morphology is the key to the injection-production effect of the well group. Xiao and Guo [22] established a low-permeability heterogeneous geological model for the numerical simulation of hydraulic fracturing. The results show that there is an optimal value for fracture conductivity and fracture length. Xu et al. [23] used the Eclipse software to conduct orthogonal simulations for the fracture network fracturing of low-permeability oil and gas reservoirs to optimize the fracture parameters of horizontal wells. Lei et al. [24] established a non-planar three-dimensional fracture propagation model, proposed a method for the stimulation of low-permeability oil reservoirs based on the optimal design of fracture-controlled fracturing, and optimized the fracture parameters of horizontal wells. Few scholars have optimized the fracture parameters for low-permeability sandstone reservoirs under the influence of fracturing flooding [25,26]. Engineers at fracturing sites usually operate based on experience and lack theoretical guidance.
In this study, the fracture parameters were optimized from two aspects: perforation location and fracture morphology. First, considering the influence of various factors—such as the mechanical properties, mineral composition, and deformation characteristics of the rock—and using the rock fracturing coefficient as an index, a new method for brittleness evaluation of low-permeability sandstone reservoirs was proposed and the perforation location of the reservoir was optimized accordingly. Furthermore, considering the influence of the oil-displacing agent and hydraulic fractures, a productivity numerical model for the two-phase flow of oil–water in matrix–fracture dual-permeability media was established to optimize fracture morphology under fracturing flooding conditions. Finally, its application in the oil field proved that the technology has good practicability.

2. Perforation Location Optimization Based on Brittleness Evaluation

2.1. Rock Property Testing Experiment

Taking the low-permeability sandstone of the fourth member of the Shahejie formation in the Bohai Bay basin with a burial depth of 2500–3000 m as an example, 13 groups of downhole rock cores were selected for the rock property testing experiment. The stress–strain characteristics, fracture morphology, and mechanical parameters of the core were obtained through triaxial mechanical experiments.
The mineral compositions of the 13 groups of rocks were obtained using whole-rock mineral analysis. The results (Table 1) show that the mineral types of the sandstone in the fourth member of the Shahejie formation include clay minerals, quartz, feldspar, and carbonate minerals, with average contents of 34, 41, 16, and 9%, respectively. The mineral composition distribution of this block was significantly different and exhibited strong heterogeneity.
The rock samples were cut into standard rock pillars (2.5 cm in diameter and 5 cm in length), and triaxial mechanical experiments were conducted on the rock pillars using the RTR-1000 rock mechanics experimenter. The Young’s modulus of the sandstone in the fourth member of the Shahejie formation is between 7000 MPa and 28,000 MPa, as shown in Table 1, with an average value of 14,856 MPa; the Poisson’s ratio is between 0.06 and 0.474, with an average value of 0.254. Using the parameters of the triaxial mechanical experiment, the stress–strain curves of the rock pillar at different stress stages were generated, and the peak strain, residual strain, peak stress, and residual stress were calculated. The analysis shows that, under the same confining pressure, there are significant differences in the mechanical parameters, and the overall heterogeneity of the fourth member of the Shahejie formation is strong.

2.2. Fracture Morphology Analysis

The fracture morphology of the rock is important for determining the brittleness of the reservoir rock. A comparative analysis of the rock fracture modes, which was conducted after the experiment, shows that the fracture forms are divided into three types—single shear fractures, split fractures, and complex fractures—as shown in Figure 1.
Many scholars have qualitatively described the characterization of the fracture shape of the core; however, there are few quantitative characterization methods for the fracture mode of low-permeability sandstone. Through classical brittleness index analysis, it was found that there is no direct correlation among rock mechanical parameters, mineral composition, and the three fracture forms of rock [27]; therefore, it is necessary to explore a new brittleness index characterization method.
As shown in Figure 2, the fractal dimension (D) of the core end-face fracture was deduced using box theory [28], and the calculation equation is as follows:
D = C p ln ( N ) ln ( R )
where D is the fractal dimension of the core end-face fracture (dimensionless), R is the side length of the square boxes (cm), N is the number of square boxes containing fractures, and Cp is the proportionality constant.
As shown in Figure 3, the fracture morphology on the side of the rock pillar can also characterize the fracture characteristics to a certain extent. Considering the effects of the fractal dimension and the fracture angle of the rock pillar, a rock-fracture complexity coefficient (Fc) is defined. The calculation method is shown in Equation (2), and the calculation results are listed in Table 2.
F C = D ( 1 α 90 )
where Fc is the fracturing coefficient (dimensionless) and α is the fracture angle (°).
From Equation (2), it can be deduced that the larger the fractal dimension (D) and the smaller the fracture angle (α), the larger the fracturing coefficient (Fc) and the more complex the fracture morphology. As shown in Figure 4, the relationship between the fracturing coefficient and the fracture morphologies of the different cores was compared and analyzed. Cores with fracturing coefficients between 1 and 1.1 showed shear fractures or split fractures, cores with coefficients between 1.1 and 1.2 showed split fractures, and cores with coefficients greater than 1.2 showed complex fractures. Therefore, the core fracturing coefficient had a good correlation with the core fracture shape, which verifies the reliability of the coefficient to a certain extent.
The main factors affecting the complexity of rock fractures were determined through whole-rock mineral analysis tests and triaxial mechanical experiments. As shown in Table 3, according to single-factor correlation analysis, the factors affecting the complexity of rock fractures mainly include quartz content, Young’s modulus, and peak stress [27].

2.3. Evaluation of Rock Brittleness Index

Based on the above analysis, the quartz content, Young’s modulus, and peak stress were selected as key indicators affecting the rock brittleness of this block, and a suitable low-permeability sandstone brittleness evaluation method for this block was established. The equation used is as follows:
B l s = W 1 Q n + W 2 E n + W 3 σ p n
where Bls is the dimensionless low-permeability sandstone brittleness index; Qn, En, and σpn are the normalized quartz content, Young’s modulus, and peak stress, respectively; and W1, W2, and W3 are the weight coefficients of each dimensionless parameter.
The weight coefficients of each influencing parameter were obtained by grey relational analysis; the quartz content, Young’s modulus, and peak stress were 0.303, 0.358, and 0.339, respectively.
Young’s modulus can be obtained from sonic logging and density logging data. Quartz mineral content can be obtained from elemental capture spectroscopy logging data. However, peak stress cannot be obtained from well log data; therefore, the approximated peak stress was used for the adjacent wells in the same block.
E = a ρ r Δ t s 2 ( 3 Δ t s 2 4 Δ t p 2 Δ t s 2 Δ t p 2 )
where E is Young’s modulus, MPa; a is unit conversion factor; ρr is the rock density, g/m3; ts is shear wave log data, μs/m; and tp is compression wave log data, μs/m.
The brittleness index was then calculated using Equation (3). Finally, according to the calculation results, the formation with a high brittleness index was selected as the perforation location; thus, the extension position of the hydraulic fractures in the reservoir could be determined.

3. Fracture Morphology Optimization Based on Fracturing Flooding Simulation

3.1. Fracturing Flooding Mathematical Model

The following conditions were assumed in this model.
  • The reservoir matrix was heterogeneous and anisotropic, with three-dimensional hexahedrons of equal horizontal thickness.
  • The fracture direction was consistent with the maximum horizontal principal stress, and the fractures were homogeneous and isotropic.
  • The fluid only considered the two phases of oil and water, and the oil displacement agent existed only in the water phase.
  • The fluid, matrix, and fractures could be compressed to a certain extent, and the compressibility coefficient was constant.
  • The reservoir was maintained at a constant temperature, and capillary imbibition was considered in the matrix.
  • The bottom-hole pressure of the production well was constant; the injection rate and pressure were kept constant.
  • Hydraulic fracture direction is the maximum horizontal principal stress direction, and the fracture length is constant.
The mathematical equations for the oil and water phase seepage in the matrix are as follows:
t ( φ m ρ κ S κ , m ) + ( ρ κ v κ , m ) = q κ , m w + q κ , fm
v κ , m = k m k r κ μ κ p κ , m
where φm is the dimensionless reservoir matrix porosity, ρκ is the density of fluid κ (g/cm3), κ denotes oil or water, Sκ,m is the saturation of fluid κ in the reservoir matrix (dimensionless), q κ , m w is the flow exchange term for fluid κ between the wellbore and reservoir matrix (m3/d), qκ,fm is the flow exchange term for fluid κ between the wellbore and reservoir matrix (that is, the flow of fluid κ from the fracture to the reservoir matrix (m3/d)), km is the absolute permeability of the reservoir matrix (mD), krκ is the dimensionless relative permeability of fluid κ, μκ is the viscosity of fluid κ (mPa·s), pκ,m is the pressure of fluid κ in the reservoir matrix (MPa), and t is the production time (s).
The mathematical equations for the flow of the oil and water phases in the fractures are as follows.
t ( φ f ρ κ S κ , f ) + ( ρ κ v κ , f ) = q κ , f w + q κ , f m
v κ , f = k f k r κ μ κ p κ , f
where φf denotes the dimensionless fracture porosity, Sκ,f is the saturation of fluid κ in the fracture (dimensionless), q κ , f w is the flowrate of fluid κ from the production well to the fracture (m3/d), qκ,mf is the flowrate of fluid κ from the reservoir matrix to the fracture (m3/d), kf is the absolute permeability of the fracture (mD), and pκ,f is the pressure of fluid κ in the fracture (MPa).
The stress-sensitive equations for porosity and permeability can be obtained by considering the compressibility of the fractures and matrix.
{ φ m = φ m 0 e C ( p m t p 0 ) , φ f = φ f 0 e C f ( p f t p 0 ) k m = k m 0 e d ( p m t p 0 ) , k f = k f 0 e d f ( p f t p 0 )
where φm0 is the dimensionless initial reservoir matrix porosity, C is the dimensionless matrix porosity compressibility, pmt is the matrix pore pressure (MPa), p0 is the initial reservoir pressure (MPa), φf0 is the dimensionless initial fracture porosity, Cf is the dimensionless fracture porosity compressibility, pft is the fracture pressure (MPa), km0 is the initial permeability of the reservoir matrix (mD), d is the dimensionless matrix permeability stress sensitivity coefficient, kf0 is the initial permeability of the fracture (mD), and df is the dimensionless fracture permeability stress sensitivity coefficient.
Because the permeability in the fracture was relatively large, the capillary force was regarded as zero [29]. The matrix had a capillary pressure, which is expressed as
p of = p wf , p om p wm = p c
where pof is the oil pressure in the fracture (MPa), pwf is the water pressure in the fracture (MPa), pom is the oil pressure in the matrix (MPa), pwm is the water pressure in the matrix (MPa), and pc is the capillary pressure in the matrix (MPa).
The distribution of the oil-displacing agent was simulated by solving the conservation equation for the oil-displacing agent in the water phase.
t ( φ m C s ρ s ) + d i v ( C s k m k rw g r a d p μ ws + φ S wm D w s g r a d C s ) + Q a = Q s
where Cs is the volume fraction of the oil-displacing agent in the water phase (%), ρs is the density of the oil-displacing agent (kg/m3), μws is the solution viscosity of the oil-displacing agent and water mixture (mPa·s), D w s is the dimensionless diffusion coefficient of the oil-displacing agent in the water phase, Qa is the adsorption term of the oil-displacing agent in the pore matrix, and Qs is the injection source term of the oil-displacing agent.
The model considered the effect of the oil displacement agent concentration on the relative permeability model, capillary force, water phase viscosity, oil-displacing agent adsorption capacity, and rock wettability, and the specific influence law was obtained from the experiment [30]. The relative permeability used as the value of the miscibility function between the two endpoints was calculated in two steps. First, the endpoints of the curves were interpolated, and the immiscibility and miscibility curves were scaled to fit these points. Finally, the relative permeability values on both curves were determined, and the final relative permeability was used as an interpolation between these two values.
The production well should satisfy the bottom-hole flow pressure to maintain a constant; thus, the Peaceman model was adopted for the inner boundary condition [31]. The oil-displacing agent at the bottom of the well was given a specific initial concentration value, and the later concentration was completely updated implicitly at the end of each time step after the oil and water phase flow rates were calculated.
{ q κ , f w = W I f ( p f p w ) q κ , m w = W I m ( p m p w ) Q s = q w , m w × C s w
where WIf is the well index in the fracture grid (m3/d·MPa), pf is the pressure in the fracture (MPa), pw is the bottom-hole flow pressure (MPa), WIm is the well index in the matrix grid (m3/d·MPa), pm is the pressure in the matrix (MPa), q w , m w is the water flow exchange term between the wellbore and reservoir matrix (m3/d), and C s w is a constant that represents the volume fraction of the oil-displacing agent at the bottom of the injection well (%).
The outer boundary conditions belong to the no-flow boundary category and satisfy the Neumann model.
p n | Γ = 0
The initial conditions of the model include initial reservoir pressure and original oil saturation.
{ p ( x , y , z ) | t = 0 = C 1 s ( x , y , z ) | t = 0 = C 2
Finally, the fracturing flooding model was solved using the finite difference method.

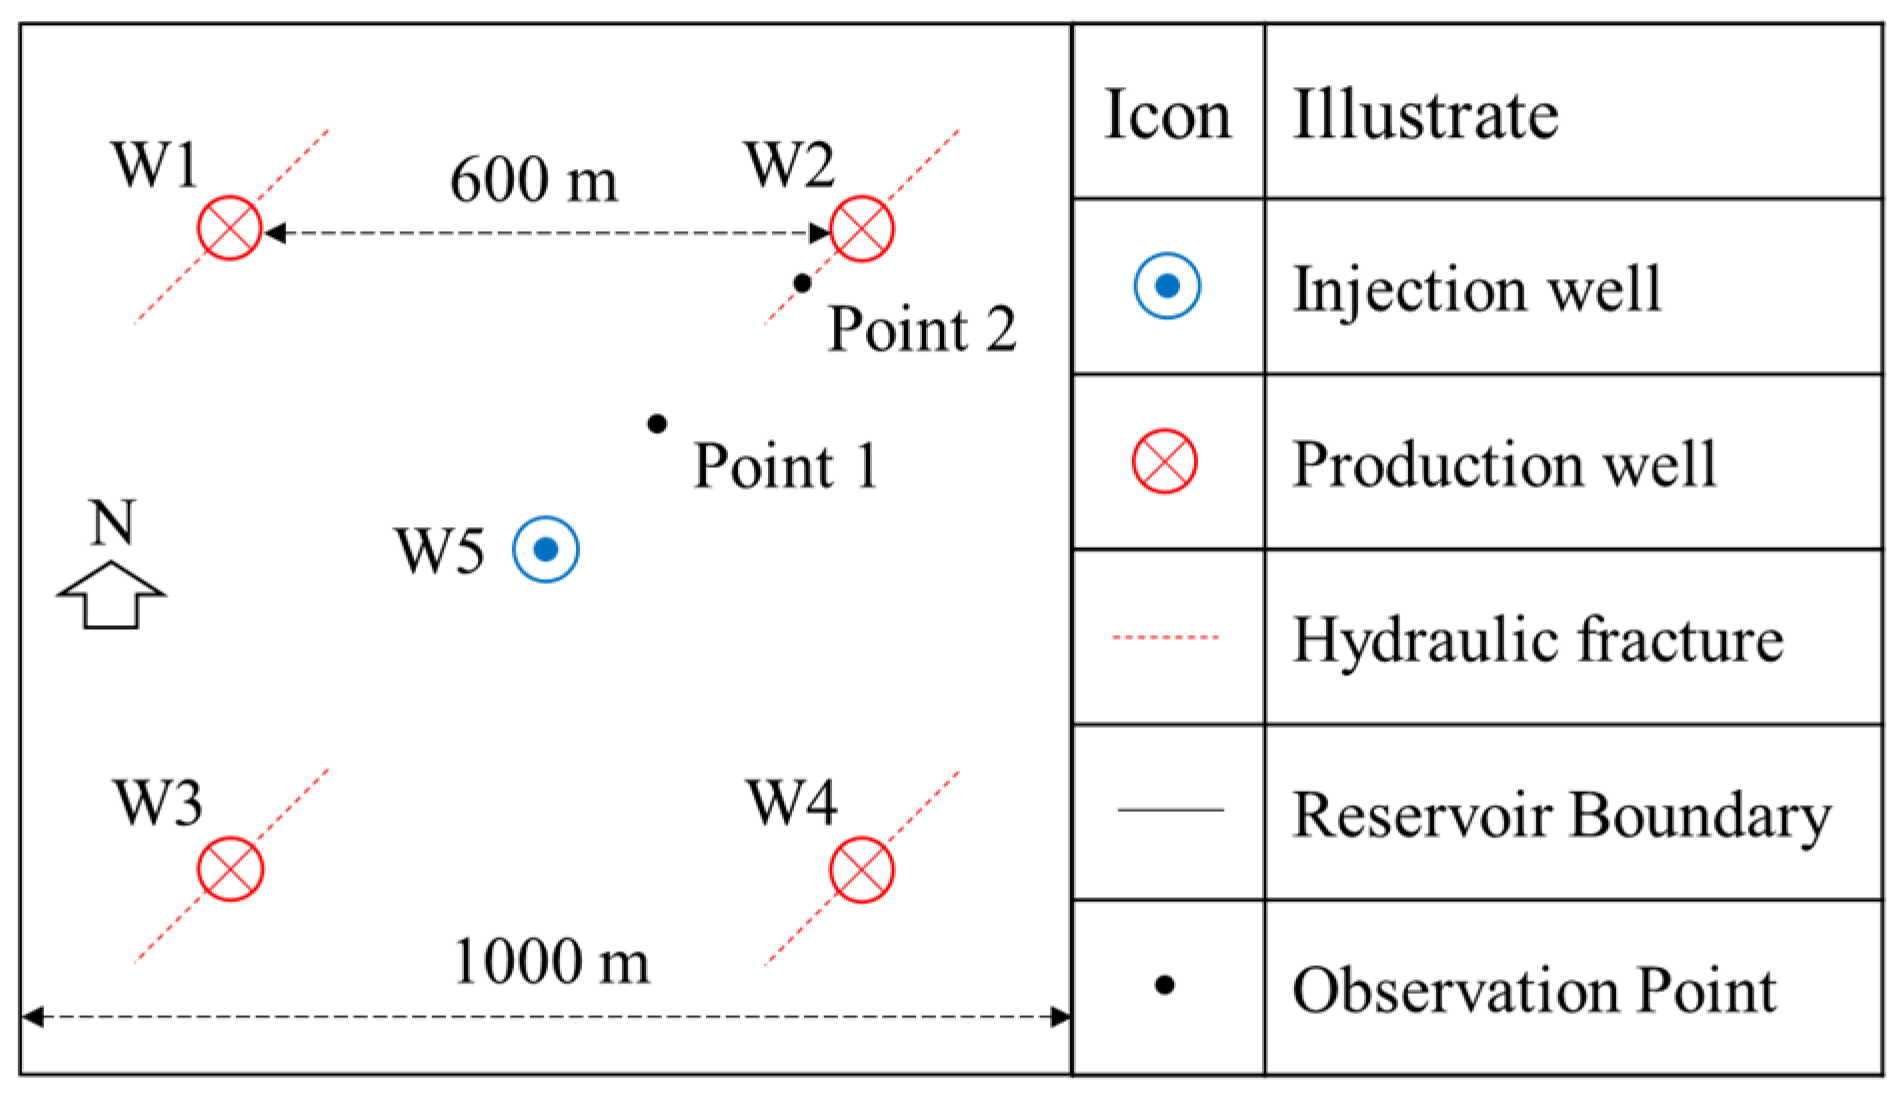
3.2. Numerical Simulation of Fracturing Flooding

According to the typical fracturing flooding well group (well G) in the low-permeability sandstone reservoir of the fourth member of the Shengli oilfield, a numerical model was established, as shown in Figure 5, including one water injection well and four production wells. The fracture direction of the fracturing well was consistent with that of the maximum horizontal principal stress (NE45°). The half-length of the crack was 110 m, and its conductivity was 20 D·cm. The oil–water relative permeability and capillary pressure of the matrix in this model were obtained from core experiments, as shown in Figure 6, and the other reservoir geological parameters are shown in Table 4. After simulating fracturing and flooding, the water injection well injects a constant amount of liquid daily, and the production well is produced at a constant pressure.
To verify the model’s reliability, the calculation results of this model and CMG software results were compared under the same production and injection conditions. As shown in Figure 7, the errors in the average formation pressure and cumulative production after 3 years of well group production are within 5%, indicating that the model has good reliability.

3.2.1. The Effect of Fracturing

Conventional water injection was performed in well W5 at an injection rate of 30 m3/d. The production well was simulated under the conditions of no fracturing and fractures caused by fracturing, and the effect of fracturing on the production of the well group was analyzed. In Figure 5, point 1 represents the matrix and point 2 represents the fracture. The evolution process of reservoir physical properties in the production process is studied by analyzing the change rules of porosity and permeability at the two points. As shown in Figure 8, the stress sensitivity effect has a great impact on fracture permeability in the production process. The porosity and permeability of the reservoir matrix and fracture porosity have little change.
As shown in Figure 9, using well W1 as an example, under the condition of no fracturing, the single-well productivity is low, and the initial daily oil production is only 1.58 m. After fracturing, the initial daily production of a single well increased to 8.02 m, and the multiplication ratio was 5.1. The 3-year cumulative production increased by 2066 m3, which shows good fracturing stimulation potential.

3.2.2. The Effect of Fracture Orientation

Well W1 was located in the minimum horizontal principal stress direction of the water injection well (W5), and well W2 was located in the maximum horizontal principal stress direction of W5. The fracture orientations of the two wells were inconsistent with the effective direction of water injection, but the other fracture parameters were the same; therefore, the production conditions were compared. As shown in Figure 10, the fracture direction of well W1 was perpendicular to the line connecting the oil injection wells. In the pressure flooding process, the water injection front advanced evenly, the water cut increased more slowly, and the initial production declined more slowly. Water injection lasted longer. The direction of the fracture in well W2 was parallel to the line connecting the oil injection well. During the water injection process, the water flooding front protruded more considerably along the dominant fracture channel, resulting in a faster rise in the water cut and rapid decline in the production of the well. Therefore, the effect of fracture orientation on the production effect of production wells should be fully considered in the process of reservoir development and well deployment.

3.2.3. The Effect of Oil Displacement Agent

Taking well W1 as an example, the production process of conventional water injection and the effect of the oil displacement agent addition were simulated. The mass concentration of the oil displacement agent was 0.5%, and the influence of the oil displacement agent on the production effect during the water injection process was analyzed. As shown in Figure 11, the production trend in the early stages of the two cases is the same; the single-well production decreases and the water cut increases. After 400 d of production, the oil-displacing agent reached the vicinity of the production well, the oil–water mobility ratio increased, and the water-cut rise rate slowed down. The daily oil production was stable at approximately 3 m3, and the cumulative oil increase was 643.7 m3 in 3 years.

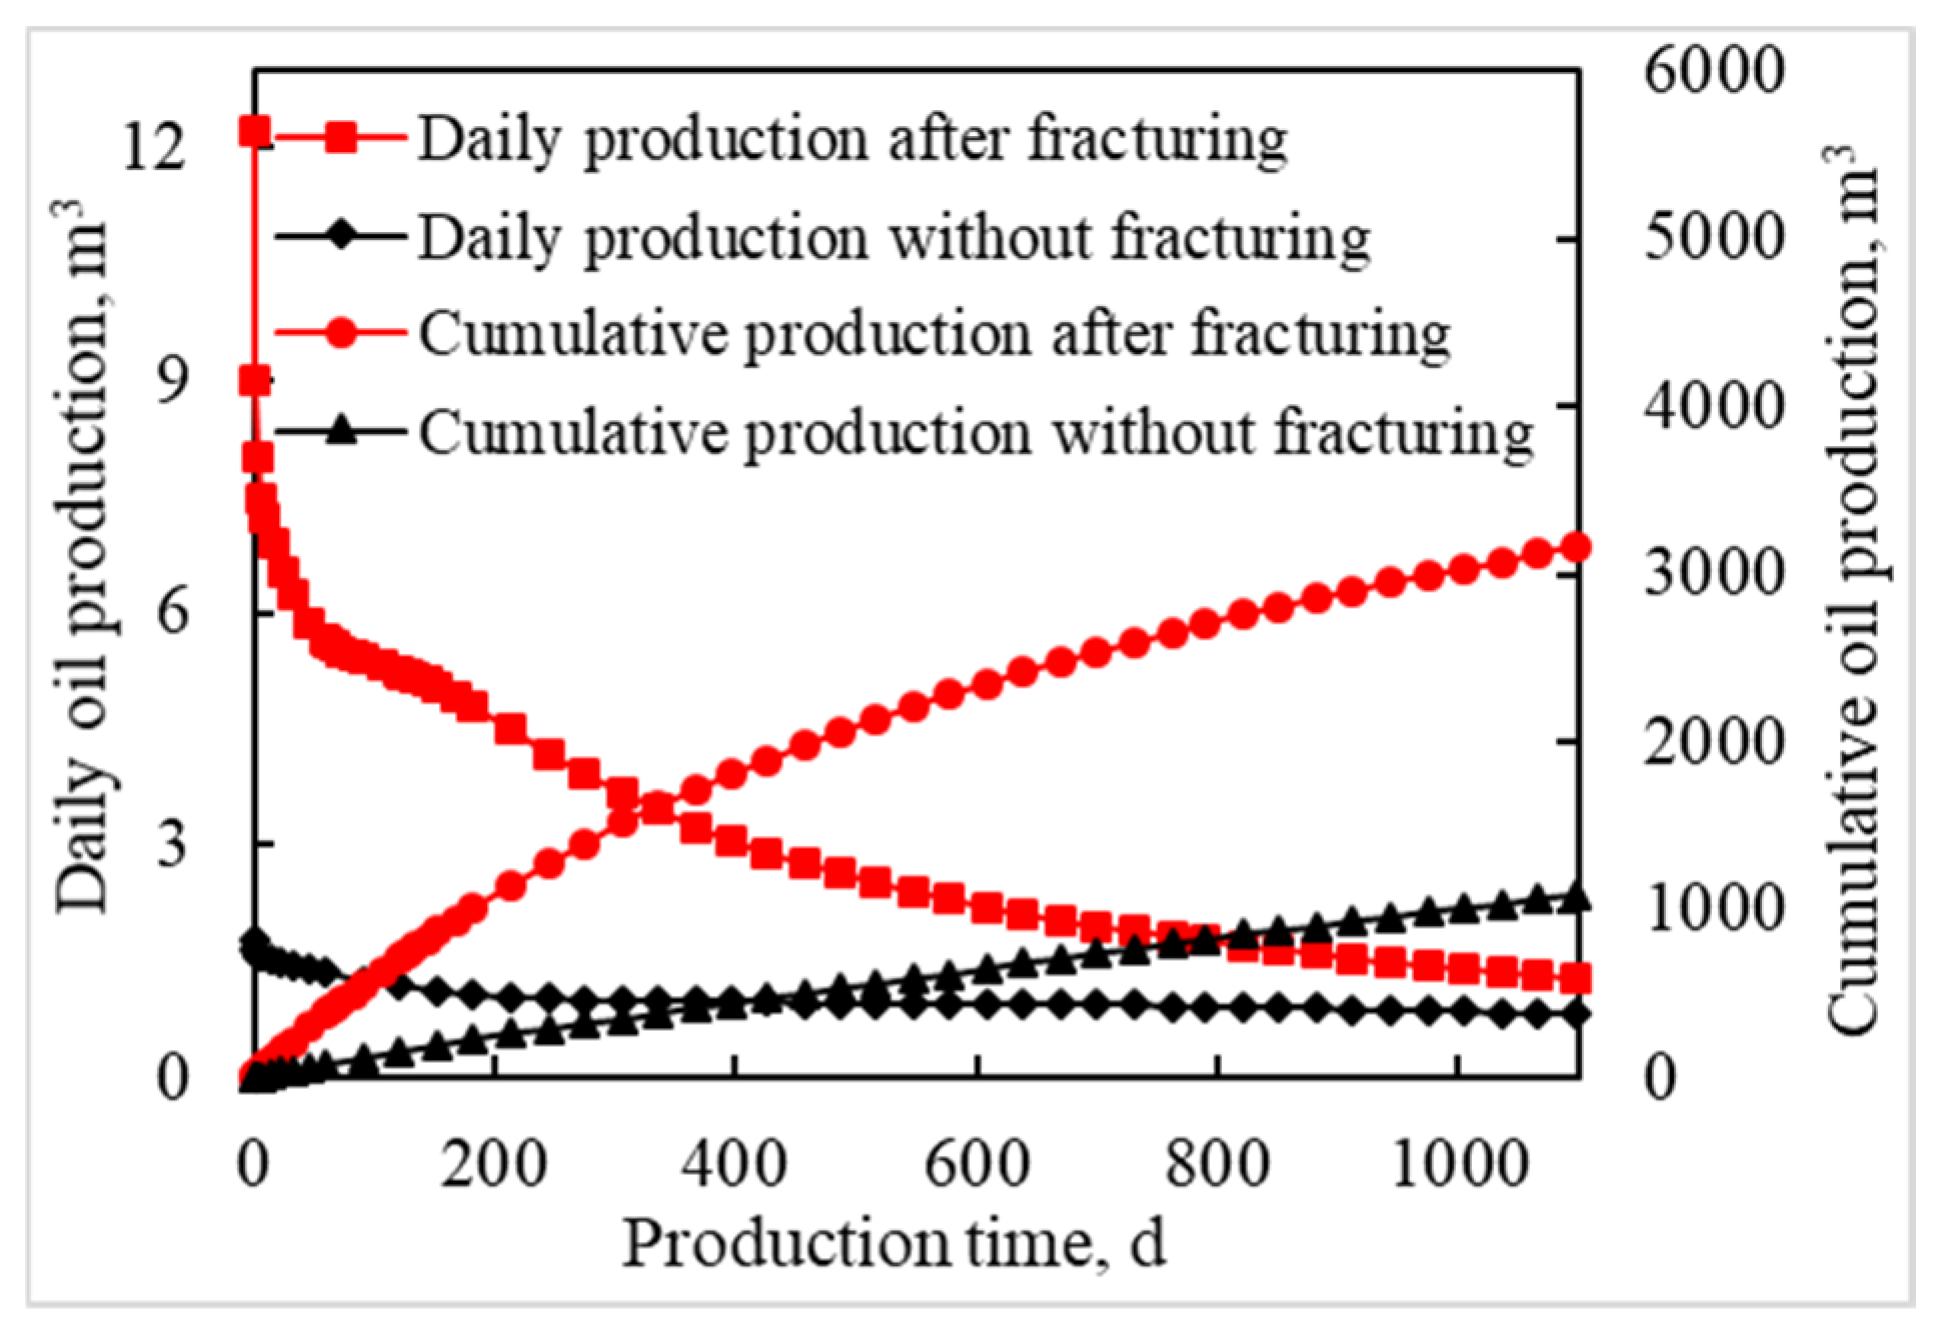
3.2.4. Comparison between Fracturing Flooding and Conventional Fracturing

According to the fracturing flooding technology of low-permeability sandstone reservoirs in the Shengli oilfield, water was rapidly injected into the formation of well W5 at an injection rate of 0.5 m3/min (the mass concentration of the oil displacement agent was 0.5%) to supplement the formation energy. After 2 months, a total of 43,200 m3 was injected. Conventional water injection with an injection rate of 30 m3/d was subsequently used, and the production well was opened for production. A comparison between the fracturing flooding process and conventional fracturing production is shown in Figure 12. The daily oil production of conventional fracturing was 8.02 m3, and the cumulative oil production after 3 years was 3793 m3. After the completion of fracturing flooding, the formation energy was sufficient, and the initial daily oil production was 27.3 m3. However, the production decreased rapidly in the early stages. After 180 d of fracturing flooding, the production dropped to the same level as that of conventional fracturing (4.2 m3). In other words, the period of fracturing flooding was valid for 6 months, and after 3 years, the cumulative oil increase was 970 m3, and the effect of fracturing flooding was obvious.

3.3. Fracture Morphology Optimization

Taking wells W1 and W2 located in different horizontal principal stress directions of injection well W5 as an example, under the condition of constant production pressure difference, the 3-year cumulative oil production was used as the index to optimize the fracture length and conductivity. As shown in Figure 13, with an increase in the fracture half-length, the 3-year cumulative oil production of well W1 continued to increase, but the rate of increase continued to decrease. Based on the increase in production, the fracture half-length of well W1 was optimized to 90 m. The production of well W2 was more significantly affected by the fracture length. When the fracture half-length was less than 80 m, the cumulative oil production increased with the fracture length. When the fracture half-length was greater than 80 m, with a further increase in the fracture length, water channeling occurred sooner in the production well owing to the influence of the water injection front, which significantly affected the production. Therefore, the optimal fracture half-length of well W2 is 80 m.
Based on the optimal fracture length, the 3-year cumulative oil production under a conductivity of 15–35 D·cm was simulated. As shown in Figure 14, with an increase in conductivity, the cumulative production increases continuously but the rate of increase gradually decreases. Considering the economic benefits, the optimized fracture conductivities of wells W1 and W2 were 20 and 25 D·cm, respectively.

4. Field Application

Taking the low-permeability sandstone reservoir fracturing flooding well group (G well group) in the Shengli oilfield as an example, field implementation was carried out based on previous research results. According to the logging data of the well, the corresponding reservoir parameters were sorted, and a small layer with a higher brittleness index was selected as the perforation location. As shown in Figure 15, the red circle represents the preferred perforation position. According to the optimization results of the fracturing flooding numerical simulation, the half-length of the fractures in wells W1 and W4, located in the direction of the minimum horizontal principal stress of the injection well (W5), was designed to be 90 m, and their conductivity was 20 D·cm. The half-length of the fractures in wells W2 and W3, located in the direction of the maximum horizontal principal stress of the water injection well, was designed to be 80 m, and the conductivity was 25 D·cm. The construction parameters were optimized based on the fracture parameters and implemented on-site.
Considering well W1 as an example for post-fracturing analyses, well W6 is an adjacent well in the same layer as well W1, and well W6 adopts conventional methods for fracturing design and implementation. The comparison parameters are listed in Table 5. As shown in Figure 16, because the sandstone interval with a higher brittleness index is more likely to initiate fracture, the fracture pressure of well W1 at the preferred perforation location was lower, and the pumping pressure was reduced by 5–10 MPa, which effectively reduced the construction risk. According to the net pressure fitting results, the actual half-fracture length of well W1 was 87.4 m, the conductivity was 20.5 D·cm, and the errors in the design parameters were less than 3%.
By comparing the two wells under different fracturing parameters (Figure 17), it can be seen that the initial daily oil production of well W1 was 12.5 m3, which is 5.6 m3 higher than that of well W6, and the production of well W1 was stable for a longer time. This series of technologies were adopted by Shengli oilfield and applied to more than 20 low-permeability sandstone production wells in the Bohai Bay basin, and the average daily oil production per well increased by 3.5 m3, which greatly improved the fracturing stimulation effect.

5. Conclusions

(1)
Feldspar, quartz, carbonate, and clay are the main minerals of the low-permeability sandstone in the Bohai Bay basin, with contents of 41%, 34%, 9%, and 16%, respectively. The average Young’s modulus and Poisson’s ratio of the rocks in the fourth member of Shahejie are 14,856 MPa and 0.254, respectively.
(2)
From the three aspects of rock mineral composition, mechanical parameters, and stress–strain characteristics, it is concluded that the main controlling factors affecting the complexity of rock fractures mainly include quartz content, Young’s modulus, and peak stress. The brittleness index was evaluated, and the weight coefficients of the influencing factors were calculated as 0.303, 0.358, and 0.339, respectively.
(3)
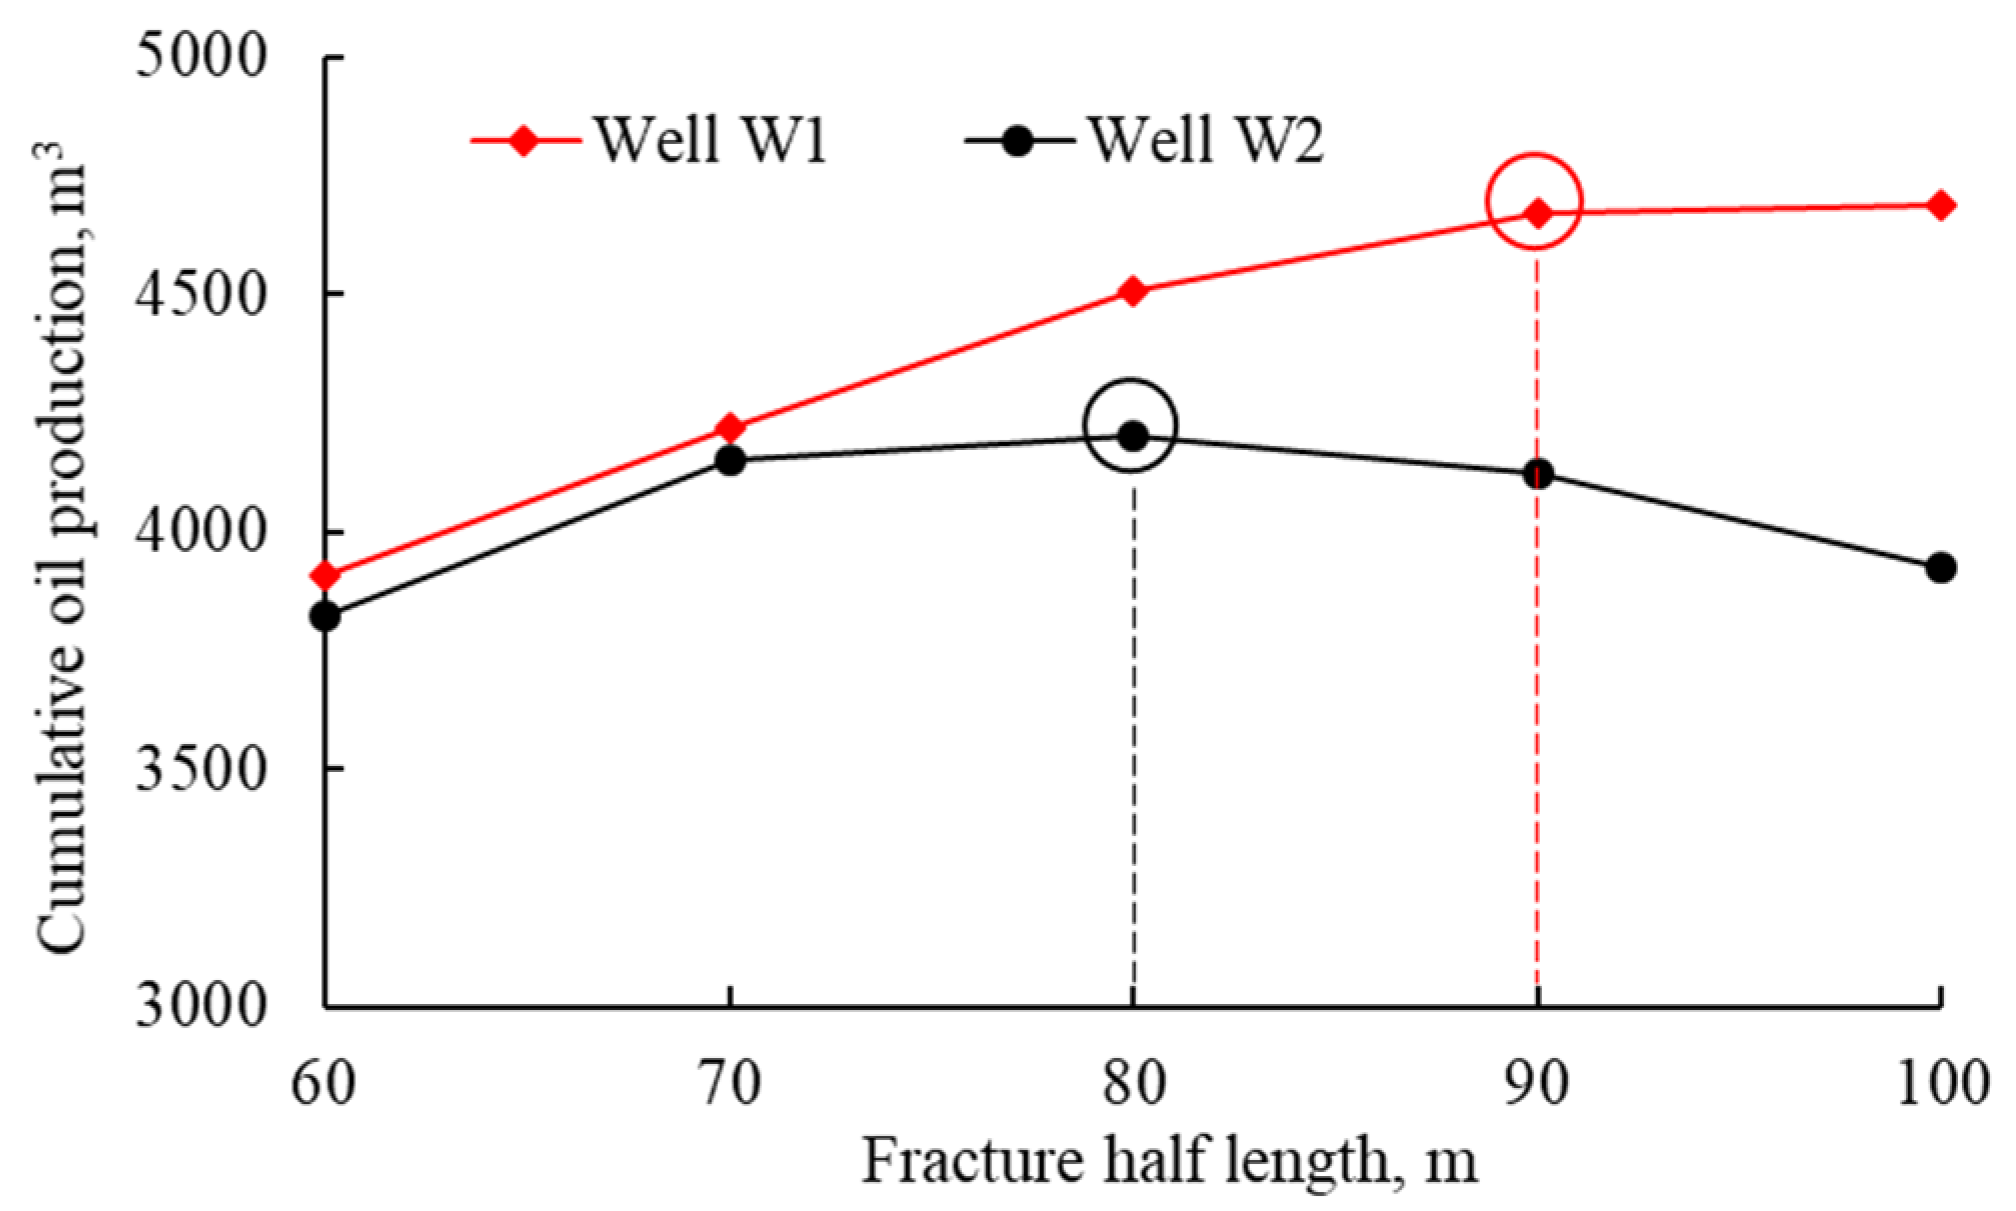
For production wells, in the direction of minimum horizontal principal stress, the swept area of water flooding should be expanded, the fracture length should be optimized to 90 m, and the fracture conductivity should be 20 D·cm. To fracture production wells in the direction of the maximum horizontal principal stress, the advancing speed of the water injection front should be slowed down to reduce the risk of water channeling in injection-production wells. The optimized fracture length was 80 m, and the fracture conductivity was 25 D·cm.
(4)
The fracturing perforation location was optimized by analyzing the brittleness index of the target interval of the reservoir, and the fracture parameters were optimized by numerical simulation of fracturing flooding. This series of technologies was adopted by the Shengli oilfield and applied to more than 20 low-permeability sandstone production wells in the Bohai Bay basin, which increased the average daily oil production per well by 3.5 m3, prolonged the stable production time, and enhanced the fracturing stimulation effect to a certain extent.

Author Contributions

C.L., conceptualization, methodology, supervision, funding acquisition, writing—review and editing; L.M., methodology, validation, writing—original draft, investigation, writing—review and editing; J.G., supervision, funding acquisition; L.Z., supervision, funding acquisition; S.X., methodology, validation; B.C., supervision, funding acquisition; Y.Z., supervision, funding acquisition; H.Y., supervision, funding acquisition; Z.T., supervision, funding acquisition. All authors have read and agreed to the published version of the manuscript.

Funding

This research was funded by the National Natural Science Foundation of China (grant number 52022087), National Natural Science Foundation of China Joint Fund Project Key Support Project (grant number U21A20105), and the major project of CNOOC Beijing Research Institute: Study on multi-scale and multi-dimensional Optimization Technology of geoengineering integration for offshore low permeability reservoir (CCL2022RCPS0361KQN).

Institutional Review Board Statement

Not applicable.

Informed Consent Statement

Not applicable.

Data Availability Statement

Data are available in the article.

Acknowledgments

All individuals included in this section have consented to the acknowledgment.

Conflicts of Interest

The authors declare no conflict of interest.

Nomenclature

Dthe fractal dimension of the core end-face fracture
Rthe side length of the square boxes (cm)
Nthe number of square boxes containing fractures
Cpthe proportionality constant
Fcthe fracturing coefficient
αthe fracture angle (°)
Blsthe dimensionless low-permeability sandstone brittleness index
Qnthe normalized quartz content
Enthe normalized Young’s modulus
σpnthe normalized peak stress
W1, W2, W3the weight coefficients of each dimensionless parameter
EYoung’s modulus (MPa)
athe unit conversion factor
ρthe rock density (g/m3)
tsthe shear wave log data (μs/m)
tpthe compression wave log data (μs/m)
φmthe dimensionless reservoir matrix porosity
ρκthe density of fluid κ (g/cm3)
κoil or water
Sκ,mthe saturation of fluid κ in the reservoir matrix
q κ , m w the flow exchange term for fluid κ between the wellbore and reservoir matrix (m3/d)
qκ,fmthe flow exchange term for fluid κ between the wellbore and reservoir matrix—that is, the flow of fluid κ from the fracture to the reservoir matrix (m3/d)
kmthe absolute permeability of the reservoir matrix (mD)
krκthe dimensionless relative permeability of fluid κ
μκthe viscosity of fluid κ (mPa·s)
pκ,mthe pressure of fluid κ in the reservoir matrix (MPa)
tis the production time (s)
φfthe dimensionless fracture porosity
Sκ,fthe saturation of fluid κ in the fracture (dimensionless)
q κ , f w the flowrate of fluid κ from the production well to the fracture (m3/d)
qκ,mfthe flowrate of fluid κ from the reservoir matrix to the fracture (m3/d)
kfthe absolute permeability of the fracture (mD)
pκ,fthe pressure of fluid κ in the fracture (MPa)
φm0the dimensionless initial reservoir matrix porosity
Cthe dimensionless matrix porosity compressibility
pmtthe matrix pore pressure (MPa)
p0the initial reservoir pressure (MPa)
φf0the dimensionless initial fracture porosity
Cfthe dimensionless fracture porosity compressibility
pftthe fracture pressure (MPa)
km0the initial permeability of the reservoir matrix (mD)
dthe dimensionless matrix permeability stress sensitivity coefficient
kf0the initial permeability of the fracture (mD)
dfthe dimensionless fracture permeability stress sensitivity coefficient
pofthe oil pressure in the fracture (MPa)
pwfthe water pressure in the fracture (MPa)
pomthe oil pressure in the matrix (MPa)
pwmthe water pressure in the matrix (MPa)
pcthe capillary pressure in the matrix (MPa)
Csthe volume fraction of the oil-displacing agent in the water phase (%)
ρsthe density of the oil-displacing agent (kg/m3)
μwsthe solution viscosity of the oil-displacing agent and water mixture (mPa·s)
Dwsthe dimensionless diffusion coefficient of the oil-displacing agent in the water phase
Qathe adsorption term of the oil-displacing agent in the pore matrix
Qsthe injection source term of the oil-displacing agent
WIfthe well index in the fracture grid (m3/d·MPa)
pfthe pressure in the fracture (MPa)
pwthe bottom-hole flow pressure (MPa)
WImthe well index in the matrix grid (m3/d·MPa)
pmthe pressure in the matrix (MPa)
q w , m w the water flow exchange term between the wellbore and reservoir matrix (m3/d)
C s w a constant that represents the volume fraction of the oil-displacing agent at the bottom of the injection well (%)

References

  1. Wu, Q.; Xu, Y.; Wang, X.Q.; Wang, T.F.; Zhang, S.L. Volume fracturing technology of unconventional reservoirs: Connotation, optimization design and implementation. Pet. Explor. Dev. 2012, 39, 352–358. [Google Scholar] [CrossRef]
  2. Xu, Y.; Lei, Q.; Chen, M.; Wu, Q.; Yang, N.Y.; Weng, D.W.; Li, D.Q.; Jiang, H. Progress and development of volume stimulation techniques. Pet. Explor. Dev. 2018, 45, 874–887. [Google Scholar] [CrossRef]
  3. Lei, Q.; Guan, B.S.; Cai, B.; Wang, X.; Xu, Y.; Tong, Z.; Wang, H.Y.; Fu, H.F.; Liu, Z.; Wang, Z. Technological progress and prospects of reservoir stimulation. Pet. Explor. Dev. 2019, 46, 580–587. [Google Scholar] [CrossRef]
  4. Ding, B.; Xiong, C.M.; Geng, X.F.; Guan, B.S.; Pan, J.J.; Xu, J.G.; Dong, J.F.; Zhang, C.M. Characteristics and EOR mechanisms of nanofluids permeation flooding for low-permeability oil. Pet. Explor. Dev. 2020, 47, 756–764. [Google Scholar] [CrossRef]
  5. He, J.G.; Wang, H.W. Design and Effect of Fracture-flooding in Class III Oil Reservoirs. J. Southwest Pet. Univ. Sci. Technol. Ed. 2018, 40, 95–104. [Google Scholar]
  6. Xu, B. Study on Mechanism and Mathematical Model of Fracturing and Percolation Enhanced Oil Recovery in Medium and Low Permeability Reservoirs: An Example in the Xingbei Development Zone of Daqing Oilfield; Northeast Petroleum University: Daqing, China, 2019. [Google Scholar]
  7. Wang, J.L.; Liu, Y.Z.; Chen, M.Q.; Liu, L.; Gao, J. Experimental study on dynamic imbibition mechanism of low permeability reservoirs. Pet. Explor. Dev. 2009, 36, 86–90. [Google Scholar]
  8. Liu, H.L.; Xiong, W.; Gao, S.S.; Xue, H.; Hu, Z.M. Physical Modeling of Water-Oil Displacement in Hydraulic Fractured Horizontal Wells. Xinjiang Pet. Geol. 2010, 31, 171–173. [Google Scholar]
  9. Zhang, H.N.; Chen, J.T. Insights into Energy Storage Bulk Fracturing Technology for Low-permeability Oilfields—A Case Study of Peripheral Wellblock of Jilin Oilfield. Unconv. Oil Gas 2015, 2, 55–60. [Google Scholar]
  10. Wu, Z.B.; Li, L.; Yan, Y.Q. New development pattern of network fracturing and imbibition oil recovery for super-low permeability oil reservoirs. Fault-Block Oil Gas Field 2019, 26, 491–494. [Google Scholar]
  11. Shi, Y.H. Subject: Study on Fracturing Fluid’s Imbibition of Chang-7 Source Based on Nuclear Magnetic Resonance; Xi’an Shiyou University: Xi’an, China, 2018. [Google Scholar]
  12. Xu, Y.H.; Meng, Y.; Shi, S.G. Design Method of Water Injection Rate for High-Pressure Water Injection in Low Permeability Reservoirs. Inn. Mong. Petrochem. Ind. 2021, 47, 118–121. [Google Scholar]
  13. Lu, C.; Ma, L.; Zhang, T.; Guo, J.C.; Li, M.; Huang, B. A novel hydraulic fracturing method and case study based on proppant settlement transport model. In Proceedings of the 53rd ARMA Rock Mechanics/Geomechanics Symposium, New York, NY, USA, 23–26 June 2019. [Google Scholar]
  14. Tarasov, B.; Potvin, Y. Universal criteria for rock brittleness estimation under triaxial compression. Int. J. Rock Mech. Min. Sci. 2013, 59, 57–69. [Google Scholar] [CrossRef]
  15. Lu, C.; Ma, L.; Li, Z.L.; Huang, F.L.; Huang, C.H.; Yuan, H.R.; Tang, Z.B.; Guo, J.C. A Novel Hydraulic Fracturing Method Based on the Coupled CFD-DEM Numerical Simulation Study. Appl. Sci. 2020, 10, 3027. [Google Scholar] [CrossRef]
  16. Sun, F.Q.; Du, S.H.; Zhao, Y.P. Fluctuation of fracturing curves indicates in-situ brittleness and reservoir fracturing characteristics in unconventional energy exploitation. Energy 2022, 252, 124043. [Google Scholar] [CrossRef]
  17. Hucka, V.; Das, B. Brittleness determination of rocks by different methods. Int. J. Rock Mech. Min. Sci. Geomech. Abstr. 1974, 11, 389–392. [Google Scholar] [CrossRef]
  18. Jarvie, D.M.; Hill, R.J.; Ruble, T.E. Unconventional shale-gas systems: The Mississippian Barnett Shale of north-central Texas as one model for thermogenic shale-gas assessment. AAPG Bull. 2007, 91, 475–499. [Google Scholar] [CrossRef]
  19. Rickman, R.; Mullen, M.J.; Petre, J.E.; Grieser, W.V.; Kundert, D. A practical use of shale petrophysics for stimulation design optimization: All shale plays are not clones of the Barnett Shale. In Proceedings of the SPE Annual Technical Conference and Exhibition, Denver, CO, USA, 21–24 September 2008. [Google Scholar]
  20. Liu, Z.S.; Sun, Z.D. New brittleness indexes and their application in shale/clay gas reservoir prediction. Pet. Explor. Dev. 2015, 42, 117–124. [Google Scholar] [CrossRef]
  21. Quinn, J.B.; Quinn, D.G. Indentation brittleness of ceramics: A fresh approach. J. Mater. Sci. 1997, 32, 4331–4346. [Google Scholar] [CrossRef]
  22. Xiao, Y.; Guo, J.C. Optimization of Fracturing Parameters for Low Permeability and Heterogeneous Reservoir Production well. Sci. Technol. Eng. 2012, 12, 9019–9022. [Google Scholar]
  23. Xu, C.C.; Chen, C.H.; Wang, B.; Wu, Y.H.; Peng, C.J. Fracture parameter optimization of network fracturing for horizontal well in low permeability and low-permeability oil reservoir. Fault-Block Oil Gas Field 2014, 21, 823–827. [Google Scholar]
  24. Lei, Q.; Weng, D.W.; Guan, B.S.; Mu, L.J.; Xu, Y.; Wang, Z.; Guo, Y.; Li, S. A novel approach of stimulation based on fracture controlling optimization and design. Pet. Explor. Dev. 2020, 47, 1–8. [Google Scholar]
  25. Harimi, B.; Masihi, M.; Mirzaei-Paiaman, A.; Hamidpour, E. Experimental study of dynamic imbibition during water flooding of naturally fractured reservoirs. J. Pet. Sci. Eng. 2018, 174, 1–13. [Google Scholar] [CrossRef]
  26. Lucas, M.; Mohsen, T.; Ke, X.; Miguel, M.; Du, Y.J.; Matthew, B. Surfactant flooding in oil-wet micromodels with high permeability fractures. Fuel 2019, 241, 1117–1128. [Google Scholar]
  27. Lu, C.; Ma, L.; Guo, J.C.; Li, X.Y.; Zheng, Y.C.; Ren, Y.; Yin, C.B.; Li, J.F.; Zhou, G.Q.; Wang, J.D.; et al. Novel Method and Case Study of a Deep Shale Fracability Evaluation Based on the Brittleness Index. Energy Explor. Exploit. 2021, 40, 1–18. [Google Scholar] [CrossRef]
  28. He, T. Research on Compressibility Evaluation of Low-Permeability Sandstone Reservoirs in the Second Member of Kong 2 Member in Dagang Oilfield; Southwest Petroleum University: Chengdu, China, 2016. [Google Scholar]
  29. Xu, S.Q.; Ren, G.T.; Younis, R.M.; Feng, Q.H. Revisiting field estimates for carbon dioxide storage in depleted shale gas reservoirs: The role of geomechanics. Int. J. Greenh. Gas Control 2021, 105, 103222. [Google Scholar] [CrossRef]
  30. Wang, J.; Liu, H.Q.; Xia, J.; Liu, Y.T.; Hong, C.; Meng, Q.B.; Gao, Y. Mechanism simulation of oil displacement by imbibition in fractured reservoirs. Pet. Explor. Dev. 2017, 44, 761–770. [Google Scholar] [CrossRef]
  31. Xu, S.Q.; Guo, J.C.; Feng, Q.H.; Ren, G.T.; Li, Y.Y.; Wang, S. Optimization of hydraulic fracturing treatment parameters to maximize economic benefit in tight oil. Fuel 2022, 329, 125329. [Google Scholar] [CrossRef]
Figure 1. Core fracture morphology. (a) Single shear fractures. (b) Split fractures. (c) Complex fractures.
Processes 11 00285 g001
Figure 2. Schematic diagram of the box theory. The red lines represent fractures.
Processes 11 00285 g002
Figure 3. Schematic of the fracture angle on the side of the rock pillar.
Processes 11 00285 g003
Figure 4. Core fracture morphology under different fracturing coefficients. Black dots represent single shear fractures, yellow dots represent split fractures, and red dots represent complex fractures.
Processes 11 00285 g004
Figure 5. Schematic of fracturing flooding well group.
Processes 11 00285 g005
Figure 6. Matrix oil–water phase permeability (a) and capillary pressure curves (b).
Processes 11 00285 g006
Figure 7. The calculation results of the model and CMG.
Processes 11 00285 g007
Figure 8. Evolution process of porosity and permeability.
Processes 11 00285 g008
Figure 9. Production of well W1 with and without fracturing.
Processes 11 00285 g009
Figure 10. Production situation under different fracture orientation conditions.
Processes 11 00285 g010
Figure 11. Influence of oil displacement agent on production efficiency.
Processes 11 00285 g011
Figure 12. Comparison between fracturing flooding and conventional fracturing.
Processes 11 00285 g012
Figure 13. Fracture half-length optimization results.
Processes 11 00285 g013
Figure 14. Fracture conductivity optimization results.
Processes 11 00285 g014
Figure 15. Perforation location optimization results. ①, ② and ③ represent three perforation positions respectively.
Processes 11 00285 g015
Figure 16. Construction data fitting curve.
Processes 11 00285 g016
Figure 17. Daily oil production curve.
Processes 11 00285 g017
Table 1. Basic parameters of the core.
CoreMineral CompositionMechanical ParametersStress–Strain Parameters
CaseClay
(%)
Quartz
(%)
Feldspar
(%)
Carbonate
(%)
Poisson’s RatioYoung’s Modulus
(MPa)
Peak Stress
(MPa)
Residual Stress
(MPa)
Peak Strain
(%)
Residual Strain
(%)
136.132.72110.10.18618,905.4175951.151.48
27.429.24518.50.47417,82963380.390.49
37.429.24518.50.26610,338.349390.420.73
413.630.640.315.40.27822,125.72701751.561.98
515.938.739.16.40.2416,937.574400.530.6
615.938.739.16.40.27412,209.382400.91.32
715.938.739.16.40.35914,529114610.951.18
812.63053.440.266951.227160.580.82
912.63053.440.259223.735190.510.73
1015.33043.810.90.23916,448.8118780.921.24
1115.33043.810.90.24616,617.9120820.871.12
1227.630.730.910.80.05811,602.31401222.14.2
1327.630.730.910.80.4378629.638190.520.63
Table 2. Fracture morphology parameters.
Core CaseFracture MorphologyFractal DimensionFracture Angle
(°)
Fracturing Coefficient
1split fractures1.2051.20
2single shear fractures1.50251.08
3single shear fractures1.36201.06
4complex fractures1.96451.24
5split fractures1.69121.17
6split fractures1.35121.17
7split fractures1.9491.08
8complex fractures1.44351.20
9split fractures1.44101.19
10complex fractures1.47361.21
11split fractures1.2041.20
12single shear fractures1.58201.05
13complex fractures1.39421.20
Table 3. Analysis of influencing factors of rock fracture complexity.
Influencing FactorCorrelation CoefficientInfluencing FactorCorrelation CoefficientInfluencing
Factor
Correlation Coefficient
Clay0.0276Peak stress0.1446Young’s modulus0.1269
Quartz0.1071Peak strain0.0019Poisson’s ratio0.0076
Feldspar0.0004Residual stress0.0453————
Carbonate0.0858Residual strain0.0405————
Table 4. Reservoir geological parameters.
ParametersValueParametersValue
Model size
(m)
1000 × 1000 × 30Rock compression properties
(MPa−1)
6.0 × 10⁻⁶
Surface crude oil density
(g·cm−3)
0.86Formation water compressibility
(MPa−1)
4.42 × 10⁻⁶
Surface water density
(g·cm−3)
1.00Crude oil compressibility
(MPa−1)
3.60 × 10⁻⁵
Surface crude oil viscosity
(mPa·s)
21.10Original gas oil ratio27.40
Formation water viscosity
(mPa·s)
0.46Formation temperature
(°C)
112.00
Formation crude oil volume factor1.30Regional formation pressure
(MPa)
30.00
Matrix porosity
(%)
12Formation pressure coefficient1.10
Matrix permeability
(mD)
5Reservoir vertical depth
(m)
2900.00
Table 5. Construction parameter comparison results.
Well NameFracture Pressure (MPa)Pumping Pressure (MPa)Design Half-Fracture Length (m)Actual Half-Fracture Length (m)Design Conductivity (D·cm)Actual Conductivity (D·cm)Daily Oil Production
(m3)
W131.236~409087.42021.412.5
W638.541~50120116.33032.86.9
Disclaimer/Publisher’s Note: The statements, opinions and data contained in all publications are solely those of the individual author(s) and contributor(s) and not of MDPI and/or the editor(s). MDPI and/or the editor(s) disclaim responsibility for any injury to people or property resulting from any ideas, methods, instructions or products referred to in the content.

