Article

Transport Behavior of Methane Confined in Nanoscale Porous Media: Impact of Pore Evolution Characteristics

1
State Key Laboratory of Shale Oil and Gas Enrichment Mechanism and Effective Development, Beijing 100101, China
2
School of Chemical Engineering and Technology, China University of Mining and Technology, Xuzhou 221116, China
3
PetroChina Coalbed Methane Company Limited, Beijing 100028, China
4
China Oil & Gas Pipeline Network Corporation, Beijing 100007, China
5
School of Mining, China University of Mining and Technology, Xuzhou 221116, China
*
Author to whom correspondence should be addressed.
Processes 2022, 10(12), 2746; https://doi.org/10.3390/pr10122746
Submission received: 16 November 2022 / Revised: 15 December 2022 / Accepted: 16 December 2022 / Published: 19 December 2022
(This article belongs to the Special Issue Advances in Enhancing Unconventional Oil/Gas Recovery)

Abstract

:
As a key technical aspect contributing to shale gas development, nanoconfined methane flow behavior has received tremendous research interest, which remains challenging to understand clearly. The majority of previous contributions put emphasis on the mechanism model for methane confined in a single nanopore; at the same time, the other part focusing on an upscaling approach fails to capture the spatial pore-network characteristics as well as the way to assign pressure conditions to methane flow behavior. In light of the current knowledge gap, pore-network modeling is performed, in which a pore coordination number, indicating the maximum pores a specified pore can connect, gas flow regimes classified by Knudsen numbers, as well as different assigned pressure conditions, are incorporated. Notably, the pore-network modeling is completely self-coded, which is more flexible in adjusting the spatial features of a constructed pore network than a traditional one. In this paper, the nanoconfined methane flow behavior is elaborated first, then the pore network modeling method based on the mass conservation principle is introduced for upscaling, and in-depth analysis is implemented after that. Results show that (a) as for porous media with pore sizes ranging from 5~80 nm, dramatic advancement on apparent gas permeability takes place while pressure is less than 1 MPa; (b) apparent gas permeability evaluated at a specified pressure shall be underestimated by as much as 31.1% on average compared with that under the pressure-difference condition; (c) both a large pore size and a high coordination number are beneficial for strong gas flow capacity through nanoscale porous media, and the rising ratio can reach about 6 times by altering the coordination number from 3 to 7, which is quantified and presented for the first time.

1. Introduction

The development of unconventional gas reservoirs, such as shale gas, coal seam gas, and tight gas, is a feasible approach to reduce coal combustion as well as CO2 emissions [1,2]. As reported by the EIA at the end of 2020, the geological reserve of shale gas reaches 317.76 trillion cubic feet, accounting for 70.68% of total proved natural gas reserves in the United States. As a result, both the petroleum industry and the ecological environment will benefit from the successful exploitation of shale gas [3,4]. With the combination of hydraulic fracturing technology and multi-lateral horizontal wells [5,6], gas production performance from ultra-tight shale formations with rich nanoscale pores has been surprisingly enhanced in the past few decades. At the same time, theoretical breakthroughs in shale gas production, particularly for methane confined in nanoscale pore space, are still challenging. Although profound knowledge of multi-scale gas flow physics in shale is the best guarantee for shale gas development, upscaling the method from nanoconfined flow to that in porous media remains undeveloped [7,8], and flow behavior at the shale core scale is still vague.
Basically, existing research focusing on shale gas production can be classified into three types according to scale, suggesting the nanoscale, core scale, and reservoir scale. Massive research efforts are devoted to revealing the nanoconfined gas flow mechanism [9,10], which is fairly mature to date. In accordance with the Knudsen number, a parameter evaluating the gas sparsity under nanoconfinement, there are four different flow regimes, including continuum flow, slip flow, transition flow, and free molecular flow, in the order of the rising gas rarefaction effect. Naturally, a great deal of researchers proposed unified models, attempting to cover all the mentioned flow regimes. Insightfully, Song et al. (2016) proposed an apparent gas permeability model coupling bulk-gas flow and surface diffusion contributed by adsorption molecules [11]. The key correlation reproducing the above four flow regimes is referred to in Beskok and Karniadakis (1999) [12]. After that, Wu et al. (2016) noticed the intermolecular collisions would be responsible for alteration of flow regimes [13], they developed a model for bulk gas transport, and its reliability has been well clarified by MD (molecular simulation) and experimental data. In addition, the model for bulk gas transport is further developed by considering inherent water distribution features [14,15], surface roughness [16], various gas types [17,18], and other influential factors [19,20]. After decades of development, a solid theoretical background for bulk gas transport at the nanoscale can be demonstrated. As for research on the reservoir scale, numerical simulation is the primary tool; however, the majority of which fail to couple dynamic shale matrix permeability due to the alteration of the four mentioned flow regimes. Therefore, the prediction output from numerical simulation is hard to match with the actual production performance of realistic shale gas wells. Thus, the link between research on the nanoscale and that on the reservoir scale is significantly necessary, which is believed to be research on the core scale. The apparent permeability evaluated at the shale core scale can be utilized as the macroscopic value for the reservoir scale, which also couples microscopic flow mechanisms in each nanopore constructing the core porous media. In this work, a self-coded pore network modeling framework is presented for the first time, sharing the advantage of controlling every key aspect of the constructed pore network and formulas representing nanoconfined flow behavior, expecting to shed light on gas flow performance and capacity through ultra-tight porous media.
Actually, to reach characterization of gas flow at the core scale other than through pore network modeling, there are additional approaches such as the classic capillary bundle model [21] and the lattice Boltzmann model (LBM) [22]. Pore network modeling is a direct technological advancement against the classic capillary bundle. LBM is able to capture gas flow mechanisms from a microscopic perspective and can also represent gas flow behavior in a complex pore structure. However, the calculation of LBM upon gas flow in porous media is time-consuming, as it requires sufficient computational resources to handle gas flow complexity in each nanopore [23,24]. In contrast, pore network modeling incorporates the theoretical model for gas transport in nanopores, greatly accelerating the calculation efficiency. Song et al. (2017) utilized pore network modeling to study gas transport behavior and identify the contributions of each flow mechanism; its reliability was verified in combination with LBM results [25]. Yang et al. (2019) extended the applicability of pore network modeling from the gas phase to the oil phase, considering oil positive slip in shale organic nanopores and negative slip in inorganic nanopores [26]. Wang and Sheng (2019) simulated gas-water two-phase flow at the shale core scale [27], in which the organic and inorganic parts are distinguished and generated by a newly proposed stochastic algorithm. Cui et al. (2019) investigated oil-water flow in nanoscale porous media [28], caused by fracturing water invasion, and a computational fluid dynamics (CFD) method was applied to quantify pore cross-section on fluid flow flux. Yi et al. (2021) performed an in-depth analysis on the way to extract the pore network from the shale sample [29], presenting the feasibility of the apparent pore network (APN) over the intrinsic pore network (IPN) after simulating gas transport in nanoscale porous media. A brief summary of the main current research related to gas-phase PNM is provided in Table 1.
Based on the above analysis, although current research on PNM has achieved fairly accurate prediction of fluid flow in nanoscale porous media, several key shortcomings remain to be overcome. First, the effect of the spatial structure of the pore network, such as the pore size distribution (PSD) and coordination number, on the gas flow behavior has not been investigated completely. Furthermore, the most common method for determining fluid flow capacity is to assign a typical pressure with a negligible pressure difference, while the presence of a pressure difference during the depressurization development process is obvious. As a result, the frequently utilized way to assign pressure condition is different from that in field condition, while the associated impact resulting from the difference is unclear. In light of current research updates, research is performed to try to fill the above-mentioned knowledge gap. It should be underlined that the pore network modeling in this work is totally self-coded, with great flexibility to alter the spatial structure of the pore network, which facilitates identifying the influences of each parameter. Both the PSD and the coordination number of gas transport in nanoscale porous media are investigated. Moreover, the way of assigning pressure conditions is discussed, and a detailed analysis is provided. Therefore, the novel technical part of this research basically resides in the incorporation of spatial pore-network structure and sensible pressure conditions for realistic field exploitation.
The whole paper context is arranged in the following way. The physical model making clear the essential advantage of pore network modeling over the traditional mechanism model or capillary bundle model is presented first. Then, reliable formulas reproducing the nanoconfined gas flow behavior are introduced, and the primary concepts establishing the pore network modeling are briefly provided, including the part to generate concrete spatial structure and that for flow capacity calculation. After that, gas transport through nanoscale porous media is seriously discussed. Finally, several conclusions are drawn.

2. Physical Model

In order to reach a good understanding of gas flow in the shale matrix, which is ultra-tight and rich in nanopores with pore sizes ranging from several nanometers to hundreds of nanometers, typical procedures to achieve the upscaling objective are presented in Figure 1. Generally, research efforts start with the primary mechanism model, representing the gas flow behavior in a single nanopore. As for this technical part, molecular dynamics (MD), theoretical modeling, as well as advanced experimental measurement, are used to investigate the nanoconfined gas transport behavior. With the intention to bridge nanoconfined flow and reservoir simulation, it entails an effective tool to transition the mechanism model to that suitable for shale core scale, which can be applied as reservoir permeability. At the very beginning, the classic capillary bundle model is utilized, consisting of a certain number of nanopores with various pore radii, pore lengths, and tortuosities. Although the capillary bundle model is a fairly direct upscaling method, there is an evident difference between the capillary bundle model and the realistic shale matrix, limiting its accuracy on gas flow in porous media. In the capillary bundle model, gas flux in a specific nanopore does not affect that in neighboring nanopores, which seriously conflicts with the actual case. In light of this, pore network modeling is developed, which generally includes two parts. The first part is the construction of the pore network, which is a spatial structure composed of massive nanopores with assigned pore network information, including pore size distribution, coordination number, and so on. Then, the second part is the simulation of gas flow in porous media, which is inherently dependent on the mechanism model and the mass conservation principle. From the perspective of flow physics, pore network modeling is evidently superior to the capillary bundle model, which is able to capture gas flux exchange between nanopores and has a more complicated spatial structure.
In this work, self-coded pore network modeling is utilized so that pore size distribution, coordination number, and skeleton porosity can be accurately and conveniently controlled. Moreover, microscopic flow physics is fully coupled in this pore network modeling, and gas mass flux between nanopores is considered to ensure the mass conservation of the whole system by an efficient algorithm. Notably, the gas flow capacity through porous media is evaluated in a steady state, which is suitable to describe gas permeability in shale matrix during the long-term depressurization development process. In the modeling of this research, the calculation node, representing pores, is over 200, and the number of connecting throats is over 300, which mitigate the uncertainty caused by a discontinuous medium and ensure the reliability of the obtained results.

3. Model Establishment

3.1. Nanoconfined Flow Behavior

The mathematic part of this research starts with the characterization of nanoconfined gas flow behavior, which is apparently different from regular fluid flow described by the classic Navier–Stokes equation [30]. The origin of the difference is caused by the nanoconfinement effect induced by the greatly reduced pore size. From the microscopic viewpoint, the molecular flow velocity near the wall is close to 0 as in the case of bulk scale, and its movability is considered negligible. In contrast, when collisions between gas molecules and the wall surface become dominant, molecular slip takes place at the boundary, manifesting that the movability of molecules near the wall cannot be neglected. It is experimentally reported that nanoconfined flow capacity can reach as great as several orders of magnitude as evaluated by the no-slip equation [31,32].
A number of theoretical models have been proposed to elucidate the discrepancy compared with regular equations for gas flow, and four flow regimes are summarized, consisting of continuum flow, slip flow, transition flow, and free molecular diffusion. The flow regime is heavily dependent on the surrounding pressure and temperature conditions, which are identified by the Knudsen number, with the following formula:
K n = λ r
λ = μ p π Z R T 2 M
where Kn is the Knudsen number, dimensionless; λ is the mean free path, representing the distance a gas molecule can move between two adjacent collision events, its calculation formula is Equation (2), m; r is the pore radius, m; μ is gas viscosity, cp; p is the pressure, MPa; R is the gas universal constant, which is equal to 8.314 J/mol/K; Z is the gas compressibility factor, dimensionless; T is the temperature, K; M is the gas molar mass, 16 g/mol.
After carefully checking existing models developed for nanoconfined gas flow, the primary constitutive equation for the majority of current models describing bulk-gas flow in nanopores is Beskok and Karniadakis (1999), covering the entire Knudsen number range. Thus, the reliable model is adopted in this work, notably the stress dependence and surface diffusion of the adsorption phase, which are not considered currently but can be incorporated and discussed in the future. Concrete formulas for gas transport in nanopores considering gas slip are provided below.
K = r 2 8 ( 1 + α K n ) ( 1 + 4 K n 1 + K n )
α = α o 2 π tan 1 ( α 1 K n β )
where α is the rarefaction coefficient, dimensionless; αo is the rarefaction coefficient with infinite Kn, dimensionless; α1 and β are constants, which are 1.19 and 0.4, respectively.
On the basis of Equations (1)–(4), the apparent permeability for gas transport through a nanopore can be calculated. Furthermore, in order to implement the conservation principle of gas mass rate, it is crucial to adopt a suitable approach to obtaining gas physical properties, such as viscosity and density. The classic PVT equation [33,34] is provided below as a beginning point.
P = R T v b a v ( v + b ) + b ( v b )
where v is the molar volume, m3/mol.
Notably, a and b are basic PVT parameters, which are described as a function of critical pressure and critical temperature in the bulk state previously. The authors have noticed variations in gas critical properties under the nanoconfinement effect, also its effect on gas density can result in errors as high as 23% [35]. Thus, the shift of critical properties shall be incorporated in the calculation of gas density. Formulas describing a and b are below.
a = 0.45724 R 2 T c 2 P c [ 1 + κ ( 1 T r ) ]
b = 0.0778 R T c P c
κ = 0.37464 + 1.54226 ω 0.26992 ω 2
where Pc, Tc are the critical nanoconfined gas pressure and temperature, concrete formulas suggesting the shift compared with the original critical properties may refer to our previous research. Tr is the reduced temperature, dimensionless, and ω is the methane acentric factor, dimensionless. Then, the gas density can be sensibly obtained with the given pressure and temperature conditions.
After calculating sensible gas density under the nanoconfinement effect, the formulas below are available for gas viscosity [36,37], which is described as a function of gas density.
μ = ( 1 × 10 4 ) ξ exp ( X ρ Y )
ξ = ( 22.65 + 0.0388 ) T 1.5 209.2 + 19.26 M + 1.8 T
X = 3.448 + 548 + 0.01 M
Y = 2.447 0.224 X
where ρ is gas density, kg/m3; μ is gas viscosity, cp.
Then, for a single nanopore with gas transport, the mass flow rate has the following expression.
q = ρ π r 4 ( 1 + α K n ) ( 1 + 4 K n 1 + K n ) Δ p 8 μ l
where Δp is the pressure difference between the two ends of the nanopore, Pa; l is the length of nanopore, m; q is the mass flow rate, kg/s.

3.2. Pore Network Modeling

First, it is necessary to elaborate pore network construction, in which numerous nanopores with various pore sizes and lengths are connected; the number of nanopores exceeds 200 to mitigate the uncertainty caused by discontinuous medium. Notably, pore size distribution, porosity, and coordination of the ultimate pore network are controlled by a powerful algorithm, ensuring that the generated spatial parameters can have excellent matches against the assigned targets. At the beginning of construction, an assigned number of nodes, suggesting the pores in a tight matrix, are placed randomly in a specific space. Then, the interpore connections take place, suggesting that the nodes find their neighboring nodes and try to connect them at a certain distance. At the same time, the formation of throats is subject to a coordination number, which indicates the average number of throats a node should connect. After that, the basic pore network is established, and a fine algorithm shall complete the assignments of pore size to all throats and pores.
The inherent physics driving proper modeling is the mass conservation of gas flow rates. As for the case of i-th node in the pore network, it may have several connections, like n, indicating that the inflow and outflow of the i-th node must happen in the n connections. Furthermore, for a stable state, the mass flow rates from inflow and outflow should be equal after the whole balance is reached. On the basis of Equation (13), which describes the mass flow rate in a single connection, then the summation of the mass flow rates from n connections has the following expression.
i = 1 i = n q i = 0
Once the pressure of two connected nodes is given, the mass flow rate between them can be calculated, in which gas density and viscosity are evaluated at the arithmetic mean pressure of the two connected nodes. Notably, for the whole pore network, where the total number of nodes is m, as the pressure at each node is unknown from the beginning of the calculation, there exist m unknown pressure values. Moreover, for each node, there exists Equation (14) as a function of its unknown pressure; therefore, m equations exist for m unknown values, indicating the solutions of all nodes can be obtained properly.
After all the unknown pressures are calculated, the nodes connecting to the boundary nodes at the exit side of the whole pore network are identified, and the mass flow rates from these nodes are summarized and regarded as the total gas mass rate. On the basis of the total rate, the apparent permeability of the entire porous medium is obtained using the equation below [38,39,40], in which gas density and viscosity are evaluated at the mean pressures of inlet pressure and outlet pressure.
K a p p = q t μ l ρ π r 2 Δ p
where qt is the total gas mass rate through the pore network, kg/s; Kapp is apparent gas permeability in the constructed pore network, nD.

4. Results and Discussion

In this research, the slip feature and spatial characteristics of nanoscale porous media on apparent gas permeability at the core scale are focused. According to a typical tight gas reservoir located in Xinjiang, China, the pore size in this work falls in the range from 5~80 nm, and the pressure ranges of 0.1~50 MPa [41], covering the entire pressure variation during actual production.

4.1. Rarefaction Phenomenon

The unique feature of nanoconfined flow is the molecular slip at the boundary; other than that, gas flow in nanoscale porous media is affected by network structure. In this section, we put attention on the slip at the boundary, also called the rarefaction phenomenon, the main mechanism contributing to the enhancement of gas flow capacity. The first step in performing pore network modeling is constructing a fancy network with desirable key parameters, like pore size distribution and coordination number. At this point, in order to remove the influence induced by network characteristics, relevant parameters are assigned in advance.
As presented in Figure 2a, from the comparison between the assigned pore size distribution and the actual one generated by the self-coded algorithm provided, it can be demonstrated the algorithm is able to reach a good agreement with the assigned goal. From Figure 2b, it can be observed that the pore size in the network ranges from 5 to 80 nm, also different pores connect in such a way that the coordination number is 3.
The gas flow through nanoscale porous media is simulated under the condition that the pressure difference between the inlet and outlet is set at 0.001 MPa. In this case, the gas flow capacity at a specified pressure condition can be mimicked, which makes it fairly clear to explore the rarefaction phenomenon with regards to pressure variation. In Figure 3a, the red dotted line represents the apparent permeability for gas flow in porous media without considering the slip boundary, which remains a constant value and is insensitive to pressure change as indicated. The phenomenon that the permeability remains unchanged is in line with the classic Darcy’s law, suggesting that the permeability is an inherent property of reservoirs and shall not change with pressure variation. After considering boundary slip taking place under the nanoconfinement effect, the traditional principle about unchanged permeability breaks down. As illustrated in Figure 3a, the apparent permeability (blue line) shows an evident negative trend with the pressure rise; the apparent permeability can reach 8103 nD at 0.1 MPa while declining to 626 nD at 10 MPa, close to the value without considering boundary slip. Firstly, at a low-pressure range, the rarefaction effect plays as a greatly positive role in enhancing the apparent permeability. The gas velocity in nanopores is greatly advanced due to gas slippage at boundary, in which the molecules close to the boundary gain a certain degree of mobility. Meanwhile, the sharp decrease in apparent permeability with increasing pressure indicates that high pressure will inhibit the rarefaction effect greatly. As can be observed in Figure 3a, the apparent permeability at 50 MPa is exactly equal to the value from the classic theory, suggesting the gas slip vanishes at high pressure.
Notably, the assigned pressure condition of negligible difference between the inlet and outlet pressure failed to fit the realistic pressure condition during the depressurization development process. The pressure difference may make a difference on gas flow capacity, as nanoconfined gas flow is sensitive to pressure variation as indicated in Figure 3a. The spatial pressure distribution with the given inlet pressure (10 MPa) and outlet pressure (9.999 MPa) is illustrated in Figure 3b. In order to address this issue, in the following investigation, outlet pressure is assigned as a constant of 0.001 MPa, at the same time, the inlet pressure ranges from 0.1~50 MPa. As presented in Figure 4a, similar to that under the specified pressure condition, apparent permeability rises with the pressure reduction, and the rise amplitude increases in the low-pressure condition. Compared with the specified pressure condition that the gas flow regime in the whole network is almost the same, the large pressure difference in this case will result in several flow regimes in the network. For example, the continuum flow dominates the region close to the inlet side of the network, while slip flow or transition flow is the main flow mechanism for the region close to the outlet side. As a result, the apparent gas permeability is controlled by multiple flow regimes in the network in this pressure condition rather than a simple single flow regime with a negligible pressure difference.
To highlight the difference in gas flow capacity under both pressure conditions, a comparison is performed. The discrepancy, the vertical axis value in Figure 5, is calculated by the following equation, quantitatively displaying the difference in apparent permeability.
D i s = K a p p _ l K a p p _ n K a p p _ n
where Kapp_l is the apparent permeability through the pore network with a large pressure difference, nd; Kapp_n is the apparent permeability with a negligible pressure difference, nD; Dis is the discrepancy.
As indicated in Figure 5, there exists a negative relationship between pressure augment and discrepancy; the discrepancy can be as great as 31.1% at 1 MPa, which ranges from 2.8% to 31.1%. It means that the apparent permeability evaluated with the neglected pressure difference will underestimate the essential gas flow capacity through nanoscale porous media. Moreover, it can be observed from Figure 5 that the decline rate is greatly mitigated after pressure exceeds 10 MPa. Furthermore, the discrepancy can be overlooked when the pressure is over 30 MPa, in which case, the slip phenomenon is drastically weakened.

4.2. Pore-Network Characteristics

Various approaches have been applied to characterize microscopic pore structures, particularly for shale gas reservoirs or coalbed methane reservoirs, which is the inherent factor resulting in the nanoconfined gas flow. In this research, pore-network characteristics, including pore size distribution and coordination number, are studied. Specifically, as displayed in Figure 6, three sets of pore size distribution are provided, the case_1 symbol represents porous media dominated by small nanopores, the case_2 symbols represent the medium nanopores, and case_3 symbols represent the majority of large nanopores.
Then, the impact of pore size distribution on apparent gas permeability is illustrated in Figure 7. Similarly, the general variation trend remains that the apparent gas permeability will decline with increasing pressure, regardless of the alteration of pore size distribution. In addition, at any pressure, apparent gas permeability with large pore size is always stronger than that with small pore size. The discrepancy caused by different pore size distributions has a negative correlation with increasing pressure. The containment effect of boundary slip mechanisms caused by increasing pressure may take responsibility for the above phenomenon. At low pressure, the slip phenomenon intensifies gas permeability more in small nanopores than in large nanopores. As a result, the difference between case_1 and case_2 increases due to the low-pressure conditions.
The coordination number denotes the maximum number of pores a single pore can connect to in the pore network, which is generally believed to be in the range of 3 to 7. In this research, three sets of coordination numbers are assigned, and the pore size distribution remains unchanged on the basis of case_2, as presented in Figure 7. It can be observed from Figure 8 that the apparent permeability in the case of a coordination number of 7 can reach as high as 6164 nD. There is an evident tendency that apparent permeability rises dramatically with increasing coordination number. The increasing coordination number undoubtedly enhances the connectivity of the whole pore network; as a result, the possibility for the presence of isolated pores is greatly reduced, which can be attributed as a positive aspect for permeability enhancement. In addition, for a molecule flowing in the network with a large coordination number, there will be more passageways available, and the optimal one would be selected based on the minimum resistance principle.

5. Conclusions

(1)
A self-coded pore network modeling platform for gas flow in nanoscale porous media is established, in which nanoconfined flow mechanisms covering the entire Knudsen number range and pore evolution features, such as pore size distribution and coordination number, are well incorporated. The platform is more flexible on adjusting key parameters compared with the existing tools for PNM.
(2)
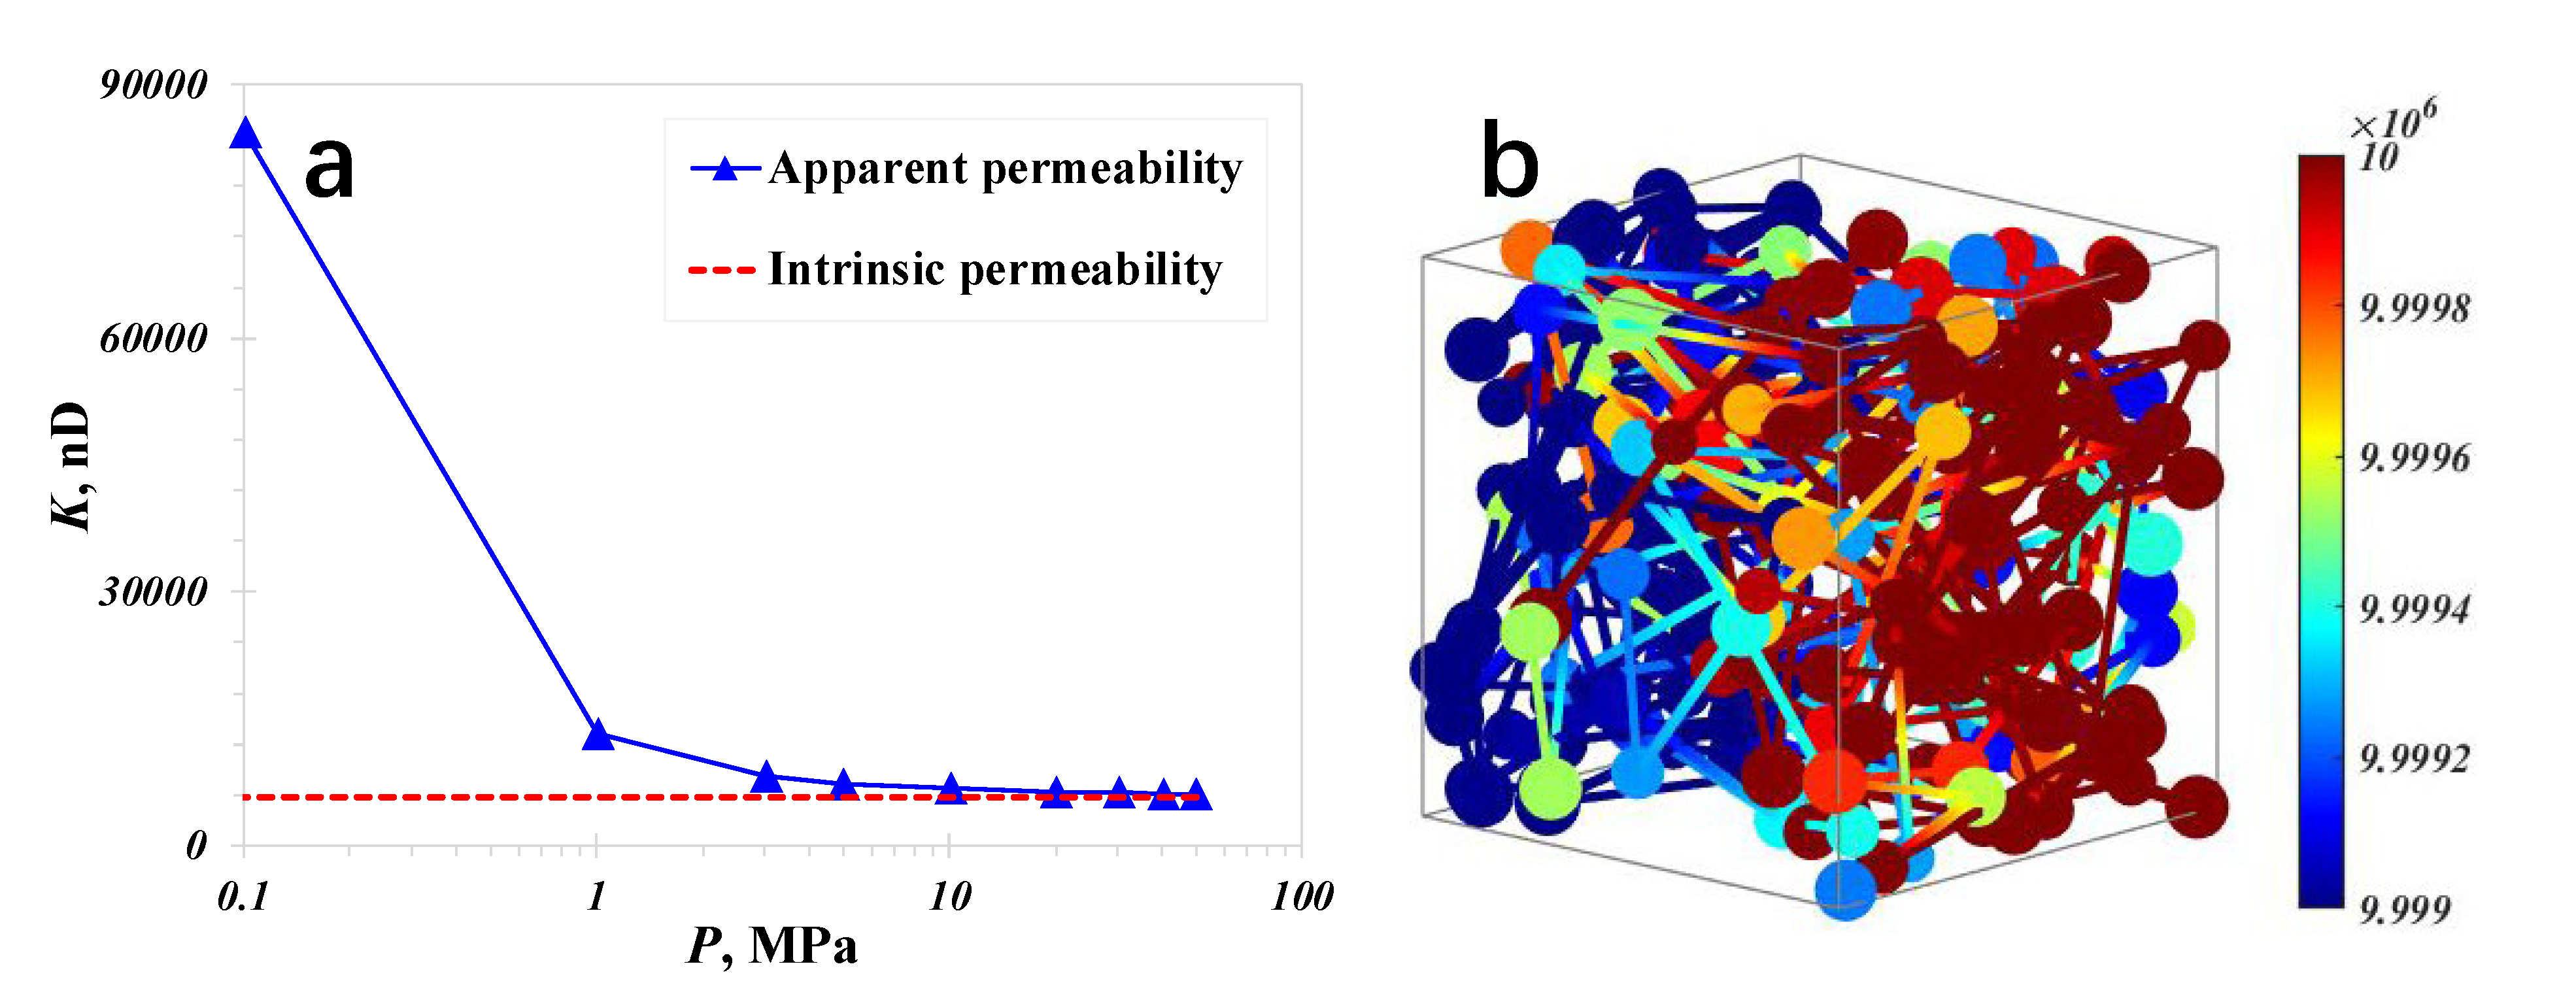
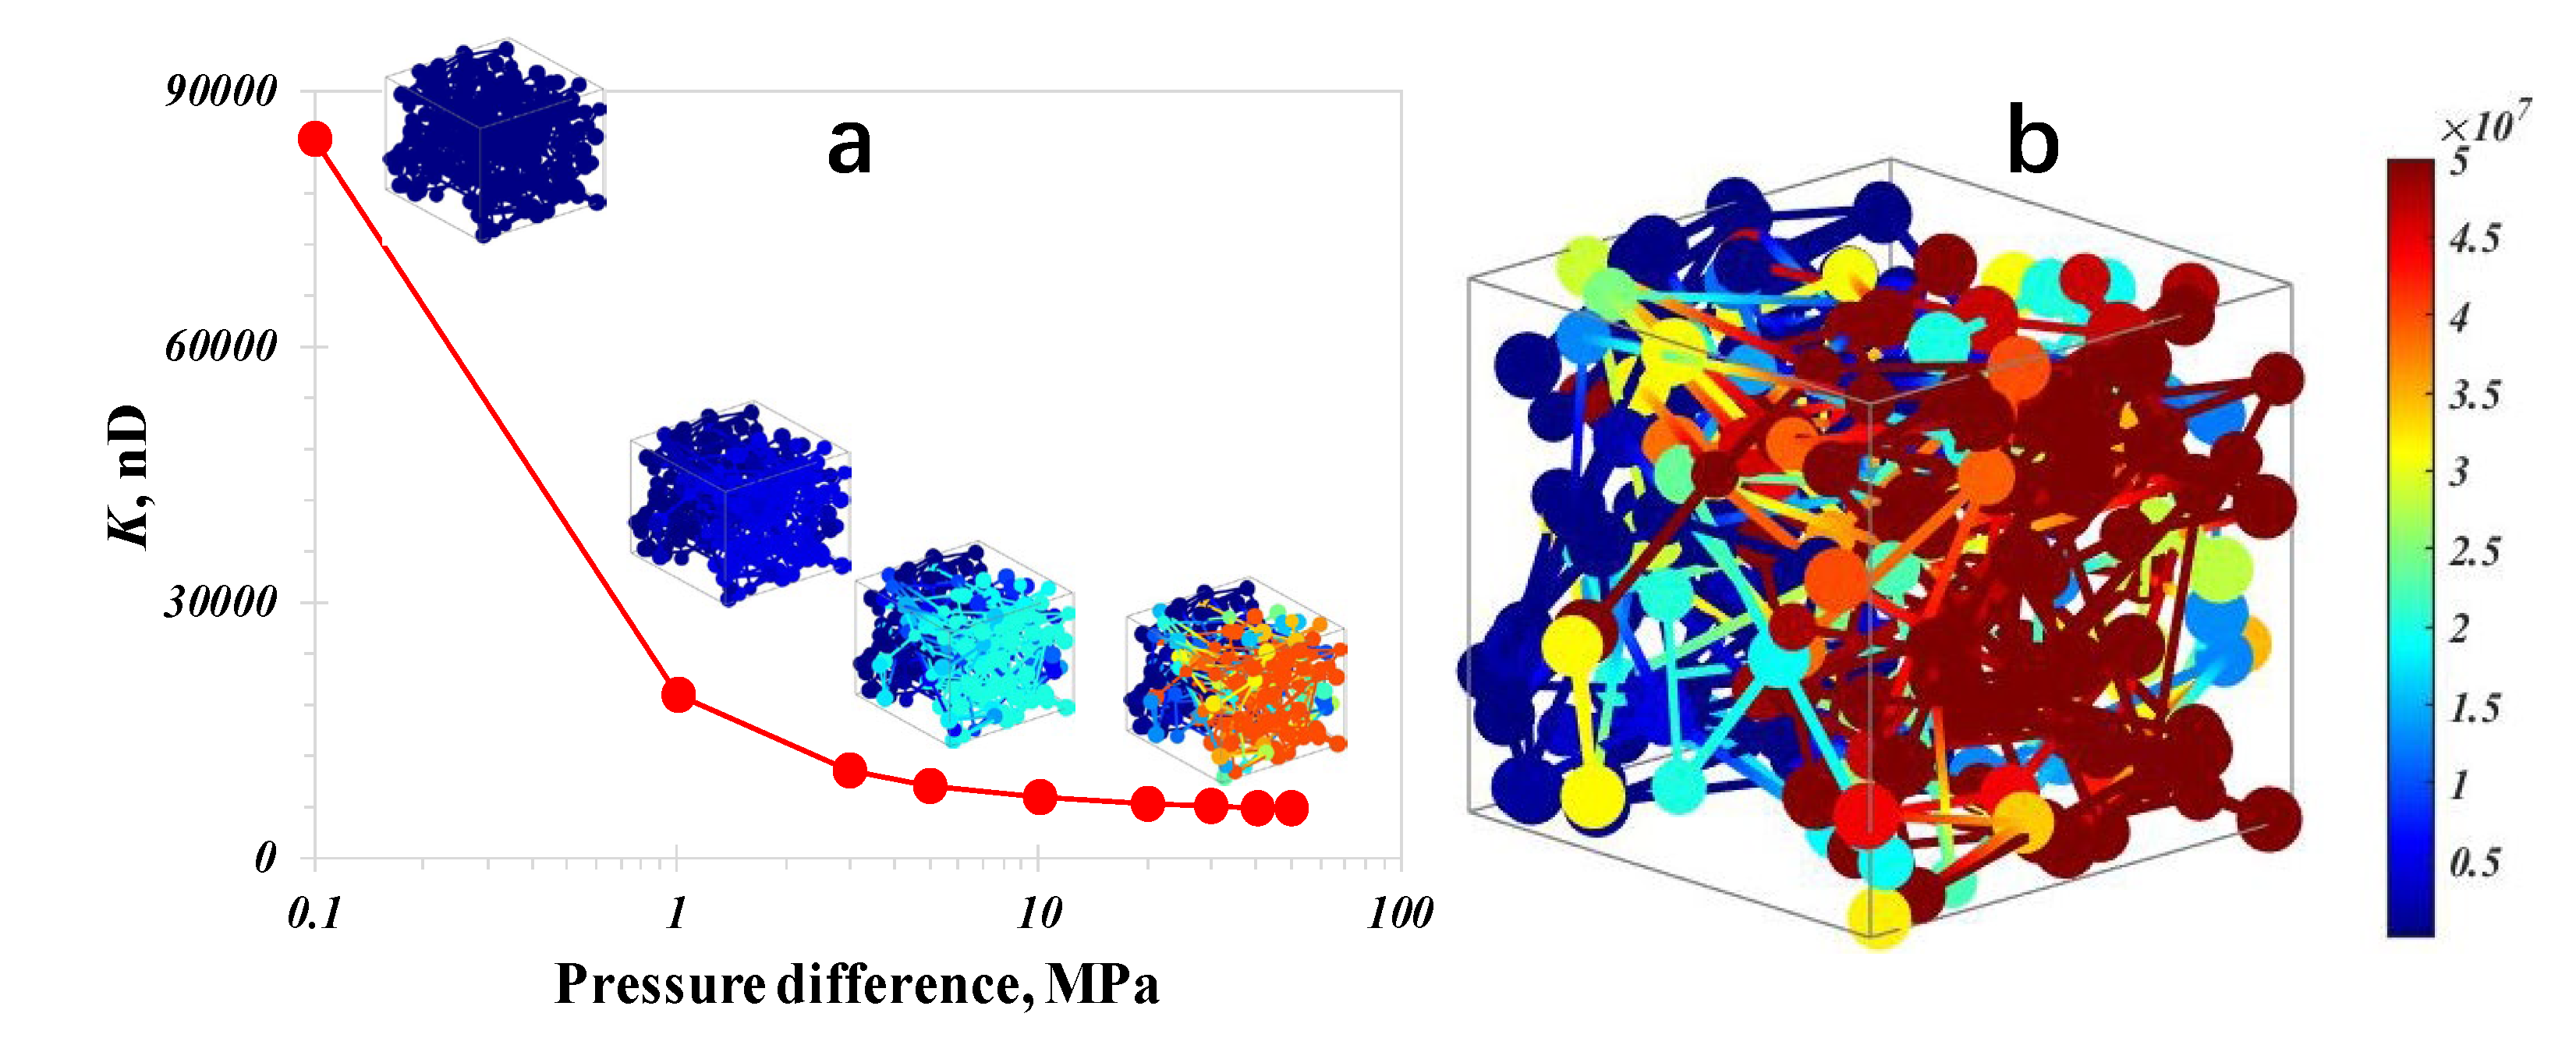
The rarefaction phenomenon acts as a positive factor in advancing gas flow capacity through porous media, particularly in the case of low pressure, where the apparent permeability shall sharply decline from 8103 nD to 598 nD after taking no account of the boundary slip. Moreover, the pressure difference across the inlet and outlet imposes a great influence on gas flow; the apparent permeability would be underestimated by as much as 31.1% with a neglected pressure difference.
(3)
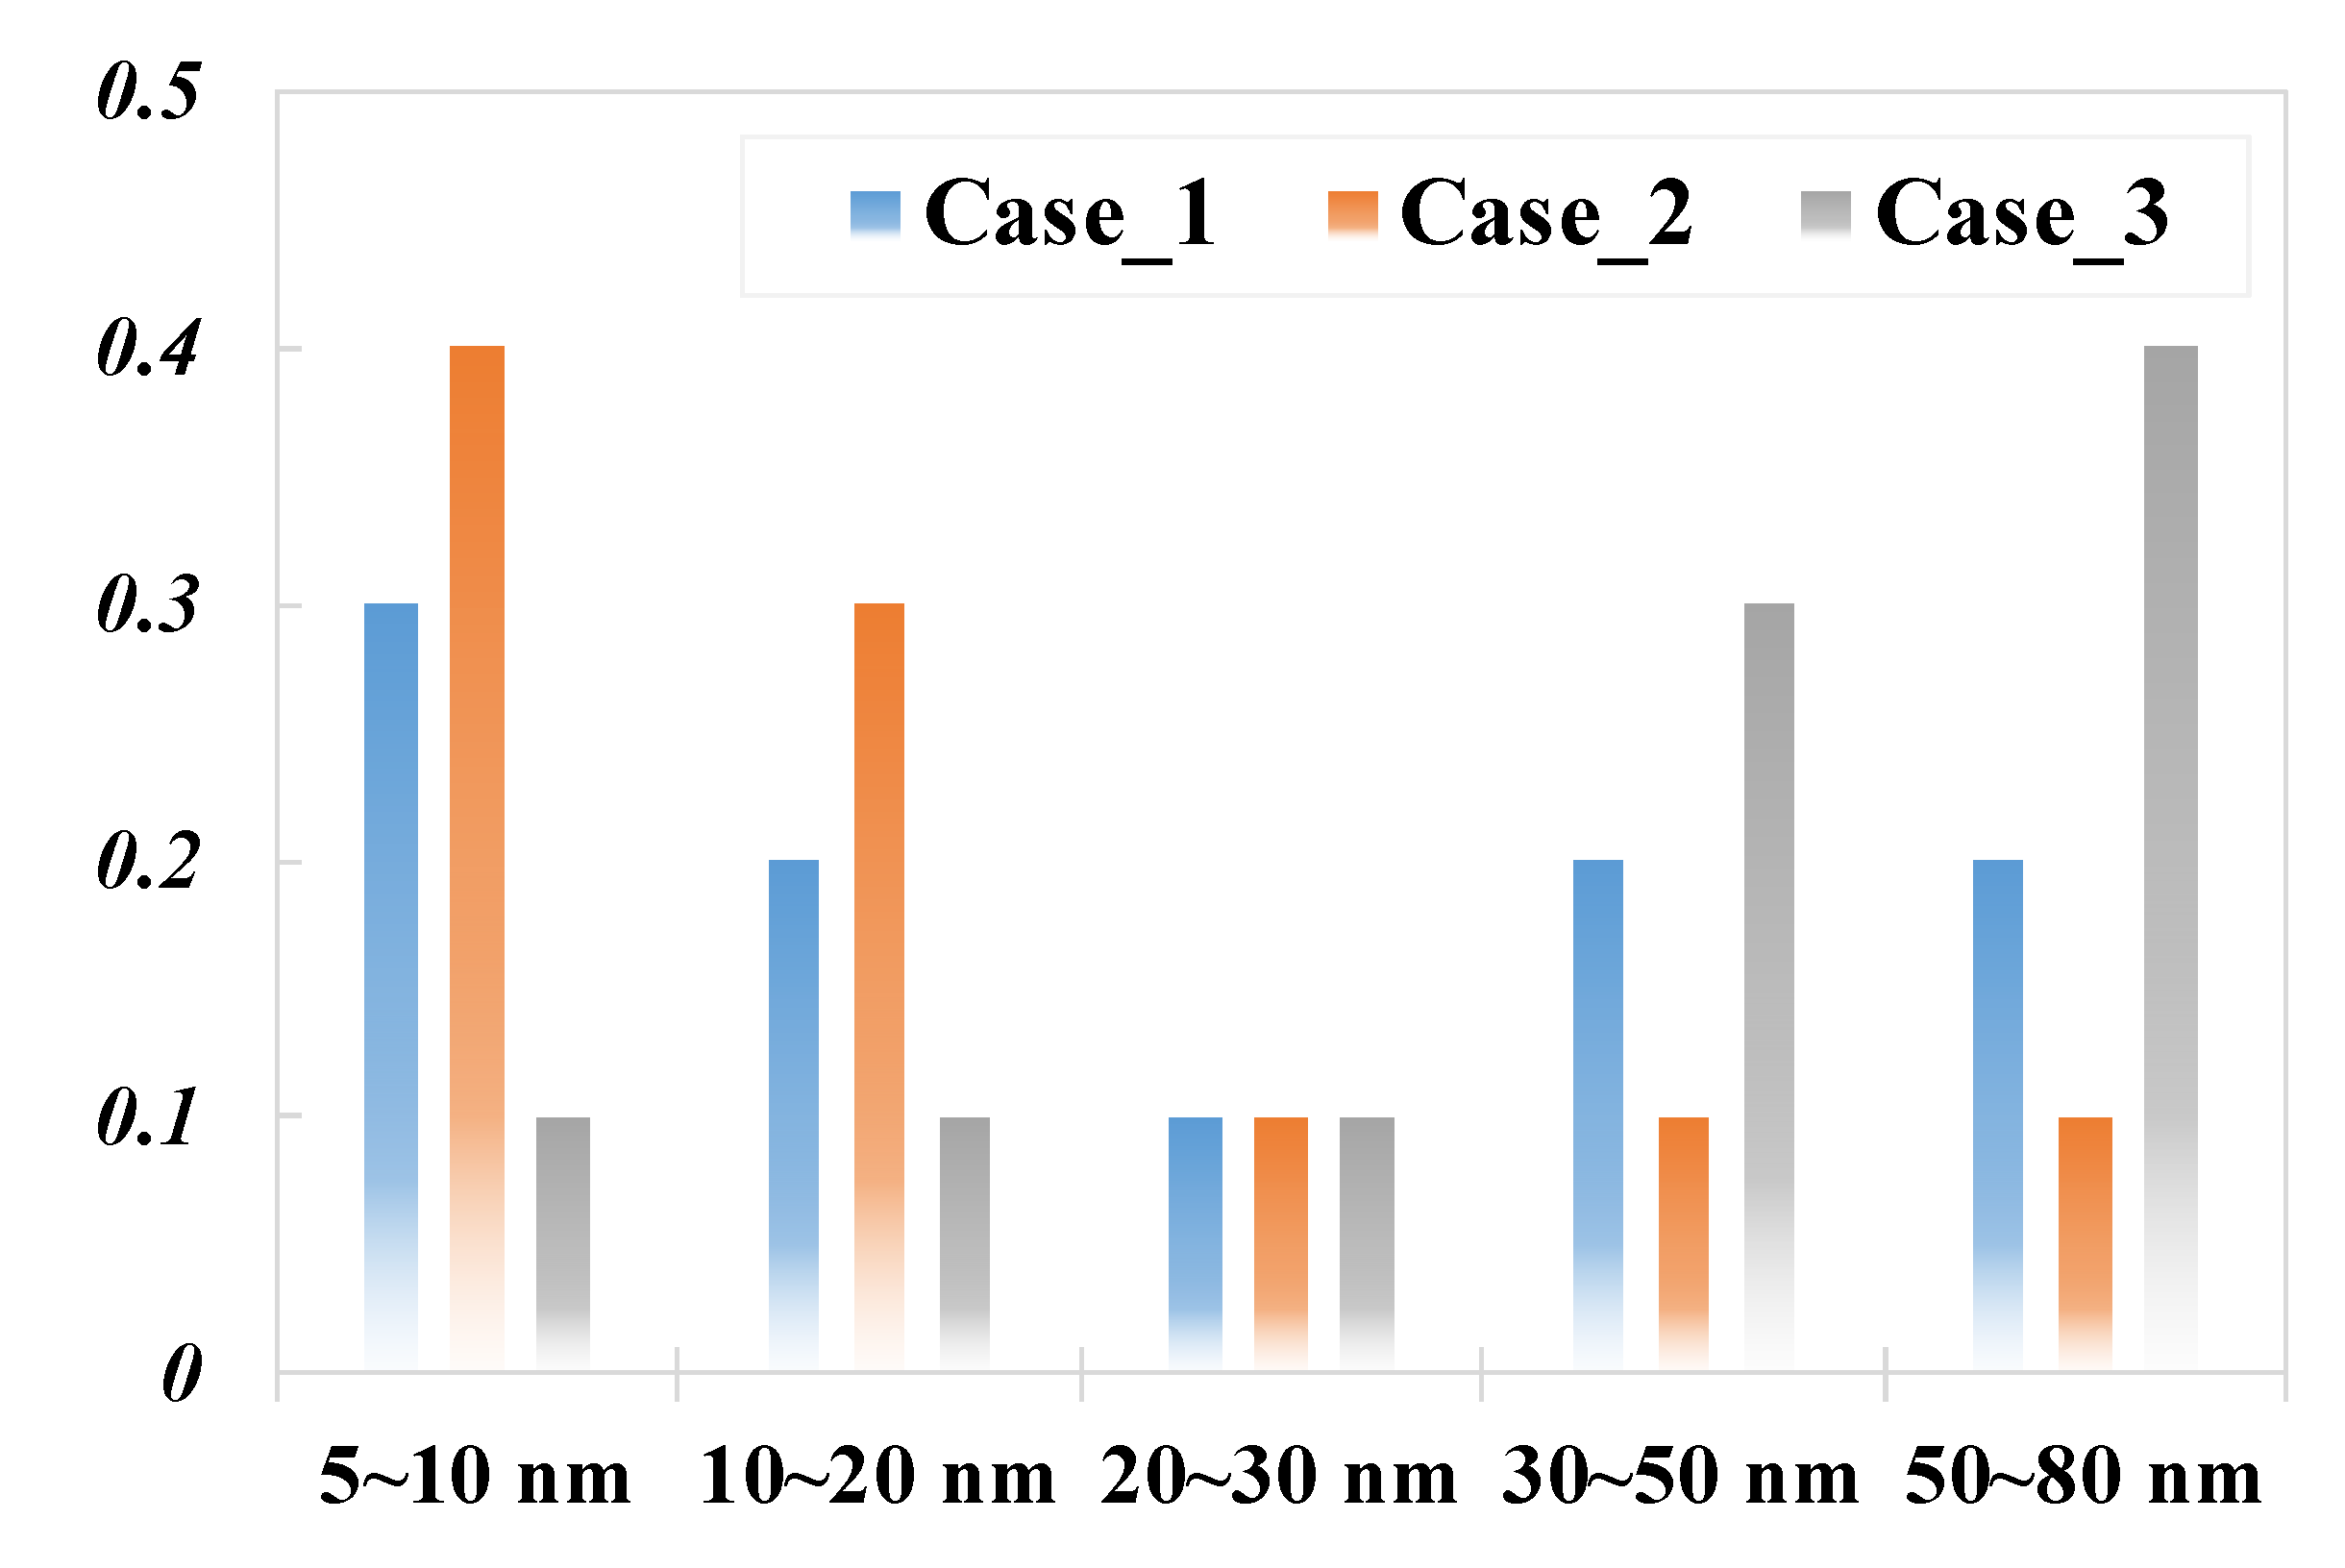
The variation trend for apparent gas permeability versus pressure remains regardless of the assigned different pore size distribution. Moreover, apparent gas permeability with a large pore size is always stronger than that with a small pore size, discrepancy caused by alteration of pore size distribution has a negative correlation with increasing pressure. Apparent gas permeability rises dramatically with the increasing coordination number, which can be attributed to the reduction of isolated pores as well as the optimized gas flow passageways triggered by the minimum resistance principle.

Author Contributions

Supervision: Z.S.; Methodology: S.W.; Investigation: S.F. and L.J.; Resources: F.W.; Formal analysis: S.Y. and Y.L. All authors have read and agreed to the published version of the manuscript.

Funding

The research was supported by the Open Fund of State Key Laboratory of Shale Oil and Gas Enrichment Mechanisms and Effective Development (No. 33550000-21-ZC0613-0337), National Natural Science Foundation Projects of China (No. 52104099), and Natural Science Foundation Projects of Jiangsu Province (No. BK20210508). The first author also acknowledges the Fundamental Research Funds for Central Universities (No. 2021QN1059) to support part of this work. We also acknowledge China University of Mining & Technology for the permission to publish this work.

Conflicts of Interest

The authors declare no conflict of interest.

References

  1. Yu, P.; Dempsey, D.; Archer, R. A three-dimensional coupled thermo-hydro-mechanical numerical model with partially bridging multi-stage contact fractures in horizontal-well enhanced geothermal system. Int. J. Rock Mech. Min. Sci. 2021, 143, 104787. [Google Scholar] [CrossRef]
  2. Wu, Y.; Zhu, Q.; Zhu, B. Decoupling analysis of world economic growth and CO2 emissions: A study comparing developed and developing countries. J. Clean. Prod. 2018, 190, 94–103. [Google Scholar] [CrossRef]
  3. Cao, M.; Sharma, M.M. The impact of changes in natural fracture fluid pressure on the creation of fracture networks. J. Pet. Sci. Eng. 2022, 216, 110783. [Google Scholar] [CrossRef]
  4. Ma, D.; Duan, H.Y.; Zhang, Q.; Zhang, J.X.; Li, W.X.; Zhou, Z.L.; Liu, W.T. A numerical gas fracturing model of coupled thermal, flowing and mechanical effects. Comput. Mater. Contin. 2020, 65, 2123–2141. [Google Scholar] [CrossRef]
  5. Deng, H.; Sheng, G.; Zhao, H.; Meng, F.; Zhang, H.; Ma, J.; Gong, J.; Ruan, J. Integrated optimization of fracture parameters for subdivision cutting fractured horizontal wells in shale oil reservoirs. J. Pet. Sci. Eng. 2022, 212, 110205. [Google Scholar] [CrossRef]
  6. Wang, Y.; Liu, H.; Guo, M.; Shen, X.; Han, B.; Zhou, Y. Image recognition model based on deep learning for remaining oil recognition from visualization experiment. Fuel 2021, 291, 120216. [Google Scholar] [CrossRef]
  7. Sun, Z.; Wang, S.; Xiong, H.; Wu, K.; Shi, J. Optimal nanocone geometry for water flow. AIChE J. 2022, 68, e17543. [Google Scholar] [CrossRef]
  8. Pang, Y.; Hu, X.; Wang, S.; Chen, S.; Soliman, M.Y.; Deng, H. Characterization of adsorption isotherm and density profile in cylindrical nanopores: Modeling and measurement. Chem. Eng. J. 2020, 396, 125212. [Google Scholar] [CrossRef]
  9. Sun, Z.; Huang, B.; Yan, S.; Wang, S.; Wu, K.; Yu, W.; Li, Y.; Wang, S. Nanoconfined Methane Thermodynamic Behavior below Critical Temperature: Liquid–Vapor Coexistence Curve under Wettability Effect. Ind. Eng. Chem. Res. 2022, 61, 4971–4979. [Google Scholar] [CrossRef]
  10. Sheng, G.; Su, Y.; Wang, W. A new fractal approach for describing induced-fracture porosity/permeability/ compressibility in stimulated unconventional reservoirs. J. Pet. Sci. Eng. 2019, 179, 855–866. [Google Scholar] [CrossRef]
  11. Song, W.; Yao, J.; Li, Y.; Sun, H.; Zhang, L.; Yang, Y.; Zhao, J.; Sui, H. Apparent gas permeability in an organic-rich shale reservoir. Fuel 2016, 181, 973–984. [Google Scholar] [CrossRef]
  12. Beskok, A.; Karniadakis, G.E. Report: A model for flows in channels, pipes, and ducts at micro and nano scales. Microscale Thermophys. Eng. 1999, 3, 43–77. [Google Scholar]
  13. Wu, K.; Chen, Z.; Li, X.; Guo, C.; Wei, M. A model for multiple transport mechanisms through nanopores of shale gas reservoirs with real gas effect–adsorption-mechanic coupling. Int. J. Heat Mass Transf. 2016, 93, 408–426. [Google Scholar] [CrossRef]
  14. Li, J.; Li, X.; Wu, K.; Feng, D.; Zhang, T.; Zhang, Y. Thickness and stability of water film confined inside nanoslits and nanocapillaries of shale and clay. Int. J. Coal Geol. 2017, 179, 253–268. [Google Scholar] [CrossRef]
  15. Li, J.; Li, X.; Wu, K.; Wang, X.; Shi, J.; Yang, L.; Zhang, H.; Sun, Z.; Wang, R.; Feng, D. Water sorption and distribution characteristics in clay and shale: Effect of surface force. Energy Fuels 2016, 30, 8863–8874. [Google Scholar] [CrossRef]
  16. Zhang, T.; Javadpour, F.; Li, J.; Zhao, Y.; Zhang, L.; Li, X. Pore-scale perspective of gas/water two-phase flow in shale. SPE J. 2021, 26, 828–846. [Google Scholar] [CrossRef]
  17. Feng, D.; Bakhshian, S.; Wu, K.; Song, Z.; Ren, B.; Li, J.; Hosseini, S.A.; Li, X. Wettability effects on phase behavior and interfacial tension in shale nanopores. Fuel 2021, 290, 119983. [Google Scholar] [CrossRef]
  18. Feng, D.; Li, X.; Wang, X.; Li, J.; Zhang, T.; Sun, Z.; He, M.; Liu, Q.; Qin, J.; Han, S. Capillary filling of confined water in nanopores: Coupling the increased viscosity and slippage. Chem. Eng. Sci. 2018, 186, 228–239. [Google Scholar] [CrossRef]
  19. Yu, P.; Dempsey, D.; Archer, R. Techno-Economic feasibility of enhanced geothermal systems (EGS) with partially bridging Multi-Stage fractures for district heating applications. Energy Convers. Manag. 2022, 257, 115405. [Google Scholar] [CrossRef]
  20. Pang, Y.; Fan, D.; Chen, S. A Novel Approach To Predict Gas Flow in Entire Knudsen Number Regime through Nanochannels with Various Geometries. SPE J. 2021, 26, 3265–3284. [Google Scholar] [CrossRef]
  21. Sun, Z.; Shi, J.; Wu, K.; Xu, B.; Zhang, T.; Chang, Y.; Li, X. Transport capacity of gas confined in nanoporous ultra-tight gas reservoirs with real gas effect and water storage mechanisms coupling. Int. J. Heat Mass Transf. 2018, 126, 1007–1018. [Google Scholar] [CrossRef]
  22. Huang, J.; Yin, X.; Barrufet, M.; Killough, J. Lattice Boltzmann simulation of phase equilibrium of methane in nanopores under effects of adsorption. Chem. Eng. J. 2021, 419, 129625. [Google Scholar] [CrossRef]
  23. Grunau, D.; Chen, S.; Eggert, K. A lattice Boltzmann model for multiphase fluid flows. Phys. Fluids A: Fluid Dyn. 1993, 5, 2557–2562. [Google Scholar] [CrossRef] [Green Version]
  24. Saadat, M.H.; Hosseini, S.A.; Dorschner, B.; Karlin, I.V. Extended lattice Boltzmann model for gas dynamics. Phys. Fluids 2021, 33, 046104. [Google Scholar] [CrossRef]
  25. Song, W.; Yao, J.; Ma, J.; Couples, G.; Li, Y. Assessing relative contributions of transport mechanisms and real gas properties to gas flow in nanoscale organic pores in shales by pore network modelling. Int. J. Heat Mass Transf. 2017, 113, 524–537. [Google Scholar] [CrossRef]
  26. Yang, Y.; Wang, K.; Zhang, L.; Sun, H.; Zhang, K.; Ma, J. Pore-scale simulation of shale oil flow based on pore network model. Fuel 2019, 251, 683–692. [Google Scholar] [CrossRef]
  27. Wang, X.; Sheng, J.J. Multi-scaled pore network modeling of gas-water flow in shale formations. J. Pet. Sci. Eng. 2019, 177, 899–908. [Google Scholar] [CrossRef]
  28. Cui, R.; Feng, Q.; Chen, H.; Zhang, W.; Wang, S. Multiscale random pore network modeling of oil-water two-phase slip flow in shale matrix. J. Pet. Sci. Eng. 2019, 175, 46–59. [Google Scholar] [CrossRef]
  29. Yi, Z.; Hu, S.; Wu, S.; Ma, J.; Gao, J.; Yuan, Y. Pore network extraction for shale gas flow in nanoporous media. Mar. Pet. Geol. 2021, 126, 104896. [Google Scholar] [CrossRef]
  30. Sun, Z.; Huang, B.; Liu, Y.; Jiang, Y.; Zhang, Z.; Hou, M.; Li, Y. Gas-phase production equation for CBM reservoirs: Interaction between hydraulic fracturing and coal orthotropic feature. J. Pet. Sci. Eng. 2022, 213, 110428. [Google Scholar] [CrossRef]
  31. Xu, Y.; Sheng, G.; Zhao, H.; Hui, Y.; Zhou, Y.; Ma, J.; Rao, X.; Zhong, X.; Gong, J. A new approach for gas-water flow simulation in multi-fractured horizontal wells of shale gas reservoirs. J. Pet. Sci. Eng. 2021, 199, 108292. [Google Scholar] [CrossRef]
  32. Wang, Y.; Dai, Z.; Liu, H. Pore-scale mechanisms and simulations for gas–water two-phase transport processes in natural gas reservoirs. J. Nat. Gas Sci. Eng. 2021, 96, 104314. [Google Scholar] [CrossRef]
  33. Wu, Y.; Cheng, L.; Ma, L.; Huang, S.; Fang, S.; Killough, J.; Jia, P.; Wang, S. Transient two-phase flow model for production prediction of tight gas wells with fracturing fluid-induced formation damage. J. Pet. Sci. Eng. 2021, 199, 108351. [Google Scholar] [CrossRef]
  34. Ma, D.; Zhang, J.X.; Duan, H.Y.; Huang, Y.L.; Li, M.; Sun, Q.; Zhou, N. Reutilization of gangue wastes in underground backfilling mining: Overburden aquifer protection. Chemosphere 2021, 264, 128400. [Google Scholar] [CrossRef] [PubMed]
  35. Sun, Z.; Huang, B.; Wu, K.; Shi, S.; Wu, Z.; Hou, M.; Wang, H. Nanoconfined methane density over pressure and temperature: Wettability effect. J. Nat. Gas Sci. Eng. 2022, 99, 104426. [Google Scholar] [CrossRef]
  36. Cao, M.; Hirose, S.; Sharma, M.M. Factors controlling the formation of complex fracture networks in naturally fractured geothermal reservoirs. J. Pet. Sci. Eng. 2022, 208, 109642. [Google Scholar] [CrossRef]
  37. Shen, W.J.; Li, X.Z.; Ma, T.R.; Cai, J.C.; Lu, X.B.; Zhou, S.W. High-pressure methane adsorption behavior on deep shales: Experiments and modeling. Phys. Fluids 2021, 33, 063103. [Google Scholar] [CrossRef]
  38. Zhao, W.; Jia, C.; Zhang, T.; Jiang, L.; Li, X.; Jiang, Z.; Zhang, F. Effects of nanopore geometry on confined water flow: A view of lattice Boltzmann simulation. Chem. Eng. Sci. 2021, 230, 116183. [Google Scholar] [CrossRef]
  39. Wang, S.; Liang, Y.; Feng, Q.; Javadpour, F. Sticky layers affect oil transport through the nanopores of realistic shale kerogen. Fuel 2022, 310, 122480. [Google Scholar] [CrossRef]
  40. Wang, S.; Yao, X.; Feng, Q.; Javadpour, F.; Yang, Y.; Xue, Q.; Li, X. Molecular insights into carbon dioxide enhanced multi-component shale gas recovery and its sequestration in realistic kerogen. Chem. Eng. J. 2021, 425, 130292. [Google Scholar] [CrossRef]
  41. Wang, S.; Feng, Q.; Javadpour, F.; Zha, M.; Cui, R. Multiscale modeling of gas transport in shale matrix: An integrated study of molecular dynamics and rigid-pore-network model. SPE J. 2020, 25, 1416–1442. [Google Scholar] [CrossRef]
Figure 1. Mimicking methane flow behavior with different approaches.
Processes 10 02746 g001
Figure 2. Construction of porous media with assigned spatial pore network attributes (a): Pore size distribution; (b): Spatial pore structure.
Processes 10 02746 g002
Figure 3. Apparent gas permeability under the specified pressure condition (a): Gas flow capacity; (b): Spatial pressure distribution feature.
Processes 10 02746 g003
Figure 4. Apparent gas permeability under the displacement pressure-difference condition (a): Gas transport capacity; (b): Spatial pressure distribution feature.
Processes 10 02746 g004
Figure 5. Discrepancy caused by different ways to assign pressure condition.
Processes 10 02746 g005
Figure 6. Different pore size distributions of the nanoscale porous media.
Processes 10 02746 g006
Figure 7. Impact of PSD on apparent gas permeability versus pressure.
Processes 10 02746 g007
Figure 8. Impact of pore coordination number on apparent gas permeability.
Processes 10 02746 g008
Table 1. Literature review of recent main research about gas phase PNM.
ResearchersPurposesKey Influential FactorsLimitations
Song et al. (2017) [25]Gas transport behavior in porous media constructed by shale organic nanopores.microscopic gas flow regimes.Impact of spatial structure of pore network is not elaborated.
Yang et al. (2019) [26]Oil transport behavior in shale porous media.microscopic oil flow mechanism and volumetric toc.The way pressure condition is assigned on flow has not been revealed.
Wang and Sheng (2019) [27]Gas-water flow in shale porous media.nanopore tortuosity, pore size distribution of organic matter and inorganic matter.Impact of spatial structure of pore network is not elaborated.
Cui et al. (2019) [28]Oil-water flow in shale porous media.nanopore shape, spatial structure of pore network.The way pressure condition is assigned on flow has not been revealed.
Yi et al. (2021) [29]Gas transport in nanoscale porous media.microscopic gas flow mechanism, spatial structure of pore network.The way pressure condition is assigned on flow has not been revealed.
Publisher’s Note: MDPI stays neutral with regard to jurisdictional claims in published maps and institutional affiliations.

