Article

Interpretation Method for Lost Gas in Deep Coalbed and Its Application

1
Institute of Unconventional Oil and Gas Science and Technology, China University of Petroleum (Beijing), Beijing 102200, China
2
PetroChina Exploration and Development Research Institute, Beijing 100083, China
3
CNPC Unconventional Key Laboratory, Beijing 100083, China
4
PetroChina Coal Bed Methane Co., Ltd., Beijing 100028, China
5
School of Mechanical Engineering, Shaanxi University of Technology, Hanzhong 723001, China
6
School of Energy and Mining Engineering, Shandong University of Science and Technology, Qingdao 266590, China
*
Authors to whom correspondence should be addressed.
Processes 2023, 11(1), 200; https://doi.org/10.3390/pr11010200
Submission received: 14 November 2022 / Revised: 14 December 2022 / Accepted: 27 December 2022 / Published: 8 January 2023

Abstract

:
The gas loss time during the deep coalbed coring process is long. The measured desorption curve does not meet the application conditions for the classical United States Bureau of Mines (USBM) method. However, the industry still lacks a reliable interpretation method, which affects identifying deep coalbed methane reserves and optimizing sweet spots. (Method) The classical double-porosity and double-permeability theoretical model was adopted, and the influence of reservoir permeability, water saturation, and temperature on gas output in the coalbed desorption process was considered. Based on the measured field desorption data of the P1 sample of the No. 8 coal in the Benxi Formation on the eastern margin of Ordos, the entire process for the deep coalbed gas content test was numerically simulated. (Results) The simulation results show that the lost gas in the P1 sample accounts for 24.7% of the total gas, reaching 8.64 m3/t, including 18.81% of loss in wellbore lifting and 5.88% of loss during surface exposure. The total gas content of the sample is 35.34 m3/t. The P1 sample contains free gas, with a content of 9.71 m3/t, and the ratio between adsorbed and free gas is close to 7:3. Matrix permeability, initial gas saturation, and lifting time are the key factors that determine the amount of lost gas. The results of deep coalbed gas loss calculated by the USBM method were excessively large, approximately twice that calculated using the new method. The total gas content calculated based on multiple parameters is consistent with the interpretation results of the new method, with an average error of approximately 7%. (Conclusion) The interpretation method of gas loss in deep coalbeds has acceptable reliability and can be applied in shale gas content testing.

1. Introduction

Deep coalbed methane is an important substitute area for the next step of coalbed methane exploration and development, and breakthroughs have been made in the Daning–Jixian block of the Ordos Basin, the Baijiahai Uplift in the eastern Junggar Basin, and the Hedi block of Suide County [1]. In particular, the initial daily production of the D6-7P1 horizontal well of deep coalbed methane in the Daning–Jixian block on the eastern margin of the Ordos Basin reaches over 90,000 m3, which is planned to become the first deep coalbed gas field in China with a productivity of a hundred billion cubic meters [2,3]. Gas content is a key parameter that must be initially determined in deep coalbed methane reservoir evaluations, resource reserve calculations, and development zone optimizations. However, no method is reliable enough for interpreting gas loss in deep coalbeds.
Previous studies asserted that gas content can be determined primarily in two ways: the direct method and the indirect method. The direct method refers to the field desorption method, which is subdivided into four types according to the interpretation method: the United States Bureau of Mines (USBM) method [4], the polynomial fitting method [5], the Smith–Williams method [6], and the Amoco curve fitting method [7]. The indirect method covers the isothermal adsorption method, the well-logging interpretation method, the seismic interpretation method, etc. Many scholars have extensively explored improving the reliability of gas loss calculations and explaining calculation methods for gas loss. Based on a comparative analysis of the effects of the USBM linear regression method, polynomial regression method, and Amoco curve fitting method on gas loss in shale, Zhou Shangwen [8] concluded that although it is a simple theoretical basis, the USBM linear regression method has stronger applicability and can provide more practical calculation results. Zhao Qun [9] asserted that the exponential decreasing method has the best fitting effect with the measured data in the entire test zone. Yao Guanghua [10] analyzed the applicability of the USBM to deep shale gas and asserted that for gas reservoirs with normal pressure coefficients, the calculation time for gas loss is greater, resulting in a larger gas loss, while for gas reservoirs with abnormally high pressure, the calculation time for gas loss is lower, which may lead to less gas loss. Some scholars have also discussed the measures and methods for improving the fitting accuracy of gas loss from various aspects, including selecting experimental points, studying gas diffusion characteristics, and optimizing desorption starting times [11,12,13,14,15,16,17,18]. Some scholars have studied the desorption and diffusion coefficients of adsorbed and free gas in the reservoir in the laboratory and predicted the desorption index. It provides an important reference value for the calculation of lost gas in this paper [19,20].
In actual operations, the commonly used direct method is the USBM method, and the main executive standard is the Method of Determining Coalbed Methane Content (GB/T 19559-2021) [21]. The USBM method assumes that the coal sample comprises spherical particles, and the gas undergoes Fick diffusion in the coal sample; it ignores the influences of the water phase and seepage. Thus, by inference, the desorbed gas volume in the first few hours of desorption is approximately linear with the square root of the desorption time. A graph with the cumulative desorption amount under the standard state as the ordinate and the square root of the total time of gas loss as the abscissa can be developed. In graphing the desorption gas volume versus the square root of the total time, the lost gas volume is the intercept of the fitted straight line with the ordinate axis. The USBM method assumes that the gas loss starts when the sample is lifted at half of the wellbore, which does not exactly match the actual desorption start time of the sample. It is notable that the USBM method is based on the simplified analytical solutions of the desorption–diffusion equation of the single-porosity model that focuses on the adsorbed gas and assumes that the diffusion rate is constant. The applicable conditions for the method include (1) the lost gas does not exceed 20%, that is, the duration of gas loss should not be too long; (2) only adsorbed gas is present, that is, no free gas; and (3) the temperature changes during the coring process are minor. Wireline coring, known for its fast lift speed and short gas loss time, is often adopted for shallow coalbed coring. In this case, the USBM method has had a good application effect. However, conventional coring with drill pipes is generally applied in deep coalbed coring. The lifting process for this coring method is quite slow and often takes 6 to 8 h, resulting in extended gas loss time. In addition, at high deep coal reservoir temperatures, temperature changes can be substantial throughout the coring process, and the diffusion rate is a function that varies with desorption. Furthermore, the deep coalbed may contain a certain amount of free gas. Therefore, the large difference in the presence of deep coalbed methane and the coring parameters may lead to a large deviation between the calculation results of the USBM linear regression method and the actual gas content.
To resolve any deviations in the calculation results of the USBM linear regression, this paper adopts the measured desorption data and the classic double-porosity and double-permeability theoretical model for coalbeds on the study of gas diffusion in coal reservoirs by Zhao Wei [22], and considers the effects of reservoir permeability, water saturation, and temperature on gas output during the desorption process to numerically simulate the entire process of deep coalbed gas content testing. When the simulation result perfectly matches the measured desorption data, the numerical simulation can substitute for the complete gas loss process so that the lost gas volume and the total gas content can be obtained. Meanwhile, a comparison with the total gas content calculated based on various parameters was conducted to verify the reliability of the new method.

2. Experimental Samples and Experimental Methods

2.1. Experimental Samples

The Daning–Jixian area is located in the fold zone of the western Shanxi region on the southeastern margin of the Ordos Basin. It borders the Lvliang Mountains to the East, stretches across the Yellow River to connect with the Yi-Shaan Slope structural belt in the West, and meets the Weibei Uplift in the South. The research area has large exploration potential, with a proven reserve of coalbed methane resources exceeding 1438 × 108 m3. The main coal-bearing seams are the No. 5 coal seam of the Shanxi Formation and the No. 8 coal seam of the Benxi Formation of the Carboniferous–Lower Permian System. In this paper, a P1 sample from a well of the Benxi Formation with a depth of 2137.61 m is selected for case analysis. As shown in Figure 1, the sample is primary structure coal of the semibright coal type according to its macroscopic classification, with well-developed cleats, specular coal strips, and shell-shaped fractures. It belongs to the anthracite class, and the detailed parameters are shown in Table 1.

2.2. Experimental Methods

2.2.1. Field Gas Content Test

The field gas content test was implemented in accordance with the Method of Determining Coalbed Methane Content (GB/T 19559-2021). The measurement began immediately after the sample was filled and sealed in a tank and lasted for 8 h in total, successively comprising 1 h with a measurement interval of no more than 10 min, 1 h with an interval of no more than 15 min, 1 h with an interval of no more than 30 min, and 5 h with an interval of no more than 120 min. After 8 h of continuous desorption, relevant data were collected at regular intervals until the desorption terminated. The manual measuring cylinder (Figure 2) was the earliest tool for collecting desorption data. In recent years, various methods, such as the high-precision flowmeter, automatic U-shaped measuring cylinder, and pulse rotation measuring, have been developed, further improving the automation degree and test accuracy (Figure 3). See Table 2 and Figure 4 for the field desorption data for sample P1.

2.2.2. Testing of Other Basic Parameters

Isothermal adsorption was performed according to the Experimental Method of High-pressure Isothermal Adsorption to Coal (GB/T 19560-2008) [23]. The proximate analysis was conducted in accordance with the Proximate Analysis of Coal by Instrumental Method (GB/T 30732-2014) [24]. The true relative density test was conducted and referred to the Methods for Determining the Physical and Mechanical Properties of Coal and Rock—Part 2: Methods for Determining the True Density of Coal and Rock [25]. The porosity, permeability, and matrix permeability of coal were determined according to the Practices for Core Analysis (GB/T 29172-2012) [26]. The sample analysis and tests were completed in the CNPC Unconventional Oil and Gas Key Laboratory.

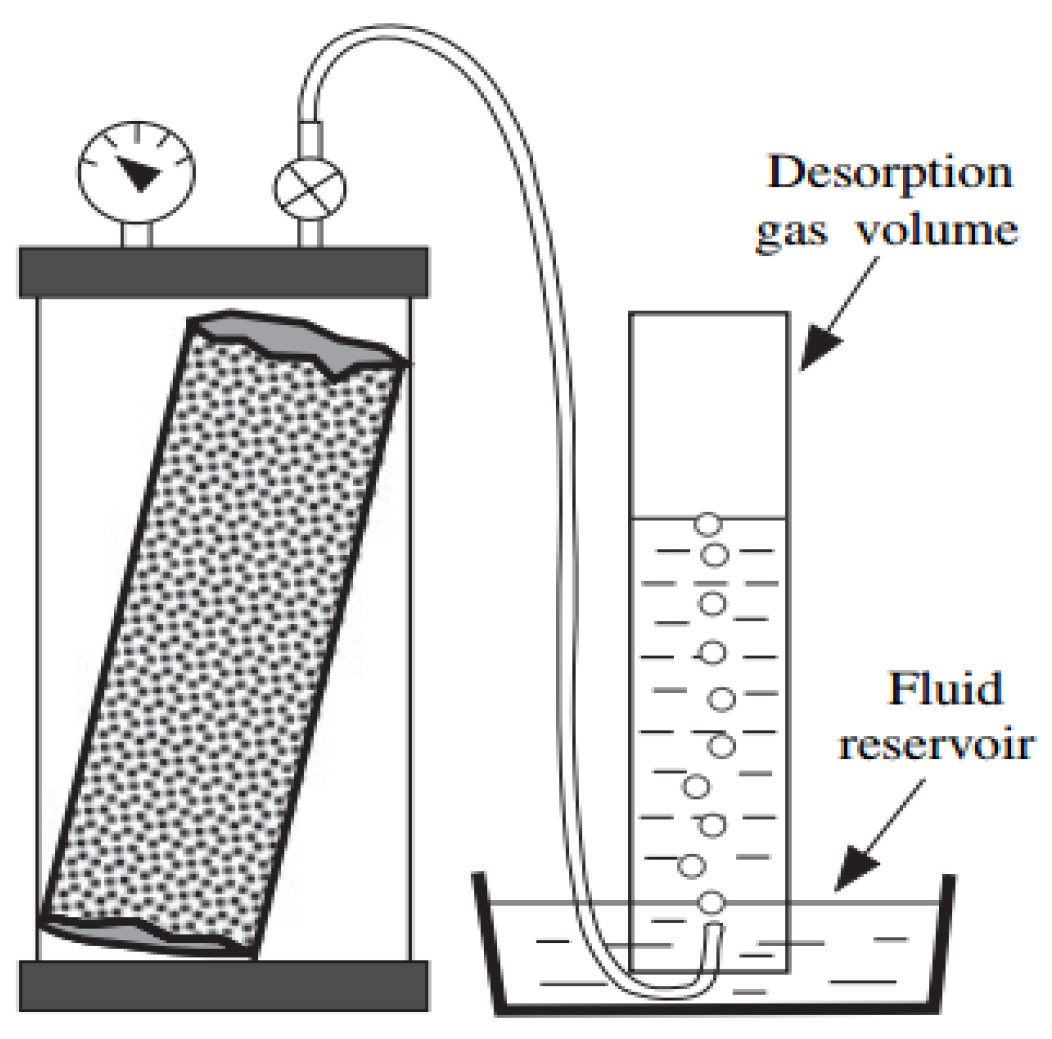
2.2.3. Physical Model for Gas Loss Simulation

The Warren–Root model with double porosity and double permeability (as shown in Figure 5) was adopted as the pore–fracture physical model for this simulation. In addition, the presence of liquid and gas phases in the coalbed was also considered. Coal has a typical pore–fracture double-porosity and double-permeability structure, that is, coal contains many tiny pores and large fractures (cleats). The tiny pore system causes coal to have a large specific surface area and strong adsorption capacity but low permeability. The fracture system has small porosity, but its permeability is several orders of magnitude larger than that of the pore system.

2.2.4. Establishment of the Coalbed Methane Mathematical Model with Double Porosity and Double Permeability

(1)
Fundamental assumptions of the model
(1)
Coalbed methane is stored in a free state in fractures but in a free state and an adsorbed state in matrices;
(2)
The adsorption and desorption processes in coal matrix pores are deemed to reach equilibrium instantaneously and not change over time. Therefore, they are pressure dependent and meet the conditions of the Langmuir isotherm adsorption equation;
(3)
While lifting coalbed methane cores, the temperature varies with the core depth;
(4)
The flow from coal matrix pores to fractures is the slippage diffusion flow, and the gas in the fractures is seepage flow, which conforms to Darcy’s Law;
(5)
The Warren–Root model, which considers the plane radial flow of coalbed methane in cylindrical rock samples, is adopted. The fluid flows from the matrix to the fractures as a quasi-steady-state cross flow, and the gas can flow out of the rock samples through fractures and pores;
(6)
Two kinds of fluids are present, water and coalbed methane, in the matrix and crevices of coalbeds. The water is incompressible, but the compressibility factor and viscosity of the gas change with temperature and pressure, and the effects of gravity and capillary force are ignored;
(7)
The structural effect on the gas reservoir is neglected, and the matrix and fractures are homogeneous and isotropic;
(8)
There is a starting pressure gradient for the flow of fluid in pores.
(2)
Seepage equation
The gas and water in the matrix system diffuse and seep into fractures [27], while the gas and water in the fracture system seep outward. The seepage velocities are shown below:
Water   phase   in   the   matrix :   v wm = k amw μ w ( p wm λ m )
Gas   phase   in   the   matrix :   v m = k am μ g ( p m λ m )
Water   phase   in   the   fractures :   v w = k w μ w ( p w λ f )
Gas   phase   in   the   fractures :   v f = k g μ g ( p f λ f )
where v wm is the flow velocities of the water phase in the matrix, m / s ; μ w   is the viscosity of water, mPa s ; p wm   is the pressure gradient of the water, MPa / m ; k amw   is the effective permeabilities of the water, mD. v w is the flow velocities of the water phase in the fractures, m / s , μ g   is the viscosity of water, mPa s ; p m is the pressure gradient of the gas, MPa / m ; k am is the effective permeabilities of the gas, mD.
v m   is the flow velocities of the gas in the matrix, m / s , p w   is the pressure gradient of the water, MPa / m ; k w   is the effective permeabilities of the water, mD. v f is the flow velocities of the gas in the fractures, m / s ; p f is the pressure gradient of the gas, MPa / m ; k g is the effective permeabilities of the gas, mD.
λ m = e am k am bm s gm cm and λ f = e af k g bf s g cf are the starting pressure gradients for the matrix system and the fracture system, respectively, Pa / m [28]. Among them, am , bm , cm , af , bf , and   cf are exponential constants, which can be measured experimentally. When the pressure gradient | p wm | < λ m , v wm = 0 ; when | p m | < λ m , v m = 0 ; when | p w | < λ f , v w = 0 ; and when | p f | < λ f , v f = 0 .
(3)
Continuity equation
The continuity equation for water and gas in the matrix and fracture systems:
Water   phase   in   the   matrix :   t [ s wm ϕ m ρ w ] = ( ρ w v wm ) ρ w k amw σ ( p wm p w ) μ w
  Gas   phase   in   the   matrix :   t [ s gm ϕ m ρ m + ( 1 ϕ m ϕ f ) q m ] = ( ρ m v m ) ρ m k am σ ( p m p f ) μ g
Water   phase   in   fractures :   t [ s w ϕ f ρ w ] = ( ρ w v w ) + ρ w k amw σ ( p wm p w ) μ w
Gas   phase   in   fractures :   ( s g ρ f ϕ f ) t = ( ρ f v f ) + ρ m k am σ ( p m p f ) μ g
where ρ m   is the densities of gas in the matri, kg / m 3 ; ϕ m   is the porosity of the matrix, which is dimensionless.   ρ f is the densities of gas in the fractures, kg / m 3 ;   ϕ f is the porosity of the fractures, which are dimensionless ρ w = 1000   kg / m 3 is the density of water, which is incompressible. s gm   and   s wm are the saturations of the gas and water phases in the matrix, respectively, with s wm + s gm = 1 . s g   and   s w are the saturations of the gas and water phases in fractures, respectively, with s w + s g = 1 . The second term on the right side of the equal signs in Equations (5) and (7) is the cross flow of water from the matrix to fractures. The second term on the right side of the equal signs in Equations (6) and (8) is the cross flow of gas from the matrix to fractures. σ = 4 ( 1 L x 2 + 1 L y 2 + 1 L z 2 ) is the shape factor, while L x , L y , and   L z are the spacing of fractures in the directions of x , y , and   z , respectively [29].
q = V L p m p L + p m is the adsorption amount of gas per unit mass of the sample, m 3 / t , which satisfies the Langmuir isotherm adsorption equation. Here, V L is the Langmuir volume, m 3 / t ; p L is the Langmuir pressure, MPa ; q m = ρ s M g V 0 q is the amount of the adsorbed gas containing coalbed methane per unit volume of the coal rock sample, kg / m 3 ;   M g is the molar mass of gas, kg / mol ; V 0 = 22.4 × 10 3   m 3 / mol is the molar volume of gas under standard conditions; and ρ s is the skeletal density of the coal rock sample, m 3 / t .
(4)
The state equation of the gas in the matrix and fractures:
Gas   phase   in   the   matrix :   ρ m = p m M g z m ( T , p m ) R T
Gas   phase   in   fractures :   ρ f = p f M g z f ( T , p f ) R T
where R = 8.314   J / ( mol · K ) is the gas constant, and T is the absolute temperature, K. z m ( T , p m )   and   z f ( T , p f ) are the compression coefficients of gas in the matrix and fractures, which are functions of the temperature and pressure of the gas in the matrix and fractures, respectively [30].
According to the equations for the capillary forces in the matrix and fractures:
Matrix :   p m p wm = p cm ( s wm )
fractures :   p f p w = p c ( s w )
where p cm ( s wm )   and   p c ( s w ) are the capillary forces in the matrix and fractures, respectively, and they are functions of gas saturations in the matrix and fractures, respectively. If the capillary force is ignored, it can be concluded from Equations (11) and (12) that p m = p wm   and   p f = p w .
(5)
Initial and boundary conditions
The initial conditions for the coalbed methane desorption process of the coal rock sample:
p m = p f = p 0 ;   s g = s g 0 ,   s w = 1 s g 0 ;   s gm = s gm 0 , s wm = 1 s gm 0 ;  
The boundary conditions for the coalbed methane desorption process of the coal rock sample:
p f r = 0 ,   p m r = 0   ( r = 0 , t > 0 ) p f = p c ,   p m = p c   ( r = R a , t > 0 )
where R a is the radius of the cylindrical bottom of the coal rock sample, while s gm 0   and   s g 0 represent the initial gas saturation in the matrix pores and fractures, respectively. p 0 = ρ w g H + p air is the pressure of coalbed methane in the coal rock sample at the initial desorption stage; g = 9.8   m / s 2 is the gravitational acceleration; H is the formation depth where the coal rock sample is located at the initial desorption stage; and p air = 0 . 1013   MPa  is atmospheric pressure. While lifting a rock sample ( 0 < t t s 1 ), the hydrostatic pressure on the surface of the rock sample decreases with depth. At the filling stage and the filling measuring stage on the ground, the pressure on the rock sample surface is atmospheric pressure. Therefore,
p c = { ρ w g H ( 1 t t s 1 ) + p a i r 0 t t s 1 p a i r t > t s 1
(6)
Establishment of the heat conduction equation of the temperature field
For cylindrical rock samples, the heat conduction equation [31] along the radial direction of circular sections is assumed to be
2 T r 2 + 1 r T r = 1 a T t
where T ( r , t ) is the temperature inside the rock sample, which is a function of the radial coordinate r and time t . a = k T ρ b C is the thermal diffusivity, m 2 / s ; k T is the heat conductivity of the rock sample, W / ( m K ) ; C the specific heat capacity of the coal rock sample, J / ( k g K ) ; and ρ b is the apparent density of the coal rock sample, k g / m 3 .
The time when the core starts being lifted is taken as the initial zero time, and the temperature of the rock sample at this time is the reservoir temperature T r e s . Therefore, the initial conditions can be expressed as follows.
T ( r , t ) = T r e s ( t = 0 , 0 r R a )
The coring process comprises three stages: rock sample lifting, ground filling, and filling measuring. As the drilling fluid wraps the rock sample while it is being lifted ( 0 < t t s 1 ), its surface temperature is the temperature of the drilling fluid mud T m u d . In the ground filling stage ( t s 1 < t t s 2 ), the surface temperature of the rock sample is the atmospheric temperature T a i r . In the filling measuring stage ( t s 2 < t t s 3 ), the rock sample must be placed in a heat-insulated box for desorption in a high-temperature water bath. At this time, the surface temperature of the rock sample is the water bath temperature and the reservoir temperature T r e s . Therefore, the boundary conditions of the surface temperature of the rock sample sphere can be expressed as follows:
T ( t ) | r = R a = { T m u d 0 < t t s 1 T a i r t s 1 < t t s 2 T r e s t s 2 < t t s 3
The temperature gradient at the center of the rock sample is zero, and the corresponding boundary conditions can be expressed as follows:
d T d r | r = 0 = 0 , t 0
(7)
Equation solution
The fundamental equations are solved using the fully implicit finite difference method. The temperature field equation was solved first to obtain the internal temperature field of the rock sample during the core lifting. The obtained results of the rock sample temperature field were applied to the solution of the desorbed coalbed methane volume.

3. Results and Discussion

3.1. Comparison of the Gas Loss Interpretation Results from the New Method with Those of Other Methods

The whole coring process was simulated for the P1 sample for 80 h. As shown in Figure 6, the gas loss process varies nonlinearly and can be roughly divided into an exponential growth stage in the wellbore, a linear loss stage on the surface, and a curve changing stage during natural desorption. The interpretation results from the new method are shown in Table 3. The total gas content of this sample is 34.98 m3/t. According to the test composition, the total gas can be divided into lost gas, desorbed gas, and residual gas. Among them, the lost gas is 8.64 m3/t, accounting for 24.7%. The gas loss in wellbore lifting reaches 6.58 m3/t, accounting for 18.81%, while the gas loss during surface exposure is 2.06 m3/t, accounting for 5.88%. The gas loss volume in wellbore lifting is 3.2-fold greater than that during surface exposure, but the gas loss times differ by sixfold between the two stages. Therefore, based on conjecture, the loss of speed during the surface exposure is approximately twice that in the wellbore. The measured desorbed gas on site is 23.18 m3/t, accounting for 66.3%. The residual gas is 3.16 m3/t, accounting for 9.0%. According to the occurrence state, the total gas can be divided into adsorbed gas and free gas, of which the adsorbed gas is 25.63 m3/t, accounting for 72.2%, and the free gas is 9.71 m3/t, accounting for 27.8%. The adsorbed gas-to-free gas ratio of this sample is approximately 7:3. In general, the deep coalbed methane is still dominated by adsorbed gas, which is affected by factors such as the loss degree during lifting, storage conditions, reservoir temperature, and pressure. Some samples may have very little or no free gas, showing strong heterogeneity.
According to the isothermal adsorption results, the maximum in situ adsorption capacity of the sample is calculated to be 25.16 m3/t, which differs by only 1.62 m3/t from the measured desorbed gas. However, the lost gas volume should be considerably larger than this value. It is inferred that the in situ state is a supersaturated adsorbed state, that is, a certain proportion of free gas is contained. Therefore, the gas loss starts when the core begins to be lifted, and the starting time should be the starting point for loss computations. The measured data are adopted for regression, and the simulation results of gas loss under the USBM method, polynomial method, Amoco method, and the new method are obtained, which are 25.93 m3/t, 35 m3/t, 50 m3/t, and 8.64 m3/t, accounting for 50.88%, 58.30%, 66.64%, and 24.70% of the total gas, respectively. The sequence for the simulated lost gas volume is Amoco method > polynomial method > USBM method > new method (Table 4).

3.2. Adsorbed Gas-To-Free Gas Ratio during Gas Loss

The simulation results in Figure 7 show the production results of the adsorbed gas and free gas. The P1 sample contains 9.71 m3/t of free gas, accounting for 27.8%, and the adsorbed gas-to-free gas ratio is close to 7:3. Before filling desorption, the lost gas is dominated by the lost free gas. During filling desorption, the adsorbed gas loss is 15.64%, while the free gas loss reaches up to 53.24%. After approximately 7.25 h of desorption, the cumulative output of the desorbed gas is 64.87%, while the cumulative output of free gas is 92.69%. Clearly, for deep coalbed methane, a high proportion of free gas is conducive to high production in the early stage. After approximately 10% of the life cycle passes, the contribution from free gas output approaches zero, and the adsorbed gas becomes critical for stable production in the middle and late stages. Therefore, deep coalbed methane production should focus on optimizing bottom-hole pressure during gas recovery by water drainage. The blowout-type production by depressurization in the early stage may prejudice the overall depressurization, further restricting the desorption of adsorbed gas in the later stages.

3.3. Analysis of Factors Influencing Gas Loss

The effects of different initial gas saturations, matrix permeabilities, fracture permeabilities, lifting times, Langmuir volumes, and Langmuir pressures on gas output during the gas content tests were simulated at the core scale, which lasted for a total of 80 h. The conclusions drawn from Figure 8 are that (1) a higher initial gas saturation leads to greater free gas content and greater total gas volume, in addition to greater loss velocity and more gas loss in the initial stage; (2) a larger matrix permeability correlates with a more rapid loss velocity in the initial stage and more gas loss, but the final total gas volume remains unchanged; (3) changes in fracture permeability have little effect on gas output, that is, the core-scale desorption is insensitive to fracture permeability, and coalbed methane production is primarily controlled by matrix permeability; (4) a shorter lifting time means less gas loss and more reliable calculation results for gas loss, but the final total gas volume remains unchanged; (5) a larger Langmuir volume leads to a higher proportion of adsorbed gas and larger total gas volume, but it has little effect on gas loss under the conditions of the sample; and (6) Langmuir pressure has little effect on gas loss and total gas volume. Overall, matrix permeability and initial gas saturation are crucial for determining the gas loss degree, followed by the Langmuir volume.

3.4. Application of the New Method

The new method was applied to interpret gas loss during the conventional coring of four coal rock samples from a well. The results show that the new method is fundamentally consistent with the USBM method in the desorbed gas results but predicts an approximately 50% smaller gas loss than the USBM method, and the total gas volume differs by approximately 1.3 times (Figure 9). Meanwhile, based on the measured and inferred parameters, such as isotherm adsorption, porosity, water saturation, temperature, and pressure, the amounts of the adsorbed gas and free gas were calculated and summed to obtain the total gas volume. As shown in Figure 10, the results are nearly consistent with that of the new method, with an average error of approximately 7%, and the difference in sample 3-2 is relatively large. It is speculated that water loss may occur in the pores during sample collection and processing, and the measured water saturation is smaller.

4. Conclusions

(1)
This paper provides a new interpretation method of gas loss in deep coalbeds by numerically simulating the entire process of gas content testing based on the classic double-porosity and double-permeability theoretical model of coalbeds and a consideration of the effects of reservoir permeability, water saturation, and temperature on gas output during the desorption process.
(2)
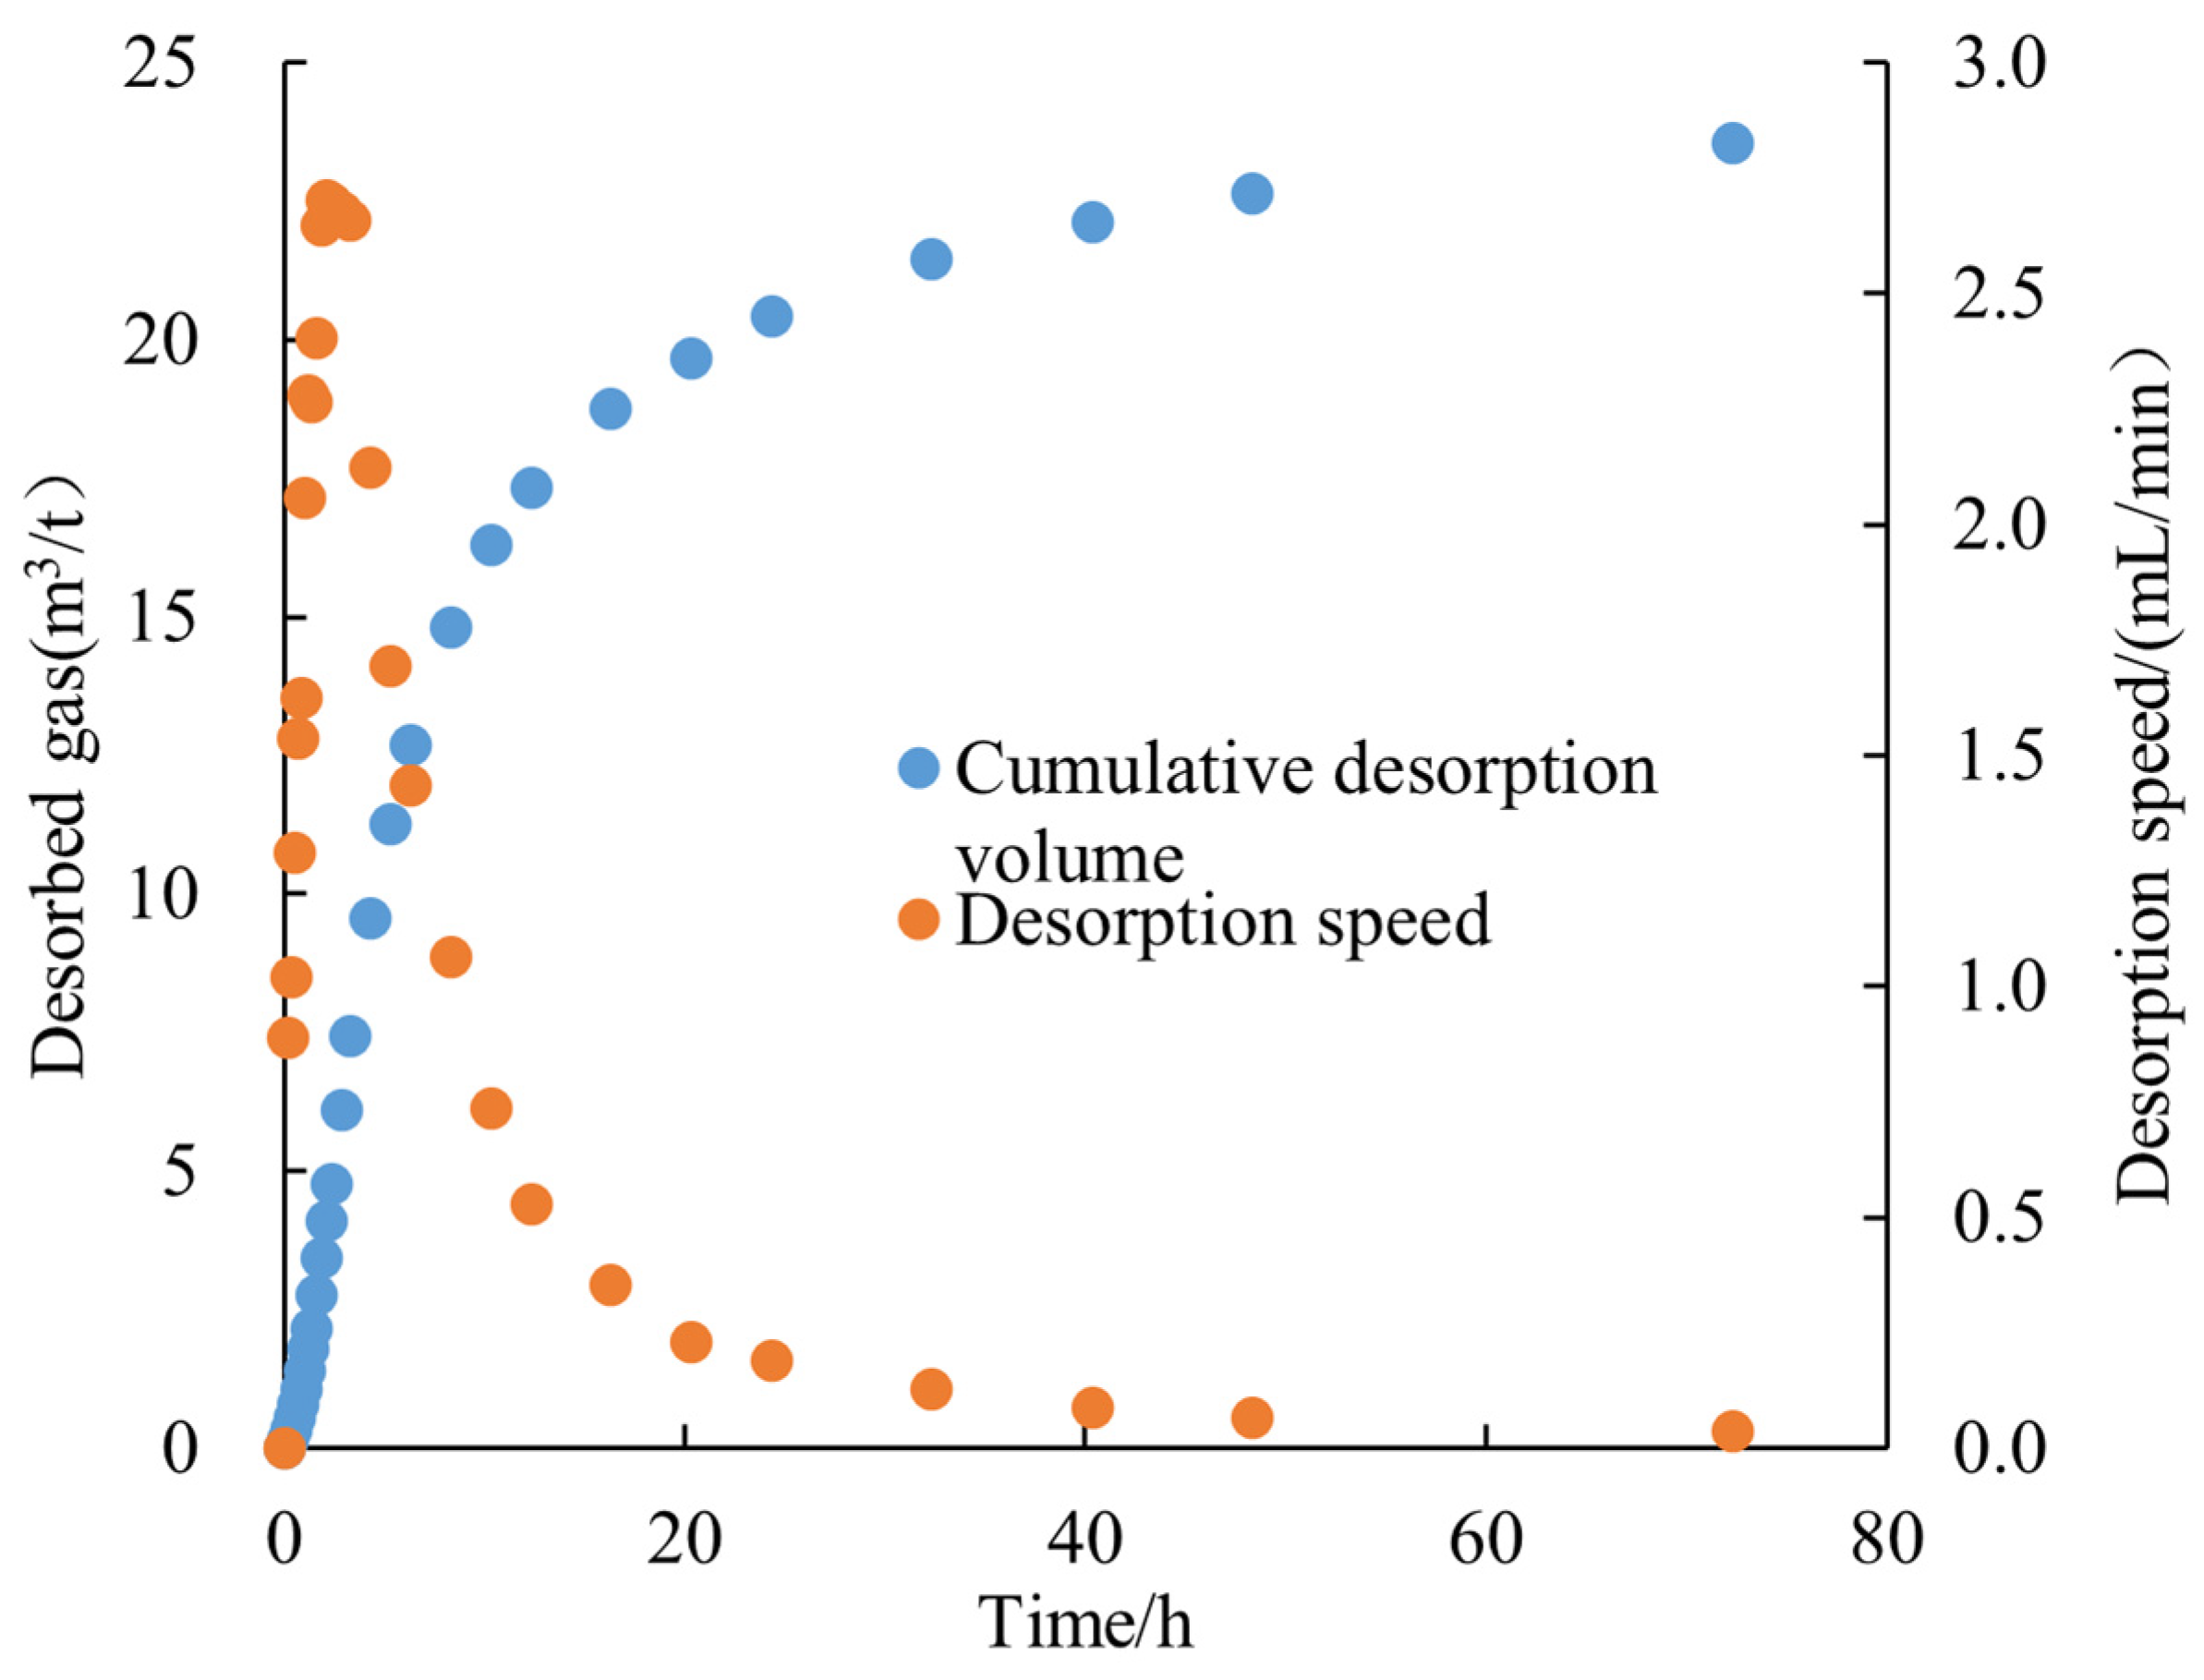
Based on the new method, the gas loss of the deep coalbed rock sample P1 is calculated to be 8.7 m3/t, accounting for 24.7% of the total gas. The gas loss in wellbore lifting amounts to 6.6 m3/t, accounting for 18.8%, while the gas loss during surface exposure is 2.1 m3/t, accounting for 5.9%. The measured desorbed gas on site is 23.54 m3/t. The total gas volume is 34.98 m3/t. The adsorbed gas-to-free gas ratio is approximately 7:3. The comparison results of gas loss between different methods are Amoco method (68%) > polynomial method (59.8%) > USBM method (52.4%) > new method (26.8%).
(3)
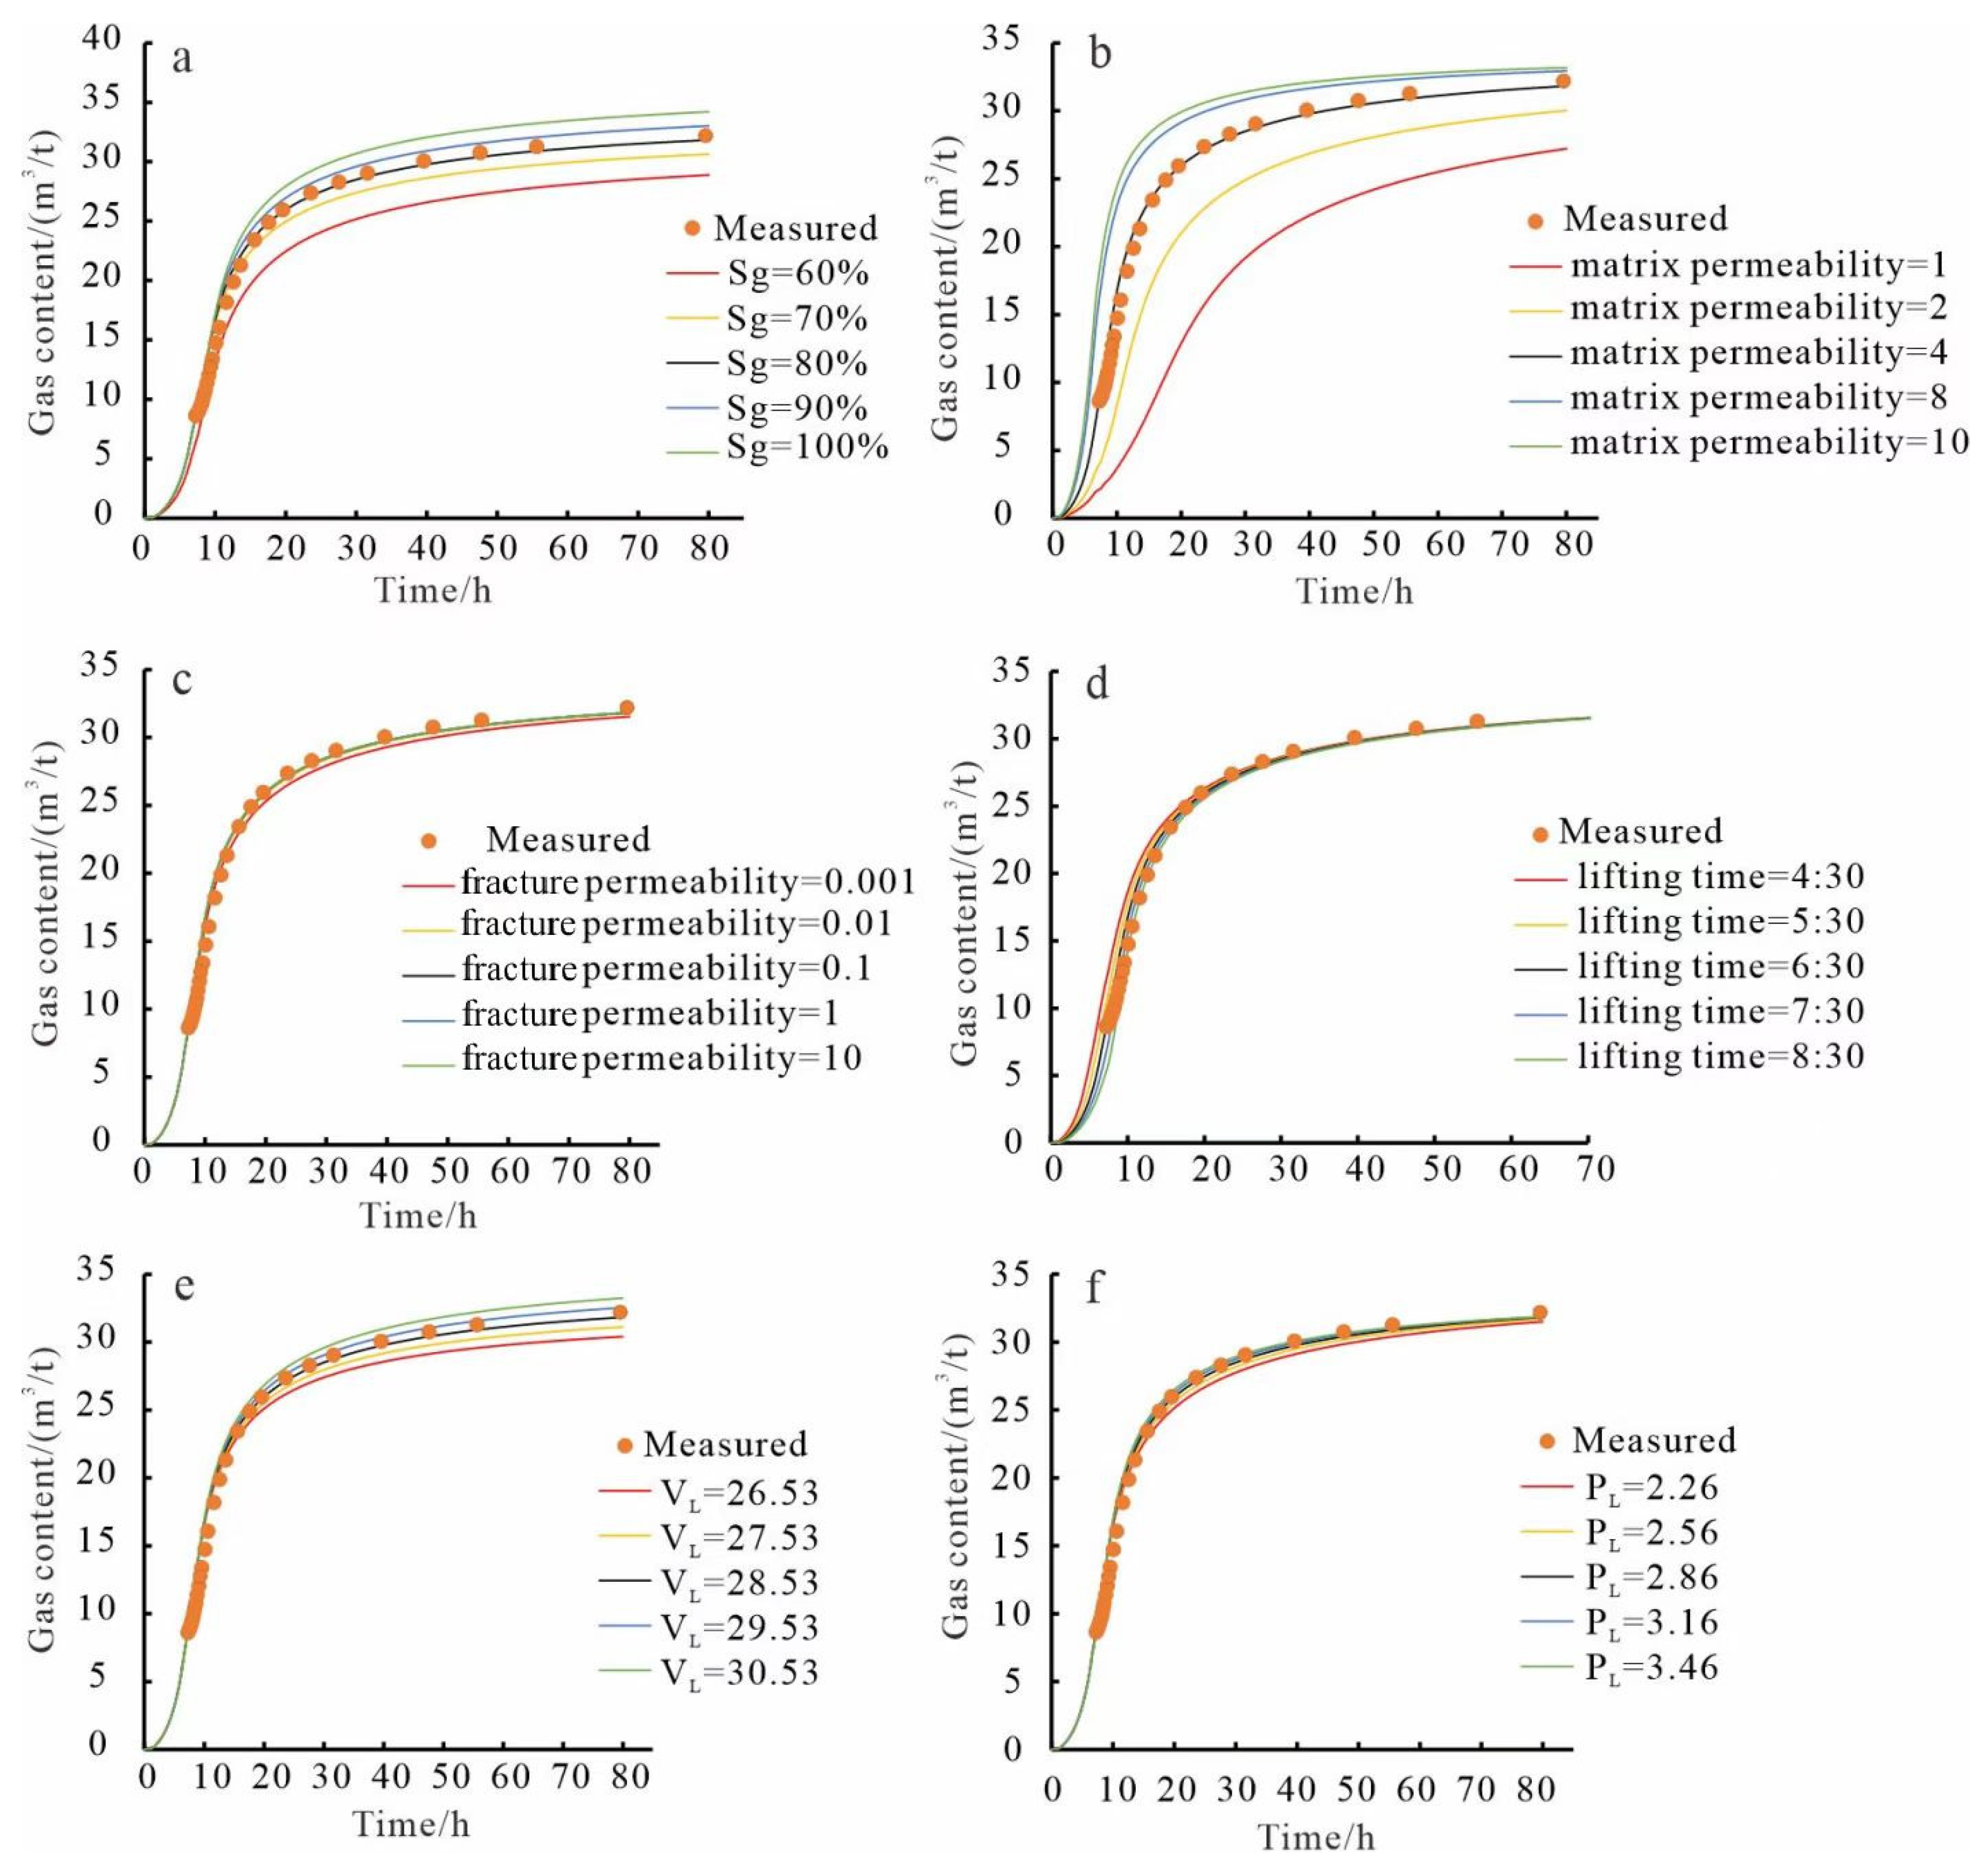
Matrix permeability and initial gas saturation are crucial in determining the gas loss degree, followed by the Langmuir volume. The reliability of the interpretation results from numerical simulations must be further verified in combination with the gas content test for pressure-maintaining coring and the physical simulation experiment for gas loss.
(4)
The gas loss calculated by the USBM method is excessively large and approximately twice that obtained using the new method. The sum of the adsorbed and free gas calculated based on multiple parameters is nearly consistent with the interpretation results of the new method, with an average error of approximately 7%. This result demonstrates the reliability of the new method. This method can also be applied in shale gas content tests.

Author Contributions

Conceptualization, Z.D. and H.W.; methodology, Z.D. and Z.J.; software, L.L.; validation, Z.D., F.T., R.D. and W.L.; formal analysis, Z.D.; investigation, R.D., S.H. and Y.L.; resources, J.Z.; data curation, X.W.; writing—original draft preparation, Z.D.; writing—review and editing, Z.J. and X.W.; visualization, Z.D.; supervision, Z.D.; project administration, Z.D.; funding acquisition, Z.D. All authors have read and agreed to the published version of the manuscript.

Funding

This study was funded by the Research on Coalbed Methane Exploration and Development Technology (2021DJ23), a forward-looking basic technology key project of PetroChina.

Data Availability Statement

All data is unavailable due to privacy or ethical restrictions.

Acknowledgments

We thank all authors and those who contributed to this paper and the editors and reviewers for their suggestions.

Conflicts of Interest

The authors declare no conflict of interest.

References

  1. Ye, J.; Hou, S.; Zhang, S. Progress of Coalbed Methane Exploration and Development in China during the 13th Five-Year Plan Period and the Next Exploration Direction. Coal Geol. Explor. 2022, 50, 15–22. [Google Scholar]
  2. Li, S.; Wang, C.; Wang, H.; Wang, Y.; Xu, F.; Guo, Z.; Liu, X. Reservoir Forming Characteristics and Favorable Area Evaluation of Deep Coalbed Methane in Daning-Jixian Block. Oal Geol. Explor. 2022, 50, 193–200. [Google Scholar]
  3. Nie, Z.; Shi, X.; Sun, W. Production Characteristics of Deep Coalbed Methane Gas Reservoirs in DaningJixian Block and Its Development Technology Countermeasures. Coal Geol. Explor. 2022, 50, 193–200. [Google Scholar]
  4. Kissell, F.N.; Mecullo, C.H.; Elder, C.H. Direct Method of Determining Methane Content of Coalbeds for Ventilation Design; U.S. Dept. of Interior, Bureau of Mines: Washington, DC, USA, 1973; pp. 77–97.
  5. Shtepani, E.; Noll, L.A.; Elrod, L.W.; Jacobs, P.M. A New Regression-Based Method for Accurate Measurement of Coal and Shale Gas Content. SPE J. 2010, 13, 359–363. [Google Scholar] [CrossRef]
  6. Smith, D.M.; Williams, F.L. Direct Method of Determining the Methane Content of Coal—A Modification. Fuel 1984, 63, 425–427. [Google Scholar] [CrossRef]
  7. Yee, D.; Seidle, J.P.; Hanson, W.B. Gas Sorption on Coal and Measurement of Gas Content. Hydrocarb. Coal AAPG Stud. Geol. 1993, 38, 203–218. [Google Scholar]
  8. Zhou, S.; Wang, H.; Xue, H.; Chen, H.; Guo, W. Comparative Analysis of Calculation Methods for Gas Loss in Shale Gas Content Field Test. Chin. Sci. Technol. Pap. 2018, 13, 2453–2460. [Google Scholar]
  9. Zhao, Q.; Wang, H.; Yang, S. A New Method for Calculating the Loss of Gas in Shale Core Desorption Test. Nat. Gas Ind. 2013, 33, 30–34. [Google Scholar]
  10. Yao, G.; Wang, X.; Du, H.; Yi, W.; Guo, M.; Xiang, R.; Li, Z. Applicability of USBM Method in the Test on Shale Gas Content. Acta Pet. Sin. 2016, 37, 802–806. [Google Scholar]
  11. Deng, Z.; Liu, H.; Kang, Y. Estimation Methods of Lost Gas in Coalbed Gas Content Testing. Nat. Gas Ind. 2008, 28, 85–86. [Google Scholar]
  12. Liu, H.; Deng, Z.; Liu, D.; Zhao, Q.; Kang, Y.; Zhao, H. Discussion on lost gas calculating methods in shale gas content testing. Oil Drill. Prod. Technol. 2010, 32, 156–158. [Google Scholar] [CrossRef]
  13. Tang, Y.; Zhang, J.; Liu, Z.; Li, L. Measurement of Shale Gas Content by Desorption Method and Improvement of Its Method. Nat. Gas Ind. 2011, 31, 108–112. [Google Scholar]
  14. Hao, J.; Jiang, Z.; Xing, J.; Li, Z.; Tang, X.; Su, J. An Improved Method for Estimating Lost Gas Content of Shale Gas. Mod. Geol. 2015, 29, 1475–1482. [Google Scholar]
  15. Wei, Q.; Yan, B.; Xiao, X. Research Progress of Shale Gas Desorption Methods. Nat. Gas Geosci. 2015, 26, 1657–1665. [Google Scholar]
  16. Li, G.; Meng, Z.; Liu, J. Characteristics of Methane Diffusion in Coal Matrix and Its Effect on Gas Production. Earth Sci. 2017, 42, 1358–1363. [Google Scholar] [CrossRef]
  17. Liu, G.; Zhao, Q.; Gao, C.; Jiang, L.; Sun, J.; Liu, C. A Critical Desorption Time Method to Improve the Calculation Accuracy of Gas Loss in Shale Gas Content Testing. Nat. Gas Ind. 2019, 39, 71–75. [Google Scholar]
  18. Zuo, G.; Lu, C.; Li, B. Study on the Lower Limit Value of Shale Gas Loss Calculated by Area Method. In Proceedings of the 2019 International Conference on Oil and Gas Field Exploration and Development, Xi’an, China, 16–18 October 2019; Xi’an Shiyou University: Xi’an, China, 2019; pp. 800–807. [Google Scholar] [CrossRef]
  19. Zhao, W.; Cheng, Y.; Pan, Z.; Wang, K.; Liu, S. Gas diffusion in coal particles: A review of mathematical models and their applications. Fuel 2019, 252, 77–100. [Google Scholar] [CrossRef]
  20. Zhao, W.; Wang, K.; Ju, Y.; Fan, L.; Cao, H.; Yang, Y.; Wang, L. Quantification of the asynchronous gas diffusivity in macro-/micropores using a Nelder-Mead simplex algorithm and its application on predicting desorption-based indexes. Fuel 2023, 332, 126149. [Google Scholar] [CrossRef]
  21. GB/T 19559-2021; Method of Determining Coalbed Methane Content. China GB Standards: Beijing, China, 2021.
  22. Zhao, W.; Wang, K.; Ju, Y.; Fan, L.; Cao, H.; Yang, Y.; Wang, L. Analysis on the accuracy of laboratory measurement of apparent diffusion coefficient of adsorbed gas in matrix based on the competition relationship between gas flow and gas diffusion. J. China Coal Soc. 2022, 47, 860–869. [Google Scholar]
  23. GB/T 19560-2008; GB/T Experimental Method of High-pressure Isothermal Adsorption to Coal. China GB Standards: Beijing, China, 2008.
  24. GB/T 30732-2014; Proximate Analysis of Coal by Instrumental Method. China GB Standards: Beijing, China, 2014.
  25. GB/T 23561.2-2009; Methods for Determining the Physical and Mechanical Properties of Coal and Rock—Part 2: Methods for Determining the True Density of Coal and Rock. China GB Standards: Beijing, China, 2009.
  26. GB/T 29172-2012; Practices for Core Analysis. China GB Standards: Beijing, China, 2012.
  27. Ma, Q.; Yang, S.; Wang, J.; Huang, Y. Nonlinear Seepage Model for Tight Reservoirs Based on Start-up Pressure Gradient. J. Petrochem. Univ. 2020, 33, 36–41. [Google Scholar] [CrossRef]
  28. Huang, L.; Shi, J.; Yang, L.; Zang, J.; Zhang, L.; Yu, P. Experimental research and analysis on threshold pressure gradient in low-permeability gas reservoir. Fault-Block Oil Gas Field 2016, 23, 610–614. [Google Scholar]
  29. Kazemi, H.; Merrill, S.L.; Porterfield, K.L.; Zeman, P.R. Numerical Simulation of Water-Oil Flow in Naturally Fractured Reservoirs. SPE J. 1976, 16, 317–326. [Google Scholar] [CrossRef]
  30. Hu, Z.; Hua, Y.; Du, X. Inorganic Chemistry; Science Press: Beijing, China, 2013; Volume 1, pp. 9–10. [Google Scholar]
  31. Evans, L.C. Partial regularity for stationary harmonic maps into spheres. J. Arch. Ration. Mech. Anal. Provid. 1991, 116, 101–105. [Google Scholar] [CrossRef]
Figure 1. Sample P1 Overview.
Processes 11 00200 g001
Figure 2. Schematic of a Manual Measuring Cylinder.
Processes 11 00200 g002
Figure 3. Three Commonly Used Desorption Devices. (a). High-precision flowmeter method for measuring desorbed gas; (b). Automatic U-shaped measuring cylinder for measuring desorbed gas; (c). Pulse rotation for measuring desorbed gas.
Processes 11 00200 g003
Figure 4. Desorption Curve of Sample P1.
Processes 11 00200 g004
Figure 5. Warren–Root Model with Double Porosity and Double Permeability.
Processes 11 00200 g005
Figure 6. Interpretation Results from the New Method ((a): Total gas production curve; (b): Wellbore loss stage; (c): Surface loss stage; (d): Natural desorption stage).
Processes 11 00200 g006
Figure 7. Changes in the Adsorbed Gas-to-Free Gas Ratio during the Loss Process. ((a): Release amount of adsorbed gas and free gas; (b) Release amount ratio of adsorbed gas and free gas).
Processes 11 00200 g007
Figure 8. Sensitivity Analysis of the Factors Influencing Gas Loss ((a): initial gas saturation; (b): matrix permeability; (c): fracture permeability; (d): lifting time; (e): Langmuir volume; (f): Langmuir pressure).
Processes 11 00200 g008
Figure 9. Comparison Results Between the New Method and USBM Method.
Processes 11 00200 g009
Figure 10. Comparison Between the New Method and the Sum of Adsorbed and Free Gas.
Processes 11 00200 g010
Table 1. Basic Parameter Table of Sample P1.
Data CategoryParametersValueAcquisition Method
Basic sample informationMass (g)2240Measurement
Depth (m)2137.61Measurement
Porosity (%)10Measurement
Apparent density (g/cm3)1.48Measurement
Moisture (%)1.32Measurement
Ash content (%)26.62Measurement
Organic carbon content (TOC, %)72.06Measurement
Ro, max (%)3.25Measurement
Vitrinite (%)64.3Measurement
Exinite (%)9.1Measurement
Inertinite (%)26.6Measurement
Experimental conditions and results of isothermal adsorptionExperimental temperature (°C)60Measurement
Langmuir volume VL (m3/t)28.53Measurement
Langmuir pressure PL (MPa)2.86Measurement
Field desorption dataLifting depth (m)2137.61Measurement
Reservoir pressure (MPa)21.38Estimation
Surface temperature (°C)20Measurement
Subsurface temperature (°C)60Estimation
Mud temperature (°C)30Estimation
Water bath temperature (°C)60Measurement
Lifting time6 h and 30 minMeasurement
Time from reaching the ground to tank filling45 minMeasurement
Time to fill72 h and 45 minMeasurement
Table 2. Desorption Data Sheet.
Desorption Time (min)Cumulative Desorption Volume (mL)Desorbed Gas (m3/t)Desorption Speed
(m3/(t*hour))
000.000.000
10331.360.150.89
20712.000.321.02
301192.830.531.29
401765.8580.791.54
502372.471.061.63
603140.261.402.06
703990.911.782.28
804835.732.162.26
956182.202.762.40
1107664.343.422.65
1259177.574.102.70
14010,686.624.772.70
17013,683.516.112.68
20016,659.137.442.66
26021,413.069.562.12
32025,207.0511.251.69
38028,417.8012.691.43
50033,172.0614.811.06
62036,468.4816.280.74
74038,832.5917.340.53
98041,995.3118.750.35
122044,053.4619.670.23
146045,738.9520.420.19
194048,017.0021.440.13
242049,572.2522.130.09
290050,714.6522.640.06
434052,736.0623.540.04
Table 3. Sample Calculation and Interpretation Results from the New Method.
CategoryNew MethodProportion
Test compositionLost gas (m3/t)8.6424.7%
Desorbed gas (m3/t)23.1866.3%
Residual gas (m3/t)3.169.0%
Total gas (m3/t)34.98100.0%
Occurrence stateAdsorbed gas (m3/t)25.2772.2%
Free gas (m3/t)9.7127.8%
Table 4. Comparison of Results from Different Simulation Methods.
ParametersUSBM MethodPolynomial MethodAmoco MethodNew Method
Lost gas (m3/t)25.9335508.64
Desorbed gas (m3/t)23.5423.5423.5423.54
Residual gas (m3/t)1.491.491.493.16
Total gas (m3/t)50.9660.0375.0334.98
Proportion of lost gas50.88%58.30%66.64%24.70%
Disclaimer/Publisher’s Note: The statements, opinions and data contained in all publications are solely those of the individual author(s) and contributor(s) and not of MDPI and/or the editor(s). MDPI and/or the editor(s) disclaim responsibility for any injury to people or property resulting from any ideas, methods, instructions or products referred to in the content.

